
Analysis of Agricultural Drought Evolution Characteristics and Driving Factors in Inner Mongolia Inland River Basin Based on Three-Dimensional Recognition


Abstract
1. Introduction
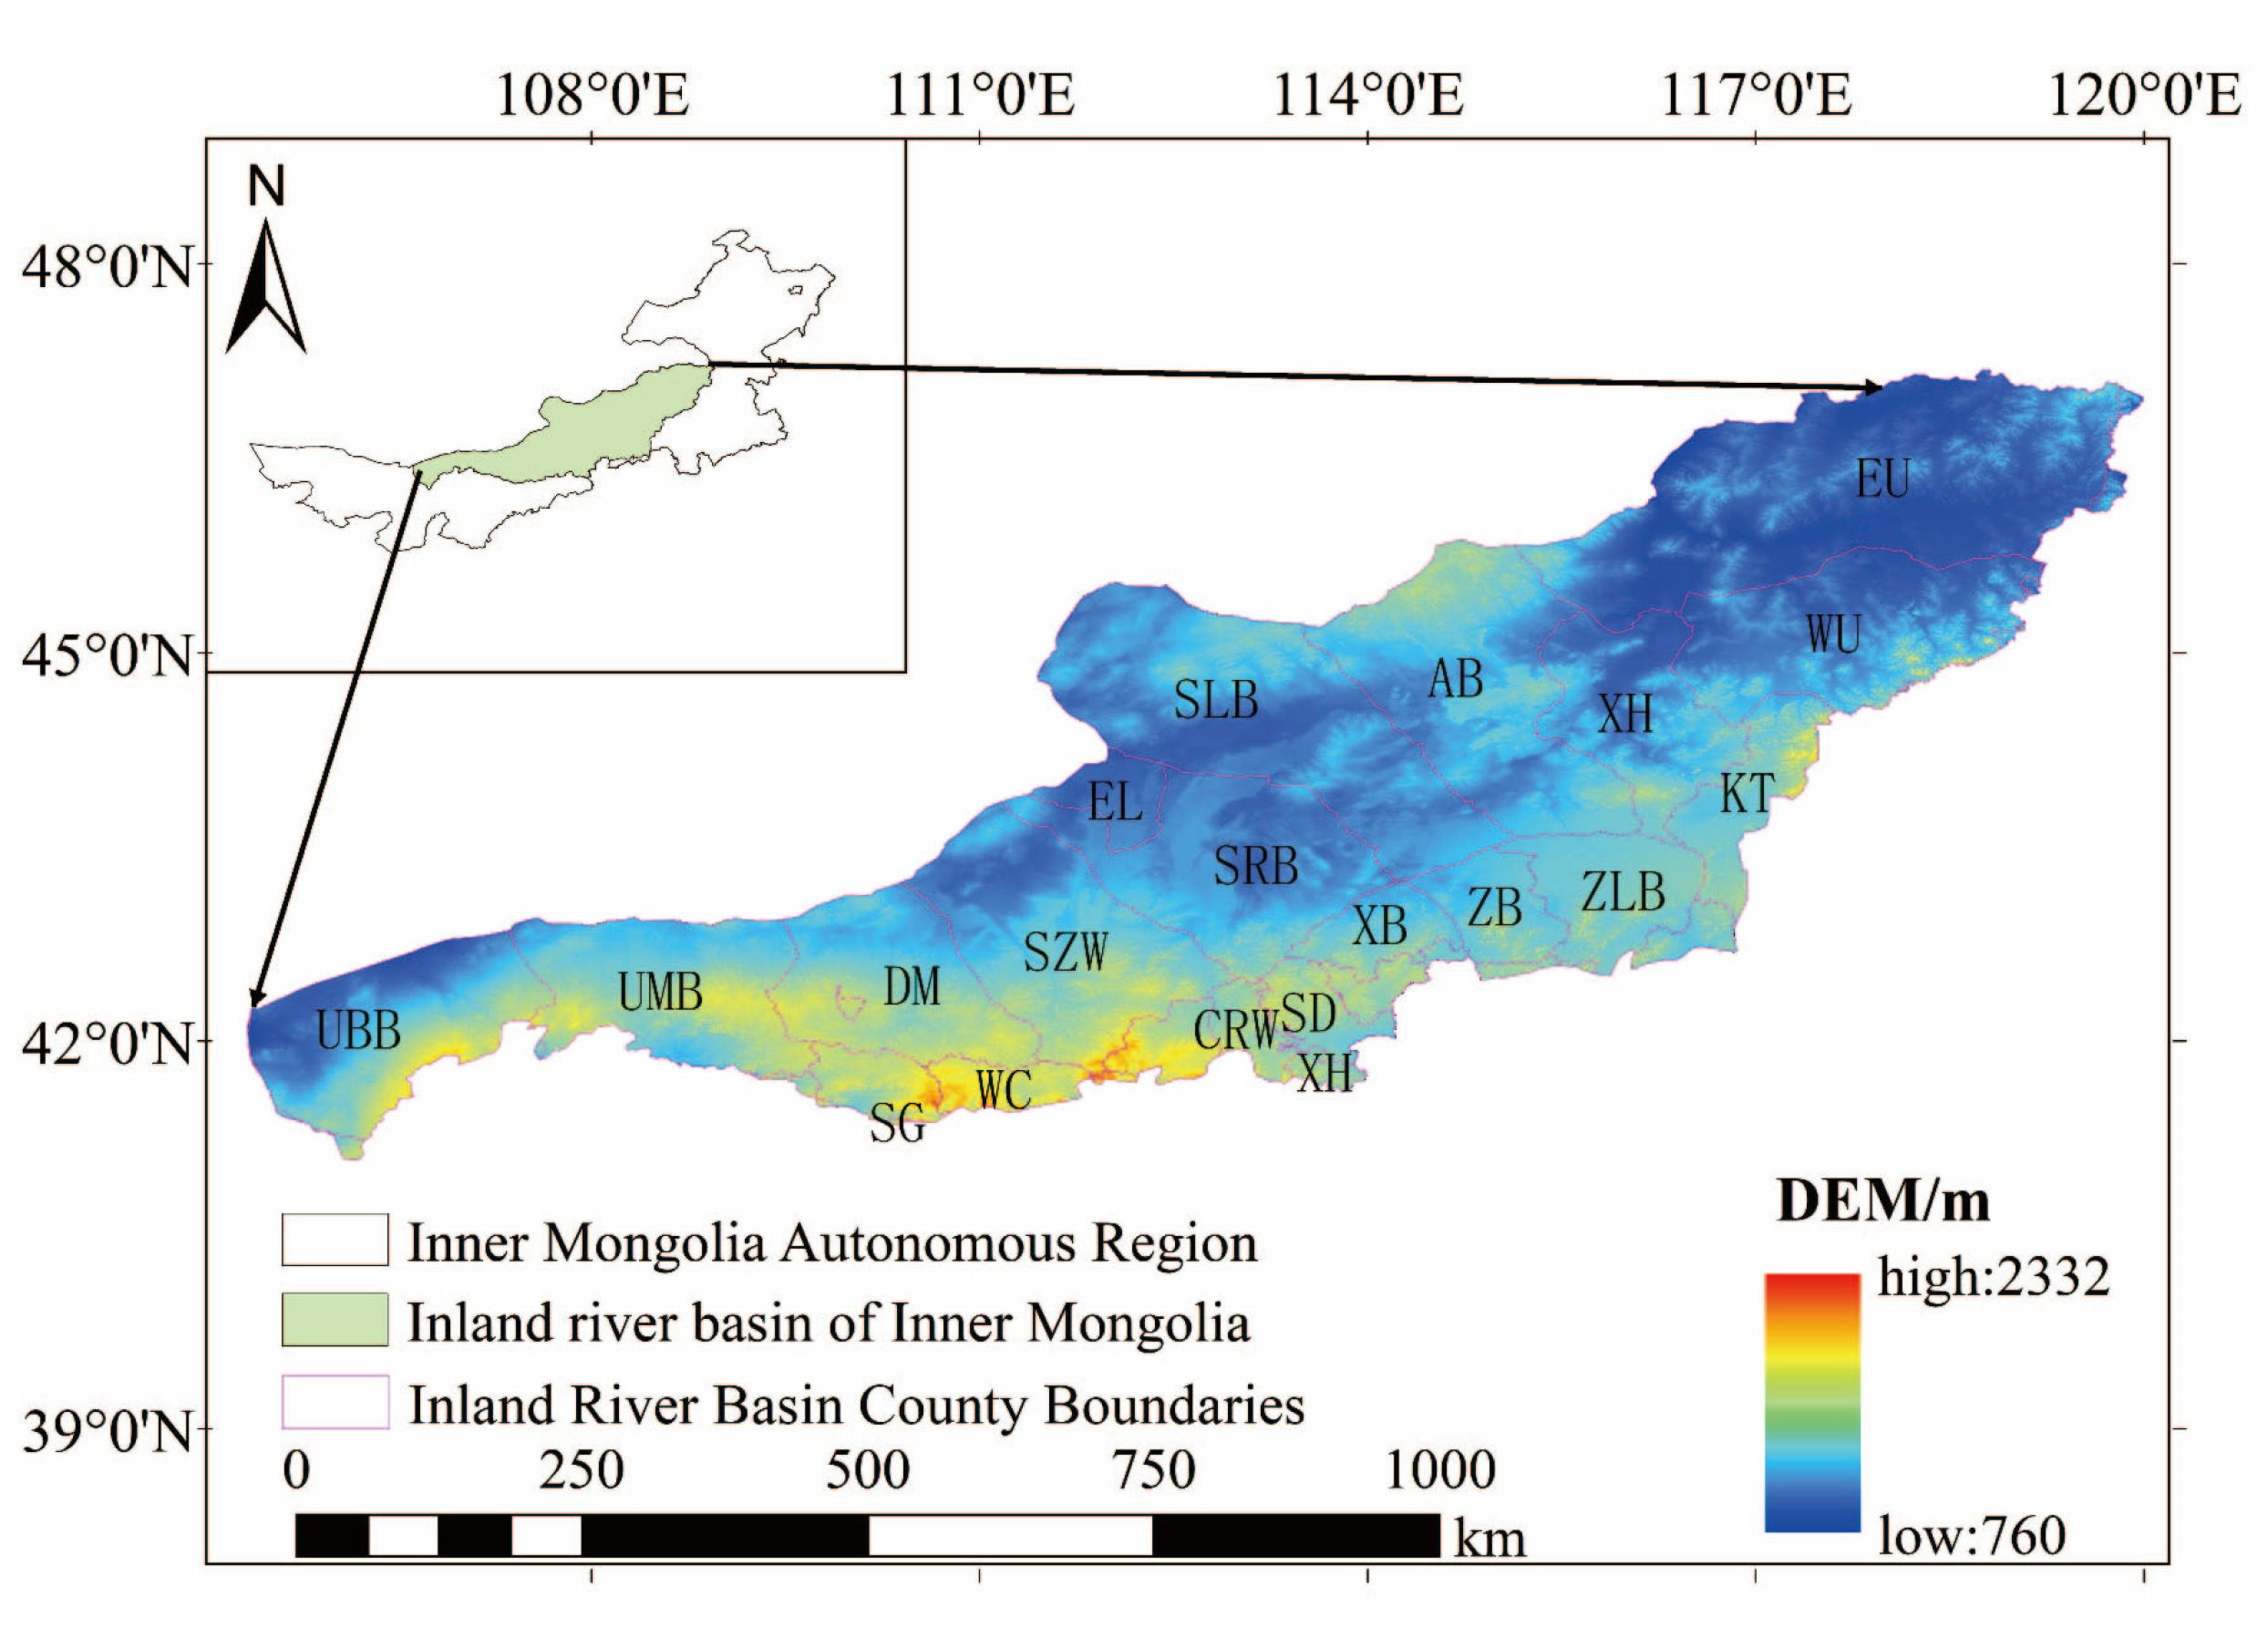
2. Study Region
3. Materials and Methods
3.1. Materials
3.1.1. Soil Moisture Data
3.1.2. Meteorological Factor Data and Drought Statistics
3.2. Methods
3.2.1. Standardized Soil Moisture Index
3.2.2. Modified Mann–Kendall Test
3.2.3. Three-Dimensional Identification Method of Drought Events
- (1)
- Drought patch recognition
- (2)
- Drought patch time–history connection
- (3)
- Drought characteristic variable extraction.
- (1)
- Drought duration is the duration of the drought event; it is the first and the last time interval between dry patches; it can also be considered a drought at the height of the three-dimensional continuum;
- (2)
- Drought area is the vertical projection area of the three-dimensional continuum of drought on a two-dimensional plane (longitude × latitude);
- (3)
- Drought severity is the sum of the water shortage degree of all arid bodies, that is, the volume of the three-dimensional drought continuum;
- (4)
- Drought center is a drought three-dimensional continuum center of mass;
- (5)
- Drought migration direction is a drought three-dimensional continuum drought center at every moment.
3.2.4. Cross-Wavelet Transform
4. Results
4.1. Temporal Evolution Characteristics of Agricultural Drought
4.1.1. Characteristics of Drought Time Evolution in Multi-Scale Agriculture
4.1.2. Variation Trend of Agricultural Drought Time at Different Scales
4.1.3. Temporal Characteristics of Seasonal Drought Intensity and Area Proportion
4.2. Spatial Evolution Characteristics of Agricultural Drought
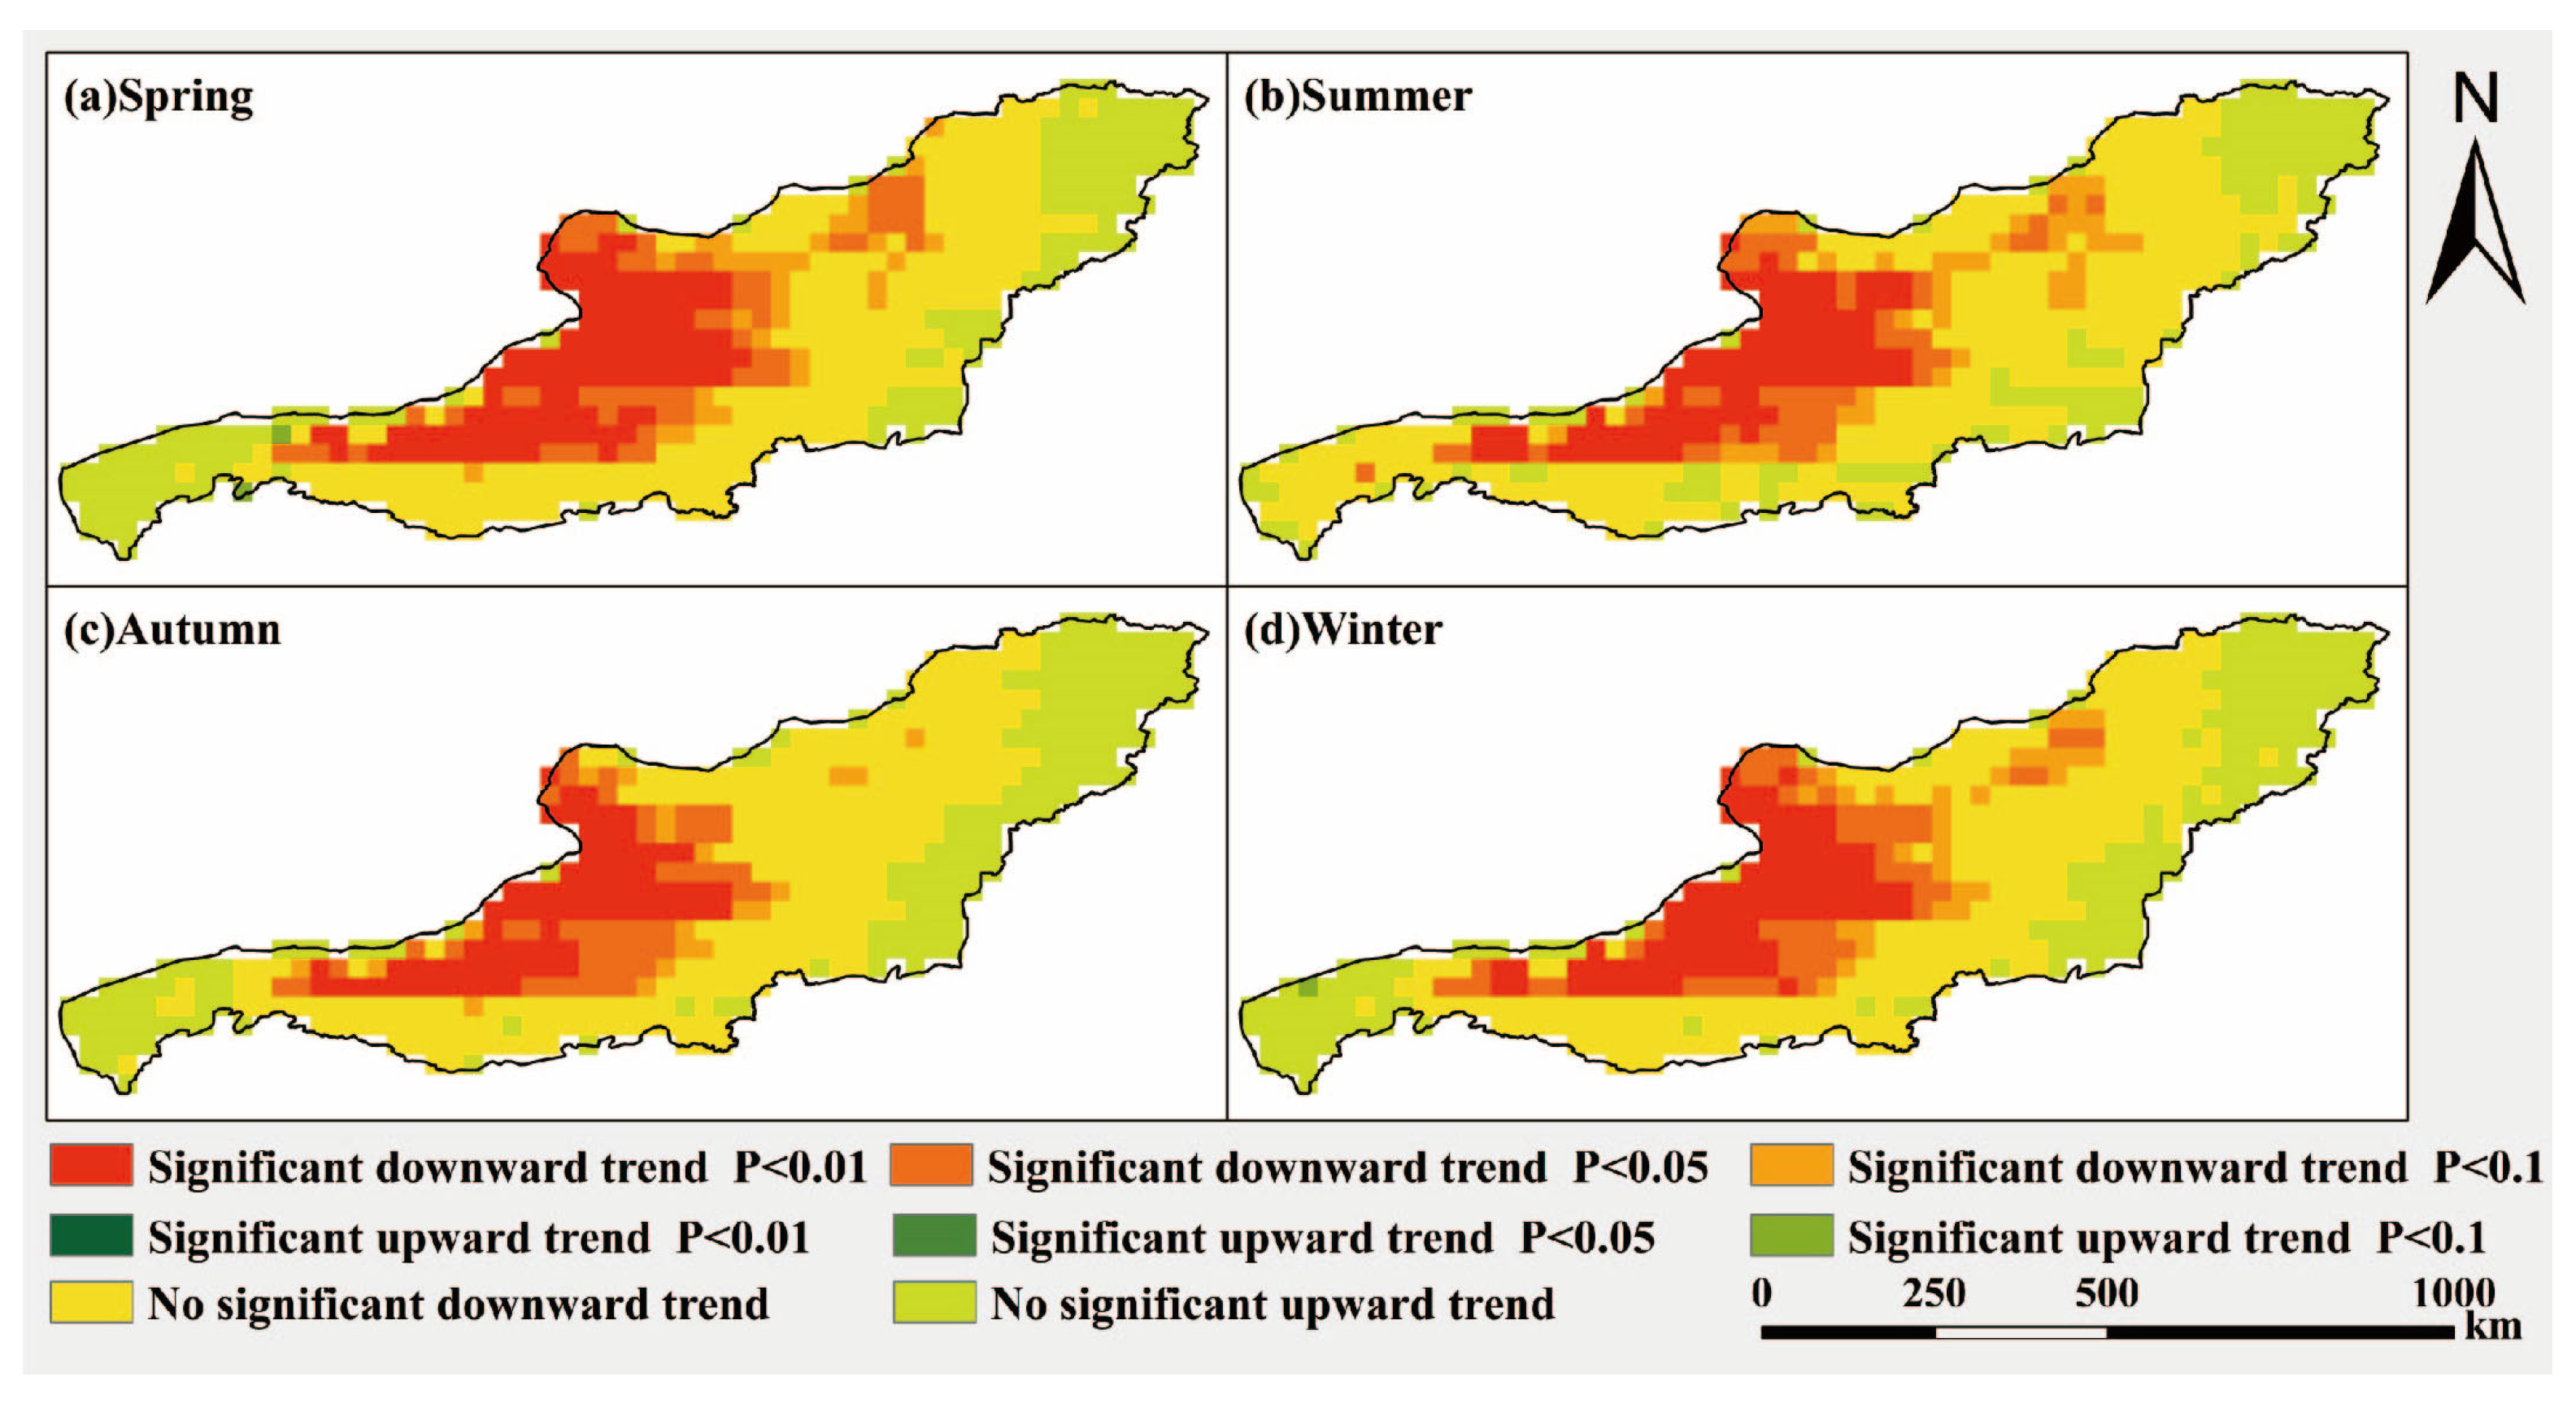
4.2.1. Spatial Distribution Characteristics of Drought Change Trend
4.2.2. Spatial Distribution Characteristics of Agricultural Drought Intensity
4.2.3. Spatial Distribution Characteristics of Agricultural Drought Frequency
4.3. Dynamic Evolution of Agricultural Drought Events Based on Three-Dimensional Recognition Method
4.3.1. Drought Recognition Results Based on Three-Dimensional Recognition Method
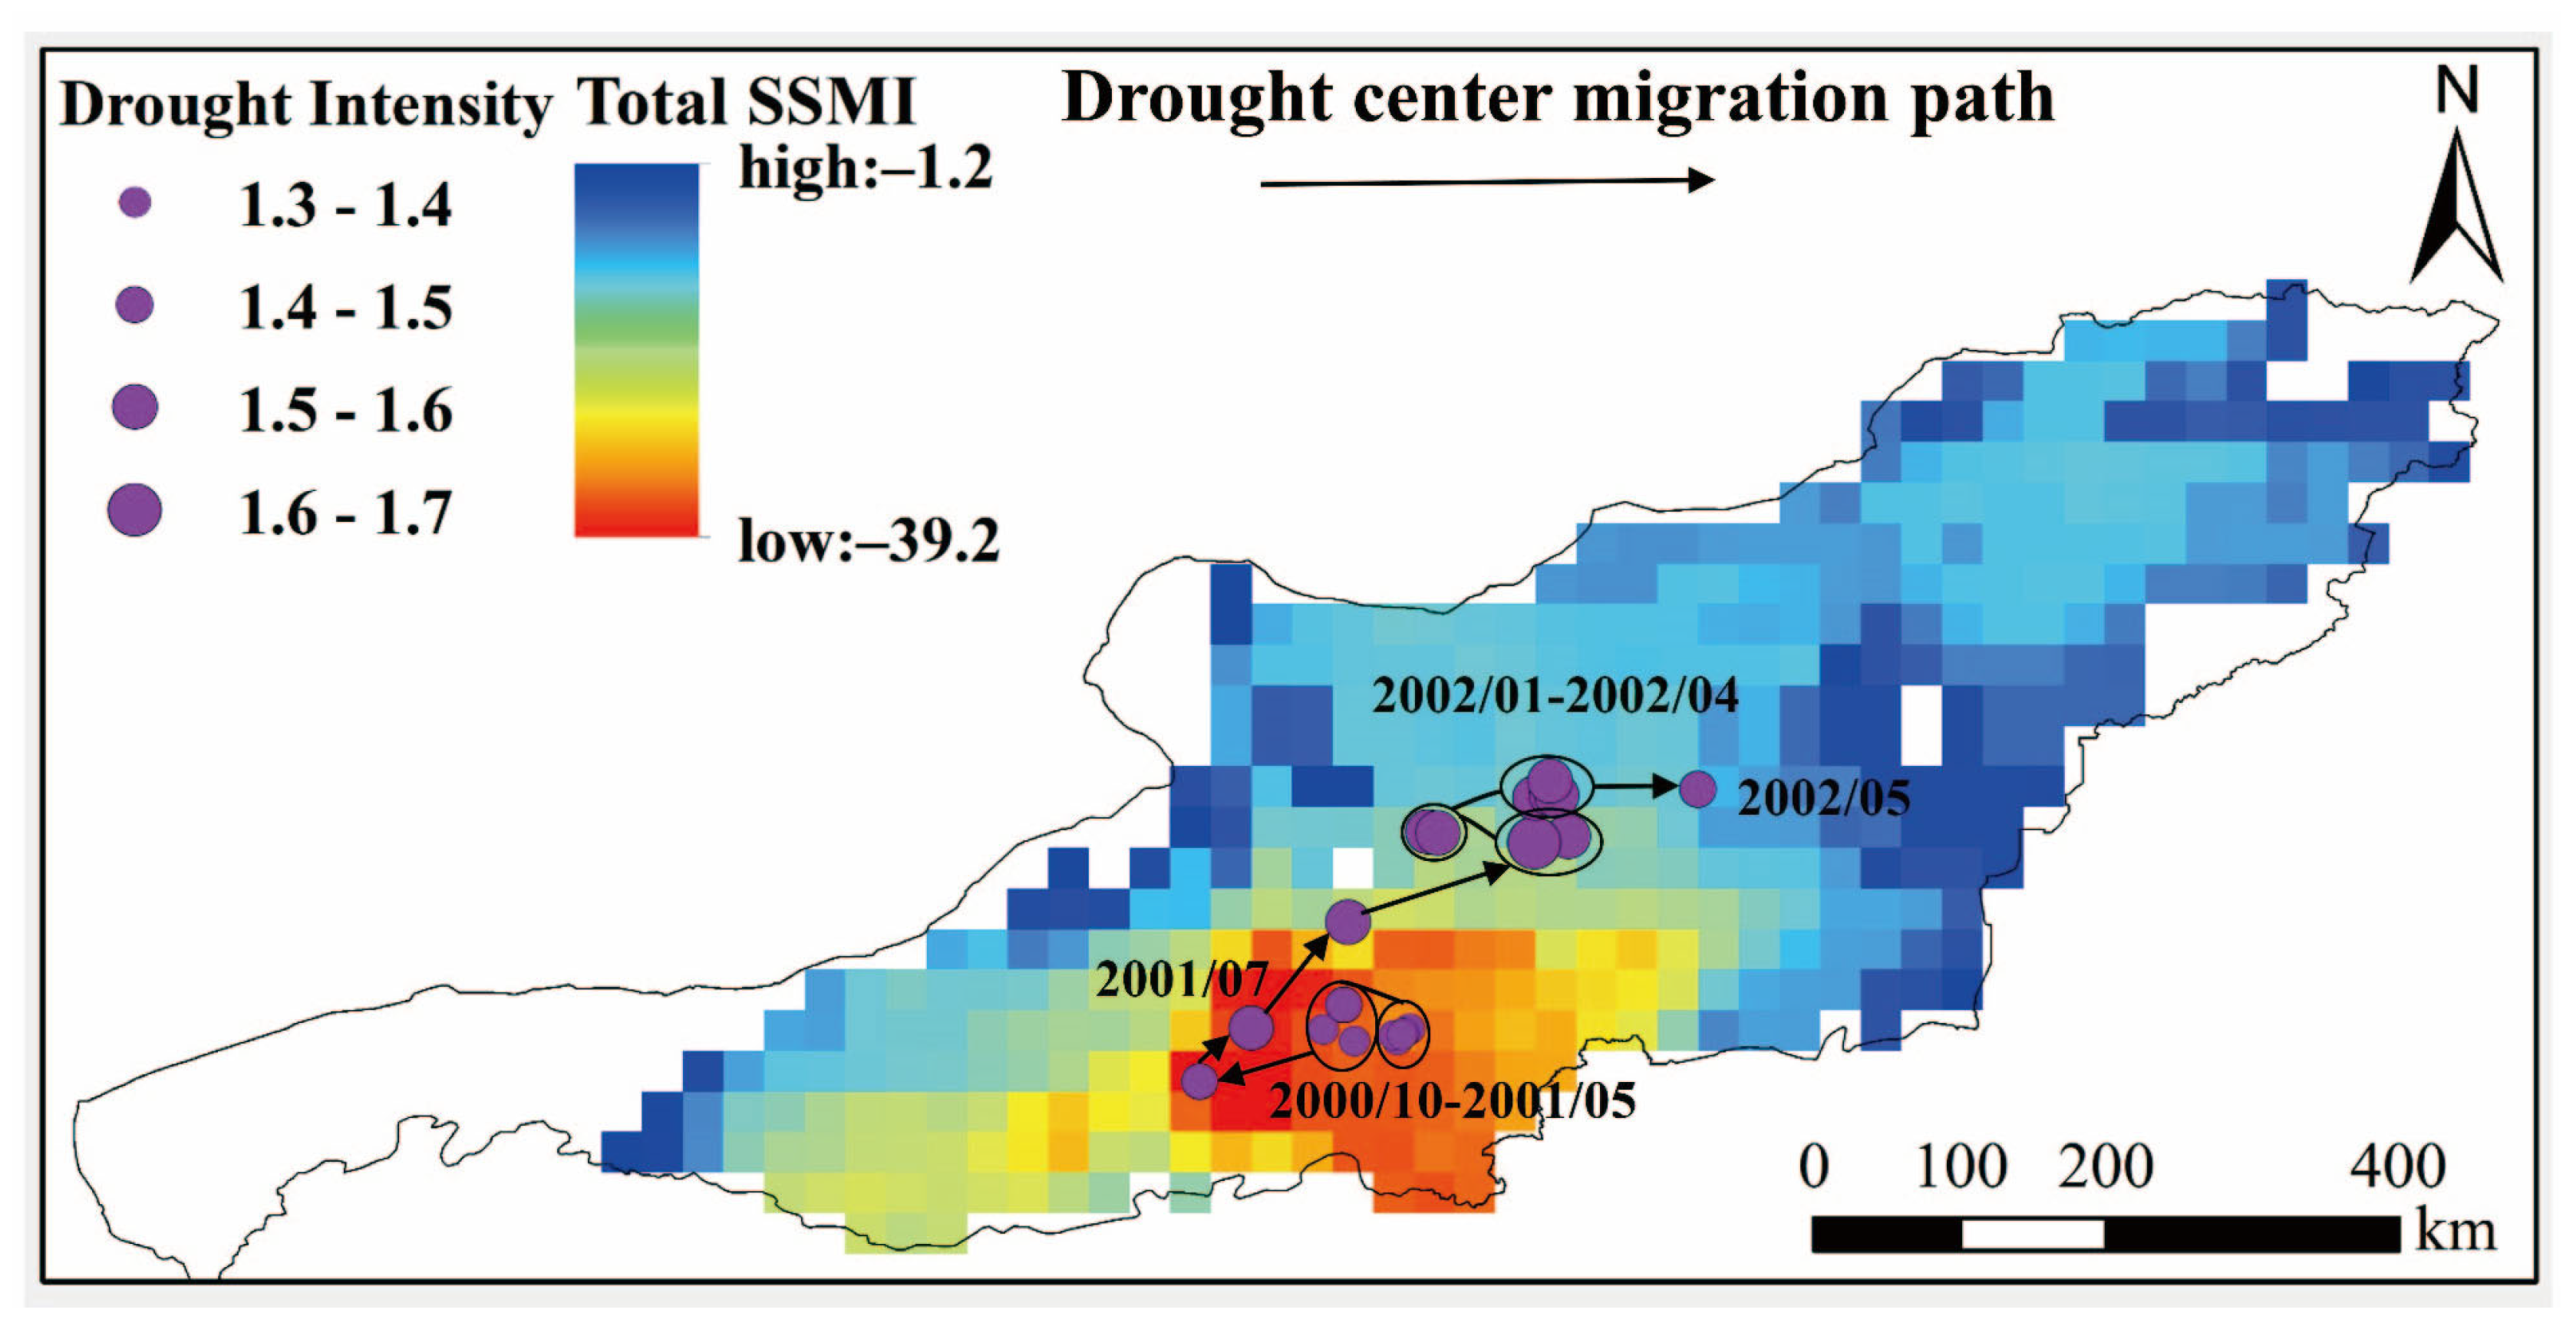
4.3.2. Analysis of Typical Agricultural Drought Events
5. Discussion
5.1. Driving Factor Analysis
5.2. Advantages and Limitations
6. Conclusions
- (1)
- With the increase in time scale, the fluctuation of agricultural drought decreased, but the SSMI index of all scales showed a downward trend, and the spring drought was the most obvious (linear tendency rate was −0.072/10a), and the change trend of drought area proportion and intensity was similar in four seasons;
- (2)
- The spatial distribution characteristics of drought change trend in four seasons were similar, but the area with a significant downward trend of drought in spring was the largest, and the area of the high-frequency region was also the largest, accounting for 35.40% and 42.70% respectively;
- (3)
- The most serious agricultural drought happened from October 2000 to May 2002, and both the drought area and severity reached the maximum in September 2001, with the drought area and intensity of 2.26 × 10⁵ km2 and 3.61 × 10⁵ months·km2, respectively. The drought event mainly experienced five processes: drought onset–intensification–decay–re-intensification–termination, and the migration path of the drought center was characterized by southwest to northeast transmission;
- (4)
- T, P, E, and H all played a driving role in the occurrence of agricultural drought. T and E were mainly negatively correlated with SSMI; P and H were mainly positively correlated with SSMI, and P had a greater impact on SSMI.
Author Contributions
Funding
Data Availability Statement
Conflicts of Interest
References
- Zhang, Z.; Wang, Z.; Lai, H.; Wang, F.; Li, Y.; Feng, K.; Qi, Q.; Di, D. Lag Time and Cumulative Effects of Climate Factors on Drought in North China Plain. Water 2023, 15, 3428. [Google Scholar] [CrossRef]
- Deo, R.C.; Byun, H.-R.; Adamowski, J.F.; Begum, K. Application of effective drought index for quantification of meteorological drought events: A case study in Australia. Theor. Appl. Climatol. 2017, 128, 359–379. [Google Scholar] [CrossRef]
- Li, Y.; Xie, Z.; Qin, Y.; Xia, H.; Zheng, Z.; Zhang, L.; Pan, Z.; Liu, Z. Drought under global warming and climate change: An empirical study of the Loess Plateau. Sustainability 2019, 11, 1281. [Google Scholar] [CrossRef]
- Pritchard, H.D. Asia’s glaciers are a regionally important buffer against drought. Nature 2017, 545, 169–174. [Google Scholar] [CrossRef] [PubMed]
- Lesk, C.; Rowhani, P.; Ramankutty, N. Influence of extreme weather disasters on global crop production. Nature 2016, 529, 84–87. [Google Scholar] [CrossRef]
- Zhu, Y.; Liu, Y.; Wang, W.; Singh, V.P.; Ma, X.; Yu, Z. Three dimensional characterization of meteorological and hydrological droughts and their probabilistic links. J. Hydrol. 2019, 578, 124016. [Google Scholar] [CrossRef]
- Ling, M.; Guo, X.; Shi, X.; Han, H. Temporal and spatial evolution of drought in Haihe River Basin from 1960 to 2020. Ecol. Indic. 2022, 138, 108809. [Google Scholar] [CrossRef]
- Tigkas, D.; Vangelis, H.; Proutsos, N.; Tsakiris, G. Incorporating aSPI and eRDI in drought indices calculator (DrinC) software for agricultural drought characterisation and monitoring. Hydrology 2022, 9, 100. [Google Scholar] [CrossRef]
- Kazemzadeh, M.; Malekian, A. Spatial characteristics and temporal trends of meteorological and hydrological droughts in northwestern Iran. Nat. Hazards 2016, 80, 191–210. [Google Scholar] [CrossRef]
- Mishra, A.K.; Singh, V.P. A review of drought concepts. J. Hydrol. 2010, 391, 202–216. [Google Scholar] [CrossRef]
- Parmesan, C.; Morecroft, M.D.; Trisurat, Y. Climate Change 2022: Impacts, Adaptation and Vulnerability; Intergovernmental Panel on Climate Change: Geneva, Switzerland, 2022. [Google Scholar]
- Mirzabaev, A.; Kerr, R.B.; Hasegawa, T.; Pradhan, P.; Wreford, A.; von der Pahlen, M.C.T.; Gurney-Smith, H. Severe climate change risks to food security and nutrition. Clim. Risk Manag. 2023, 39, 100473. [Google Scholar] [CrossRef]
- Dai, M.; Huang, S.; Huang, Q.; Leng, G.; Guo, Y.; Wang, L.; Fang, W.; Li, P.; Zheng, X. Assessing agricultural drought risk and its dynamic evolution characteristics. Agric. Water Manag. 2020, 231, 106003. [Google Scholar] [CrossRef]
- Potopová, V.; Štěpánek, P.; Možný, M.; Türkott, L.; Soukup, J. Performance of the standardised precipitation evapotranspiration index at various lags for agricultural drought risk assessment in the Czech Republic. Agric. For. Meteorol. 2015, 202, 26–38. [Google Scholar] [CrossRef]
- Qin, Y.; Yang, D.; Lei, H.; Xu, K.; Xu, X. Comparative analysis of drought based on precipitation and soil moisture indices in Haihe basin of North China during the period of 1960–2010. J. Hydrol. 2015, 526, 55–67. [Google Scholar] [CrossRef]
- Winkler, K.; Gessner, U.; Hochschild, V. Identifying droughts affecting agriculture in Africa based on remote sensing time series between 2000–2016: Rainfall anomalies and vegetation condition in the context of ENSO. Remote Sens. 2017, 9, 831. [Google Scholar] [CrossRef]
- Martínez-Fernández, J.; González-Zamora, A.; Sánchez, N.; Gumuzzio, A. A soil water based index as a suitable agricultural drought indicator. J. Hydrol. 2015, 522, 265–273. [Google Scholar] [CrossRef]
- Mao, Y.; Wu, Z.; He, H.; Lu, G.; Xu, H.; Lin, Q. Spatio-temporal analysis of drought in a typical plain region based on the soil moisture anomaly percentage index. Sci. Total Environ. 2017, 576, 752–765. [Google Scholar] [CrossRef]
- Andreadis, K.M.; Clark, E.A.; Wood, A.W.; Hamlet, A.F.; Lettenmaier, D.P. Twentieth-century drought in the conterminous United States. J. Hydrometeorol. 2005, 6, 985–1001. [Google Scholar] [CrossRef]
- An, Q.; He, H.; Nie, Q.; Cui, Y.; Gao, J.; Wei, C.; Xie, X.; You, J. Spatial and temporal variations of drought in Inner Mongolia, China. Water 2020, 12, 1715. [Google Scholar] [CrossRef]
- Du, E.; Chen, F.; Jia, H.; Wang, L.; Yang, A. Spatiotemporal evolution and hysteresis analysis of drought based on rainfed-irrigated arable land. Remote Sens. 2023, 15, 1689. [Google Scholar] [CrossRef]
- Chen, X.; Li, F.-w.; Li, J.-z.; Feng, P. Three-dimensional identification of hydrological drought and multivariate drought risk probability assessment in the Luanhe River basin, China. Theor. Appl. Climatol. 2019, 137, 3055–3076. [Google Scholar] [CrossRef]
- Lloyd-Hughes, B. A spatio-temporal structure-based approach to drought characterisation. Int. J. Climatol. 2012, 32, 406–418. [Google Scholar] [CrossRef]
- Guo, H.; Bao, A.; Ndayisaba, F.; Liu, T.; Jiapaer, G.; El-Tantawi, A.M.; De Maeyer, P. Space-time characterization of drought events and their impacts on vegetation in Central Asia. J. Hydrol. 2018, 564, 1165–1178. [Google Scholar] [CrossRef]
- Wen, X.; Tu, Y.-h.; Tan, Q.-f.; Li, W.-y.; Fang, G.-h.; Ding, Z.-y.; Wang, Z.-n. Construction of 3D drought structures of meteorological drought events and their spatio-temporal evolution characteristics. J. Hydrol. 2020, 590, 125539. [Google Scholar] [CrossRef]
- Feng, K.; Yan, Z.; Li, Y.; Wang, F.; Zhang, Z.; Su, X.; Wu, H.; Zhang, G.; Wang, Y. Spatio-temporal dynamic evaluation of agricultural drought based on a three-dimensional identification method in Northwest China. Agric. Water Manag. 2023, 284, 108325. [Google Scholar] [CrossRef]
- Wei, Y.; Zhu, L.; Chen, Y.; Cao, X.; Yu, H. Spatiotemporal variations in drought and vegetation response in Inner Mongolia from 1982 to 2019. Remote Sens. 2022, 14, 3803. [Google Scholar] [CrossRef]
- Wang, Y.; Liu, G.; Guo, E. Spatial distribution and temporal variation of drought in Inner Mongolia during 1901–2014 using Standardized Precipitation Evapotranspiration Index. Sci. Total Environ. 2019, 654, 850–862. [Google Scholar] [CrossRef] [PubMed]
- Ma, Z.-C.; Sun, P.; Zhang, Q.; Hu, Y.-Q.; Jiang, W. Characterization and evaluation of MODIS-derived crop water stress index (CWSI) for monitoring drought from 2001 to 2017 over Inner Mongolia. Sustainability 2021, 13, 916. [Google Scholar] [CrossRef]
- Huang, J.; Xue, Y.; Sun, S.; Zhang, J. Spatial and temporal variability of drought during 1960–2012 in Inner Mongolia, north China. Quat. Int. 2015, 355, 134–144. [Google Scholar] [CrossRef]
- Cai, S.; Song, X.; Hu, R.; Leng, P.; Li, X.; Guo, D.; Zhang, Y.; Hao, Y.; Wang, Y. Spatiotemporal characteristics of agricultural droughts based on soil moisture data in Inner Mongolia from 1981 to 2019. J. Hydrol. 2021, 603, 127104. [Google Scholar] [CrossRef]
- Shen, Z.; Zhang, Q.; Singh, V.P.; Sun, P.; Song, C.; Yu, H. Agricultural drought monitoring across Inner Mongolia, China: Model development, spatiotemporal patterns and impacts. J. Hydrol. 2019, 571, 793–804. [Google Scholar] [CrossRef]
- Khan, N.Z.; Waseem, M. Assessment of Satellite Based Evapotranspiration Products at Regional Scale over Landscape of Pakistan. Hydrology 2022, 10, 34–41. [Google Scholar]
- Wang, W.; Cui, W.; Wang, X.; Chen, X. Evaluation of GLDAS-1 and GLDAS-2 forcing data and Noah model simulations over China at the monthly scale. J. Hydrometeorol. 2016, 17, 2815–2833. [Google Scholar] [CrossRef]
- Sun, X.; Lai, P.; Wang, S.; Song, L.; Ma, M.; Han, X. Monitoring of extreme agricultural drought of the past 20 years in southwest China using GLDAS soil moisture. Remote Sens. 2022, 14, 1323. [Google Scholar] [CrossRef]
- Li, Y.; Huang, S.; Wang, H.; Zheng, X.; Huang, Q.; Deng, M.; Peng, J. High-resolution propagation time from meteorological to agricultural drought at multiple levels and spatiotemporal scales. Agric. Water Manag. 2022, 262, 107428. [Google Scholar] [CrossRef]
- Yang, M.; Yan, D.; Yu, Y.; Yang, Z. SPEI-based spatiotemporal analysis of drought in Haihe River Basin from 1961 to 2010. Adv. Meteorol. 2016, 2016, 7658015. [Google Scholar] [CrossRef]
- Abu Arra, A.; Şişman, E. Characteristics of Hydrological and Meteorological Drought Based on Intensity-Duration-Frequency (IDF) Curves. Water 2023, 15, 3142. [Google Scholar] [CrossRef]
- Ullah, I.; Ma, X.; Yin, J.; Omer, A.; Habtemicheal, B.A.; Saleem, F.; Iyakaremye, V.; Syed, S.; Arshad, M.; Liu, M. Spatiotemporal characteristics of meteorological drought variability and trends (1981–2020) over South Asia and the associated large-scale circulation patterns. Clim. Dyn. 2023, 60, 2261–2284. [Google Scholar] [CrossRef]
- Merabti, A.; Darouich, H.; Paredes, P.; Meddi, M.; Pereira, L.S. Assessing Spatial Variability and Trends of Droughts in Eastern Algeria Using SPI, RDI, PDSI, and MedPDSI—A Novel Drought Index Using the FAO56 Evapotranspiration Method. Water 2023, 15, 626. [Google Scholar] [CrossRef]
- Li, J.; Xi, M.; Pan, Z.; Liu, Z.; He, Z.; Qin, F. Response of NDVI and SIF to Meteorological Drought in the Yellow River Basin from 2001 to 2020. Water 2022, 14, 2978. [Google Scholar] [CrossRef]
- Wang, F.; Yang, H.; Wang, Z.; Zhang, Z.; Li, Z. Drought evaluation with CMORPH satellite precipitation data in the Yellow River Basin by using gridded standardized precipitation evapotranspiration index. Remote Sens. 2019, 11, 485. [Google Scholar] [CrossRef]
- Li, W.-y.; Wen, X.; Tan, Q.-f.; Tu, Y.-h.; Yang, T.-t.; Wang, Y.-l.; Yu, X.-d. Exploring spatio-temporal distribution and evolution of dry-wet alternation using a three-dimensional identification method. J. Hydrol. 2022, 612, 128119. [Google Scholar] [CrossRef]
- Sheffield, J.; Andreadis, K.M.; Wood, E.F.; Lettenmaier, D.P. Global and continental drought in the second half of the twentieth century: Severity–area–duration analysis and temporal variability of large-scale events. J. Clim. 2009, 22, 1962–1981. [Google Scholar] [CrossRef]
- Xu, K.; Yang, D.; Yang, H.; Li, Z.; Qin, Y.; Shen, Y. Spatio-temporal variation of drought in China during 1961–2012: A climatic perspective. J. Hydrol. 2015, 526, 253–264. [Google Scholar] [CrossRef]
- Liu, Y.; Zhu, Y.; Ren, L.; Singh, V.P.; Yong, B.; Jiang, S.; Yuan, F.; Yang, X. Understanding the spatiotemporal links between meteorological and hydrological droughts from a three-dimensional perspective. J. Geophys. Res. Atmos. 2019, 124, 3090–3109. [Google Scholar] [CrossRef]
- Wang, A.; Lettenmaier, D.P.; Sheffield, J. Soil moisture drought in China, 1950–2006. J. Clim. 2011, 24, 3257–3271. [Google Scholar] [CrossRef]
- Zhang, Z.; Lai, H.; Wang, F.; Feng, K.; Qi, Q.; Li, Y. Spatial–Temporal Patterns and Propagation Dynamics of Ecological Drought in the North China Plain. Water 2022, 14, 1542. [Google Scholar] [CrossRef]
- Su, L.; Miao, C.; Duan, Q.; Lei, X.; Li, H. Multiple-wavelet coherence of world’s large rivers with meteorological factors and ocean signals. J. Geophys. Res. Atmos. 2019, 124, 4932–4954. [Google Scholar] [CrossRef]
- Poornima, S.; Pushpalatha, M.; Jana, R.B.; Patti, L.A. Rainfall Forecast and Drought Analysis for Recent and Forthcoming Years in India. Water 2023, 15, 592. [Google Scholar] [CrossRef]
- Miao, L.; Jiang, C.; Xue, B.; Liu, Q.; He, B.; Nath, R.; Cui, X. Vegetation dynamics and factor analysis in arid and semi-arid Inner Mongolia. Environ. Earth Sci. 2015, 73, 2343–2352. [Google Scholar] [CrossRef]
- Guo, W.; Huang, S.; Huang, Q.; She, D.; Shi, H.; Leng, G.; Li, J.; Cheng, L.; Gao, Y.; Peng, J. Precipitation and vegetation transpiration variations dominate the dynamics of agricultural drought characteristics in China. Sci. Total Environ. 2023, 898, 165480. [Google Scholar] [CrossRef]
- Wang, L.; Kotani, A.; Tanaka, T.; Ohta, T. Assessment of drought condition using remotely sensed drought severity index and its correlations with soil moisture product in Inner Mongolia. Theor. Appl. Climatol. 2020, 141, 715–728. [Google Scholar] [CrossRef]
- Na, Y.T. Overview of application of remote sensing on drought monitoring in Inner Mongolia. Adv. Mater. Res. 2014, 955–959, 3735–3739. [Google Scholar] [CrossRef]
- Zhao, H.; Chen, X.; Yang, J.; Yao, C.; Zhang, Q.; Mei, P. Comprehensive Assessment and Variation Characteristics of the Drought Intensity in North China Based on EID. J. Appl. Meteorol. Climatol. 2022, 61, 297–308. [Google Scholar] [CrossRef]
- Pan, Y.; Zhu, Y.; Lü, H.; Yagci, A.L.; Fu, X.; Liu, E.; Xu, H.; Ding, Z.; Liu, R. Accuracy of agricultural drought indices and analysis of agricultural drought characteristics in China between 2000 and 2019. Agric. Water Manag. 2023, 283, 108305. [Google Scholar] [CrossRef]
- Wang, Q.; Liu, Y.-y.; Zhang, Y.-z.; Tong, L.-j.; Li, X.; Li, J.-l.; Sun, Z. Assessment of spatial agglomeration of agricultural drought disaster in China from 1978 to 2016. Sci. Rep. 2019, 9, 14393. [Google Scholar] [CrossRef] [PubMed]
- Yang, P.; Zhai, X.; Huang, H.; Zhang, Y.; Zhu, Y.; Shi, X.; Zhou, L.; Fu, C. Association and driving factors of meteorological drought and agricultural drought in Ningxia, Northwest China. Atmos. Res. 2023, 289, 106753. [Google Scholar] [CrossRef]


| Drought Level | SSMI | Drought Severity |
|---|---|---|
| I | −0.5 < SSMI | No drought |
| II | −1 < SSMI ≤ −0.5 | Light drought |
| III | −1.5 < SSMI ≤ −1 | Moderate drought |
| IV | −2 < SSMI ≤ −1.5 | Severe drought |
| VI | SSMI ≤ −2 | Extreme drought |
| Number | Start Time (Month Year) | End Time (Month Year) | Drought Duration (Month) | Drought Center | Drought Area (104 km2) | Drought Severity (105 Months·km2) | |
|---|---|---|---|---|---|---|---|
| Lon | Lat | ||||||
| 36 | October 2020 | May 2002 | 20 | 113.81 | 43.20 | 24.19 | 35.28 |
| 56 | October 2007 | June 2008 | 9 | 114.52 | 43.73 | 26.31 | 27.58 |
| 83 | July 2017 | August 2018 | 14 | 111.09 | 42.51 | 12.99 | 23.12 |
| 5 | August 1965 | June 1966 | 11 | 111.80 | 42.31 | 16.85 | 18.99 |
| 45 | September 2005 | May 2006 | 9 | 114.44 | 43.89 | 19.40 | 18.32 |
| 69 | September 2011 | June 2012 | 10 | 112.43 | 42.68 | 14.62 | 18.20 |
| 61 | September 2009 | May 2010 | 9 | 114.69 | 43.58 | 17.43 | 16.59 |
| 59 | September 2008 | July 2009 | 11 | 115.84 | 44.58 | 16.84 | 15.17 |
| 41 | October 2002 | May 2003 | 8 | 112.38 | 42.64 | 13.71 | 11.63 |
| 51 | September 2006 | May 2007 | 9 | 111.76 | 42.59 | 14.07 | 10.89 |
Disclaimer/Publisher’s Note: The statements, opinions and data contained in all publications are solely those of the individual author(s) and contributor(s) and not of MDPI and/or the editor(s). MDPI and/or the editor(s) disclaim responsibility for any injury to people or property resulting from any ideas, methods, instructions or products referred to in the content. |
© 2024 by the authors. Licensee MDPI, Basel, Switzerland. This article is an open access article distributed under the terms and conditions of the Creative Commons Attribution (CC BY) license (https://creativecommons.org/licenses/by/4.0/).
Share and Cite
Zhang, Z.; Guo, H.; Feng, K.; Wang, F.; Zhang, W.; Liu, J. Analysis of Agricultural Drought Evolution Characteristics and Driving Factors in Inner Mongolia Inland River Basin Based on Three-Dimensional Recognition. Water 2024, 16, 440. https://doi.org/10.3390/w16030440
Zhang Z, Guo H, Feng K, Wang F, Zhang W, Liu J. Analysis of Agricultural Drought Evolution Characteristics and Driving Factors in Inner Mongolia Inland River Basin Based on Three-Dimensional Recognition. Water. 2024; 16(3):440. https://doi.org/10.3390/w16030440
Chicago/Turabian StyleZhang, Zezhong, Hengzhi Guo, Kai Feng, Fei Wang, Weijie Zhang, and Jian Liu. 2024. "Analysis of Agricultural Drought Evolution Characteristics and Driving Factors in Inner Mongolia Inland River Basin Based on Three-Dimensional Recognition" Water 16, no. 3: 440. https://doi.org/10.3390/w16030440
APA StyleZhang, Z., Guo, H., Feng, K., Wang, F., Zhang, W., & Liu, J. (2024). Analysis of Agricultural Drought Evolution Characteristics and Driving Factors in Inner Mongolia Inland River Basin Based on Three-Dimensional Recognition. Water, 16(3), 440. https://doi.org/10.3390/w16030440