Article

Analysis of Pressure Pulsation and Structural Characteristics of Vertical Shaft Cross-Flow Pumps

1
School of Mechanical Engineering, Yangzhou Polytechnic College, Yangzhou 225100, China
2
College of Electrical, Energy and Power Engineering, Yangzhou University, Yangzhou 225100, China
3
Suzhou Water Conservancy Design and Research Co., Ltd., Suzhou 215011, China
*
Author to whom correspondence should be addressed.
Water 2024, 16(2), 324; https://doi.org/10.3390/w16020324
Submission received: 29 November 2023 / Revised: 4 January 2024 / Accepted: 16 January 2024 / Published: 18 January 2024
(This article belongs to the Special Issue Design and Optimization of Fluid Machinery)

Abstract

:
In order to study the pressure pulsation characteristics and structural dynamic response characteristics of a vertical shaft cross-flow pump, this study used a computational fluid dynamics (CFD) numerical simulation method to analyze the pressure pulsation characteristics of the inlet passage, impeller, and guide vane positions of the vertical shaft cross-flow pump device. At the same time, this study analyzed the equivalent stress–strain characteristics of the impeller and guide vane of a vertical shaft cross-flow pump based on fluid structure coupling technology and comprehensively analyzed the deformation modes of the impeller blades and guide vanes under dynamic water flow. This research shows that due to the influence of rotor–stator interaction, the amplitude of pressure pulsation at the interface between the impeller and guide vane of the pump device is the largest and that the main frequency distribution at this position is relatively complex. The non-uniformity of stress distribution at the impeller position gradually decreases with an increase in the radial distance. The high stress and strain zones of the impeller and guide vane are concentrated at the root of the blade. This study can provide reference for hydraulic optimization design and stable operation of similar pump devices.

1. Introduction

Nowadays, large-scale vertical axial flow pump devices play a very important role in the national economy, and they are widely used in various pump station projects [1,2]. However, the safe and stable operation of pumping stations has also attracted the attention of many experts and scholars. The structure of large axial flow pump units is complex, and changes in the structural characteristics of the pump device can greatly affect the reliability of pump station operation and even lead to major safety accidents in severe cases. Especially for a vertical shaft tubular pump station, where the unit is located in the flow channel, the water thrust and pressure during the operation of the pump device will undergo periodic fluctuations with the operating cycle. Therefore, during the operation of the pump station, cracks are highly likely to appear on the blades and affect the safe and stable operation of the pump station. In order to ensure the safe and stable operation of the pump station, it is required that the impeller and its supporting flow passage components, as the core components of the pump station, can maintain the strain within the normal range under the action of hydraulic thrust and pressure.
During operation, the water continuously impacts the pump rotor, and the deformation of the pump rotor affects the movement of the water flow, which is a fluid structure coupling phenomenon [3,4,5]. The water flow will generate pulsating pressure throughout the entire pump device. During operation, the pressure pulsation will have an impact on the overall operation of the pump device, causing stress and strain on the overflow components. Zhang et al. [6] comprehensively compared and analyzed the fluid dynamics characteristics of bidirectional axial flow pumps under positive and negative operation. Obaidi et al. [7] systematically examined the pressure fluctuation characteristics of axial flow pumps by manipulating the angles of diverse impeller blades within both the time and frequency domains. Liu et al. [8] conducted experiments and numerical simulations to characterize the energy and pressure pulsation of centrifugal pumps and explained the influence of axial distance on the pressure pulsation of the pump device. At the same time, in order to reduce the impact of pressure fluctuations on centrifugal pumps, Zheng et al. [9] summarized measures to reduce pressure fluctuations and stress. Feng et al. [10] found through research that the rotor–stator interaction in axial flow pumps can generate pressure pulsation and further vibration. Under unstable conditions, the flow pattern inside the axial flow pump device is more disordered, and the pump device is more susceptible to significant pressure fluctuations. Kan et al. [11] studied the typical flow structure and pressure fluctuation characteristics of the axial flow pump under stall conditions and compared and analyzed the design and stall conditions to reveal the mechanism of low-frequency pressure fluctuations under stall conditions.
Pressure pulsation is one of the reasons for unstable operation of pump devices. While in operation, pressure pulsations continuously impact the pump, generating cyclic stress that leads to cracks on the impeller blades. Hence, numerous experts and scholars globally have delved into researching the structural characteristics of pump devices. Yang et al. and Bai et al. [12,13] conducted comprehensive investigations into the fatigue characteristics of axial flow pumps, offering a detailed exposition on the subject. Concurrently, the temporal evolution of stress manifests a discernible periodic pattern. Simultaneously, scholars have undertaken investigations into the structural attributes of various pump devices, including the bidirectional flow channel axial flow pump device [14], the S-type front axle extended tube pump device [15], and full tube axial flow pump units [16]. Scholars have elucidated the stress and strain distribution in the pump device utilizing fluid-structure coupling methods, providing insights into potential crack locations. Through numerical simulation, Zhang et al. [17] illustrated that the maximum equivalent stress in the impeller transpires in the joint region connecting the impeller blade’s root and the hub, while the maximum deformation of the impeller manifests at the leading edge’s tip. Zhou et al. [18] studied the stress–strain situation of a reverse generator set, and the article provided a detailed explanation of the location where stress–strain occurred, elucidating the changes in the stress–strain amplitude of the reverse generator set. Wang et al. [19] scrutinized the structural attributes of blades on both pressure and suction sides, identifying a notable concentration of stress proximate to the leading edge in the linkage between the blades and the hub. The maximum effective stress of the blades changed periodically, so preventive measures for blade fatigue should be taken. In addition to fluid solid coupling, scholars have also conducted thermal fluid solid coupling on the pump device, introducing the influence of temperature on the overall structural characteristics of the pump device. Ji et al. [20] conducted numerical simulations based on the coupling effect between fluid solid heat in multiple physical fields and designed an axially partitioned fuel cooling shell to solve the temperature rise problem of electric fuel pump (EFP) motors. Wei et al. [21] studied the thermal fluid solid coupling effect of axial piston pumps under high pressure and high-speed conditions, revealing the temperature and pressure changes in the oil film over time, the pressure distribution of the fluid, and the stress and displacement distribution of the solid in the valve plate. In order to study the correlation mechanism between the flow characteristics and the fluid-induced force under the compound whirl motion in the centrifugal pump, the RNG k-ε model was selected by Zhou et al. [22] to simulate a low specific speed centrifugal pump with impeller eccentricity based on the N-S equation. The results showed that the trend of fluid-induced force and the pressure coefficient is similar. With an increase in the impeller speed and impeller eccentricity, the dynamic and static interferences between the impeller and the volute tongue are more significant, the uneven distribution of the pressure around the impeller makes the internal flow of the centrifugal pump more disordered and increases the fluid-induced force near the volute tongue. Zhang et al. [23] aimed to provide a numerical investigation into the vibration features in a vertical axial pump based on a two-way iterative fluid–structure interaction method. Turbulent flow features were studied under the design condition, using the shear–stress transport k-ω turbulence model and the sliding mesh approach. The results revealed the time and frequency law of fluid pressure pulsation and structural vibration at the same position in the vertical axial pump while additionally providing important theoretical guidance for design optimization and safe operation of the vertical axial pump. In summary, many scholars have conducted pressure pulsation calculations and fluid solid coupling numerical simulations for pump devices, explored the interrelationship between pressure pulsation and the structural characteristics of the pump device, and analyzed the stress and strain of the pump device. Nevertheless, scholarly attention has been predominantly directed toward tubular axial flow pumps, with a comparatively limited emphasis on the investigation of structural characteristics pertaining to vertical shaft tubular pump devices.
This study delves into the pressure pulsation characteristics and structural characteristics of a vertical shaft tubular pump, employing the fluid–solid coupling method to compute the pump’s structural characteristics. The analysis encompasses the evaluation of equivalent stress and strain in the impeller and guide vanes of the vertical shaft tubular pump, with particular attention to the stress–strain variations at the impeller blade roots. The findings of this research offer practical engineering insights and serve as a valuable reference for related applications.

2. Numerical Simulation

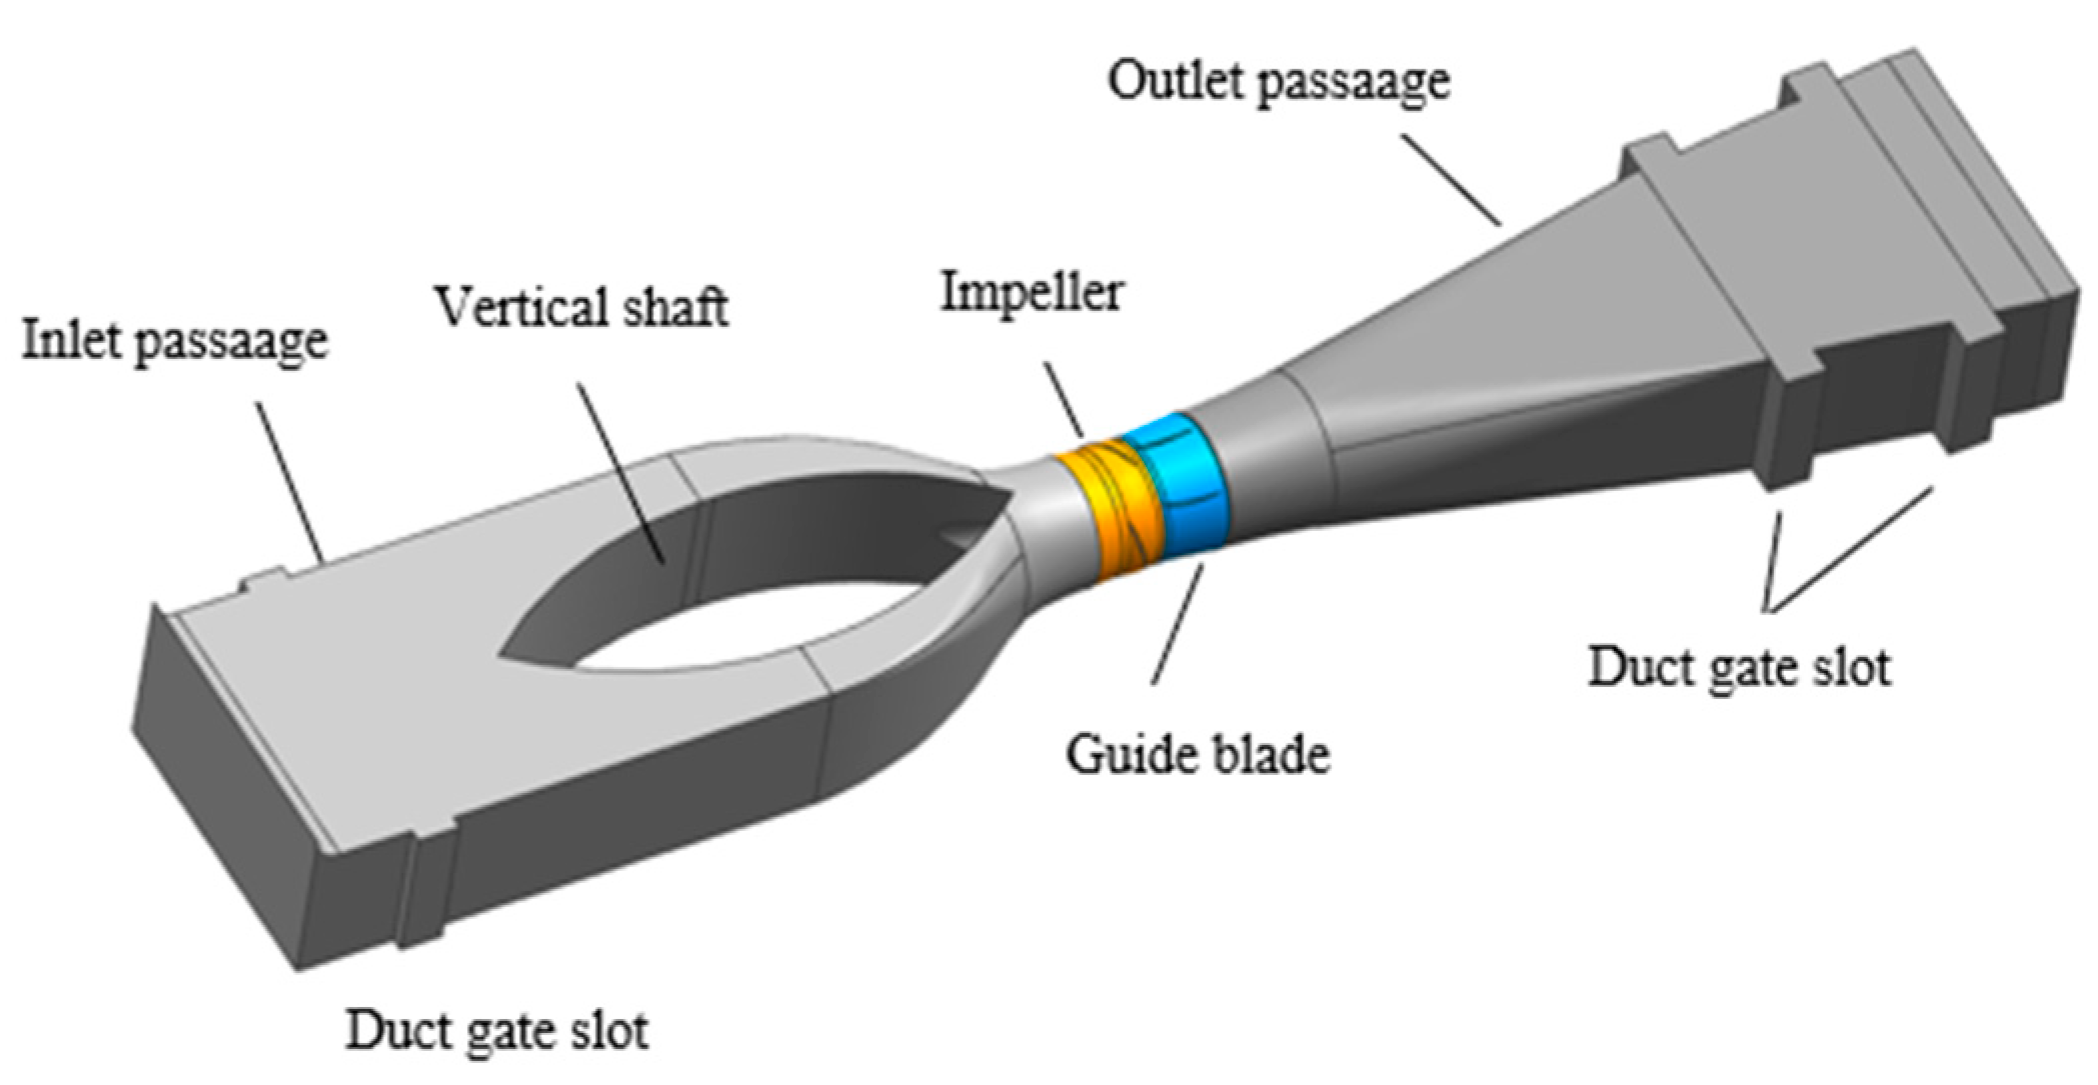
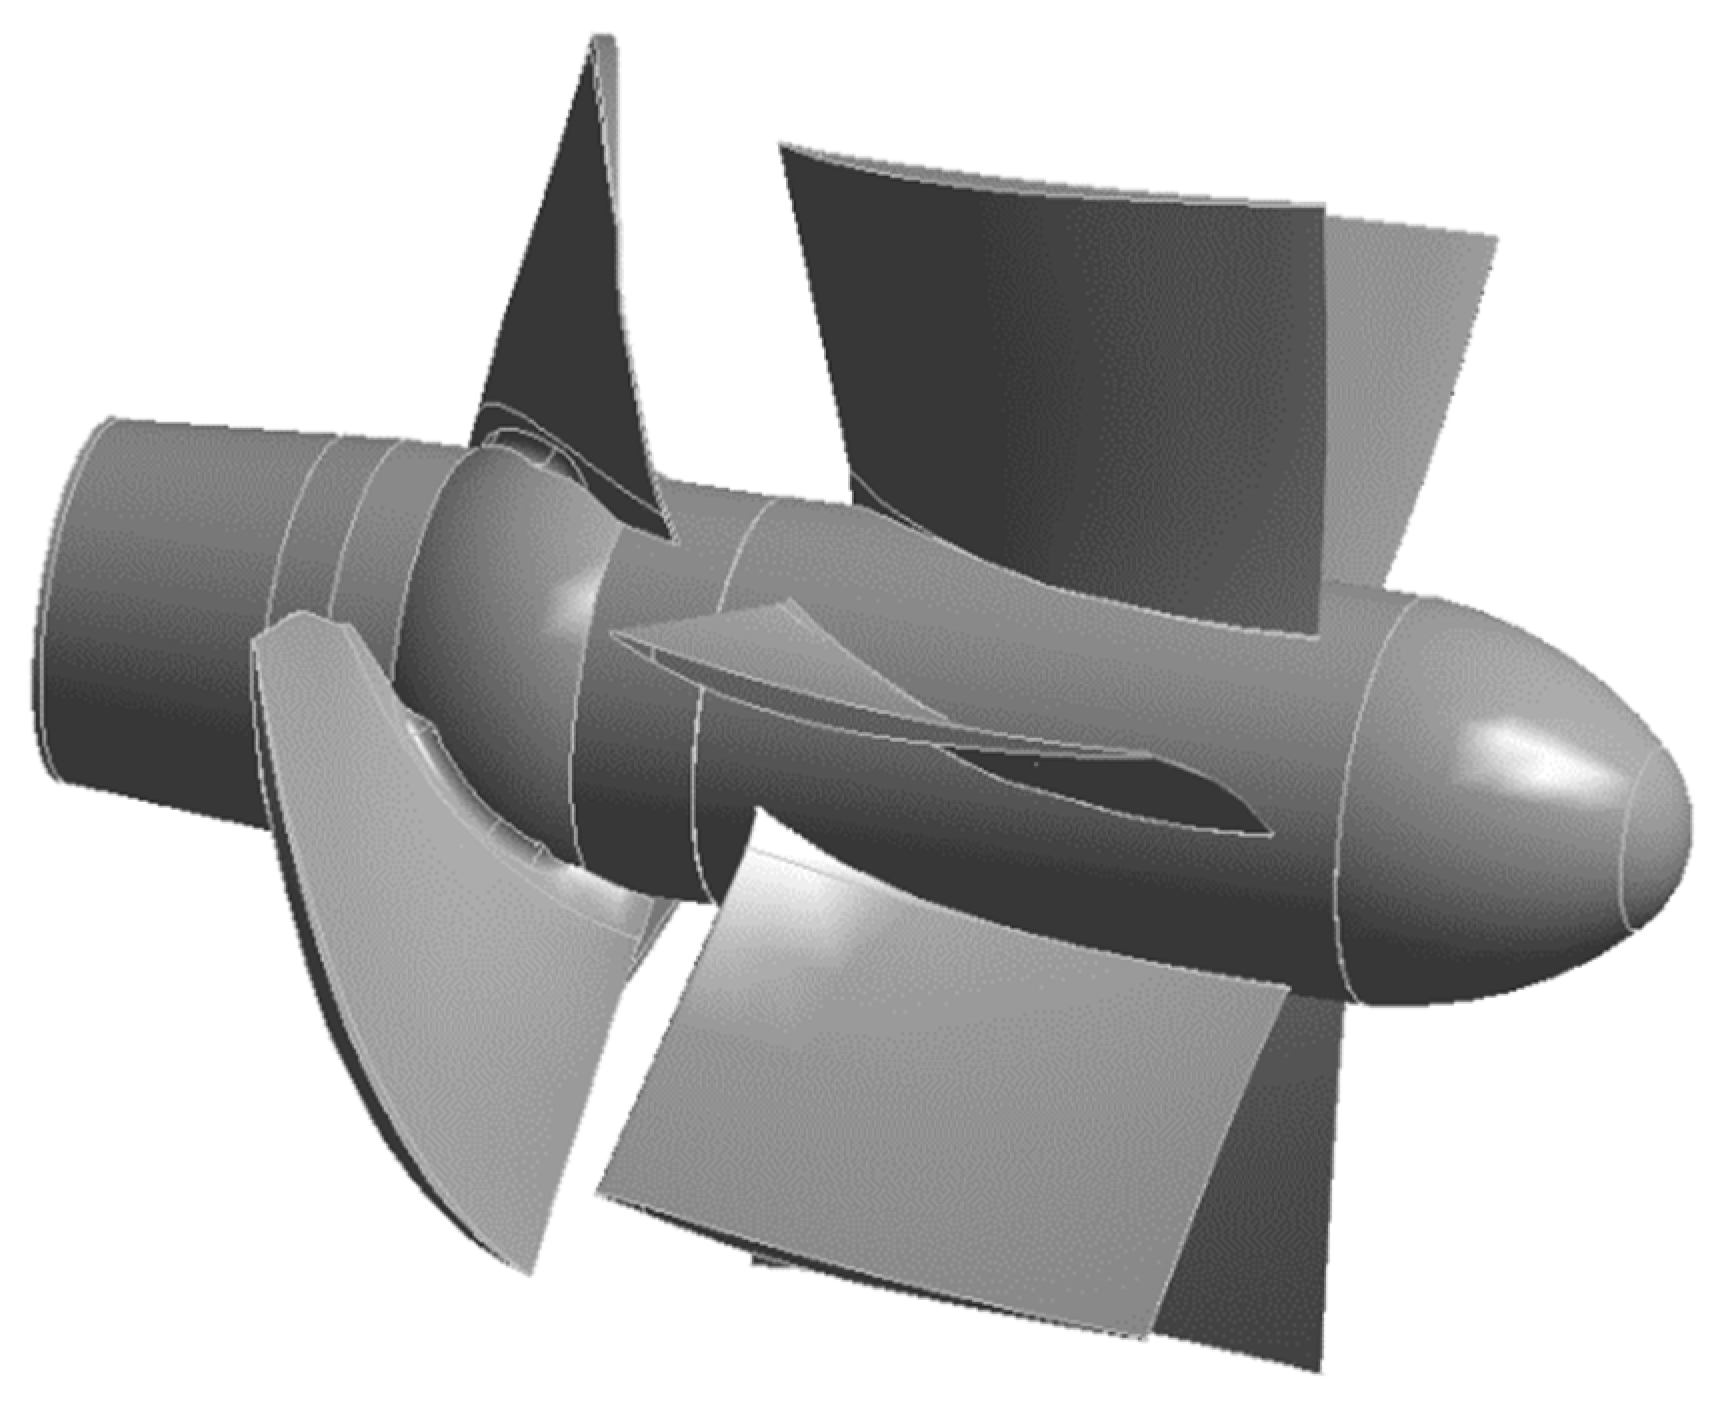
2.1. Numerical Simulation Model

The computational framework encompasses a low-head vertical pump, wherein each discrete pumping station is characterized by a designated volumetric flow rate of 14 m3/s and is equipped with a pump impeller featuring a diameter of 2400 mm, comprising three impeller blades and five guide vanes. The comprehensive computational domain of the model encompasses the inlet passage, impeller, guide vane, and outlet passage. Figure 1 presents a schematic representation of the vertical shaft pump’s structural configuration.

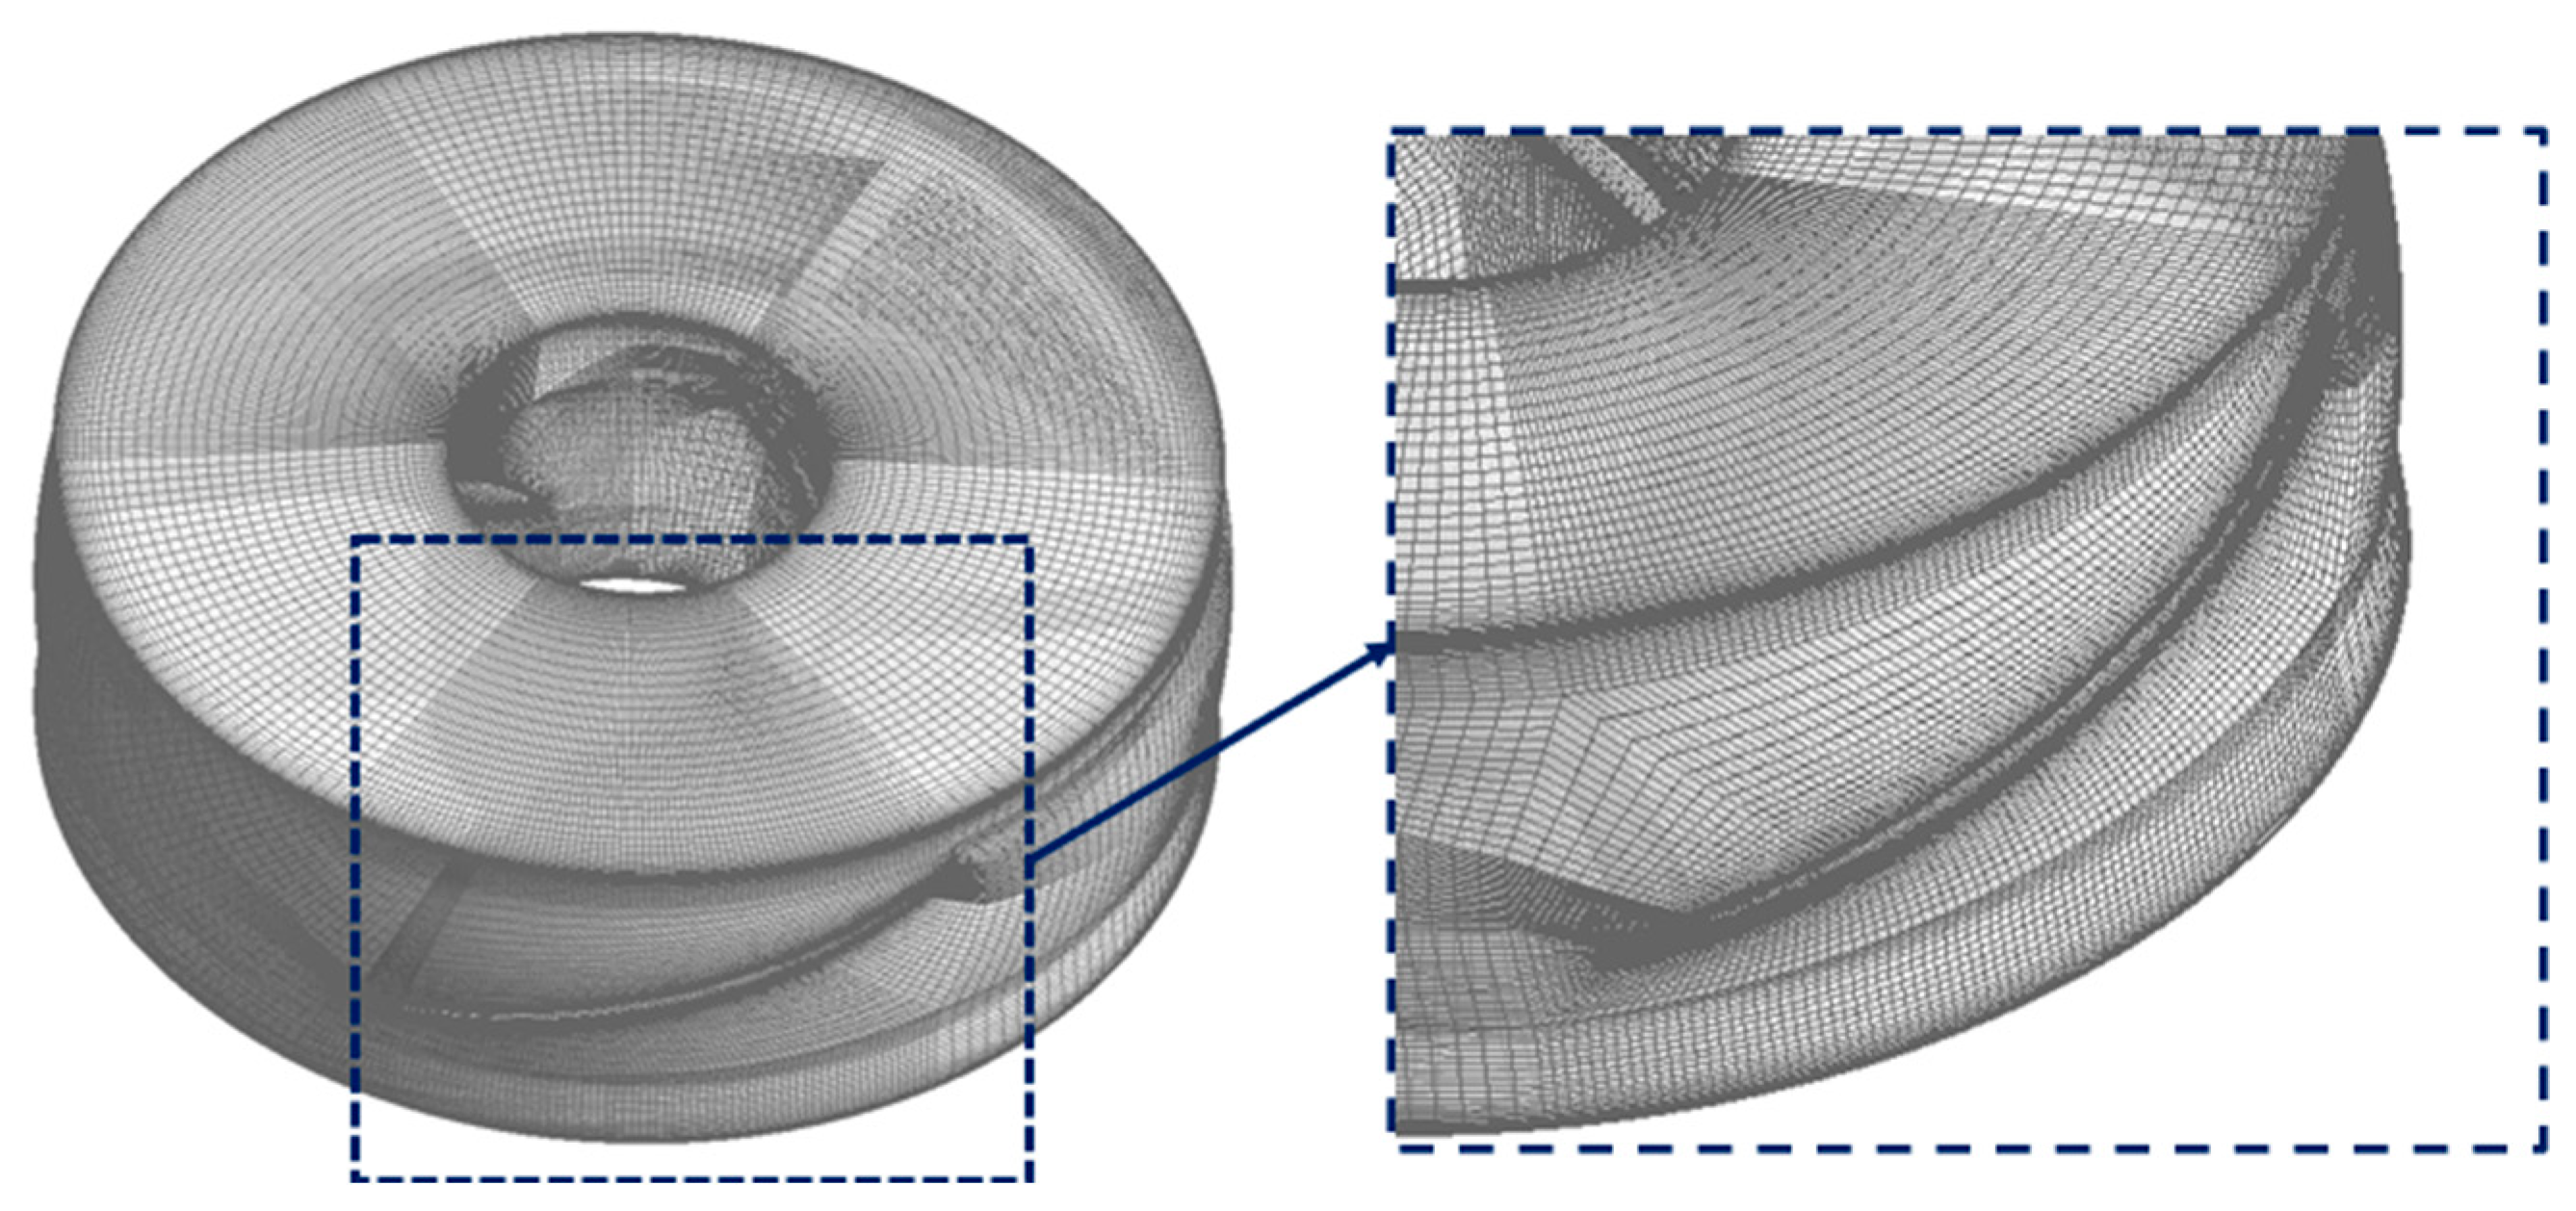
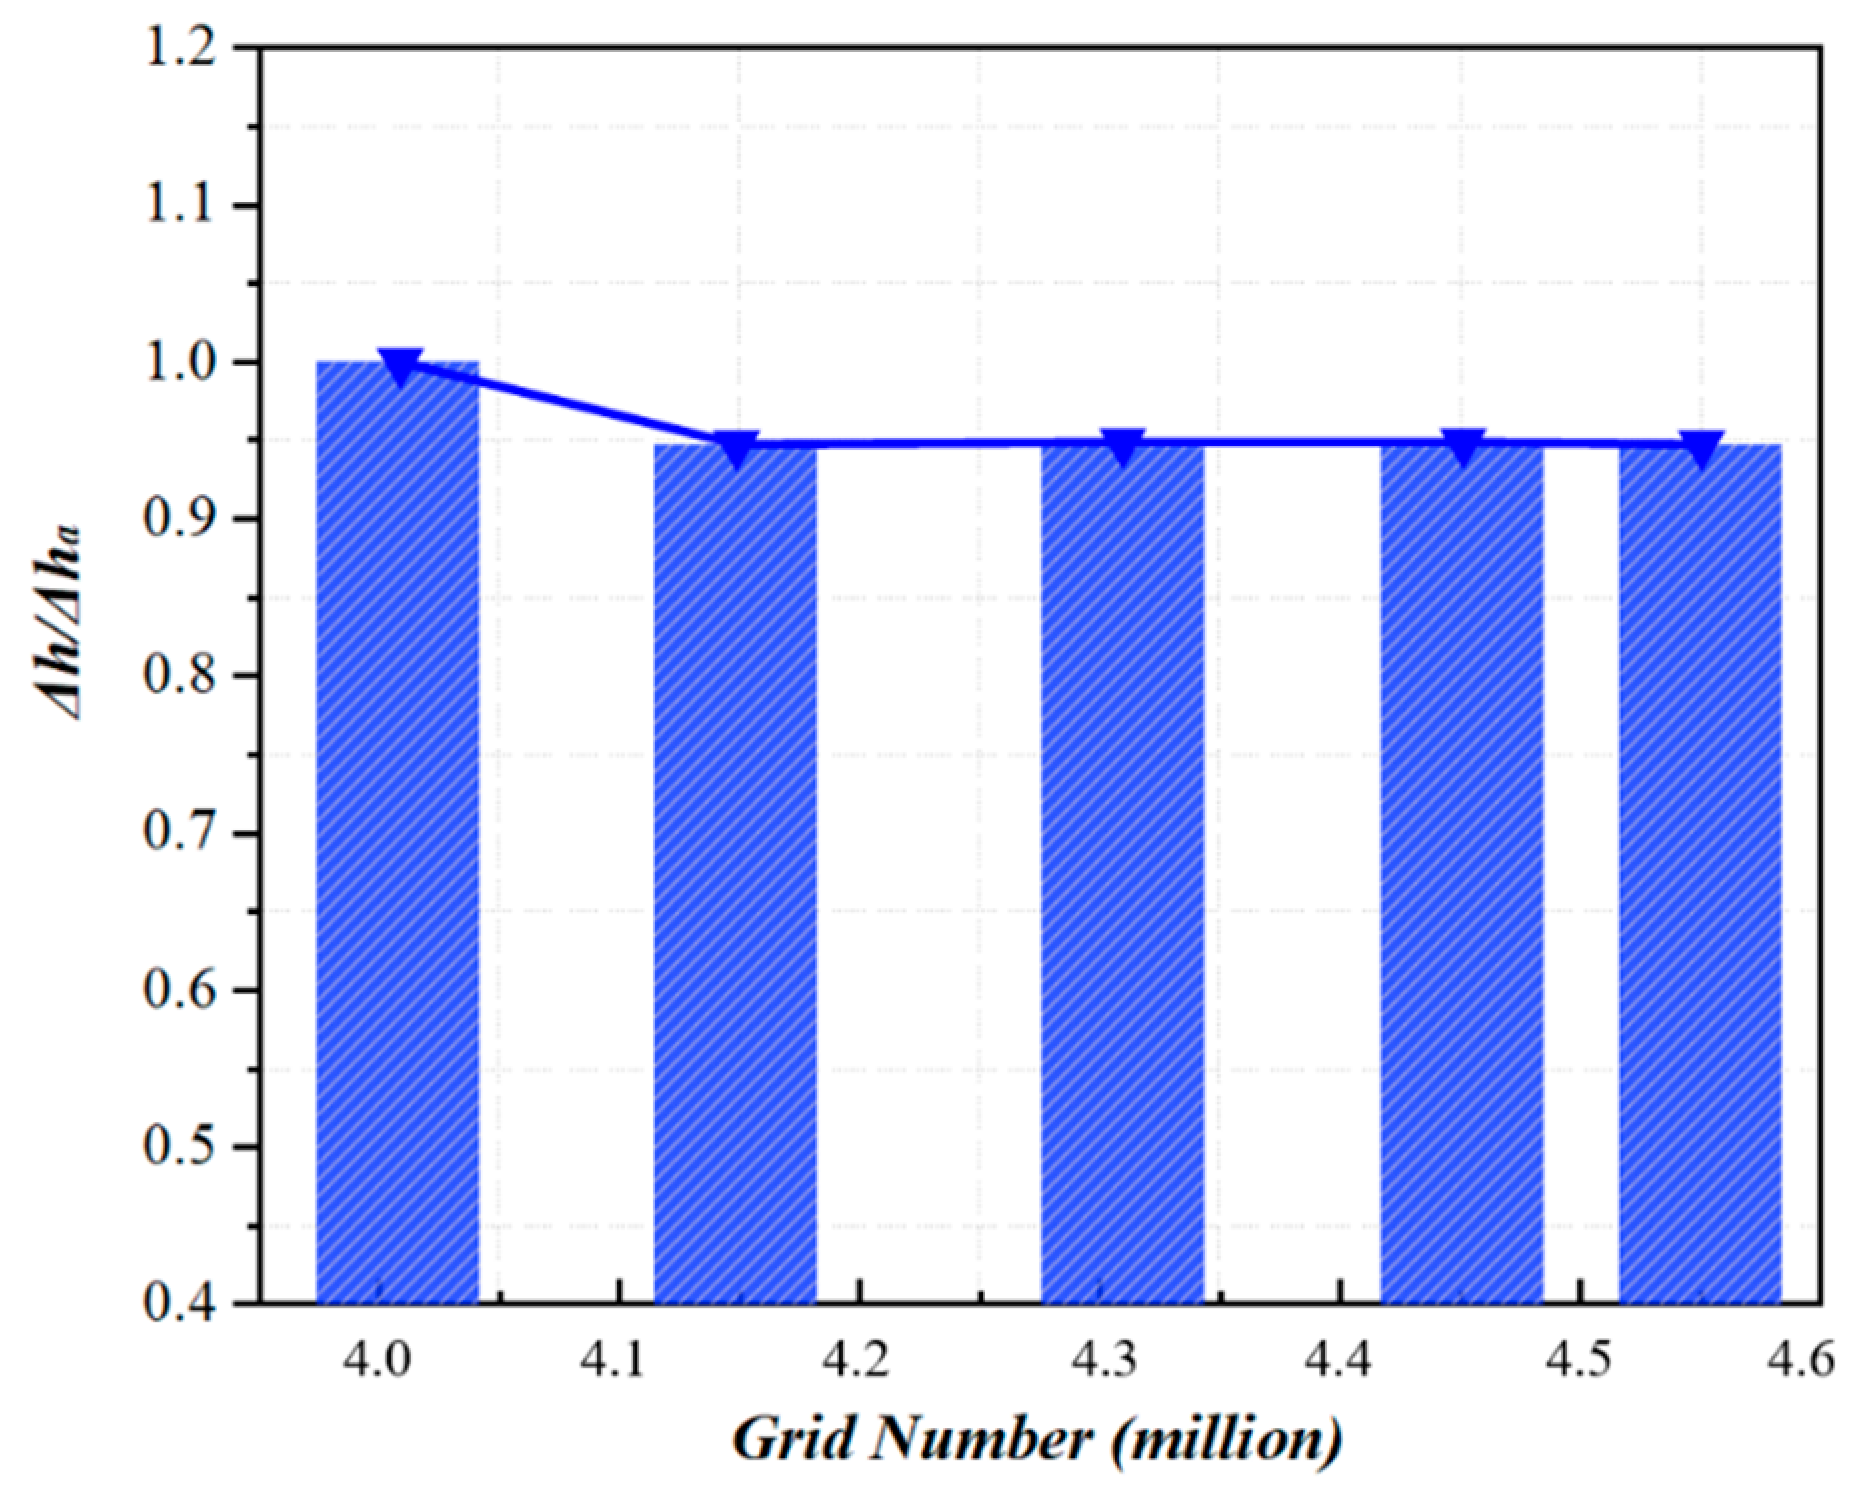
2.2. Mesh Sectioning

To account for both computational efficiency and precision in the subsequent numerical simulation, this study employed the ICEM CFD software within the ANSYS 19.2 to construct a hexahedral mesh computational model of the impeller. Figure 2 illustrates the mesh diagram of the impeller, while the remaining components of the pump utilize the Mesh software on the ANSYS platform to formulate a tetrahedral mesh. To ensure the precision of numerical simulation calculations, the grid count for the impeller is incrementally augmented, thereby optimizing computational resources without compromising grid quality. The grid independence results are shown in Figure 3. The analytical findings revealed that with an aggregate quantity of approximately 4.5 million power grids, the range of variations in hydropower loss remained within ±5%, thereby satisfying the criteria for the independence testing of the power grid.

2.3. Boundary Condition Settings

The inlet boundary is positioned at the inception of the inlet passage, where a prescribed mass flow rate of 14,000 kg/s is applied. The outlet boundary is characterized by the implementation of a pressure outlet condition, with normal pressure specified at the terminus of the outlet passage. The solid sidewall has no sliding conditions and no heat transfer and adopts wall features in the near-wall region. Let the impeller region be the rotation region. The interface between the inlet passage and the impeller as well as the interface between the impeller and the guide vanes in the pump device are set as follows: the frozen rotor interface is set in steady–state calculations, and the transient rotor–stator is set in transient calculations. All remaining interfaces are designated as static interfaces. The computational medium is defined as water with a temperature maintained at 25 °C. The calculation framework adopts a first-order headwind format, with a specified convergence accuracy of 10−5.

2.4. SST Turbulence Model

The turbulence models used in the numerical simulation of the pump device in this paper are all based on an SST k-ω turbulence model. This is mainly because SST k-ω turbulence models can fully adapt to various physical phenomena, such as changes in back pressure, and can be applied to the viscous inner layer. By applying wall functions, boundary layer phenomena can be accurately simulated without the need for more easily distorted viscous attenuation functions. This model is more suitable for the research content of this paper.
The SST turbulence model was first proposed by Menter in 1994. Menter combined Model k-ω and Model k-ε through a mixed function, avoiding the sensitivity of turbulence models to incoming flow and the need to add additional wall functions at the wall surface. Later, Menter modified the BSL k-ω model to calculate the eddy viscosity coefficient in the model and propose a shear stress transport (SST) model. The specific form of this model is as follows:
ρ k t + ρ u j k x j = P 1 β * ρ ω k + σ x j μ + σ k μ t d k x j
ρ w t + ρ u j w x j = r v t P 1 β ρ w 2 + x j u + σ ω μ t w d x j + 2 1 F 1 P σ ω 2 ω k x j ω x j
This turbulence model mainly establishes transport equations for turbulent kinetic energy k and specific dissipation rate ω. The right side of Equation (1) is the generation term, dissipation term, and diffusion term, while the right side of Equation (2) is the generation term, dissipation term, diffusion term, and cross-diffusion term. Among them, the “switch function” F1 is used to organically combine the k-ω and k-ε models. In the near wall region, F1 approaches 1, and the model approximates the k-ω model. When moving away from the wall, F1 approaches 0, and the model is transformed into the k-ε model, thus achieving complementary advantages and disadvantages between these two models. Use φ 1 to represent the parameters in the original k-ω model, and use φ 2 to represent the parameters in the transformed k-ε model; then, the parameter φ in the SST model can be represented as:
φ = F 1 φ 1 + 1 F 1 φ 2       ( φ = β , σ k , σ w , γ ) γ = β β * σ ω k 2 β *
The switch function F1 is defined as the function of the minimum distance to the wall:
F 1 = tanh Γ 4 Γ = min max Γ 1 , Γ 3 , Γ 2 Γ 1 = 500 v d 2 ω ,   Γ 2 = 4 ρ σ ω 2 k d 2 C D k ω , Γ 3 = k β * ω d C D k ω = max 2 ρ σ ω 2 1 ω k x i ω x i , 10 20 Ω = 2 W i j W i j , W i j = 1 2 u i x j u j x i
In the formula, d represents the minimum distance to the object surface; v is the coefficient of motion viscosity; ρ is the density; and Ω is the vorticity value.
The expression for the turbulent viscosity coefficient is:
μ t = a 1 ρ k max a 1 ω , Ω F 2
Similar to F1, the switch function F2 is also defined as a function of the minimum distance to the wall:
F 2 = tanh Π 2 ,   Π = max 2 Γ 3 , Γ 1
This function tends to 1 in the boundary layer flow and 0 in the free shear layer flow.

2.5. Fluid–Structure Coupling Settings

The structural analysis in this study employs the unidirectional flow solid–state bonding methodology. To scrutinize the structural characteristics of the blade, the finite element method is employed for the segmentation of the blade mesh. The physical computational domain encompasses both an impeller and a guide blade, as depicted in the figure. The materials constituting the impeller and guide vanes are identified as stainless steel. Figure 4 shows the overall structure of the solid-state computing domain. Figure 5 illustrates the mesh configuration of the impeller and guide vane structure. The impeller structure is discretized using a tetrahedral mesh. Finite element calculations necessitate careful consideration of boundary conditions for the vane model, encompassing structural constraints and pressure loads. In order to mitigate rigidity displacements within the structure, a fixed restraint is implemented on the hub surface, and a cylindrical support is affixed to the pump shaft. The loading conditions for structural computations are communicated through computational fluid dynamics (CFD) calculations involving blade, wheel, and rim surface pressures. Additionally, accounting for the influence of centrifugal force and gravity resulting from impeller rotation, the impeller rotational speed is specified as 135 revolutions per minute (r/min), and gravitational acceleration is set at 9.81 m/s2.

3. Description of the Experimental Device

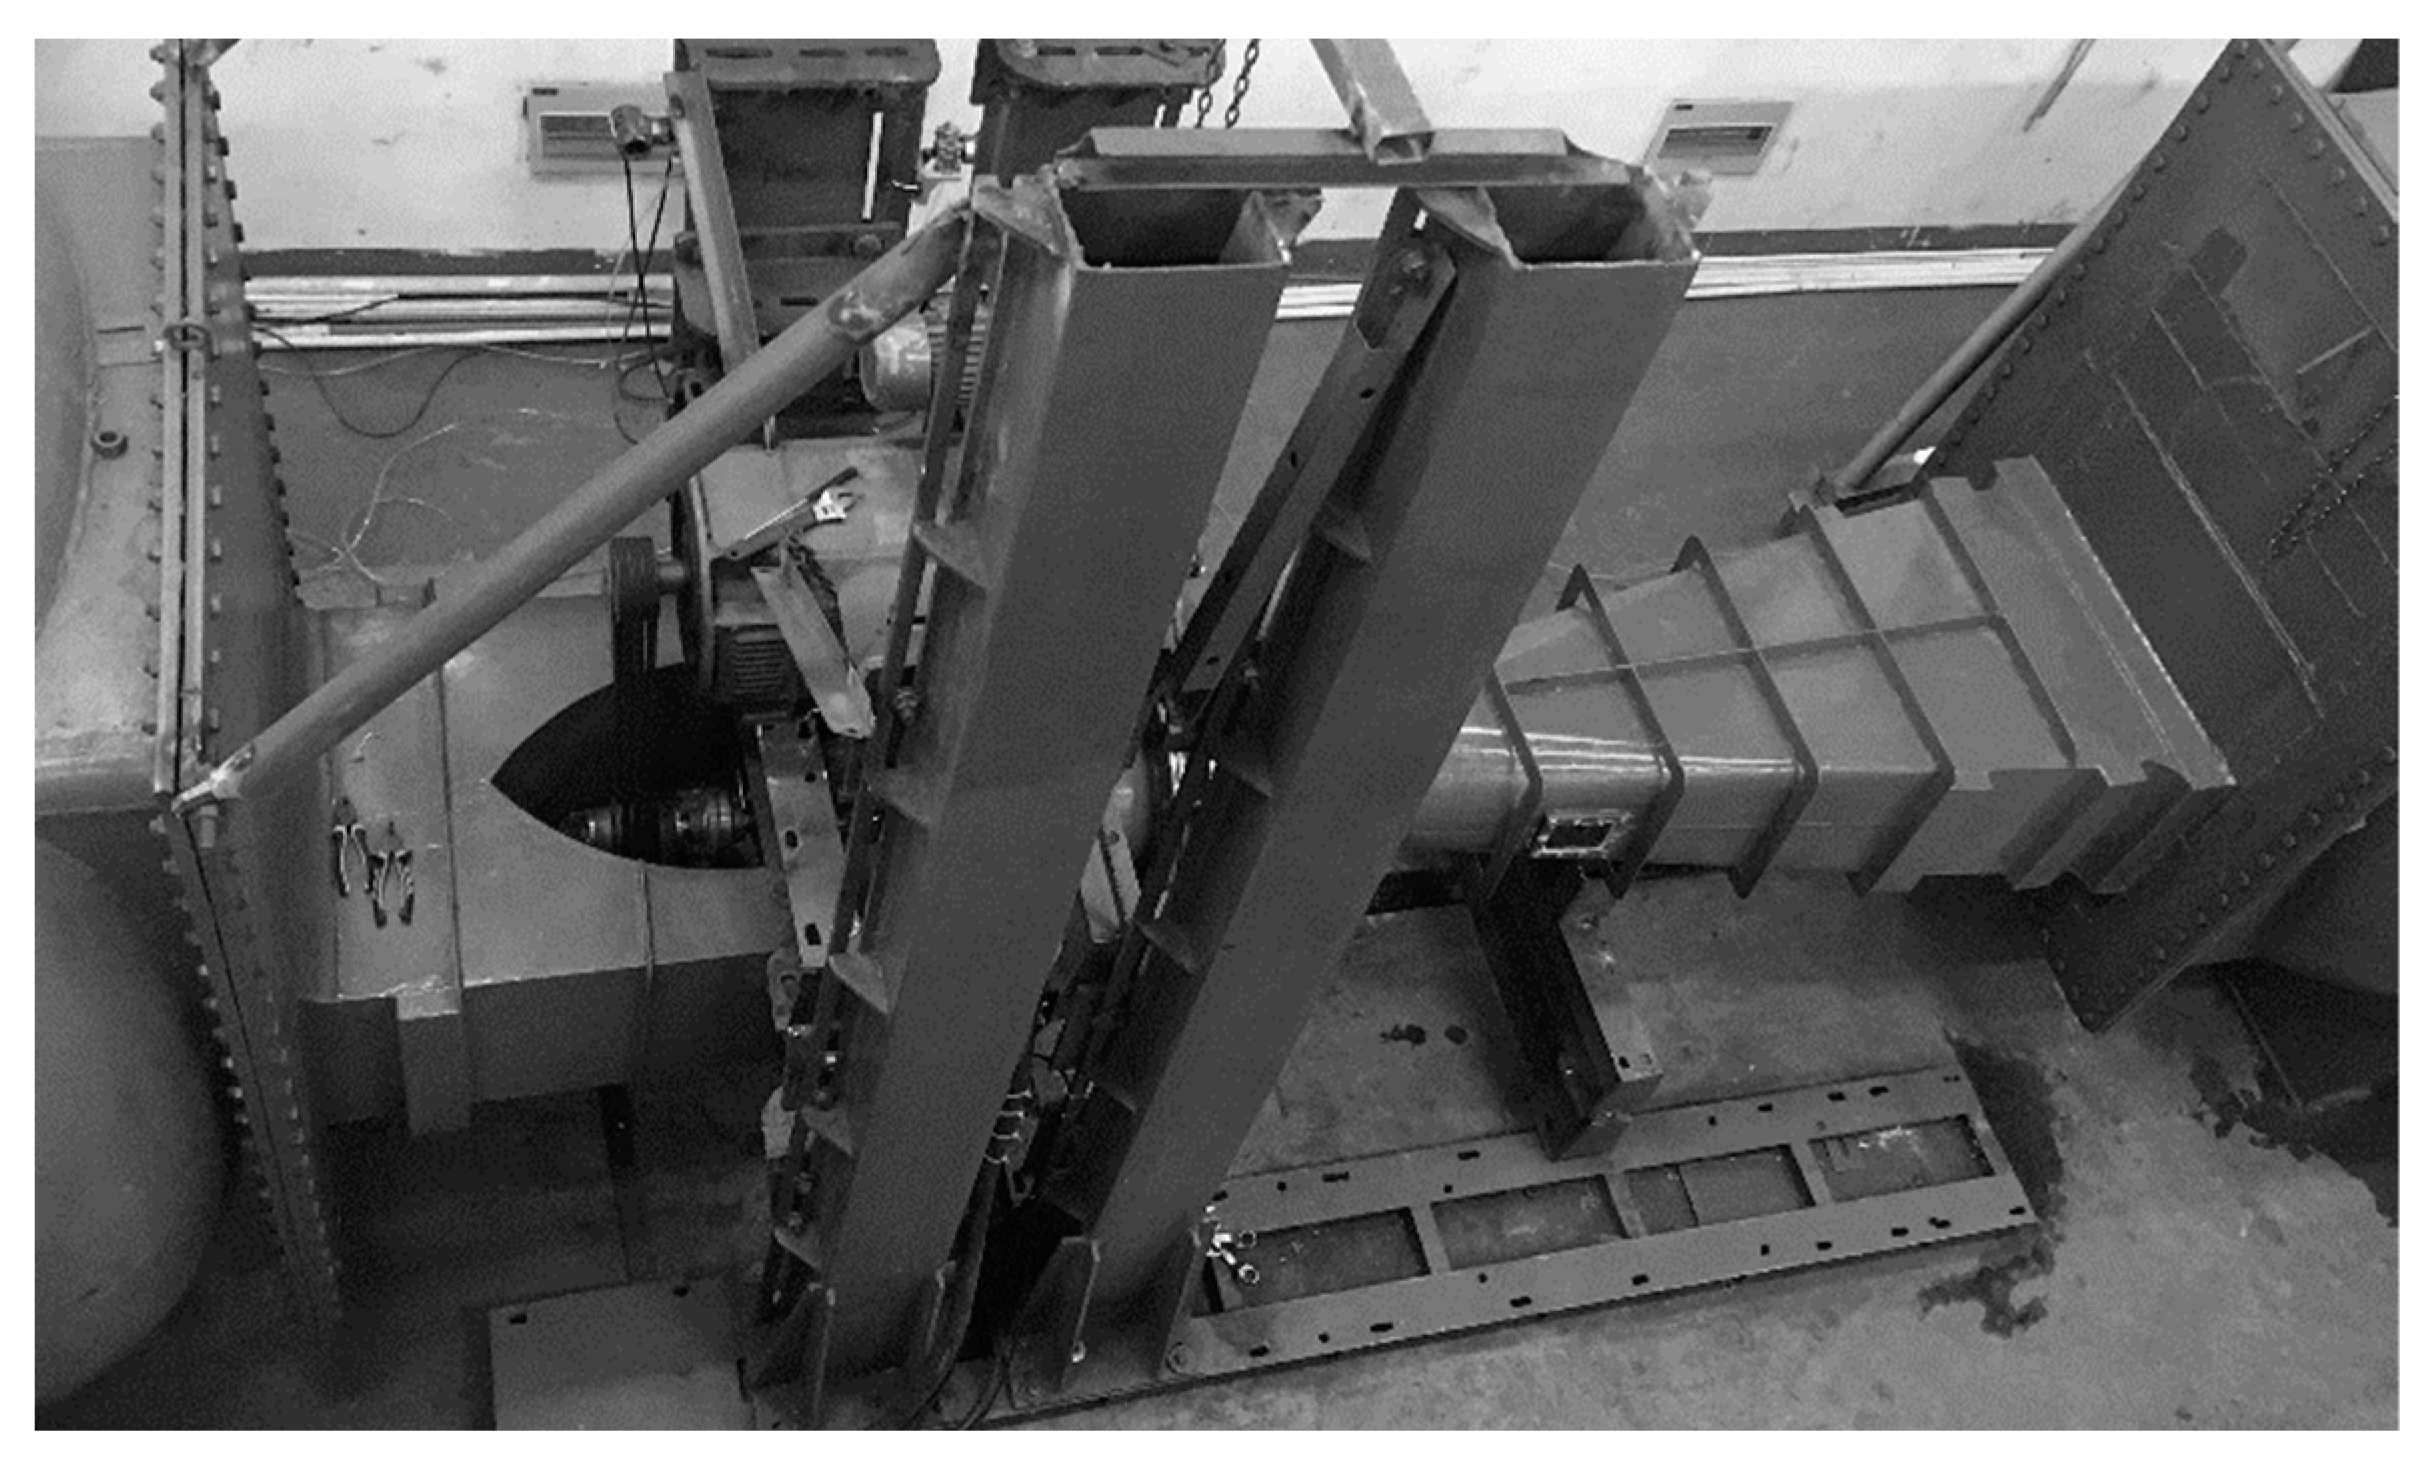
3.1. Model Experimental Setup

To substantiate the dependability of the numerical simulation, experimental validations were performed on the pump apparatus, delineated in Figure 6. The model pump impeller features a diameter of 300 mm, incorporating three blades and six guide vanes. The model impeller is made of brass, and the size deviation of the model water pump and device is within the allowable deviation value specified in relevant regulations. The inlet and outlet water passages are welded with steel plates, and the geometric dimensions of the model water pump channel and the prototype water pump channel are completely similar. In the course of the installation inspection for the model pump, the axial runout of the guide vane body and the positioning surface of the impeller chamber measured 0.10 mm, the radial runout of the outer surface of the wheel hub was 0.08 mm, and the clearance between the blade tips was maintained within 0.20 mm.

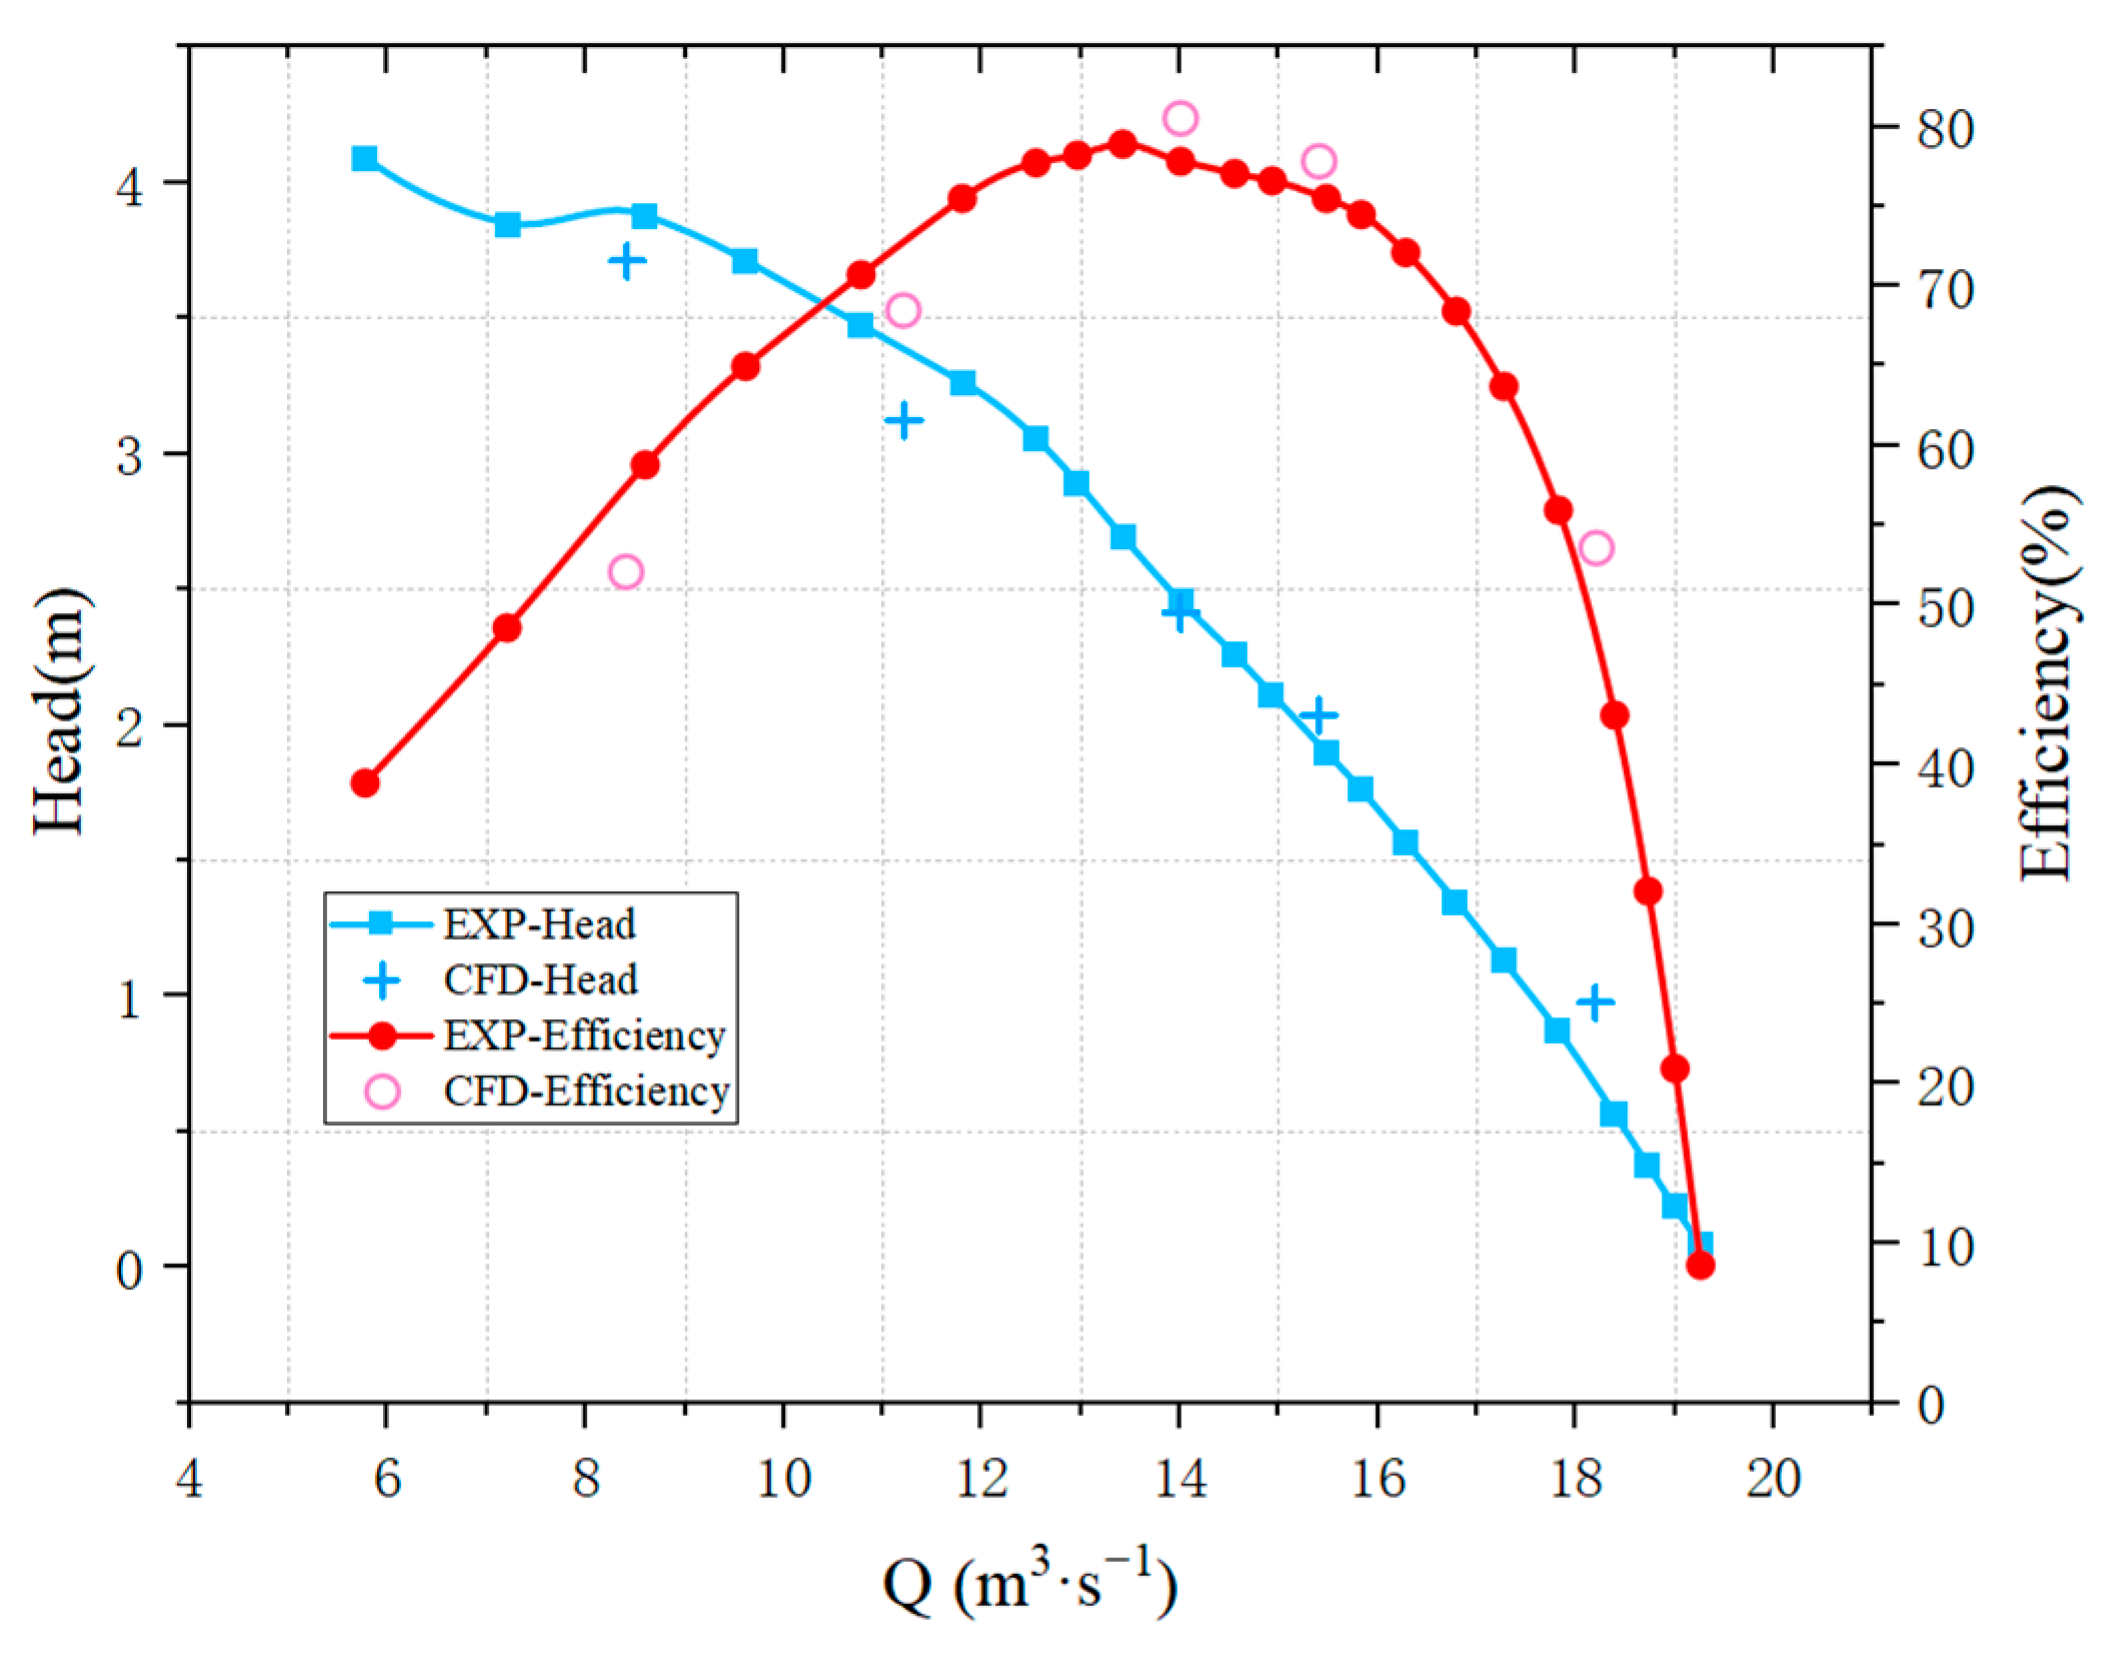
3.2. Comparison of Simulations and Experimental Results

Figure 7 shows the comparison of CFD predicted energy performance with experimental results. As shown in the figure, when the flow rate is 14 m3/s, the CFD predicted head is 2.41 m, with a prediction efficiency of 80.54%. The experimental measured head is 2.46 m, with an efficiency of 77.83%. The relative deviation of the head is 3.3%, and the relative deviation of efficiency is 1.9%. Simultaneously, through a comparative analysis of numerical simulation outcomes and experimental results across four additional flow conditions, the observed errors consistently fall within a 5% margin. The comparison results show that the CFD prediction results are in good agreement with the experimental results.

4. Results and Discussion

4.1. Pressure Pulsation Characteristics

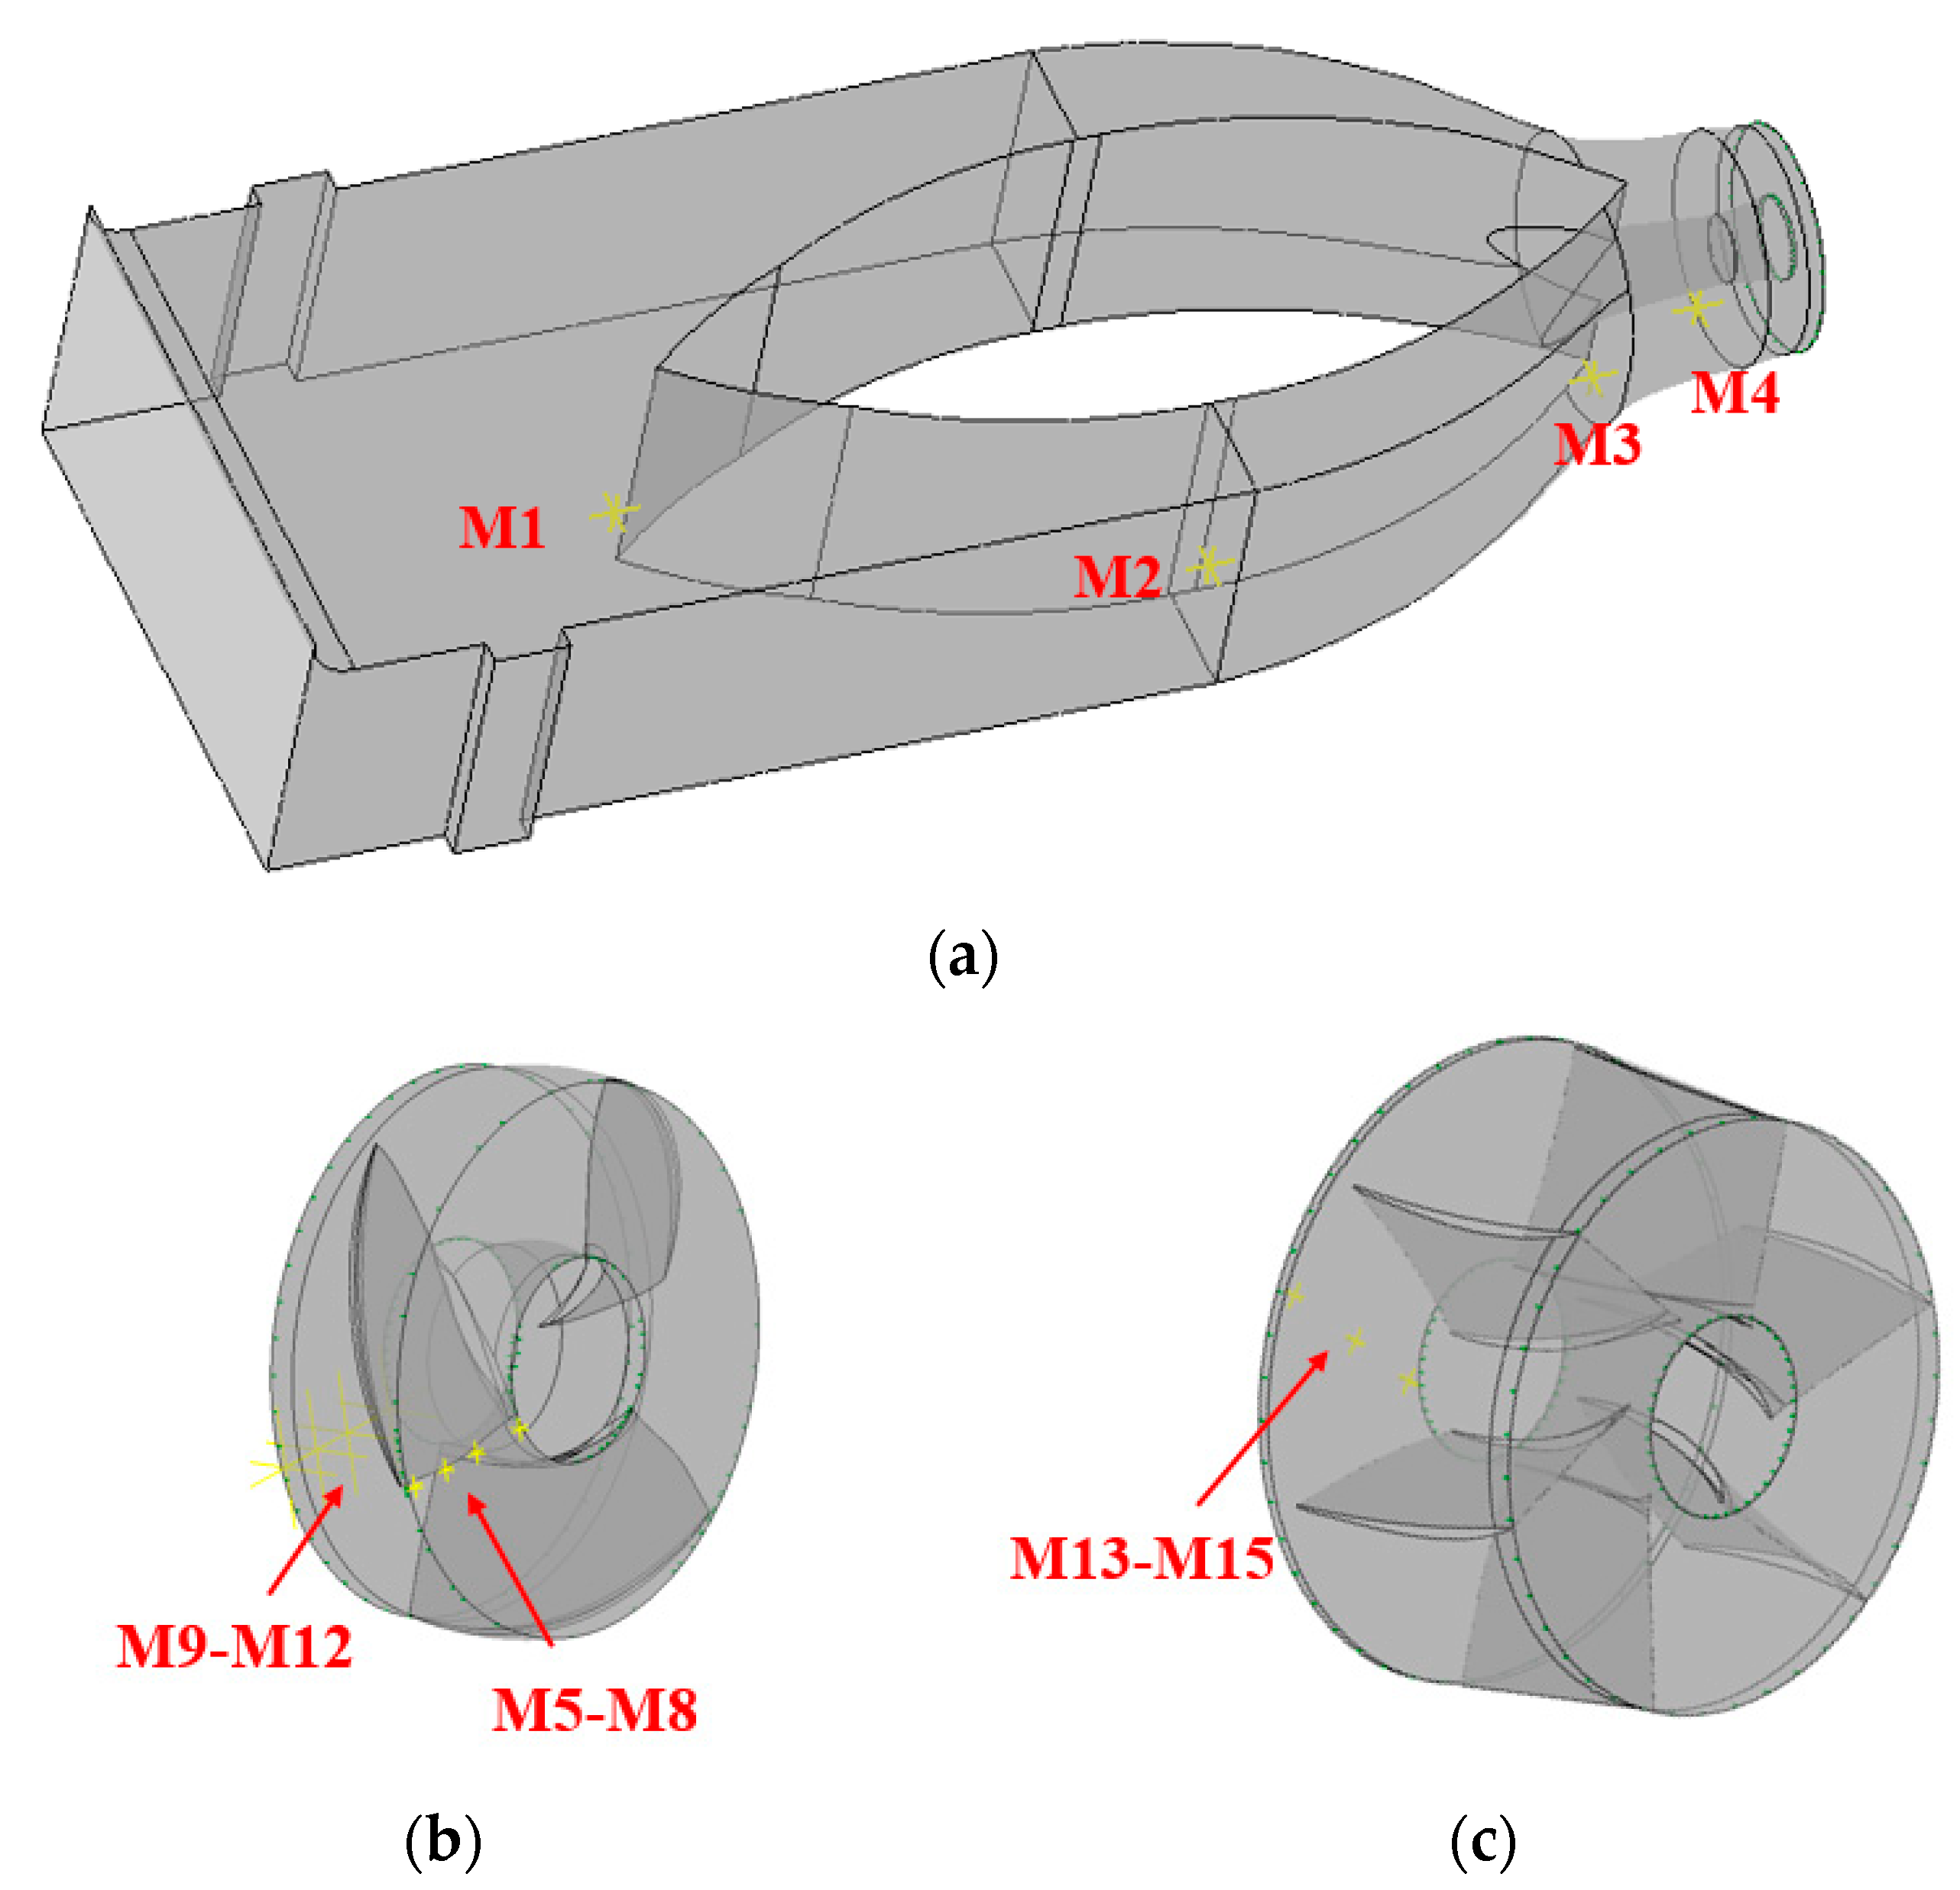
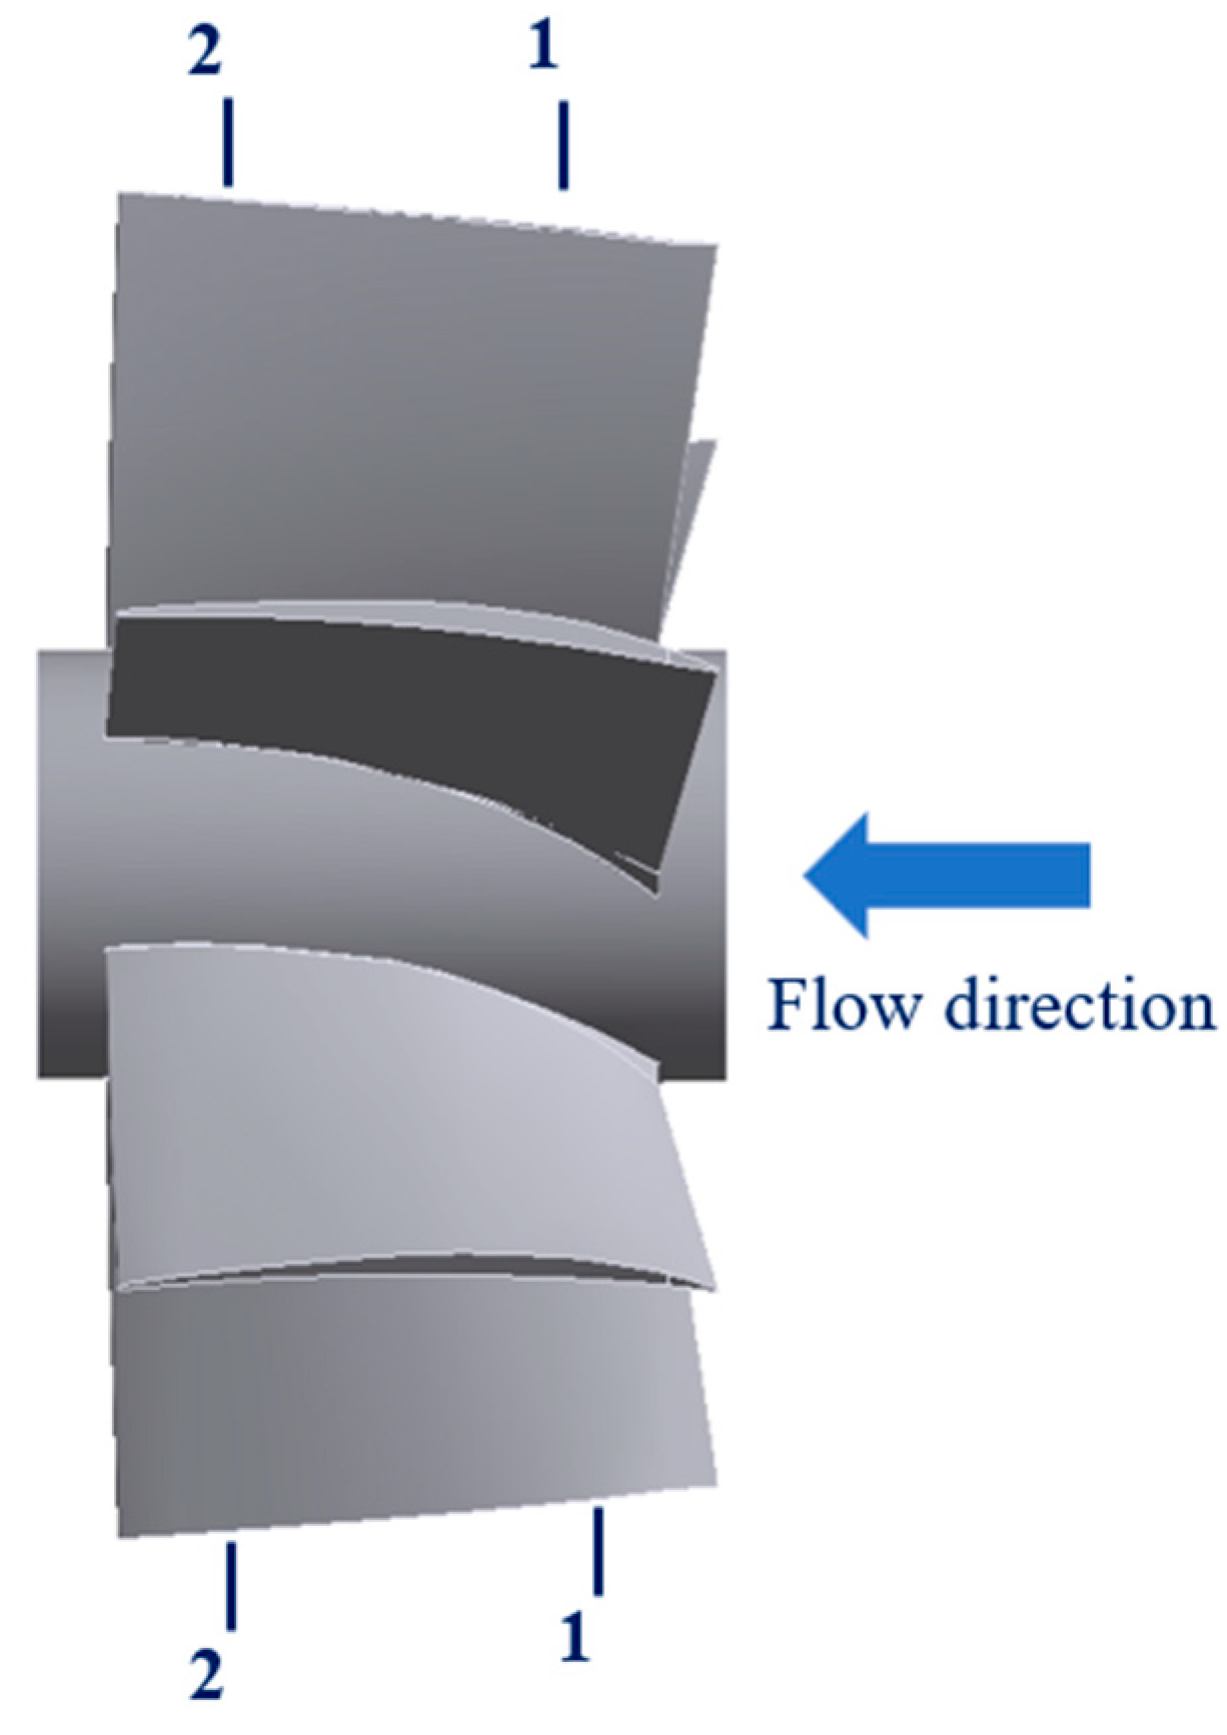
4.1.1. Layout of Pressure Pulsation Measurement Points

Figure 8 shows the cross-sectional flow velocity distribution of the pump device. From the figure, it can be seen that the flow velocity changes more uniformly at the inlet passage position, and as the cross-sectional area of the inlet passage decreases, the water flow velocity gradually increases. When the water passes through the impeller position, it starts to accelerate due to the rotation of the impeller. In the guide vane section, due to the rectification effect of the guide vanes, the water flow velocity begins to decrease. At the outlet passage position, the water flow velocity continues to decrease and the velocity distribution gradually stabilizes.
To analyze the internal pressure pulsation of the pump, 15 pressure pulsation monitoring points were installed in the calculation model. M1, M2, M3, and M4 monitoring points were installed in the vertical axis position of the inlet passage of the pump device. The monitoring points M5, M6, M7, and M8 were evenly distributed at the inlet of the impeller along the direction from the rim to the hub. Similarly, the monitoring points M9, M10, M11, and M12 were uniformly placed at the impeller outlet. In addition, the M13, M14, and M15 monitoring points were installed at the exit of the guide vane. The specific layout is shown in Figure 9.

4.1.2. Time–Frequency Characteristics

Employing eight times the impeller rotation period as the sampling interval, an analysis of pressure pulsations within the axial flow pump flow field was conducted. To scrutinize the pressure pulsations, a pressure pulsation coefficient, denoted as Cp, was introduced, and its analytical expression is as follows:
C p = p p ¯ 0.5 ρ u 2
where:
  • p—instantaneous pressure, Pa;
  • p ¯ —time-averaged pressure, Pa;
  • ρ —water density, kg/m3;
  • u—impeller circumferential speed, m/s.
Define the number of rotation cycles N = t/T, where t is the collection time of any point signal and T is the time for the impeller to rotate for one cycle. In order to clearly demonstrate the time-domain law of pulsation, both the time-domain and frequency-domain data in this paper are pressure pulsation data from the last four cycles.
Time-domain data can clearly express the changes in pressure vibration amplitude over a certain period of time, facilitating the study of periodic changes in pressure pulsation. However, this method cannot demonstrate the frequency characteristics of pressure pulsation. Therefore, this paper uses FFT changes to convert pressure data from different monitoring points, in order to analyze the frequency characteristics and influencing factors of pressure at different positions.

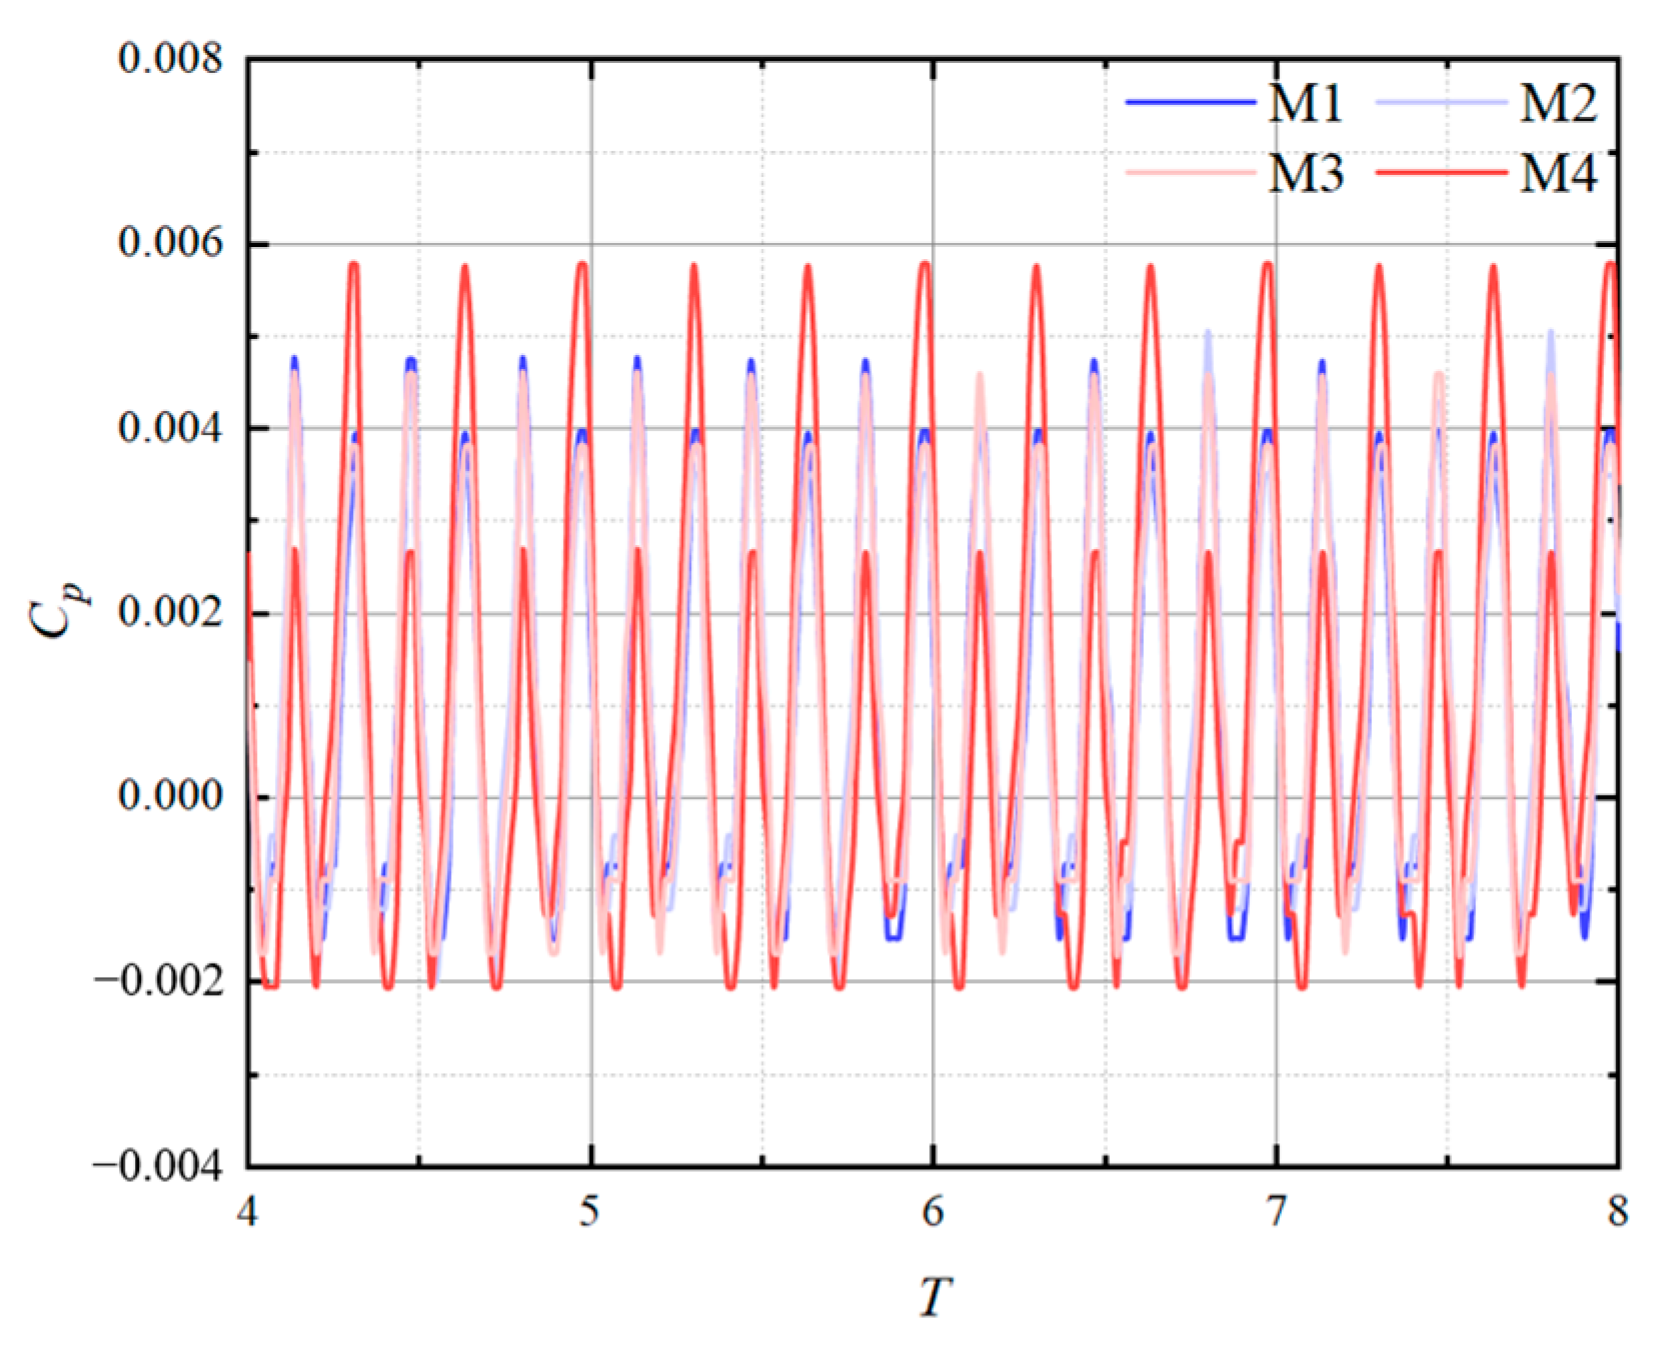
Pressure Pulsation Characteristics of the Inlet Passage

Figure 10 is a time-domain diagram of the pressure pulsation at the location of the water inlet passage. It can be clearly seen from the figure that the pressure pulsation amplitude of the monitoring points is relatively weak. This phenomenon mainly results from the long distance between the inlet passage and the impeller, so the water body is less affected by the impeller. The fluctuation curve of the monitoring points near the axis of the inlet passage shows a basic sine shape. Figure 11 shows the frequency-domain expression of pressure pulsation at various monitoring points in the inlet. It is worth noting that the frequency-domain amplitude of pressure pulsation at the inlet passage position is relatively weak and only shows a slight increment at the sixth time of the rotational frequency of the impeller.

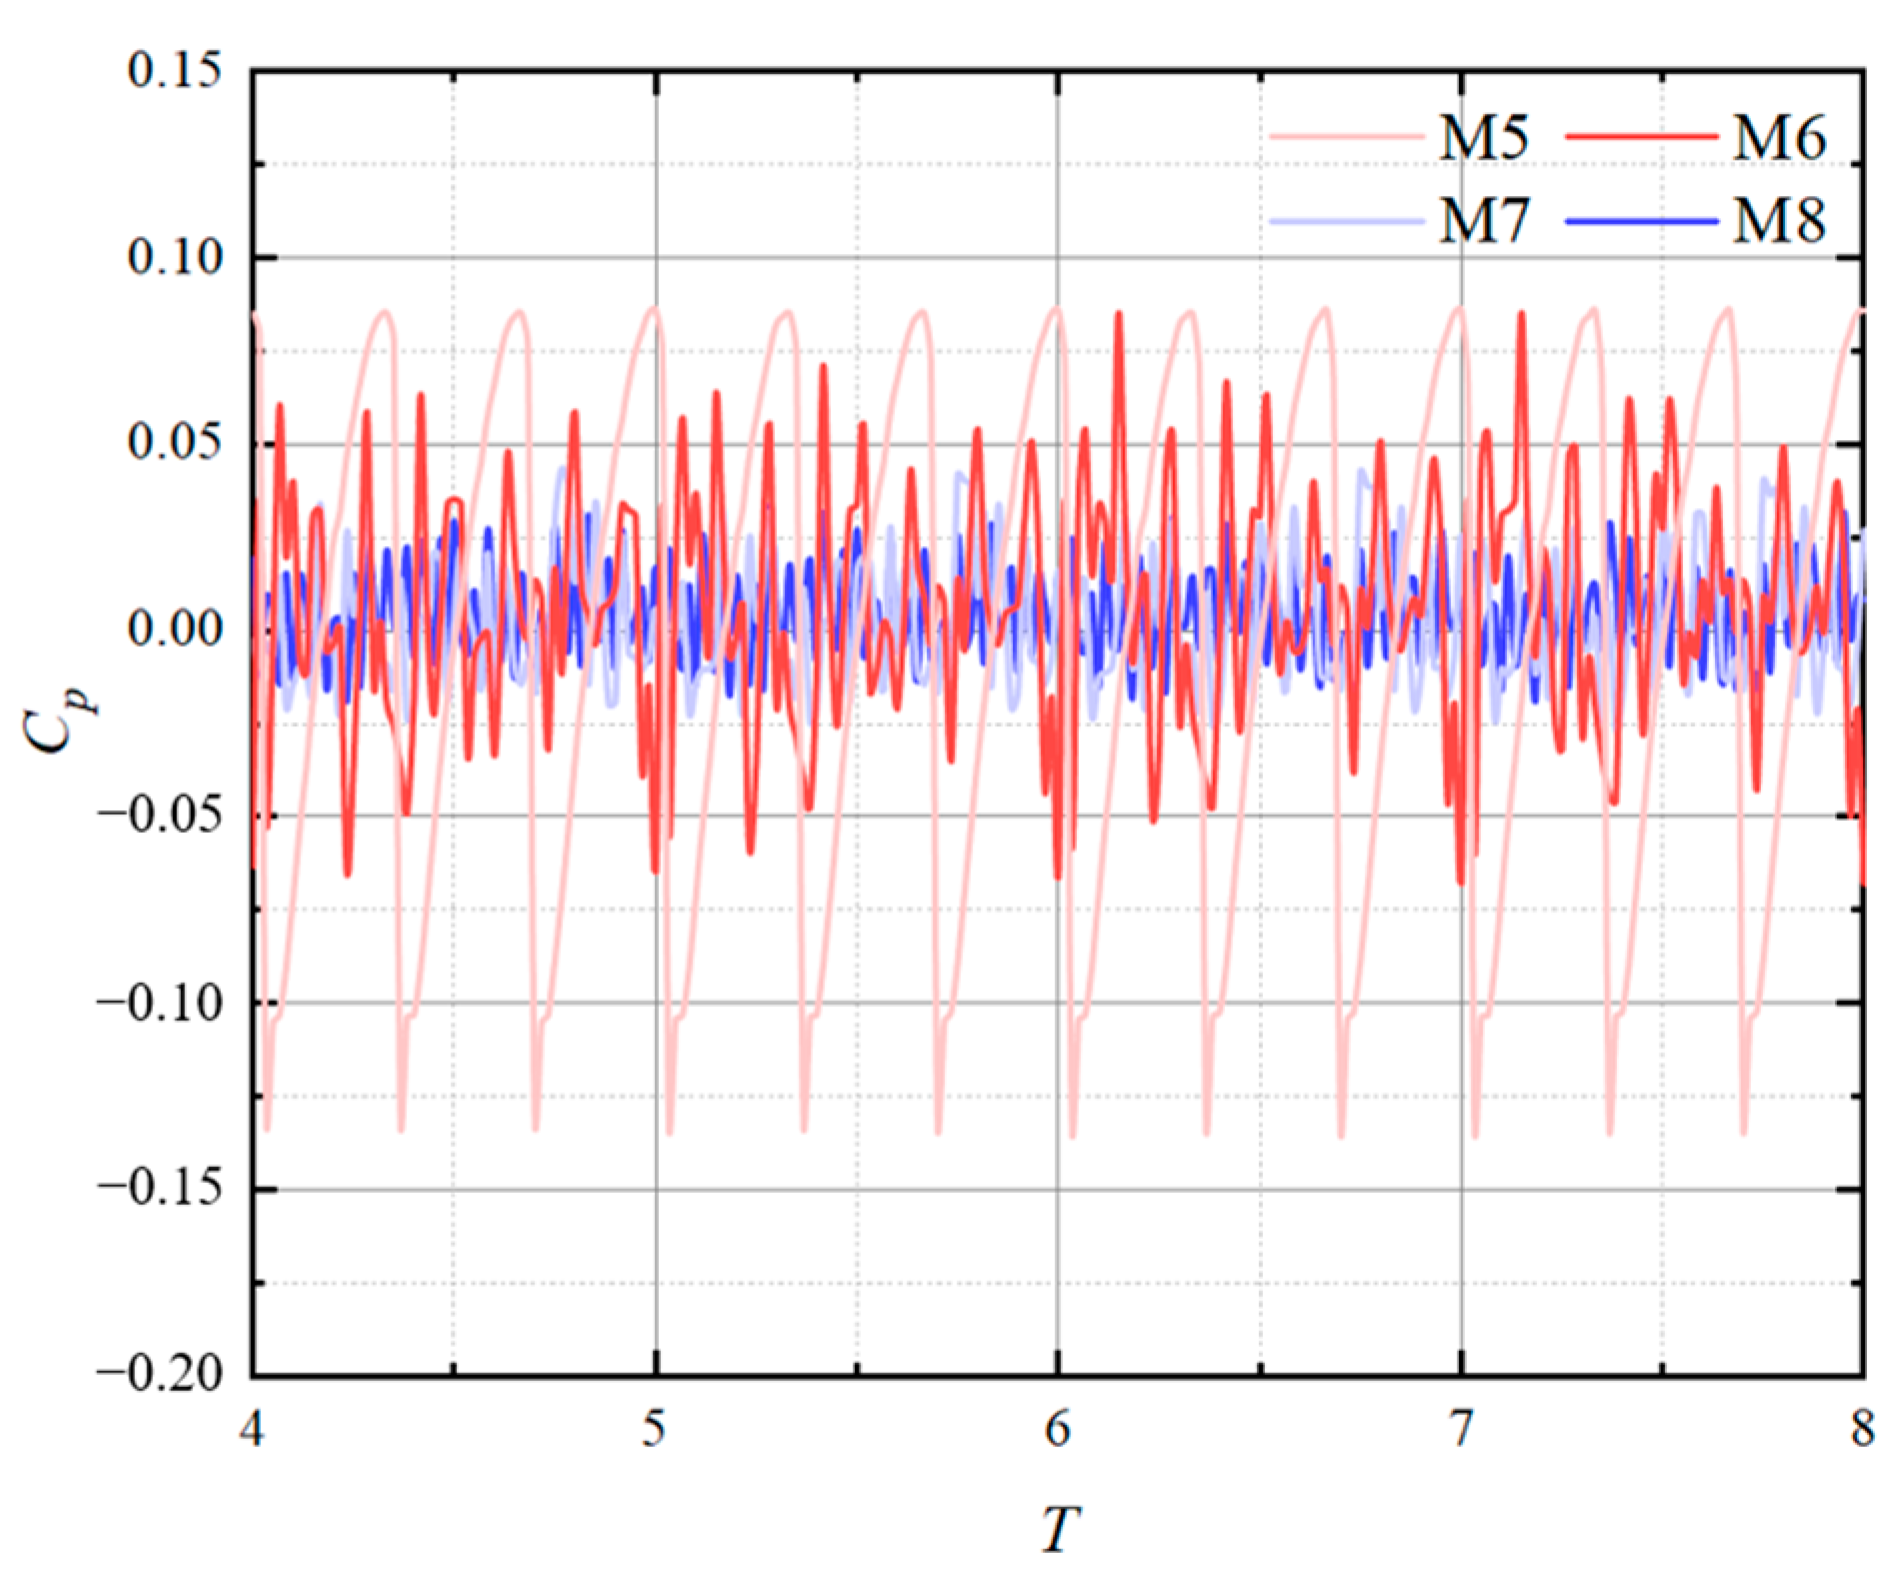
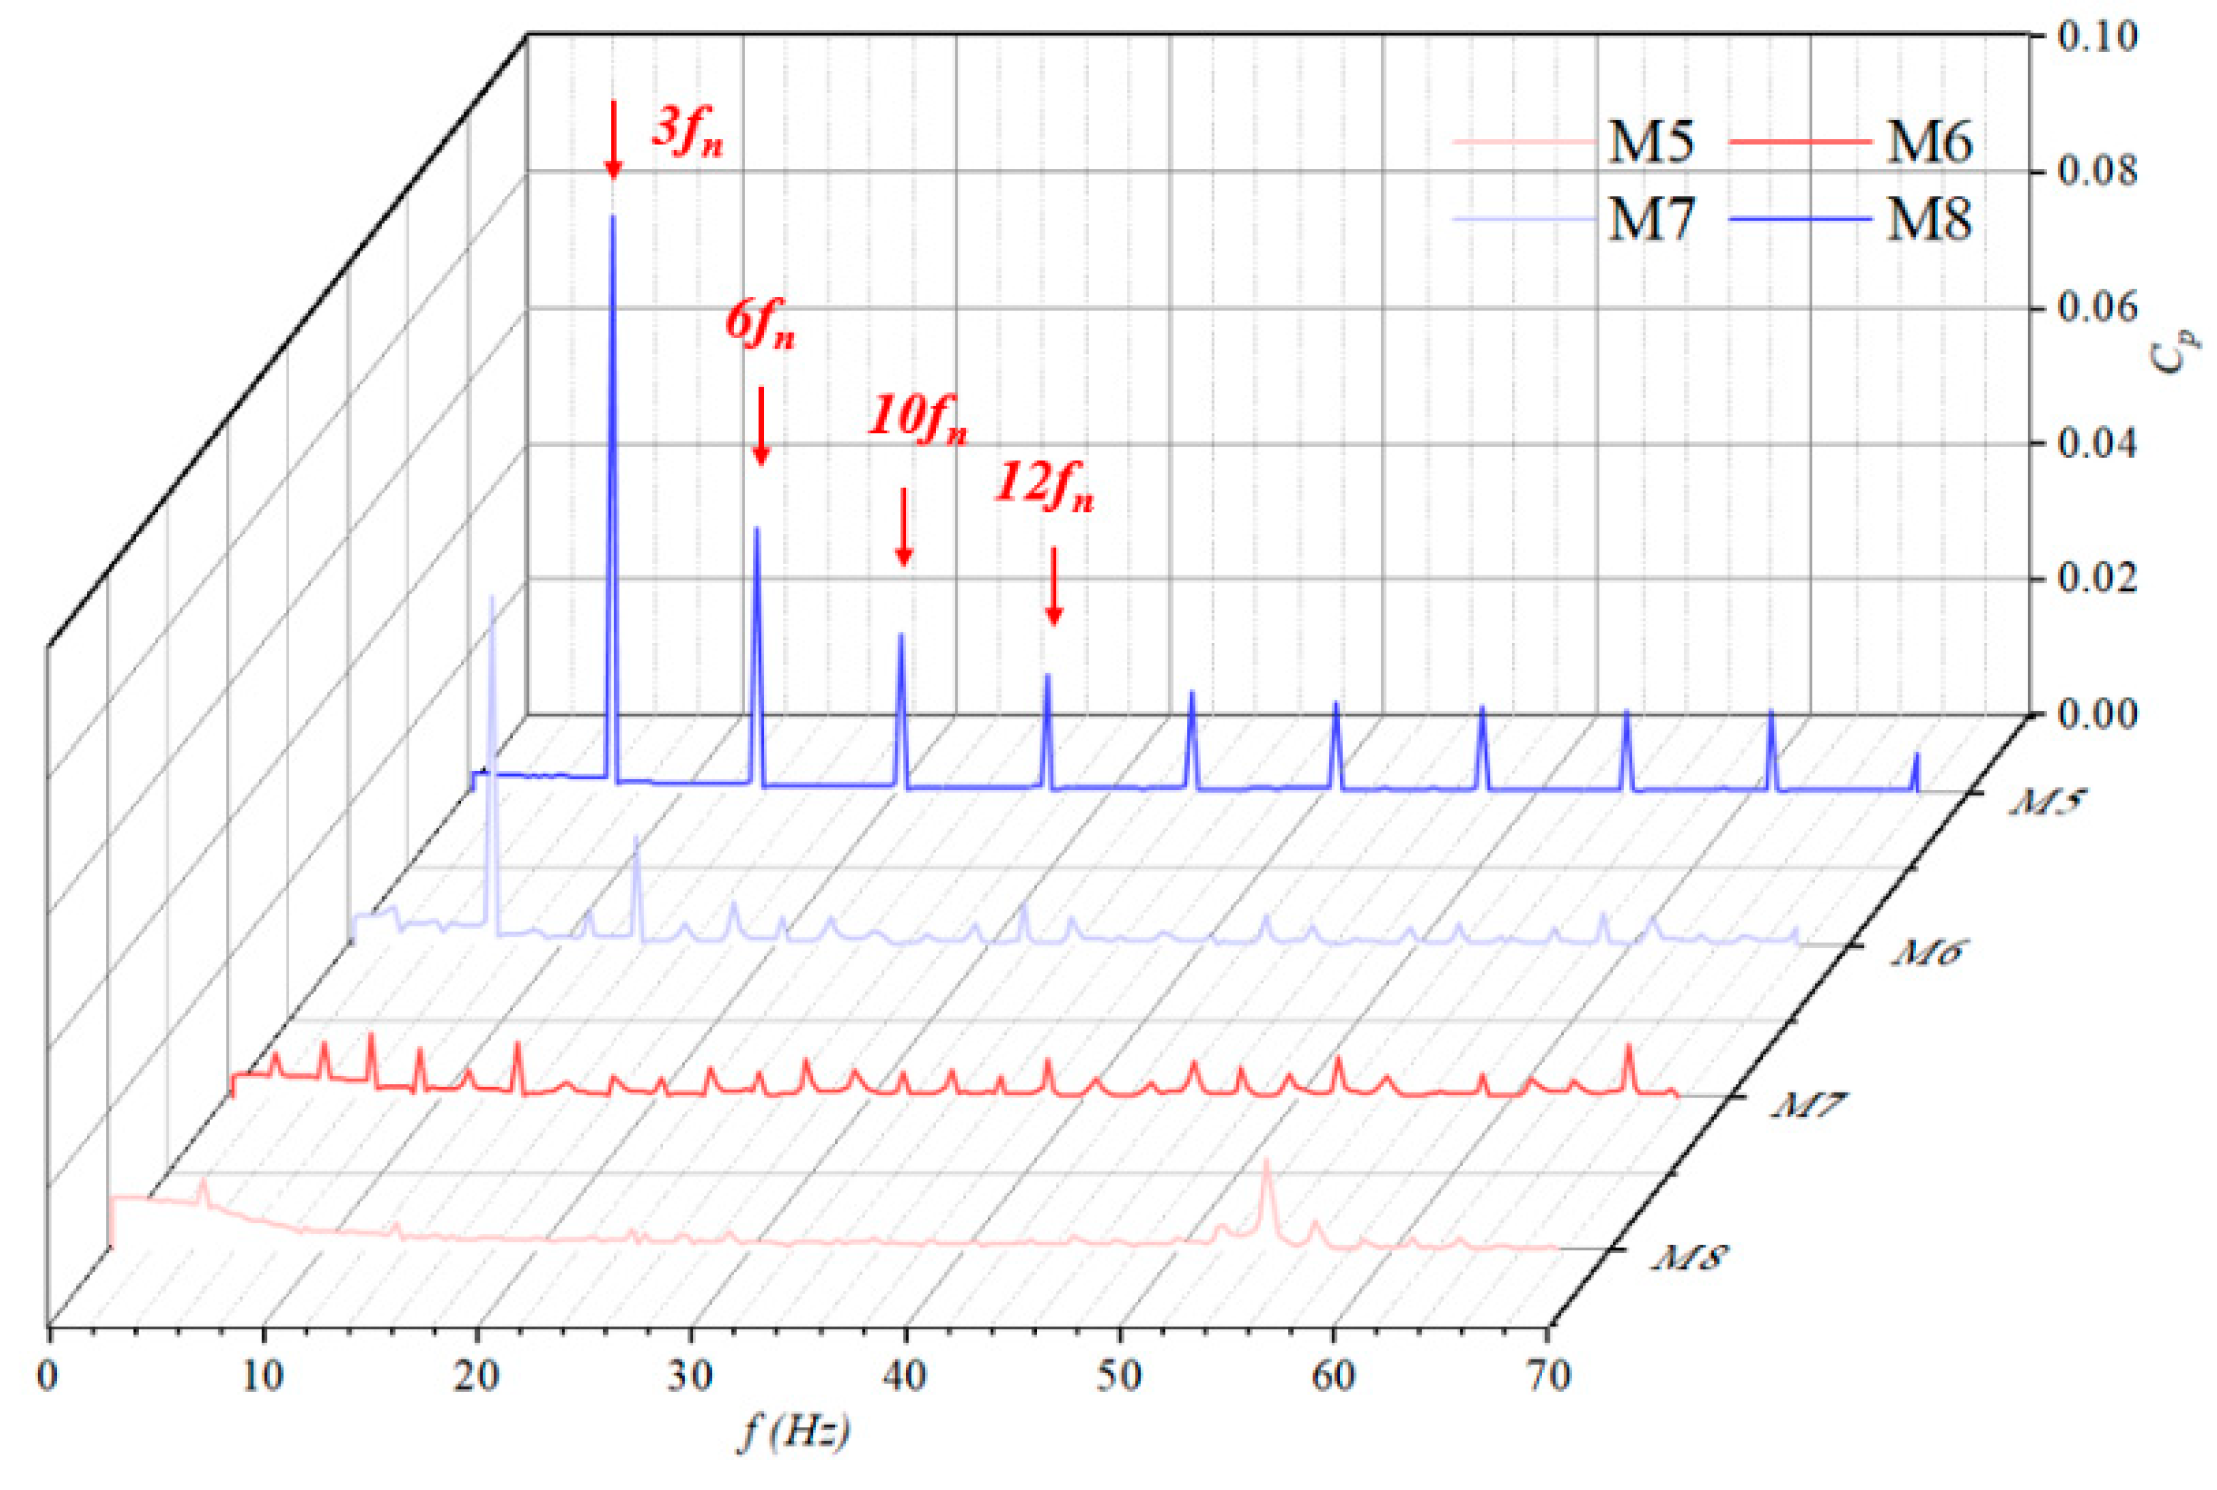
Pressure Pulsation Characteristics of the Impeller

Figure 12 presents time-domain data depicting pressure pulsations at the impeller inlet stage. It can be seen that the pressure pulsation amplitude in the cross-section is clearly larger than the pressure pulsation amplitude in the inlet passage region. The pressure pulsation vibration curves at measurement points M6, M7, and M8 exhibit a notable complexity and lack distinct regular patterns. The pressure pulsation curve of the M5 monitoring point is relatively regular, with three peaks and valleys in each period. This proves that the water flow pressure at the impeller inlet stage is affected by the blades. Moreover, when comparing the amplitudes of the four monitoring points, there is a tendency to decrease from the rim to the hub, indicating that the influence of the impeller on the imported cross-sectional water pressure is positively correlated with the cross-sectional radius.
Figure 13 is frequency-domain data of pressure fluctuations at the impeller inlet stage. As can be seen from the figure, the elementary frequency at each point is three times the rotational frequency (blade passing frequency), which once again proves that the pressure of the water body is affected by the blade rotation when it is not passing through the blade. Furthermore, it is evident that monitoring points M5 and M6 distinctly manifest heightened amplitude values, particularly at positions corresponding to 6 and 10 times the rotational frequency. This is mainly because the monitoring point is located close to the wheel flange, and the water at this location is relatively complex. The water at this location is easily affected by secondary flow from the impeller position and the boundary layer, so the distribution of its frequency-domain amplitude is also relatively complex. Upon scrutinizing the frequency-domain curves for each monitoring point, it is discerned that the vibration amplitude of pressure pulsation exhibits a diminishing trend from the rim to the hub. This trend suggests that the water at the rim position of the impeller inlet stage experiences a comparatively greater influence from the presence of the blades.
Figure 14 depicts time-domain data illustrating pressure pulsations at the outlet section of the impeller. The depicted figure reveals conspicuous regularity in the time-domain curves of pressure fluctuations at each monitoring point. Within this context, the vibration curves for points M10, M11, and M12 exhibit a recurring pattern characterized by three peaks and three valleys in each cycle. This is the characteristic of water bodies caused by the rotation of impeller blades. The vibration curve observed at monitoring point M9 manifests six peaks and valleys in each cycle. This behavior can be attributed to the location of the monitoring point at the periphery of the impeller outlet section, rendering it susceptible to dynamic and static interference arising from the interaction between the impeller and guide vanes.
Figure 15 shows the frequency-domain diagram of pressure pulsation at the outlet section of the impeller. The figure reveals that the predominant frequency at each monitoring point corresponds to six times the rotational frequency, denoting the guide vane passing frequency. This observation underscores the substantial influence of the guide vane on the pressure pulsation frequency at this particular section. Furthermore, through a comparative assessment of the amplitudes at different monitoring points, it is apparent that the frequency-domain amplitude of pressure pulsation exhibits a diminishing trend from the wheel flange to the wheel hub. Among them, the amplitude of monitoring point M9 is the largest, with its main frequency amplitude being 2.74 times that of the M10 point. In addition, the frequency-domain curve of monitoring point M9 shows a significant high amplitude distribution at the positions where the guide vanes pass through frequency multiples such as 12 times the rotational frequency and 24 times the rotational frequency. Nevertheless, the impact of the impeller on monitoring points M10, M11, and M12 is notably more pronounced due to their proximity to the wheel hub. This proximity leads to a distinctive high-amplitude distribution at three times the rotational frequency, corresponding to the impeller passing frequency.

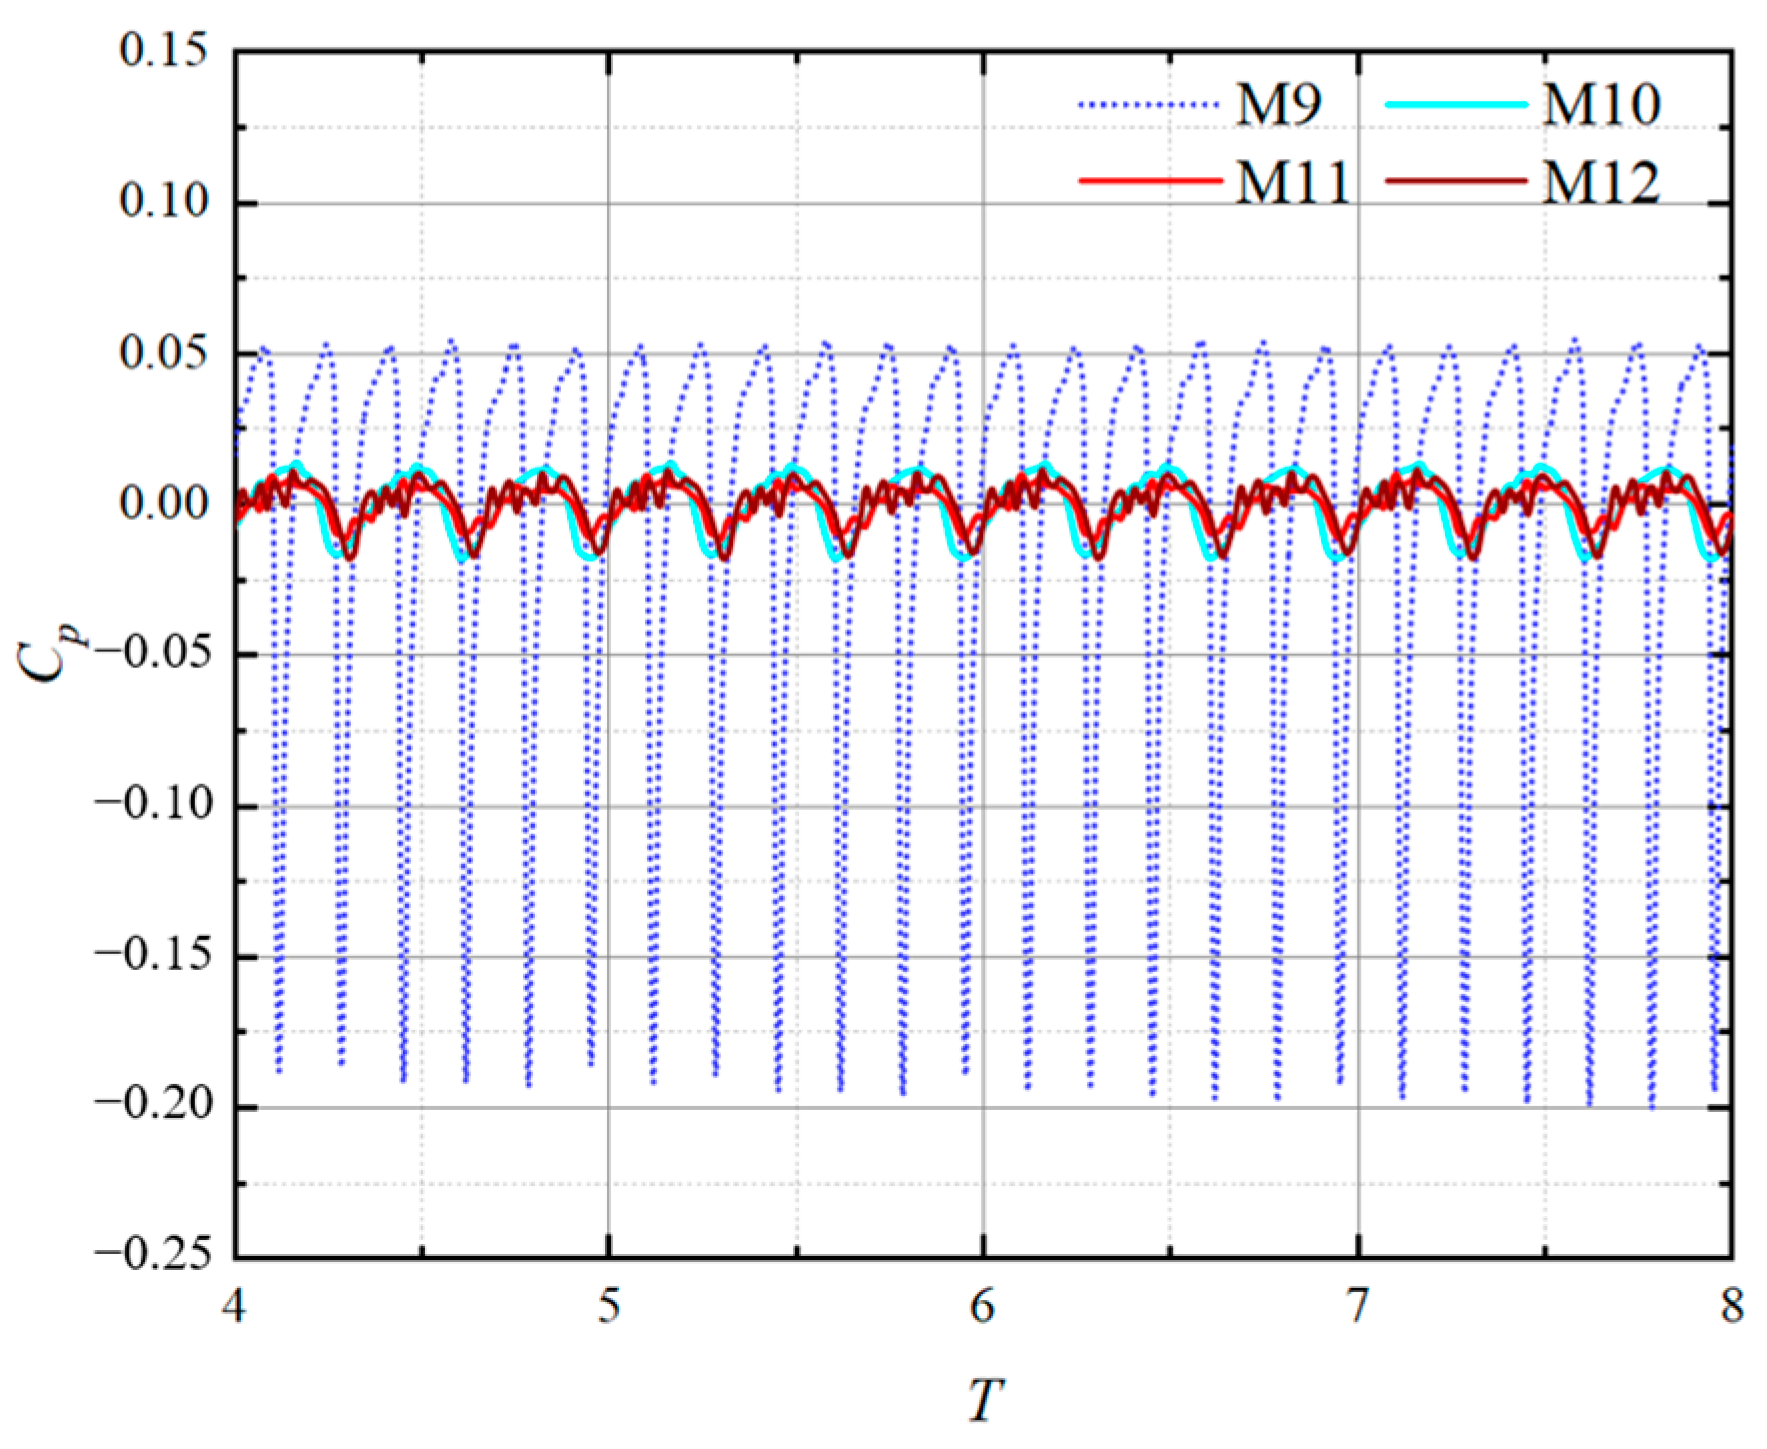
Pressure Pulsation Characteristics of the Guide Vane

Figure 16 shows the time-domain diagram of pressure pulsation at the outlet section of the guide vane. This graph indicates that the vibration curves of each monitoring point in this section have a relatively consistent pattern, with three peaks and valleys appearing within a cycle. Moreover, the amplitude of the pressure pulsation curve at this position relative to the impeller outlet section has significantly decreased, with a decrease of over 92%, indicating that the guide vane has a significant adjustment effect on water bodies. Additionally, the graphical representation indicates that the pressure data on the curve for monitoring point M13 is comparatively subdued. In accordance with the Bernoulli formula, this can be attributed to the relatively rapid flow velocity at this location, ensuring adherence to energy conservation principles and consequently resulting in a lower pressure at this specific point.
Figure 17 shows the frequency-domain diagram of pressure fluctuation at the outlet position of the guide vane. This figure indicates that the frequency amplitude of each point is relatively low, with a maximum amplitude of only 0.0028, which is significantly smaller than the impeller outlet section. At every monitoring point, there is a conspicuous high-amplitude distribution occurring at positions corresponding to 3 and 6 times the rotational frequency. This observation implies that these locations are subject to concurrent influences from both the blades and guide vanes. The primary frequency at monitoring point M13 corresponds to 1 time the rotational frequency, while monitoring point M14 exhibits a frequency of 3 times the rotational frequency, and monitoring point M15 reflects a frequency of 6 times the rotational frequency. This observation suggests that the impact of the guide vane blades becomes increasingly pronounced in closer proximity to the hub. Moreover, each cross-sectional point manifests a marked high-value distribution at a frequency corresponding to 1 time the rotational frequency. This observation signifies that the water pressure at these locations is influenced by the rotation of the axis of rotation.
In summary, it can be seen that the pressure fluctuation amplitude of the water body from the inlet passage to the outlet of the guide vanes shows a trend of first increasing and then decreasing, with the largest pressure fluctuation amplitude in the impeller section of the water body. This is because the pressure fluctuation of the water inside the pump device is mainly caused by the collision between the impeller and the water, so the pressure fluctuation at the impeller position reaches its maximum. At the same time, the main frequency of pressure fluctuation is also the passing frequency of the impeller blades. The pressure fluctuations that occur at the impeller position will be transmitted both upstream and downstream, resulting in periodic pressure fluctuations at the inlet passage position of the pump device. After the rectification effect of the guide vanes on the downstream water of the impeller, the amplitude of pressure fluctuation significantly decreases, and its main frequency also shifts to the rotational frequency of the impeller. This indicates that the main reason for the pressure fluctuation of the water at the outlet position of the guide vanes is the periodic rotation of the impeller.
Although it is normal for the water inside the pump device to experience pressure fluctuations, excessive pressure changes can cause certain damage to the pump device. Therefore, in order to reduce the pressure fluctuation of water inside the pump, it is necessary to reasonably set the shape of the impeller and guide vanes. At the same time, it is also advisable to avoid situations where there is a common divisor between the number of impeller blades and guide vanes.

4.2. Analysis of Structural Characteristics of Pump Equipment

The solid domain in the flow field, such as the impeller and guide vanes, undergoes varying degrees of stress–strain changes under pressure pulsation. The magnitude of these stress–strain changes greatly reflects the stress on the impeller guide vanes in the flow field and the safety level of the structure during operation. Therefore, in this paper, stress–strain is studied as a parameter reflecting the structural characteristics of the pump device.

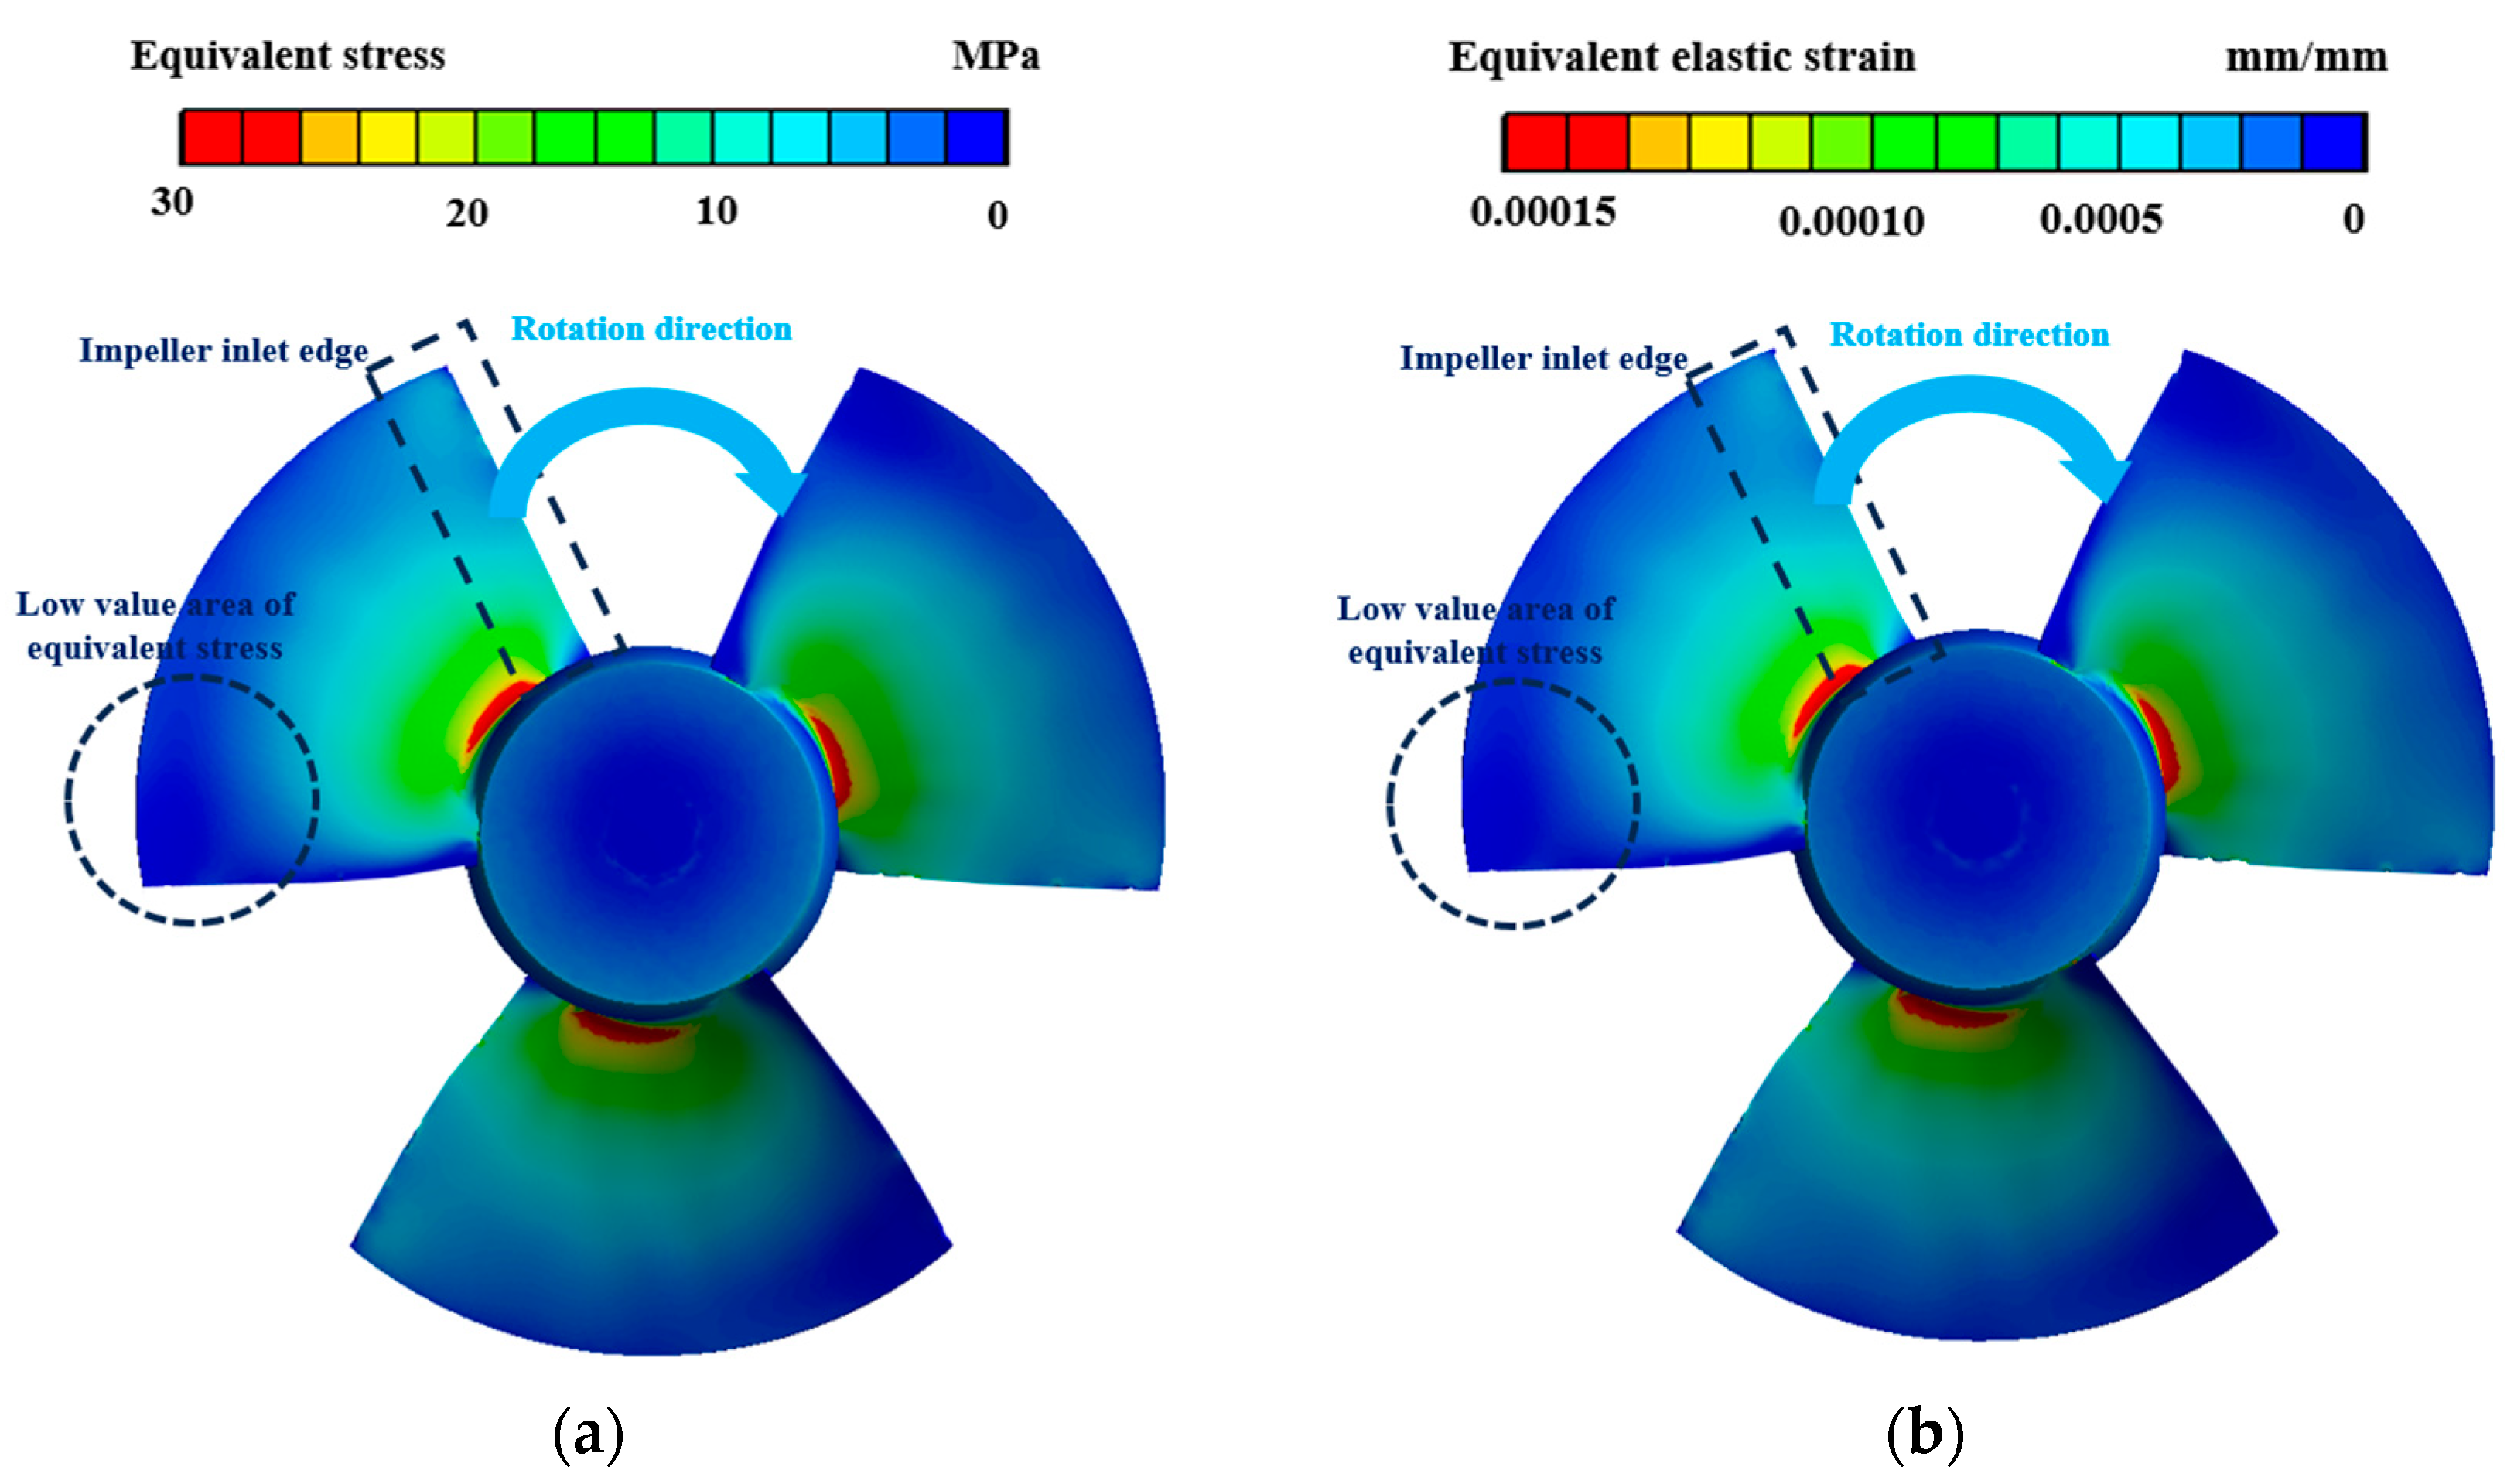
4.2.1. Stress and Strain Analysis of Impeller Blades

Figure 18 illustrates the distribution of equivalent stress on the suction surface of the water pump impeller. From the figure, it can be seen that there is a small range of high stress areas at the root of each impeller blade. Observing the stress distribution of the wheel hub, it can be observed that due to the scouring effect of water flow, the stress on the surface of the wheel hub is relatively high. In assessing the strain distribution on the suction surface of the impeller blade, it becomes evident that its strain pattern closely resembles that of the impeller blade. At the impeller root, the strain in the impeller blade is notably pronounced, exhibiting a stress decline from the impeller root towards the periphery of the impeller. Upon a detailed examination of the stress and equivalent strain distribution on the suction surface of the impeller blade, a noteworthy observation emerges. Specifically, it is discerned that the stress and strain levels at the impeller blade’s water outlet edge are relatively modest. This implies a limited erosive impact of the water flow on the impeller, signifying that, under the influence of centrifugal force or detachment, the water flow on the suction surface has experienced radial flow.
Figure 19 illustrates the distribution of equivalent stress–strain on the pressure surface of the impeller blade. Upon a comparative analysis of Figure 17 and Figure 18, it is discerned that, owing to the slender nature of the impeller blade, the stress–strain distribution on both surfaces of the impeller blade exhibits a resemblance. However, notable distinctions arise, particularly in the context of the pressure surface, where the stress–strain distribution is more pronounced, indicating a higher magnitude within the specified range as compared to the suction surface. The pressure surface, being the primary site for exerting work on the water body, tends to undergo a more substantial scouring effect, consequently necessitating a more severe stress alteration on the impeller blades. Simultaneously, the phenomenon of uneven distribution of equivalent stress and strain at the inlet and outlet edges is more pronounced on the pressure surface. Observing the stress and strain distribution on the pressure surface, a notable disparity is evident between the inlet and outlet edges. Specifically, the stress and strain near the inlet edge exhibit a more pronounced manifestation compared to the outlet edge. This suggests that, in the course of exerting work on the water body, the influence in proximity to the inlet edge of the impeller is more substantial.
In summary, it is discerned that the distribution of equivalent stress at the impeller root becomes notably pronounced during the water flow pressurization process. Figure 20 depicts the variation in circumferential stress at the impeller root. Combining Figure 18 and Figure 19, we can observe that the distribution of stress at the impeller root is not uniform and that the stress at the outlet edge of the impeller blade is greater than the stress at the inlet edge of the impeller blade. Specifically, at the Line 1 position, this phenomenon becomes more pronounced near the root of the impeller. The stress at the impeller root near the impeller outlet edge is 20.2 MPa, while the stress at the impeller root near the impeller inlet edge is 1.01 MPa. Simultaneously, with an increasing radial distance, the non-uniformity in the circumferential distribution of stress within the impeller gradually diminishes. Observationally, at positions Line 2 and Line 3, a notable decrease in stress is evident near the impeller outlet, contrasted by a substantial increase in equivalent stress near the impeller inlet. The stresses at the inlet and outlet of the Line 2 and Line 3 impellers are very similar. The impeller, as the main flow passage component for water pressure in the pump device, should experience uniform distribution of stress at the root of the impeller during operation. In this article, the concentration of high stress areas at the outlet of the impeller can indicate the occurrence of radial flow or detachment on the surface of the impeller blade, resulting in uneven flow of water on the blade surface. In the course of water operation, the blades experience non-uniform reaction forces, leading to an uneven distribution of stress and strain at the impeller root.

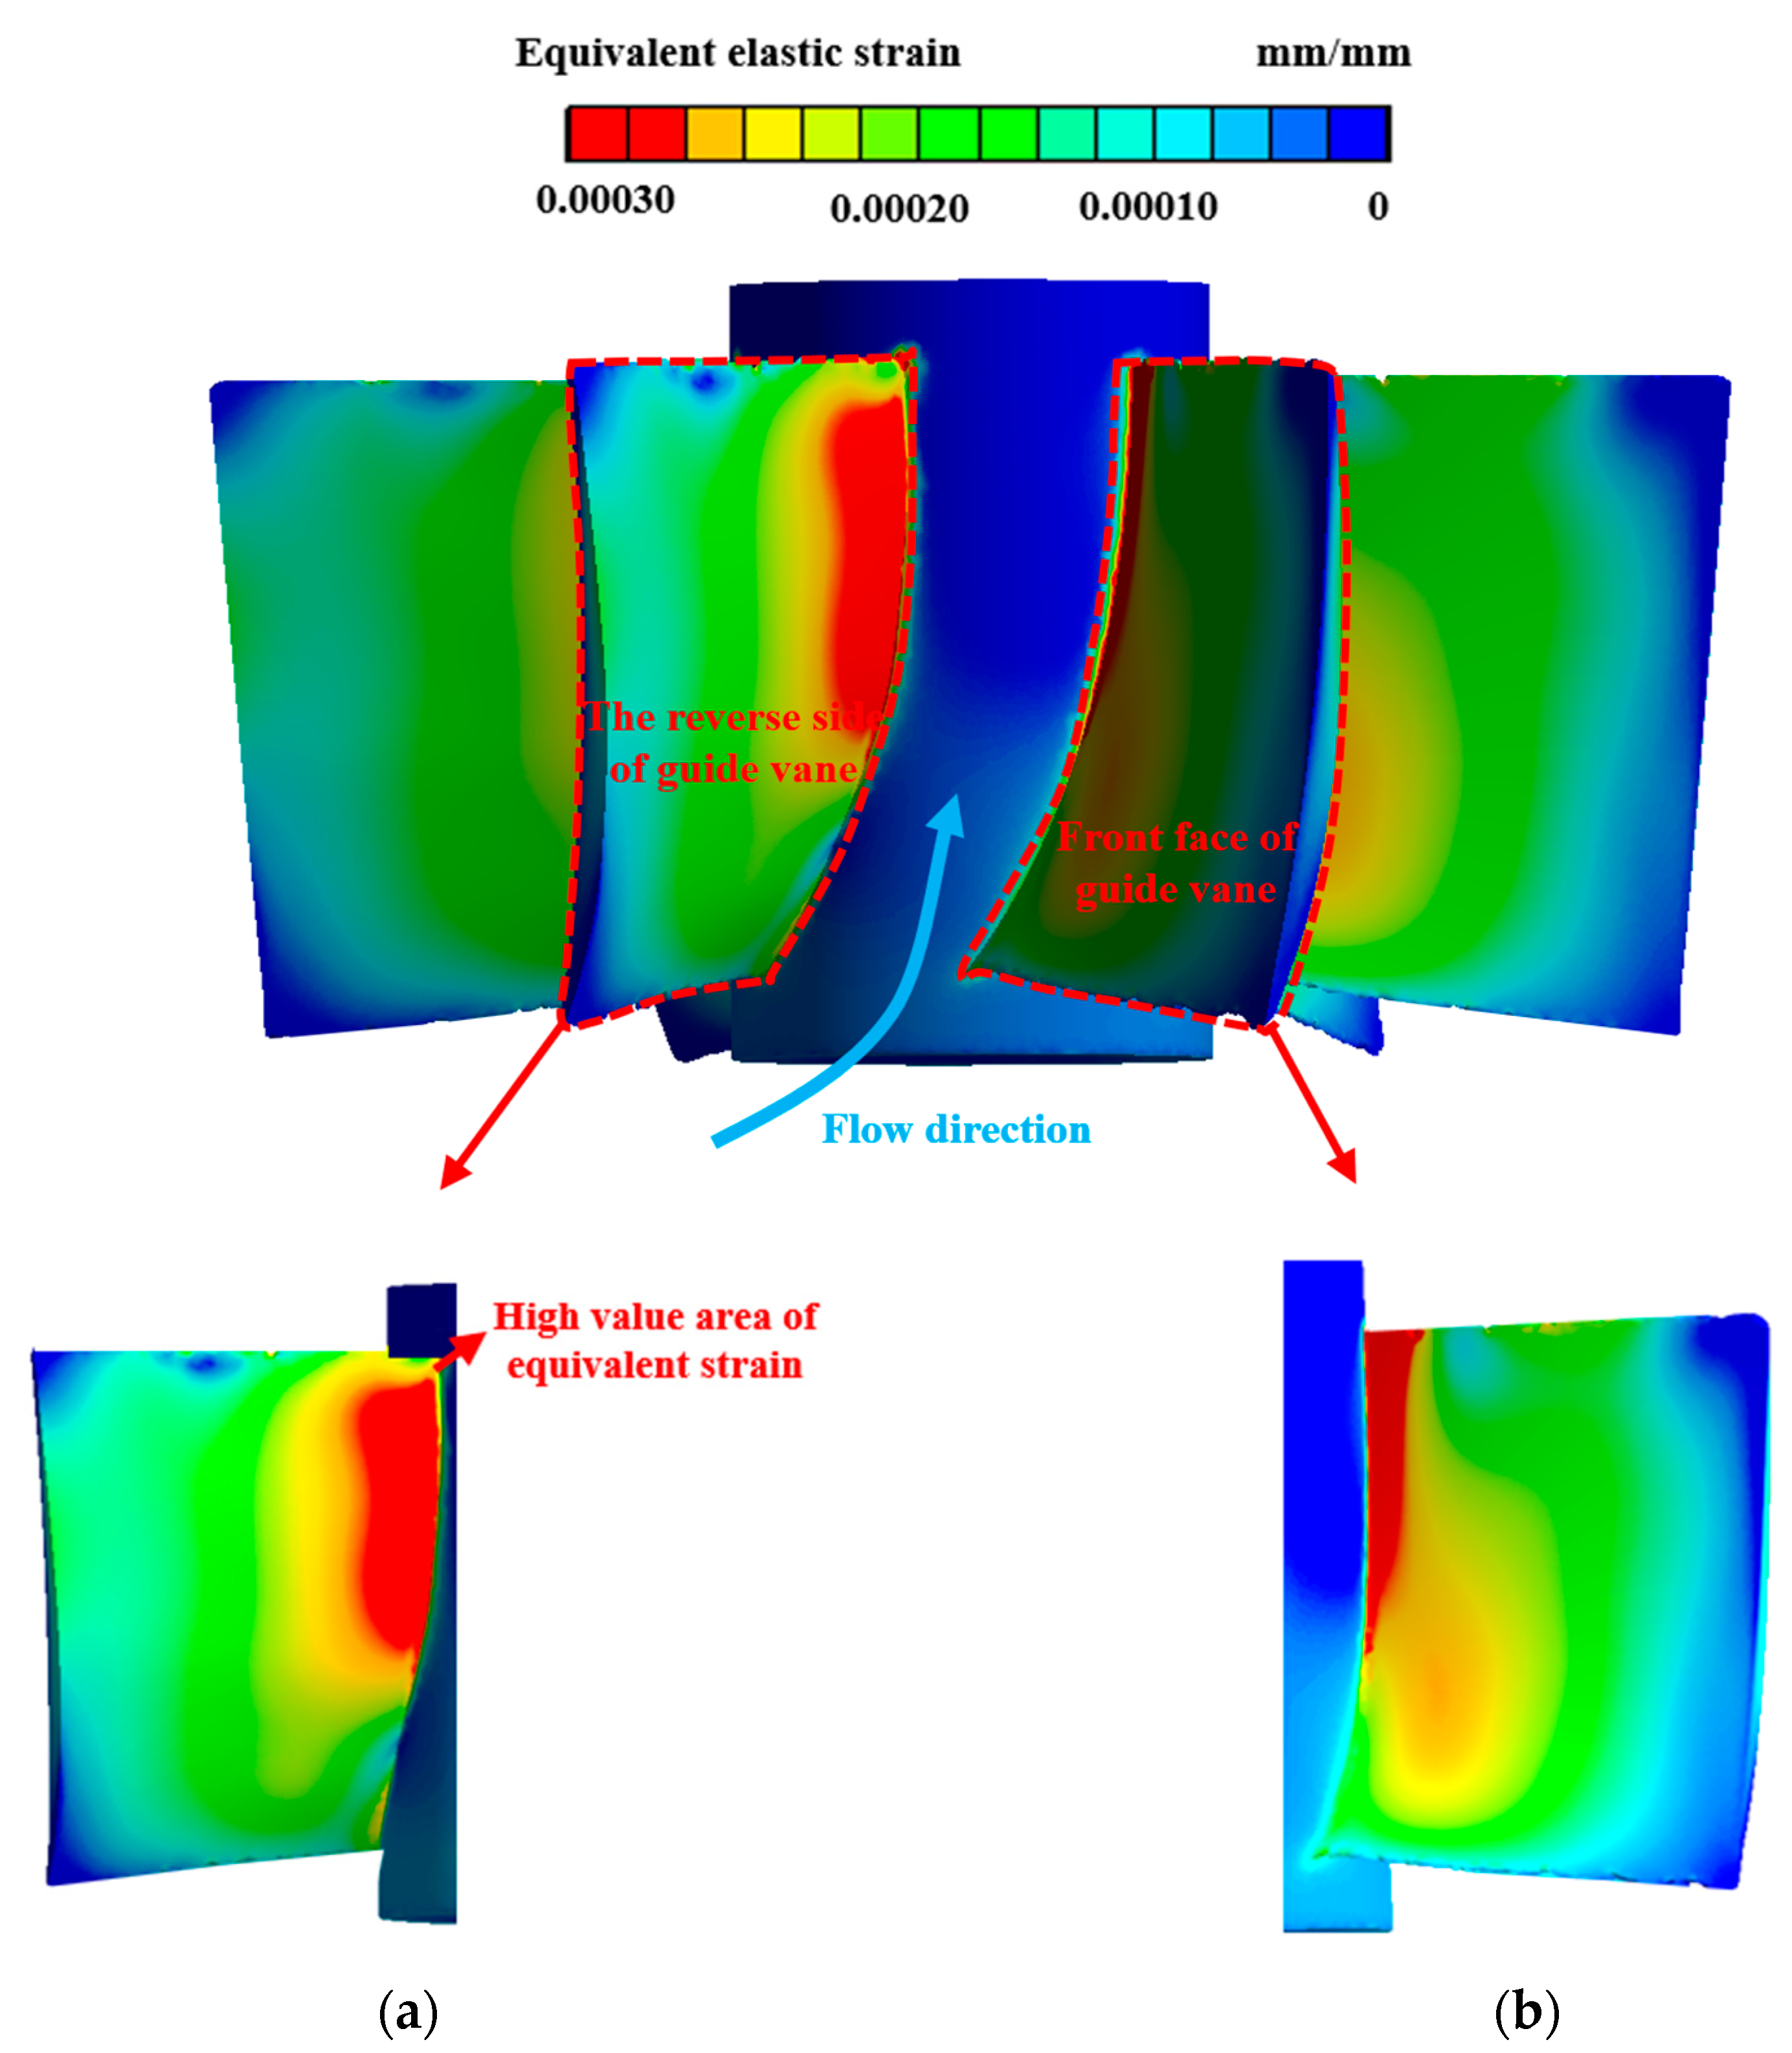
4.2.2. Stress and Strain Analysis of Guide Vane Blades

Figure 21 shows the equivalent stress distribution of the guide vane segment. Overall, the equivalent stress of the guide vane segment is basically distributed on the guide vane blade, and the stress distribution is relatively small at the guide vane hub position. Specifically, by observing the stress distribution at the position of the guide vane, it can be observed that the high value area of stress on the front face of the guide vane is distributed at the root near the outlet of the guide vane. The guide vanes play a role in recovering circulation in the flow passage components, and the guide vane section converts the kinetic energy into potential energy at the impeller outlet position. During this process, the guide vane section is often subjected to significant circumferential forces, and it can be seen that there is a relatively high stress area near the root of the guide vanes where the guide vanes have a significant effect on the recovery of water flow. On the reverse side of the guide vane, a conspicuous occurrence of elevated stress distribution near the guide vane outlet root is evident. At the position near the guide vane outlet on the back of the guide vane working surface, the water flow will detach here and further form a low-speed zone. The formation of the low-speed zone leads to turbulence of the water flow and high pressure, leading to the formation of the high stress area here.
Figure 22 illustrates the distribution of equivalent strain on the guide vane blades. Observing the equivalent strain distribution on the guide vane blades, a similarity is noted with that of the guide vane blades. The region of elevated equivalent strain on the guide vane blades is predominantly concentrated in areas exhibiting high stress values, specifically at the outlet root of the guide vane blades. Conversely, at the flange position of the guide vane, the distribution of equivalent force is notably conspicuous, particularly with the equivalent strain distributed widely across the entire working surface on the reverse side of the guide vane. However, the equivalent stress–strain distribution near the wheel flange’s outlet and inlet on the guide vane is relatively inconspicuous.
From the above analysis, it can be found that the distribution of stress and strain is basically the same. Consequently, for the purpose of investigating the internal structural attributes of the guide vane section, this study conducted calculations to ascertain the stress distribution within the guide vane section. Simultaneously, this study focused on sections 1-1 near the inlet and 2-2 near the outlet as the analytical subjects, aiming to investigate the distinct internal structural characteristics of the guide vane segment at various section positions. Figure 23 illustrates a schematic representation depicting the selection of the cross-section for the guide vane segment. Figure 24 shows the stress distribution inside the guide vane segments of sections 1-1 and 2-2.
Observation of Figure 24 reveals that in the 1-1 section near the inlet edge of the guide vane, despite the slender thickness of the guide vane blade, there is a conspicuous uneven distribution of stress within the blade. At the junction position between the guide vane and the hub, substantial stress is present on both sides, whereas the internal equivalent stress is comparatively minimal. With an increasing radial distance, the internal stress within the blade gradually attains uniformity, accompanied by a decrease in the magnitude of the equivalent stress. The thickness of the high-stress region at the blade root exceeds that at the rear of the working surface. At the position of section 2-2 near the outlet edge of the guide vane, the distribution of stress inside the blade is equally uneven. At the blade root, the elevated stress zones on both the front face and reverse side of the guide vane are predominantly concentrated on the blade surface. The stress on the blade surface significantly surpasses the stress within the blade. At the guide vane edge, a distinct region of elevated stress is noticeable on the rear of the blade, signifying that the outlet’s front face of the guide vane undergoes significant force during operation. It is highly likely that the shape of the guide vane blade profile causes water flow to form a certain range of a turbulent zone on the back of the blade near the guide vane outlet, causing an increase in surface pressure near the turbulent zone.
Upon comparing the stress distribution within the guide vane blades at two cross-sectional positions, it becomes evident that the stress at the guide vane outlet position is not only larger but also exhibits a more uneven distribution. The stresses inside the guide vane blades are relatively small, indicating that the guide vane blades did not experience significant distortion or deformation during the process of being impacted by water flow. A relatively obvious stress distribution can also be found at the connection between the guide vane and the wheel hub.

5. Conclusions

This article uses CFD numerical simulation and fluid structure coupling methods to analyze pressure fluctuations on the inlet, impeller, and guide vane cross-sections. In addition, this article analyzes the structural characteristics of vertical shaft tube pumps. The stress and strain distribution inside the impeller and guide vanes of the vertical shaft tube pump were carefully inspected, with particular emphasis on the stress and strain concentration at the interface between the impeller blades and the hub. The following conclusions were obtained:
(1)
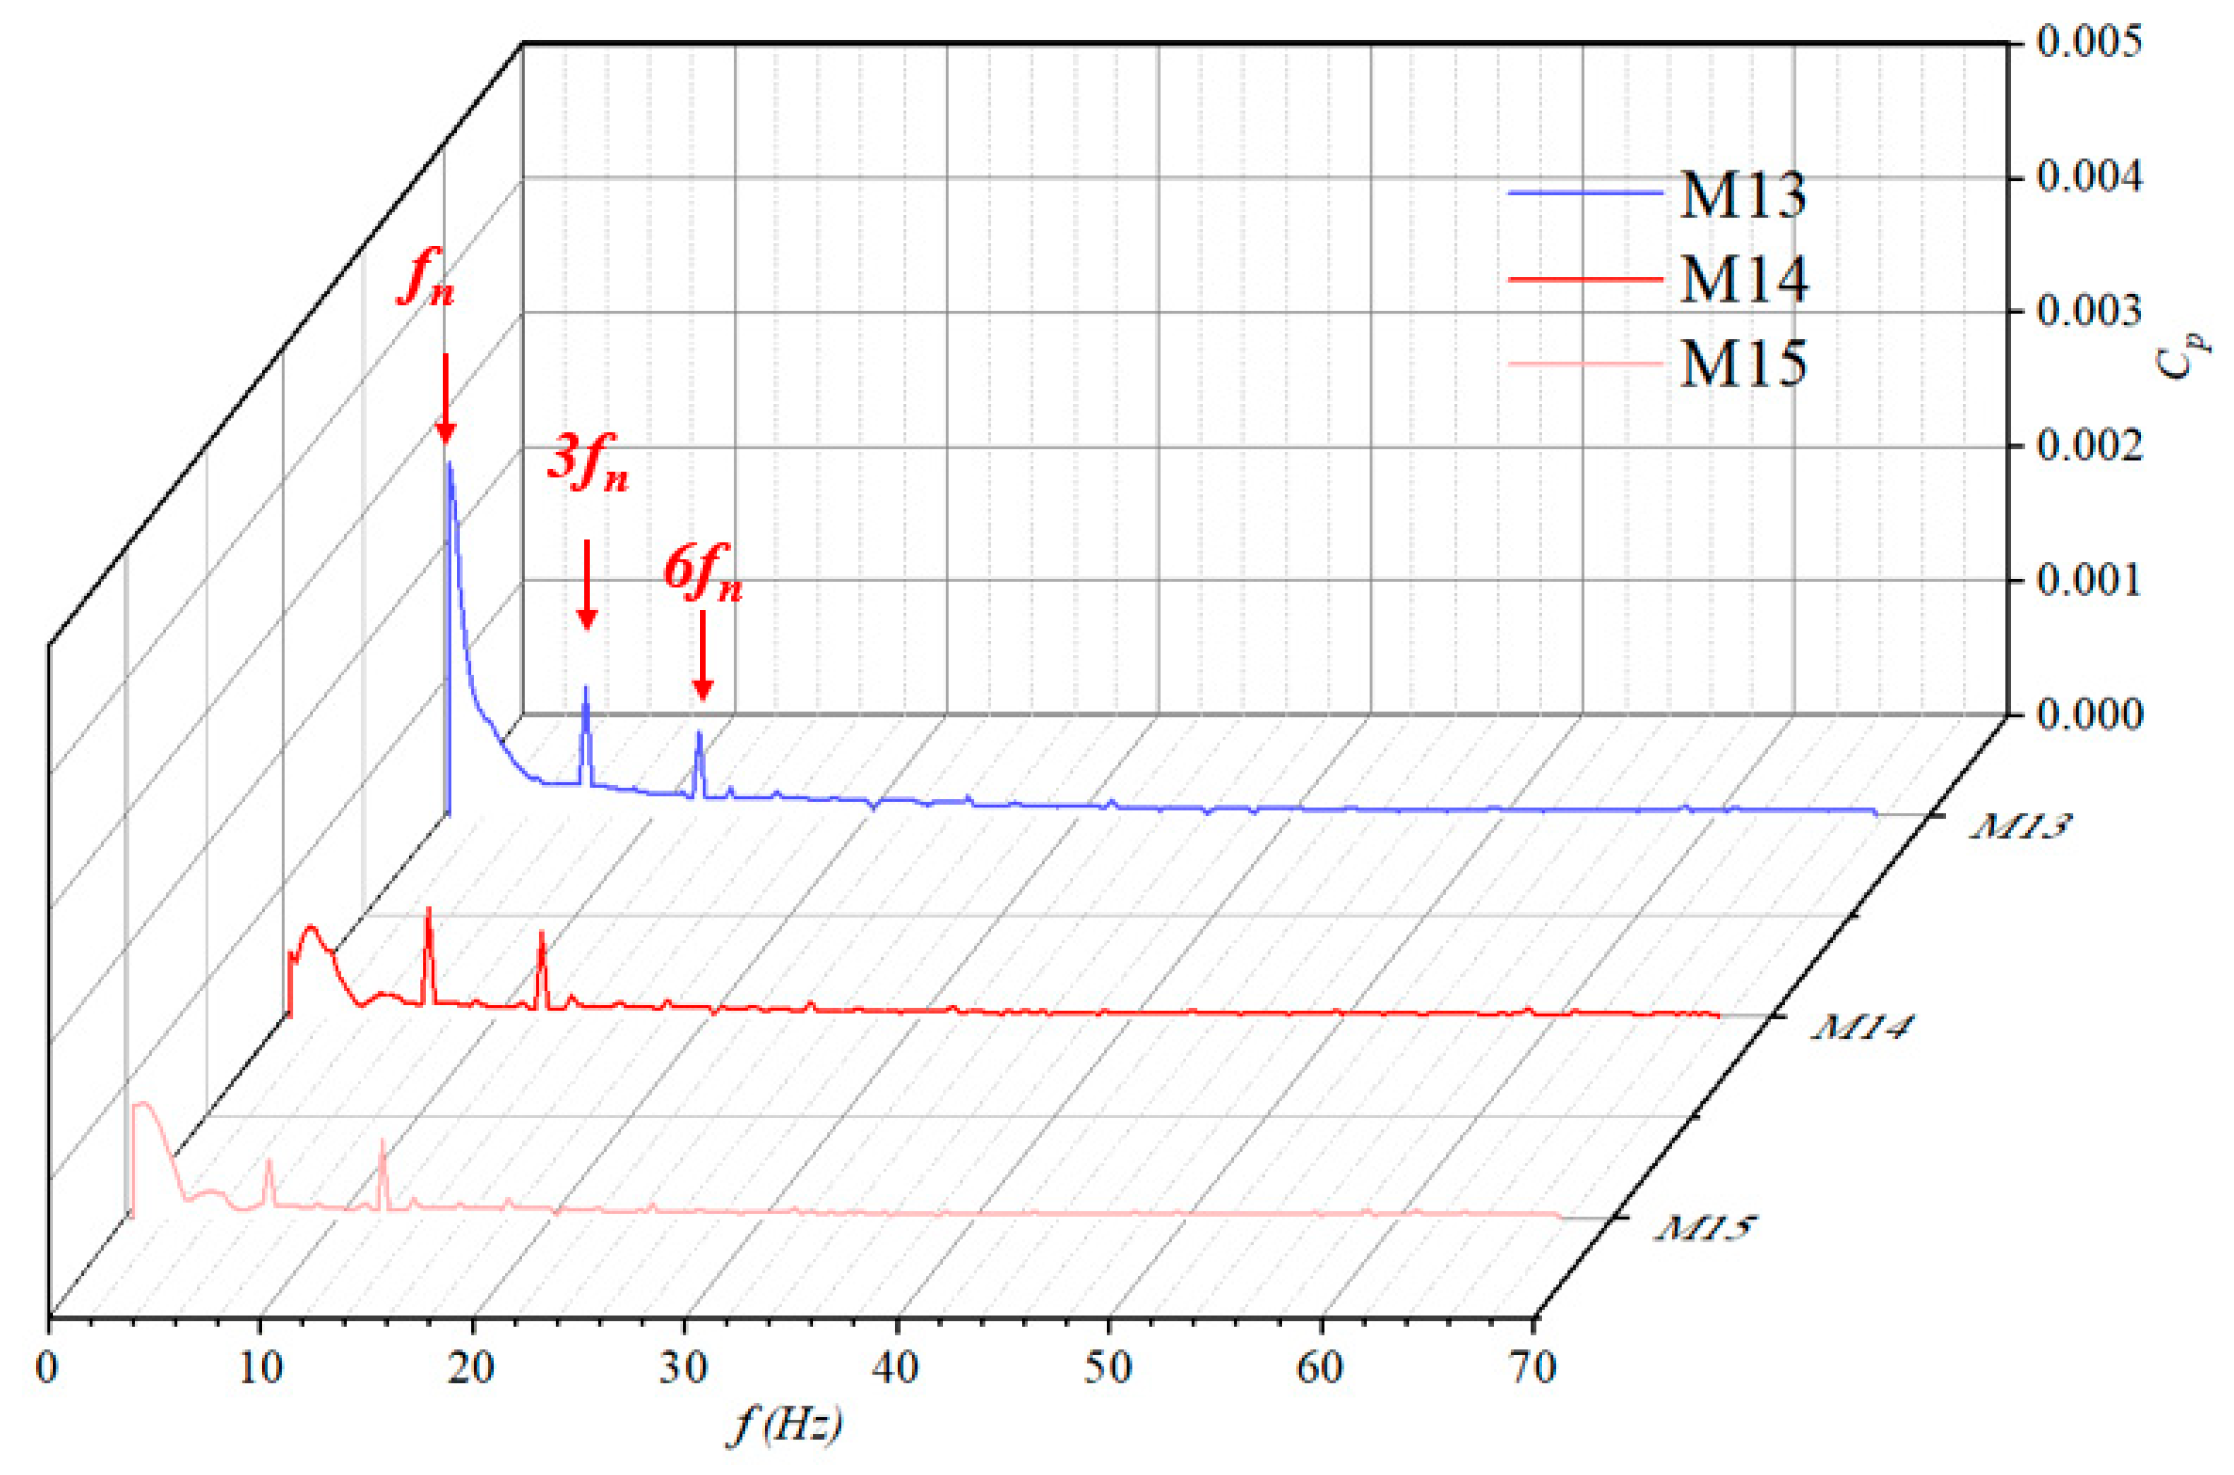
At the inlet position, due to the limited impact of impeller rotation on the inlet, the pressure fluctuation amplitude is relatively weak. The main frequency at the inlet of the impeller is three times the rotational frequency, indicating that the water body is affected by the rotation of the impeller before passing through it. The main frequency at the outlet of the impeller is six times the rotational frequency, indicating a significant impact of rotor–stator interaction on the water body.
(2)
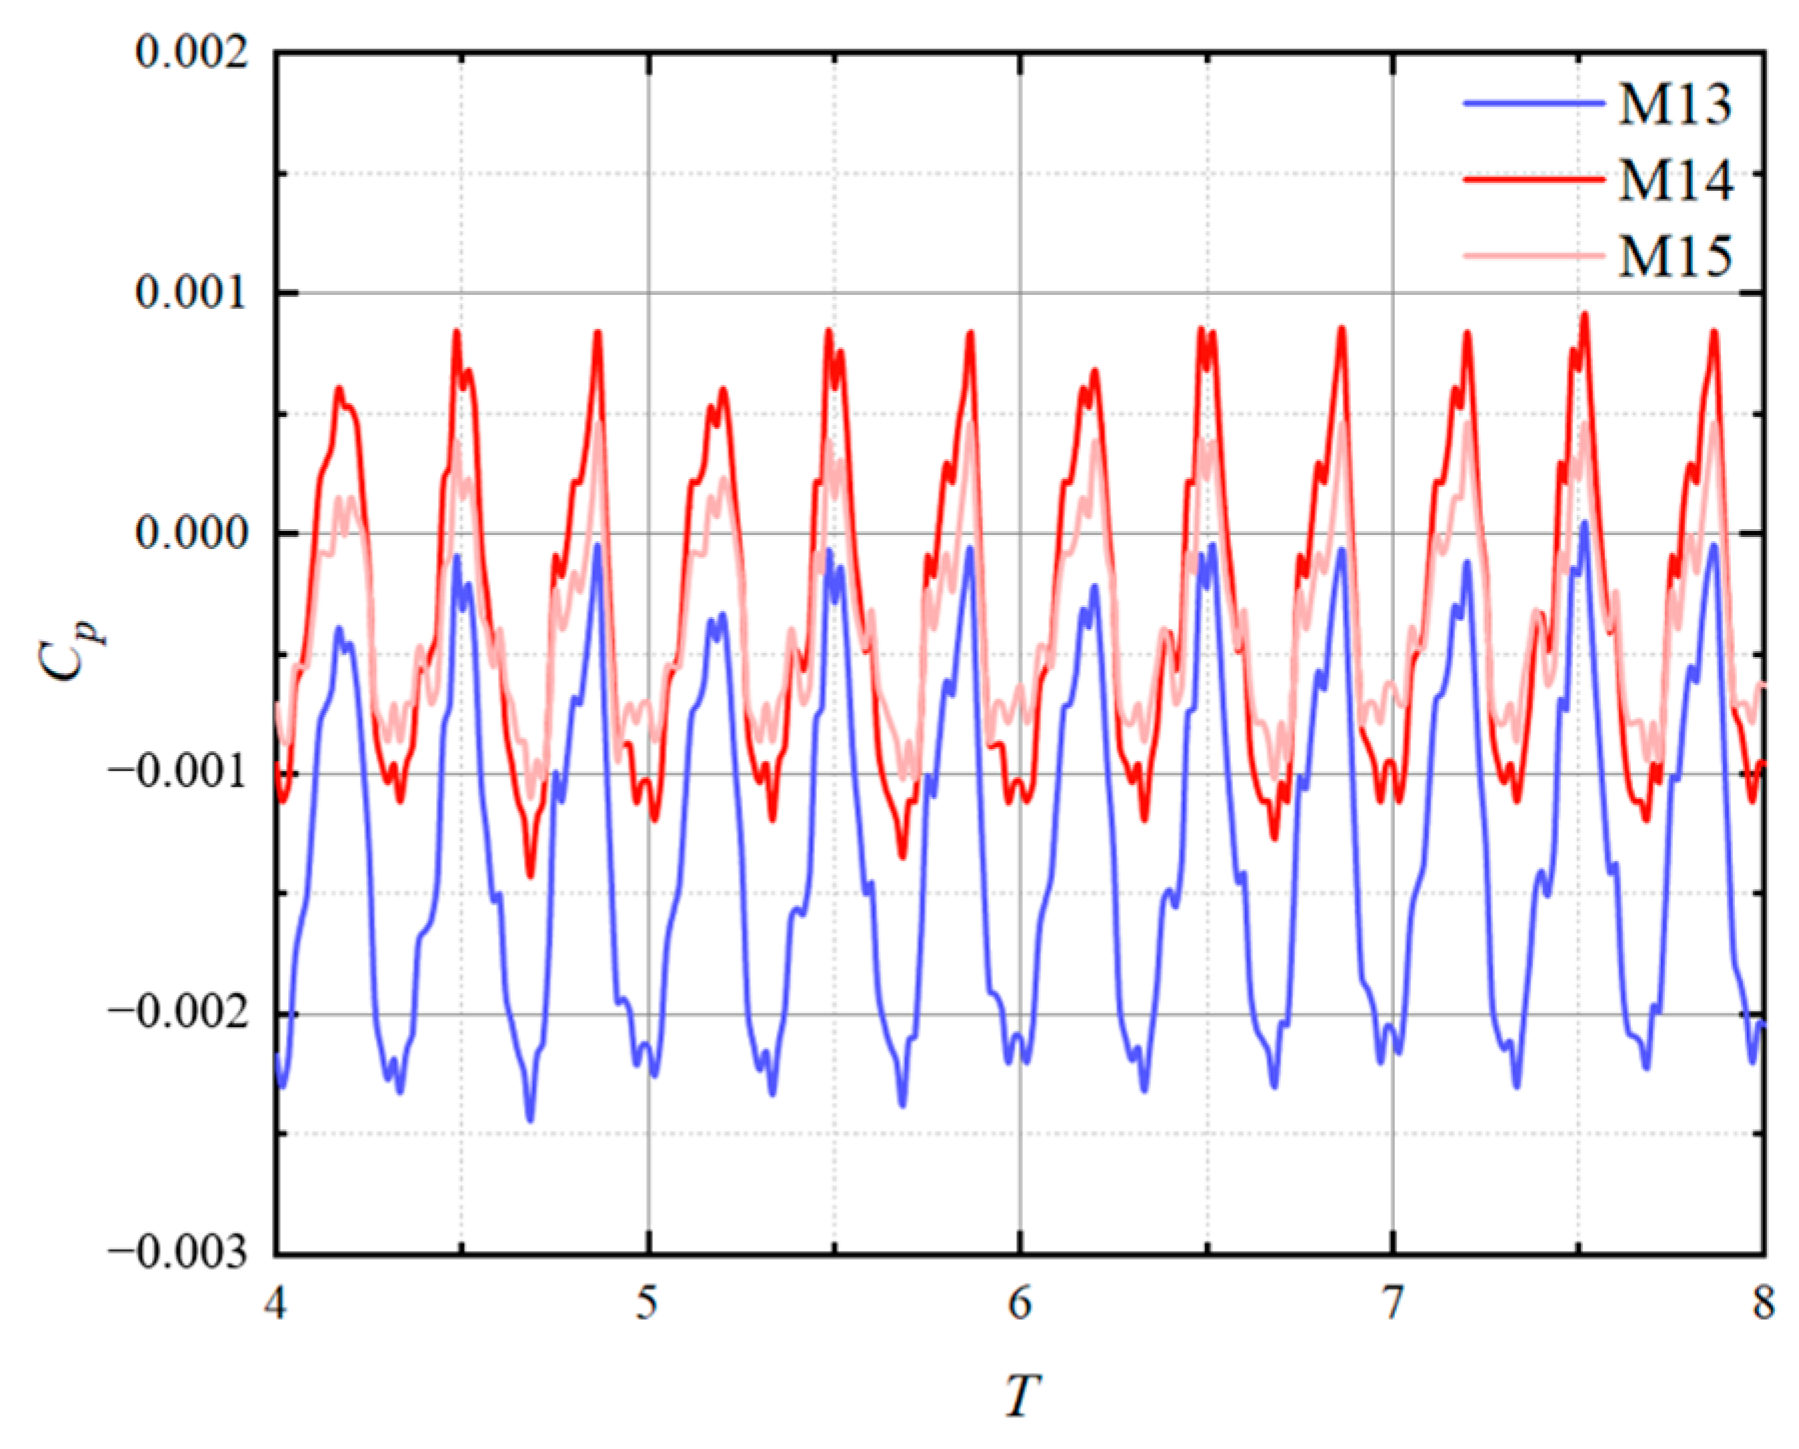
The time-domain data of the pressure fluctuation at the outlet of the guide vane show three different peaks and valleys within one cycle. It is worth noting that the amplitude of the pressure fluctuation curve significantly decreases towards the cross-section of the impeller outlet. Each monitoring point shows a significant high amplitude distribution at three times the rotational frequency and six times the position, indicating that both the impeller blades and guide blades are affected simultaneously.
(3)
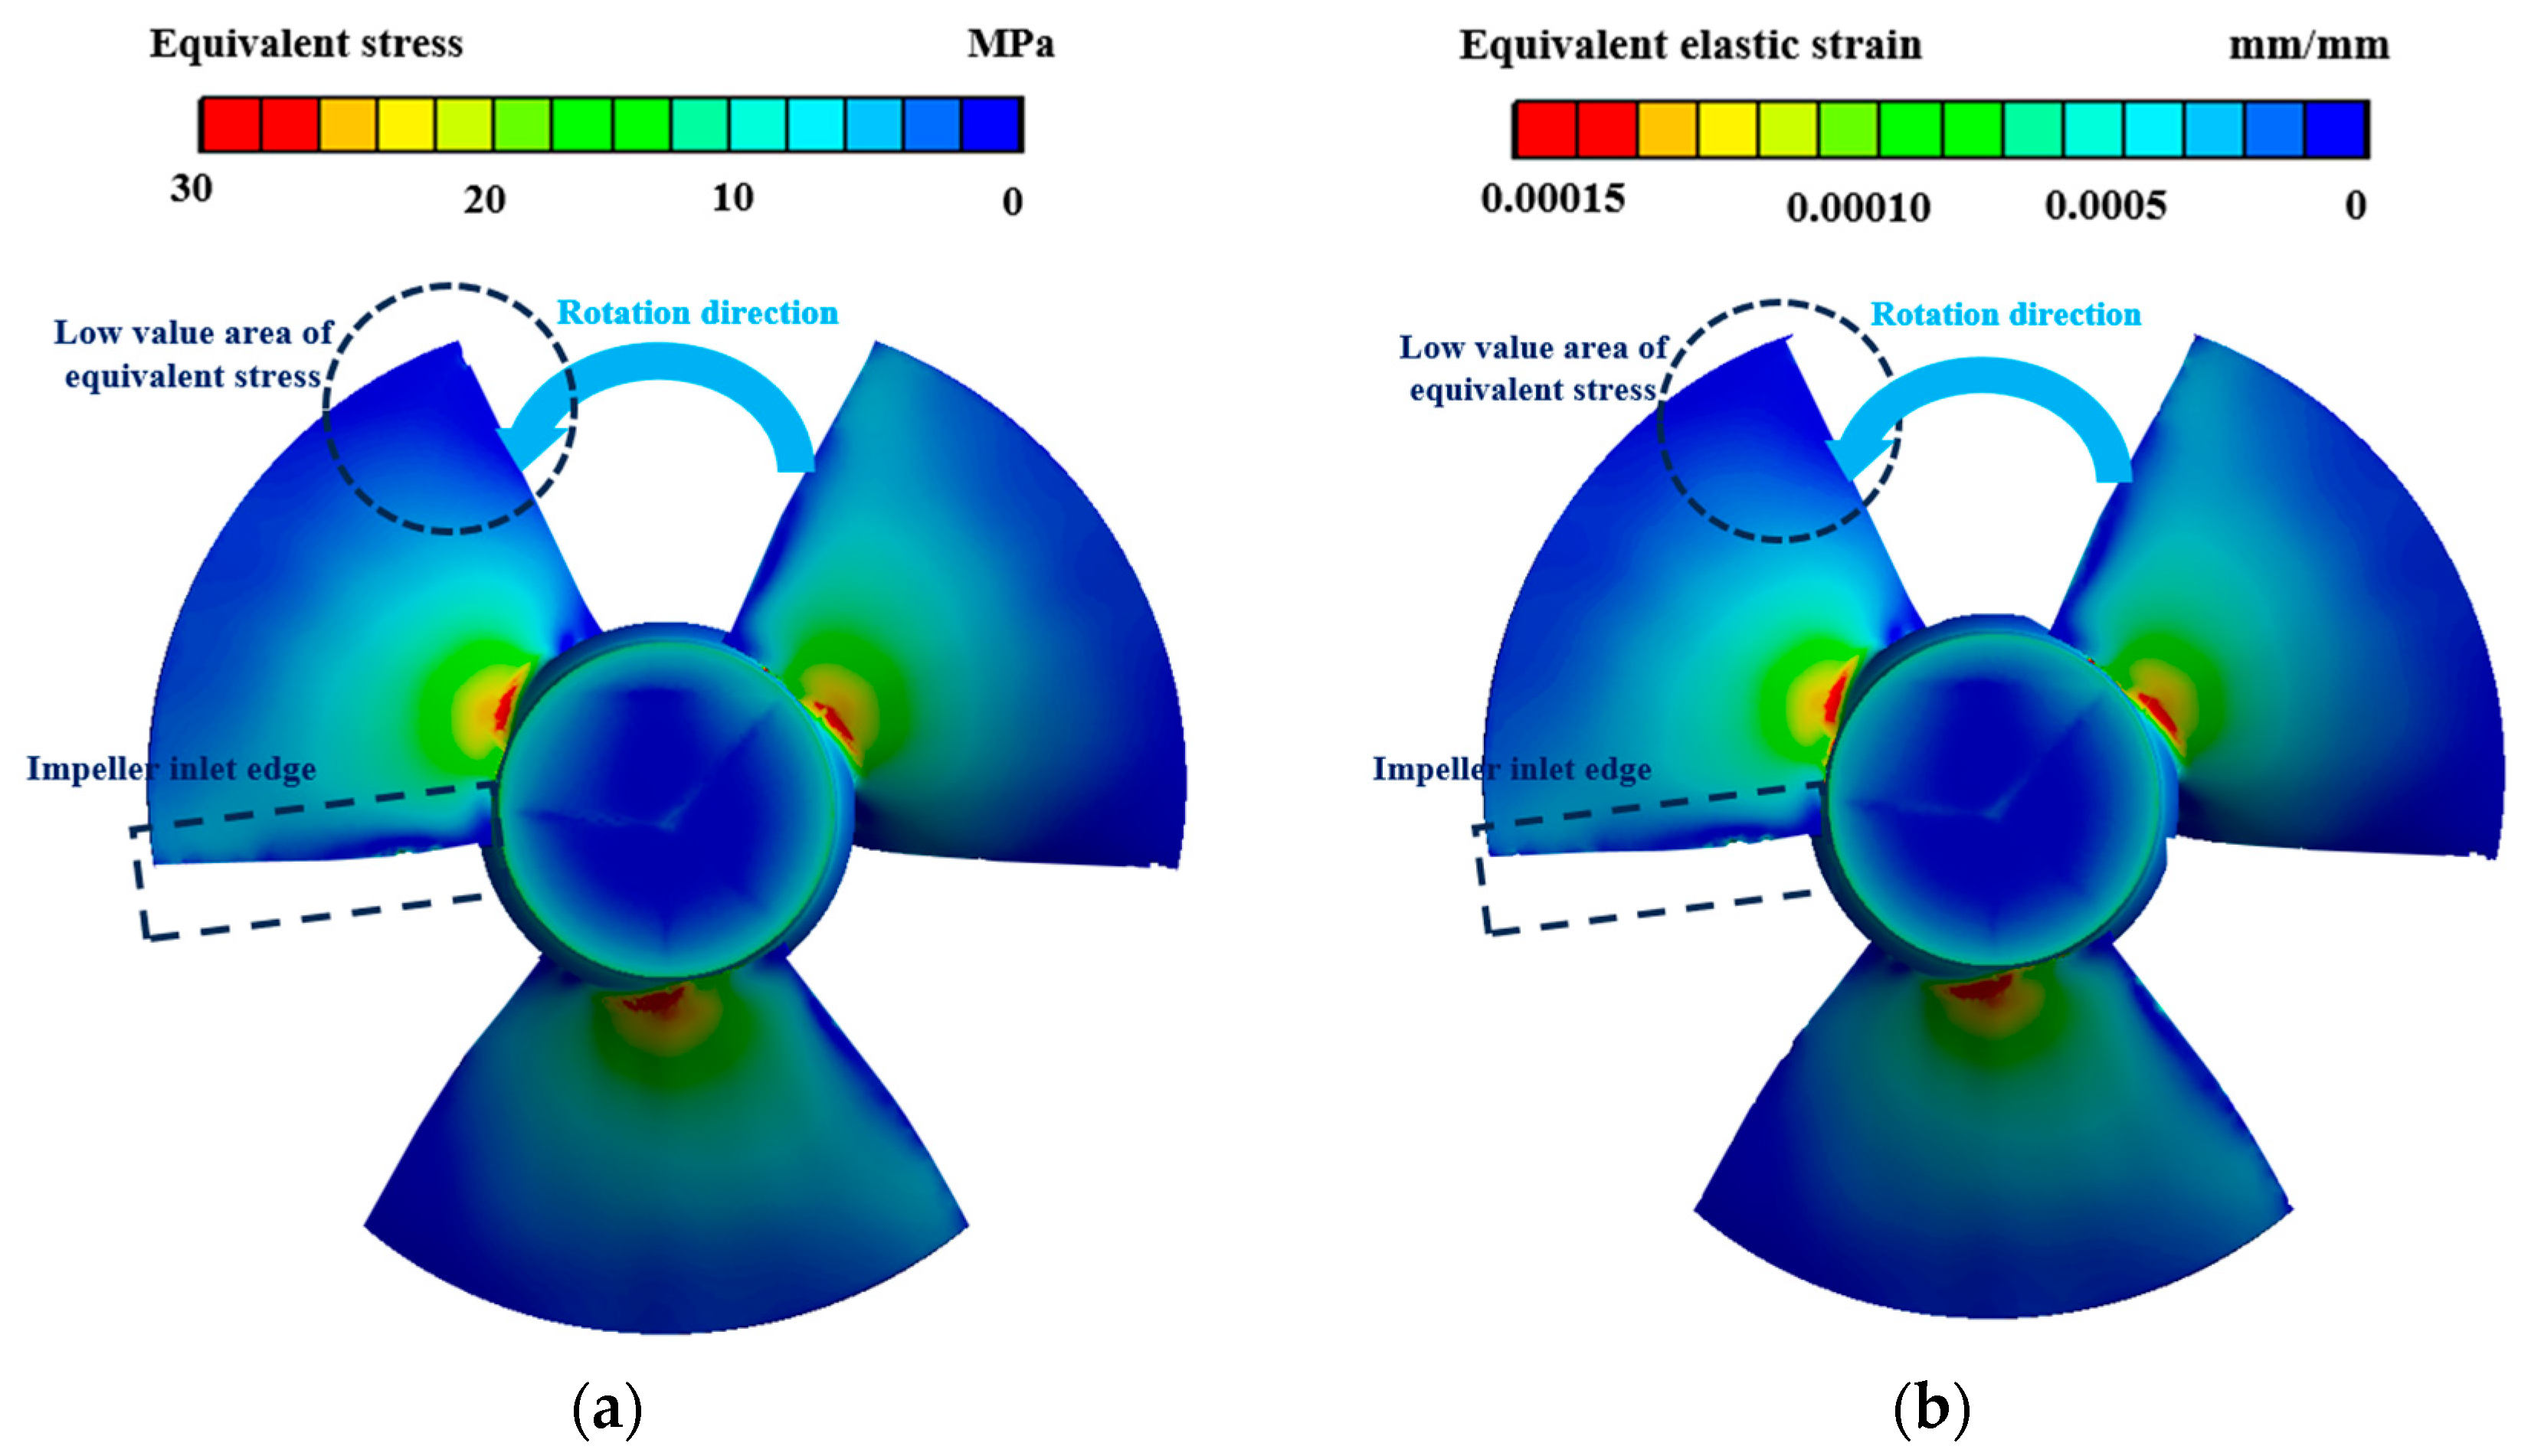
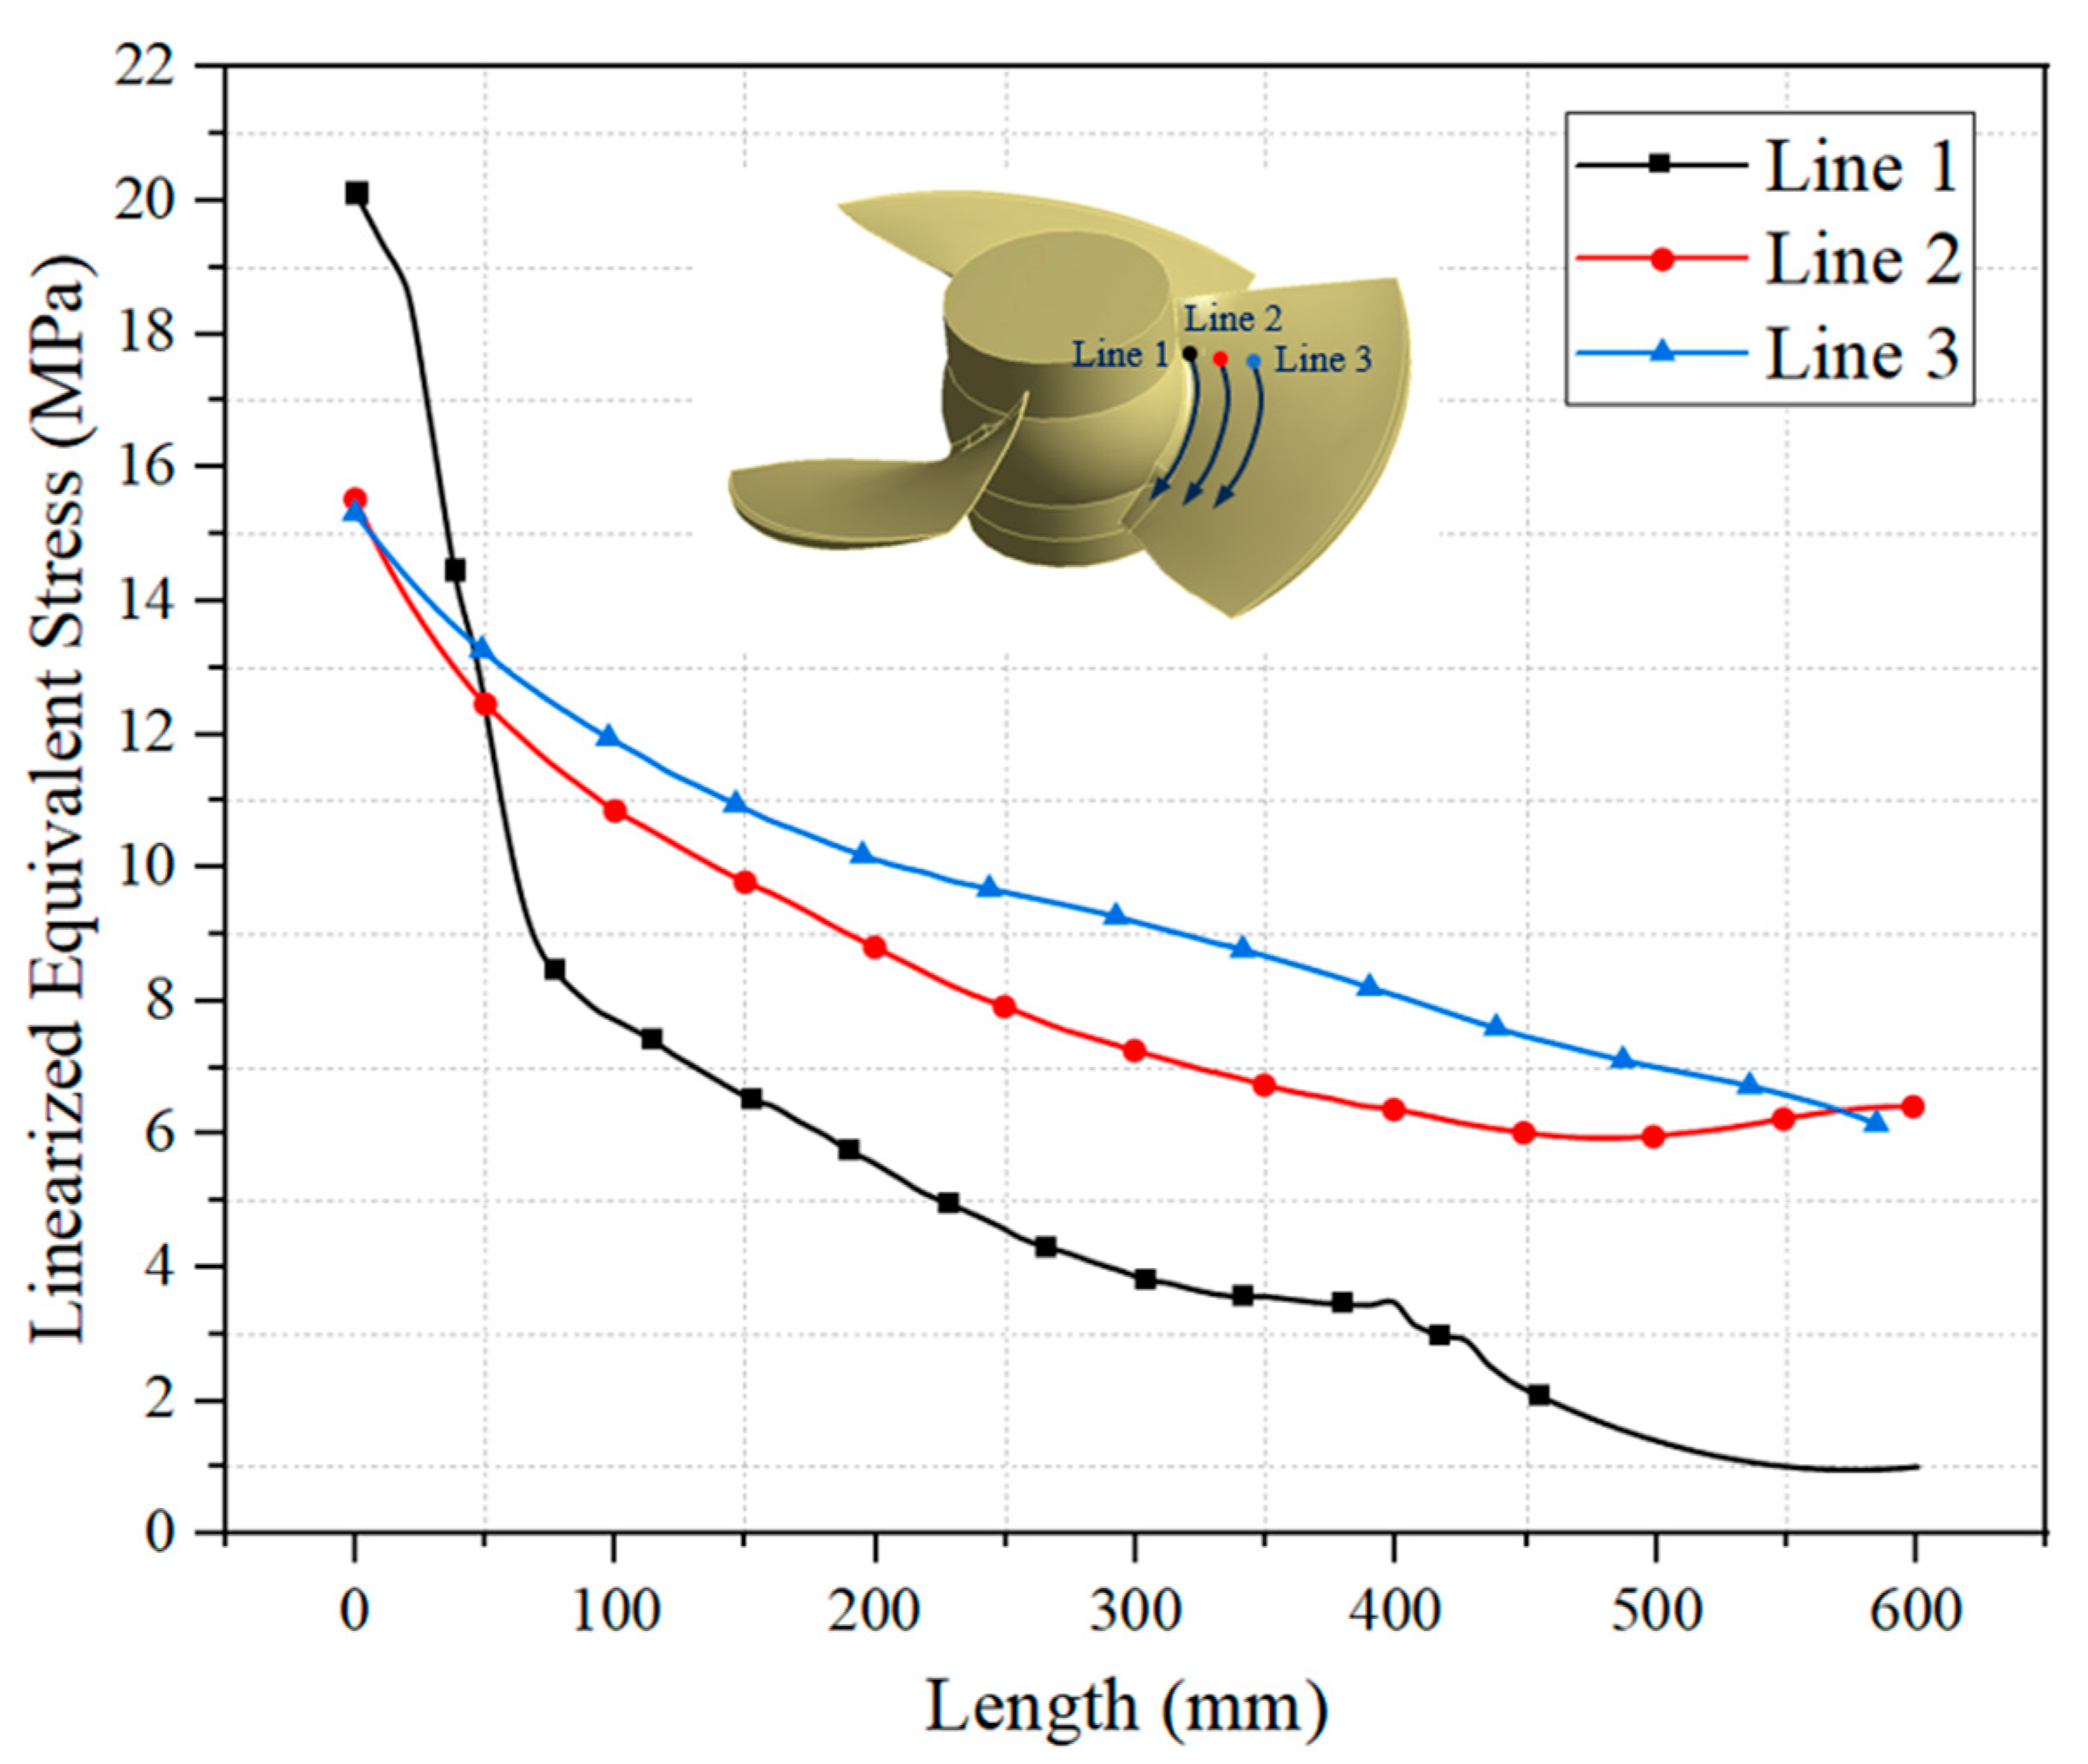
The high stress area appears at the root of the impeller, and the stress magnitude decreases in the circumferential direction towards the edge of the impeller. The stress level at the edge of the impeller is relatively moderate. The stress distribution at the root of the impeller is uneven, and the stress at the outlet edge exceeds that at the inlet edge. The non-uniformity of the stress distribution gradually decreases with the increase in the radial distance.
(4)
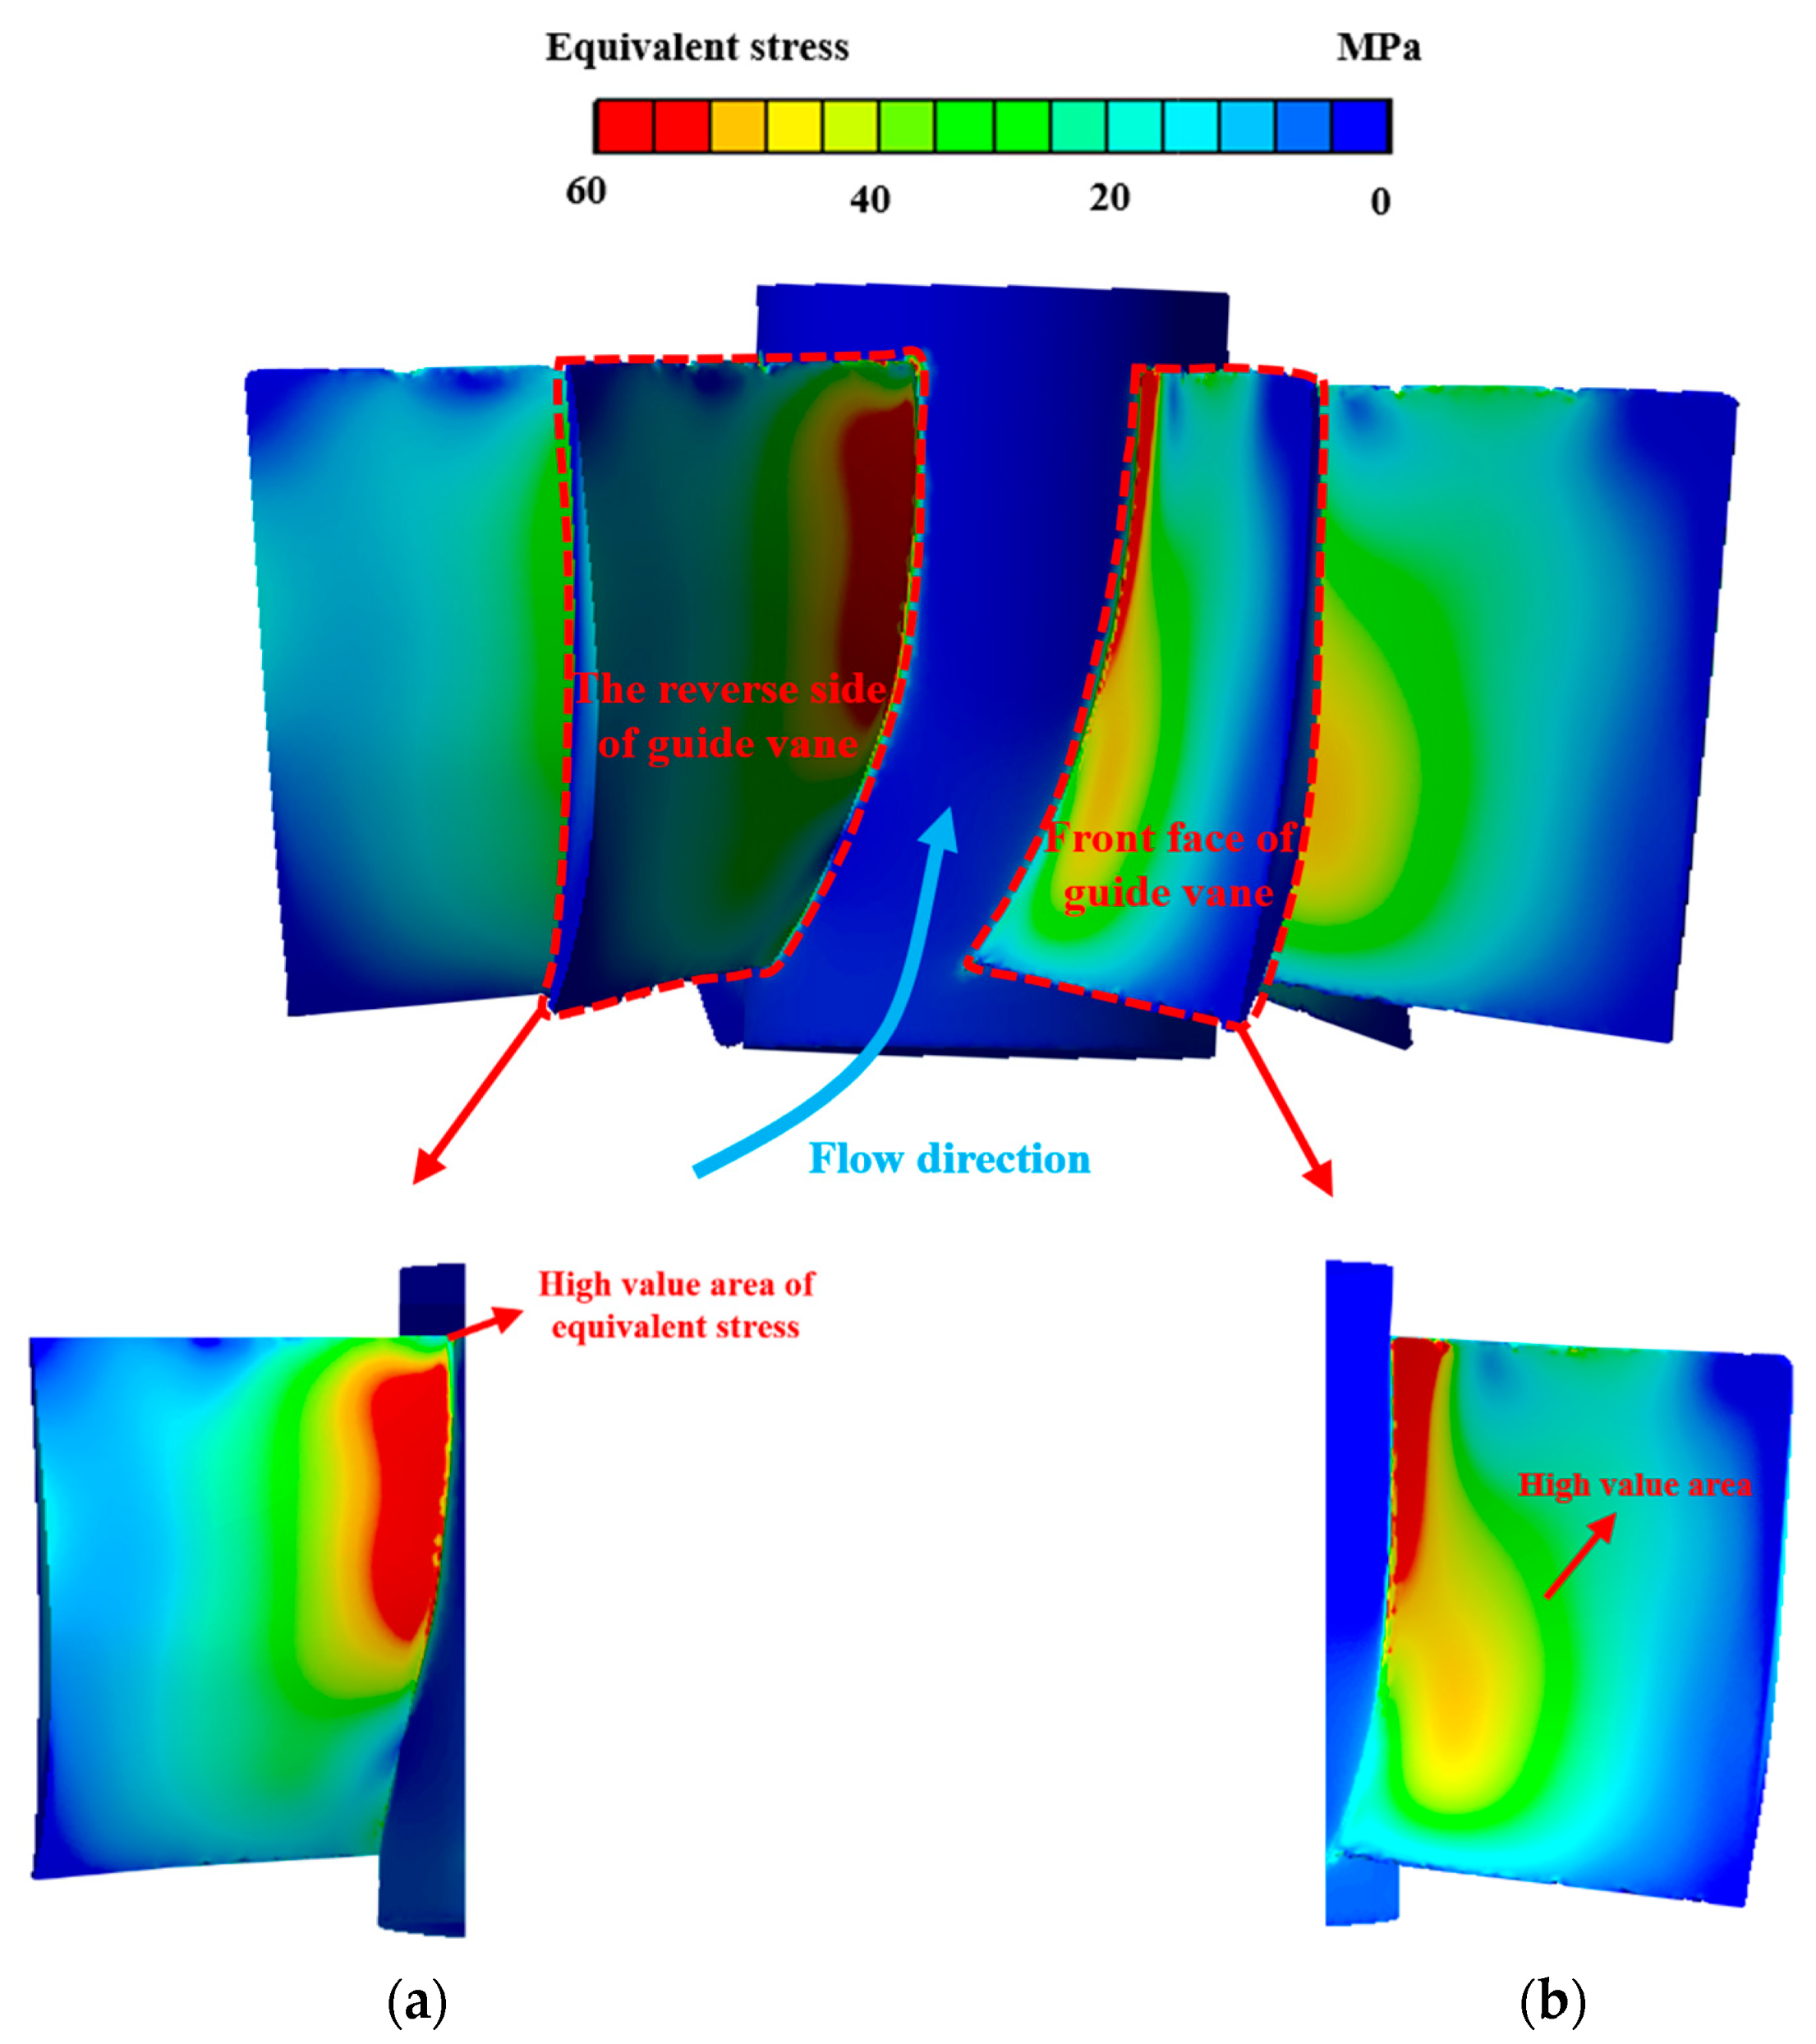
The high stress and strain areas on the front of the guide vanes are concentrated in the root area near the outlet, and the stress distribution inside the guide vanes is uneven. At the root, there is significant stress on both sides, but the internal stress is the smallest. As the radial distance increases, the stress inside the blade becomes more uniform and the stress magnitude decreases.

Author Contributions

Software, Y.Z. and H.J.; Validation, S.C. and M.W.; Writing—original draft preparation, Y.Z. and H.J.; Writing—review and editing, H.J. and S.W.; Supervision, Y.Z., H.J. and W.Z. All authors have read and agreed to the published version of the manuscript.

Funding

This research was funded by the Funding for High-End Training Projects for Teachers’ Professional Leaders in Vocational Colleges in Jiangsu Province (Grant No. 2023GRFX084).

Data Availability Statement

Data on the analysis and reporting results during the study can be obtained by contacting the authors. The data are not publicly available due to 3rd Party Data Restrictions apply to the availability of these data.

Conflicts of Interest

Author Shihui Wang and Wenbo Zhu were employed by the company Suzhou Water Conservancy Design and Research Co., Ltd. The remaining authors declare that the research was conducted in the absence of any commercial or financial relationships that could be construed as a potential conflict of interest.

References

  1. Meng, G. Retrospect and prospect to the research on rotordynamics. J. Vib. Eng. 2002, 15, 1–9. [Google Scholar]
  2. Mortazavi, F. CFD-based Impeller and Seal Rotordynamic Forces. Ph.D. Dissertation, Texas A&M University, College Station, TX, USA, 2018. [Google Scholar]
  3. Shi, W.L.; Liu, J.; Lu, L.G.; Xu, L.; Zhou, X.Y.; Sun, S.H. Hydraulic design standardization for inlet and outlet conduit of tubular pump system with front-positioned shaft. South–North Water Transf. Water Sci. Technol. 2020, 18, 115–122. [Google Scholar]
  4. Lu, L.G.; Chen, J.; Liang, J.D.; Leng, Y. Optimal hydraulic design of bulb tubular pump system. J. Hydraul. Eng. 2008, 39, 355–360. [Google Scholar]
  5. Guo, S.Y.; Chen, J.H. Research progress in fluid solid coupling applications. J. Jinan Univ. 2004, 18. [Google Scholar] [CrossRef]
  6. Zhang, X.W.; Tang, F.P.; Chen, Y.T.; Huang, C.B.; Chen, Y.J.; Wang, L.; Shi, L.J. Experimental Study on the Internal Pressure Pulsation Characteristics of a Bidirectional Axial Flow Pump Operating in Forward and Reverse Directions. Machines 2022, 10, 167. [Google Scholar] [CrossRef]
  7. Al-Obaidi, A.R. Analysis of the Effect of Various Impeller Blade Angles on Characteristic of the Axial Pump with Pressure Fluctuations Based on Time- and Frequency-Domain Investigations. Iran J. Sci. Technol.-Trans. Mech. Eng. 2021, 45, 441. [Google Scholar]
  8. Liu, Y.B.; Tan, L.; Liu, M.; Hao, Y.; Xu, Y. Influence of Prewhirl Angle and Axial Distance on Energy Performance and Pressure Fluctuation for a Centrifugal Pump with Inlet Guide Vanes. Energies 2017, 10, 695. [Google Scholar]
  9. Zheng, L.L.; Chen, X.P.; Qu, J.L.; Ma, X.J. A Review of Pressure Fluctuations in Centrifugal Pumps without or with Clearance Flow. Processes 2023, 11, 856. [Google Scholar] [CrossRef]
  10. Feng, J.J.; Luo, X.Q.; Guo, P.C.; Wu, G.K. Influence of tip clearance on pressure fluctuations in an axial flow pump. J. Mech. Sci. Technol. 2016, 30, 1603. [Google Scholar]
  11. Kan, K.; Zheng, Y.; Chen, Y.J.; Xie, Z.S.; Yang, G.; Yang, C.X. Numerical study on the internal flow characteristics of an axial-flow pump under stall conditions. J. Mech. Sci. Technol. 2018, 32, 4683. [Google Scholar]
  12. Bai, Y.L.; Wu, D.L. Study on Fatigue Characteristics of Axial-Flow Pump Based on Two-Way Fluid-Structure Coupling. Energies 2022, 15, 8965. [Google Scholar] [CrossRef]
  13. Yang, F.; Jiang, D.J.; Hu, W.Z.; Nasr, A.; Liu, C.; Xie, R.S. Dynamic stress characteristics and fatigue life analysis of a slanted axial-flow pump. Proc. Inst. Mech. Eng. Part C-J. Eng. Mech. Eng. Sci. 2023, 237, 2858. [Google Scholar] [CrossRef]
  14. Liu, X.Y.; Xu, F.Y.; Cheng, L.; Pan, W.F.; Jiao, W.X. Stress Characteristics Analysis of Vertical Bi-Directional Flow Channel Axial Pump Blades Based on Fluid-Structure Coupling. Machines 2022, 10, 368. [Google Scholar] [CrossRef]
  15. Shi, L.J.; Wu, C.X.; Wang, L.; Xu, T.; Jiang, Y.H.; Chai, Y.; Zhu, J. Influence of Blade Angle Deviation on the Hydraulic Performance and Structural Characteristics of S-Type Front Shaft Extension Tubular Pump Device. Processes 2022, 10, 328. [Google Scholar] [CrossRef]
  16. Shi, L.J.; Zhu, J.; Wang, L.; Chu, S.J.; Tang, F.P.; Jin, Y. Comparative Analysis of Strength and Modal Characteristics of a Full Tubular Pump and an Axial Flow Pump Impellers Based on Fluid-Structure Interaction. Energies 2021, 14, 6395. [Google Scholar] [CrossRef]
  17. Zhang, D.S.; Pan, D.Z.; Xu, Y.; Shao, P.P.; Wang, G.T. Numerical Investigation of Blade Dynamic Characteristics in an Axial Flow Pump. Therm. Sci. 2013, 17, 1511. [Google Scholar]
  18. Zhou, Y.; Zheng, Y.; Kan, K.; Zhang, Y.Q.; Wang, H.L.; Tang, W.; Zhao, M.S. Study on hydraulic characteristics of large vertical axial-flow pump used as constant frequency power generation. Proc. Inst. Mech. Eng. Part A-J. Power Energy 2021, 235, 59. [Google Scholar] [CrossRef]
  19. Wang, S.; Zhang, L.J.; Yin, G.J. Numerical Investigation of the FSI Characteristics in a Tubular Pump. Math. Probl. Eng. 2017, 9, 7897614. [Google Scholar]
  20. Ji, Z.L. Research on thermal-fluid-structure coupling of valve plate pair in an axial piston pump with high pressure and high speed. Ind. Lubr. Tribol. 2018, 70, 1137. [Google Scholar] [CrossRef]
  21. Wei, R.F.; Ye, Z.F. Experimental and numerical analysis of fluid-solid-thermal coupling on electric fuel pump. Proc. Inst. Mech. Eng. Part G-J. Aerosp. Eng. 2021, 235, 1427. [Google Scholar] [CrossRef]
  22. Zhou, W.J.; Yu, D.L.; Wang, Y.F.; Shi, J.L.; Gan, B. Research on the Fluid-Induced Excitation Characteristics of the Centrifugal Pump Considering the Compound Whirl Effect. Facta Univ.-Ser. Mech. 2023, 21, 223. [Google Scholar]
  23. Zhang, L.J.; Wang, S.; Yin, G.J.; Guan, C.N. Fluid–Structure Interaction Analysis of Fluid Pressure Pulsation and Structural Vibration Features in A Vertical Axial Pump. Adv. Mech. Eng. 2019, 11, 1687814019828585. [Google Scholar] [CrossRef]
Figure 1. Calculation model of the whole flow passage of the pump.
Water 16 00324 g001
Figure 2. Impeller water grid.
Water 16 00324 g002
Figure 3. Grid independence verification.
Water 16 00324 g003
Figure 4. Solid state computing domain.
Water 16 00324 g004
Figure 5. Impeller and guide vane grid. (a) Impeller grid, (b) Guide vane grid.
Water 16 00324 g005
Figure 6. Pumping system model.
Water 16 00324 g006
Figure 7. Comparison of CFD and test results.
Water 16 00324 g007
Figure 8. Flow velocity distribution of pump device.
Water 16 00324 g008
Figure 9. Setting of pressure pulsation monitoring points. (a) Setting of monitoring points for inlet passage, (b) Setting of monitoring points for impeller, (c) Setting of monitoring points for guide vane.
Water 16 00324 g009
Figure 10. Time-domain diagram of pressure fluctuation in the inlet passage.
Water 16 00324 g010
Figure 11. Frequency-domain diagram of pressure fluctuation in the inlet passage.
Water 16 00324 g011
Figure 12. Time-domain diagram of pressure fluctuation at the inlet section of the impeller.
Water 16 00324 g012
Figure 13. Frequency-domain diagram of pressure fluctuation at the inlet section of the impeller.
Water 16 00324 g013
Figure 14. Time-domain diagram of pressure fluctuation at the outlet section of the impeller.
Water 16 00324 g014
Figure 15. Frequency-domain diagram of pressure fluctuation at the outlet section of the impeller.
Water 16 00324 g015
Figure 16. Time-domain diagram of pressure fluctuation at the outlet section of the guide vane.
Water 16 00324 g016
Figure 17. Frequency-domain diagram of pressure fluctuation at the outlet section of the guide vane.
Water 16 00324 g017
Figure 18. Equivalent stress–strain distribution on the suction surface of the impeller. (a) Equivalent stress distribution, (b) Equivariant strain distribution.
Water 16 00324 g018
Figure 19. Equivalent stress–strain distribution on the pressure surface of the impeller. (a) Equivalent stress distribution, (b) Equivariant strain distribution.
Water 16 00324 g019
Figure 20. Changes in circumferential equivalent stress at the root of the impeller.
Water 16 00324 g020
Figure 21. Equivalent stress distribution on the guide vane section. (a) Equivalent stress on the reverse side of guide vane, (b) Equivalent stress of the front face of guide vane.
Water 16 00324 g021
Figure 22. Distribution of equivalent strain on the guide vane section. (a) Equivalent strain on the reverse side of guide vane, (b) Equivalent stress of the front face of guide vane.
Water 16 00324 g022
Figure 23. Schematic diagram of guide vane section selection.
Water 16 00324 g023
Figure 24. Equivalent stress distribution on the guide vane sections. (a) 1-1 section, (b) 2-2 section.
Water 16 00324 g024
Disclaimer/Publisher’s Note: The statements, opinions and data contained in all publications are solely those of the individual author(s) and contributor(s) and not of MDPI and/or the editor(s). MDPI and/or the editor(s) disclaim responsibility for any injury to people or property resulting from any ideas, methods, instructions or products referred to in the content.

