Article

Temporal and Spatial Distribution of Phytoplankton and Role of Environment Factors in the Shending River Backwater in the Danjiangkou Reservoir Area

1
Shenzhen Graduate School, Peking University, Shenzhen 518055, China
2
Guangdong Province River Ecological Restoration Technology Engineering Research Center, Shenzhen 518071, China
3
Shenzhen Bolvzhe Ecological Technology Co., Ltd., Shenzhen 518071, China
4
Hunan Xinyuan Environmental Technology Co., Ltd., Changsha 410000, China
*
Authors to whom correspondence should be addressed.
Water 2024, 16(2), 326; https://doi.org/10.3390/w16020326
Submission received: 8 December 2023 / Revised: 2 January 2024 / Accepted: 14 January 2024 / Published: 18 January 2024
(This article belongs to the Section Biodiversity and Functionality of Aquatic Ecosystems)

Abstract

:
The Danjiangkou Reservoir supplies drinking water to most residents in northern China. However, signs of eutrophication have been observed in the inlet tributaries of the reservoir, including the Shending River backwater. This research used data from the Sentinel-2 Multispectral instrument and findings from a 2021 aquatic ecological survey to analyze the spatial and temporal characteristics of phytoplankton distribution in the Shending River backwater region. The average chlorophyll a (Chl-a) concentrations by season, ranked from largest to smallest, are as follows: summer (63.96 μg/L) > autumn (41.26 μg/L) > spring (27.47 μg/L) > winter (16.21 μg/L); the upstream of the backwater area and the near-shore tributary bay had relatively higher Chl-a concentration. Bacillariophyceae (Cyclotella meneghiniana and Synedra sp.) and Cryptophyceae species (Chroomonas acuta) were dominant in spring, whereas Chlorophyceae (Scenedesmus sp. and Chlorella vulgaris) and Cyanophyceae (Dactylococcopsis acicularis, Microcystis aeruginosa and Oscillatoria tenuis) species were dominant in summer. The seasonal succession characteristics of the phytoplankton community were consistent with those of the Plankton Ecology Group model. The average phytoplankton cell density was 4.80 × 10⁷ cells/L, and the Shannon–Wiener average diversity index was 1.95, indicating that the Shending River backwater area was moderately eutrophic. According to Pearson correlation analysis and Mantel test, the main factors causing temporal and spatial differences in phytoplankton production in the Shending River’s backwater were water level (WL), water temperature (WT), ammonia nitrogen (NH3-N) and total nitrogen (TN). In particular, WL was significantly positively correlated with Bacillariophyceae, Chlorophyceae and Cyanophyceae, whereas WT was significantly correlated with Cryptophyceae and Chlorophyceae. NH3-N and TN were significantly correlated with Cyanophyceae. Therefore, intensive nitrogen removal from the tailwater of sewage treatment plants may be considered a feasible measure to prevent cyanobacterial bloom in the Shending River backwater of the Danjiangkou Reservoir.

Graphical Abstract

1. Introduction

Primary producers in aquatic environments, phytoplankton are sensitive to environmental changes. The community structure varies according to changes in the physical and chemical properties of the water, such as water temperature [1,2], nutrient content [3,4,5], hydrological conditions [3,6,7], and nitrogen/phosphorus (N/P) ratios [8,9,10], which are crucial factors affecting phytoplankton communities. Moreover, bacterial interactions also showed significant impact on phytoplankton community dynamics and this has been supported by many recent studies [11,12]. Thus, phytoplankton are widely used as an indicator of water environment quality in aquatic ecosystems [3,13]. Overgrowth of phytoplankton can lead to damage to the ecosystem and loss of biodiversity [14]. Cyanobacterial blooms, especially, are a long-standing water hazard worldwide and are of widespread concern due to their harmful effects on water quality, microbial diversity and ecosystems [15,16]. Cyanobacterial blooms typically occur during the summer or autumn seasons [17,18], with the dominant algae being primarily Microcystis, Planktothrix, Limnothrix, Anabaena and so on [19,20,21]. Cyanobacterial dominance and succession are influenced by various environmental factors, both abiotic and biotic. Many studies have shown that cyanobacterial blooms are directly triggered by high temperatures and nutrients [22,23]. Moreover, the cyanobacterial dominance and succession are also inherently attributed to the distinctive traits of cyanobacteria including colony formation [24], gas vesicles [25], toxin release [26] and nitrogen fixation [27]. More driving factors of cyanobacterial blooms are being researched and updated, including water temperature, chemical oxygen demand, pH, water levels and transparency [28,29,30,31,32], to provide a foundation for developing more effective strategies to prevent and control cyanobacterial blooms in various bodies of water.
In recent years, a large number of reservoirs and dams have been constructed to satisfy the need of human society for an adequate water supply, flood control, efficient shipping, agricultural irrigation and hydroelectric generation; eventually, water resource utilization became more efficient, water allocation and shortage were addressed and huge socioeconomic benefits were attained [33,34]. The environment of the water in a reservoir is affected directly by the river that flows into it, which is one of the major pollutant inputs to the reservoir. The backwater area of the inlet rivers in the confluence area is formed when the water level of the reservoir area continually rises and inundates the interior of some of the inlet rivers. Due to the decreased water flow, decreased water body diffusion capacity and increased pollutant retention time as water levels rise, eutrophication and abnormal phytoplankton proliferation are common in the backwaters of the inlet tributaries [35,36,37]. In-depth research on the occurrence of eutrophication in the backwaters of inlet tributaries should be conducted to prevent the adverse effects of eutrophication on water reservoirs. To elucidate the eutrophication mechanisms in the backwaters of inlet tributaries, recent studies have examined the spatial and temporal distribution of phytoplankton in inlet river backwaters and their relationship to environmental conditions. For 2 years, Xiao et al. observed the tributary Pengxi River, which flows into the Three Gorges Reservoir, and found that warmer water temperatures promoted the development of most cyanobacteria; they also found that large-scale reservoir operations led to structural differences, which were related to nutrient conditions, reservoir size and depth of the water, in the habitats of the backwaters of the inlet rivers [38]. Zhu et al. conducted a study on the phytoplankton in Daning River, another inflow river of the Three Gorges Reservoir, and reported that the dynamic changes in Phytoplankton were mainly affected by the hydrological system [39]. However, there is a dearth of research on the phytoplankton population in tributary backwaters and how its characteristics are related to environmental conditions.
As the longest water transfer project in the world, the South-to-North Water Diversion Project (SNWDP) has a 1264 km total route length and was created to ease severe water shortages in northern China [40]. The Danjiangkou Reservoir has a storage capacity of 29.05 billion cubic meters of water and a typical storage level of 170 m; it is the main water source in the SNWDP project [41]. The Danjiangkou Reservoir has been supplying water to 19 cities along the SNWDP since the project began operating in 2014. Its water quality directly affects how safe the drinking water is for locals in the receiving areas [42]. Recently, the Danjiangkou Reservoir has shown signs of eutrophication and water quality deterioration [43,44]. Moreover, the Danjiangkou Reservoir tributary backwaters of the Longhe, Jianhe, Shending and Si rivers have been spotted with phytoplankton blooms each year, usually from April to October; however, the distribution characteristics of phytoplankton and its drivers in the backwaters of the Danjiangkou Reservoir tributary have not yet been the subject of any published reports.
The backwater of the Shending River in the Danjiangkou Reservoir area was surveyed in this research, and the properties of phytoplankton’s spatiotemporal distribution were determined by using the Sentinel-2 Multispectral instrument (MSI) data and aquatic ecological investigation methods. Pearson correlation method and Mantel test were employed to examine the key environmental variables affecting phytoplankton growth. The key factors driving the abnormal proliferation of phytoplankton, especially the Cyanophyceae, were explored, and prevention and control strategies for cyanobacteria blooms were proposed. The findings of this research provide a guide for the prediction and prevention of algal blooms in the Danjiangkou Reservoir and for the elucidation of the eutrophication mechanism in the backwaters of its inlet tributaries.

2. Materials and Methods

2.1. Study Area

The Shending River is an inlet river of the Danjiangkou Reservoir and is located between 110°39′34″–110°53′29″ E and 32°31′04″–32°32′10″ N (Figure 1); it is 58.1 km in length and produces 67 million m3 of water annually. The Shending River Basin is characterized by a mild, north subtropical continental monsoon climate, with an average annual temperature of 15.2 °C and an average annual precipitation of 846.8 mm. The Shending River is a seasonal river in the hilly highlands, and the flood season typically runs from May through October each year. The Shending River basin catchment encompasses 227 km2 and is situated in the central and western parts of Shiyan city. There are 63 communities in the urban area of Shiyan, 40 of which are distributed along the Shending River watershed, with a total population of approximately 775,300. The research subject was the Shending River backwater area, located at the end of the Shending River. This area appears like a lake owing to the intrusion of the Danjiangkou Reservoir backwater, which is significantly larger in depth and width than that upstream of the Shending River.

2.2. Samples and Data

From the Sentinel Scientific Data Hub (https://scihub.copernicus.eu/), 12 cloudless Sentinel 2 Level-1C (L1C) MSI images (1 February 2021, 14 February 2021, 21 February 2021, 8 March 2021, 30 April 2021, 30 May 2021, 4 June 2021, 14 July 2021, 29 August 2021, 12 September 2021, 15 October 2021, 26 November 2021) of the Shending River backwaters were downloaded. The L1C data are the atmospheric apparent reflectance products obtained after orthorectified and sub-image-level geometric corrections.
Two sites were selected in the Shending River backwater area: sampling site S1 (110°51′2.6″ E, 32°46′10.9″ N) was located upstream of the Shending River backwater area, and sampling site S2 (110°53′14.2″ E, 32°48′8.0″ N) was located downstream (Figure 1). From March to August 2021, the sampling sites yielded water samples at a depth of 0.5 m four times a month (1st–3rd, 9th–11th, 19th–21st and the last three days of each month). The water samples were stored in a container with ice or ice packs and transported to the laboratory within 1–2 h. Afterward, they were kept in a refrigerator at 4 °C. A multiparameter water quality tester (YSI 6600V2; YSI Incorporated, Yellow Springs, OH, USA) detected the dissolved oxygen (DO) and water temperature (WT) at each sampling point. Quantitative phytoplankton samples were promptly fixed with neutral Lugol’s solution and sedimented for 48 h, while those for qualitative analyses of phytoplankton were gathered using the 64 μm phytoplankton mesh sieve [45,46,47]. The photosynthetically active radiation (PAR) data of the backwater area were obtained from the Yunyang meteorological monitoring station, and the water level (WL) data downstream of the backwater area were acquired from the Chenjiapo monitoring station.

2.3. Sample Analysis

In accordance with China’s “Environmental Quality Standard for Surface Water (GB3838-2002)” [48], the water samples were examined for their permanganate index (CODMn), ammonia nitrogen (NH3-N), total nitrogen (TN) and total phosphorus (TP) contents. In the plankton-counting chamber, the number of phytoplankton in concentrated samples was tallied at a 400× magnification using a biomicroscope (Olympus CX41; Olympus Corporation, Tokyo, Japan). Additionally, the cell counts of distinct phytoplankton species were computed in 100 fields that were chosen at random, and the morphology of the phytoplankton species was utilized in the identification process [49] The identified algae were further categorized into taxa using the modern systematics known as Catalogue of Life (CoL) [50], followed by taxonomic statistics.

2.4. Remote Sensing Estimation of Chlorophyll-a (Chl-a) Concentration

Chl-a concentration is a frequently used indication that is utilized in the process of assessing the phytoplankton biomass [51] and the level of eutrophication [52] in water; due to its wide monitoring range, relatively low expenditures and ease of long-term real-time monitoring, satellite remote sensing technology has been frequently used to monitor Chl-a concentrations in water bodies. The apparent absorption and scattering properties of Chl-a enable the estimation of its concentration [53,54,55]. The 2015-launched Sentinel-2 satellite consists of two identical satellites, each of which has an MSI device that can take images in 13 bands covering the short-wave, near-infrared and visible spectrum with a 5-day revisit cycle, up to 10 m of spatial resolution. Sentinel-2 is more advantageous than other remote sensing satellites because it has rich spectral bands, high spatial resolution and a short revisit period; it can be potentially used for the remote sensing monitoring of freshwater lakes [56,57,58].
In this study, the remote sensing spectral images from the Sentinel-2 satellite were used to estimate the spatiotemporal dynamics of Chl-a in the Shending River backwater area. First, the Sen2Cor tool (v2.11, http://step.esa.int/main/snap-supported-plugins/sen2cor) provided by the European Space Agency (ESA) was used to process the L1C-level data for atmospheric correction, cloud and snow detection and terrain correction. The L2A-level products were obtained. Due to the difference in the spatial resolution of the different bands of L2A-level products, all remote sensing images were resampled in the same way using the SNAP 9.0 software of ESA (http://step.esa.int/main/download/snap-download/) to facilitate the extraction of the reflectance of water quality monitoring points. The resampling bands were B2, B3, B4, B5, B6, B7, B8, B8a, the spatial resolution of resampling was 10 m and the reflectance of water bodies in the resampled images was extracted separately.
To estimate the Chl-a concentration in the Shending River backwater area via reflectance data in various bands from Sentinel 2 MSI images, we developed a Chl-a estimation model in our earlier research. The model is a semi-empirical linear regression model. During the construction of our model, we consulted numerous studies proposing various bands or band combinations that have a strong correlation to Chl-a concentration [59,60,61]. Following this, we extracted the reflectance data of these bands/band combinations from legitimate remote sensing images of the Shending River backwater area in 2021. Pearson correlation analyses were performed between these data and actual Chl-a measurement data, with results displayed in Table 1. The (1/B4 − 1/B5) × B8 band combination, which exhibited the highest correlation coefficient with Chl-a concentration, was utilized as a distinctive parameter to create the Chl-a inversion model (Equations (1) and (2)). To evaluate the accuracy of the chlorophyll a concentration inversion model, we computed the concentration of chlorophyll a utilizing remote sensing image reflectance data (five entries in total) obtained from the Shending River backwater area between 1 January and 16 March, 2022. Subsequently, the computed data using the three indicators Chl-a inversion model were compared to the chlorophyll a concentration measured according to the Chinese national standard three-color spectrophotometry (SL88-1994) [53,62]: the coefficient of determination R2, the mean absolute error (MAE) and the root mean square error (RMSE). The model demonstrated a basic ability to reflect the correlation between remote sensing images and chlorophyll a concentration in the backwater region of the Shending River, as evidenced by the R2 value of 0.687, MAE of 1.006 and RMSE of 1.219. Thus, we employed the model in this study for estimation and inversion of chlorophyll a concentration in the backwater area of the Shending River.
A total of 27,324 pixel points were set up in the study area. These pixel points’ Chl-a concentration underwent descriptive statistical analysis.
C c h l a = 260.036 x 2 + 150.927 x + 16.380
x = ( 1 / B 4 1 / B 5 ) × B 8

2.5. Characterization of Phytoplankton Community Structure

The dominating species were determined using the dominance values (Y) of each species [63]. A larger Y value indicates a more uneven distribution of species, and a more prominent presence of dominant species. The phytoplankton diversity was measured using the Shannon–Wiener index (H) [64]. Higher values of H indicate greater species diversity and stability.
Y = n i N × f i
H = i = 1 S n i N l n n i N
where N represents the total number of individuals across all species in the research region, and ni the number of individuals that belong to species i; fi is the frequency with which species i occurs, ni/N is the relative proportion of species i and S denotes the sum of all species. If the Y for a species is more than 0.02 during the sample times, then that species can be considered dominant [65].

2.6. Statistical Analysis

The analysis of variance (one-way ANOVA with least significant difference) and the Pearson correlation analysis were carried out in SPSS 18.0. Differences and correlations were considered significant when the p-value was less than 0.05.
Furthermore, the Mantel test was applied in order to investigate the relationship between environmental variables and phytoplankton communities [66,67,68,69]. The Mantel statistic is calculated between the values in matrices but follows the same equation as Pearson’s correlation. Based on data on the relative abundance of phytoplankton, the Bray–Curtis similarity index was used to generate a biological matrix, and Euclidean distances were used to calculate distance matrices for environmental data. The Monte Carlo method was applied to determine each correlation’s r values for significance using 10,000 random permutations. The Vegan package of R software (version 4.2.2, R Development Core Team, 2022) was used to conduct the Mantel test in this study.

3. Results

3.1. Remote Sensing Estimation Results

Chlorophyll-a concentrations were estimated at 27,324 pixel points in the Shending River backwater area using Level-1C (L1C) MSI images from Sentinel 2 and the Chl-a estimation model. Table 2 displays the average Chl-a concentrations during different seasons in 2021. Upon the removal of abnormal values according to the 95% confidence interval, the Chl-a concentration in summer (75.26 ± 69.23 μg/L) was the highest, followed by that in autumn (48.61 ± 46.70 μg/L). Chl-a concentrations in both seasons showed substantial variation, as demonstrated by the large values of standard deviation. In summary, the abnormal proliferation of phytoplankton in the Shending River backwaters occurred mainly in the summer and autumn in 2021. Figure 2 shows the average chlorophyll a concentration at various pixel points in the Shending River backwater area during different seasons. The results show that the abnormal phytoplankton proliferation in the Shending River backwater area was mainly concentrated in the upstream and near-shore tributary bay areas.

3.2. Phytoplankton Community

The list of phytoplankton species at sampling site 1&2 in the Shending River Backwater are shown in Table S1. Fifty phytoplankton species belonging to six classes were identified at S1 (Figure 3). The species belonging to Chlorophyceae, Bacillariophyceae and Cyanophyceae accounted for 36% (n = 18), 28% (n = 14) and 26% (n = 13) of the identified phytoplankton species in S1, respectively. Moreover, the species belonging to Euglenophyceae, Dinophyceae and Phaeophyceae accounted for 4% (n = 2), 4% (n = 2) and 2% (n = 1) of the phytoplankton species in S1, respectively. Meanwhile, 49 species belonging to seven classes were detected at S2. The species belonging to Chlorophyceae represented approximately 32.65% (n = 16) of the total species; Bacillariophyceae and Cyanophyceae had 12 species each. The three dominant classes at each sampling site were Chlorophyceae, Bacillariophyceae and Cyanophyceae, which together accounted for 81.63–90% of all phytoplankton species; the other four groupings of taxa only contributed 10–18.37%.
Table 3 lists the dominant species at each sampling point along with the dominance values (Y > 0.02) for each species. Nine dominant species were found in this study, according to the dominance values: Cyclotella meneghiniana and Synedra sp. were two of the Bacillariophyceae species, Scenedesmus sp., and Chlorella vulgaris were two of the Chlorophyceae species, Dactylococcopsis acicularis, Microcystis aeruginosa and Oscillatoria tenuis were three of the Cyanophyceae species. Dinophyceae (Peridinium bipes) and Cryptophyceae (Chroomonas acuta) had one dominant species. The most dominant species at S1 and S2 were Dactylococcopsis acicularis (Y = 0.137) and Microcystis aeruginosa (Y = 0.175), respectively.
Figure 4 illustrates the variation in phytoplankton density over time. The total phytoplankton density at S1 and S2 in the Shending River backwater area continuously increased from March to August 2021; it reached its highest value in August (summer). This result is consistent with the changes in Chl-a concentration estimated by remote sensing in Section 3.1. The mean phytoplankton density at locations S1 and S2 was 55.83 and 40.11 cells/L from March to August. The growth rate of phytoplankton density at S1 and S2 was fastest in August; it increased 46.86 and 42.81 times at S1 and S2, respectively, compared with that in July.
Bacillariophyceae had the highest relative abundance (54.94–88.84%) of phytoplankton at S1 from March to June; however, its relative abundance gradually decreased over time (Figure 5). The relative abundance of Chlorophyceae drastically increased from May to June, becoming the second-most dominant alga after diatoms. From July to August, the relative abundance of Chlorophyceae drastically decreased, while Cyanophyceae dominated during these months. Figure 6 shows that Cryptophyceae was the most abundant class at S2 from March to April; however, its abundance gradually decreased in May onwards. The relative abundance of Chlorophyceae gradually increased from April to June, reaching its highest value in May and June, while that of Cyanophyceae increased sharply in July and August.
For the purpose of estimating phytoplankton diversity, the Shannon–Wiener index was utilized (Figure 7). An average of 2.31 was found for the phytoplankton diversity indices at S1, which fluctuated between 0.63 and 3.12. The phytoplankton diversity indices at S2 averaged 1.60 on a scale from 0.18 to 2.55. The Shannon–Wiener index was higher at S1 compared to that at S2, but the difference was not significant.

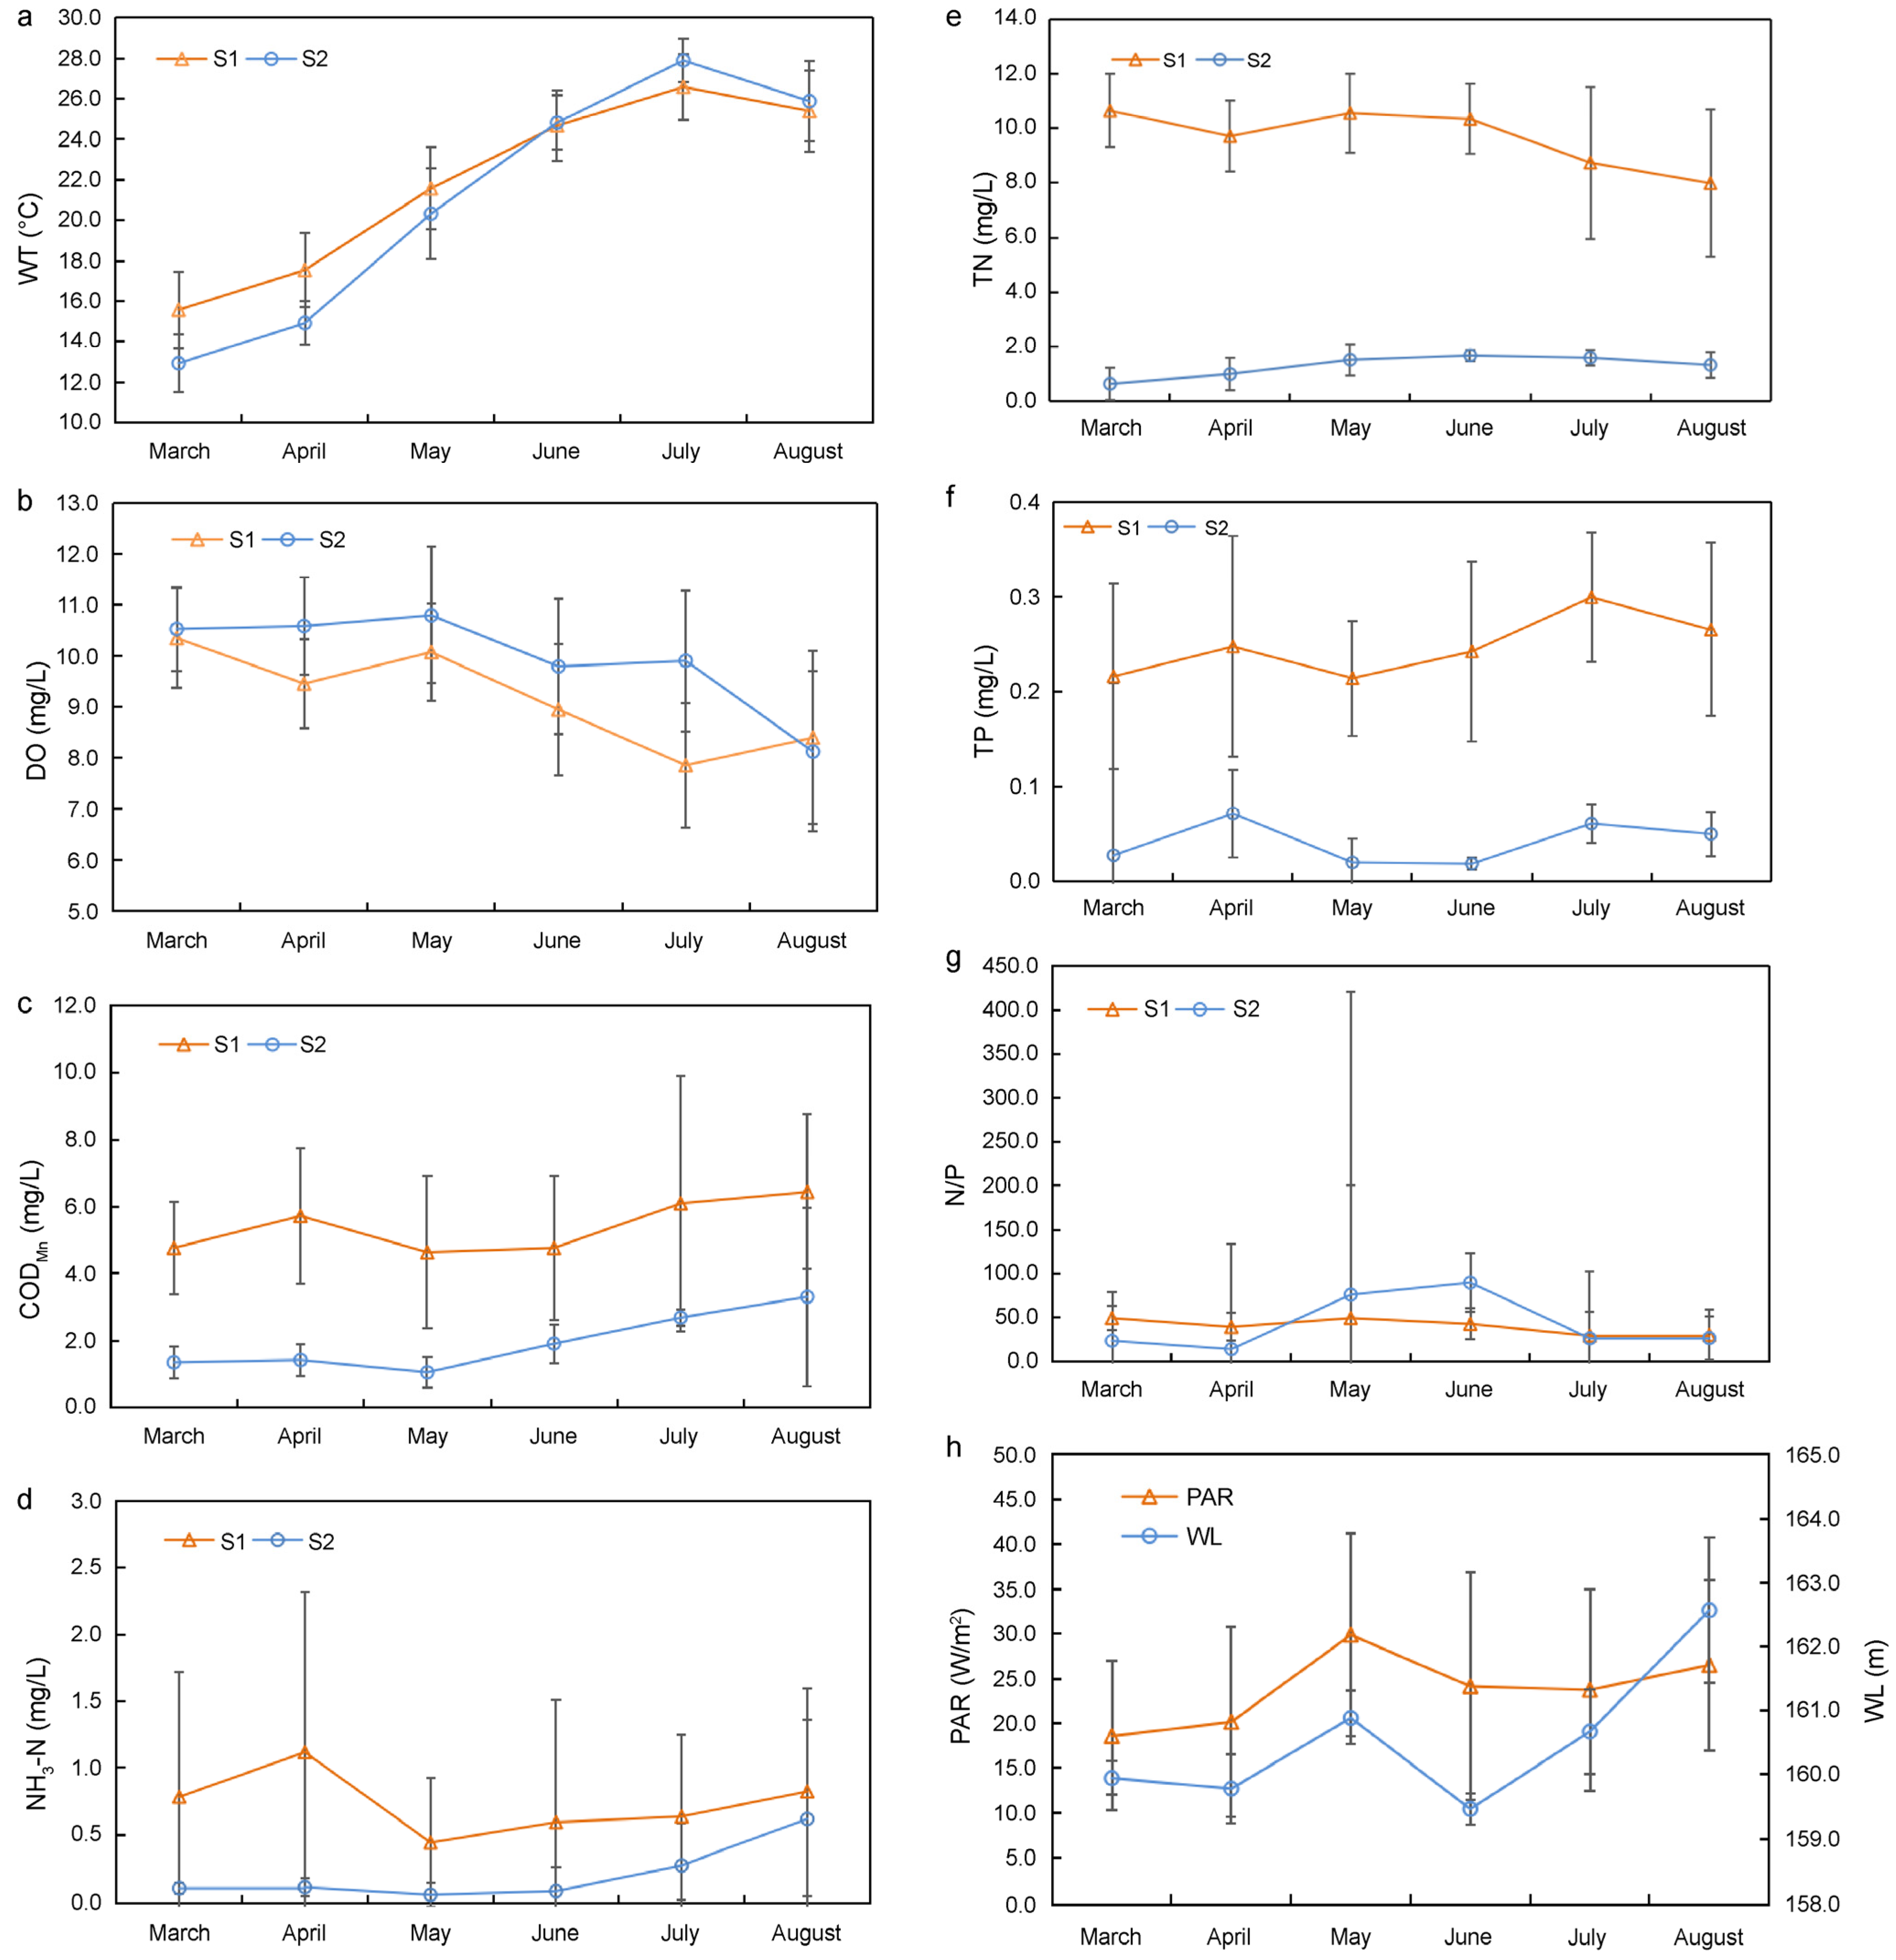
3.3. Environmental Factors

Figure 8a,b shows the key physical parameters at each sampling site over time. Overall, the average WT at both sites gradually increased during the study period, while the average DO gradually decreased. The WT of the Shending River backwater during spring ranges from 12.57 °C to 21.57 °C (average 17.15 °C), while that in summer ranges from 24.68 °C to 27.90 °C (average 25.88 °C). Summer has a significantly higher WT than spring in the Shending River backwater region (p < 0.05).
Figure 8c–g displays the changes in the values of CODMn, NH3-N, TN, TN and N/P at S1 and S2 over the course of the study. From March to August, the mean concentrations of CODMn, NH3-N, TN and TP at S1 were 5.41 mg/L, 0.73 mg/L, 9.67 mg/L and 0.25 mg/L, respectively; meanwhile the mean values of CODMn, NH3-N, TN and TP at S2 were 1.96 mg/L, 0.21 mg/L, 1.30 mg/L and 0.04 mg/L, respectively. The chemical parameters (CODMn, NH3-N, TN, and TP) of S1, located upstream, were significantly higher than those of S2, located downstream (p < 0.05).
Figure 8h shows that the mean PAR significantly and rapidly increased in spring (March to May), reaching its highest value in May (18.56–29.86 W/m2); a high mean PAR was maintained during summer (June to August). Meanwhile, the mean WL continuously increased from March to August; however, it significantly decreased to 159.94 m in June, continued to increase in July and significantly increased to 162.57 m in August (p < 0.05).

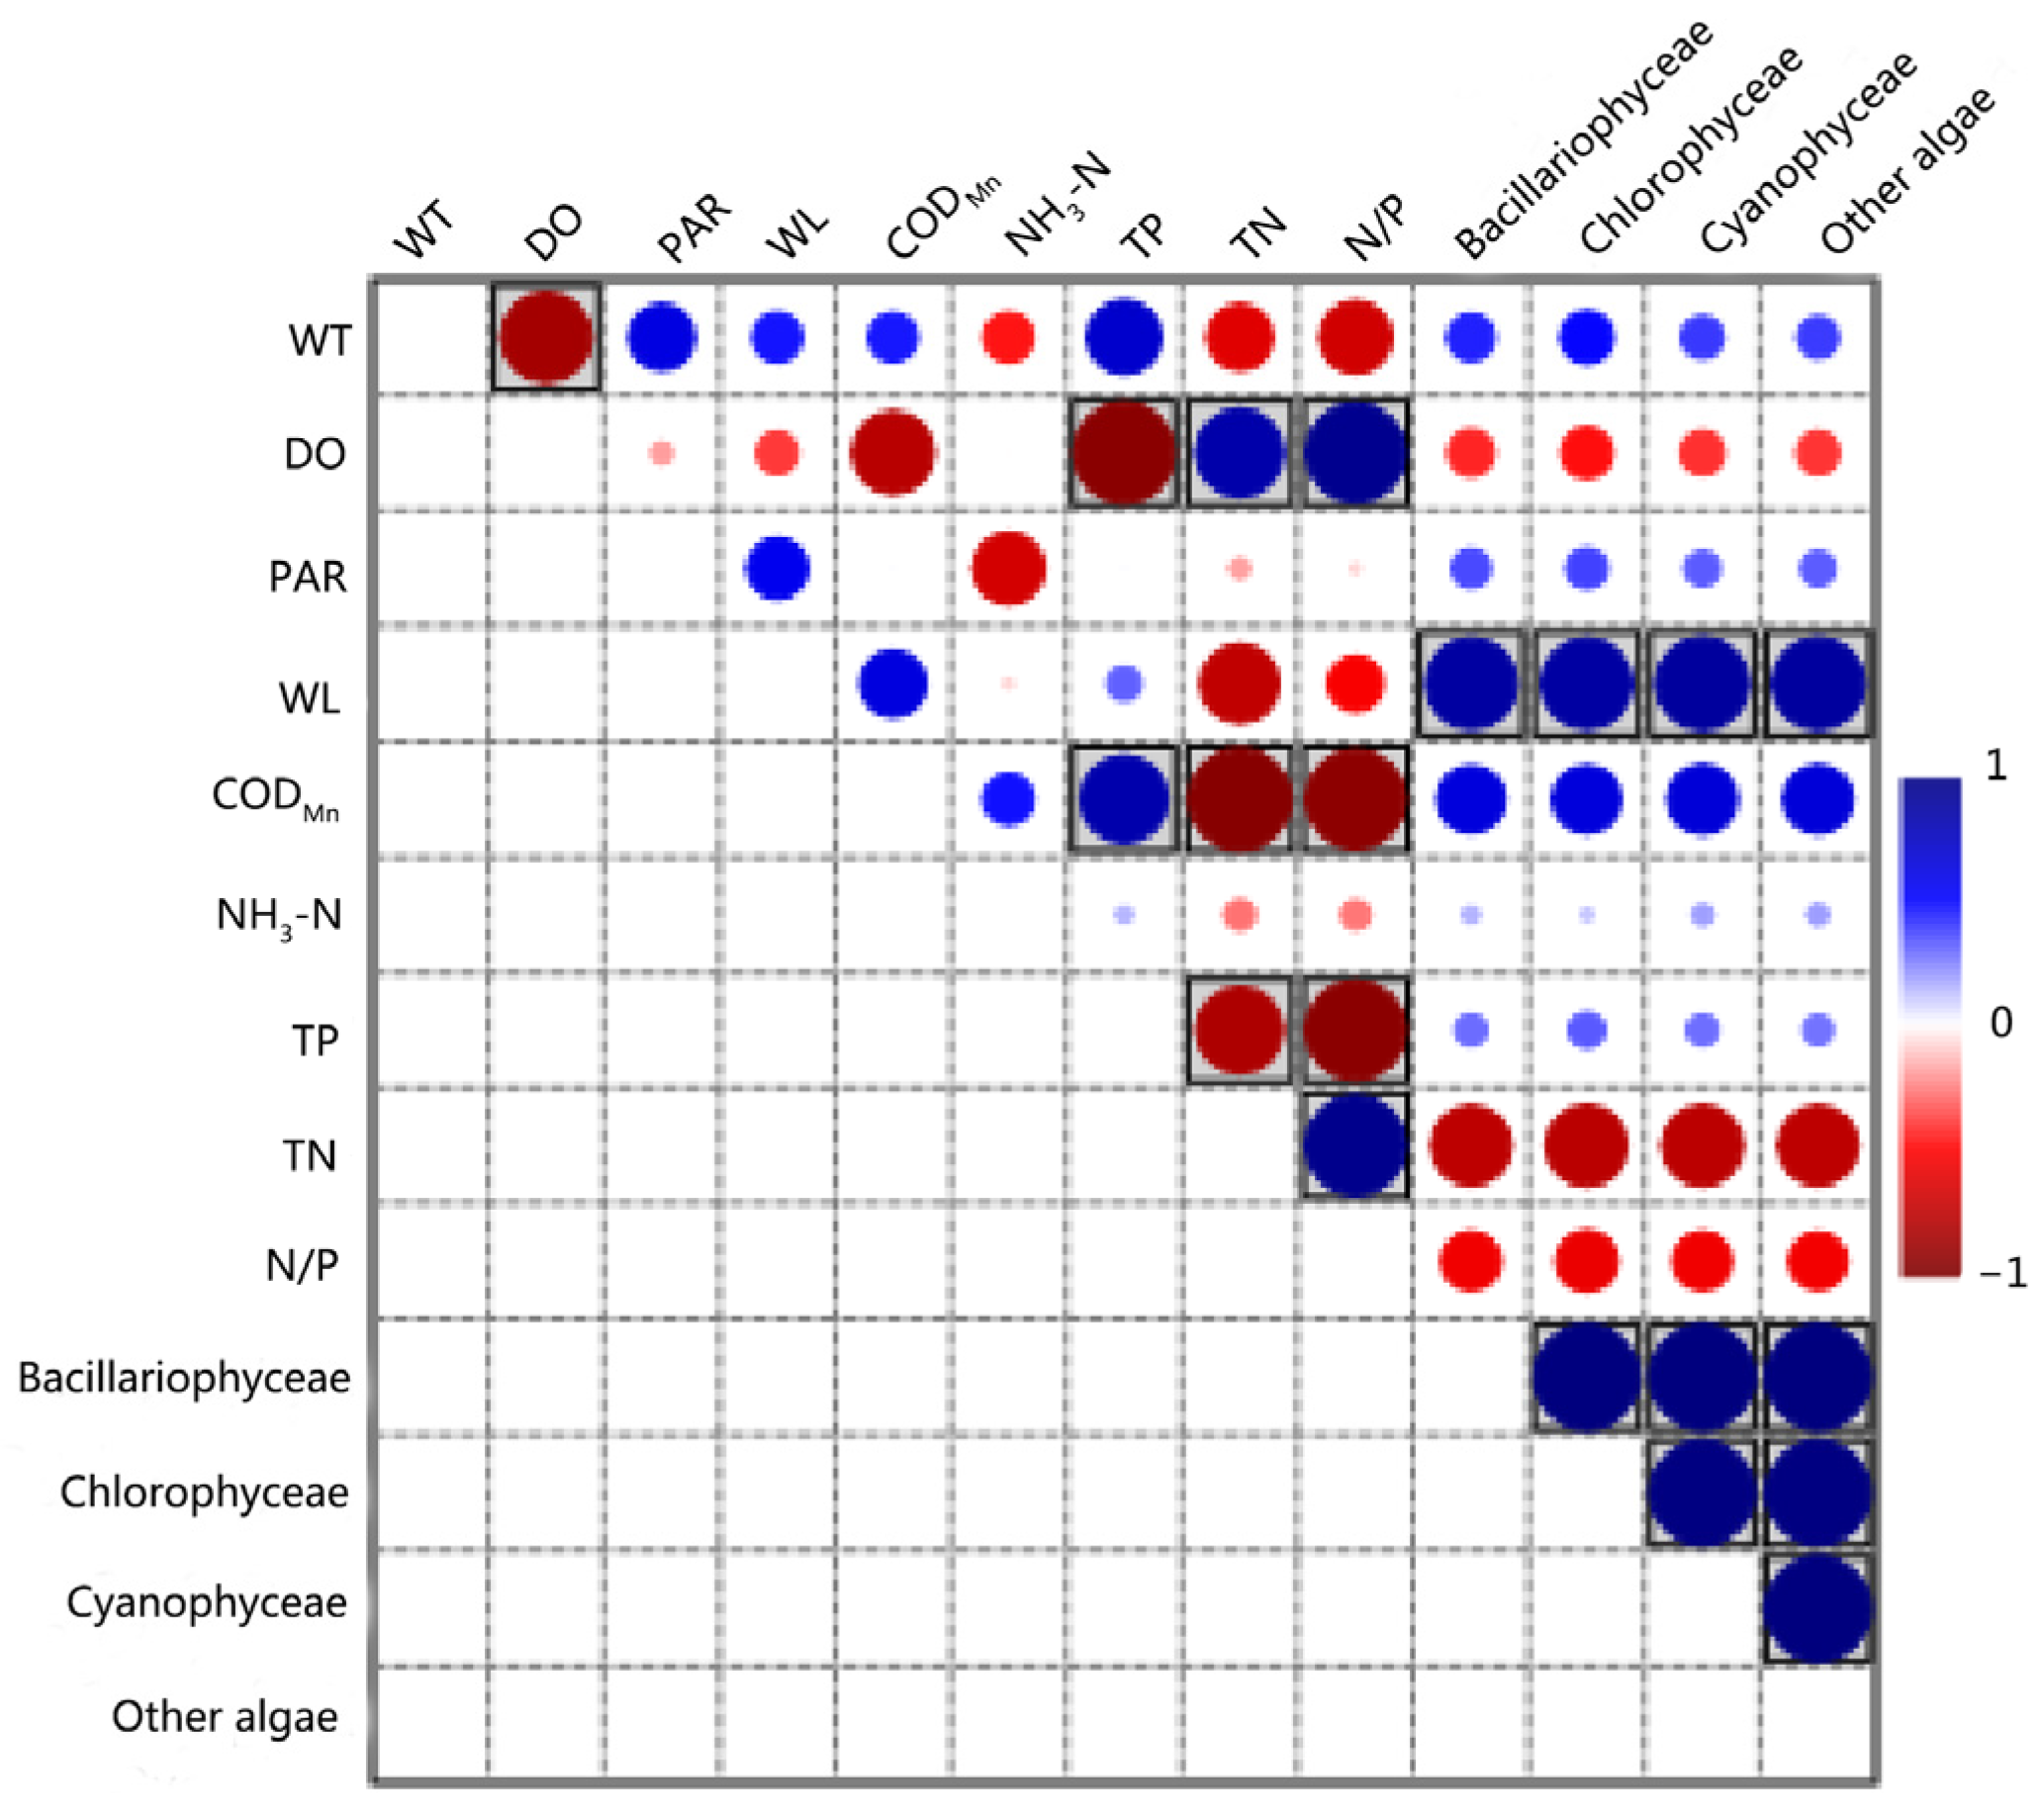
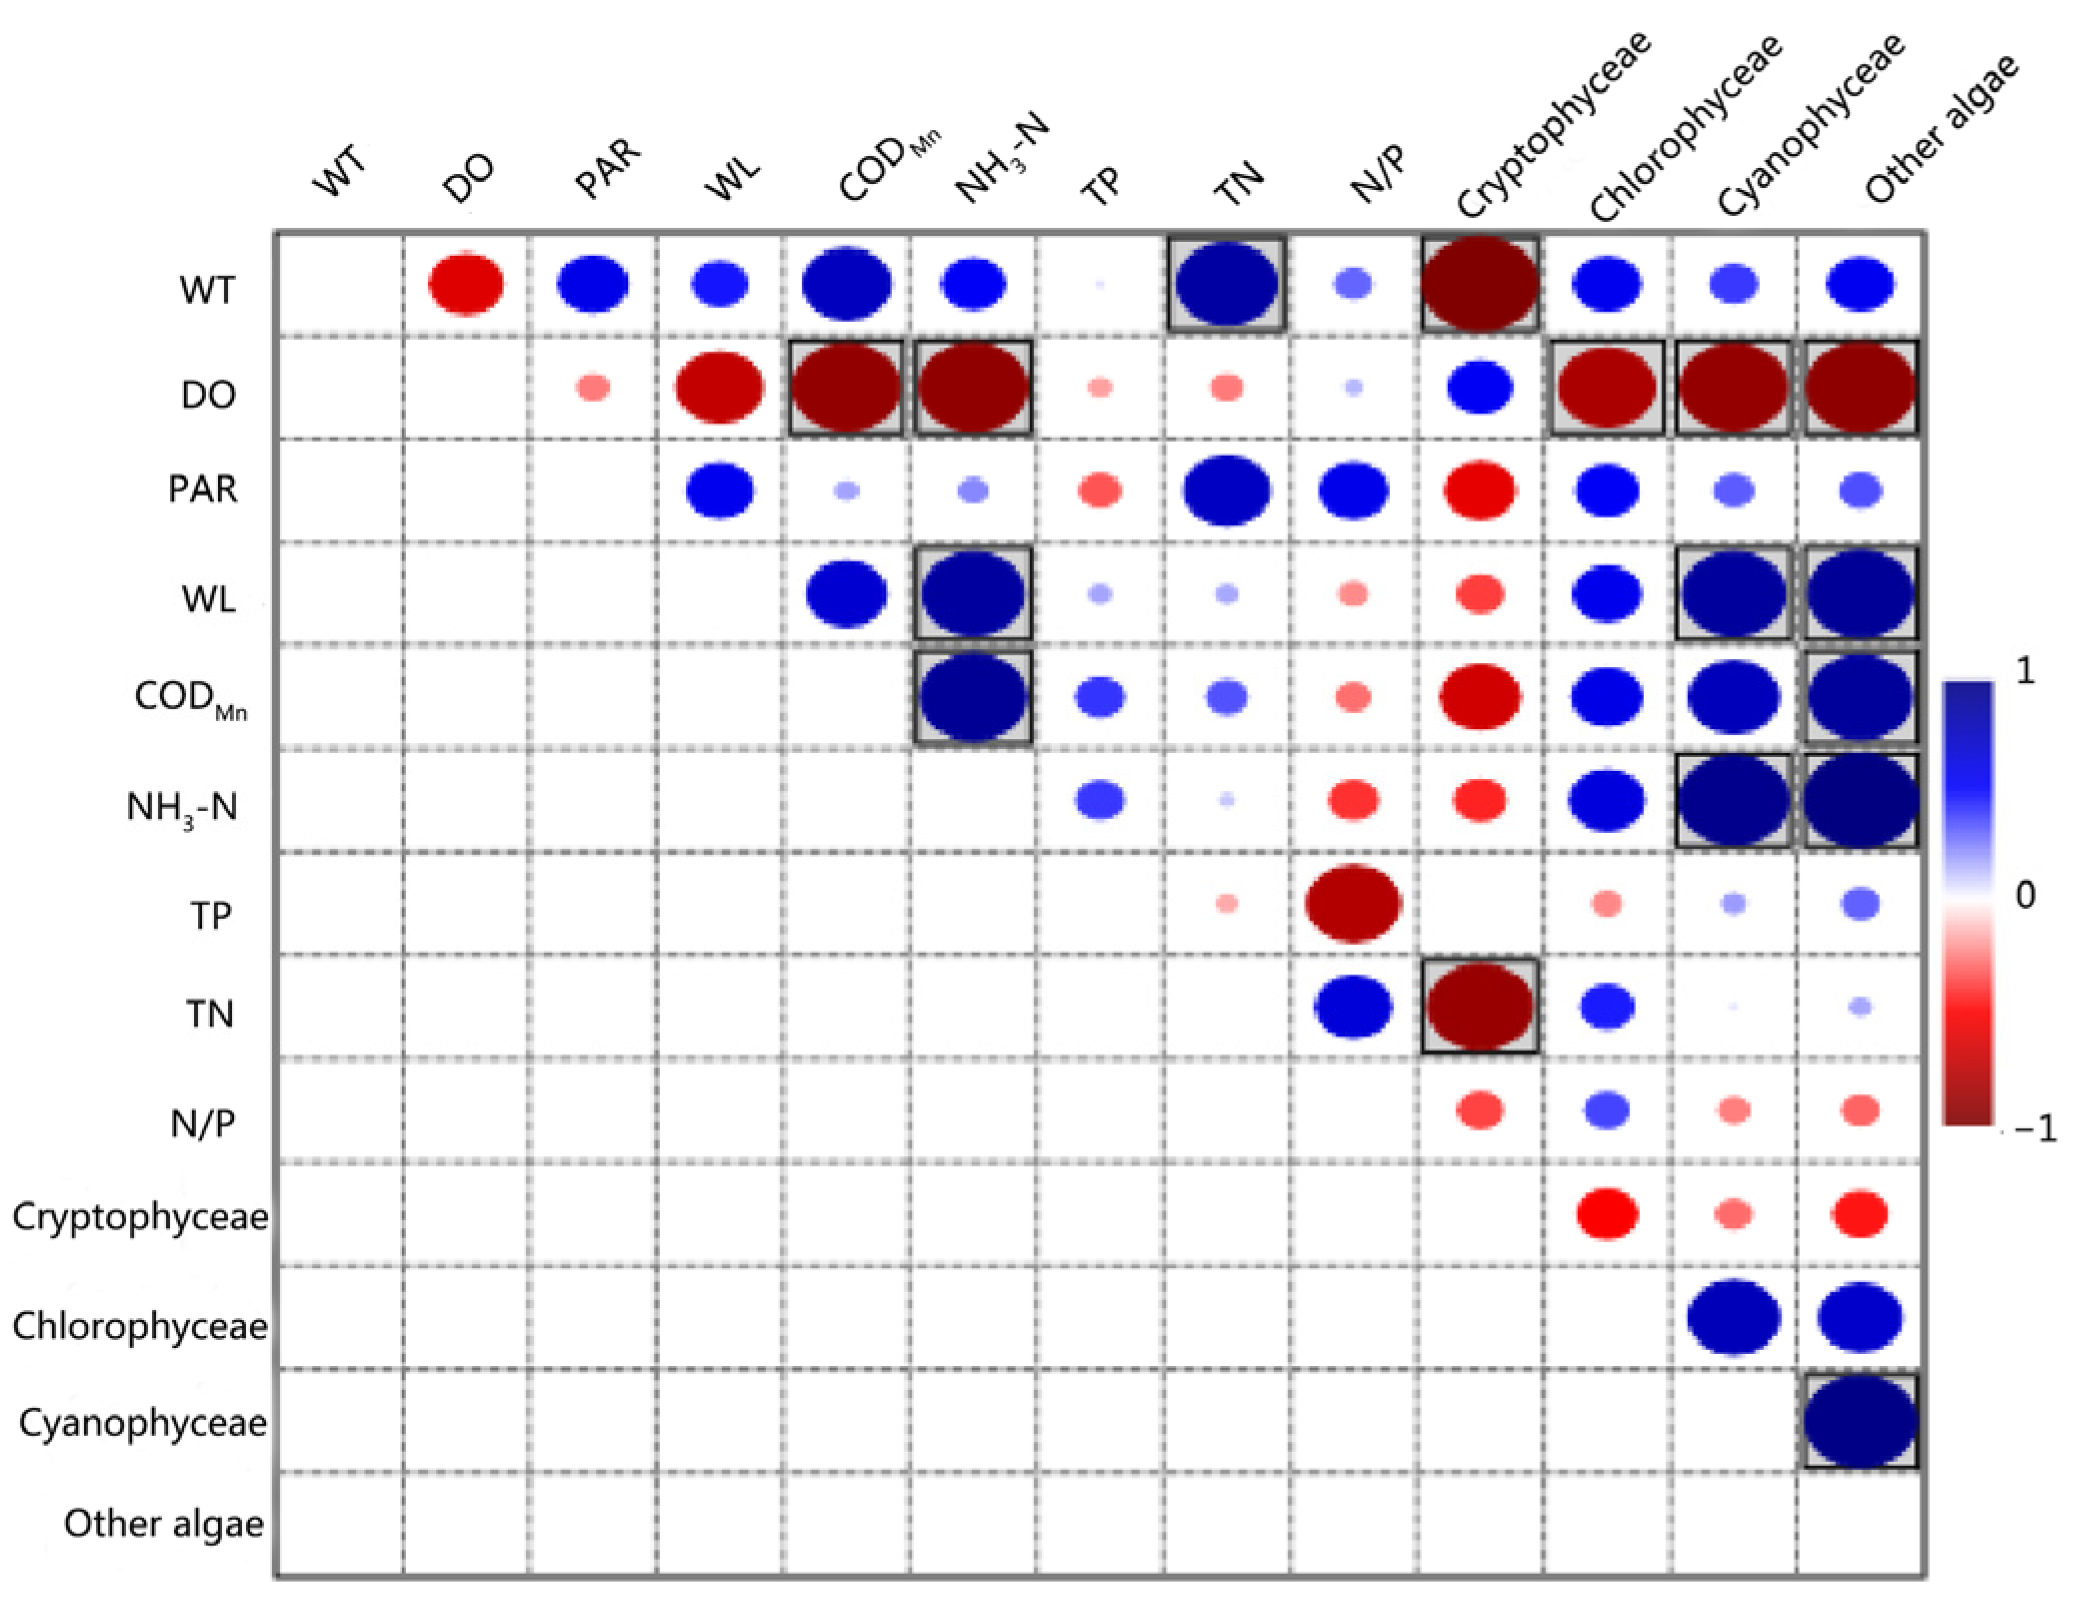
3.4. Results of the Pearson Correlation Analysis

The outcomes of the Pearson correlation analysis between environmental factors and phytoplankton abundance at S1 are displayed in Figure 9 and Table S2. There was a positive relationship between WL and the abundance of Bacillariophyceae, Chlorophyceae and Cyanophyceae (p < 0.05, r > 0.86).
Pearson correlation analysis at S2 is shown in Figure 10 and Table S3. Significant negative correlations (p < 0.05) were noticed between WT (r = −0.99) and TN (r = −0.90) and the abundance of Cryptophyceae. DO and Chlorophyceae abundance showed a significant negative correlation (p < 0.05, r = −0.83). Furthermore, the abundance of Cyanophyceae was significantly (p < 0.05) positively correlated with WL (r = 0.88) and NH3-N (r = 0.94); however, it had a highly negative correlation with DO (p < 0.05, r = −0.92).

3.5. Results of the Mantel Test

Figure 11 and Table S4 shows the Mantel test results comparison between the phytoplankton community and environmental data at S1. WT (Mantel’s r = 0.57, Mantel’s p < 0.05) was significantly correlated with Chlorophyceae, while TN (Mantel’s r = 0.54, Mantel’s p < 0.05) was significantly correlated with Cyanophyceae. Moreover, PAR (Mantel’s r = 0.37, Mantel’s p = 0.07) and WL (Mantel’s r = 0.40, Mantel’s p = 0.06) were correlated with Chlorophyceae separately, but not significantly; WL (Mantel’s r = 0.45, Mantel’s p = 0.09), CODMn (Mantel’s r = 0.40, Mantel’s p = 0.08) and NH3-N (Mantel’s r = −0.45, Mantel’s p = 0.10) were correlated with Cyanophyceae separately, but not significantly; WL (Mantel’s r = 0.84, Mantel’s p = 0.09), TN (Mantel’s r = 0.53, Mantel’s p = 0.15) was strongly correlated with Bacillariophyceae separately, but also not significantly.
Figure 12 and Table S5 shows the Mantel test results comparison between the phytoplankton community and environmental data for S2. Significant positive correlations were found between WT and Cryptophyceae (Mantel’s r = 0.56, Mantel’s p < 0.05) and between NH3-N and Cyanophyceae (Mantel’s r = 0.56, Mantel’s p < 0.05). Moreover, the Mantel’s r value between Chlorophyceae and TN, and the Mantel’s r value between Cyanophyceae and DO, WL, CODMn was greater than 0.30 separately, but not significantly.

4. Discussion

4.1. Overall Spatiotemporal Distribution Characteristics in the Shending River Backwater Area

According to the Chl-a concentration estimation of remote sensing result, the phytoplankton in the Shending River backwater area seemed to proliferate in spring and peak in summer; however, their abundance gradually decreased after autumn and remained relatively low in winter. The Chl-a concentration in spring and winter was relatively low (especially in winter, the Chl-a concentration remained below 20 μg/L), and there was no significant spatial distribution change. The Chl-a concentration in summer was the highest among the four seasons; it also had the greatest variation (an increase of 36.49 μg/L compared with that in spring), and the spatial distribution difference in summer was also the most significant. The Chl-a concentration was significantly higher upstream of the Shending River backwater area (approximately 100 μg/L) than it was downstream (approximately 40 μg/L) in the summer, using S1 and S2 sampling sites as examples. The Chl-a concentration gradually decreased in autumn; however, there were still significantly high-value areas in some nearshore reservoir areas (approximately 50 μg/L). In line with the Organization for Economic Cooperation and Development, eutrophication single factor Chl-a evaluation standard (ρ(Chl-a) < 3 mg/L is considered oligotrophic; 3 mg/L ≤ ρ(Chl-a) < 11 mg/L is considered mesotrophic; 11 mg/L ≤ ρ(Chl-a) <78 mg/L is considered eutrophic; and ρ(Chl-a) ≥ 78 mg/L is considered severely eutrophic) [70], the Shending River backwater area was generally in a eutrophic state as of 2021. Meanwhile, some areas upstream of the Shending River backwater area in summer were considered severely eutrophic.
Overall, the phytoplankton in the Shending River backwater area were most abundant in summer and autumn; they were also most abundant in the upstream of the backwater area and the near-shore tributary bay. Previous research on the spatiotemporal dynamic changes in phytoplankton abundance in the Danjiangkou Reservoir also showed that the phytoplankton density reached its highest value in summer (August) [71], according to this study’s findings. Moreover, prior studies on Danjiangkou Reservoir Bay Chl-a concentration demonstrated that the reservoir bay is more vulnerable to eutrophication and algal blooms as a result of factors like the local watershed landscape and water environment [72]. The spatiotemporal characteristics of phytoplankton in the Shending River backwater area may have resulted from water bloom outbreaks. Further dynamic analyses based on specific hydrological and meteorological data and physical and chemical parameters of water are required to analyze the causes of water bloom.

4.2. Phytoplankton Community in the Backwater of the Shending River in Spring and Summer

In spring, the upstream region of the Shending River backwater was mainly dominated by Bacillariophyceae (the dominant species were Cyclotella meneghiniana and Synedra sp.), whereas the downstream region was dominated by Cryptophyceae (the dominant species was Chroomonas acuta). In summer, Chlorophyceae (the dominant species were Scenedesmus sp. and Chlorella vulgaris) and Cyanophyceae (the dominant species were Dactylococcopsis acicularis, Oscillatoria tenuis and Microcystis aeruginosa) became dominant; the occurrence of Cyanophyceae increased dramatically at the conclusion of summer. The Shending River backwater area is located in a subtropical humid area, which belongs to the transitional zone between tropical and temperate zones. The phytoplankton communities in the Shending River’s backwater have seasonal successional traits that are consistent with the Plankton Ecology Group (PEG) model, which was summarized by analyzing the plankton and physical and chemical factors of many temperate nutrient lakes [73]. The phytoplankton community succession process in the PEG model over the seasons can be generally described as follows: Cryptophyceae and Bacillariophyceae dominate winter and spring, Chlorophyceae in summer and Cyanophyceae in late summer and early fall.
When compared to the Danjiangkou Reservoir (approximately 106 cells/L in spring and summer), the Shending River backwater region (107–108 cells/L in spring and summer, except in August, when the density exceeded 108 cells/L) had a greater phytoplankton density [71]. A water body’s trophic state can be determined by the phytoplankton density [74]. Thus, the Shending River backwater area is mostly in a moderately eutrophic state during spring and summer, based on the average algal cell density (4.80 × 10⁷ cells/L) of this water body. Water quality is also indicated by the Shannon–Wiener index of phytoplankton diversity [75,76,77]; an ecosystem with a high diversity index is considered to be healthy, while one with a low value is thought to be less so. According to this study’s average phytoplankton diversity index (1.95) for the Shending River backwater area, it was moderately polluted and had a less healthy ecosystem, which was consistent with the findings of the evaluation of algae density. Furthermore, the Shending River backwater area’s phytoplankton density was greater in summer than spring and upstream than downstream, which is consistent with the results of remote sensing.
Based on the previous results, it was found that the Shannon–Wiener index decreased significantly in the Shending River backwater, despite a rapid increase in algal density during summer. Summer outbreaks of harmful cyanobacterial blooms in the Shending River backwater may be related to this phenomenon. The Shending River backwater area experienced rapid growth of cyanobacteria due to high summer temperatures and sufficient N,P nutrients [22,23]. Some cyanobacteria, such as Microcystis aeruginosa and Oscillatoria tenuis, have unique biological characteristics that contribute to their rapid growth, including: (1) Microcystis aeruginosa can maintain a colonial form [24], which makes them less susceptible to predation [78], increases their buoyancy [79] and provides a protective effect through the surrounding extracellular polysaccharides [80], thus enhancing their competitiveness. (2) Microcystis aeruginosa and Oscillatoria tenuis can produce cyanotoxins to protect themselves from grazing by zooplankton [80] and to inhibit the growth of phytoplankton competitors [81,82]. (3) Microcystis aeruginosa and Oscillatoria tenuis have gas vesicles that enable them to adjust their buoyancy, allowing them to acquire light at the water surface and nutrients in deeper waters [83,84]. Due to the competitive advantage of Microcystis aeruginosa and Oscillatoria tenuis, other phytoplankton growth is inhibited, resulting in a decline in phytoplankton diversity and the health of the aquatic ecosystem.

4.3. Environmental Variables Impacting the Proliferation of Phytoplankton in the Shending River Backwater Area

According to the findings of the Pearson correlation study, WL exhibited a significant positive relationship with each of the phytoplankton classes at S1 and S2, except Cryptophyceae and Chlorophyceae. Compared with other water bodies, the abnormal proliferation of phytoplankton caused by rising water levels is a unique phenomenon in backwaters. However, the impact of WL on phytoplankton is universal compared with that in different backwater areas. In this study, owing to long-term rainfall and the Danjiangkou Reservoir storage operations, the WL and phytoplankton density in the Shending River backwater area increased continuously from spring to summer. It is generally believed that, as WL increases, water flow slows down, the water body diffusion capacity decreases and the retention time of pollutants is prolonged, leading to frequent eutrophication and abnormal phytoplankton proliferation in the backwaters of inlet tributaries [36,37]. Overall, rising water levels can lead to the abnormal proliferation of phytoplankton, and this impact is widespread and does not specifically affect individual phytoplankton species.
WT may be a key environmental element influencing phytoplankton growth and abundance [35,85,86]. Previous research has revealed that low temperature conditions are generally not conducive to the survival of algae, and most algae exist in the form of spores [87]. When WT gradually increases, especially more than 18 °C, the growth rate of various algae also increases to a different extent [88]. According to this study’s Pearson correlation analysis, all dominant phytoplankton classes, such as Bacillariophyceae, Chlorophyceae and Cryptophyceae, were positively correlated with WT. Therefore, summer phytoplankton density was thus considerably greater than spring phytoplankton density because summer WT was substantially greater than spring WT. Simultaneously, different phytoplankton species have different preferences and adaptabilities to temperature, which may explain the different phytoplankton community structures under different WT conditions. Previous studies have shown that Bacillariophyceae and Cryptophyceae can adapt to lower water temperatures [89], whereas Chlorophyceae and Cyanophyceae prefer higher water temperatures [22,85]. Such previous findings explain why Bacillariophyceae and Cryptophyceae were dominant in the Shending River backwater area in spring, while Chlorophyceae and Cyanophyceae were dominant in summer. The Pearson correlation analysis and Mantel test revealed that Chlorophyceae and Cryptophyceae were significantly correlated with WT, possibly because these classes are more sensitive to WT [90].
According to earlier research, when the N/P ratio is below 16, nitrogen is the limiting nutrient, whereas beyond 16, phosphorous is [51]. In the Shending River backwater area, the average N/P ratio (41.36) was higher than the cutoff point of 16, indicating that phosphorus is a nutrient that limits growth. However, this study found no significant correlation between phosphorus and phytoplankton abundance, and its findings were consistent with those of [2]. Due to the possibility that high amounts of nutrients in eutrophic water may go past phytoplankton’s capacity to absorb them for assimilation, Paerl et al. proposed that the N/P ratio theory is more applicable for water bodies with low nutrient levels [91]. Phosphorus also plays a crucial role in the initial phases of algal bloom outbreaks and is likely to stop being a limiting nutrient as soon as it accumulates in sediments [92]. As determined by the Mantel test, species of Cyanophyceae were found in the upper Shending River backwater area had a significant positive correlation with TN, whereas those in the lower reaches had a significant positive correlation with NH3-N. Thus, nitrogen affects phytoplankton communities more than phosphorus, and watershed management should limit nitrogen input to prevent eutrophication. The study on the driving factors of algal blooms in the backwater area of the Xiangxi River, a tributary of the Three Gorges Reservoir, also found that nitrogen has a stronger impact on algal blooms than phosphorus [1].
The phytoplankton density in the upper reaches of the Shending River backwater area was significantly higher than that in the lower reaches due to the higher concentration of nutrients (CODMn, NH3-H, TN, and TP) in the upper reaches. Furthermore, the relatively high phytoplankton density in bays near the shore in the backwater area is speculated to be due to the proximity of these areas to the shore, which led to slower water flow, weaker hydraulic exchange and longer residence time of the pollutants.

4.4. Suggestions on Water Bloom Control in the Shending River Backwater Area

In summer, especially August, cyanobacteria drastically increased in the Shending River backwater area. The dominant species, Microcystis aeruginosa, is a common cyanobacterial bloom that produces microcystins, which cause liver tissue damage in humans [93]. Therefore, we believe that bloom control should focus on controlling cyanobacterial blooms in the backwater of the Shending River. The Pearson correlation analysis and Mantel test revealed that WL and nitrogen were significantly correlated with cyanobacteria abundance. Frequent opening of the sluice to reduce the water level may affect the normal process of water storage and power generation in the Danjiangkou Reservoir area; therefore, it may not be practical. Controlling the input of nitrogen pollutants into the backwater of the Shending River may be a method that can be implemented at present. The four wastewater treatment plants in the Shending River Basin may be the main sources of nitrogen pollutants. The effluent from these projects is discharged directly into the Shending River, and the required TN concentration is less than 15 mg/L. Therefore, we suggest that TN removal should be further strengthened in the sewage treatment plants in the Shending River Basin. To better guide the formulation of deep nitrogen removal targets for the tailwater of sewage treatment plants in the Shending River Basin and predict bloom outbreaks, we suggest that further research and application of water quality models in the Danjiangkou Reservoir and the Shending River should be conducted in the future.

5. Conclusions

The Shending River backwater area was moderately polluted and had an unhealthy ecosystem in 2021. Especially the summer, the Shending River backwater area experienced a significant increase in algal density, with an average of 4.80 × 10⁷ cells/L (reaching as high as 3.16 × 10⁸ cells/L in August), and an average chlorophyll-a concentration of 41.26 μg/L. Spatially, the upper reaches and near-shore embayments exhibited higher chlorophyll-a concentrations compared to the rest of the area. These areas were prone to algae enrichment.
The Shending River’s backwater phytoplankton communities follow the PEG model for seasonal succession: In spring, the upstream region of the Shending River backwater was dominated by Bacillariophyceae, whereas the downstream region was dominated by Cryptophyceae. In the summer, Chlorophyceae and Cyanophyceae emerged as the dominant phytoplankton groups, whereas Cyanophyceae became dominant at the end of summer.
The Pearson correlation analysis and Mantel test indicate that WL, WT, NH3-N and TN are the main factors causing the spatiotemporal distribution of phytoplankton in the Shending River backwater area.
Intensive nitrogen removal from the tailwater of sewage treatment plants may be considered a feasible measure to prevent cyanobacterial bloom in the Shending River backwater of the Danjiangkou Reservoir.

Supplementary Materials

The following supporting information can be downloaded at: https://www.mdpi.com/article/10.3390/w16020326/s1, Table S1. The list of phytoplankton species at sampling site 1&2 in the Shending River Backwater (March–August 2021). Table S2. Results of the Pearson correlation analysis at sampling site 1. Table S3. Results of the Pearson correlation analysis at sampling site 2. Table S4. Mantel test result at sampling site 1. Table S5. Mantel test result at sampling site 2.

Author Contributions

Data curation, B.W. and L.L.; Formal analysis, B.W.; Investigation, L.M.; Methodology, H.Z.; Supervision, H.Z.; Validation, L.M.; Visualization, L.L.; Writing—original draft, B.W. and L.L.; Writing—review and editing, H.Z. All authors have read and agreed to the published version of the manuscript.

Funding

This research was funded by the Chinese National Natural Science Foundation (51308006).

Data Availability Statement

Data are contained within the article and supplementary materials.

Acknowledgments

The authors are grateful to the anonymous reviewers for their helpful comments and suggestions.

Conflicts of Interest

Author L.L. was employed by Shenzhen Bolvzhe Ecological Technology Co., Ltd. and L.M. was employed by Hunan Xinyuan Environmental Technology Co., Ltd. The remaining authors declare that the research was conducted in the absence of any commercial or financial relationships that could be construed as a potential conflict of interest.

References

  1. Su, Y.; Hu, M.; Wang, Y.; Zhang, H.; He, C.; Wang, Y.; Wang, D.; Wu, X.; Zhuang, Y.; Hong, S.; et al. Identifying key drivers of harmful algal blooms in a tributary of the Three Gorges Reservoir between different seasons: Causality based on data-driven methods. Environ. Pollut. 2022, 297, 118759. [Google Scholar] [CrossRef]
  2. Li, L.; Li, Q.; Chen, J.; Wang, J.; Jiao, S.; Chen, F. Temporal and spatial distribution of phytoplankton functional groups and role of environment factors in a deep subtropical reservoir. J. Oceanol. Limnol. 2018, 36, 761–771. [Google Scholar] [CrossRef]
  3. Tian, Y.; Jiang, Y.; Liu, Q.; Xu, D.; Liu, Y.; Song, J. The impacts of local and regional factors on the phytoplankton community dynamics in a temperate river, northern China. Ecol. Indic. 2021, 123, 107352. [Google Scholar] [CrossRef]
  4. Zhang, Y.; Ban, X.; Li, E.; Wang, Z.; Xiao, F. Evaluating ecological health in the middle-lower reaches of the Hanjiang River with cascade reservoirs using the Planktonic index of biotic integrity (P-IBI). Ecol. Indic. 2020, 114, 106282. [Google Scholar] [CrossRef]
  5. Minaudo, C.; Abonyi, A.; Leitao, M.; Lancon, A.M.; Floury, M.; Descy, J.P.; Moatar, F. Long-term impacts of nutrient control, climate change, and invasive clams on phytoplankton and cyanobacteria biomass in a large temperate river. Sci. Total Environ. 2021, 756, 144074. [Google Scholar] [CrossRef] [PubMed]
  6. Costa, M.R.A.; Cardoso, M.M.L.; Selmeczy, G.B.; Padisák, J.; Becker, V. Phytoplankton functional responses induced by extreme hydrological events in a tropical reservoir. Hydrobiologia 2023, 1–19. [Google Scholar] [CrossRef] [PubMed]
  7. Abirhire, O.; Davies, J.M.; Imtiazy, N.; Hunter, K.; Emmons, S.; Beadle, J.; Hudson, J. Response of phytoplankton community composition to physicochemical and meteorological factors under different hydrological conditions in Lake Diefenbaker. Sci. Total Environ. 2023, 856 Pt 2, 159–210. [Google Scholar] [CrossRef] [PubMed]
  8. Daines, S.J.; Clark, J.R.; Lenton, T.M. Multiple environmental controls on phytoplankton growth strategies determine adaptive responses of the N:P ratio. Ecol. Lett. 2014, 17, 414–425. [Google Scholar] [CrossRef]
  9. Zhang, H.K.; Min, F.L.; Cui, H.R.; Peng, X.; Zhang, X.Y.; Zhang, S.X.; Li, Z.X.; Ge, F.J.; Zhang, L.; Wu, Z.B.; et al. Characteristics of Phytoplankton Communities and Key Impact Factors in Three Types of Lakes in Wuhan. Huan Jing Ke Xue 2023, 44, 2093–2102. [Google Scholar] [CrossRef]
  10. Serre-Fredj, L.; Chasselin, L.; Jolly, O.; Jacqueline, F.; Claquin, P. Colimitation assessment of phytoplankton growth using a resource use efficiency approach in the Bay of Seine (French-English Channel). J. Environ. Manag. 2022, 306, 114487. [Google Scholar] [CrossRef]
  11. Paver, S.F.; Hayek, K.R.; Gano, K.A.; Fagen, J.R.; Brown, C.T.; Davis-Richardson, A.G.; Crabb, D.B.; Rosario-Passapera, R.; Giongo, A.; Triplett, E.W.; et al. Interactions between specific phytoplankton and bacteria affect lake bacterial community succession. Environ. Microbiol. 2013, 15, 2489–2504. [Google Scholar] [CrossRef] [PubMed]
  12. Wang, K.; Mou, X.; Cao, H.; Struewing, I.; Allen, J.; Lu, J. Co-occurring microorganisms regulate the succession of cyanobacterial harmful algal blooms. Environ. Pollut. 2021, 288, 117682. [Google Scholar] [CrossRef]
  13. Rosinska, J.; Kozak, A.; Dondajewska, R.; Goldyn, R. Cyanobacteria blooms before and during the restoration process of a shallow urban lake. J. Environ. Manag. 2017, 198 Pt 1, 340–347. [Google Scholar] [CrossRef] [PubMed]
  14. Znachor, P.; Nedoma, J.; Hejzlar, J.; Seďa, J.; Komárková, J.; Kolář, V.; Mrkvička, T.; Boukal, D.S. Changing environmental conditions underpin long-term patterns of phytoplankton in a freshwater reservoir. Sci. Total Environ. 2020, 710, 135626. [Google Scholar] [CrossRef] [PubMed]
  15. Chao, C.; Lv, T.; Wang, L.; Li, Y.; Han, C.; Yu, W.; Yan, Z.; Ma, X.; Zhao, H.; Zuo, Z.; et al. The spatiotemporal characteristics of water quality and phytoplankton community in a shallow eutrophic lake: Implications for submerged vegetation restoration. Sci. Total Environ. 2022, 821, 153460. [Google Scholar] [CrossRef]
  16. Cheng, W.; Hwang, S.; Guo, Q.; Qian, L.; Liu, W.; Yu, Y.; Liu, L.; Tao, Y.; Cao, H. The Special and General Mechanism of Cyanobacterial Harmful Algal Blooms. Microorganisms 2023, 11, 987. [Google Scholar] [CrossRef]
  17. Wang, Z.; Akbar, S.; Sun, Y.; Gu, L.; Zhang, L.; Lyu, K.; Huang, Y.; Yang, Z. Cyanobacterial dominance and succession: Factors, mechanisms, predictions, and managements. J. Environ. Manag. 2021, 297, 113281. [Google Scholar] [CrossRef] [PubMed]
  18. Van de Waal, D.B.; Gsell, A.S.; Harris, T.; Paerl, H.W.; de Senerpont Domis, L.N.; Huisman, J. Hot summers raise public awareness of toxic cyanobacterial blooms. Water Res. 2023, 249, 120817. [Google Scholar] [CrossRef]
  19. Dokulil, M.T.; Teubner, K. Cyanobacterial dominance in lakes. Hydrobiologia 2000, 438, 1–12. [Google Scholar] [CrossRef]
  20. Foysal, M.J.; Timms, V.; Neilan, B.A. Dynamics of the benthic and planktic microbiomes in a Planktothrix-dominated toxic cyanobacterial bloom in Australia. Water Res. 2023, 249, 120980. [Google Scholar] [CrossRef]
  21. Lefler, F.W.; Barbosa, M.; Zimba, P.V.; Smyth, A.R.; Berthold, D.E.; Laughinghouse, H.D. Spatiotemporal diversity and community structure of cyanobacteria and associated bacteria in the large shallow subtropical Lake Okeechobee (Florida, United States). Front. Microbiol. 2023, 14, 1219261. [Google Scholar] [CrossRef] [PubMed]
  22. Paerl, H.W.; Huisman, J. Climate. Blooms like it hot. Science 2008, 320, 57–58. [Google Scholar] [CrossRef] [PubMed]
  23. Yin, X.; Yan, G.; Wang, X.; Huang, D.; Li, L. Spatiotemporal Distribution Pattern of Phytoplankton Community and Its Main Driving Factors in Dongting Lake, China—A Seasonal Study from 2017 to 2019. Water 2022, 14, 1674. [Google Scholar] [CrossRef]
  24. Xiao, M.; Li, M.; Reynolds, C.S. Colony formation in the cyanobacterium Microcystis. Biol. Rev. Camb. Philos. Soc. 2018, 93, 1399–1420. [Google Scholar] [CrossRef] [PubMed]
  25. Zhou, Q.; Lu, N.; Gu, L.; Sun, Y.; Zhang, L.; Huang, Y.; Chen, Y.; Yang, Z. Daphnia enhances relative reproductive allocation in response to toxic microcystis: Changes in the performance of parthenogenetic and sexual reproduction. Environ. Pollut. 2020, 259, 113890. [Google Scholar] [CrossRef] [PubMed]
  26. Lu, J.; Zhu, B.; Struewing, I.; Xu, N.; Duan, S. Nitrogen-phosphorus-associated metabolic activities during the development of a cyanobacterial bloom revealed by metatranscriptomics. Sci. Rep. 2019, 9, 2480. [Google Scholar] [CrossRef]
  27. He, P.; Cai, X.; Chen, K.; Fu, X. Identification of small RNAs involved in nitrogen fixation in Anabaena sp. PCC 7120 based on RNA-seq under steady state conditions. Ann. Microbiol. 2020, 70, 4. [Google Scholar] [CrossRef]
  28. Yu, X.P.; Chen, Y.W.; Liu, J.F.; Wang, J.J.; Xu, G.F.; Zou, H.Y.; Chen, N.; Xia, Y. Analysis on the Current Situation of Phytoplankton in the Typical River-Lake Ecotone of Lake Poyang. Huan Jing Ke Xue 2023, 44, 4954–4964. [Google Scholar] [CrossRef]
  29. Chen, S.; He, H.; Zong, R.; Liu, K.; Yan, M.; Xu, L.; Miao, Y. Geographical Patterns of Algal Communities Associated with Different Urban Lakes in China. Int. J. Environ. Res. Public. Health 2020, 17, 1009. [Google Scholar] [CrossRef]
  30. Peng, X.; Zhang, L.; Li, Y.; Lin, Q.; He, C.; Huang, S.; Li, H.; Zhang, X.; Liu, B.; Ge, F.; et al. The changing characteristics of phytoplankton community and biomass in subtropical shallow lakes: Coupling effects of land use patterns and lake morphology. Water Res. 2021, 200, 117235. [Google Scholar] [CrossRef]
  31. Mao, Z.; Gu, X.; Cao, Y.; Luo, J.; Zeng, Q.; Chen, H.; Jeppesen, E. Pelagic energy flow supports the food web of a shallow lake following a dramatic regime shift driven by water level changes. Sci. Total Environ. 2021, 756, 143642. [Google Scholar] [CrossRef]
  32. Zhang, Y.; Hu, M.; Shi, K.; Zhang, M.; Han, T.; Lai, L.; Zhan, P. Sensitivity of phytoplankton to climatic factors in a large shallow lake revealed by column-integrated algal biomass from long-term satellite observations. Water Res. 2021, 207, 117786. [Google Scholar] [CrossRef] [PubMed]
  33. Li, X.T.; Liu, B.; Wang, Y.M.; Yang, Y.G.; Liang, R.F.; Peng, F.J.; Xue, S.D.; Zhu, Z.X.; Li, K.F. Hydrodynamic and environmental characteristics of a tributary bay influenced by backwater jacking and intrusions from a main reservoir. Hydrol. Earth Sys. Sc. 2020, 24, 5057–5076. [Google Scholar] [CrossRef]
  34. Liro, M. Dam reservoir backwater as a field-scale laboratory of human-induced changes in river biogeomorphology: A review focused on gravel-bed rivers. Sci. Total Environ. 2019, 651, 2899–2912. [Google Scholar] [CrossRef] [PubMed]
  35. Holbach, A.; Bi, Y.; Yuan, Y.; Wang, L.; Zheng, B.; Norra, S. Environmental water body characteristics in a major tributary backwater of the unique and strongly seasonal Three Gorges Reservoir, China. Environ. Sci. Proc. Imp. 2015, 17, 1641–1653. [Google Scholar] [CrossRef] [PubMed]
  36. Ran, X.; Bouwman, A.F.; Yu, Z.; Liu, J. Implications of eutrophication for biogeochemical processes in the Three Gorges Reservoir, China. Reg. Environ. Chang. 2018, 19, 55–63. [Google Scholar] [CrossRef]
  37. Yang, Z.; Cheng, B.; Xu, Y.; Liu, D.; Ma, J.; Ji, D. Stable isotopes in water indicate sources of nutrients that drive algal blooms in the tributary bay of a subtropical reservoir. Sci. Total Environ. 2018, 634, 205–213. [Google Scholar] [CrossRef]
  38. Xiao, Y.; Li, Z.; Guo, J.; Liu, J.; Wu, S. Cyanobacteria in a tributary backwater area in the Three Gorges Reservoir, China. Inland. Waters 2016, 6, 77–88. [Google Scholar] [CrossRef]
  39. Zhu, K.; Bi, Y.; Hu, Z. Responses of phytoplankton functional groups to the hydrologic regime in the Daning River, a tributary of Three Gorges Reservoir, China. Sci. Total Environ. 2013, 450, 169–177. [Google Scholar] [CrossRef]
  40. Chen, Z.; Yuan, J.; Sun, F.; Zhang, F.; Chen, Y.; Ding, C.; Shi, J.; Li, Y.; Yao, L. Planktonic fungal community structures and their relationship to water quality in the Danjiangkou Reservoir, China. Sci. Rep. 2018, 8, 10596. [Google Scholar] [CrossRef]
  41. Li, S.; Shi, W.; You, M.; Zhang, R.; Kuang, Y.; Dang, C.; Sun, W.; Zhou, Y.; Wang, W.; Ni, J. Antibiotics in water and sediments of Danjiangkou Reservoir, China: Spatiotemporal distribution and indicator screening. Environ. Pollut. 2019, 246, 435–442. [Google Scholar] [CrossRef] [PubMed]
  42. Zhang, C.; He, Y.; Li, W.; Guo, X.; Xiao, C.; Zhao, T. High-throughput sequencing of diatom community, its spatial and temporal variation and interrelationships with physicochemical factors in Danjiangkou Reservoir. Water 2022, 14, 1609. [Google Scholar] [CrossRef]
  43. Xin, X.; Zhang, H.; Lei, P.; Tang, W.; Yin, W.; Li, J.; Zhong, H.; Li, K. Algal blooms in the middle and lower Han River: Characteristics, early warning and prevention. Sci. Total Environ. 2020, 706, 135293. [Google Scholar] [CrossRef] [PubMed]
  44. Han, B.P.; Liu, Z. Tropical and sub-tropical reservoir limnology in China: Theory and practice. In River Basin Environments and Ecological Succession in Danjiangkou Reservoir; Zheng, J., Han, D., Eds.; Springer: Dordrecht, The Netherlands, 2012; pp. 211–241. [Google Scholar]
  45. Ostle, C.; Paxman, K.; Graves, C.A.; Arnold, M.; Artigas, L.F.; Atkinson, A.; Aubert, A.; Baptie, M.; Bear, B.; Bedford, J.; et al. The Plankton Lifeform Extraction Tool: A digital tool to increase the discoverability and usability of plankton time-series data. Earth Syst. Sci. Data 2021, 13, 5617–5642. [Google Scholar] [CrossRef]
  46. Wang, N.; Xiong, J.; Wang, X.C.; Zhang, Y.; Liu, H.; Zhou, B.; Pan, P.; Liu, Y.; Ding, F. Relationship between phytoplankton community and environmental factors in landscape water with high salinity in a coastal city of China. Environ. Sci. Pollut. Res. Int. 2018, 25, 28460–28470. [Google Scholar] [CrossRef] [PubMed]
  47. Galván, K.; Fleeger, J.W.; Fry, B. Stable isotope addition reveals dietary importance of phytoplankton and microphytobenthos to saltmarsh infauna. Mar. Ecol. Prog. Ser. 2008, 359, 37–49. [Google Scholar] [CrossRef]
  48. GB 3838-2002; Environmental Quality Standard for Surface Water. The State Environmental Protection Administration (SEPA) and the General Administration of Quality Supervision, Inspection and Quarantine(AQSIQ) of the People’s Republic of China: Beijing, China, 2002.
  49. Weng, J.; Xu, H. Atlas of Common Freshwater Algae in China; Science Technology Press: Shanghai, China, 2010. [Google Scholar]
  50. Thuesen, E.V.; Ruggiero, M.A.; Gordon, D.P.; Orrell, T.M.; Bailly, N.; Bourgoin, T.; Brusca, R.C.; Cavalier-Smith, T.; Guiry, M.D.; Kirk, P.M. A Higher Level Classification of All Living Organisms. PLoS ONE 2015, 10, e0130114. [Google Scholar] [CrossRef]
  51. Reynolds, C.S. The Ecology of Fresh Water Phytoplankton; Cambridge University Press: London, UK, 1984. [Google Scholar]
  52. Johson, R.W.; Harris, R.C. Remote sensing for water quality and biological measurements in coastal waters. Photogramm. Eng. Remote Sens. 1980, 46, 77–85. [Google Scholar]
  53. Cheng, C.; Wei, Y.; Lv, G.; Xu, N. Remote sensing estimation of chlorophyll-a concentration in Taihu Lake considering spatial and temporal variations. Environ. Monit. Assess. 2019, 191, 84. [Google Scholar] [CrossRef]
  54. Kaneko, H.; Endo, H.; Henry, N.; Berney, C.; Mahé, F.; Poulain, J.; Labadie, K.; Beluche, O.; El Hourany, R.; Chaffron, S.; et al. Predicting global distributions of eukaryotic plankton communities from satellite data. ISME Commun. 2023, 3, 101. [Google Scholar] [CrossRef]
  55. Tuygun, G.T.; Salgut, S.; Elçi, A. Long-term spatial-temporal monitoring of eutrophication in Lake Burdur using remote sensing data. Water Sci. Technol. 2023, 87, 2184–2194. [Google Scholar] [CrossRef] [PubMed]
  56. Makwinja, R.; Inagaki, Y.; Sagawa, T.; Obubu, J.P.; Habineza, E.; Haaziyu, W. Monitoring trophic status using in situ data and Sentinel-2 MSI algorithm: Lesson from Lake Malombe, Malawi. Environ. Sci. Pollut. Res. 2023, 30, 29755–29772. [Google Scholar] [CrossRef] [PubMed]
  57. Molkov, A.A.; Fedorov, S.V.; Pelevin, V.V.; Korchemkina, E.N. Regional models for high-resolution retrieval of chlorophyll a and TSM concentrations in the Gorky Reservoir by Sentinel-2 imagery. Remote Sens. 2019, 11, 1215. [Google Scholar] [CrossRef]
  58. Sakuno, Y.; Maeda, A.; Mori, A.; Ono, S.; Ito, A. A simple red tide monitoring method using Sentinel-2 data for sustainable management of brackish lake Koyama-ike. Water 2019, 11, 1044. [Google Scholar] [CrossRef]
  59. Chen, Y.; Chen, Z.; Ma, D.; Yin, H.; Wu, C. Remote Sensing Estimation of Water Quality Parameters in Gaoyou Lakebased on Sentinel-2 MSIData. Environ. Sci. Manag. 2022, 47, 77–81. [Google Scholar] [CrossRef] [PubMed]
  60. HANG, X.; CAO, Y.; HANG, R.R.; XU, M.; HUO, Y.; SUN, L.X.; ZHU, S.H. Estimation model of chlorophyll-a concentration in Taihu Lake based on random forest algcrithm and Gaofen Observations. Meteor. Mon. 2021, 47, 1525–1536. [Google Scholar] [CrossRef]
  61. MA, C. Remote sensing inversion of chlorophyll a, suspended solids and salt in Songnen Plain. Water Sav. Irrig. 2022, 7, 95–101. [Google Scholar]
  62. SL88-1994; Determination of Chlorophyll (Spectrophotometric Method). Ministry of Water Resources of the People’s Republic of China: Beijing, China, 1995.
  63. Lampitt, R.S.; Wishner, K.F.; Turley, C.M.; Angel, M.V. Marine snow studies in the Northeast Atlantic Ocean: Distribution, composition and role as a food source for migrating plankton. Mar. Biol. 1993, 116, 702. [Google Scholar] [CrossRef]
  64. Shannon, C.E.; Weaver, W. The Mathematical Theory of Communication; University of Illinois Press: Urbana, IL, USA, 1949. [Google Scholar]
  65. He, R.; Luo, H.; He, N.; Chen, W.; Yang, F.; Huang, W.; Li, N.; Sun, L.; Peng, S. Phytoplankton Communities and Their Relationship with Environmental Factors in the Waters around Macau. Int. J. Environ. Res. Public. Health 2022, 19, 7788. [Google Scholar] [CrossRef]
  66. Xu, Y.; Xiang, Z.; Rizo, E.Z.; Naselli-Flores, L.; Han, B.P. Combination of linear and nonlinear multivariate approaches effectively uncover responses of phytoplankton communities to environmental changes at regional scale. J. Environ. Manag. 2022, 305, 114399. [Google Scholar] [CrossRef]
  67. Faquim, R.C.P.; Machado, K.B.; Teresa, F.B.; Oliveira, P.H.F.; Granjeiro, G.F.; Galli Vieira, L.C.; Nabout, J.C. Shortcuts for biomonitoring programs of stream ecosystems: Evaluating the taxonomic, numeric, and cross-taxa congruence in phytoplankton, periphyton, zooplankton, and fish assemblages. PLoS ONE 2021, 16, e0258342. [Google Scholar] [CrossRef]
  68. Borcard, D.; Legendre, P. Is the Mantel correlogram powerful enough to be useful in ecological analysis? A simulation study. Ecology 2012, 93, 1473–1481. [Google Scholar] [CrossRef] [PubMed]
  69. Mantel, N. The detection of disease clustering and a generalized regression approach. Cancer Res. 1967, 27, 209–220. [Google Scholar]
  70. OECD. Eutrophication of Waters Monitoring, Assessment and Control; Techical Report OECD; Organization for Economic Cooperation and Development, Environmental Directorate, OECD: Paris, France, 1982; pp. 75–85. [Google Scholar]
  71. Tan, X.; Xia, X.; Cheng, X.; Zhang, Q. Temporal and spatial pattern of phytoplankton community and its biodiversity indices in the Danjiangkou Reservoir. Huanjing Kexue 2011, 32, 2875–2882. [Google Scholar]
  72. Li, N.; Wang, J.; Yin, W.; Jia, H.; Xu, J.; Hao, R.; Zhong, Z.; Shi, Z. Linking water environmental factors and the local watershed landscape to the chlorophyll a concentration in reservoir bays. Sci. Total Environ. 2021, 758, 143617. [Google Scholar] [CrossRef] [PubMed]
  73. Sommer, U.; Gliwicz, Z.M.; Lampert, W.; Duncan, A. The PEG-model of seasonal succession of planktonic events in fresh waters. Arch. Hydrobiol. 1986, 106, 433–471. [Google Scholar] [CrossRef]
  74. Zhang, N.; Zang, S. Characteristics of phytoplankton distribution for assessment of water quality in the Zhalong Wetland, China. Int. J. Env. Sci. Technol. 2015, 12, 3657–3664. [Google Scholar] [CrossRef]
  75. Gao, M.; Li, Y.; Li, Y.; Sun, A.; Tian, S.; Zhang, C.; Geng, Y.; Li, L. Characteristics of Phytoplankton Community Structure and Their Relationships with Environmental Factors in Autumn in Qinhe River Basin of Jincheng Region. Huan Jing Ke Xue 2022, 43, 4576–4586. [Google Scholar] [CrossRef]
  76. Fai, P.B.A.; Kenko, D.B.N.; Tchamadeu, N.N.; Mbida, M.; Korejs, K.; Riegert, J. Use of multivariate analysis to identify phytoplankton bioindicators of stream water quality in the monomodal equatorial agroecological zone of Cameroon. Environ. Monit. Assess. 2023, 195, 788. [Google Scholar] [CrossRef]
  77. Kuang, Q.; Ming, M.; Yu, H.; Jie, Z. Study on the evaluation and treatment of lake eutrophication by means of algae biology. J. Saf. Environ./Anquan Yu Huanjing Xuebao 2005, 5, 87–91. [Google Scholar]
  78. Zhang, L.; Wang, Z.; Wang, N.; Gu, L.; Sun, Y.; Huang, Y.; Chen, Y.; Yang, Z. Mixotrophic Ochromonas Addition Improves the Harmful Microcystis-Dominated Phytoplankton Community in In Situ Microcosms. Env. Sci. Technol. 2020, 54, 4609–4620. [Google Scholar] [CrossRef] [PubMed]
  79. Wu, X.; Wu, H.; Wang, S.; Wang, Y.; Zhang, R.; Hu, X.; Ye, J. Effect of propionamide on the growth of Microcystis flos-aquae colonies and the underlying physiological mechanisms. Sci. Total Environ. 2018, 630, 526–535. [Google Scholar] [CrossRef] [PubMed]
  80. Zhu, C.M.; Zhang, J.Y.; Guan, R.; Hale, L.; Chen, N.; Li, M.; Lu, Z.H.; Ge, Q.Y.; Yang, Y.F.; Zhou, J.Z.; et al. Alternate succession of aggregate-forming cyanobacterial genera correlated with their attached bacteria by co-pathways. Sci. Total Environ. 2019, 688, 867–879. [Google Scholar] [CrossRef] [PubMed]
  81. Hu, Z.; Li, D.; Xiao, B.; Dauta, A.; Liu, Y. Microcystin-RR induces physiological stress and cell death in the cyanobacterium Aphanizomenon sp. DC01 isolated from Lake Dianchi, China. Fundam. Appl. Limnol. 2008, 173, 111. [Google Scholar] [CrossRef]
  82. Leflaive, J.P.; Ten-Hage, L. Algal and cyanobacterial secondary metabolites in freshwaters: A comparison of allelopathic compounds and toxins. Freshw. Biol. 2007, 52, 199–214. [Google Scholar] [CrossRef]
  83. Cao, H.; Kong, F.; Luo, L.; Shi, X.; Zhang, X. Effects of Wind and Wind-Induced Waves on Vertical Phytoplankton Distribution and Surface Blooms of Microcystis aeruginosa in Lake Taihu. J. Freshw. Ecol. 2006, 21, 231–238. [Google Scholar] [CrossRef]
  84. Walsby, A.E.; Hayes, P.K.; Boje, R.; Stal, L.J. The selective advantage of buoyancy provided by gas vesicles for planktonic cyanobacteria in the Baltic Sea. New Phytol. 1997, 136, 407–417. [Google Scholar] [CrossRef]
  85. Maberly, S.C.; Chao, A.; Finlay, B.J. Seasonal Patterns of Phytoplankton Taxon Richness in Lakes: Effects of Temperature, Turnover and Abundance. Protist 2022, 173, 125925. [Google Scholar] [CrossRef]
  86. Yang, J.; Wang, F.; Lv, J.; Liu, Q.; Nan, F.; Liu, X.; Xu, L.; Xie, S.; Feng, J. Interactive effects of temperature and nutrients on the phytoplankton community in an urban river in China. Environ. Monit. Assess. 2019, 191, 688. [Google Scholar] [CrossRef]
  87. Reynolds, C.S. Phytoplankton periodicity: The interactions of form, function and environmental variability. Freshw. Biol. 1984, 14, 111–142. [Google Scholar] [CrossRef]
  88. Schabhuttl, S.; Hingsamer, P.; Weigelhofer, G.; Hein, T.; Weigert, A.; Striebel, M. Temperature and species richness effects in phytoplankton communities. Oecologia 2013, 171, 527–536. [Google Scholar] [CrossRef] [PubMed]
  89. Reynolds, C.S. Ecology of Phytoplankton; Cambridge University Press: Cambridge, CA, USA, 2006. [Google Scholar]
  90. Zhong, Y.; Su, Y.; Zhang, D.; She, C.; Chen, N.; Chen, J.; Yang, H.; Balaji-Prasath, B. The spatiotemporal variations in microalgae communities in vertical waters of a subtropical reservoir. J. Environ. Manag. 2022, 317, 115379. [Google Scholar] [CrossRef] [PubMed]
  91. Paerl, H.W.; Fulton, R.S., 3rd; Moisander, P.H.; Dyble, J. Harmful freshwater algal blooms, with an emphasis on cyanobacteria. Sci. World J. 2001, 1, 76–113. [Google Scholar] [CrossRef] [PubMed]
  92. Kong, F.; Fao, G. Hypothesis on cyanobacteria bloom-forming mechanism in large shallow eutrophic lakes. Acta Ecol. Sin./Shengtai Xuebao 2005, 25, 589–596. [Google Scholar]
  93. Li, T.; Fan, X.; Cai, M.; Jiang, Y.; Wang, Y.; He, P.; Ni, J.; Mo, A.; Peng, C.; Liu, J. Advances in investigating microcystin-induced liver toxicity and underlying mechanisms. Sci. Total Environ. 2023, 905, 167. [Google Scholar] [CrossRef]
Figure 1. Overview of China’s Danjiangkou Reservoir and the research area in the Shending River’s backwaters.
Water 16 00326 g001
Figure 2. Graphical representation of concentration of Chl-a on average in the Shending River backwaters during different seasons in 2021.
Water 16 00326 g002
Figure 3. Number and proportion of phytoplankton species at sites S1 and S2.
Water 16 00326 g003
Figure 4. Total phytoplankton density at sites S1 and S2.
Water 16 00326 g004
Figure 5. Relative phytoplankton class abundance at S1.
Water 16 00326 g005
Figure 6. Relative phytoplankton class abundance at S2.
Water 16 00326 g006
Figure 7. Shannon–Wiener index at sites S1 and S2.
Water 16 00326 g007
Figure 8. Temporal variations in (a) WT, (b) DO, (c) CODMn, (d) NH3-N, (e) TN, (f) TP, (g) N/P, (h) PAR and WL at sites S1 and S2.
Water 16 00326 g008
Figure 9. Results of the Pearson correlation analysis at S1.
Water 16 00326 g009
Figure 10. Results of the Pearson correlation analysis at S2.
Water 16 00326 g010
Figure 11. Mantel test result at S1. * and ** represent p < 0.05 and p < 0.01, respectively.
Water 16 00326 g011
Figure 12. Mantel test result at S2. * and ** represent p < 0.05 and p < 0.01, respectively.
Water 16 00326 g012
Table 1. Correlation between band/band combination reflectance and chlorophyll a concentration.
Band/Band CombinationCorrelation Coefficient Band/Band CombinationCorrelation Coefficient
B2−0.059B8/B6−0.131
B3−0.090B8/B7−0.268
B4−0.0723B7/B60.274
B50.010B7/B50.175
B60.018B6/B50.095
B70.036B8a/B50.162
B80.032B8a/B60.279
B8a0.041B8a/B70.161
2.5 × (B8 − B4)/(B8 + 6 × B4 − 7.5 × B2 + 1)0.312B8a/B80.386
(B8 − B4)/(B8 + B4)0.271(1/B4 − 1/B5) × B60.598
B8 − B40.319(1/B4 − 1/B5) × B70.539
B8/B40.252(1/B4 − 1/B5) × B80.718
B8/B50.030(1/B4 − 1/B5) × B8a0.502
Table 2. Estimating Chl-a concentration in the backwater of the Shending River in 2021: statistical features.
SeasonMean
(μg/L)
5% Trimmed Mean
(μg/L)
Min
(μg/L)
Max
(μg/L)
STD
(μg/L)
Spring (From March to May)28.7727.4714.67121.149.63
Summer (From June to August)75.2663.961.21499.5769.23
Autumn (From September to November)48.6141.2613.84496.6746.70
Winter (From December to February)16.9316.2110.81135.355.57
Table 3. Phytoplankton species that predominate and their dominance values (Y) at sites S1 and S2.
ClassDominant SpeciesDominance Values (Y)
S1S2
BacillariophyceaeCyclotella meneghiniana0.0390.033
Synedra sp.0.024-
CyanophyceaeDactylococcopsis acicularis0.137-
Microcystis aeruginosa-0.175
Oscillatoria tenuis-0.116
ChlorophyceaeScenedesmus sp.0.0230.049
Chlorella vulgaris0.038-
DinophyceaePeridinium bipes0.033
CryptophyceaeChroomonas acuta-0.082
Disclaimer/Publisher’s Note: The statements, opinions and data contained in all publications are solely those of the individual author(s) and contributor(s) and not of MDPI and/or the editor(s). MDPI and/or the editor(s) disclaim responsibility for any injury to people or property resulting from any ideas, methods, instructions or products referred to in the content.

