Article

Spatiotemporal Variation in the Meteorological Drought Comprehensive Index in the Beijing–Tianjin–Hebei Region during 1961–2023

1
Beijing Municipal Climate Center, Beijing Meteorological Service, Beijing 100089, China
2
Key Laboratory of Land Surface Pattern and Simulation, Institute of Geographic Sciences and Natural Resources Research, Chinese Academy of Sciences, Beijing 100101, China
3
University of Chinese Academy of Sciences, Beijing 100049, China
4
Land Consolidation and Rehabilitation Center, Ministry of Natural Resources, Beijing 100035, China
*
Authors to whom correspondence should be addressed.
Water 2023, 15(24), 4230; https://doi.org/10.3390/w15244230
Submission received: 3 November 2023 / Revised: 26 November 2023 / Accepted: 1 December 2023 / Published: 8 December 2023
(This article belongs to the Special Issue Drought Monitoring and Risk Assessment)

Abstract

:
It is crucial to investigate the characteristics of meteorological drought in the Beijing–Tianjin–Hebei (BTH) region to improve the accuracy of agriculture and water resource monitoring and management. In this study, using instrumental observation data from 85 meteorological stations in the BTH region during 1961–2023 derived from the National Meteorological Information Center, we first calculated the meteorological drought comprehensive index (MCI) and analyzed the spatiotemporal characteristics of the MCI. In the BTH region, the MCI intensity from May to June was the most severe in the intraseasonal variation. The trend of the decreasing drought intensity in May–June has occurred for the past 60 years. The southern region in the BTH region was more likely to experience droughts. Next, the spatial patterns of the top two EOF modes of the May–June MCI were depicted. The primary spatial pattern of the BTH, which was characterized by consistent changes in the MCI throughout the entire BTH region, could be represented by the first mode’s R2 of 69.01%. Then, we compared the spatial pattern of the MCI intensity under different return periods. Using the May–June MCI of 1961–2023, the drought intensity gradually increased from northwest to southeast for the 10-, 20-, and 50-year return periods. However, the drought intensity decreased and then increased from northwest to southeast based on the 1991–2023 MCI. Notably, a 20-year return period of severe drought affected Beijing and northern Hebei in 2023. Finally, we discussed the linkages of drought in the BTH region and atmospheric circulation/sea surface temperature (SST) anomalies, which were calculated using the Pearson correlation coefficient and wavelet coherence. We suggest that the MCI variations in the BTH region may be related to the SST anomalies of the Indian Ocean in 1961–1990 and the Pacific Ocean in 1991–2023, respectively. The abovementioned studies have enlightened us to focus on predicting the Pacific SST for drought, which will facilitate agricultural production and water resource management in the BTH region.

1. Introduction

The frequency and intensity of extreme droughts are widespread and increasing with rapid global warming, significantly impacting ecosystems and society [1,2,3,4]. Extreme drought, characterized by a period of below-normal precipitation, is economically, ecologically, and socially disruptive, leading to food and water shortages [5,6]. To improve the ability to predict extreme droughts, it is valuable to understand the linkages between droughts and atmospheric circulation/sea surface temperature (SST) anomalies. Many studies have focused on the frequency and strength variations in regional droughts using instrumental meteorological data. Dai (2011) found a general global increase in drought, although with substantial regional variation and individual events dominating trend signatures in some regions [7], such as the extreme droughts that occurred in the Sahel during 1960–1990 [8] and continental extreme droughts in central Australia and the central USA from the 1950s to 1960s [9]. We compared the sc-PDSI calculated by van der Schrier et al. (2013) [10] and Dai (2011) [7], and found that the dominant mode of global drought variability is very similar, with a temporal evolution suggesting a trend towards drying. However, the other analysis for the 1950–2009 period shows an initial increase in drying in the Van der Schrier et al. [10] dataset, followed by a decrease from the mid-1980s onwards, while the Dai data show a continuing increase until 2000. Donat et al. (2013) [11] found that the annual maximum number of consecutive dry days has declined since the 1950s in more regions than it has increased. However, only regions in Russia and the USA indicate significant changes. Most studies on global dryness find decadal drought dominating longer-term trends [11,12,13]. Giorgi et al. (2011) [14] indicate that positive trends (reflecting an increase in the length of drought and/or extreme precipitation events) are most marked in Europe, India, and parts of South America and East Asia. However, trends appear to have decreased (reflecting a decrease in the length of drought and/or extreme precipitation events) in Australia and northern South America. Furthermore, as a result of global warming, intense drought occurrences will become more frequent [15], and the risk of megadroughts will rise as well [7]. Therefore, extreme droughts are hot topics in the climate science community.
Generally, drought is classified into four categories, including meteorological drought, hydrological drought, agricultural drought, and socioeconomic drought, by the American Meteorological Society [16]. Meteorological drought is a shortage of water due to an imbalance between precipitation and evapotranspiration payments and receipts during a certain period of time [17]. The widely used meteorological drought indices include the relative humidity index, standardized precipitation index (SPI) [18,19], standardized precipitation evapotranspiration index (SPEI) [20,21], Palmer drought severity index (PDSI) [22], and meteorological drought comprehensive index (MCI) [23,24]. In detail, the SPI, which is frequently used in drought monitoring, is estimated from the probability of precipitation occurring in a specific time period, but it ignores the effects of temperature and evapotranspiration [25]. The SPEI is constructed based on the SPI by introducing potential evapotranspiration. The monthly SPEI is sensitive to short-term precipitation and temperature changes, while the 6-month-scale SPEI better reflects subsoil moisture and stream runoff [26,27]. The MCI also considers the potential evapotranspiration and water shortages. These different drought indices have been widely used in drought research.
The Beijing–Tianjin–Hebei region (hereafter, the BTH region) is China’s “Capital Economic Circle” with a high population density and economic output, and it includes Beijing City, Tianjin City, and Hebei Province [28,29]. On the one hand, it is bordered by the Yanshan Mountains in the north and the Taihang Mountains in the west, with high vegetation cover. Precipitation in North China is characterized by significant seasonal and interdecadal variations [30,31]. From the 1950s to the 1970s, there was a dipole pattern of “floods in the north and droughts in the south”, with high precipitation in northern and northeastern China and low precipitation in the middle and lower reaches of the Yangtze River. Then, the rain belt moved southwards to southern China, and the precipitation in the eastern part of China often showed the triple-pole pattern of “+–+”. In the 1990s, the rain belt shifted northwards to the Yangtze River basin and changed to the dipole pattern of “floods in the south and droughts in the north” [32,33]. Summer precipitation in China underwent a significant climatic leap in approximately 1976, with North China and the Yellow River Basin experiencing decreased precipitation from 1977 [34,35,36]. Zhang et al. (2004) [37] analyzed the changes in precipitation in North China since 1880 and found that the precipitation in North China was low in the periods 1899–1920 and 1965–1997, in which the precipitation in 1980–1993 continued to be low and the drought phenomenon grew serious. Aerosol pollution caused by winter/spring forest wildfires, induced by extreme drought due to the East Asia winter monsoon system [33,38], may flow to urban agglomerations downstream and affect human health [39,40,41]. On the other hand, the central and southern parts of the BTH region belong to the North China Plain, which is largely made up of cropland and is one of China’s main grain-producing regions. Some studies have found that drought is the most important agrometeorological disaster in the North China Plain, with the largest annual disaster loss rate [42]. Between 1951 and 2010, there was a considerable increase in the intensity of drought disasters, and among all types of disasters, the amount of food lost due to drought and the risk of yield decline were the highest [43]. It is noted that North China experienced persistent hot waves and extreme drought in May–June 2023. Such extreme meteorological conditions have already caused accelerated moisture loss in cropland, hindering the growth of seedlings of some spring-sown crops, and affecting the progress of summer maize emergence in North China [44]. Therefore, we should intensify our research on the characteristics and causes of droughts in the BTH region.
This study aimed to explore the spatiotemporal variation in the MCI in the BTH region and drought intensity at different return periods. This study addressed the following questions: (1) What have the spatiotemporal characteristics of the MCI in the BTH region been over the last 60 years? (2) What were the drought intensities during the 10-, 20-, and 50-year return periods? The remainder of this paper is organized as follows: Section 2 introduces the materials and methods, Section 3 presents the results, Section 4 discusses the potential causes of drought during different time periods, and Section 5 presents the conclusions.

2. Materials and Methods

2.1. Study Area

The BTH region, with an area of 2.18 × 10⁷ hm2, is located in the northern region of North China, including Beijing, Tianjin, and Hebei (Figure 1). In general, the BTH region experiences a warm, temperate, continental monsoon climate with cold, dry winters and hot, wet summers. Its average temperature ranges from less than 0 °C in January to approximately 18–27 °C in July (Figure 1c). The average annual precipitation is 484.5 mm, which decreases from southeast to northwest. This region has an average annual precipitation of 484.5 mm, which decreases from the southeast to the northwest (Figure 1d). The seasonal distribution is irregular, with precipitation in July and August prevailing since it is influenced by the East Asia summer monsoon [21,26,45]. The BTH region is distinguished by a high altitude in the northwest and a low altitude in the southeast. Forest predominates in the high-altitude mountainous regions of the north and west. Meanwhile, grassland is located in the western transitional area between forest and cropland. Urban land is also predominantly concentrated in and around large cities.

2.2. Data

The datasets used in this study mainly consist of the meteorological instrumental observation dataset from atmospheric circulation indices and SST indices.
The daily meteorological instrumental observation dataset from 1961 to 2023, including surface air temperature, precipitation, wind at 2 m, surface net radiation, etc., is provided by the National Meteorological Information Center (http://data.cma.cn/, accessed on 10 July 2023). There are 173 national meteorological stations in the BTH region. The dataset underwent rigorous quality control to ensure reliable data quality, such as eliminating outliers and data homogenization. These errors generally result from the relocation of meteorological station locations or replacement of meteorological instruments. On the one hand, the relocation of meteorological station locations generally results in an abrupt climate change in the time series of meteorological data. We first divided the time series into two segments using the abrupt point as a criterion. Then, we selected the longer series of the two series as the base period. Finally, we calibrated the mean and variance of the short series to a standard consistent with the long series using the idea of data homogenization. On the other hand, the sensitivity error of meteorological instruments generally results in outliers. We removed outliers when we found significantly large or small data by examining the time series. Meanwhile, some meteorological stations began recording data after 1961, so the period of meteorological observation data collection is insufficient in length. Therefore, we finally selected data from 85 national meteorological stations from 1961 to 2023 with no missing data and reliable quality in this study.
The land use dataset in 2015 was extracted from the National Land Use Datasets of China involved in the Resource and Environment Science and Data Center, Chinese Academy of Sciences (RESDC-CAS, https://www.resdc.cn/, accessed on 10 July 2023). These datasets are based on Landsat ETM/TM/OLI, ZY–3, HJ–1A, and other satellite images and rely on a unified standard artificial digital interpretation that comprises six classes (i.e., cropland, forest land, grassland, water, urban and rural construction land, and unused land) as well as 25 sub-classes. Importantly, the average classification accuracy of these datasets is over 90% [46]. Here, we primarily use six classes to discriminate different land types.
Atmospheric circulation and SST indices include 88 atmospheric circulations and 26 SST indices, which are derived from the National Climate Center, China Meteorological Administration [47]. The indices are calculated strictly in accordance with internationally recognized algorithms. Additionally, the data are updated monthly.

2.3. Methods

2.3.1. Meteorological Drought Comprehensive Index

The MCI is the result of the cumulative effect of the combined long- and short-term precipitation deficits [24]. The MCI considered the combined effects of effective precipitation over a 60-day period, evapotranspiration over a 30-day period, precipitation on a seasonal scale (90 days), and precipitation on a near-half-year scale (150 days). The index applies to the monitoring and assessment of daily meteorological drought. The smaller the MCI values, the greater the drought intensity, and vice versa. The calculation processes of the MCI are as follows:
M C I = K a × a × S P I W 60 + b × M I 30 + c × S P I 90 + d × S P I 150
where Ka is the seasonal adjustment coefficient. Generally, Ka is based on how sensitive crops are to soil moisture at growth and development phases through many field experiments. Ka varies with different months and regions. As summarized by Zhang (2017), the Ka values of the agroclimatic zone (including wheat area and corn area) in Beijing, Tianjin, and Hebei are consistent in each month, as shown in Table 1. Furthermore, according to Zhang et al. (2017) [24], the impacts of the SPI and MI at different scales on the MCI varied with climate zone. Through many experimental and observational data, the weightings of SPI and MI at different scales are parameterized, thus obtaining a comprehensive index: the MCI. Through a large number of field experiments conducted by previous scholars, Zhang et al. (2017) [24] summarized that the weighting coefficients of a, b, c, and d of the weighting coefficients of SPIW60, MI30, SPI90, SPI150 in North China are constant, which are defined as 0.3, 0.5, 0.3, and 0.2, respectively.
SPIW60 is the standardized weighted precipitation index for the last 60 days, which is defined by Equation (2).
S P I W 60 = S P I n = 0 N m n P n
where N is 1, 2, …, 60, and m is the contribution parameter in North China, defined as 0.85. Pn is the precipitation on the nth day.
MI30 is the relative humidity index for the last 30 days, which is defined by Equation (3).
M I 30 = P P E T P E T
where P is the precipitation, and PET is the potential evapotranspiration, which is calculated by the functions of FAO Penman–Monteith, defined by Equation (4).
P E T = 0.408 R n G + γ 900 T m e a n + 273 u 2 ( e s e a ) + γ ( 1 + 0.34 u 2 )
where Rn is the surface net radiation, G is the soil heat flux, Tmean is the daily mean temperature, u2 is the wind at 2 m, es is the saturated water vapor pressure, ea is the actual water vapor pressure, Δ is the slope of saturated water vapor pressure curve, and γ is the dry and wet table constants.
SPI90 and SPI150 are the standardized precipitation indices for the last 90 days and 150 days, respectively, found in McKee et al. (1993) [48]. a, b, c, and d are the weight coefficients of SPIW60, MI30, SPI90, and SPI150, defined as 0.3, 0.5, 0.3, and 0.2 in the BTH region, respectively. According to the definition of Zhang et al. (2017) [24], the daily MCI below −0.5 and above −1 is considered as light drought, below −1 and above −1.5 as moderate drought, below −1.5 and above −2 as severe drought, and below −2 as extreme drought.
Based on the abovementioned calculation processes, we found that the MCI has been used as an indicator for drought monitoring in the National Climate Center, China Meteorological Administration, since it may capture monthly and seasonal precipitation anomalies and monthly scale water shortages [24]. The indicator is updated daily. Therefore, considering the applicability of indicators, the MCI was used in this study to estimate the drought characteristics in the BTH region.

2.3.2. Empirical Orthogonal Function on the MCI

The empirical orthogonal function (EOF) is usually used for single-variable time-varying characteristic decomposition [49]. It can decompose climate information into spatial and temporal dimensions (function). The spatial function characterizes the spatial distribution of the variable field, which does not change with time. The time function consists of a linear combination of spatial points. In this study, the MCI matrix is Xm×n, where m is the number of stations and n is the length of time. The covariance matrix Cm×n is defined as Equation (5).
C m × n = 1 n ( X m × n × X m × n T )
The eigenvalues (λ1, λ2, …, λm) and eigenvectors (Vm×m) of matrix Cm×n satisfy Equations (6) and (7).
C m × n × V m × n = V m × n × E m × n
E m × n = λ 1 0 0 λ m
The time coefficient matrix Tm×n is defined by Equation (8).
T m × n = V m × n T × X m × n
To circumvent the possibility of random numbers in the actual data or any anomalies or false data mixed into the EOF analysis process, it is necessary to determine the eigenvalue of errors. The North test is used in this study [50].
λ = λ 2 / n
where Δλ is the error range of the eigenvalue λ. The North significance test is passed when the error ranges of two neighboring eigen roots do not overlap via the sequential test and the error range labelling of λ, which means that the results of the empirical orthogonal function decomposition corresponding to the eigenvalues are physically meaningful.

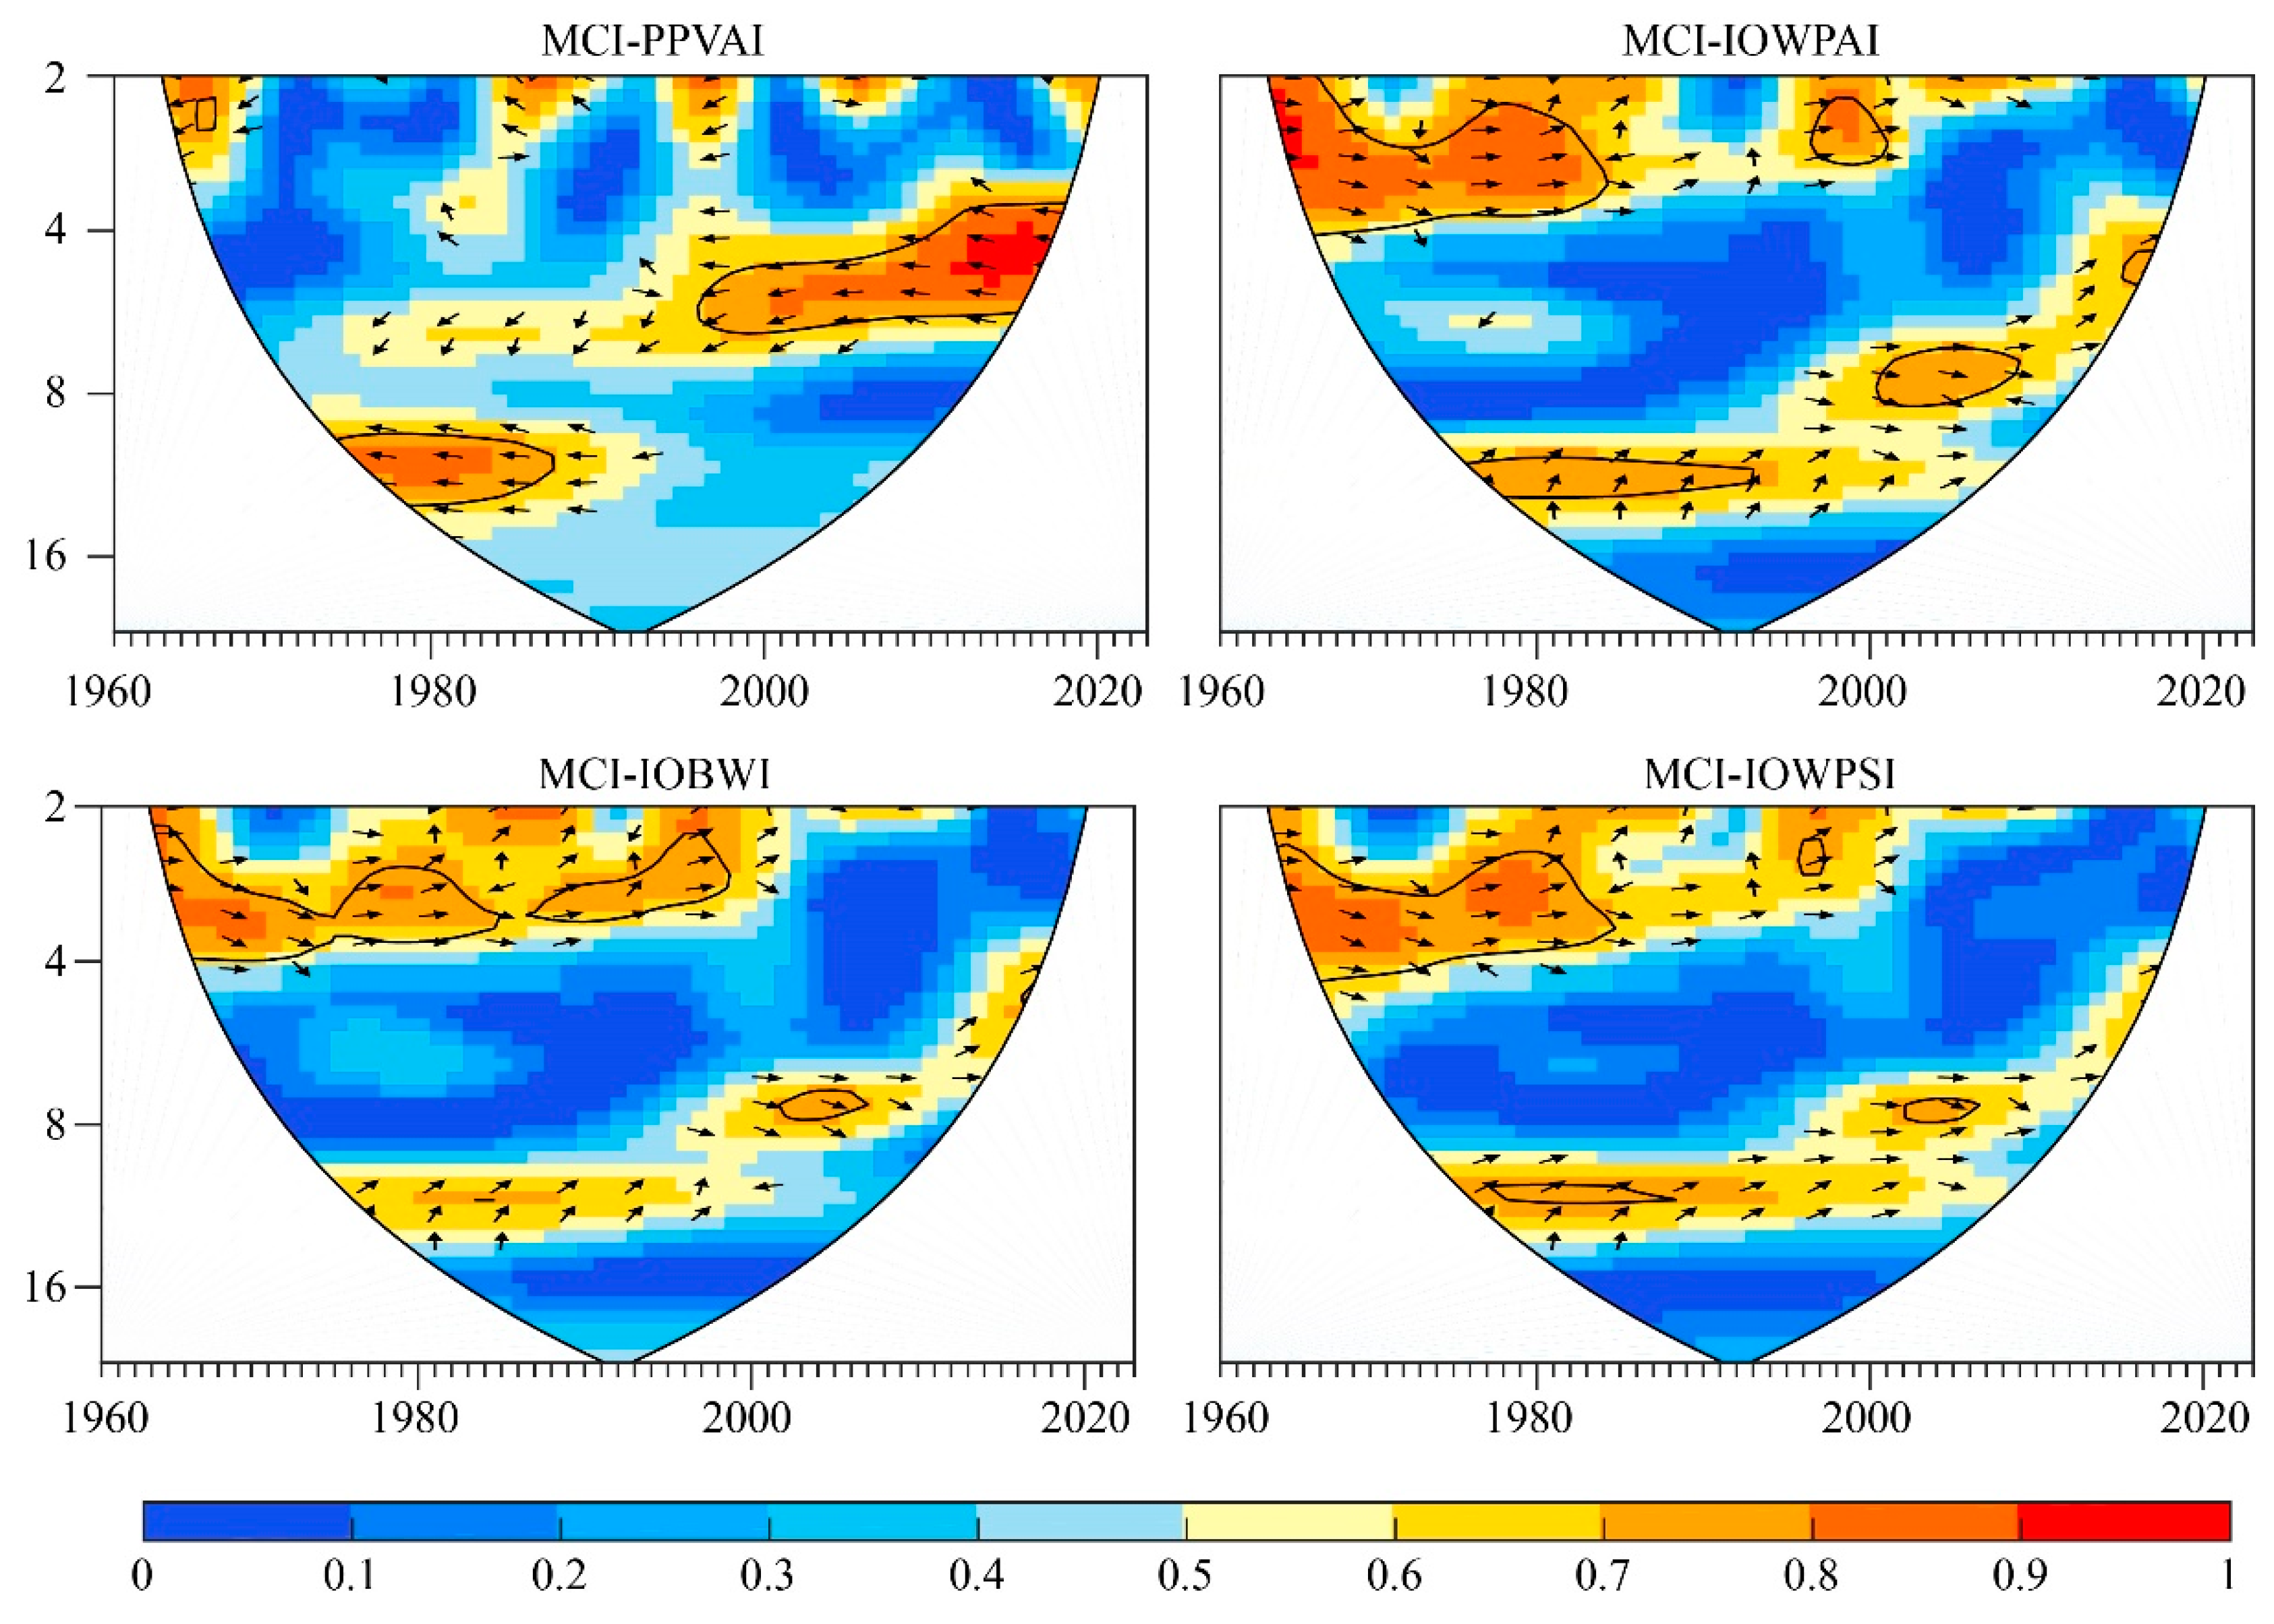
2.3.3. Wavelet Coherence between the MCI and Atmospheric Circulation/SST Indices

Wavelet coherence is generally employed to examine the coherence of two time series in the time–frequency domain [51]. It is defined as follows:
R 2 s , t = S [ s 1 W x y ( s , t ) ] 2 S [ s 1 W x ( s , t ) 2 · s 1 W y ( s , t ) 2 ]
where s is the scale parameter, t is the time parameter, and S is the smoothing operator. Wx(s,t) and Wy(s,t) are the wavelet transforms of the time series x and y, respectively. Wxy(s,t) is the cross-wavelet transform. The wavelet coherence value R2 is between 0 and 1, which is similar to the Pearson correlation coefficient. The values could be regarded as local correlation coefficients in time frequency space, with larger values indicating stronger correlations. When R2 is close to 1, it can be assumed that the MCI and sea surface temperature index series are strongly correlated. When R2 is close to 0, it can be assumed that the two series are basically irrelevant. The significance test algorithm is the Monte Carlo method [52].
To research the potential impact of atmospheric circulation/SST on the MCI in the BTH region, we calculated the wavelet coherence between the MCI and atmospheric circulation/SST indices. Wavelet coherence values passing the 95% significance test indicate that the MCI and atmospheric circulation/SST indices have the same period. The period variations in the MCI and atmospheric circulation/SST indices are synchronized and the two series are in phase when the arrows are right. The period variations in the MCI and atmospheric circulation/SST indices differ by half a cycle and the two series are in anti-phase when the arrows are left.

3. Results

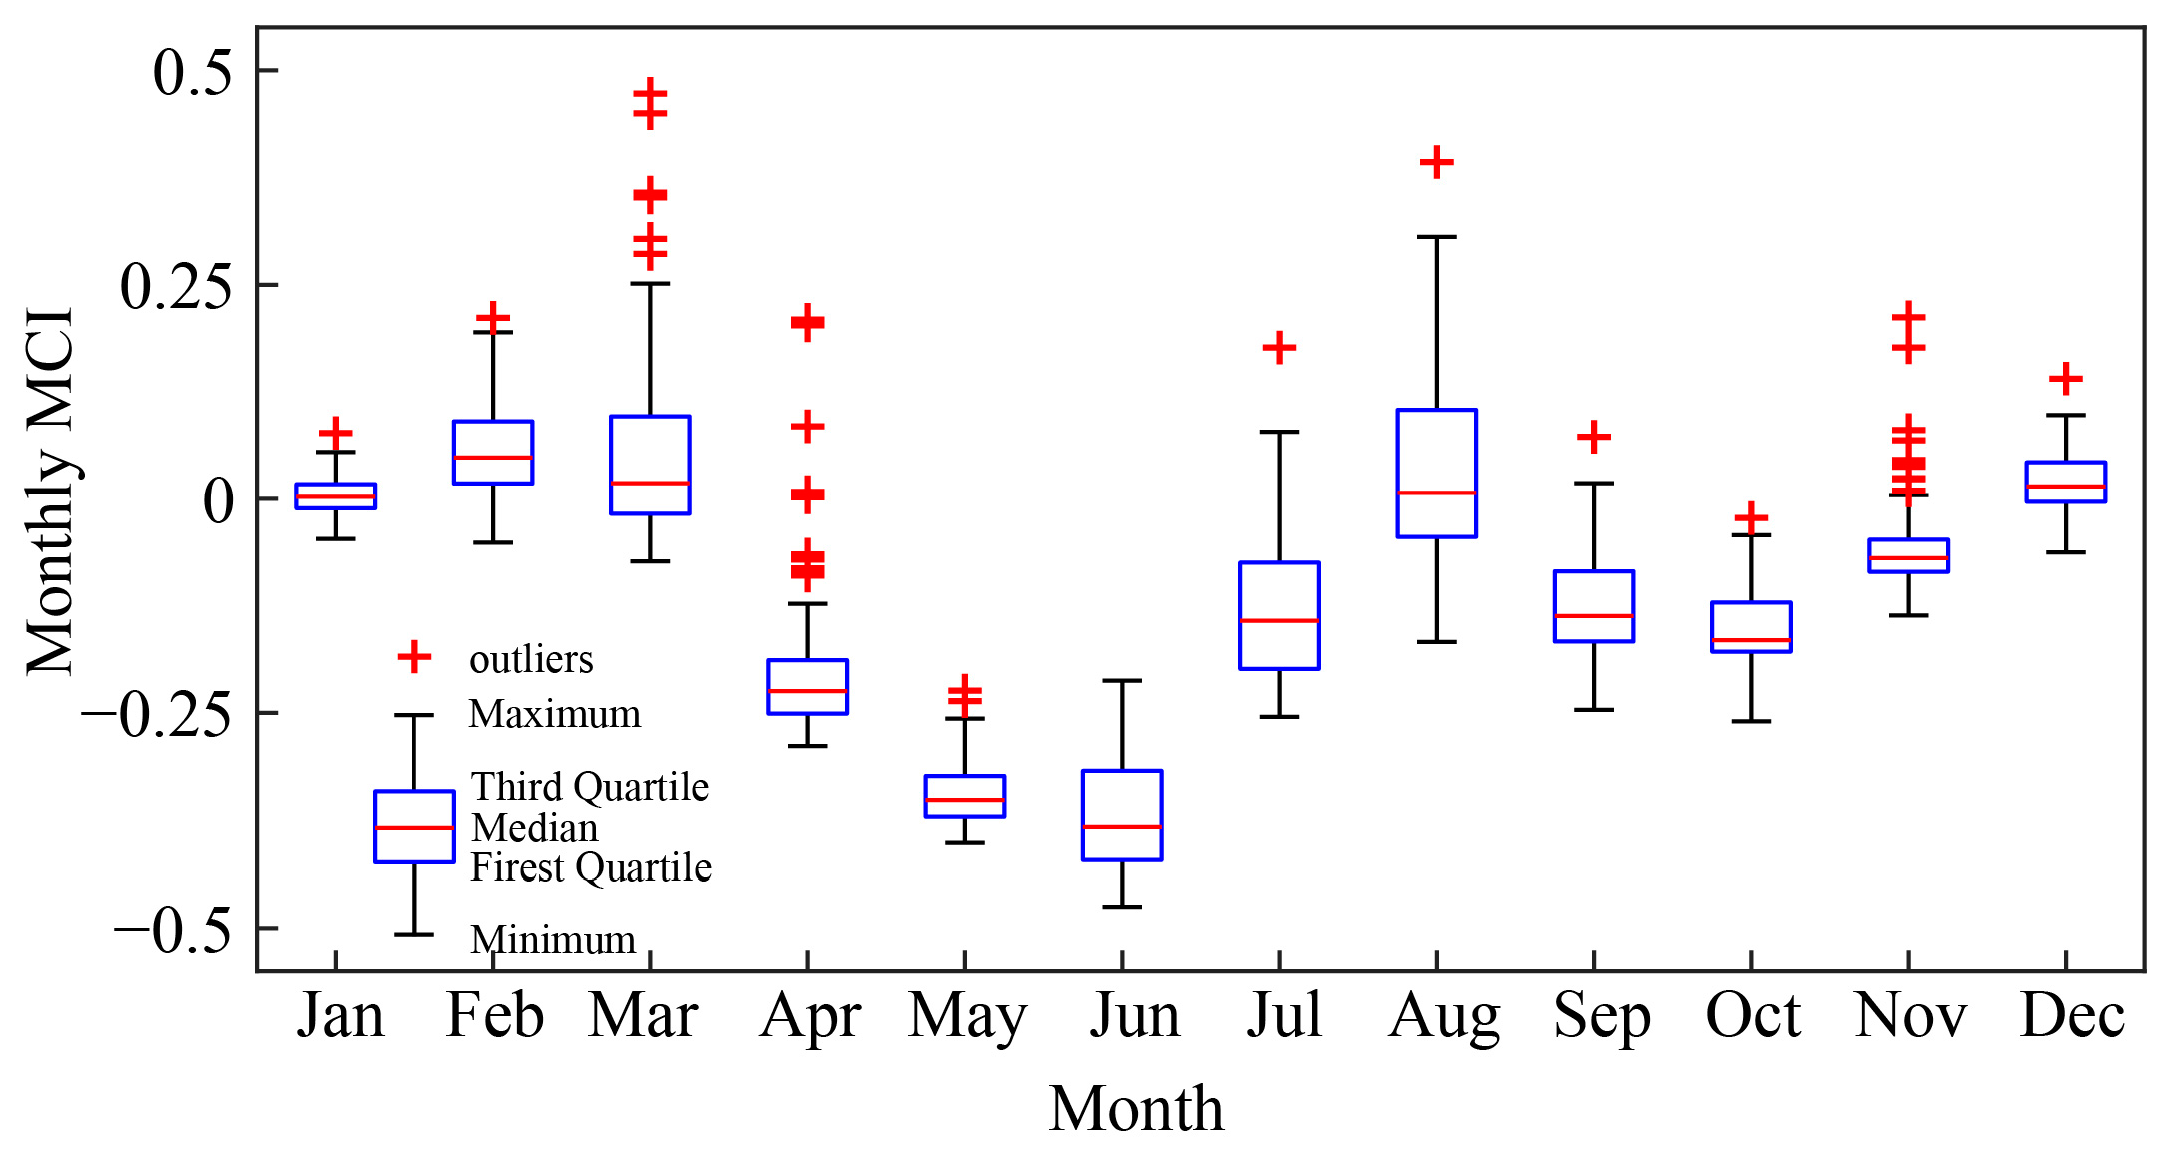
3.1. Temporal Variations in MCI in the Beijing–Tianjin–Hebei Region

A boxplot of the monthly mean MCI in the BTH region during 1961–2023 is shown in Figure 2. The intraseasonal variation in the MCI followed a normal distribution with a mean value of −0.35. The median MCI rapidly decreased in spring at a rate of 0.10/month. The MCI for April to June were much lower than those for the other months throughout the year, ranging from −0.30 to −0.38. Afterwards, the MCI increased quickly, peaking at 0.01 in August. Notably, April to June (spring to early summer) was the driest time of the year, which was mainly due to the increase in temperature and evaporation during this period, and the drought reached its peak before the rainy season began. However, the monthly MCI for April had significantly more outliers which were approximately close to the median MCI values in other months (e.g., July, September, October). No significant outliers of the MCI were evident in May and June. Meanwhile, there was a significant (p < 0.1) difference between the medians of the MCI between April and May–June using the chi-square test. Whether there were outliers or medians, these suggested more consistent characteristics of the changes in the MCI for May and June, clearly different to the April MCI. Therefore, May–June was used as the target analysis period for a comprehensive meteorological drought in the Beijing–Tianjin–Hebei region.

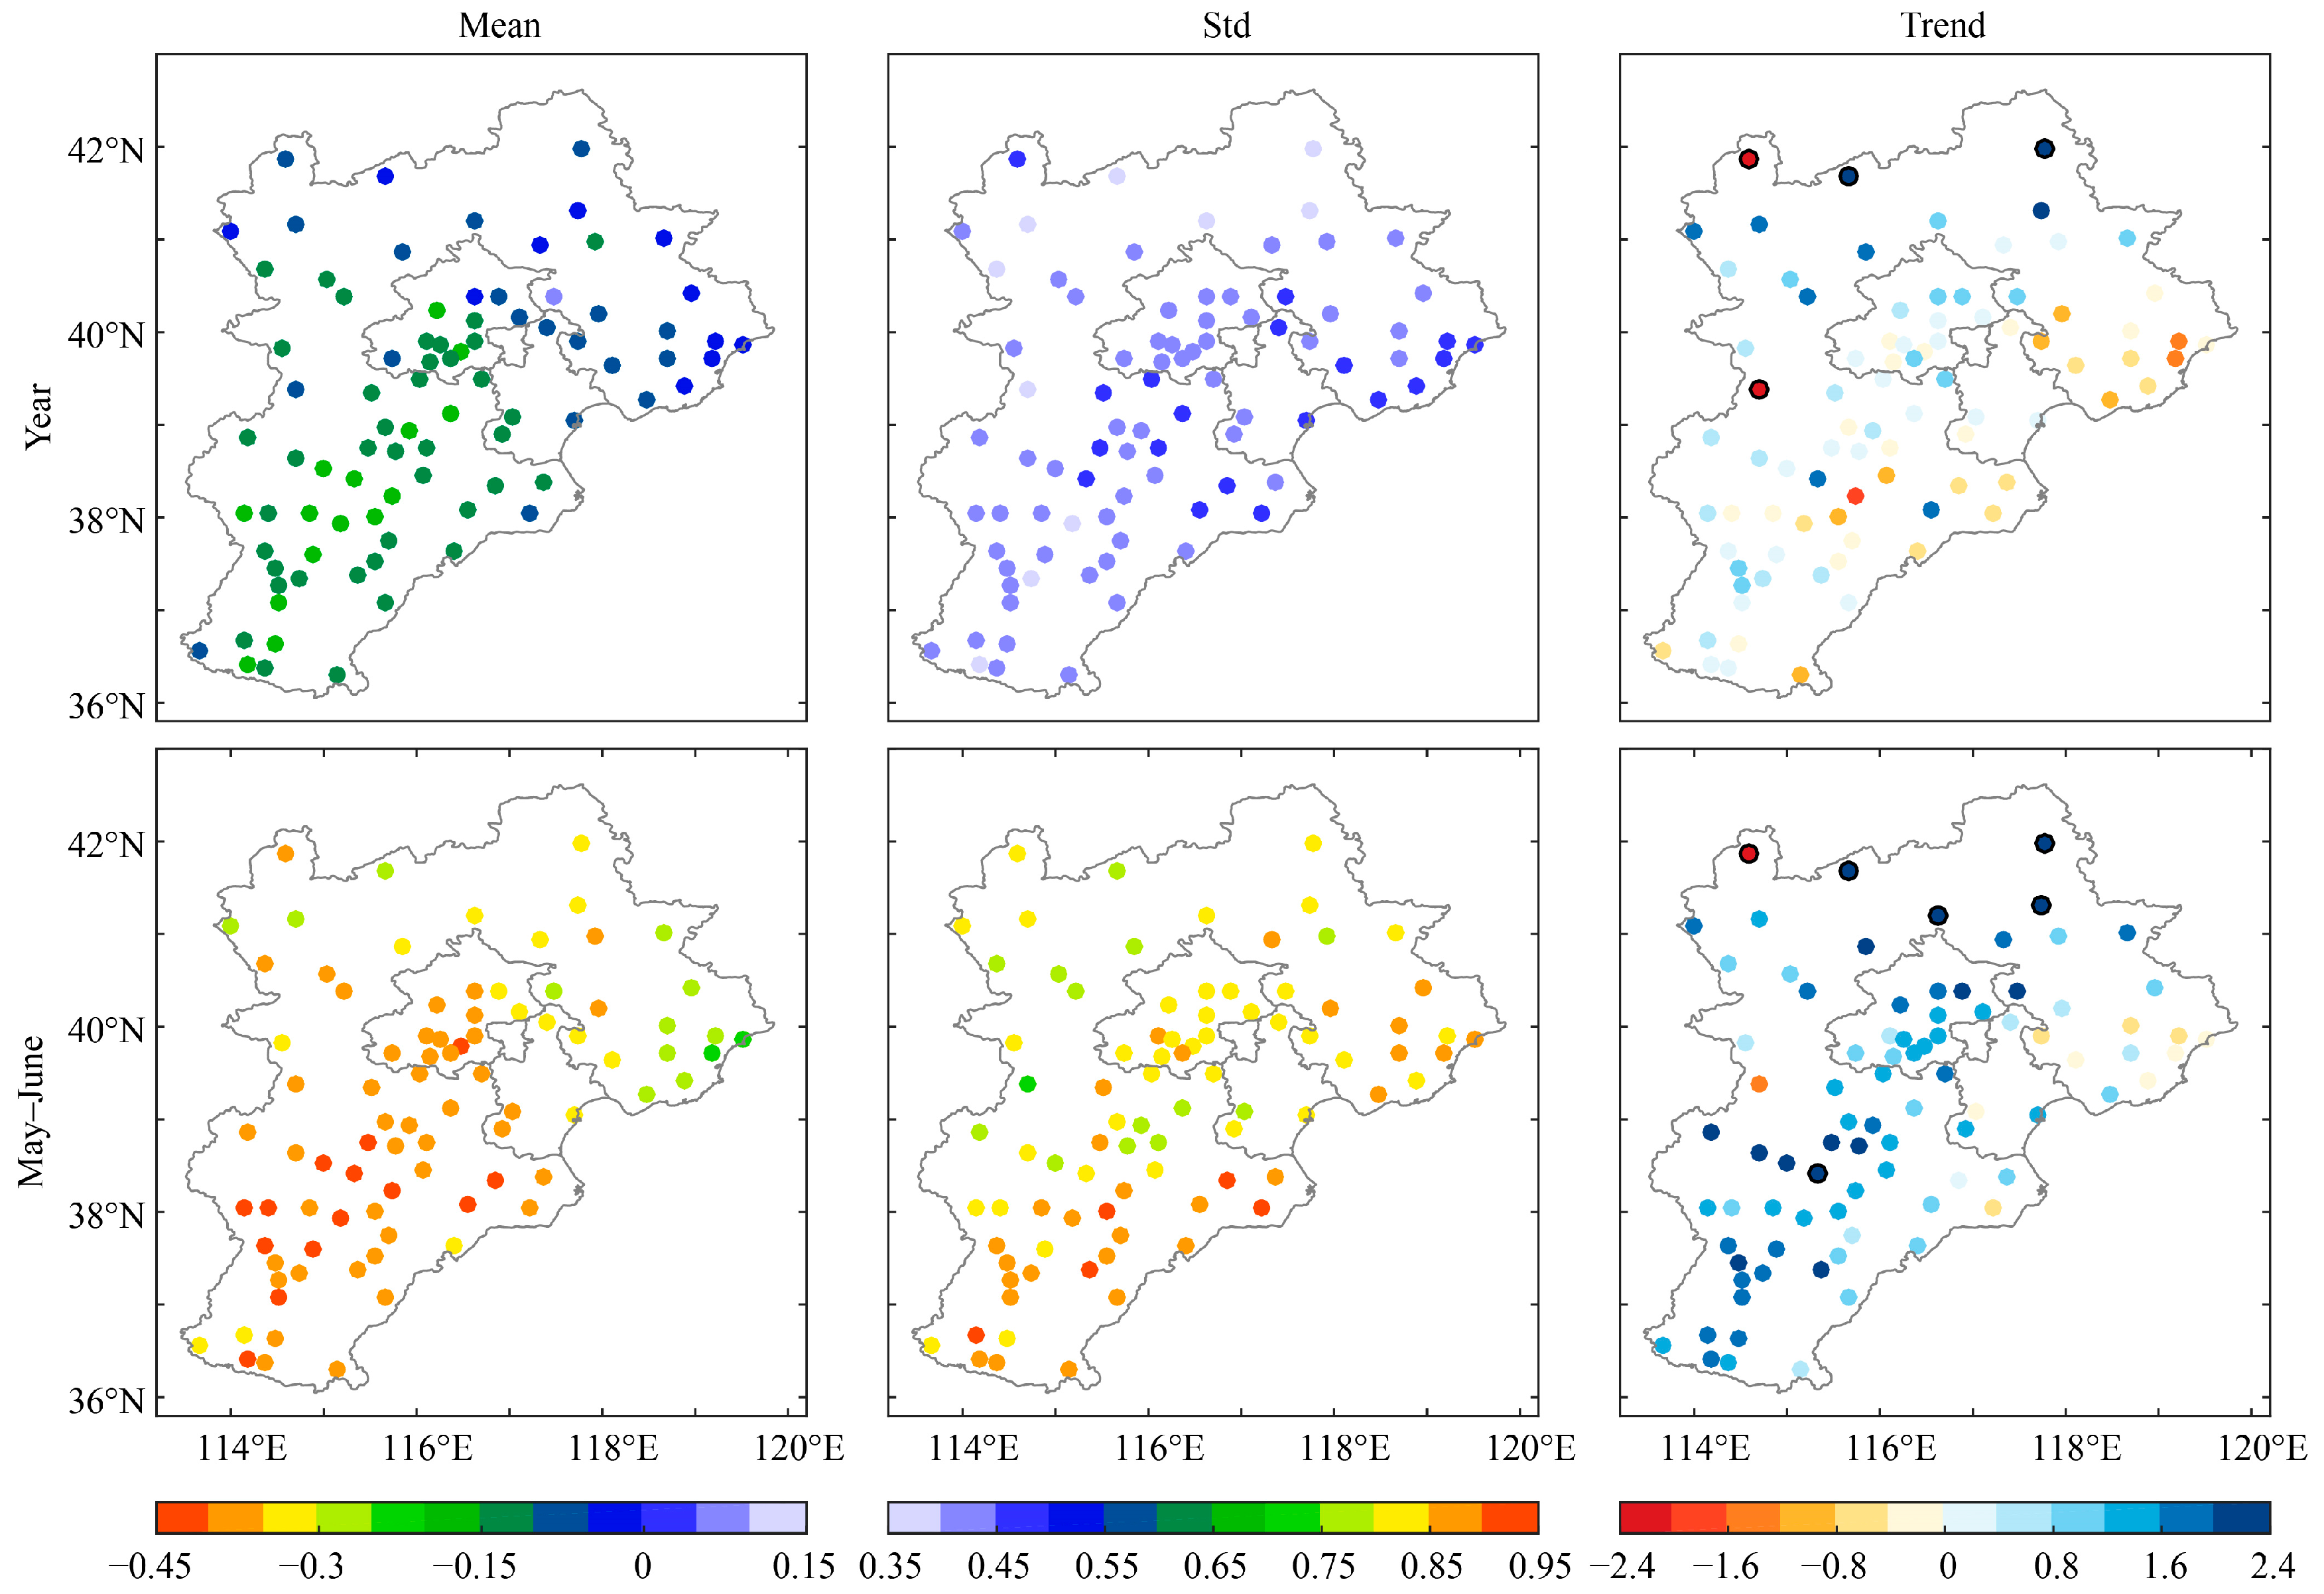
3.2. Spatial Patterns of the MCI in the Beijing–Tianjin–Hebei Region

Figure 3 illustrates the spatial characteristics of the annual and May–June MCI during 1961–2022. Notably, only the differences between the annual and May–June MCI variations in 1961–2022 are compared because 2023 has not yet passed. The regional mean annual MCI for the BTH region was −0.11, ranging from −0.18 to −0.06. In the BTH region, the annual MCI pattern was described as “flood in the northeast, drought in the southwest”, where the drought intensity in the northeast was minimum and in the southwest was maximum with an MCI of approximately −0.2. The regional mean May–June MCI for the BTH region was −0.36, ranging from −0.43 to −0.22. The spatial distribution of the May–June MCI was drought throughout the whole BTH region. These results demonstrated that the trend of drought intensity increased from the northeast to the southwest in both the annual MCI and May–June MCI. In the BTH region, the standard deviation of the annual mean MCI and May–June MCI displayed a spatial pattern of “small in the north, large in the south”, which indicated that drought variability was low/high in the northern/southern portion. However, the drought variability of the May–June MCI was significantly higher than that of the annual MCI, suggesting that the BTH region experienced extreme droughts more frequently in May–June. Although the spatial pattern of “drought in the southeast, flood in the northwest” was the dominant feature, the annual MCI trend in the BTH region was insignificant. The drought intensity trend of the annual MCI was insignificant. The trend of the decreasing drought intensity of the May–June MCI reached ~1/10a. Meanwhile, the most significant changes in the May–June MCI were in the northern mountainous areas and southern cultivated areas. This indicated that the wetter trend of the BTH region was more significant in May–June than the annual trend.
The abovementioned findings suggested that the MCI changes in May–June were more obvious than the annual changes. The mean MCI was mainly dominated by drought, with a trend of decreasing drought intensity. Furthermore, there was a higher probability of extreme droughts in the southern region, where there was greater drought variability.
We used the data in the period of 1961–2023 to analyze the characteristics of the May–June MCI in the following study. Figure 4 depicts the top two dominant spatial patterns of the EOF mode for the May–June MCI in the BTH. We found that the R2 of EOF1 was 69.01%, and its spatial pattern was characterized by largely consistent MCI changes in the BTH region. The R2 of EOF2 was 10.23%, and its spatial pattern was a “northeast–southwest” dipole. The cumulative variance explained by the first two modes reached 79.24%, which indicated that the first two modes could essentially reflect the main spatial pattern of the May–June MCI in the BTH region. The R2 of the first mode was close to 70%, indicating that it could represent the predominant spatial pattern of the BTH, i.e., the consistent change in the MCI throughout the entire region. Hence, using the results of EOF1, we analyzed the differences in the probability density function pattern of the MCI series between different time periods (i.e., 1961–1990 and 1991–2020) and the wavelet coherence between the MCI series of the whole Beijing–Tianjin–Hebei region and atmospheric circulation/SST indices series to research the potential impact of atmospheric circulation/SST on the MCI in the BTH region.

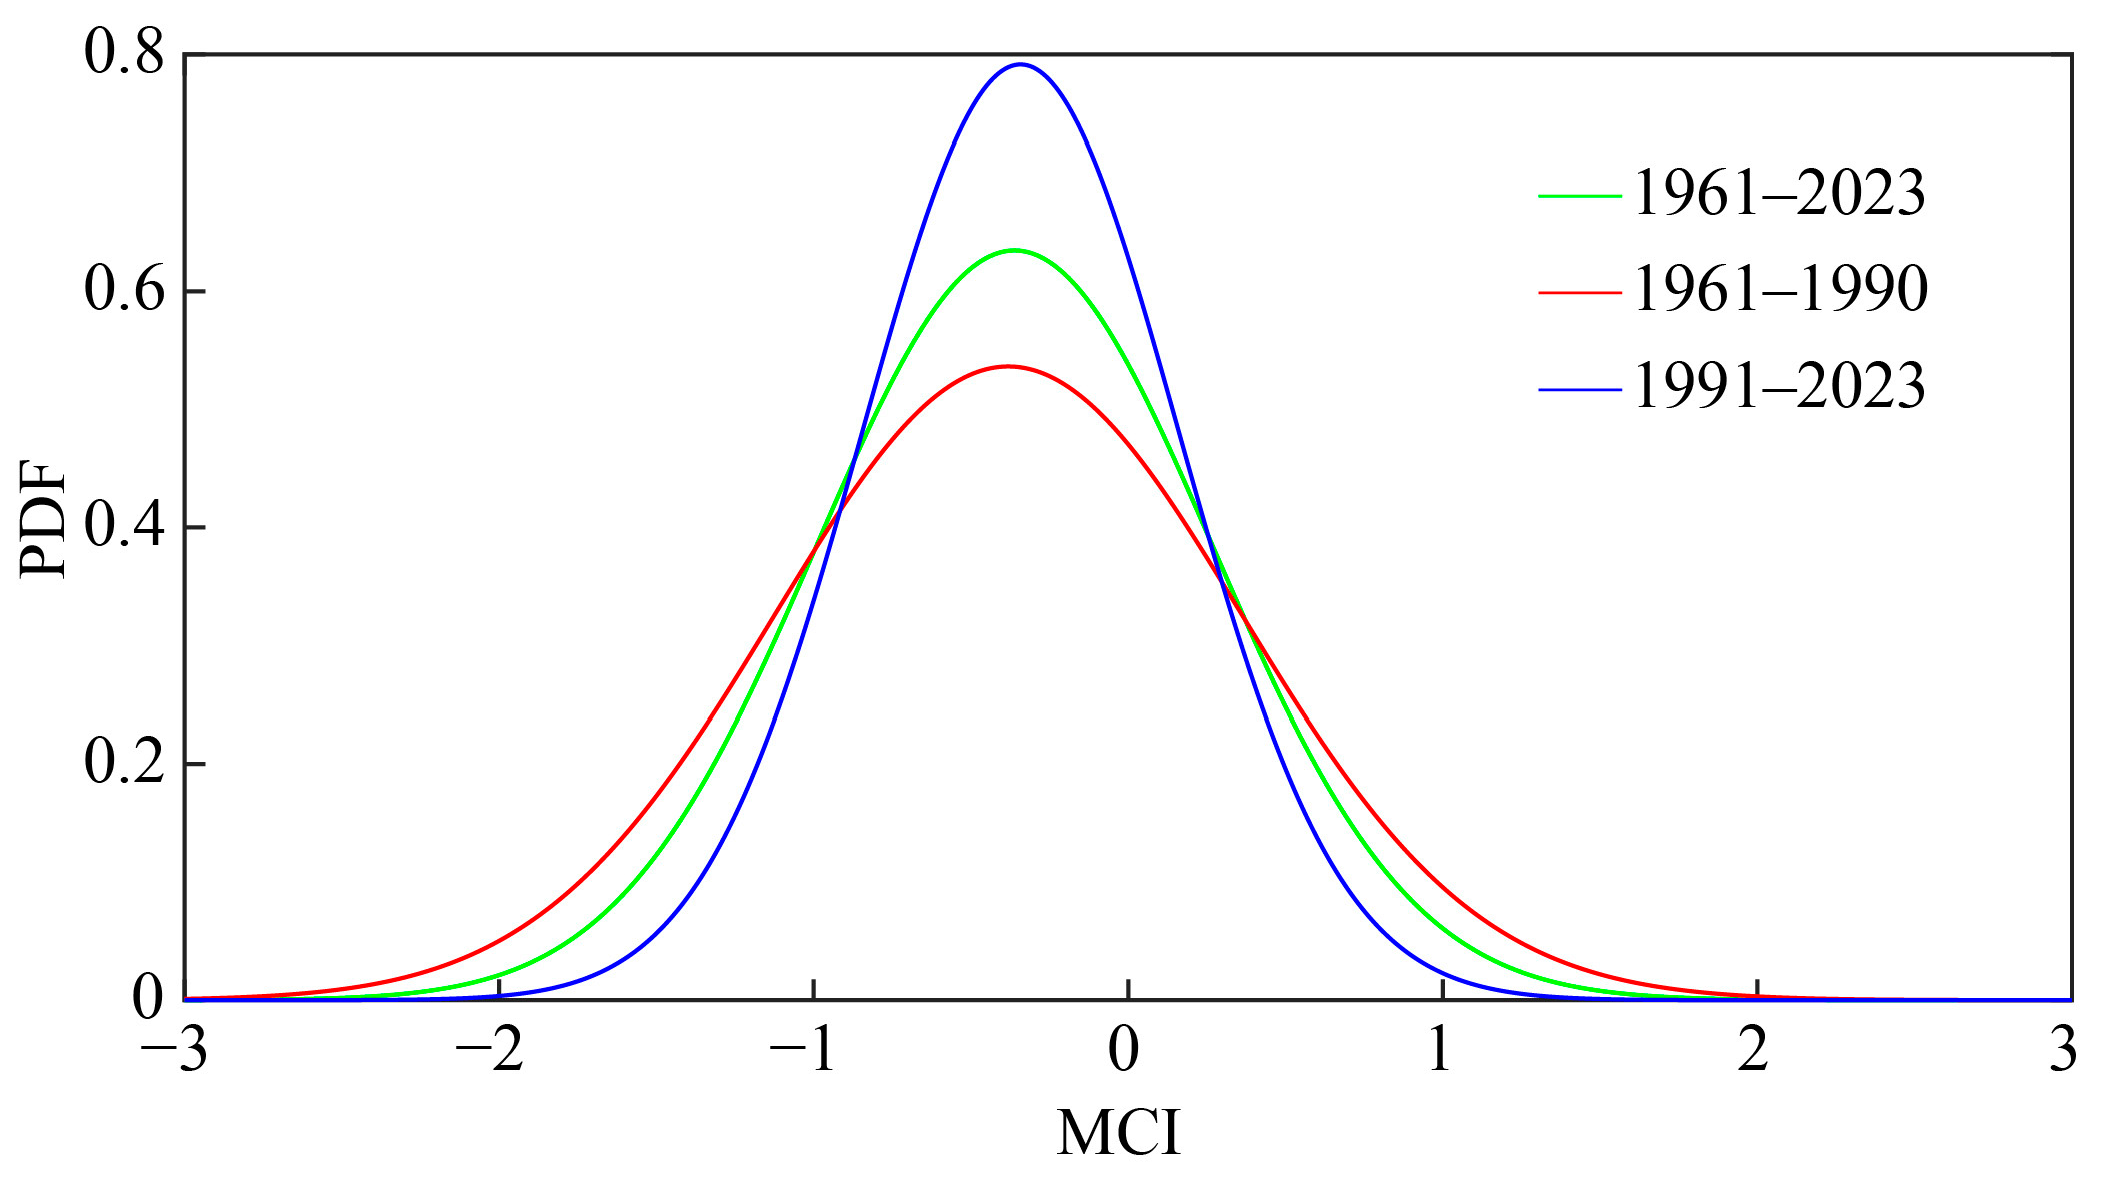
3.3. Comparison of the MCI Characteristics between 1961–1990 and 1991–2023

Figure 5 illustrates the probability density function pattern of the May–June MCI over different time periods. The May–June MCI was found to have a normal distribution in the time periods of 1961–2023, 1961–1990, and 1991–2023. The mean value of the MCI was approximately −0.35, which indicated that the BTH region had primarily experienced drought over the past 60 years. The probability of extreme events was highest during 1961–1990, followed by 1961 to 2023, and then 1991 to 2023, while the probability of average climatology was reversed. These results showed that the meteorological drought conditions in the BTH region over the past 30 years had gradually changed from extreme to common droughts, and that the extremeness had been reduced.

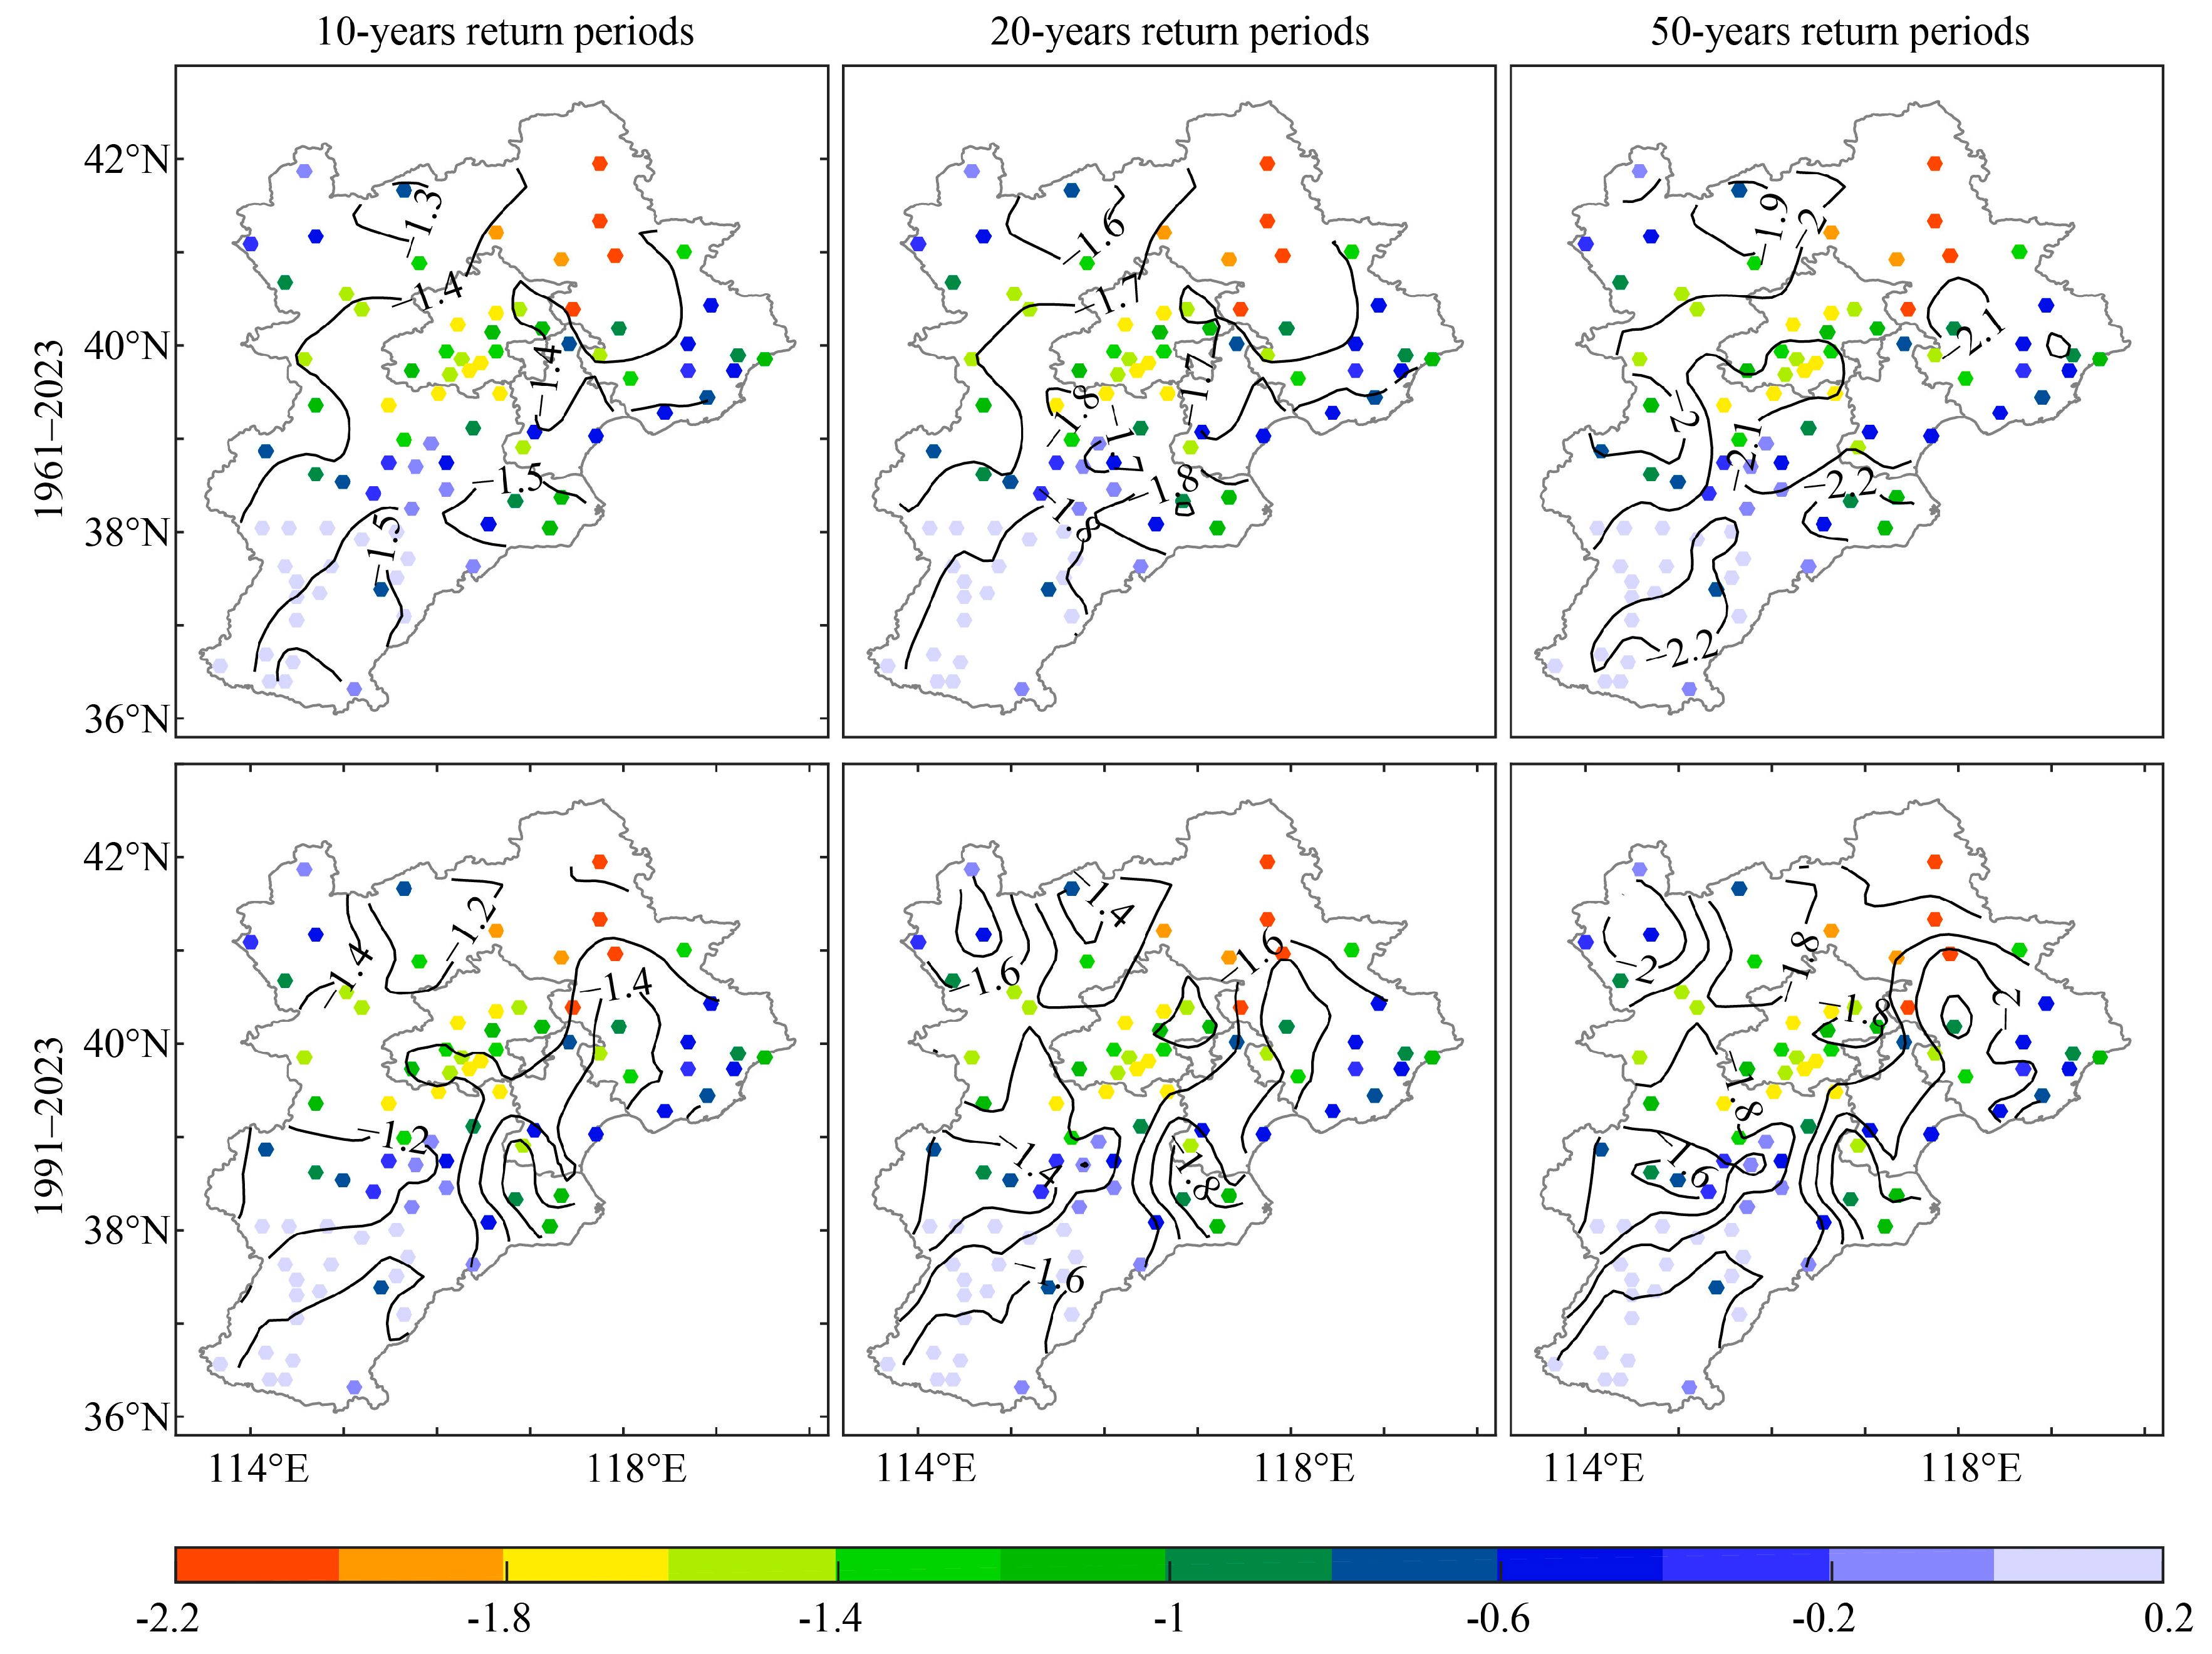
3.4. Different Return Periods of the MCI in the Beijing–Tianjin–Hebei Region

It is reported by the Ministry of Emergency Management that North China experienced several persistent heat waves and extreme drought events from May to June in 2023, which have resulted in decreasing crop yields and increasing forest fire danger [20]. To analyze the historical status of 2023 persistent extreme drought events in the BTH region over the past several decades, we calculated the BTH return periods based on different time periods and compared them with the May–June MCI intensity in 2023. Figure 6 shows the spatial distribution of the May–June MCI intensity during the 10-, 20-, and 50-year return periods and the May–June MCI intensity in 2023. We found that the drought intensity of the MCI gradually increased from northwest to southeast based on the calculated 10-year return period from 1961 to 2023. The drought intensity of the MCI in 2023 in Beijing and northern Hebei exceeded the drought intensity of the 10-year return period. The drought intensity of MCI first decreased and then increased from northwest to southeast based on the 10-year return period from 1991 to 2023.The drought intensity of the MCI in 2023 in Beijing and northern Hebei was also higher than that of the 10-year return period. The drought intensity of the MCI gradually increased from northwest to southeast based on the 20-year return period calculated from 1961 to 2023. The drought intensity of the MCI in 2023 in southern Beijing, northwestern Beijing, and northern Hebei exceeded the drought intensity of the 20-year return period. The drought intensity of the MCI first decreased and then increased from northwest to southeast based on the 20-year return period from 1991 to 2023. The drought intensity of the MCI in 2023 in Beijing and northern Hebei was also higher than that of the 20-year return period. The extent of 2023 exceeding the 20-year return period calculated from 1991–2023 was greater when compared to 1961–2023. The drought intensity of the MCI gradually increased from northwest to southeast based on the 50-year return period calculated from 1961 to 2023. The drought intensity of the MCI in 2023 only in the northern portions of Hebei exceeded the drought intensity of the 50-year return period. The drought intensity of the MCI first decreased and then increased from northwest to southeast based on the 50-year return period from 1991 to 2023. The drought intensity of the MCI in 2023 only in the northern portions of Hebei was higher than that of the 50-year return period.
The abovementioned findings suggested that the spatial pattern of the MCI drought intensity varied with different time periods, although the same return period was calculated. The spatial pattern of the MCI intensity in the BTH region increased gradually from northwest to southeast for the 10-, 20-, and 50-year return periods calculated based on 1961–2023. However, the spatial pattern of the MCI intensity first decreased and then increased from northwest to southeast for the 10-year, 20-year, and 50-year return periods calculated based on 1991–2023. Whether based on 1961–2023 or 1991–2023, the drought intensity of the MCI in 2023 in Beijing and northern Hebei reached the 20-year return period. However, drought extents greater than the 20-year return period were more extensive based on the period of 1991–2023. Meanwhile, the drought intensity in 2023 reached a 50-year return period only in some parts of northern Hebei. These results suggested that the 2023 drought in northern China (NC) was likely to spread from northern NC to southern NC, which may be due to the influence of a high-pressure system in Northeast China.

4. Discussion

To discuss the linkage of the MCI in the BTH region and atmospheric circulation/SST anomalies, we calculated the correlation coefficients between the regional mean May–June MCI series of the BTH region and a total of 114 indices, including 88 atmospheric circulation indices series and 26 SST indices series. Table 2 shows the top five correlation coefficients of the May–June MCI series and atmospheric circulation indices/SST indices series. We found that the top five indices with the largest correlation coefficients with the MCI variations were, respectively, the Pacific Polar Vortex Area Index (PPVAI), Indian Ocean Warm Pool Area Index (IOWPAI), Indian Ocean Basin-Wide Index (IOBWI), Indian Ocean Warm Pool Strength Index (IOWPSI), and NINO B SSTA Index. In particular, the PPVAI is defined as the area of the sector enclosed by the polar vortex north of the characteristic contour of the southern boundary of the vortex in the Northern Hemisphere in the 500 hPa height field, 150° E–120° W region. The IOWPAI is defined as a spherical area of areas where the sea surface temperature exceeds 28 °C in the regions 7° S–30° N, 41° E–98° E and 30° S–8° N, 41° E–120° E. The IOBWI is defined as the regional average of the sea surface temperature distance levels in the region 20° S–20° N, 40° E–110° E. The IOWPSI is defined as a spherical area of areas where the sea surface temperature exceeds 28 °C in the regions 7° S–30° N, 41° E–98° E and 30° S–8° N, 41° E–120° E. The NINO B SSTA Index is defined as the regional average sea surface temperature anomaly in the region 0°–10° N, 50° E–90° E. The MCI had a negative correlation with the PPVAI, which had a correlation coefficient of −0.392 (p < 0.01). However, the MCI had positive correlations with the other four indices, which had correlation values of 0.368 (p < 0.05), 0.389 (p < 0.01), 0.390 (p < 0.01), and 0.398 (p < 0.01). Since the correlation coefficients between the MCI and the four indices (i.e., PPVAI, IOWPAI, IOBWWI, and IOWPSI) were the largest, passing the 99% significance test, and significantly higher than that with the NINO B SSTA Index, the wavelet coherences between the May–June MCI series and SST indices, except the NINO B SSTA index, were examined (Figure 7). We discovered that the MCI and PPVAI had significant quasi-4–6-year oscillations since the 1990s–2010s. Additionally, the anti-phase relationship between the MCI and PPVAI was confirmed by the negative correlation between the two indices. During the 1980s, there were significant quasi-decadal oscillations between the MCI and PPVAI, and the two indices exhibited an anti-phase variation relationship. However, the MCI and IOWPAI, IOBWI, and IOWPSI all had quasi-2–4-year oscillations between 1960 and 1990, and there were phase relationships between the MCI and the three SST indices. Moreover, there was quasi-decadal oscillation between the MCI and the IOWPAI and IOWPSI. Numerous studies have examined how ocean systems affect drought/flood variations in North China. The Pacific SST in the mid-high latitude, especially the Pacific Decadal Oscillation (PDO) [53] and the Indian SST [54], has a good correspondence with precipitation in North China. For instance, when the PDO is in the warm phase, summer precipitation in North China is anomalously low, and when the PDO is in the cold phase, summer precipitation in the region is anomalously high, and the PDO mainly influences summer precipitation in North China through the East Asian summer monsoon [55]. Hao et al. (2012) [54] showed that the consistently high sea surface temperature in the tropical Indian Ocean leads to more precipitation and weaker winter winds in East Asia, which further causes weaker thermal contrasts between the land and sea in the spring and summer seasons and weak southerly winds in the eastern part of China and, correspondingly, less precipitation during the flood season in the northern part of the country.
These findings suggested that there was a quasi-2–4-year oscillation between the MCI, IOWPAI, IOBWI, and IOWPSI from 1961 to 1990. The three SST indices over the Indian Ocean may be related to the higher probability of extreme droughts in the BTH region. There was a quasi-4–6-year oscillation between the MCI and IOWPAI over the Pacific from 1991 to 2023, which may have declined the probability of extreme droughts in the BTH region. However, there are some weaknesses or limitations of our study. On the one hand, we calculated the wavelet coherence between the MCI and atmospheric circulation/SST indices to discuss the linkage of drought in the BTH region and atmospheric circulation/SST anomalies. However, this is just a statistical relationship. Studying how SST anomalies affect atmospheric circulation and alter local climate change, thereby triggering local droughts in North China, is equally important. In future research, we may consider analyzing the relationship and potential mechanisms between the three oceans and drought/flood in North China, which could help us to better predict the drought/flood in North China. On the other hand, the main focus has been on the climate states of monthly MCI in this study. In the future, more attention must be paid to the characteristics of continuous extreme drought, such as the number of consecutive MCI days.

5. Conclusions

The abovementioned results demonstrated that in the BTH region, the meteorological drought intensity from May to June was the most severe in the intraseasonal variation. The mean MCI in the BTH region was mainly dominated by drought. The drought intensity trend of the annual MCI was insignificant. The drought intensity trend of the MCI in May–June generally decreased throughout the whole BTH region. Meanwhile, the most significant changes of the May–June MCI were in the northern mountainous areas and southern Plain. In addition, there was a higher probability of extreme droughts in the southern area of the BTH region, where there was greater drought variability. The MCI changes in May–June were more obvious than those in the year. The cumulative variance explained by the first two modes reached 79.24%. The primary spatial pattern of MCI was characterized by consistent MCI changes throughout the whole BTH region, with the R2 reaching 69.01%. Compared with 1961–1990, meteorological drought conditions in the BTH region over the past 30 years gradually changed from extreme to common droughts. The spatial pattern of the MCI intensity in the BTH region increased gradually from northwest to southeast for the 10-, 20-, and 50-year return periods calculated based on 1961–2023. However, the spatial pattern of the MCI intensity was more pronounced in the northwest and softer in the southeast based on the 1991–2023 MCI. A 20-year return period of severe drought affected Beijing and northern Hebei in 2023. The drought intensity of the MCI in 2023 in northern Hebei alone reached the 50-year return period. These results suggested that the 2023 drought in NC was likely to spread from northern to southern NC. Moreover, the droughts in the BTH region may be related to IOWPAI, IOBWI, and IOWPSI, with 2–4 years of oscillation over the Indian Ocean, and IOWPAI, with 4–6 years of oscillation over the Pacific during 1961–1990 and 1991–2023, respectively. Moreover, our study mainly relied on an observational meteorology dataset. In the future, we need to research future projections so that government officials can precisely identify extreme drought events and put effective preventive measures in place to effectively improve local agricultural production and water resource management.

Author Contributions

Conceptualization, W.D., Z.H., M.B. and P.X.; methodology, W.D., Z.H., M.B. and P.X.; software, M.B., L.Z., C.Z. and P.X.; data curation, L.Z., C.Z. and Z.W.; analysis, W.D., Z.H., M.B., L.Z. and P.X.; writing—original draft, W.D., M.B. and P.X.; writing—review and editing, Z.H., L.Z., C.Z. and Z.W. All authors have read and agreed to the published version of the manuscript.

Funding

This research was supported by the National Natural Science Foundation of China (No. 42171030, the funder: Zhixin Hao; No. 42305055, the funder: Mengxin Bai), the Science and Technology Project of Beijing Meteorological Service (No. BMBKJ202302001, the funder: Mengxin Bai), the Key Project of Beijing Academy of Emergency Management Science and Technology (No. Y2023046, the funder: Wupeng Du and Mengxin Bai) and the Key Project of Beijing Municipal Ecology and Environment Bureau (No. QT-2023-0028, the funder: Pei Xing).

Data Availability Statement

All the data used in this study are publicly available and can be downloaded from the corresponding websites. The daily meteorological observation data for calculating the MCI can be accessed from National Meteorological Information Center, China Meteorological Administration (http://data.cma.cn/, accessed on 10 July 2023). The atmospheric circulation and SST indices are publicly available from the National Climate Center, China Meteorological Administration (http://www.ncc-cma.net/, accessed on 10 July 2023).

Conflicts of Interest

The authors declare no conflict of interest.

References

  1. Werner, C.; Meredith, L.K.; Ladd, S.N.; Ingrisch, J.; Kübert, A.; van Haren, J.; Bahn, M.; Bailey, K.; Bamberger, I.; Beyer, M. Ecosystem fluxes during drought and recovery in an experimental forest. Science 2022, 374, 1514–1518. [Google Scholar] [CrossRef]
  2. Eisenhauer, N.; Weigelt, A. Ecosystem effects of environmental extremes. Science 2022, 374, 1442–1443. [Google Scholar] [CrossRef] [PubMed]
  3. Chen, X.D.; Tian, F.Y.; Su, Y. How did the late 1920s drought affect northern Chinese society? Weather. Clim. Extreme 2022, 36, 100451. [Google Scholar] [CrossRef]
  4. Sugg, M.; Runkle, J.; Leeper, R.; Bagli, H.; Golden, A.; Handwerger, L.H.; Magee, T.; Moreno, C.; Reed-Kelly, R.; Taylor, M. A scoping review of drought impacts on health and society in North America. Clim. Chang. 2020, 162, 1177–1195. [Google Scholar] [CrossRef]
  5. Bai, M.X.; Zheng, J.Y.; Hao, Z.X.; Zhang, X.Z.; Zeng, G. Hydroclimate patterns over the Northern Hemisphere when megadroughts occurred in North China during the last millennium. Clim. Chang. 2019, 157, 365–385. [Google Scholar] [CrossRef]
  6. Dai, A.G. Increasing drought under global warming in observations and models. Nat. Clim. Chang. 2013, 3, 52–58. [Google Scholar] [CrossRef]
  7. Dai, A.G. Characteristics and trends in various forms of the Palmer Drought Severity Index during 1900–2008. J. Geophys. Res. Atmos. 2011, 116, D12115. [Google Scholar] [CrossRef]
  8. Dai, A.G.; Lamb, P.J.; Trenberth, K.E.; Hulme, M.; Jones, P.D.; Xie, P.P. The recent Sahel drought is real. Int. J. Climatol. 2004, 24, 1323–1331. [Google Scholar] [CrossRef]
  9. Spinoni, J.; Naumann, G.; Carrao, H.; Barbosa, P.; Vogt, J. World drought frequency, duration, and severity for 1951–2010. Int. J. Climatol. 2014, 34, 2792–2804. [Google Scholar] [CrossRef]
  10. van der Schrier, G.; Barichivich, J.; Briffa, K.R.; Jones, P.D. A scPDSI-based global dataset of dry and wet spells for 1901–2009. J. Geophys. Res. Atmos. 2013, 118, 4025–4048. [Google Scholar] [CrossRef]
  11. Donat, M.G.; Alexander, L.V.; Yang, H.; Durre, I.; Vose, R.; Dunn, R.J.H.; Willett, K.M.; Aguilar, E.; Brunet, M.; Caesar, J.; et al. Updated analyses of temperature and precipitation extreme indices since the beginning of the twentieth century: The HadEX2 dataset. J. Geophys. Res. Atmos. 2013, 118, 2098–2118. [Google Scholar] [CrossRef]
  12. Frich, P.; Alexander, L.V.; Della-Marta, P.; Gleason, B.; Haylock, M.; Tank, A.; Peterson, T. Observed coherent changes in climatic extremes during the second half of the twentieth century. Clim. Res. 2002, 19, 193–212. [Google Scholar] [CrossRef]
  13. Alexander, L.V.; Zhang, X.; Peterson, T.C.; Caesar, J.; Gleason, B.; Tank, A.M.G.K.; Haylock, M.; Collins, D.; Trewin, B.; Rahimzadeh, F.; et al. Global observed changes in daily climate extremes of temperature and precipitation. J. Geophys. Res. Atmos. 2006, 111, D05109. [Google Scholar] [CrossRef]
  14. Giorgi, F.; Im, E.S.; Coppola, E.; Diffenbaugh, N.S.; Gao, X.J.; Mariotti, L.; Shi, Y. Higher hydroclimatic intensity with global warming. J. Clim. 2011, 24, 5309–5324. [Google Scholar] [CrossRef]
  15. Wang, X.X.; Jiang, D.B.; Lang, X.M. Future extreme climate changes linked to global warming intensity. Sci. Bull. 2017, 62, 1673–1680. [Google Scholar] [CrossRef]
  16. Society, A.M. Meteorological drought-policy statement. B. Am. Meteorol. Soc. 1997, 78, 55–94. [Google Scholar]
  17. Wilhite, D.A. Drought and Water Crises: Science, Technology, and Management Issues; CRC Press: Boca Raton, FL, USA, 2005. [Google Scholar]
  18. Han, Z.H.; Liu, X.G.; Hao, K.; Yu, N.; Liu, Y.W.; Yang, Q.L. Drought evolution characteristics and trend prediction in Inner Mongolia based on standardized precipitation index. J. Irrig. Drain. Eng. 2017, 35, 430–439. (In Chinese) [Google Scholar]
  19. Sobral, B.S.; de Oliveira-Júnior, J.F.; de Gois, G.; Pereira, E.R.; Terassi, P.M.D.; Muniz, J.G.R.; Lyra, G.B.; Zeri, M. Drought characterization for the state of Rio de Janeiro based on the annual SPI index: Trends, statistical tests and its relation with ENSO. Atmos. Res. 2019, 220, 141–154. [Google Scholar] [CrossRef]
  20. Yang, Y.; Gan, T.Y.; Tan, X. Spatiotemporal changes of drought characteristics and their dynamic drivers in Canada. Atmos. Res. 2020, 232, 104695. [Google Scholar] [CrossRef]
  21. Zhang, X.T.; Pan, X.B.; Xu, L.; Wei, P.; Yin, Z.W.; Shao, C.X. Analysis of spatio-temporal distribution of drought characteristics based on SPEI in Inner Mongolia during 1960–2015. Trans. Chin. Soc. Agricul. Eng. 2017, 33, 190–199. (In Chinese) [Google Scholar]
  22. Zhang, J.; Sun, F.; Lai, W.; Lim, W.H.; Liu, W.B.; Wang, T.T.; Wang, P.T. Attributing changes in future extreme droughts based on PDSI in China. J. Hydrol. 2019, 573, 607–615. [Google Scholar] [CrossRef]
  23. Wang, C.L.; Guo, J.; Xue, L.F.; Ding, L.J. An Improved Comprehensive Meteorological Drought Index CI_(new) and Its Applicability Analysis. Chin. J. Agrometeorol. 2011, 32, 621–626. (In Chinese) [Google Scholar]
  24. GB/T 20481-2017; Grades of Meteorological Drought. Standards Press of China: Beijing, China, 2017.
  25. Hayes, M.J.; Svoboda, M.D.; Wilhite, D.A.; Vanyarkho, O.V. Monitoring the 1996 drought using the standardized precipitation index. Bull. Am. Meteorol. Soc. 1999, 80, 429–438. [Google Scholar] [CrossRef]
  26. Vicente-Serrano, S.M.; Beguería, S.; López-Moreno, J.I. A multiscalar drought index sensitive to global warming: The standardized precipitation evapotranspiration index. J. Clim. 2010, 23, 1696–1718. [Google Scholar] [CrossRef]
  27. Su, H.X.; Li, G.Q. Low-frequency drought variability based on SPEI in association with climate indices in Beijing. Acta Ecol. Sin. 2012, 32, 5467–5475. (In Chinese) [Google Scholar]
  28. Fan, J.; Lian, Y.N.; Zhao, H. Review of the research progress in Beijing-Tianjin-Hebei region since 1980. Acta Geogr. Sin. 2022, 77, 1299–1319. (In Chinese) [Google Scholar]
  29. Fang, C.L. Theoretical foundation and patterns of coordinated development of the Beijing-Tianjin-Hebei Urban Agglomeration. Prog. Geog. 2017, 36, 15–24. (In Chinese) [Google Scholar]
  30. Zheng, J.Y.; Wu, M.W.; Ge, Q.S.; Hao, Z.X.; Zhang, X.Z. Observed, Reconstructed, and Simulated Decadal Variability of Summer Precipitation over Eastern China. J. Meteorol. Res. 2017, 31, 49–61. [Google Scholar] [CrossRef]
  31. Ding, Y.H.; Wang, Z.Y.; Sun, Y. Inter-decadal variation of the summer precipitation in East China and its association with decreasing Asian summer monsoon. Part I: Observed evidences. Int. J. Climatol. 2008, 28, 1139–1161. [Google Scholar] [CrossRef]
  32. Huang, R.H.; Liu, Y.; Huangfu, J.L.; Feng, T. Characteristics and internal dynamical causes of the interdecadal variability of East Asian winter monsoon near the late 1990s. Chin. J. Atmos. Sci. 2014, 38, 627–644. (In Chinese) [Google Scholar]
  33. Ding, Y.H.; Si, D.; Liu, Y.J.; Wang, Z.Y.; Li, Y.; Zhao, L.; Song, Y.F. On the characteristics, driving forces and interdecadal variability of the East Asian summer monsoon. Chin. J. Atmos. Sci. 2018, 42, 533–558. (In Chinese) [Google Scholar]
  34. Zhou, L.T.; Huang, R.H. Research on the characteristics of interdecadal variability of summer climate in China and its possible cause. Clim. Environ. Res. 2003, 8, 274–290. (In Chinese) [Google Scholar]
  35. Ding, Y.H.; Zhang, L. Intercomparison of the time for climate abrupt change between the Tibetan Plateau and other regions in China. Chin. J. Atmos. Sci. 2008, 32, 794–805. (In Chinese) [Google Scholar]
  36. Yang, X.Q.; Xie, Q.; Zhu, Y.M.; Sun, X.G.; Guo, Y.J. Decadal-to-interdecadal variability of precipitation in North China and associated atmospheric and oceanic anomaly patterns. Chin. J. Geophys. 2005, 48, 789–797. (In Chinese) [Google Scholar]
  37. Zhang, C.J.; Li, D.L.; Wang, X.P. Study of precipitation variability in last 100 years and trend prediction in Northeast Asia in future 10–15 years. Plat. Meteorol. 2004, 23, 919–929. (In Chinese) [Google Scholar]
  38. Ding, Y.H.; Sun, Y.; Wang, Z.Y.; Zhu, Y.X.; Song, Y.F. Inter-decadal variation of the summer precipitation in China and its association with decreasing Asian summer monsoon Part II: Possible causes. Int. J. Climatol. 2009, 29, 1926–1944. [Google Scholar] [CrossRef]
  39. Zhang, Z.Y.; Xu, X.D.; Qiao, L.; Gong, D.Y.; Kim, S.J.; Wang, Y.J.; Mao, R. Numerical simulations of the effects of regional topography on haze pollution in Beijing. Sci. Rep. 2018, 8, 5504. [Google Scholar] [CrossRef]
  40. Chow, F.K.; Yu, K.A.; Young, A.; James, E.; Grell, G.A.; Csiszar, I.; Tsidulko, M.; Freitas, S.; Pereira, G.; Giglio, L. High-Resolution Smoke Forecasting for the 2018 Camp Fire in California. Bull. Am. Meteorol. Soc. 2022, 103, 1531–1552. [Google Scholar] [CrossRef]
  41. Xu, R.B.; Ye, T.T.; Yue, X.; Yang, Z.Y.; Yu, W.H.; Zhang, Y.W.; Bell, M.L.; Morawska, L.; Yu, P.; Zhang, Y.X. Global population exposure to landscape fire air pollution from 2000 to 2019. Nature 2023, 621, 521–529. [Google Scholar] [CrossRef]
  42. Zhao, H.Y.; Zhang, Q.; Gao, G.; Lu, E. Characteristic analysis of agricultural drought disaster in China during 1951–2007. J. Nat. Disasters 2010, 19, 201–206. (In Chinese) [Google Scholar]
  43. Hu, Y.N.; Li, K.; Xu, Y.L. Characteristic Analysis of Agricultural Meteorological Disasters and Risk Assessment of the Crop Loss in North China Plain during 1951-2010. Chin. J. Agrometeorol. 2013, 34, 197–203. [Google Scholar]
  44. Available online: https://www.mem.gov.cn/xw/yjglbgzdt/202310/t20231008_465002.shtml (accessed on 8 October 2023).
  45. Zhang, J.; Sun, F.B.; Liu, W.B.; Liu, J.H.; Wang, H. Spatio-temporal patterns of drought evolution over the Beijing-Tianjin-Hebei region, China. J. Geogra. Sci. 2019, 29, 863–876. [Google Scholar] [CrossRef]
  46. Kuang, W.H.; Chen, L.J.; Liu, J.Y.; Xiang, W.N.; Chi, W.F.; Lu, D.S.; Yang, T.R.; Pan, T.; Liu, A.L. Remote sensing-based artificial surface cover classification in Asia and spatial pattern analysis. Sci. China Earth Sci. 2016, 59, 1720–1737. [Google Scholar] [CrossRef]
  47. Available online: http://cmdp.ncc-cma.net/Monitoring/cn_index_130.php (accessed on 10 July 2023).
  48. McKee, T.B.; Doesken, N.J.; Doesken, J. The relationship of drought frequency and duration to time scale. In Proceedings of the Eighth Conference on Applied Climatology. American Meteorological Society, Anaheim, CA, USA, 17–22 January 1993; pp. 179–184. [Google Scholar]
  49. Lorenz, E.N. Seasonal and irregular variations of the Northern Hemisphere sea-level pressure profile. J. Meteorol. 1951, 8, 52–59. [Google Scholar] [CrossRef]
  50. North, G.R.; Bell, T.L.; Cahalan, R.F.; Moeng, F.J. Sampling errors in the estimation of Empirical Orthogonal Functions. Mon. Weather Rev. 1982, 110, 699–706. [Google Scholar] [CrossRef]
  51. Torrence, C.; Compo, G.P. A practical guide to wavelet analysis. Bull. Am. Meteorol. Soc. 1998, 79, 61–78. [Google Scholar] [CrossRef]
  52. Hope, A.C.A. A simplified Monte Carlo significance test procedure. J. Roy. Stat. Soc. 1968, 30, 582–598. [Google Scholar] [CrossRef]
  53. Huang, R.H.; Xu, Y.H.; Zhou, L.T. The interdecadal variations of summer precipitation in China and the drought trend in North China. Plat. Meteorol. 1999, 18, 465–476. [Google Scholar]
  54. Hao, L.S.; Ding, Y.H.; Kang, W.Y. Relationship between changes in Indian Ocean SST and reduced summer precipitation in North China. Clim. Chang. Res. Bull. 2012, 1, 13–31. (In Chinese) [Google Scholar]
  55. Qian, C.; Zhou, T.J. Multidecadal variability of North China aridity and its relationship to PDO during 1900–2010. J. Clim. 2014, 27, 1210–1222. [Google Scholar] [CrossRef]
Figure 1. Terrain ((a) triangles represent 85 national meteorological stations), and land use (b), and spatial patterns of annual average temperature ((c) barplot in the lower right corner is monthly average temperature; Jan: January; Apr: April; Jul: July; Oct: October) and annual precipitation ((d) barplot in the lower right corner is monthly precipitation; the meanings of the abbreviated months are consistent with Figure 1c) in the Beijing–Tianjin–Hebei region.
Water 15 04230 g001
Figure 2. Monthly mean variations in the MCI in the Beijing–Tianjin–Hebei region (Jan: January; Feb: February; Mar: March; Apr: April; May: May; Jun: June; Jul: July: Aug: August; Sep: September; Oct: October; Nov: November; Dec: December).
Water 15 04230 g002
Figure 3. Spatial pattern of mean value (left column), standard deviation (middle column), and trend (right column; units: 10 a−1; the black circles denote significance at a confidence level of 0.05) of annual (top row) and May–June MCI (bottom row) during 1961–2022.
Water 15 04230 g003
Figure 4. Spatial pattern of the first two EOF modes of the May–June MCI during 1961–2023 (the first two EOF modes both passed the North test).
Water 15 04230 g004
Figure 5. Probability density function pattern of the May–June MCI over 1961–2023, 1961–1990, and 1991–2023.
Water 15 04230 g005
Figure 6. Spatial distribution of May–June MCI intensity at three different return periods (10-, 20-, 50-year return periods; contour) and May–June MCI intensity in 2023 (scatter).
Water 15 04230 g006
Figure 7. Wavelet coherence between the May–June MCI and SST indices (PPVAI: Pacific Polar Vortex Area Index; IOWPAI: Indian Ocean Warm Pool Area Index; IOBWI: Indian Ocean Basin-Wide Index; IOWPSI: Indian Ocean Warm Pool Strength Index). Solid black lines represent passing the 95% significance test; black arrows to the right/left indicate that the two factors are in phase/anti-phase.
Water 15 04230 g007
Table 1. The values of the seasonal adjustment coefficient (Ka) for different months in the BTH region.
Month123456789101112
Ka0.40.81.01.21.21.21.21.01.00.80.60.4
Table 2. Top five correlation coefficients of the May–June MCI and atmospheric circulation, SST indices.
Atmospheric Circulation/SST IndicesCorrelation Coefficient
Pacific Polar Vortex Area Index−0.392 **
NINO B SSTA Index0.368 *
Indian Ocean Warm Pool Area Index0.389 **
Indian Ocean Basin-Wide Index0.390 **
Indian Ocean Warm Pool Strength Index0.398 **
Note: ** and * passed significance at a confidence level of 0.01 and 0.05, respectively.
Disclaimer/Publisher’s Note: The statements, opinions and data contained in all publications are solely those of the individual author(s) and contributor(s) and not of MDPI and/or the editor(s). MDPI and/or the editor(s) disclaim responsibility for any injury to people or property resulting from any ideas, methods, instructions or products referred to in the content.

