Abstract
Global warming results in increasingly widespread wildfires, mostly in Siberia, but also in North America and Europe, which are responsible for the uncontrollable emission of pollutants, also to the High Arctic region. This study examines 11 samples of rainfall collected in August in a coastal area of southern Bellsund (Svalbard, Norway). It covers detailed analysis of major ions (i.e., Cl−, NO3−, and SO42−) and elements (i.e., Cu, Fe, Mn, Pb, and Zn) to Hybrid Single-Particle Langrarian Integrated Trajectory( HYSPLIT) backward air mass trajectories. The research of wildfires, volcanic activities, and dust storms in the Northern Hemisphere has permitted the assessment of their relations to the fluctuations and origins of elements. We distinguished at least 2 days (27 and 28 August) with evident influence of volcanic activity in the Aleutian and Kuril–Kamchatka trenches. Volcanic activity was also observed in the case of the Siberian wildfires, as confirmed by air mass trajectories. Based on the presence of non-sea K (nsK), non-sea sulphates (nss), and Ca (the soil factor of burned areas), the continuous influence of wildfires on rainfall chemistry was also found. Moreover, dust storms in Eurasia were mainly responsible for the transport of Zn, Pb, and Cd to Svalbard. Global warming may lead to the increased deposition of mixed-origin pollutants in the summer season in the Arctic.
1. Introduction
The atmosphere is the most efficient medium of transport for pollutants from lower latitude areas [1,2,3,4]. During the process of the long-range atmospheric transport of pollutants (LRATP), chemical compounds and trace elements may be dispersed in the atmosphere in particulate, aerosol, or gaseous forms and, consequently, reach the Arctic [5,6,7]. The main role of precipitation is the purification of pollutants from the atmosphere, significantly contributing to their deposition in the terrestrial environment [8,9,10].
The Svalbard archipelago is characterised by the low emission of pollutants from local sources such as coal mines and several permanent settlements (e.g., Longyearbyen, Barentsburg, Ny-Alesund), which are among the main sources of anthropogenic trace elements in the area. Human presence in Svalbard, however, also results in the direct emission of pollutants from the combustion of coal in heat and power plants, waste incineration, sewage discharge, and the development of the tourist activities of cruise ships (in the vicinity of Hornsund, Bellsund, Isfjord, Nordaustlandet, and Edgeoya), as well as local traffic and the operation of airports [3,11,12,13]. Pollutants from LRATP are primarily emitted from the urbanised and industrialised areas of Greenland, Iceland, North America, and Eurasia [3,13].
The concentrations of trace elements in rainfall samples during the summer season could be influenced by pollutants originated from both natural sources (volcanic eruptions, forest fires, and dust storms, among others) and anthropogenic sources (the combustion of fossil fuels and oils, industrial processes, smelting, vehicular traffic, waste incineration (As, Cd, Cr, Mn, Pb, Sb, Se, Sn, and Zn), non-ferrous metal production, iron/steel manufacturing, and cement production, among others) [3,11,14,15]. To date, studies on rainwater chemistry in Svalbard have mainly focused on the analysis of major ions [16,17], trace elements [5,8,18,19] and, less frequently, organic compounds such as PAHs [9,20]. None of the aforementioned works attempted to link precipitation chemistry to natural phenomena like forest fires, volcanic eruptions, or dust storms, and none looked for their origin in these very phenomena occurring in the Northern Hemisphere. To the best of our knowledge, the first attempt to search for the influence of volcanic eruptions on water chemistry in Svalbard was a study conducted in Fuglebekken Creek [9,21]. The present work is the first to comprehensively describe the natural phenomena occurring in the Northern Hemisphere and to relate them to rainwater chemistry in Svalbard. An extensive review of the interdisciplinary literature is a valuable source of information regarding the chemistry of precipitation in Svalbard, as well as trace elements emitted into the atmosphere as a result of volcanic eruptions, wildfires, and dust storms. The elements supplied with rainfall to the Calypsostranda marine terrace in August 2016 largely reached that coastal area as a result of the long-range atmospheric transport of pollutants clearly related to natural sources from areas of lower latitude [5]. This result served as the starting point for detailed chemical data analysis and for the determination of the origin of elements.
The main objective of this paper is to investigate connections among the extreme natural events which took place in the summer of 2016 in areas of lower latitude. Specifically, it investigates the origin of the major and trace elements transported to Spitsbergen as a result of LRATP, using the rainfall chemistry features of the Bellsund coast as an example. This involved the detailed analysis of the results of selected anions, major and trace elements, and dissolved organic carbon (DOC) in each of the rainfall samples from the Calypsostranda marine terrace [5]. Moreover, particular emphasis was given to the analysis of the variation of air mass inflows in August, as well as to the literature on pollutant emissions from natural events such as volcanic eruptions in the Aleutian Trench [22] or Kuri–Kamchatka Trench [23], wildfires in Siberia [24], Alaska [25], or Canada [26], and soil dust transport from Iceland [27], Alaska [28], Greenland [29], or Eurasia [27], as well as human activities at lower latitudes [13].
2. Materials and Methods
2.1. Sampling Location and Analytical Methods
Calypsostranda occupies an area of approximately 6 km2 (the NW part of Wedel-Jarlsberg Land, SW Svalbard) between Josephbukta and Skilvika, and is adjacent to the Renard and Scott glaciers. It constitutes a complex of raised marine terraces (25–120 m ASL), which are cut by numerous erosive dissections. They are composed of till intercalations, gravels with clay, and marine sands [30,31,32]. The precipitation gauge utilized in this study was located at an altitude of 44 m ASL on the Calypsostranda marine terrace (Figure 1). The rainfall samples were collected between 23 July and 31 August 2016. The meteorological conditions on the Calypsostranda marine terraces have been measured only during the summer seasons since 1986. This is due to the fact that the Calypsobyen Polar Station operates only at this time of the year. Meteorological conditions spanning the multiannual period from 1986 to 2011 are as follows: average wind speed (4.3 m/s), average precipitation (32.4 mm), and average air temperature (5.0 °C) [33].
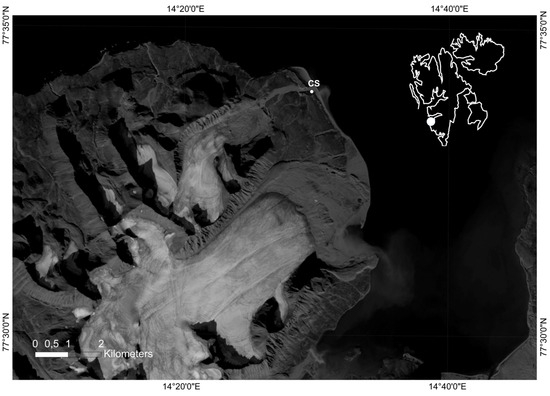
Figure 1.
Location of the Hellman rain gauges in the Calypsostranda marine terrace.
For the analyses of physicochemical properties (pH, SEC) performed at the Calyp-sobyen field laboratory, a microcomputer pH/conductometer CPC-411 by Elmetron, equipped with an electrode type EPS-1, was used, as well as a conductivity sensor EC. Organic (DOC) and inorganic analytes (anions and elements) were determined after the delivery of samples to the laboratory in Poland. Deionised water of the Mili-Q type (Mili-Q® Ultrapure Water Purification Systems, Millipore®, Burlington, MA, USA) was used in each step of the analytical procedure in the laboratories. Detailed information regarding the applied analytical methods and validation parameters of these analytical procedures, as well as details regarding quality accuracy and quality control (QA/QC), are presented in Table 1. Meteorological measurements of temperature (T) and precipitation amount (P) were conducted using the equipment and procedures described in a previous work [5].

Table 1.
Validation parameters of the analytical procedures for the determination of major ions and trace elements in the precipitation samples.
2.2. Hybrid Single-Particle Langrarian Integrated Trajectory (HYSPLIT)
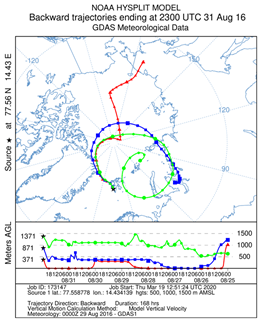
As a supportive tool for assessing the origin of pollutants inflowing to the Arctic in the study period, the NOAA Air Resources Lab HYSPLIT trajectories model was employed [34,35]. The analysis of directions of the inflow of air masses was performed with a model that verified the backward trajectories on the measurement day at 23:00 UTC, located at altitudes of 500, 1000, and 1500 m above sea level (ASL), which corresponds to 371, 871, 1371 m above ground level (AGL), respectively. A set of GDAS meteorological data for wind speed, as well as model vertical velocity (the vertical movement of air masses), was applied. A backward forecast period of 168 h was adopted to minimize errors which may occur due to the high degree of complexity of the natural processes of atmospheric circulation.
2.3. Factors for Results Analysis
Non-sea SO42− (nss) are considered a tracker for ship emissions [17] and volcanic emissions [36] and, together with non-sea potassium (nsK), a tracker for wildfires [37]. Both nss and nsK were calculated in this study according to the formulas given in the literature [15,19].
3. Results and Discussion
Based on the results of the backward air mass trajectories, areas of lower latitude were selected, from which pollutants could most likely have been transported to the Calypsostranda marine terrace in August 2016. This allowed for the selection of extreme natural phenomena related to these areas (volcanic eruptions, wildfires, and dust storms), which were responsible for the emission of metals and non-metals to the atmosphere within the study period. The details concerning air mass trajectories are described in Table 2. Individual phenomena, as well as their potential effect on the concentrations of major and trace elements in Bellsund rainfall, are discussed in detail in Section 3.1.
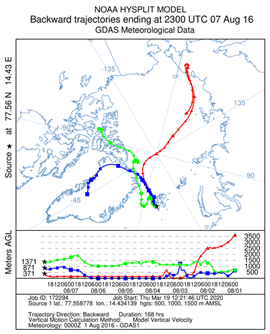
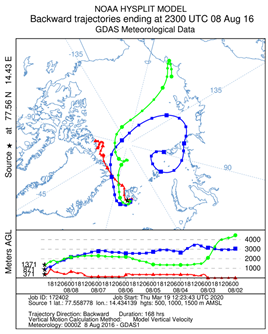
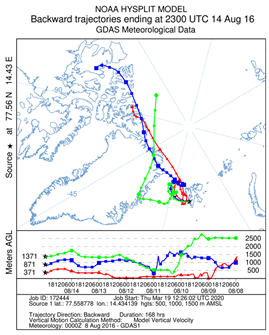
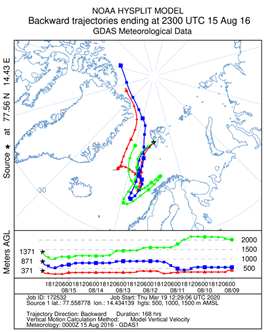
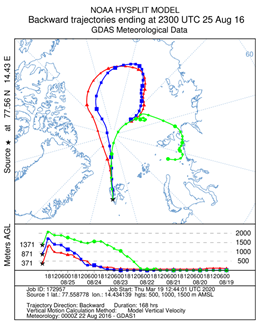
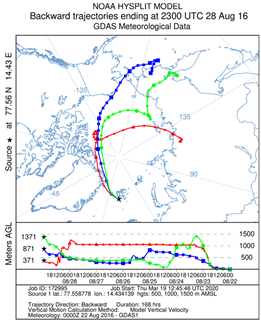
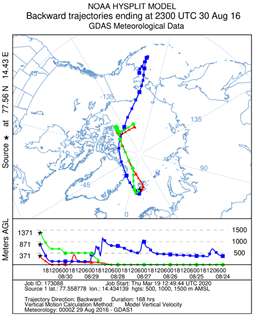
Table 2.
Models of 7-day back-trajectories (BTs) for 7 (A), 8 (B), 14 (C), 15 (D), 16 (E), 17 (F), 25 (G), 28 (H), 29 (I), 30 (J), and 31 August (K) 2016. Air mass trajectories which reach Calypsostranda at the height of 371 m AGL (red), 871 AGL (blue), and 1371 AGL (green).
3.1. Natural and Anthropogenic Origins of Pollutants
The analysis of the pollution sources of the southern edge of Bellsund [5] showed that only the results of rainfall samples collected on the Calypsostranda marine terrace were under the impact of the local orographic effect on trace element deposition. The results of the cluster analysis of selected elements present in the Calypsostranda rain samples allowed for the differentiation of their sources into local, on the one hand, and related to the process of LRTAP, on the other. At the same time, the results also indicated the predominant influence of natural sources related to their emission to the atmosphere. Therefore, the impact of extreme natural phenomena occurring in lower latitudes, on the chemical features of rainfall in Bellsund, is discussed in detail later in this paper, based on the air mass trajectories (Table 2, parts A–K) and data given in Table 3, which presents the chemical analysis results in 11 rainfall samples.
Table 3.
Results of the meteorological measurements and chemical analysis of the rainfall samples collected on Calypsostranda (nd—non-determined, <LOD—below limit of detection).
3.1.1. Volcanic Eruptions
Volcano gasses may be a source of Na, K, Fe, Zn, Pb, Cu, Sb, Li, Mn, Ni, Bi, Sr, Mo, As, and Cd, while elements such as Si, Ca, Al, Mg, Ti, V, and Cr are more concentrated in solids than in gaseous forms [38]. Elemental bismuth (Bi) was considered a good source for estimating volcanic natural background [39]; nevertheless, it was found that, despite a huge amount of Bi emitted to the atmosphere from volcanoes and rock-soil dust (1200–1700 tones/year and 40 tones/year, respectively), anthropogenic sources, such as oil and coal combustion, aluminium production, ferromanganese alloy manufacturing, and refuse incineration, are still responsible for up to 80% of Bi emitted to the atmosphere [40]. Even though Bi does not reflect volcanic background, it may be used for tracing volcanic activity and eruptions. In the rainfall samples collected from the coastal area of Bellsund, the highest concentrations of Bi (23.5 µg/L) was recorded on 7 August, as was the case with Al (5.38 µg/L), As (0.276 µg/L), Co (1.81 µg/L), Cr (0.403 µg/L), Mn (3.32 µg/L), Mo (0.796 µg/L), Ni (66.4 µg/L), Pb (3.74 µg/L), Sb (0.190 µg/L), V (0.344 µg/L), and Zn (184 µg/L). Higher than average levels of Ag (0.174 µg/L) and Cd (0.278 µg/L), and the presence of Ba (4.08 µg/L) and Hg, were also recorded on 7 August. (0.044 µg/L) (Table 3). This was most likely related to air masses inflowing from the Chukotka Mountains (Table 2, part A), closest to the volcanic region of Kamchatka and Alaska, active in July and August. The possible volcanic source of Bi is also indicated by the significant relationship between Bi and V (rs = 0.964), as well as with Mo (rs = 0.909), As (rs = 0.900), Sb (rs = 0.843), Li (rs = 0.733), Co (rs = 0.609), and the mean air temperature T (rs = 0.773) at Calypsostranda [5].
A gradual decrease in the concentration of Bi was observed, despite the re-inflow of air masses from North Siberia and Russia between 25 and 31 August (Figure 2A), with one exception on 28 August, when air masses almost reached the Kamchatka region (Table 2, part H).
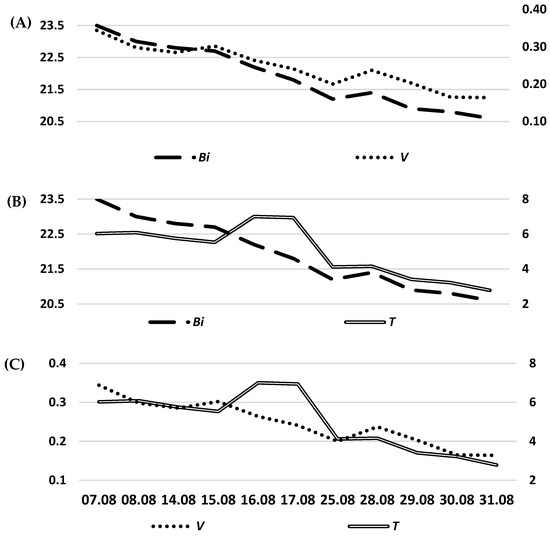
Figure 2.
The relationship between the concentrations of Bi and V (A), as well as that between Bi and T (B), and V and T (C).
Fresh ashes from the Pavlof volcanic eruption on 28 April 2016 contained metal oxides in the following order of contribution: Al2O3 > Fe2O3 > Na2O > MgO > CaO > TiO2 > K2O > P2O5 > MnO. High concentrations of trace elements Sr (404 ppm), Ba (306 ppm), V (236 ppm), Zn (112 ppm), Cu (40.9 ppm), and Co (19.8 ppm) were found, as was the presence of Li (13.0 ppm), Cr (10 ppm), Pb (4.83 ppm), Ni (4 ppm), As (3.67 ppm), Mo (1.07 ppm), U (0.606 ppm), Cd (0.136 ppm), Sb (0.126 ppm), and Ag (0.082 ppm) [22]. In the case of Shiveluch, only the composition of xenoliths was known. They were found to be a source of SiO2 > MgO > FeO (total Fe) > Al2O3 > CaO > Cr2O3 > Na2O > K2O > MnO > TiO2 > P2O5 [41]. Ionow et al. [23] provided more comprehensive information regarding rock composition in the Klyuchevskoy group of volcanoes, including Shiveluch. The host enclaves for minerals are made of Mg, Fe, Cr, and Al. They include olivines composed of Mg and Fe, with low CaO (<0.1% weight) and high NiO (approximately 0.4% weight) concentrations, as well as spinels composed of Mg, Cr, and Al. The xenoliths from the Klyuchevskoy group of volcanoes generally also include CaO and elements with contributions in the following order: Ba > V > Sr > Zn > Co > Ni > Pb > U [23].
It is very likely that, at the beginning of August, air masses at a height of 1.5–3.5 km ASL over NE Siberia were in contact with the residues of volcanic eruptions that took place at the end of July in the Kamchatka and Alaska regions, contributing to the highest recorded concentrations of elements in the collected samples on 7 August (Table 2, part A). This is strongly indicated by one of the highest concentrations of Ba on record, and by the highest concentrations of Al, V, and Cr recorded at very high levels in volcanic ashes from the Pavlof volcano and in the rocks of the Klyuchevskoy group of volcanoes. Furthermore, rainfall from 7 August stands out with concentrations of K (2180 µg/L), Zn (184 µg/L), Pb, Sb, Li, Mn, Ni, Mo, As, Cd, and Sr which were higher then than on any other day. Elevated concentrations of Fe found in volcanic gasses were also recorded, as well as in the ashes and rocks of the volcanic region (Table 3).
3.1.2. Wildfires
Summer, especially July and August, are considered to be the season of wildfires in the Northern Hemisphere due to the abnormally hot and dry weather, which results from climate change [24,42,43,44]. During wildfires, elements behave differently, and may be divided into active air migrants (Cd, Pb, As, Sb, Se, Mn, Zn, U, and Sr) and those accumulated in the burned area (Cr, Ni, Co, V, Th, Mg, K, Na, Ca, and Al) [24,45]. Elements emitted during wildfires may be of both lithophilic and anthropogenic origin [24,46,47]. The atmosphere affected by smoke emissions from Siberian wildfires showed elevated concentrations of Ti, V, Mn, Fe, Ni, Co, Cu, Zn, As, Se, Sr, Cd, Ba, and Pb. Aerosol element enrichment occurred in the following order: Al > Be > B > Zn > Mo > U > Sn > As > W > Tl > Sb > Cd > Ag > Se > Ni > Co > Li > Th > Cu > Pb. Studies conducted in the areas of Lake Baikal, considered to be one of the purest places in the world, also showed elevated concentrations of NH4+, K+, NO3−, SO42−, B, Mn, Zn, As, Sr, Cd, and Pb in aerosol, suggesting the inflow of air masses affected by wildfires in Central Siberia [24]. Some researchers in their work [37] have indicated that non-sea K (nsK) and non-sea SO42− (nss) over Svalbard may originate from Siberian wildfires. In the summer of 2016, areas of the Russian Federation damaged by wildfires were estimated for up to 6.34 mln ha. Information on the activity of Siberian wildfires and the transport of polluted air masses in the Northern Hemisphere is given in Supplementary Material S1. Next to volcanic gasses, the plume of polluted air from Siberian wildfires was also likely a source of the highest concentrations of elements recorded in summer rainfall on 7 August, based on Calypsostranda rainfall samples. The influxes of air masses from a height between 1.5 and 3.5 km ASL were also observed on 7, 14, 15, 16, and 25 August. On 14 and 15 August, they were located over the Arctic Ocean and NE Greenland; on 16 August, they were located over Central Greenland; and, on 25 August, they were located over the Arctic Ocean and Svalbard. The chemical composition of rainfall in these cases did not show pollution as high as that on 7 August. Moreover, they were characterised by the lowest sum of trace elements recorded in the sampling period, suggesting that high-altitude air masses in the second half of August over the Arctic Ocean and Greenland were not as polluted as at those over the northern coast of Eurasia at the beginning of August.
The Chukotka district, where air masses inflowed to Calypsostranda from on 7 August and between 28 and 31 August, was considered a region with no fire dynamics between the years 2000 and 2017 [48]; however, in summer 2016, wildfires were recorded in the neighbouring areas of the Kamchatka and Magadan districts [49]. It, therefore, cannot be excluded that gasses, ashes, or polluted dust from these regions were also transported later on to the Chukotka district and, consequently, to Svalbard.
In Alaska, over much of July, wildfires burned 45, 793 ha in the area of Kobuk-Koyukuk and the Alatna Complex [25], but their contribution to air pollution was relatively low in comparison to Siberian wildfires in the same year.
The largest wildfire in Canada started on 3 May 2016. It was declared under control after two months on 5 July, but was fully extinguished only by the end of the year. In Fort McMurray and the Athabasca Oil Sands Region (AOSR), rich in bitumen and crude oil, 590.0 ha burned during that time. The fire caused environment enrichment with bitumen-origin elements V, Ni, Se, Mo, and Re, detected in moss samples. The wildfire in Fort McMurray and the AOSR was determined to have a lower impact on the regional deposition of those trace elements which are considered major pollutants, relative to ongoing anthropogenic activities caused by the presence of oil sands ore [26]. However, some studies regarding the atmospheric remobilization of contaminants [46] suggest that, like in other places on Earth (California, Chile, USA, and Europe, among others), along with a plume of wildfires, the atmosphere also carried pollutants from industrial enterprises and soil dust. Next to the soil factor (Ca, Si, Ti, Zn), anthropogenic factors can also be designated, such as Cd-Pb (the remobilisation of leaded gasoline deposits), Zn-K (smoke and automobiles), Co-Fe, and Co-Ni (industrial activity) [46,50]. Moreover, during fire periods, maximum elevations of As, Cd, Co, Fe, K, and Zn concentrations were recorded, and K was assumed to be the element associated with biomass burning.
Higher than average concentrations of K and Ca, which suggests the inflow of elements related to wildfires, were recorded on 7, 28, and 29 August (between 2.18 and 445 μg/L) (Table 3). The origin of pollutants related to Siberian wildfires confirmed extremely high concentrations of K and Ca on 7 August. On 28 August (Table 2, part H), a specific air mass trajectory was observed at an altitude between 0.5 and 1.5 km ASL, which contributed to the influx of elements from the vicinity of the volcanic region of Kamchatka and Alaska, Siberian areas burned in the July wildfires, and the industrial part of northern Russia. All of this was manifested similarly to samples from 7 August involving increased concentrations of trace elements As, Bi, Cd, Co, Li, Mn, Li, Pb, Sb, Se, Sr, V, and Zn. While rainfall from 29 August (Table 2, part I) showed a lower concentration of the aforementioned trace elements in comparison with that from 28 August (Table 2 (part H) and Table 3), it was characterised by the content of Cr, Fe, and Ni, at higher concentrations than that recorded the day before, suggesting the increased concentration of these pollutants in air masses at the lower altitude of the atmosphere (below 0.5 km ASL before reaching Svalbard).
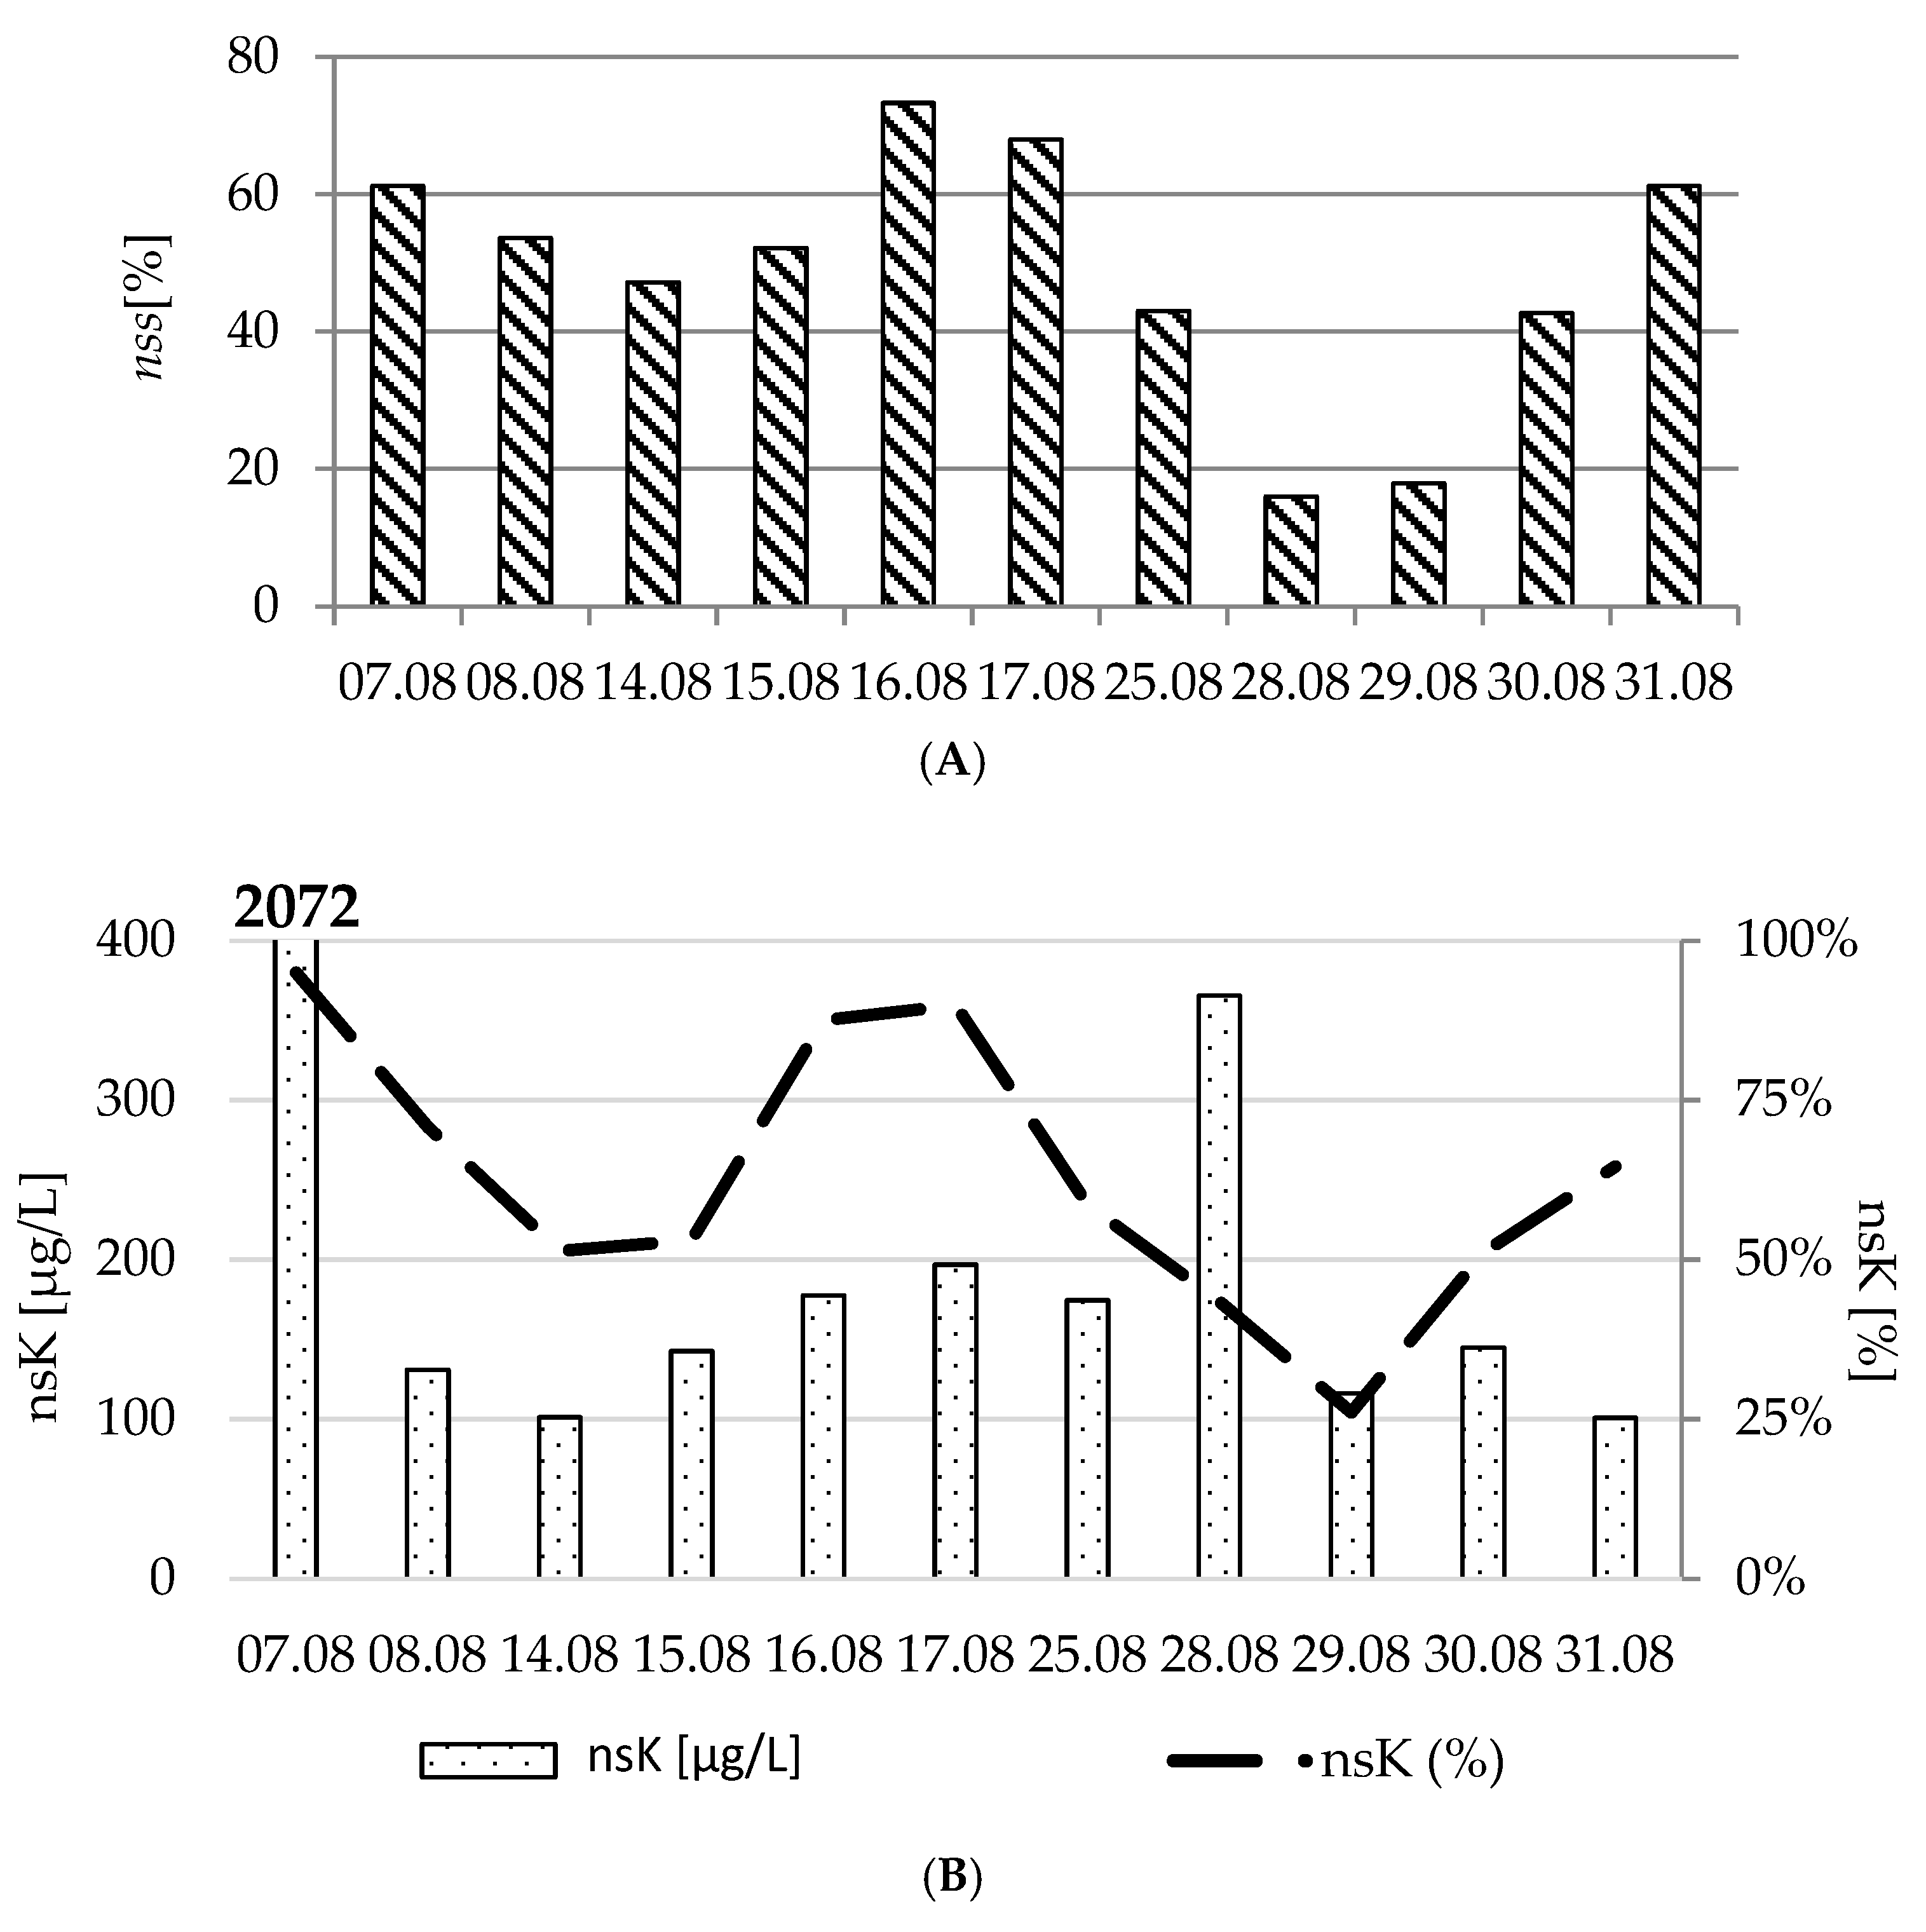
In rainfall samples from Calypsostranda, the percentage contribution of nsK showed very strong positive correlations with the percentage contribution of nss (rs = 0.918) (Table S1). Statistically significant correlations were also found between the nsK percentage contribution and T (rs = 0.645), pH (rs = −0.682), SEC (rs = −0.888), Cl− (rs = −0.873), SO42− (rs = −0.755), Mg (rs = −0.864), and Na (rs = −0.809). Similarly significant correlations were noted between the percentage contributions of nss and T (rs = 0.655), as well as with SEC (rs = −0.961), Cl− (rs = −0.927), SO42− (rs = −0.809), Mg (rs = −0.936), Na (rs = −0.891), and Sr (rs = −0.688). This suggests that the percentage increase in both nss and nsK was favoured by the influx of warm air masses poor in elements of marine origin [5]. Based on this assumption, the constant inflow of nsK and nss originated from wildfires was observed in every rainfall sample, suggesting the ongoing impact of wildfires on the chemical composition of August rainfall in Bellsund (Figure 3A,B). The highest percentage contributions of nsK (71–95%) were recorded on 7, 8, 16, and 17 August (Figure 3B). The percentage contributions of nsK between 51% and 65% were observed on 14, 15, 25, 30, and 31 August. The lowest percentage contributions of nsK were observed on 28 and 29 August (43% and 26%, respectively). It is noteworthy that there was a significant correlation between the concentration of K with nsK (rs = 0.647) and elements of marine origin (Cl−, SO42−, Mg, Na), as well as with Al (rs = 0.745), Ca (rs = 0.609), and Mn (rs = 0.709), while nsK shows a significant correlation with Co (rs = 0.620) and Mn (rs = 0.774) (Table 2). This indicates the differentiated sources of K and the strong correlation of nsK with elements of the soil of the burned area (Co) and the active air migrant (Mn) [24].
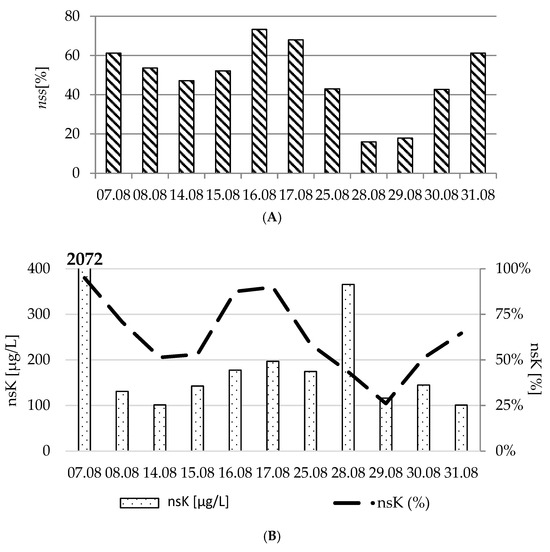
Figure 3.
Percentage contribution of nss in total concentration of sulphates (A) and nsK as well as the concentration of nsK (B) in rainfall samples collected from Calypsostranda.
The calculated concentrations of nsK were the highest on 7 and 28 August (2072 µg/L and 366 µg/L) (Figure 3B), when polluted air was strongly related to far NE Siberia (Table 2, parts A and H). Concentrations of nsK between 150 and 200 µg/L were recorded on 16, 17, and 25 August when the air masses were mostly above the surface of the Greenland Sea and the Arctic Ocean at an altitude of less than 1.5 km ASL (Table 2, parts E–G). In these cases, ship transportation can also be considered a source of K and SO42−, with an emission peak observed in spring and summer [51]. Non-sea K at concentrations of 143 µg/L and 145 µg/L was recorded on 15 and 30 August, respectively (Figure 3B). Air masses in these cases travelled from differentiated directions, but mostly at a height below 1.0 km ASL, except for one air stream on 15 August, which also showed high concentration of Ca (49.5 µg/L) (a soil factor of burned areas indicating the impact of wildfires in Eurasian areas). On 30 August, nsK was accompanied by very high concentrations of Ag (0.235 µg/L), Cd (0.677 µg/L), Cr (0.064 µg/L), Co (0.042 µg/L), Pb (3.36 µg/L), Se (0.598), and Zn (81.8) (Table 3, Figure 3B), pointing to emissions from wildfires in more urbanised and industrialised areas as well as in North America. The increased presence of these pollutants in the samples suggests the potential remobilisation of leaded gasoline (Cd-Pb) during fires. Other sources may be smoke from automobiles (Zn-K), as well as waste incineration (Pb-Zn) and fossil (Cr and Co, among others). Rainfall samples collected on 8 and 29 August had nsK concentrations of 131 µg/L and 116 µg/L, respectively (Figure 3B), and were characterised by both differentiated air mass trajectories and altitudes (Table 2, parts B and I). Both samples, however, showed higher than average concentrations of the soil factors of the burned areas (Ca and Ni) (Table 3), suggesting their wildfire origin was in far NE Siberia. Concentrations of nsK on 14 and 31 August (Table 2, parts C and K) were the same (101 µg/L) (Figure 3B). In these cases, air mass trajectories and their altitudes ASL are also different. They were, however, characterised by very low concentrations of Ca (11 µg/L and 9.2 µg/L, respectively), as well as similar concentrations of Zn, suggesting prevalent smoke sources from automobiles (Zn-K) for nsK and dominant anthropogenic sources for other elements.
3.1.3. Dust Transport
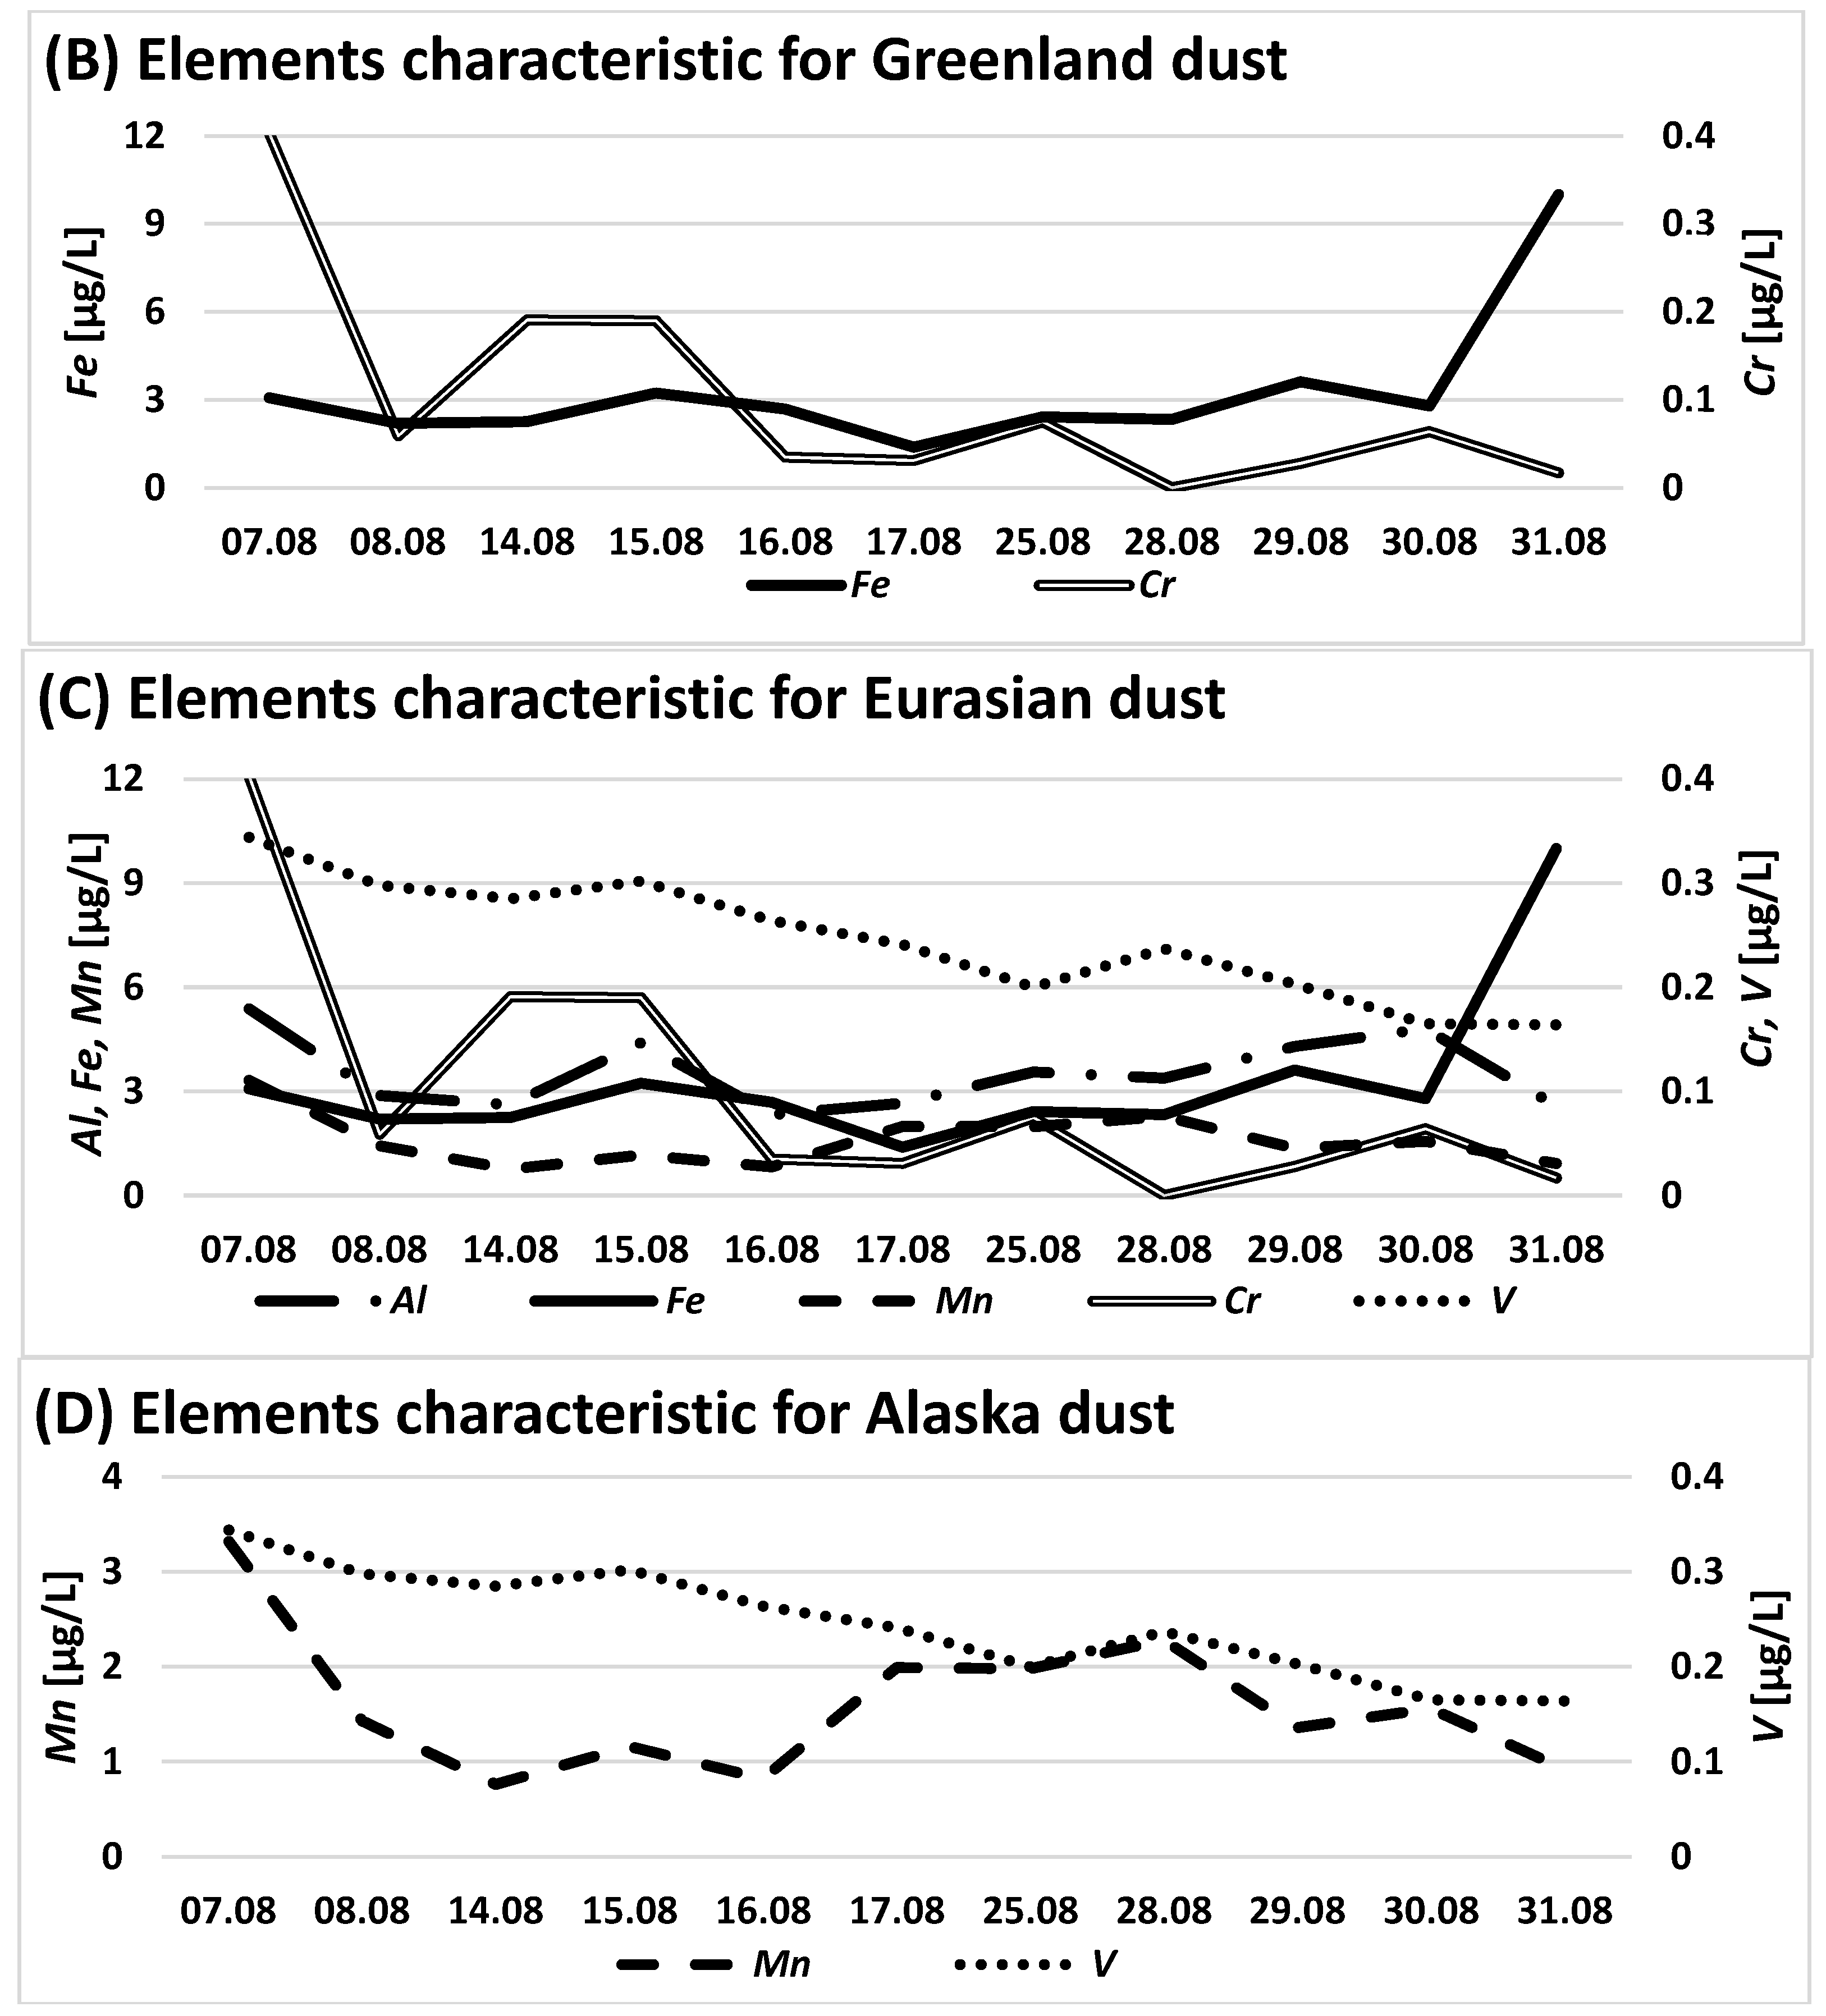
The end of summer, namely August, is the beginning of the season of dust storms in Iceland, Alaska, Canada, and Russia, but also in Antarctica, New Zealand, and Patagonia [27,29,52]. Dust storms deliver elements primarily of soil origin (Mg, P, Ca, Mn, Fe, K, Al, and Si) [53]. However, depending on the region (Iceland, Greenland, Alaska, or Eurasia), different compositions of dust fractions were observed [29]. Iceland, considered a volcanic island, delivered the highest amounts of dust rich in Fe, Cr, and V. Icelandic dust primarily originated from 30 active volcanic systems and glacier catchments [27,54]. Greenland dust transports Fe and Cr, but also Ti. The most diverse element composition is represented by Eurasian dust fractions (Al, Fe, Mn, Ti, Cr, and V), while Alaska mainly delivers dust rich in elements such as Mn and V [29]. Figure 4A–D present temporal variations in concentrations of elements related to dust storms in areas of lower altitude, in rainfall samples collected on the Calypsostranda marine terrace.
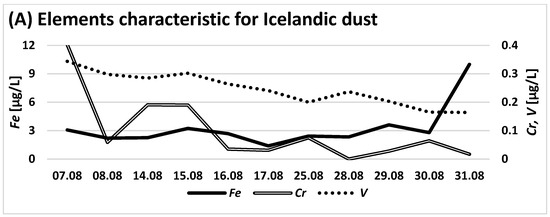
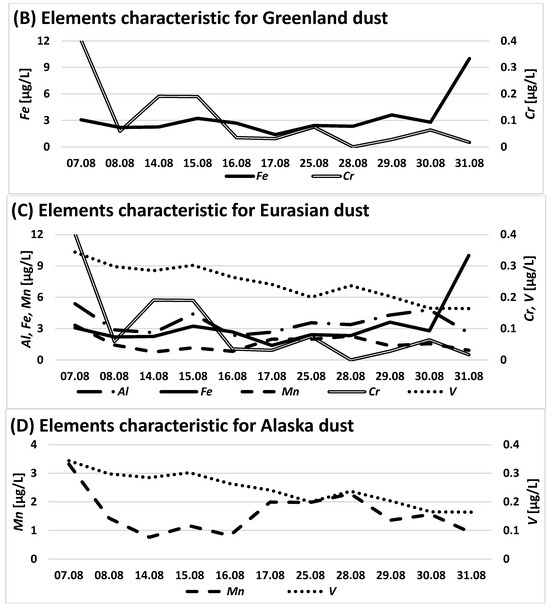
Figure 4.
Concentrations of elements occurring in Calypsostranda rainfall samples characteristic of dust transport footprints from Iceland (A), Greenland (B), Eurasia (C), and Alaska (D).
In the August rainfall samples, a considerable contribution of dust and crustal origin elements [4,53] was manifested by the presence of K, Ca, Al, Fe, Mn, Ba, Co, Cr, and V (Table 3).
In Iceland in 2016, the lowest numbers for sandstorms and unique days of suspension were recorded, at 10 and 8, respectively. Although no volcanic eruptions were observed during the whole year, volcanic ash and unique ash days were noted at a number of 4 and 2, respectively [27]. Air mass inflows that could participate in the transport of dust particles from Iceland were observed only once, on 17 August (Table 2, part F); however, there were no noticeable increases in the concentration of Fe, Cr, and V noted on that day (Figure 4A), which could confirm the transport of Icelandic dust. For Greenland, the inflow of air masses that could promote the transport of dust was recorded on 7, 14, and 16 August (Table 2, parts A, C, E), when they were over its territory. The potential transport of Greenland dust to Svalbard was also favoured by circulating air streams on the east coast of Greenland on 17 August (Table 2, part F), as well as on 8 and 15 August, and between 28 and 31 August (Table 2, parts B, D, H–K), when they were approaching its northern coast.
The air mass backward trajectories shown in Table 2, part A suggest that, on 7 August, the air masses could transport particles not only from the urbanised and industrialised west coast of Greenland, which could be a source of Pb and Zn [13], but also from NE Siberia or even Alaska; however, in this case, as noted in Figure 4C, on 7 August, most of the elements characteristic of Eurasian dust showed an increase. It was, therefore, possible that air jets from these areas were responsible for increased concentrations of Al, Ca, Cr, Fe, Mn, and V, as well as the presence of Ba.
On 14 and 16 August, the presence of air masses over Greenland was recorded (Table 2, parts C and E); however, the increases in element concentration on these days could also be related to the influx of more polluted air from higher altitudes (1.5–3.5 km ASL), as well as from the far north of Canada or Alaska (on 14 August) or northern Europe (on 16 August). Both of the elements (Mn and V) characteristic of Alaska dust showed, on 14 August, a decreasing tendency (Figure 4D), similar to Bi (Figure 3A), which is used for tracking volcanic activity, and nsK or nss, which are used as trackers for wildfires (Figure 3A,B). An increase in the concentrations of Fe and Cr (Figure 4B) would suggest Greenland as a source of elements that reached Calypsostranda on that day, rather than far north Canada.
On 15 August, all three streams of air reached the coasts of northern Europe (Table 2, part D). There was a noticeable increase in the concentration of elements characteristic for Eurasia (Figure 4C). The presence of Ba and high concentrations of Al (4.40 µg/L), Ca (49.5 µg/L), and Mn (1.16 µg/L), as well as Fe (3.23 µg/L), Cr (0.190 µg/L), and V (0.302 µg/L), indicate the presence of Eurasian dust fractions.
On 16 August, two of the air streams were still close to the coast of northern Europe; however, they did not reach the air at the height above 1000 m ASL (Table 2, part E). They were manifested by decreased concentrations of Al, Fe, Mn, Cr, and V related to Eurasian dust (Figure 4C).
During the sampling season, the inflow of air masses from the coastal areas of both Iceland and Greenland was only recorded on 17 August (Table 2, part F). The rainfall sample, however, contained no increased concentrations of elements characteristic of Icelandic, Greenland, or Eurasian dust (Figure 4A,B), suggesting that these air streams did not transport dust from these sites.
The air streams from 25 August arrived from lower altitude areas of the Arctic Ocean and northern Russia (below 500 m ASL) (Table 2, part G). Due to the position of the Arctic front in the first case, the air streams may have been a source of pollutants from ship emissions present in the sample (Co, Ni, and V). The air stream coming from the industrialised coasts of northern Russia, however, was not only a source of pollutants but, also, of dust characteristic of Eurasian fractions (Figure 4C).
On 28 August, streams of air arrived from areas of far NE Siberia (the Kamchatka and Chukotka districts), the coasts of NW Alaska, and northern Russia (Table 2, part H). Higher than average concentrations of elements related to Eurasian and Alaskan dust were recorded (Figure 4C,D). The highest recorded level of Ca (67.4 µg/L) (Table 3), the second highest level of nsK (Figure 3B), and higher concentrations of Al, Fe, and V than what was found in other samples (Table 3), would suggest a Eurasian source of dust (Figure 4C) and the other pollutants related to the burned areas (Cd, Co, Ni, Pb, Sb, Se, and Sr).
Between 29 and 30 August, streams of air withdrew from the terrestrial areas of far NE Siberia (Table 2, parts I and J). On 29 August, the impact of the circulation of air masses around the coastal areas of Chukotka, on the chemical composition of the rainfall sample from that day, was still observed (Table 2, part I). An increase in concentrations of Al, Fe, and Cr (Figure 4C), as well as the presence of Cr and Mn, and other elements related to the burned areas (Ca, Mg, Ni, and Sr) (Table 3), pointed to the transport of Eurasian fractions of dust. There was also an evident decrease in the concentrations of Cd, Co, Pb, and Zn (Table 3). On 30 August, one of the air streams started its journey from the Yukon area in Alaska and circulated close to that area’s NE coasts. The increase of Mn and the presence of V were recorded (Figure 4D), suggesting a contribution of dust from the Alaskan fraction but, again, the increase of Al, Mn, and Cr (Figure 4C), as well as the presence of Fe and V, suggested the Eurasian fraction as the original source of the dust. On 31 August 31, a decrease in all the elements related to dust transport, except for Fe (Figure 4A–D), could be noted. However, based on the air masses trajectory (Table 2, part K) and the chemical composition of the rainfall sample collected on 31 August 31, the presence of Fe, Al, Mn, V, and Cr was more likely related to the Eurasian fraction of dust than that of Greenland. This conclusion was also supported by a very low concentration of Cr, which could also have originated from Eurasia, while the level of Fe and the concentrations of Cd, Pb, and Zn strongly indicated an anthropogenic origin from northern Russia.
4. Summary and Conclusions
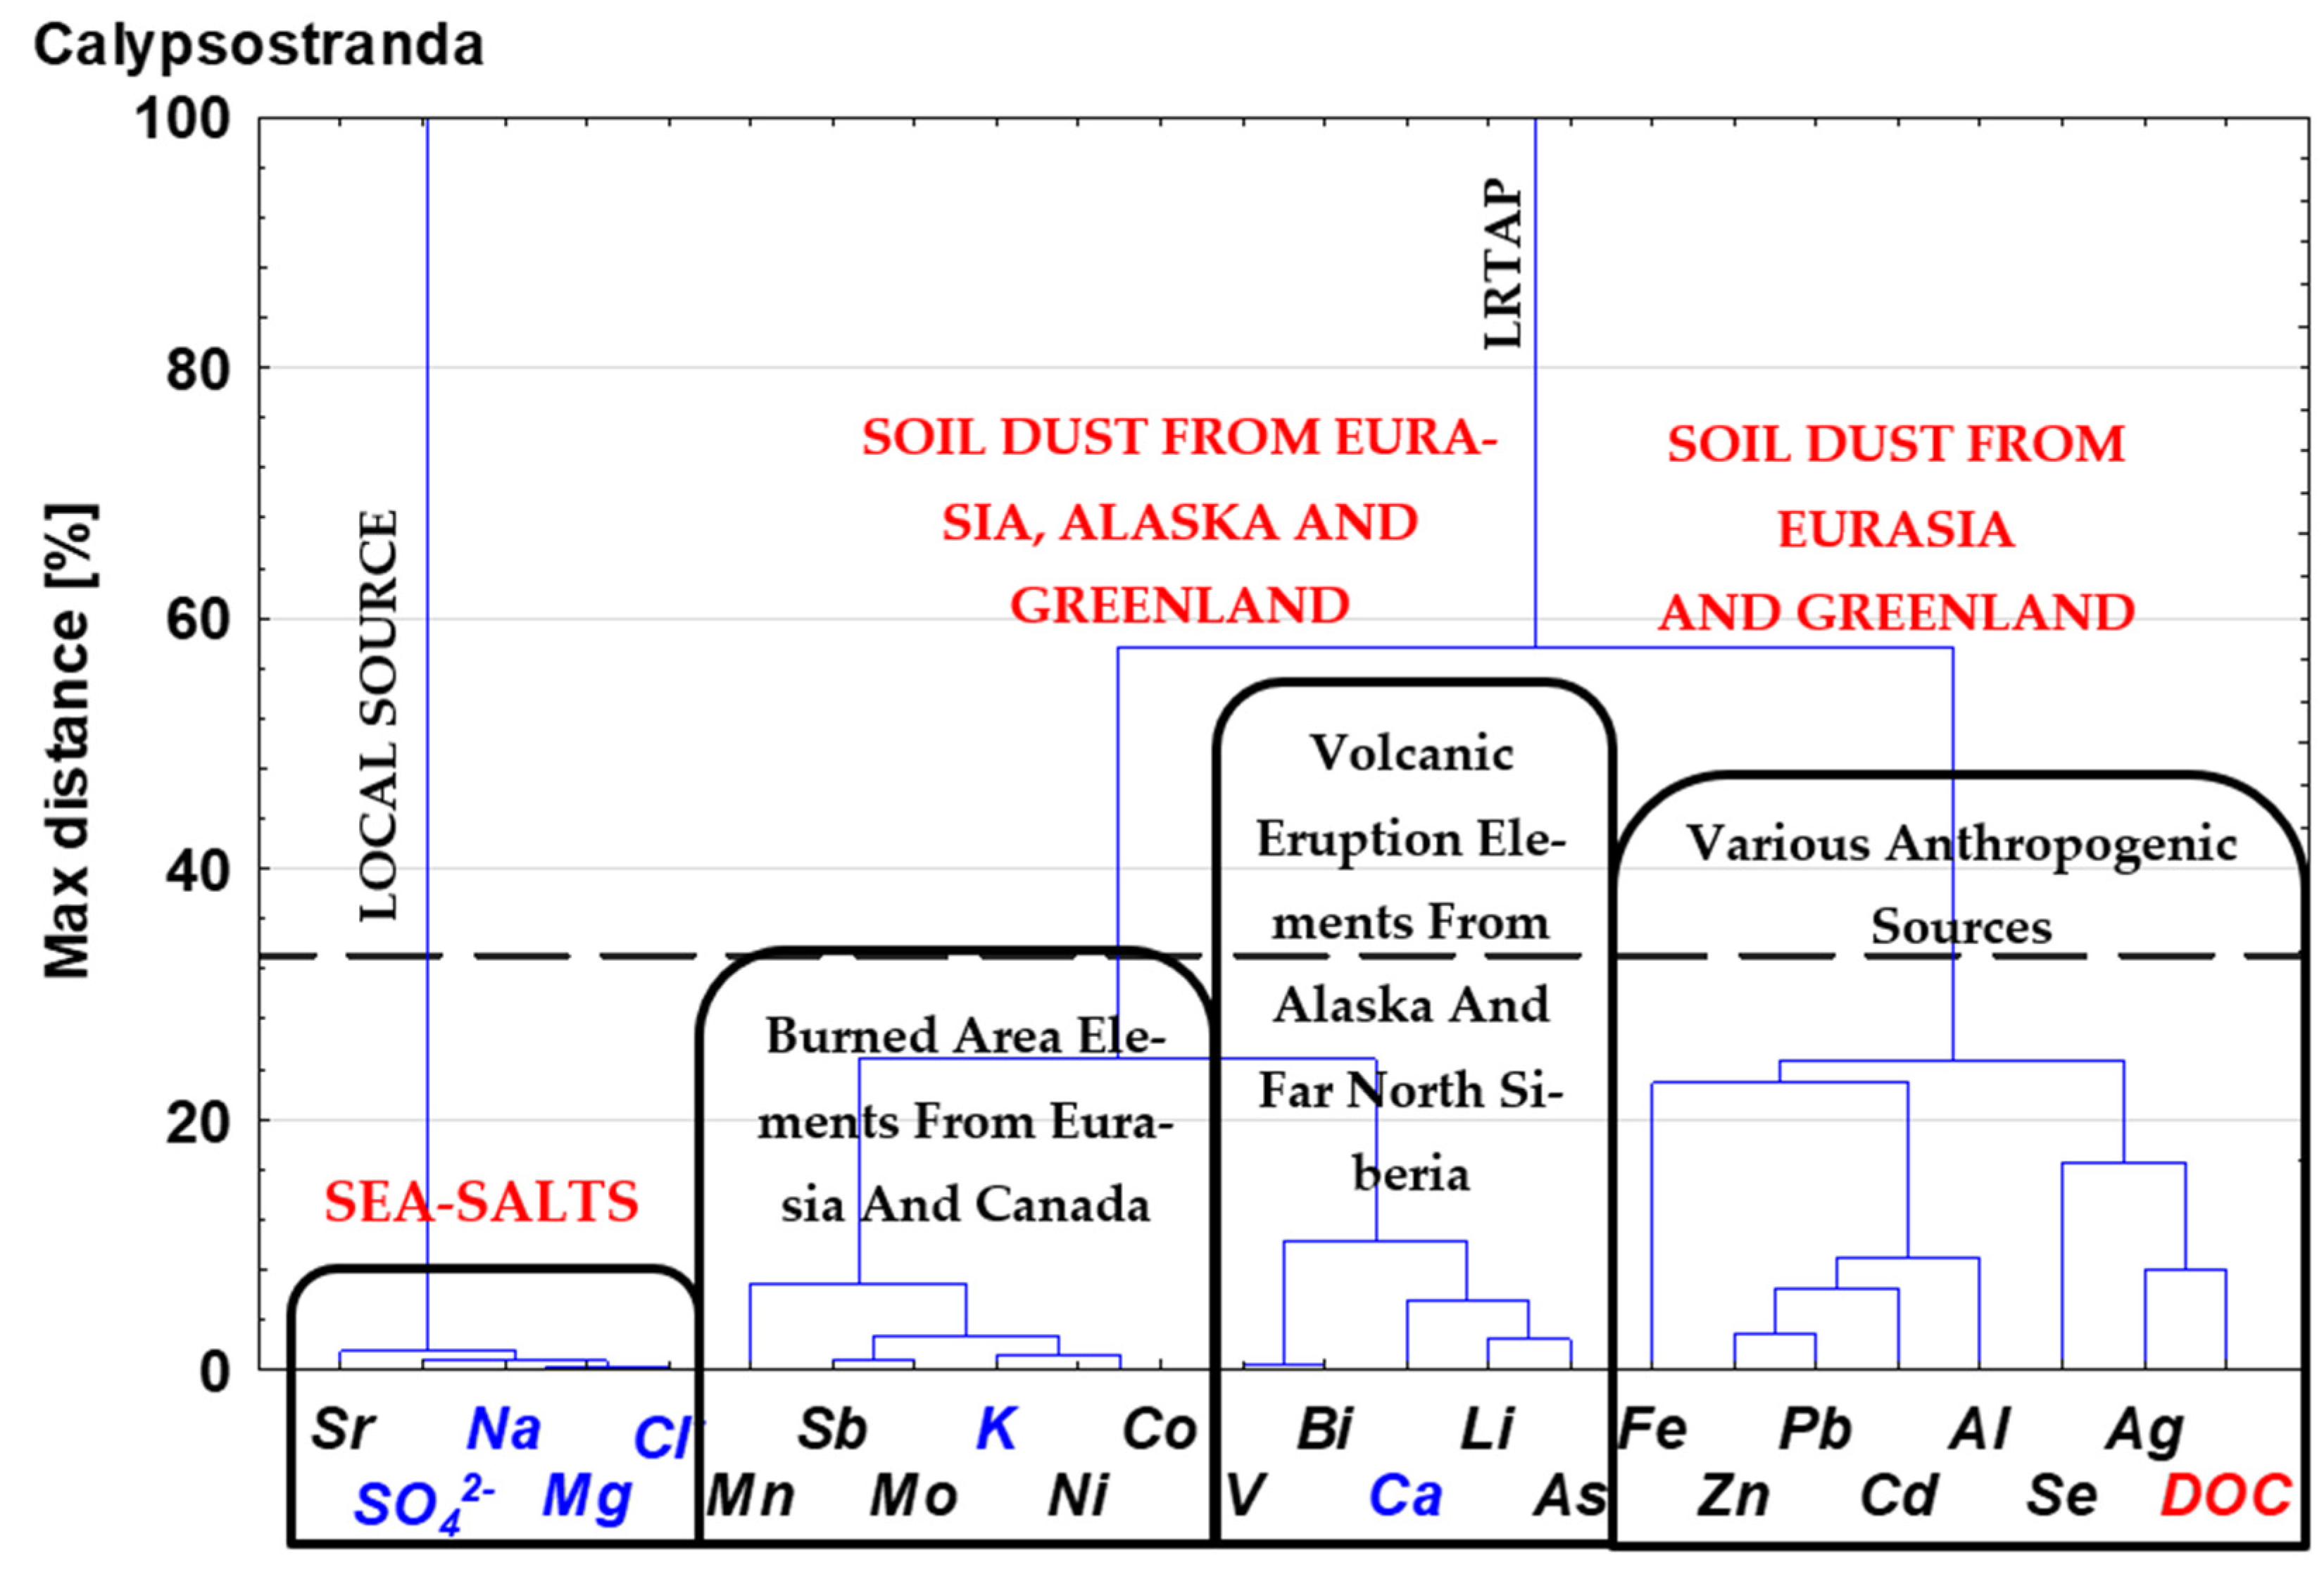
The chemical composition of summer rainfall in the coastal areas of Bellsund in August 2016 was mostly shaped by the process of the long-range atmospheric transport of pollutants originating predominantly from volcanic eruptions, wildfires, and dust emissions, as well as from, to a lesser degree, anthropogenic emissions and marine aerosol (Figure 5).
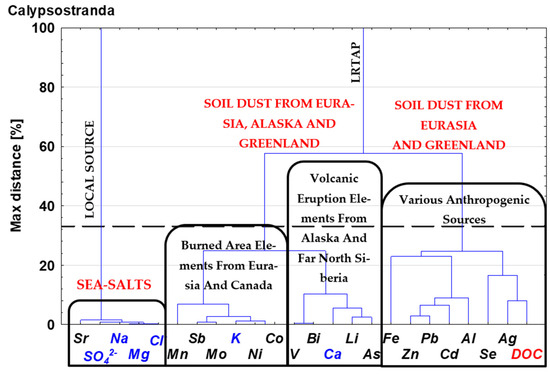
Figure 5.
Hierarchical dendrograms of DOC, ions, major and trace elements supplied to Calypsostranda with the rainfall (modified after a previous work in Chemosphere [5]).
Chemical analysis results and air mass trajectories suggest that the composition of rainfall samples was affected by the dust fractions of Eurasia, Greenland, and Alaska. The presence of the characteristics of wildfires, the non-sea sulphates (nss), and non-sea potassium (nsK), as well as the characteristic of the soil of burned areas, Ca, was also observed. This suggests the constant impact of wildfires from Eurasia and North America accompanied by the transport of trace elements from anthropogenic sources related to these areas. This phenomenon was relatively intense until the end of August, when the recorded ns-K was more likely related to anthropogenic pollutant emissions from industrialised and urbanised Eurasian or North American areas than to wildfires. The potential traces of the influence of volcanic eruptions were observed on 7 and 28 August, when air masses inflow from the coast of the far east of Siberia was preceded by the eruption of volcanoes in Alaska and Kamchatka, as well as at the end of August, when air masses reached far NE Siberia, in the areas neighbouring the active volcanic region of Kamchatka.
The results of the analysis of the directions of air masses inflow indicate a frequent scenario during the analysed period, that of the transport of air masses which collected pollutants from the industrialised northern coast of Russia and the northern part of Canada, where the air transport very often continued further, through the northern part of Greenland. Only in two cases, on 16 and 17 August, did the transport of air masses occur from the south, i.e., from Europe.
Areas from which the transport of air masses occurred were subject to wildfires (Canada, Alaska, and far east Russia), but they were also under the influence of volcanic activity (from the Pavlof volcano in the Aleutian Trench and the Sheveluch and Klyuchevskoy volcanoes in the Kuril–Kamchatka Trench). The impact and importance of these natural phenomena in shaping the precipitation mechanism in Calypsostranda is confirmed by the results of research on the movement of air masses and the analysis of the hierarchical dendrogram, which orders them in one main group that is characterised by the highest number of elements. The second most numerous group of elements corresponds with the phenomenon of the transport of dusts, particularly from the areas of industrialised Eurasia and Greenland. This is suggested by the presence of Fe and Al in the group as well as of Zn, Pb, and Cd, which are strongly related to human activity.
It should be noted that it was only possible to discuss the aspect of the origin of trace elements in rainwater after articles were published which described their emissions from volcanic eruptions or wildfires; however, most of these natural phenomena are cyclical, and it would be worthwhile to continue to sample rainfall. A comparison of results from successive seasons would be a valuable test of the hypotheses posed in this article. The analysis of backward air mass trajectories has proven to be an extremely useful tool in helping to determine the sources of pollution transported from areas of Eurasia and North America. Although the contribution of local sources of pollution on Spitsbergen is believed to be negligible, it would also be appropriate to collect meteorological data, such as wind speed and direction, in future sampling periods in order to analyse their possible influence on the shaping of rainfall chemistry.
Supplementary Materials
Supporting information can be downloaded at: https://www.mdpi.com/article/10.3390/w16020299/s1. This includes Table S1: Values of Spearman rank correlation coefficient (rs) of the meteorological data, physicochemical parameters, and ions and elements in rainfall. Statistically significant relations (at α = 0.05) are marked in bold and highlighted in grey (modified after [5]). Supplementary Material S1. Volcanic activity and Siberian wildfires in study season. References [55,56,57,58,59,60] are cited in the Supplementary Materials.
Author Contributions
Conceptualization, S.L.-K. and M.R.; methodology, S.L.-K., M.R. and Ł.M.; validation, M.F., Ł.M. and F.P.; formal analysis, S.L.-K., M.R., Ł.M., K.R. and F.P.; investigation, S.L.-K., M.R., Ł.M. and M.F.; resources, S.L.-K., M.R., Ł.M., M.F. and Ż.P.; data curation, S.L.-K., M.R., Ł.M., M.F. and Ż.P.; writing—original draft preparation, S.L.-K., M.R., Ł.M., K.R., J.P. and J.J.; writing—review and editing, S.L.-K., M.R., Ł.M., K.R. and Ż.P.; visualization, S.L.-K., Ż.P., M.R. and Ł.M.; supervision, S.L.-K., M.R. and Ż.P.; project administration, S.L.-K.; funding acquisition, S.L.-K., Ż.P. and M.R. All authors have read and agreed to the published version of the manuscript.
Funding
This research was funded by the National Science Centre of Poland, grant number 2019/32/C/ST10/00483. The research activities were co-financed by funds granted under the Research Excellence Initiative by the University of Silesia in Katowice.
Data Availability Statement
The data that support the findings of this study are available from the corresponding authors upon reasonable request.
Conflicts of Interest
The authors declare no conflicts of interest.
References
- Pacyna, J.M.; Ottar, B.; Tomza, U.; Maenhaut, W. Long-Range Transport of Trace Elements to Ny Ålesund, Spitsbergen. Atmos. Environ. 1985, 19, 857–865. [Google Scholar] [CrossRef]
- Bazzano, A.; Cappelletti, D.; Udisti, R.; Grotti, M. Long-Range Transport of Atmospheric Lead Reaching Ny-Ålesund: Inter-Annual and Seasonal Variations of Potential Source Areas. Atmos. Environ. 2016, 139, 11–19. [Google Scholar] [CrossRef]
- Arctic Monitoring and Assessment Programme. AMAP Assessment 2002: Heavy Metals in the Arctic; Arctic Monitoring and Assessment Programme (AMAP): Oslo, Norway, 2005; ISBN 8279710183. [Google Scholar]
- Maenhaut, W.; Cornille, P.; Pacyna, J.M.; Vitols, V. Trace Element Composition and Origin of the Atmospheric Aerosol in the Norwegian Arctic. Atmos. Environ. 1989, 23, 2551–2569. [Google Scholar] [CrossRef]
- Lehmann-Konera, S.; Ruman, M.; Frankowski, M.; Małarzewski, Ł.; Raczyński, K.; Pawlak, F.; Kozioł, K.; Polkowska, Ż. Rainwater Chemistry Composition in Bellsund: Sources of Elements and Deposition Discrepancies in the Coastal Area (SW Spitsbergen, Svalbard). Chemosphere 2023, 313, 137281. [Google Scholar] [CrossRef] [PubMed]
- Law, K.S.; Stohl, A. Arctic Air Pollution: Origins and Impacts. Science 2007, 315, 1537–1540. [Google Scholar] [CrossRef] [PubMed]
- Schmale, J.; Arnold, S.R.; Law, K.S.; Thorp, T.; Anenberg, S.; Simpson, W.R.; Mao, J.; Pratt, K.A. Local Arctic Air Pollution: A Neglected but Serious Problem. Earths Future 2018, 6, 1385–1412. [Google Scholar] [CrossRef]
- Kozak, K.; Kozioł, K.; Luks, B.; Chmiel, S.; Ruman, M.; Marć, M.; Namieśnik, J.; Polkowska, Ż. The Role of Atmospheric Precipitation in Introducing Contaminants to the Surface Waters of the Fuglebekken Catchment, Spitsbergen. Polar Res. 2015, 34, 24207. [Google Scholar] [CrossRef]
- Ruman, M.; Szopińska, M.; Kozak, K.; Lehmann, S.; Polkowska, Ż. The Research of the Contamination Levels Present in Samples of Precipitation and Surface Waters Collected from the Catchment Area Fuglebekken (Hornsund, Svalbard Archipelago). In Proceedings of the AIP Conference, Athens, Greece, 4–7 April 2014; Volume 297, pp. 297–300. [Google Scholar] [CrossRef]
- Seyfioglu, R.; Odabasi, M. Investigation of Air-Water Exchange of Formaldehyde Using the Water Surface Sampler: Flux Enhancement Due to Chemical Reaction. Atmos. Environ. 2006, 40, 3503–3512. [Google Scholar] [CrossRef]
- Kozak, K.; Polkowska, Z.; Ruman, M.; Kozioł, K.; Namieśnik, J. Analytical Studies on the Environmental State of the Svalbard Archipelago Provide a Critical Source of Information about Anthropogenic Global Impact. Trends Anal. Chem. 2013, 50, 107–126. [Google Scholar] [CrossRef]
- Tolvanen, A.; Eilu, P.; Juutinen, A.; Kangas, K.; Kivinen, M.; Markovaara-koivisto, M.; Naskali, A.; Salokannel, V.; Tuulentie, S.; Similä, J. Mining in the Arctic Environment—A Review from Ecological, Socioeconomic and Legal Perspectives. J. Environ. Manag. 2019, 233, 832–844. [Google Scholar] [CrossRef]
- Rudnicka-Kępa, P.; Zaborska, A. Sources, Fate and Distribution of Inorganic Contaminants in the Svalbard Area, Representative of a Typical Arctic Critical Environment—A Review. Environ. Monit. Assess. 2021, 193, 724. [Google Scholar] [CrossRef] [PubMed]
- Kalinowska, A.; Szopinska, M.; Chmiel, S.; Konczak, M.; Polkowska, Z.; Artichowicz, W.; Jankowska, K.; Nowak, A.; Łuczkiewicz, A. Heavy Metals in a High Arctic Fiord and Their Introduction with the Wastewater: A Case Study of Adventfjorden-Longyearbyen System, Svalbard. Water 2020, 12, 794. [Google Scholar] [CrossRef]
- Spolaor, A.; Moroni, B.; Luks, B.; Nawrot, A.; Roman, M.; Larose, C.; Stachnik, Ł.; Bruschi, F.; Kozioł, K.; Pawlak, F.; et al. Investigation on the Sources and Impact of Trace Elements in the Annual Snowpack and the Firn in the Hansbreen (Southwest Spitsbergen). Front. Earth Sci. 2021, 8, 536036. [Google Scholar] [CrossRef]
- Krawczyk, W.E.; Bartoszewski, S.A.; Siwek, K. Rain Water Chemistry at Calypsobyen, Svalbard. Pol. Polar Res. 2008, 29, 149–162. [Google Scholar]
- Krawczyk, W.E.; Bartoszewski, S.A. Crustal Solute Fluxes and Transient Carbon Dioxide Drawdown in the Scottbreen Basin, Svalbard in 2002. J. Hydrol. 2008, 362, 206–219. [Google Scholar] [CrossRef]
- Lehmann, S.; Gajek, G.; Chmiel, S.; Polkowska, Ż. Do Morphometric Parameters and Geological Conditions Determine Chemistry of Glacier Surface Ice? Spatial Distribution of Contaminants Present in the Surface Ice of Spitsbergen Glaciers (European Arctic). Environ. Sci. Pollut. Res. 2016, 23, 23385–23405. [Google Scholar] [CrossRef] [PubMed]
- Szumińska, D.; Szopińska, M.; Lehmann-Konera, S.; Franczak, Ł.; Kociuba, W.; Chmiel, S.; Kalinowski, P.; Polkowska, Ż. Water Chemistry of Tundra Lakes in the Periglacial Zone of the Bellsund Fiord (Svalbard) in the Summer of 2013. Sci. Total Environ. 2018, 624, 1669–1679. [Google Scholar] [CrossRef] [PubMed]
- Krawczyk, W.E.; Skrȩt, U. Organic Compounds in Rainfall at Hornsund, SW Spitsbergen: Qualitative Results. Pol. Polar Res. 2005, 26, 65–76. [Google Scholar]
- Kozak, K.; Ruman, M.; Kosek, K.; Karasiński, G.; Stachnik, Ł.; Polkowska, Z. Impact of Volcanic Eruptions on the Occurrence of PAHs Compounds in the Aquatic Ecosystem of the Southern Part of West Spitsbergen (Hornsund Fjord, Svalbard). Water 2017, 9, 42. [Google Scholar] [CrossRef]
- Koffman, B.G.; Yoder, M.F.; Methven, T.; Hanschka, L.; Sears, H.B.; Saylor, P.L.; Wallace, K.L. Glacial Dust Surpasses Both Volcanic Ash and Desert Dust in Its Iron Fertilization Potential. Glob. Biogeochem. Cycles 2021, 35, e2020GB006821. [Google Scholar] [CrossRef]
- Ionov, D.A.; Bénard, A.; Plechov, P.Y.; Shcherbakov, V.D. Along-Arc Variations in Lithospheric Mantle Compositions in Kamchatka, Russia: First Trace Element Data on Mantle Xenoliths from the Klyuchevskoy Group Volcanoes. J. Volcanol. Geotherm. Res. 2013, 263, 122–131. [Google Scholar] [CrossRef]
- Golobokova, L.; Khodzher, T.; Khuriganova, O.; Marinayte, I.; Onishchuk, N.; Rusanova, P.; Potemkin, V. Variability of Chemical Properties of the Atmospheric Aerosol above Lake Baikal during Large Wildfires in Siberia. Atmosphere 2020, 11, 1230. [Google Scholar] [CrossRef]
- Potter, K.M. Large-Scale Patterns of Forest Fire Occurrence in the Conterminous United States, Alaska, and Hawaii, 2016. In Forest Health Monitoring: National Status, Trends, and Analysis 2017; Gen. Tech. Rep. SRS-233; Potter, K.M., Conkling, B.L., Eds.; US Department of Agriculture, Forest Service, Southern Research Station: Asheville, NC, USA, 2018; pp. 45–64. [Google Scholar]
- Zhang, Y.; Pelletier, R.; Noernberg, T.; Donner, M.W.; Grant-Weaver, I.; Martin, J.W.; Shotyk, W. Impact of the 2016 Fort McMurray Wildfires on Atmospheric Deposition of Polycyclic Aromatic Hydrocarbons and Trace Elements to Surrounding Ombrotrophic Bogs. Environ. Int. 2022, 158, 106910. [Google Scholar] [CrossRef] [PubMed]
- Butwin, M.K.; Von Löwis, S.; Pfe, M.A.; Thorsteinsson, T. The Effects of Volcanic Eruptions on the Frequency of Particulate Matter Suspension Events in Iceland. J. Aerosol Sci. 2019, 128, 99–113. [Google Scholar] [CrossRef]
- Moroni, B.; Cappelletti, D.; Crocchianti, S.; Becagli, S.; Caiazzo, L.; Traversi, R.; Udisti, R.; Mazzola, M.; Markowicz, K.; Ritter, C.; et al. Morphochemical Characteristics and Mixing State of Long Range Transported Wildfire Particles at Ny-Ålesund (Svalbard Islands). Atmos. Environ. 2017, 156, 135–145. [Google Scholar] [CrossRef]
- Crocchianti, S.; Moroni, B.; Dagsson, P.; Becagli, S.; Severi, M.; Traversi, R.; Cappelletti, D. Potential Source Contribution Function Analysis of High Latitude Dust Sources over the Arctic: Preliminary Results and Prospects. Atmosphere 2021, 12, 347. [Google Scholar] [CrossRef]
- Rzętkowska, A. Vegetation of Calypsostranda in Wedel Jarlsberg Land, Spitsbergen. Pol. Polar Res. 1987, 8, 251–260. [Google Scholar]
- Zagórski, P. Shoreline Dynamics of Calypsostranda (NW Wedel Jarlsberg Land, Svalbard) during the Last Century. Pol. Polar Res. 2011, 32, 67–99. [Google Scholar] [CrossRef]
- Repelewska-Pękalowa, J.; Pękala, K. Spatial and Temporal Variation in Active Layer Thickness, Calypsostranda, Spitsbergen. In Proceedings of the 8th International Conference on Permafrost, Zürich, Switzerland, 21–25 July 2003; Philips, M., Springman, S., Arenson, L., Eds.; August Aimé Balkema: Rotterdam, The Netherlands, 2003; pp. 941–945, ISBN 9058095827. [Google Scholar]
- Mędrek, K.; Gluza, A.; Siwek, K.; Zagórski, P. The Meteorological Conditions on the Calypsobyen in Summer 2014 on the Bacground of Multiyear 1986–2011. Probl. Klimatol. Polarn. 2014, 2, 37–50. [Google Scholar]
- Rolph, G.; Stein, A.; Stunder, B. Real-Time Environmental Applications and Display SYstem: READY. Environ. Model. Softw. 2017, 95, 210–228. [Google Scholar] [CrossRef]
- Stein, A.F.; Draxler, R.R.; Rolph, G.D.; Stunder, B.J.B.; Cohen, M.D.; Ngan, F. Noaa’s Hysplit Atmospheric Transport and Dispersion Modeling System. Bull. Am. Meteorol. Soc. 2015, 96, 2059–2077. [Google Scholar] [CrossRef]
- Carn, S.A.; Krueger, A.J.; Krotkov, N.A.; Yang, K.; Levelt, P.F. Sulfur Dioxide Emissions from Peruvian Copper Smelters Detected by the Ozone Monitoring Instrument. Geophys. Res. Lett. 2007, 34. [Google Scholar] [CrossRef]
- Moroni, B.; Cappelletti, D.; Ferrero, L.; Crocchianti, S.; Busetto, M.; Mazzola, M.; Becagli, S.; Traversi, R.; Udisti, R. Local vs. Long-Range Sources of Aerosol Particles upon Ny-Ålesund (Svalbard Islands): Mineral Chemistry and Geochemical Records. Rend. Lincei 2016, 27, 115–127. [Google Scholar] [CrossRef]
- Symonds, R.B.; Reed, M.H.; Rose, W.I. Origin, Speciation, and Fluxes of Trace-Element Gases at Augustine Volcano, Alaska: Insights into Magma Degassing and Fumarolic Processes. Geochim. Cosmochim. Acta 1992, 56, 633–657. [Google Scholar] [CrossRef]
- Candelone, J.P.; Bolshov, M.A.; Rudniev, S.N.; Hong, S.; Boutron, C.F. Bismuth in Recent Snow from Central Greenland: Preliminary Results. Atmos. Environ. 1995, 29, 1843–1848. [Google Scholar] [CrossRef]
- Ferrari, C.P.; Hong, S.; Van De Velde, K.; Boutron, C.F.; Rudniev, S.N.; Bolshov, M.; Chisholm, W.; Rosman, K.J.R. Natural and Anthropogenic Bismuth in Central Greenland. Atmos. Environ. 2000, 34, 941–948. [Google Scholar] [CrossRef]
- Bryant, J.A.; Yogodzinski, G.M.; Churikova, T.G. Melt-Mantle Interactions beneath the Kamchatka Arc: Evidence from Ultramafic Xenoliths from Shiveluch Volcano. Geochem. Geophys. Geosyst. 2007, 8, 1–24. [Google Scholar] [CrossRef]
- Moroni, B.; Ritter, C.; Crocchianti, S.; Markowicz, K.; Mazzola, M.; Becagli, S.; Traversi, R.; Krejci, R.; Tunved, P.; Cappelletti, D. Individual Particle Characteristics, Optical Properties and Evolution of an Extreme Long-Range Transported Biomass Burning Event in the European Arctic (Ny-Ålesund, Svalbard Islands). J. Geophys. Res. Atmos. 2020, 125, e2019JD031535. [Google Scholar] [CrossRef]
- Sitnov, S.A.; Mokhov, I.I.; Gorchakov, G.I. The Link between Smoke Blanketing of European Russia in Summer 2016, Siberian Wildfires and Anomalies of Large-Scale Atmospheric Circulation. Dokl. Earth Sci. 2017, 472, 190–195. [Google Scholar] [CrossRef]
- Sitnov, S.A.; Mokhov, I.I.; Gorchakov, G.I.; Dzhola, A.V. Smoke Haze over the European Part of Russia in the Summer of 2016: A Link to Wildfires in Siberia and Atmospheric Circulation Anomalies. Russ. Meteorol. Hydrol. 2017, 42, 518–528. [Google Scholar] [CrossRef]
- Shcherbov, B.L.; Zhurkova, I.S. Forest Fires as an Important Factor of Scattering and Concentration of Chemical Elements in Siberia. Geol. Miner. Resour. Sib. 2014, S3, 37–40. [Google Scholar]
- Isley, C.F.; Taylor, M.P. Atmospheric Remobilization of Natural and Anthropogenic Contaminants during Wild Fi Res *. Environ. Pollut. 2020, 267, 115400. [Google Scholar] [CrossRef] [PubMed]
- Schlosser, J.S.; Braun, R.A.; Bradley, T.; Dadashazar, H.; MacDonald, A.B.; Aldhaif, A.A.; Aghdam, M.A.; Mardi, A.H.; Xian, P.; Sorooshian, A. Analysis of Aerosol Composition Data for Western United States Wildfires between 2005 and 2015: Dust Emissions, Chloride Depletion, and Most Enhanced Aerosol Constituents. J. Geophys. Res. Atmos. 2017, 122, 8951–8966. [Google Scholar] [CrossRef] [PubMed]
- Shevtsova, I.; Heim, B.; Kruse, S.; Schröder, J.; Troeva, E.I. Strong Shrub Expansion in Tundra-Taiga, Tree Infilling in Taiga and Stable Tundra in Central Chukotka (North-Eastern Siberia) between 2000 and 2017 OPEN ACCESS Strong Shrub Expansion in Tundra-Taiga, Tree Infilling in Taiga and Stable Tundra in Centra. Environ. Res. Lett. 2020, 15, 085006. [Google Scholar] [CrossRef]
- Sitnov, S.A.; Mokhov, I.I.; Likhosherstova, A.A. Exploring Large-Scale Black—Carbon Air Pollution over Northern Eurasia in Summer 2016 Using MERRA-2 Reanalysis Data. Atmos. Res. 2020, 235, 104763. [Google Scholar] [CrossRef]
- Cohen, D.D.; Atanacio, A.J.; Stelcer, E.; Garton, D. Sydney Particle Characterisation Study PM2. 5 Source Apportionment in the Sydney Region between 2000 and 2014; Australian Nuclear Science and Technology Organisation: Lucas Heights, Australia, 2016.
- Conca, E.; Abollino, O.; Giacomino, A.; Buoso, S.; Traversi, R.; Becagli, S.; Grotti, M.; Malandrino, M. Source Identification and Temporal Evolution of Trace Elements in PM10 Collected near to Ny-Ålesund (Norwegian Arctic). Atmos. Environ. 2019, 203, 153–165. [Google Scholar] [CrossRef]
- Kavan, J.; Kamil, L.; Nawrot, A. High Latitude Dust Transport Altitude Pattern Revealed from Deposition on Snow, Svalbard. Atmopshere 2020, 11, 1318. [Google Scholar] [CrossRef]
- Zhang, Q.; Shen, Z.; Cao, J.; Ho, K.; Zhang, R.; Bie, Z.; Chang, H.; Liu, S. Chemical Profiles of Urban Fugitive Dust over Xi’an in the South Margin of the Loess Plateau, China. Atmos. Pollut. Res. 2014, 5, 421–430. [Google Scholar] [CrossRef]
- Moroni, B.; Arnalds, O.; Dagsson-Waldhauserová, P.; Crocchianti, S.; Vivani, R.; Cappelletti, D. Mineralogical and Chemical Records of Icelandic Dust Sources upon Ny-Ålesund (Svalbard Islands). Front. Earth Sci. 2018, 6, 187. [Google Scholar] [CrossRef]
- GVP Global Volcanism Program. Volcanoes of the World, v.4.10.5 (27 January 2022); Venzke, E., Ed.; Smithsonian Institution: Washington, DC, USA, 2022. [Google Scholar]
- VONA/KVERT Weekly Release. 12 July 2016. Available online: http://www.kscnet.ru/ivs/kvert/van/?n=2016-07-25 (accessed on 15 March 2023).
- Global Volcanism Program 2016. Report on Cleveland (United States); Sennert, S.K., Ed.; Weekly Volcanic Activity Report, 1 June–7 June 2016; Smithsonian Institution and US Geological Survey; Available online: https://volcano.si.edu/showreport.cfm?wvar=GVP.WVAR20160601-311240 (accessed on 15 March 2023).
- Global Volcanism Program, 2016. Report on Pavlof (United States); Sennert, S.K., Ed.; Weekly Volcanic Activity Report, 27 July–2 August 2016; Smithsonian Institution and US Geological Survey; Available online: https://volcano.si.edu/showreport.cfm?wvar=GVP.WVAR20160727-312030 (accessed on 15 March 2023).
- Larsen, J.F.; Waythomas, C.F.; Mulliken, K.M.; Izbekov, P.; Cameron, C.E. Major-Element Oxide, Trace Element, and Glass Compositional Anlyses from Holocene to Historical Eruptions from Pavlof Volcano. State of Alaska. 2021. Available online: https://dggs.alaska.gov/webpubs/dggs/pir/text/pir2021_001.pdf (accessed on 15 March 2023).
- Ershov, D.V.; Sochilova, E.N. Assessment of direct pyrogenic carbon emissions in Russian forests for 2020 using remote monitoring data. Вoпрoсы Леснoй Науки 2021, 4, 1–7. (In Russian) [Google Scholar] [CrossRef]


Disclaimer/Publisher’s Note: The statements, opinions and data contained in all publications are solely those of the individual author(s) and contributor(s) and not of MDPI and/or the editor(s). MDPI and/or the editor(s) disclaim responsibility for any injury to people or property resulting from any ideas, methods, instructions or products referred to in the content. |
© 2024 by the authors. Licensee MDPI, Basel, Switzerland. This article is an open access article distributed under the terms and conditions of the Creative Commons Attribution (CC BY) license (https://creativecommons.org/licenses/by/4.0/).