1. Introduction
Natural runoff conditions are a crucial factor in maintaining the health and integrity of river ecosystems [
1]. The construction and operation of reservoirs impact the redistribution of water resources in terms of both time and space. On the one hand, for the reservoir area upstream of the dam, this results in an increase in the water surface and a decrease in flow velocity. Along with the operation of reservoir scheduling, it causes unseasonal fluctuations in reservoir water levels, altering the natural hydrological rhythm [
2,
3]. On the other hand, for the downstream area below the dam, hydropower stations with regulatory capabilities can increase the discharge during dry periods compared to natural conditions and decrease the discharge during wet periods compared to natural conditions. Additionally, the daily regulation of hydropower stations may lead to significant fluctuations in water levels and flow in the downstream river channel, potentially adversely affecting navigation and the habitat of aquatic organisms [
4].
In recent years, China has ushered in a critical period of green and low-carbon energy transformation and development, and wind power and photovoltaic power will usher in large-scale development [
5]. Hydropower has the characteristics of large capacity and flexible operation, while wind and solar power have the features of abundant resources and short construction cycles. By utilizing the existing outgoing channels of hydropower to “bundle” them together, the technical and economic characteristics of different types of power sources can be fully leveraged [
6,
7]. Accelerating the development of bundled clean energy such as “hydro-wind-solar” is an important measure in enhancing the quality of electricity and the overall economic efficiency of large-scale clean energy bases and achieving clean and sustainable development. Affected by the intermittent and anti-peak regulation of wind and photovoltaic output, the integrated operation of water, wind, and photovoltaic power can be carried out, and the reservoir capacity can be adjusted with the help of cascading hydropower in the basin, which can stabilize the amplitude of the wind power and photovoltaic output and improve the ability of the power grid to accept wind power and photovoltaic power [
8,
9,
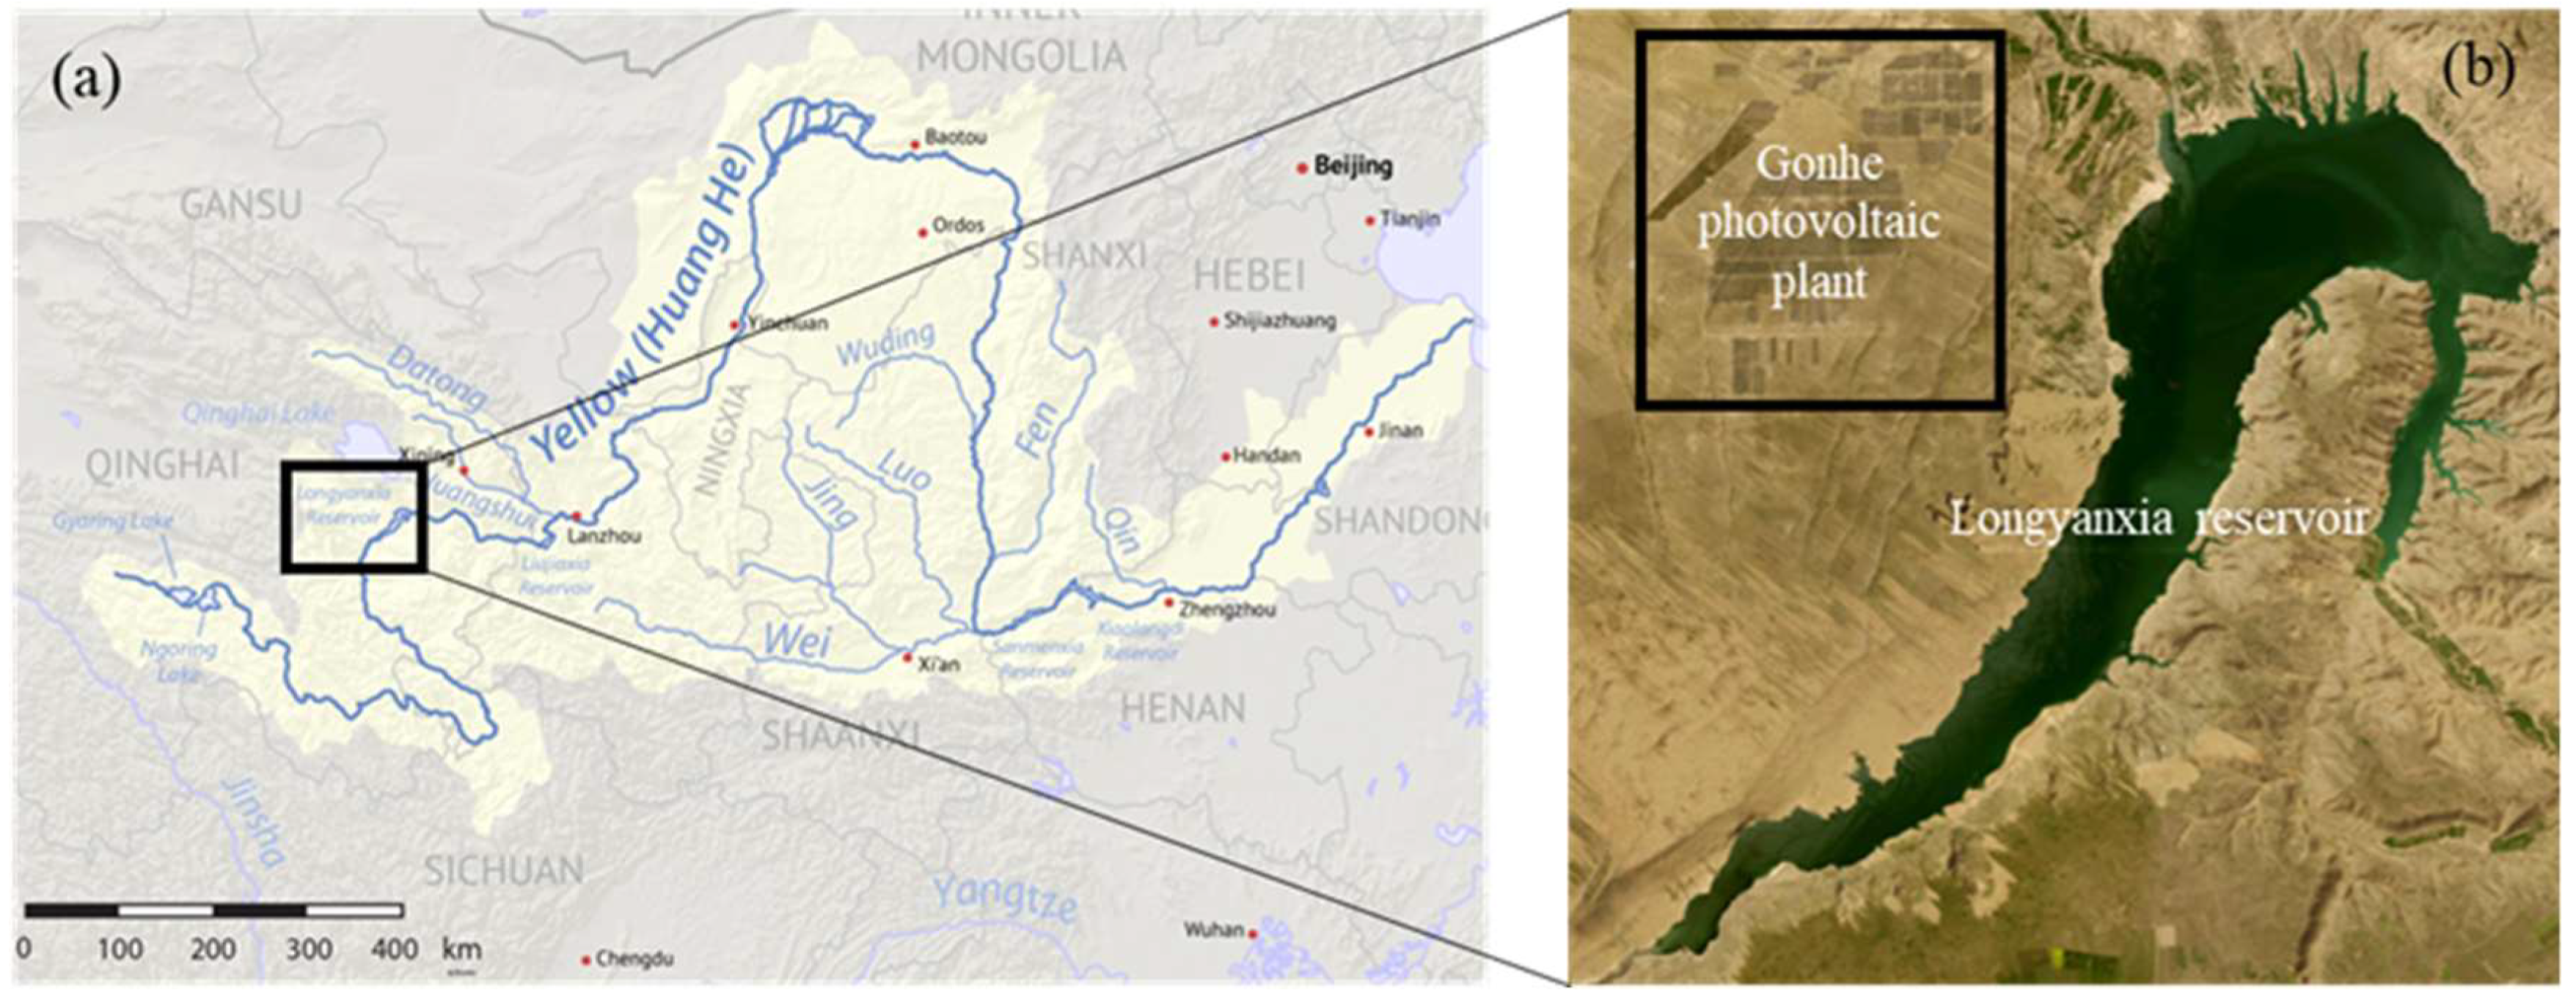
10]. The Longyangxia hydro–photovoltaic complementary operation is a facility where the electricity generated by an 850-megawatt photovoltaic power station is first connected to the Longyangxia hydroelectric power station [
11]. The combined electricity generated by these two sources is then transmitted to the grid via the Longyangxia hydroelectric power station’s outgoing channels. However, in order to meet the daily electricity demand, hydropower stations under the complementary operation of water, wind, and photovoltaic power will frequently adjust the power generation flow, and the change in the operation mode of the hydropower stations will also be “reflected” into the river, resulting in large fluctuations in the hydrological situation of the river section, which will have an adverse ecological impact on the spawning and reproduction of fish [
12,
13,
14]. Therefore, it is urgent to carry out an assessment of the characteristics of altering the intraday hydrological situation of the basin under the integrated operation of water, wind, and photovoltaic power.
For the assessment of the alteration of hydrological regimes due to hydropower station operations, various methods for assessing alterations in river runoff conditions have been proposed. These methods have found widespread application in numerous research studies and practical implementations. The index of hydrologic alternation (IHA) method, introduced by Richter et al. in 1996 [
15], stands as the most influential and extensively applied indicator system for evaluating alterations in river runoff conditions. Scholars have utilized the IHA indicators to conduct assessments of the impacts on hydrological alterations in various rivers [
16,
17,
18] following the development of hydroelectric stations. The Nature Conservancy and partners, including the US Army Corps of Engineers and US Geological Survey, assessed the hydrologic alterations caused by the Connecticut River Basin dam based on the IHA method [
19]. This method mainly focuses on the intra-annual and inter-annual alterations of runoff, and the minimum data time scale is the daily scale, with which it is difficult to evaluate the impact of intra-day peak regulation operations of hydropower stations on natural flow. However, the intra-day peak regulation operation of hydropower stations will cause hourly or even 15-min flow fluctuations in the rate of change, which will be averaged in the statistics on daily time scales and so will not be measured by these approaches. To more comprehensively evaluate the impact of hydropower dispatching operations on naturally flow variability, it is necessary to evaluate the alteration of the flow index on the subdaily scale.
The assessment of hydrological regime alterations caused by subdaily hydropower peaking operations is more difficult than daily analyses due to the lack of the large volume of data needed for these analyses and the lack of pre- and post-alteration data. The Richards–Baker flashiness index (RBF, ratio of flow oscillation path length to cumulative hourly flows in a 24 h period) [
20], the ratio of the range of the diurnal cycle to the total daily discharge (% of total flow; PTF) [
21], the coefficient of diel variation (CDV) [
22], and the reversals (NREVS, the number of transitions in hydrograph trends within a 24 h period) are proposed to quantify attributes pertaining to water volume alterations within a 24 h period. Despite their application, the aforementioned metrics fell short in comprehensively depicting variability patterns. For instance, they could not differentiate between a significant volume of flow alteration occurring once daily versus smaller alterations occurring multiple times a day. In previous studies, most subdaily flow variations are quantified by using metrics such as hourly minimum flows [
23,
24,
25], maximum hourly ramping rates [
26], the coefficient of variation in hourly flows [
22], or measurements of instantaneous minimum or maximum flows as a percentage of the total or mean daily discharge [
27]. These studies are important for assessing the ecological effects of altered subdaily variations where they are known to occur and in locations where detailed ecological investigations may provide evidence for altering dam operations.
Above all, the mechanism of the influence of hydropower station dispatching considering the consumption of renewable energy such as wind and photovoltaic power on the intraday runoff situation is still unclear, and there is a lack of a set of index systems that can completely evaluate the alterations in intraday runoff. In this paper, an evaluation index system that includes five categories for subdaily flow variations is established; these categories include the magnitude, rate of change, duration, frequency, and timing of subdaily flow regime alterations, with a total of 15 indexes. Additionally, due to the evident variability in the dispatch of hydroelectric plants throughout the year, in order to further analyze the seasonal differences in the impact of hydroelectric plant dispatching on diurnal streamflow patterns during different seasons or months, the concentration index (CI) was introduced to analyze the variations in the hydrological impacts during different months.
This paper is structured as follows.
Section 2 describes the materials and methods used in this study.
Section 3 describes the study area and the impacts of hydropower operation on the subdaily flow regime.
Section 4 presents the main results, including the redundancy of the indexes, the subdaily flow regime characteristics, and the annual variation in the flow regime alteration.
Section 5 summarizes the main conclusions of the study.
2. Materials and Methods
2.1. Indexes of Subdaily Flow Regime Alteration
Within a natural flow regime, there exist five integral components delineating the scale and frequency of hydraulic conditions [
28,
29]. These components play a crucial role in influencing the ecological well-being of riverine ecosystems. Each of these components offers insights into the variability in flow across diverse spatial and temporal dimensions. This study considers the impact of hydropower operations, especially during the operation of multi-energy complementary systems (e.g., hydro–wind–photovoltaic systems), on the subdaily flow regime of rivers. An evaluation index system for subdaily flow variations is established. The calculation of these indexes uses hourly flow data (i.e., hourly average values of inflow and outflow), including five categories: the magnitude, rate of change, duration, frequency, and timing of subdaily flow regime alterations, with a total of 15 indexes. The specific indexes and their definitions are shown in
Table 1.
(1) Magnitude. One of the most important aspects of the impact of hydropower operations on flow regimes is the change in the temporal distribution of flow (i.e., subdaily), leading to significant alterations in the magnitude of flow at different times within a day. Therefore, this index mainly evaluates the differences in the flow magnitude between high and low flows within a day, including the daily average flow, the difference between the maximum and minimum flows within a day, and the maximum difference in flow between consecutive hours.
(2) Rate of change. This index mainly evaluates the dynamic characteristics of the increase and decrease processes of flow within a day, including the flow increase rate, the flow decrease rate, and the instantaneous index [
30].
(3) Duration. This index is used to evaluate the duration of the increase or decrease process of flow within a day caused by reservoir regulation and discharge operations.
(4) Frequency. This index evaluates the frequency of flow increase or decrease within a day. The calculation is based on the time taken for the flow increase or decrease divided by the total time within a day (24 h). In addition, the flow reversal frequency is defined as the number of transitions between high and low flows.
(5) Timing. Due to the alterations in the distribution of flow within a day caused by reservoir regulation and discharge operations, the timing of the flow increase or decrease also changes. Therefore, this index is used to evaluate the timing of the maximum flow increase or decrease.
2.2. Rank-Sum Test
The rank-sum test, also known as the Mann–Whitney U test, is a non-parametric statistical test used to compare two independent samples [
31]. This test is particularly useful when the assumptions of the t-test, such as normality and equal variances, are not met. The rank-sum test works by first combining the data from both samples and ranking them from lowest to highest. The ranks are then assigned to each observation, regardless of which sample it belongs to. After ranking the data, the sum of the ranks for each sample is calculated. The test statistic is then calculated based on the difference between these sums. The null hypothesis of the rank-sum test is that there is no difference between the two samples. In other words, the distributions of the two samples are identical. The alternative hypothesis is that there is a difference between the two samples.
In this study, the distributions of these indexes in the different reservoirs at different periods were compared, and the rank-sum test was used to further confirm the differences between the distributions of the different indexes, that is, whether the subdaily flow regime influenced by the reservoir operations significantly changed compared to those not influenced by the reservoir operations. In this study, the null hypothesis of the rank-sum test was that the indexes influenced by the reservoir operations and those not influenced by the reservoir operations belonged to the same sample. At a significance level of p = 0.05, rejecting the null hypothesis indicated a significant change in the subdaily flow regime influenced by the reservoir operations compared to the subdaily flow regime not influenced by the reservoir operations.
2.3. Redundancy of the Indexes
Before the index of hydrological alteration (i.e., IHA) [
15], researchers had already used more than 100 indicators to assess changes in natural flow conditions. Based on the relationship between flow conditions and river ecosystem health, Richter et al. analyzed the redundancy of these 100+ indicators and proposed the IHA index system to describe natural flow regimes. The IHA consists of 33 indicators and is commonly used for the post-assessment of impacted river flow regimes, making it difficult to incorporate all indicators into reservoir ecological operations for practical applications [
32]. Therefore, in order to better apply the index system proposed in this study, which describes the subdaily flow regime (including 15 indexes from 5 categories) in the hydropower operations, it was necessary to analyze the redundancy of these indexes in order to reduce their number and highlight the most important indexes.
In this study, the redundancy analysis of these indexes was conducted using correlation analysis, calculating the correlation between indexes. The larger the correlation coefficient (
r), the higher the similarity between indexes. Pearson’s correlation coefficient was used for the correlation calculation in this study:
where
r is the correlation coefficient between two indexes,
Xt and
Yt are the values of indexes
X and
Y, respectively, and
and
are the mean values of the indexes.
2.4. Concentration of the Indexes
The above index system for the subdaily flow variations uses the hourly time scale of the flow processes to calculate the index values for each day of the year. The magnitude of the index values measures the impact of the hydropower operations on the intra-daily flow conditions. Due to the significant differences in the hydropower operations throughout the year, such as increasing releases during dry seasons to supplement flow and reducing releases during wet seasons for reservoir storage, this study further analyzed the seasonal differences in the impact of the hydropower operations on the subdaily flow regime using the concentration index (
CI) [
33,
34]. The formula for calculating the
CI is as follows:
where
CIi is the concentration index for the
i-th index,
xi,t is the average value of the
i-th index in the
t-th month, and
n is the number of months. If
, it indicates that the impact of the hydropower operations on subdaily flow regime is evenly distributed throughout the year. If
, it indicates a significant seasonal characteristic in the impact of the hydropower operations on the subdaily flow regime. If
, it indicates significant differences in the impact of the hydropower operations on the subdaily flow regime among different months. In general, a larger
CI shows greater differences in the evaluation indexes among different months, indicating a higher seasonal difference in the impact of the hydropower operations on the subdaily flow regime.
4. Results and Discussion
4.1. Redundancy of the Indexes
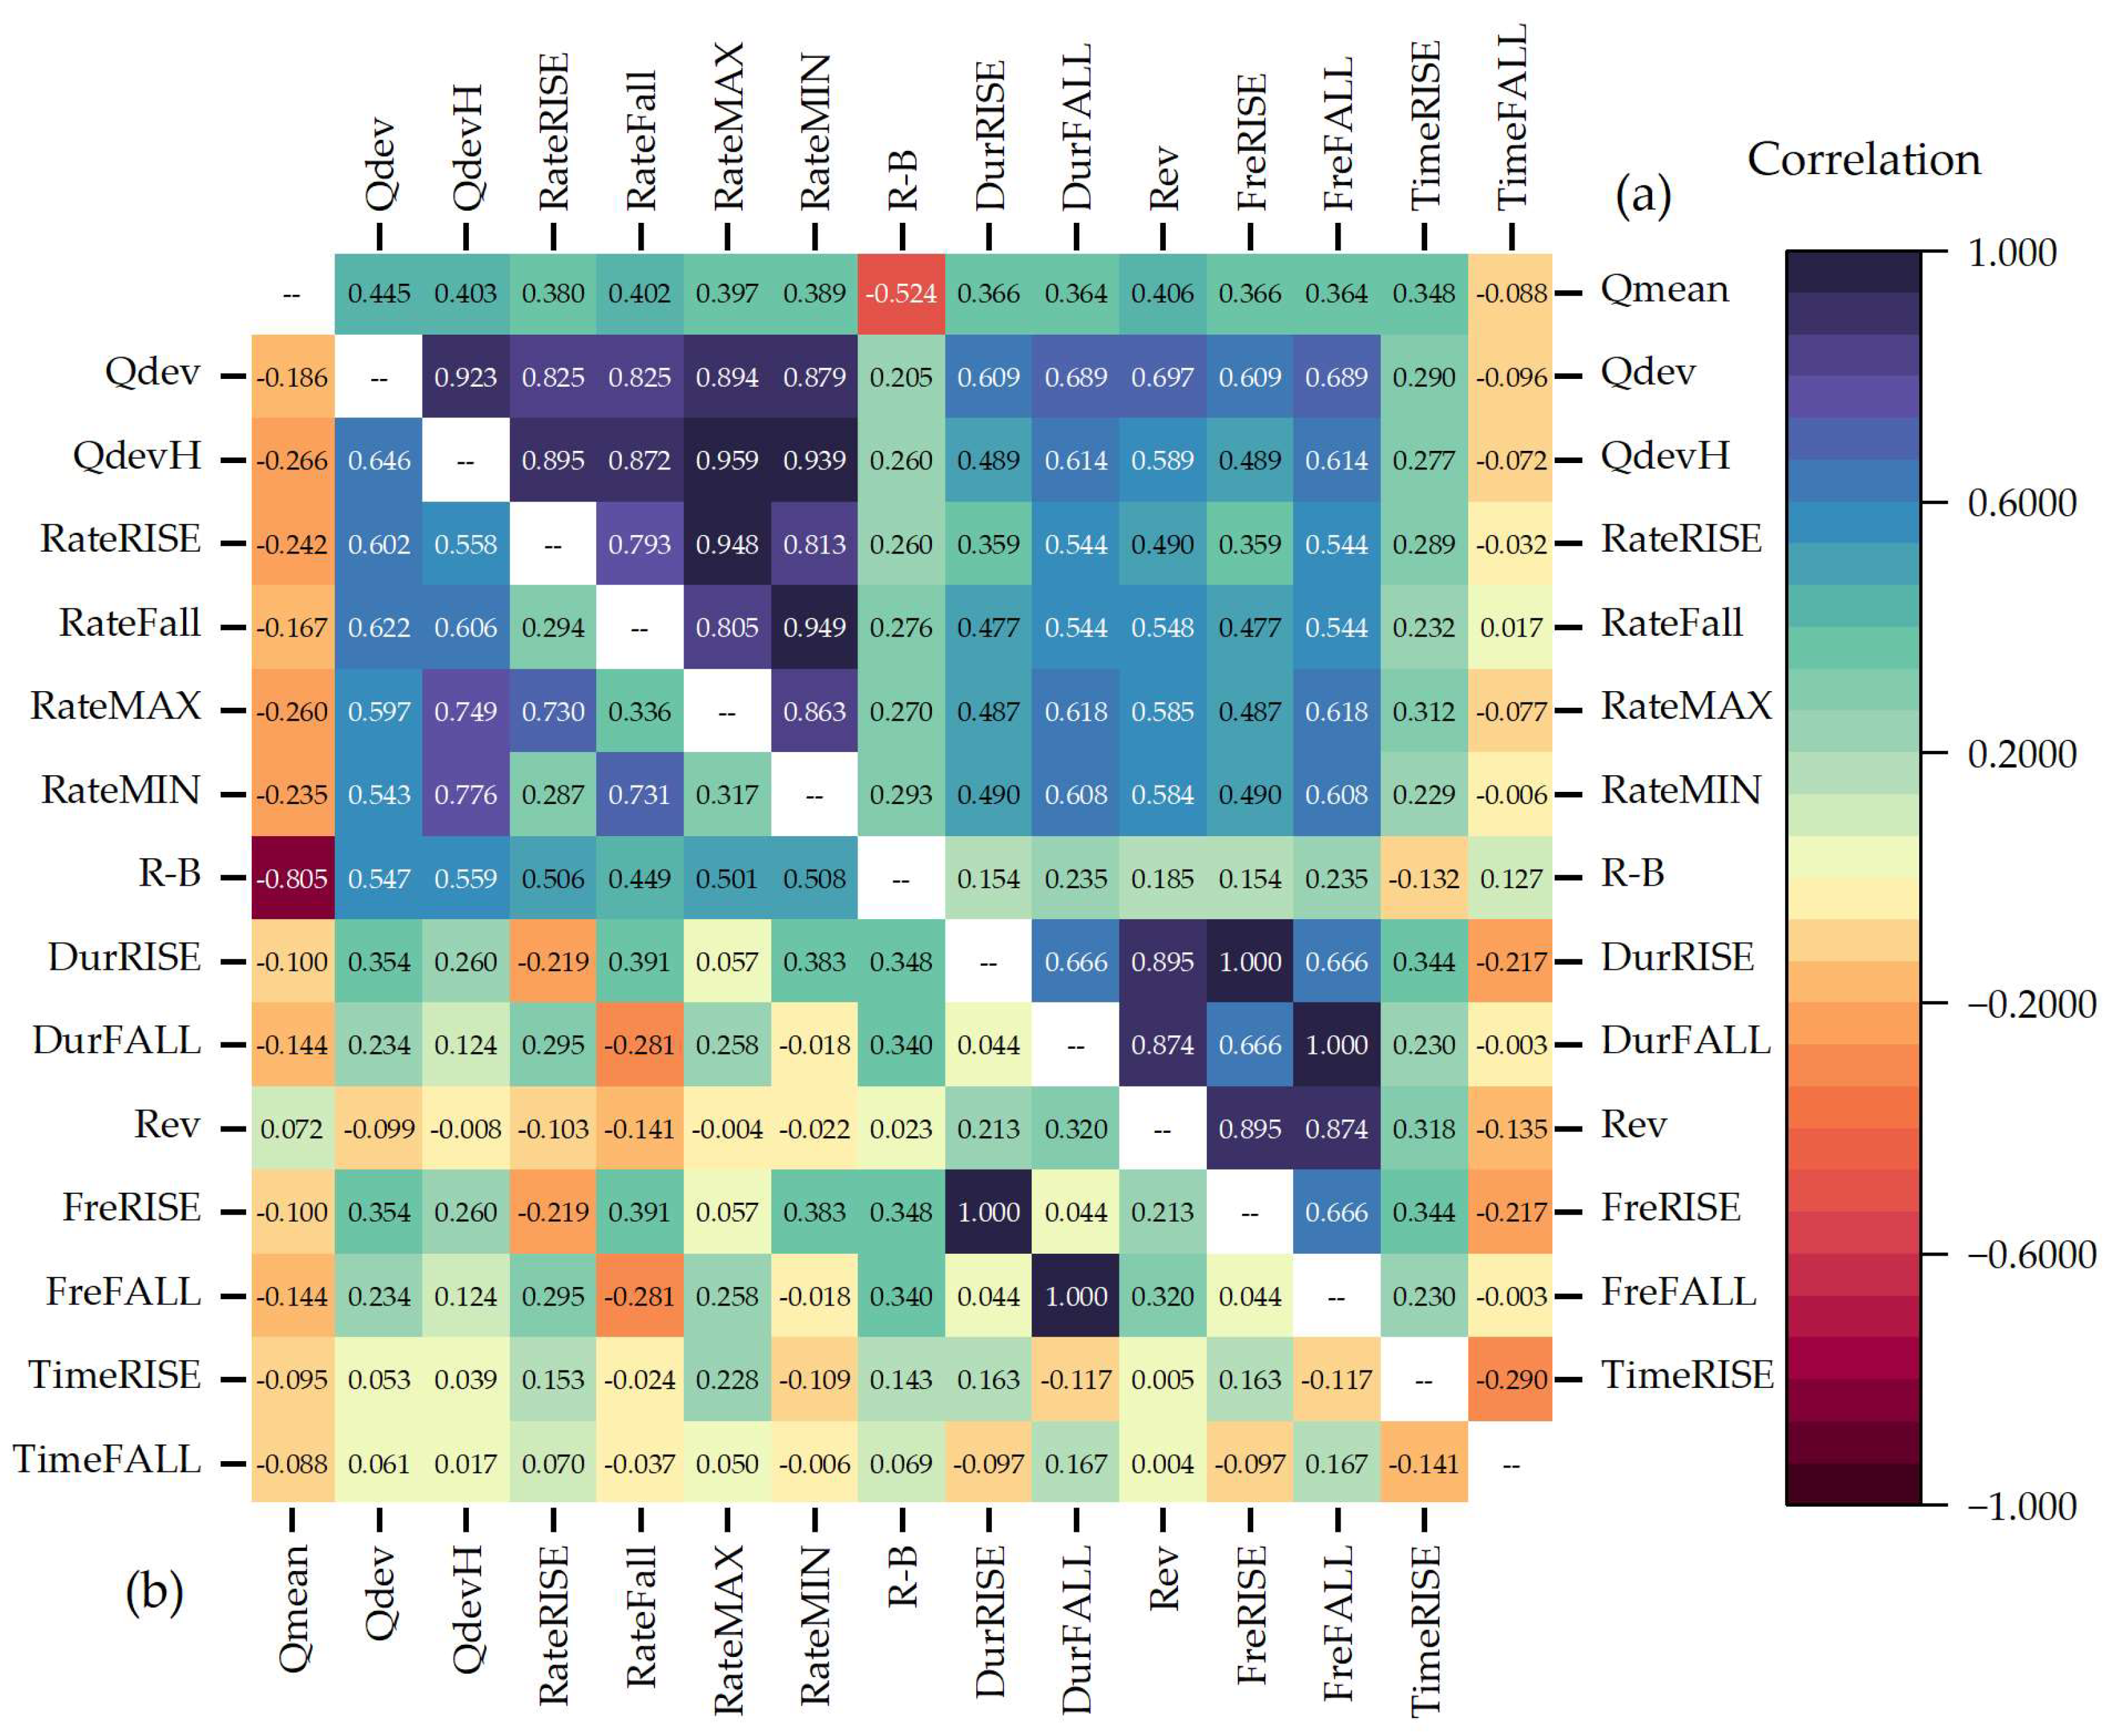
Figure 3 shows the Pearson correlation coefficient for the indexes of the subdaily flow regime alteration. Due to the small differences in the correlation coefficients of the outflow of the Longyangxia hydropower station between 2010 to 2014 and 2015 to 2020, the results in
Figure 3 only compare the correlation between the indexes of the outflow of the Longyangxia hydropower station (
Figure 3a) and the indexes of the outflow of the Banduo hydropower station (
Figure 3b) from 2015 to 2020.
The results show that there was a significant negative correlation (i.e., −0.52 and −0.8) between the daily average flow and the instantaneous index of both the Banduo and Longyangxia hydropower stations. However, the daily average flow of the Banduo hydropower station showed positive correlations with the rest of the indexes. On the other hand, the daily average flow of the Longyangxia hydropower station exhibited non-significant negative correlations with the other indexes. The correlation characteristics of the rest of the indexes for the Banduo and Longyangxia hydropower stations remained consistent. The intra-daily difference, hourly difference, average increase/decrease rate, and maximum increase/decrease rate showed significant correlations. Furthermore, the correlation between the increase/decrease frequency and the increase/decrease duration of flow reached 1, indicating a clear redundancy among these indexes. Therefore, in future studies, it may be appropriate to reduce the number of these indexes without significantly affecting the assessment of the subdaily flow regime alteration.
4.2. Analysis of Subdaily Flow Regime Characteristics
Based on the indexes of subdaily flow regime alteration established in
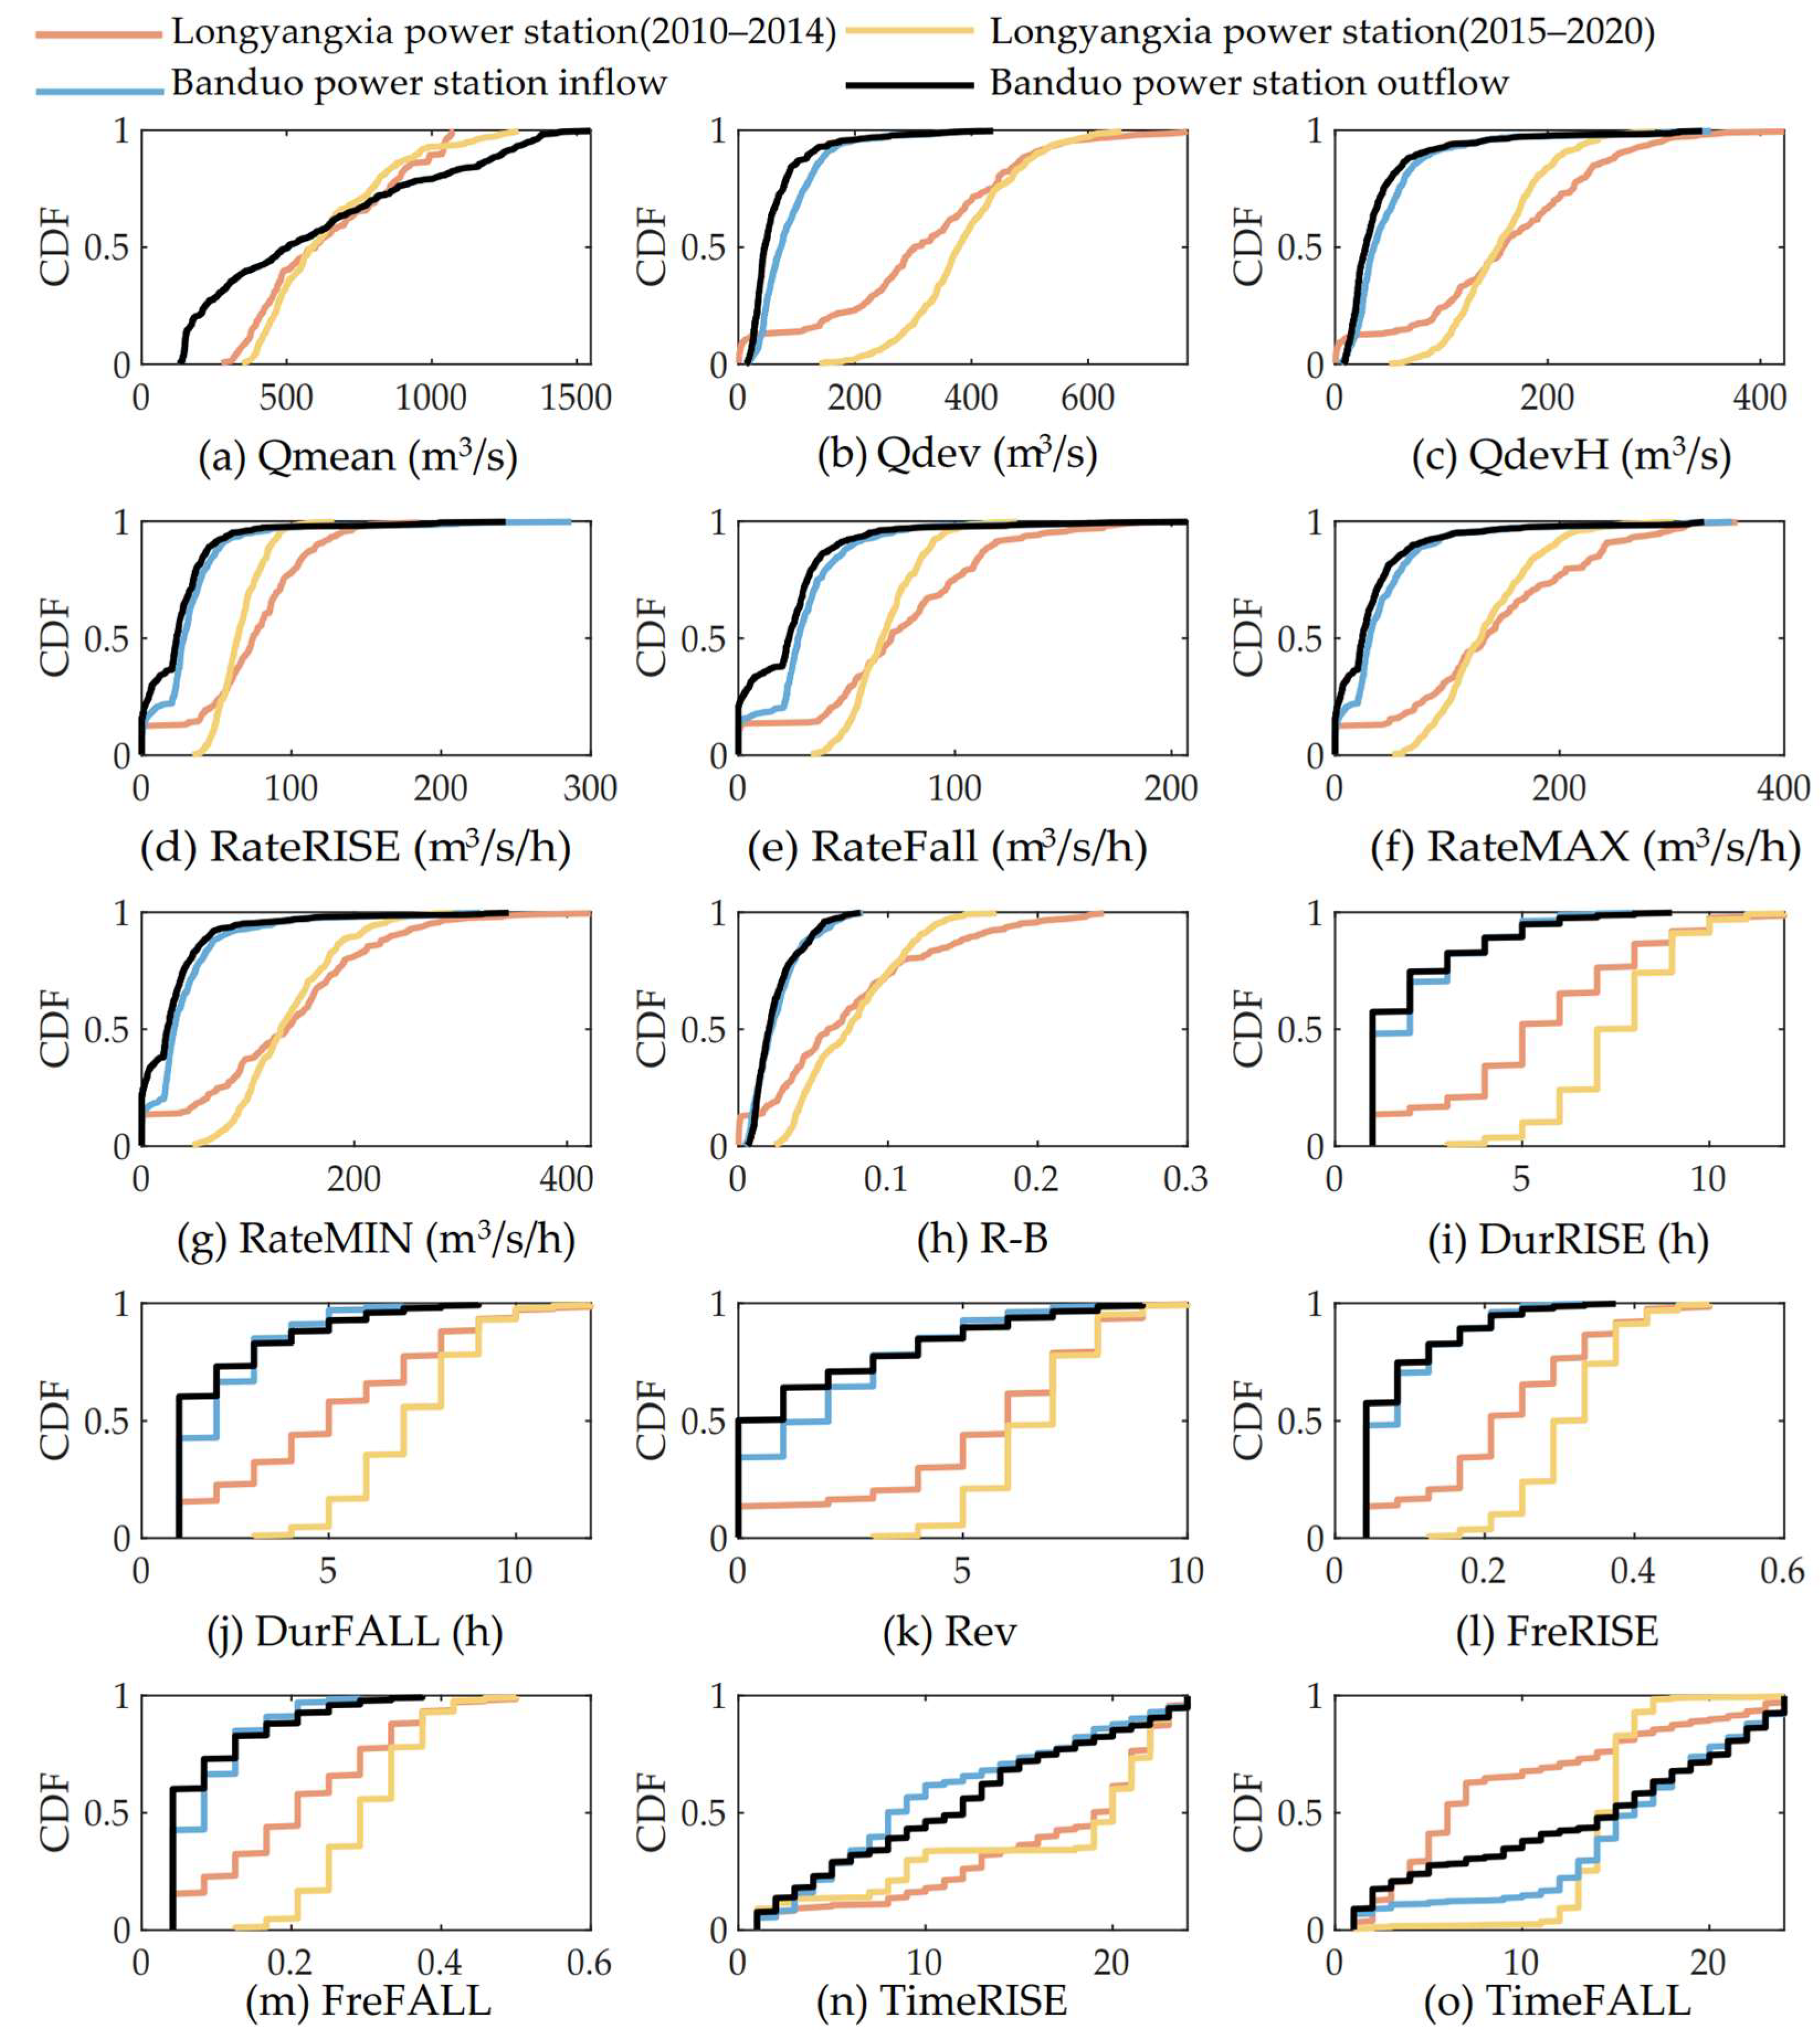
Section 2.1, this study calculated these indexes for the Banduo hydropower station’s inflow and outflow as well as for the Longyangxia hydropower station’s separate operation and hydro–photovoltaic complementary operation. In the calculation process, to reduce the impact of interannual flow processes on the results, multi-year hourly average flow values were used. After obtaining the flow series for 365 days × 24 h, the results of the indexes of the subdaily flow regime alteration were calculated, as shown in
Figure 4. Furthermore, the rank-sum test was also used to check whether the subdaily flow regime after the operation of the reservoir changed significantly compared with the natural state of the subdaily flow regime.
The curves in this figure represent the cumulative distribution function (CDF) of the indexes of the subdaily flow regime alteration. The results shown in
Figure 4 show that the distribution curves of the indexes for the outflow and inflow of the Banduo hydropower station were basically identical, indicating that the impact of the hydropower station’s operation on the subdaily flow regime was mainly reflected in the moments of flow increase and decrease. This suggests that the operation of the Banduo hydropower station has no significant impact on the subdaily flow regime. However, compared with the outflow of the Banduo hydropower station, the Longyangxia hydropower station had a significant impact on the subdaily flow regime during the separate operation, with significant differences in all the CDF curves compared to those of the Banduo hydropower station. This result can also be confirmed in
Table 2, where the
p values of the rank-sum test between the Banduo and Loangyanxia reservoirs from 2010 to 2014 were less than 0.05, rejecting the null hypothesis that these indexes belong to the same sample. Moreover, after implementing the hydro–photovoltaic complementary operation, the Longyangxia hydropower station also had a significant impact on the subdaily flow regime, particularly by significantly increasing the duration and frequency of the flow increase or decrease. Meanwhile, it also significantly affected the timing of the flow increase and decrease during the day, changing the process of the flow distribution during the day. The results shown in
Table 2 also show that the rank-sum test results after the complementary operation of the Longyangxia reservoir (2015 to 2020) were consistent with those before the complementary operation (2010 to 2014), indicating that the reservoir operation had a significant impact on the subdaily flow regime.
Table 3 shows the annual average values of the indexes of the subdaily flow regime alteration. The results indicate that the indexes of the Longyangxia hydropower station during 2010–2014 and 2015–2020 are basically consistent. The values of the first four indexes were all greater than those of the Banduo hydropower station’s outflow indexes, with most indexes increasing by over 100% compared to the Banduo hydropower station’s outflow indexes. The results suggest that after operation, the Longyangxia hydropower station has a faster rate of outflow increase or decrease, and this increase or decrease process lasts longer. Additionally, there were significant differences in the timings of the flow increase and decrease between the Banduo and Longyangxia outflow, further indicating that the operation of the Longyangxia hydropower station significantly changes the distributions of the flow within a day.
To further analyze the frequency distribution characteristics of the subdaily flow regime alteration indexes, three typical indexes were selected for analysis: the hourly difference, duration of flow increase, and timing of flow decrease. The frequency distributions of the corresponding indexes are shown in
Figure 5. The results show that the hourly difference in the Banduo hydropower station’s outflow was mainly concentrated around 50 m
3/s, while the outflow of the Longyangxia hydropower station was mainly concentrated around 180 m
3/s during both the periods of 2010–2014 and 2015–2020. Furthermore, the outflow of the Longyangxia hydropower station was even more concentrated during the period of 2015–2020. Compared to the hourly difference in the Banduo outflow, the difference in the Longyangxia outflow increased by 180%, indicating that the operation of the Longyangxia hydropower station significantly increases the difference in the outflow between hours. At the same time, the duration of the flow increase at the Longyangxia hydropower station significantly increased during the period of 2015–2020, while the timing of the flow decrease was mainly concentrated during the period of maximum photovoltaic output (i.e., around 14:00) (
Figure 5).
4.3. Annual Variation in Flow Regime Alteration
Figure 6 presents a comparison of the concentration of the subdaily flow regime alteration indexes within the year. The results show that there were significant differences in the concentration values of the outflow between the Banduo and Longyangxia hydropower stations (2010–2014) under different flow regime alteration indexes. However, the concentration values of the outflow from the Longyangxia hydropower station between 2015 and 2020 showed smaller differences, all less than 10. Furthermore, the Banduo hydropower station had the highest concentration values for the daily average flow and flow reversal frequency, while the Longyangxia hydropower station had the highest concentration value for the instantaneous index. The concentration values of these indicators all exceeded 10, indicating significant seasonal differences.
In addition, the minimum concentration value for the Banduo reservoir occurred during periods of increased runoff, while for the Longyangxia reservoir, the minimum concentration corresponded to the mean value. These results indicate that there were significant seasonal differences in the impact of the operation on the subdaily flow regime for the Banduo and Longyangxia hydropower stations during 2010–2014. However, after implementing the hydro–photovoltaic complementary operation, the Longyangxia hydropower station maintained a relatively stable impact on the subdaily flow regime across different months. After implementing the multi-energy complementary operation in the Longyangxia reservoir, due to the relatively small variation in electricity demand throughout the year, the differences within a day became more pronounced. Therefore, a multi-energy complementary system needs to meet both the annual load demand of the power grid and the variations in the subdaily load. In comparison to the operation of the Longyangxia reservoir alone, the output of the multi-energy complementary system becomes more crucial for maintaining the power grid load requirements. Consequently, the Longyangxia reservoir, after implementing the multi-energy complementary operation, exhibited a significant impact on the daily flow regimes across the year.
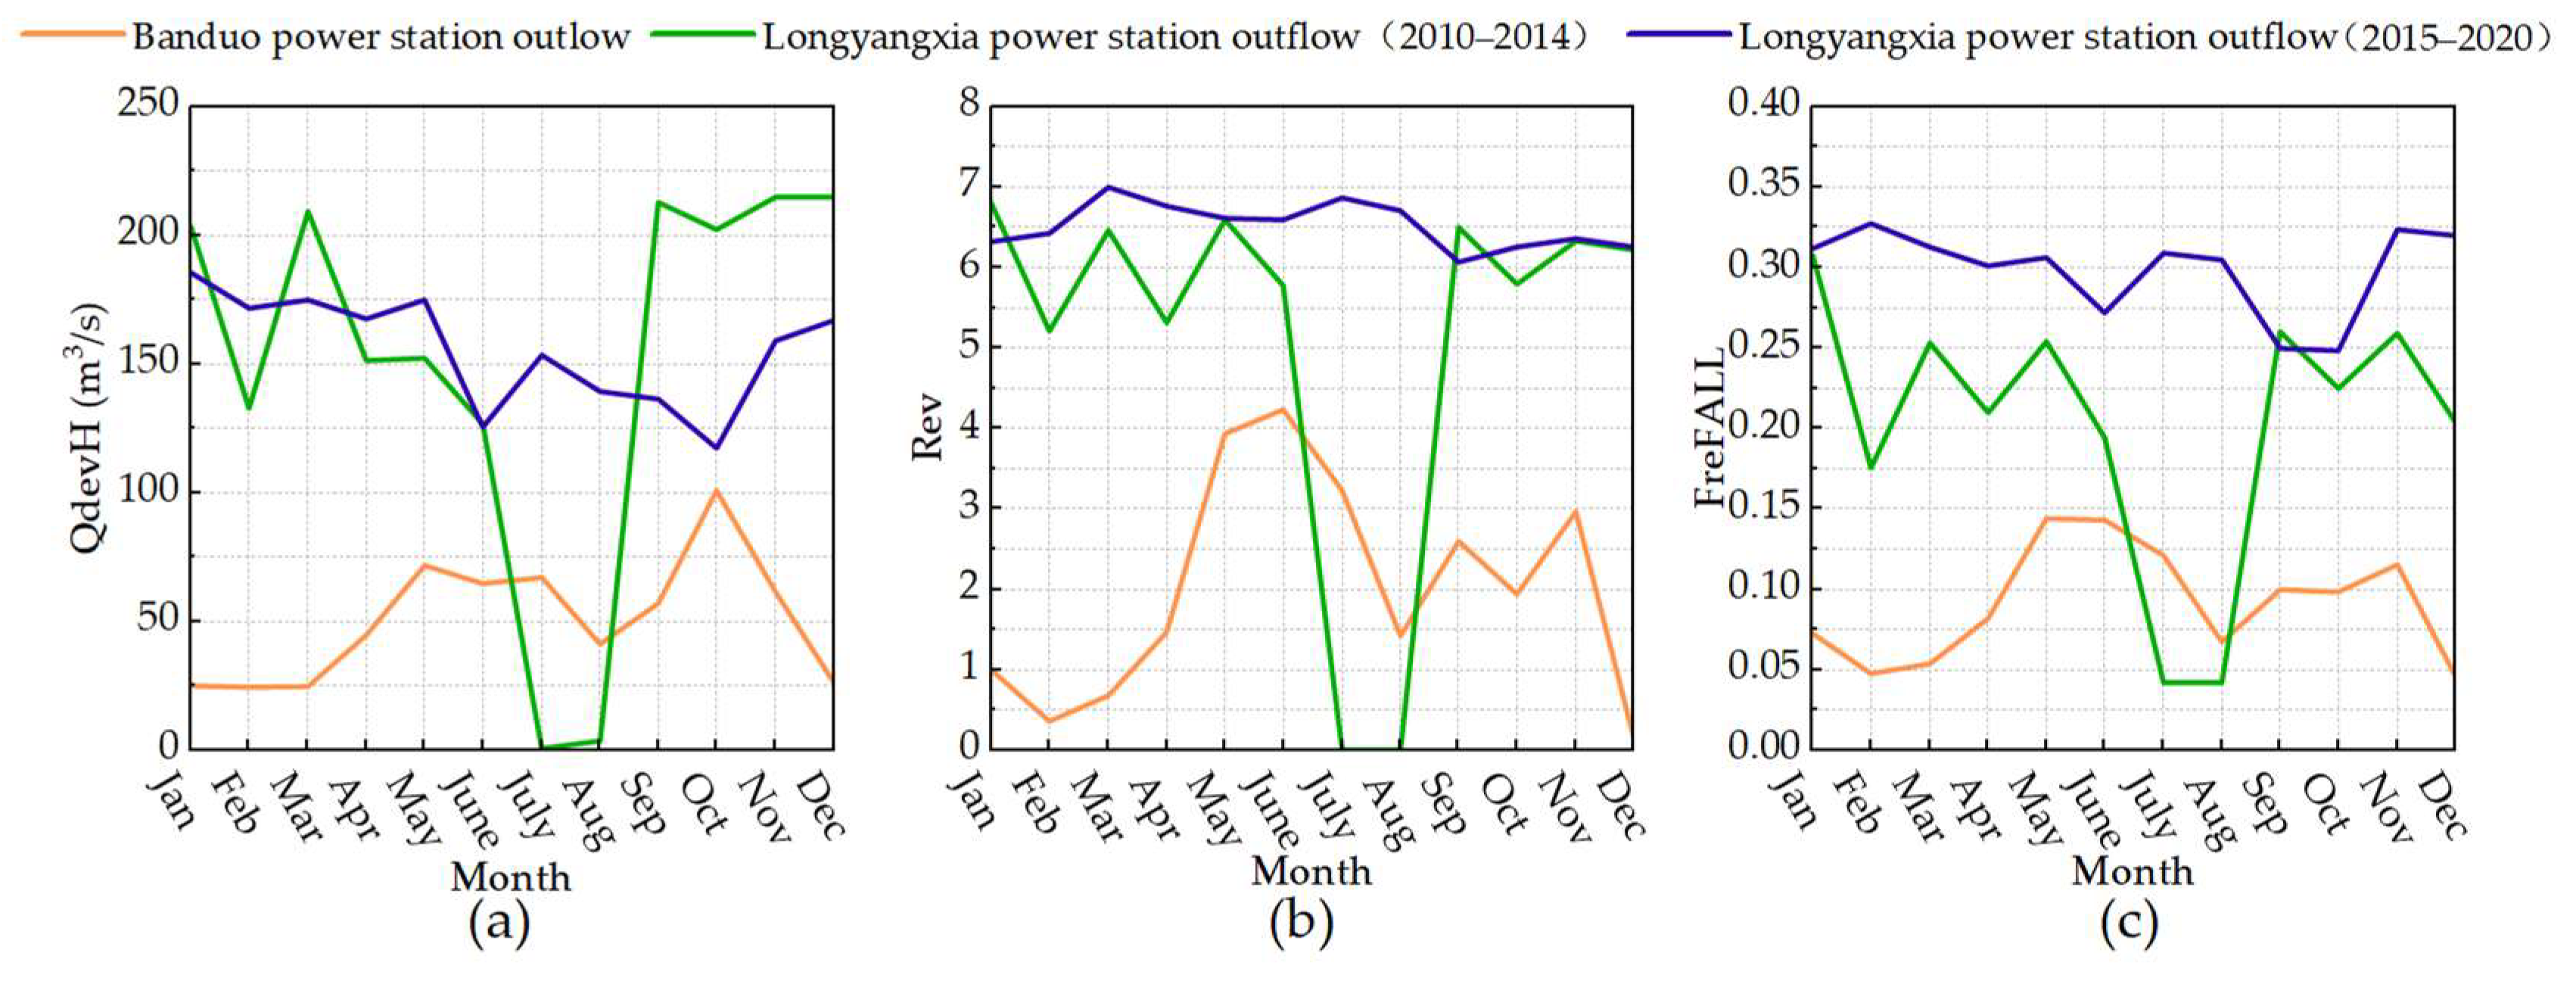
Figure 7 compares the differences in the typical subdaily flow regime alteration indexes throughout the year. The results for the hourly difference (
Figure 7a), flow reversal frequency (
Figure 7b), and flow decrease frequency (
Figure 7c) all indicate that the Longyangxia hydropower station had the greatest impact on the subdaily flow regime during the dry season when operated independently. During the wet season, the Longyangxia hydropower station did not perform hydropeaking operations within the day. However, after implementing the hydro–photovoltaic complementary operation, the Longyangxia hydropower station conducted hydropeaking operations throughout the year, resulting in a more significant impact on the subdaily natural flow regime.
In summary, there were significant differences in the intraday operating strategies between the Banduo and Longyangxia hydropower stations (2010–2014) during different seasons. However, after implementing hydro–photovoltaic complementary operation, the Longyangxia hydropower station adopted an operating strategy that increases the discharge when the photovoltaic output is insufficient and reduces the discharge when the photovoltaic output is high, resulting in a more significant impact on the subdaily natural flow regime. Furthermore, when operating independently, the impact of the Longyangxia reservoir was primarily concentrated between July and August, coinciding with the period of maximum inflow. Therefore, during single operation, flood control is the main consideration for the Longyangxia reservoir, which lacks reasonable scheduling measures, and, thus, it cannot fully leverage its excellent regulatory capacity. With multi-energy complementation, the Longyangxia reservoir fully utilized its regulatory capabilities, resulting in significant benefits.
4.4. Impact on Fish Behavior
The power output from wind and photovoltaic stations is characterized by strong fluctuations and intermittency, as well as a certain degree of anti-peak behavior. When hydropower and solar power operate together, the hydropower plants will need to frequently adjust their daily electricity generation due to the impact of the fluctuating output from wind and solar power. Changes in the operation of hydropower plants also have an impact on river ecosystems, affecting the reproduction of fish. Under a combined operation of hydropower and solar power, a sharp drop in water levels can lead to the exposure and drying out of adhesive fish eggs as well as the stranding of larvae and fry. Conversely, a sharp rise in water levels can wash away gravel from the spawning grounds and benthic invertebrates that serve as fish bait.
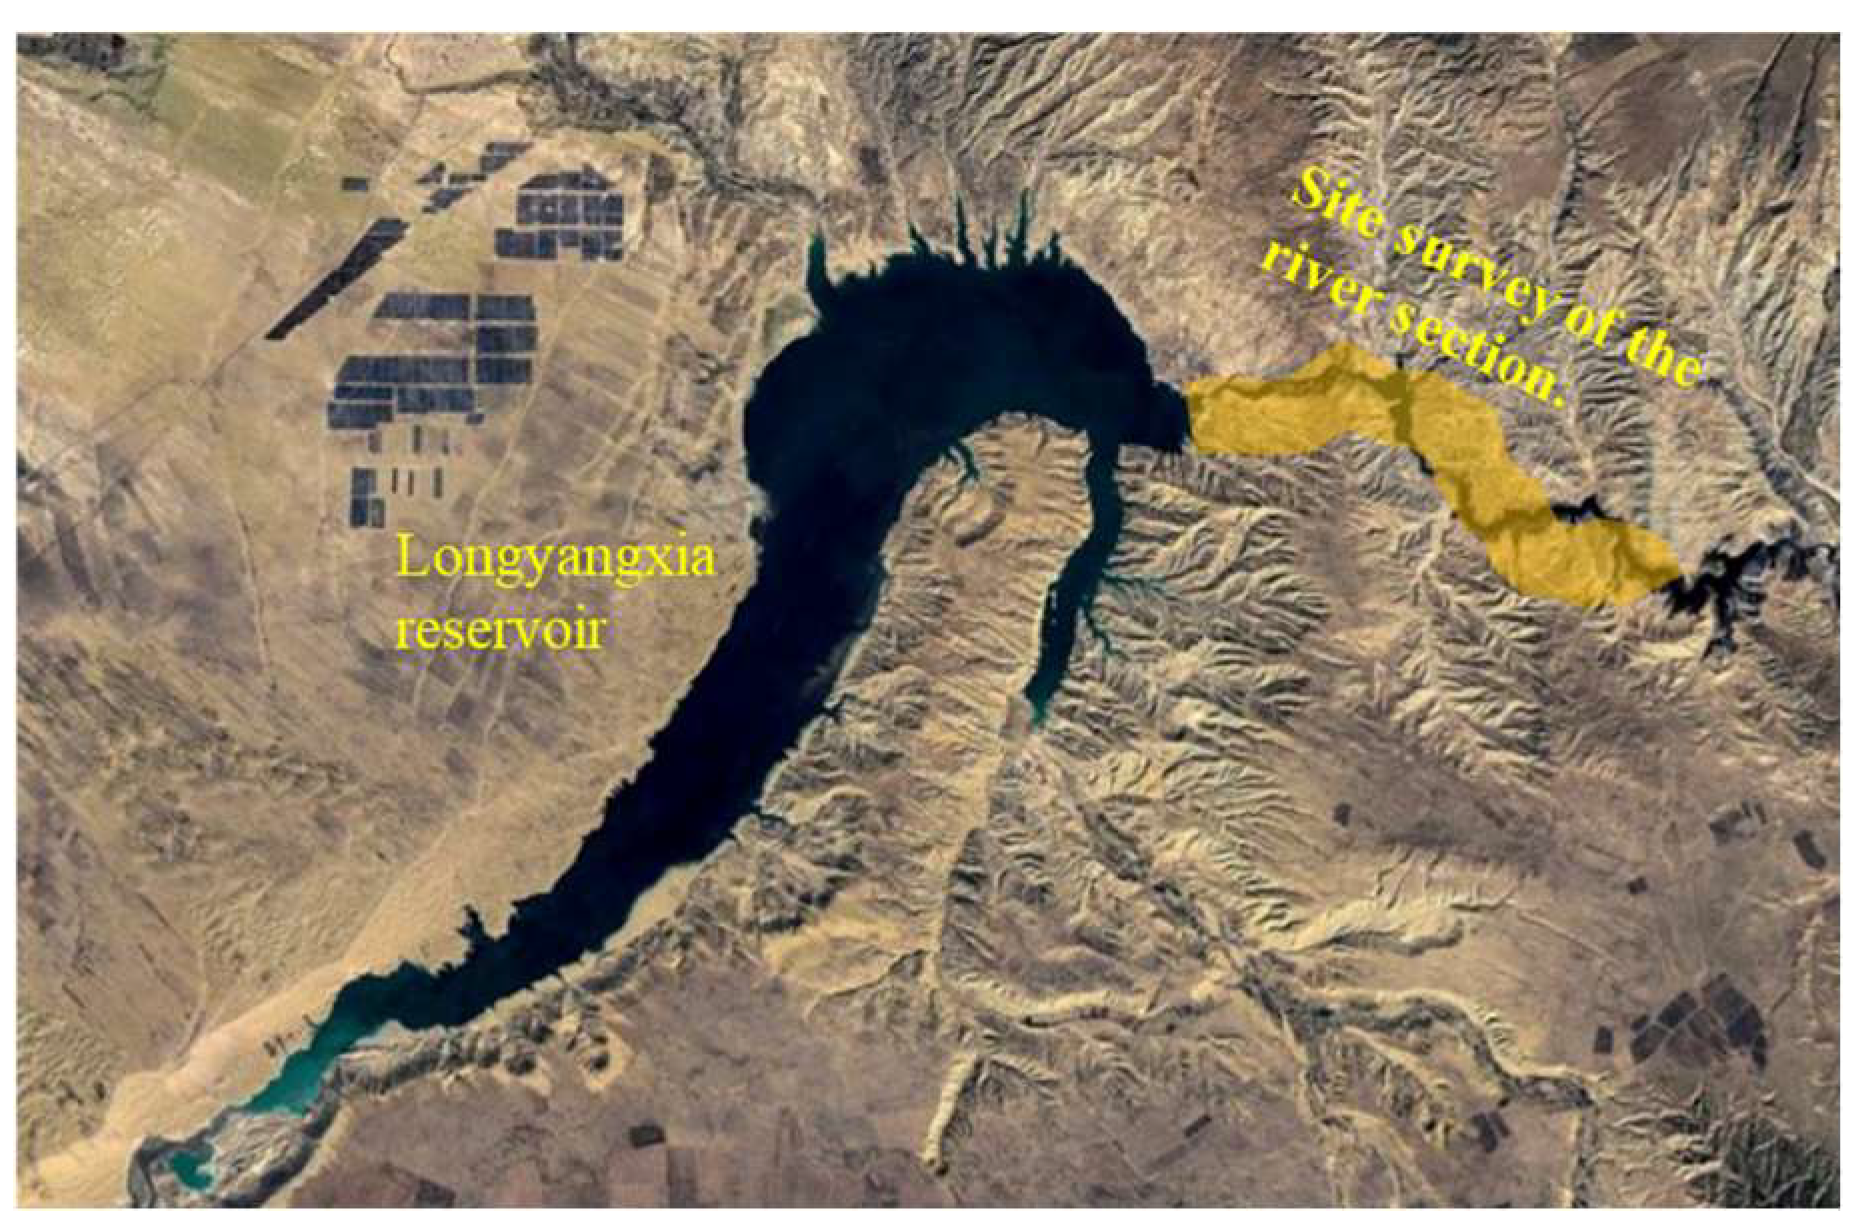
To assess the impact of the complementary operation of hydro and solar power on the habitat of fish, the fish resource data in the river section from the Longyangxia Dam to the Laxiwa Dam (
Figure 8) before the implementation of the complementary hydro and solar operation were collected from the literature [
36]. Simultaneously, a comparative analysis was carried out using the on-site survey data on the fish resources in this river section collected by the authors’ team in 2022.
In 2010, the literature indicated that the indigenous fish species in this river section were G. ecklonieckloni, S. pylzovi, G. pachycheilus, and T. scleroptera, with the rest being invasive species. Among the catch composition, the survey revealed 281 individuals of T. scleroptera, accounting for 32.45% of the total number and 55.63% of the total weight; 53 O.mykiss, constituting 6.12% of the total species and 55.63% of the total weight; followed by 77 G. ecklonieckloni, making up 8.89% of the total species and 17.82% of the total catch weight, while the remaining species had a relatively small proportion. Overall, the survey found the highest number of T. scleroptera, and a greater proportion of the weight was contributed by O.mykiss. The 2022 survey results showed that the indigenous fish species in this river section were G. ecklonieckloni, S. pylzovi, and T. scleroptera, with the rest being invasive species. In the catch composition, 106 G. ecklonieckloni were surveyed, accounting for 75.18% of the total number and 0.19% of the total weight, and 25 T. scleroptera were surveyed, accounting for 17.73% of the total species and 55.63% of the total weight, while the remaining species had a relatively small proportion.
From the comparison of the fish species and resource quantities, it is evident that after the 2015 implementation of complementary hydro and solar power operation in Longyangxia, the resource quantities of indigenous fish species known for producing adhesive eggs, such as G. pachycheilus, have sharply declined. Meanwhile, there has been an increase in non-native species like P.parva forming stable populations. Looking at the age composition of the catch, the number of large indigenous fish species in this river section is relatively low, especially for younger fish, with most being older fish, indicating a declining population structure. However, there are relatively more small-sized loach species and some introduced non-native fish species, with a larger proportion of younger fish.
The protection of subdaily flow regimes in rivers still lacks a clear guiding policy on a global scale, presenting numerous challenges and policy gaps in practical implementation. Additionally, because the conservation of river ecosystems and the operation of hydroelectric power plants fall under the jurisdiction of different departments, fully eliminating the subdaily variations in river flow regimes inevitably leads to policy conflicts. In the practical operation of multi-energy complementary systems, it is essential to consider the policy differences between various departments. Based on the indicator system proposed in this study, negotiations should determine which indicators must be safeguarded, which ones can be appropriately compromised, and which ones can be overlooked. Based on the results, to safeguard the health and integrity of river ecosystems, future multi-energy complementary system operations should prioritize paying attention to the impact on subdaily flow regimes. It is recommended to integrate the assessment indicators proposed in our study for more effective and comprehensive management of river flow regimes.
5. Conclusions
In the construction of a new energy system, hydropower can fully utilize its regulation performance to effectively regulate wind, photovoltaic, and other new energy sources to improve the stability of the power grid [
37,
38,
39]. In this process, hydropeaking operations of hydropower stations significantly change the subdaily natural flow regime, which has an obvious negative impact on riverine ecosystems. This study proposed a set of indexes to evaluate the subdaily natural flow regime alteration using five categories, i.e., the magnitude, rate of change, duration, frequency, and timing, and it analyzed the concentration and redundancy of the indexes within a day. The main conclusions are as follows:
(1) The proposed indexes for the subdaily natural flow regime alteration can effectively evaluate the subdaily flow regime alterations under the influence of hydropeaking operations of hydropower stations and accurately identify the characteristics of flow regime alteration through different aspects.
(2) The indexes of the Longyangxia hydropower stations from 2010–2014 and 2015–2020 were consistent, and the values of the four categories of the magnitude, rate of change, duration, and frequency were all greater than those of the Banduo hydropower station’s outflow. Most indexes of the Longyangxia hydropower stations have increased by over 100% compared to those of the Banduo hydropower station’s outflow.
(3) The Longyangxia hydropower station had the greatest impact on the subdaily natural flow regime during the dry season when operated independently. During the wet season, the Longyangxia hydropower station does not perform hydropeaking operations during the day. However, after implementing the hydro–photovoltaic complementary operation, the Longyangxia hydropower station conducts hydropeaking operations throughout the year, resulting in a more significant impact on the subdaily natural flow regime.
As the indexes of the subdaily natural flow regime alteration proposed in this study were constructed based on five categories, it cannot be guaranteed that the corresponding index values can represent the actual impact of hydropeaking on riverine ecosystems [
40]. Therefore, future studies need to combine these indexes with ecosystem conditions to comprehensively reveal the impact of hydropeaking operations on the health of riverine ecosystems.


