Article

Geochemical Characteristics and Controlling Factors of Groundwater Chemical Composition in the Zihe River Source Area, Shandong, China

1
Zijin Mining Group Company Limited, No. 1, Zijin Avenue, Shanghang 364200, China
2
School of Resource and Geosciences, Nanhu Campus, China University of Mining and Technology, No. 1 University Road, Xuzhou 221116, China
3
Shandong Provincial Bureau of Geology and Mineral Resources, No. 13632, Jingshi Road, Jinan 250014, China
*
Author to whom correspondence should be addressed.
Water 2024, 16(2), 298; https://doi.org/10.3390/w16020298
Submission received: 24 November 2023 / Revised: 21 December 2023 / Accepted: 12 January 2024 / Published: 15 January 2024

Abstract

:
The geochemical characterization and evolution of shallow groundwater in the Zihe River source area is a key issue that needs to be addressed. In this study, a combination of traditional geochemical techniques and geochemical modeling was used to explain the geochemical processes and major ion sources in the chemical evolution of shallow groundwater in the Zihe River source area, Northeast China. Fifty-seven water samples were collected in June 2020 for chemical analysis, and the results showed that the main groundwater chemistry types in the three major aquifers are HCO3·SO4-Ca·Mg-type pore water from loose quaternary rocks, HCO3·SO4-Ca·Mg-type karstic fissure water from carbonate rocks, and HCO3·SO4-Ca-type weathered fissure water from massive rocks. Water–rock interactions in alkaline environments were the main causes of changes in groundwater chemistry. Rock weathering dominated the geochemical evolution of each aquifer. The analysis of ion concentration ratios and modeling revealed that the aquifer’s chemical components are mainly derived from the dissolution of dolomite and calcite and partly from the infiltration of pollutants containing C l and N O 3 , as well as from the dissolution of quartz. Mg2+ is derived from the dissolution of dolomite. H C O 3 is primarily derived from the co-dissolution of calcite and dolomite, and to a lesser extent, its content is also influenced by the recharge of rainfall. S O 4 2 has two sources: it mainly originates from the dissolution of gypsum and the anhydrite layer, followed by atmospheric precipitation. The synthesis showed that the groundwater quality in the source area of Zihe River is good, all the indices reached the standard of class III groundwater quality, and the overall degree of human pollution is low. The results of this research will provide a scientific basis for the local authorities to delineate karst groundwater protection zones in the Zihe River source area and to formulate resource management strategies for the development, utilization, and protection of karst groundwater.

1. Introduction

The chemical composition of groundwater is the product of the long-term interaction between groundwater and the external environment (Yao, 2013) [1]. Research on the chemical characteristics of groundwater and the sources of its main components in river source areas can help clarify the source and formation process of groundwater and reveal the status of the groundwater environment. Meanwhile, it also provides a scientific and reasonable basis for groundwater development and protection. Shallow karst groundwater is an important water supply source for industry, agriculture, and residents in Boshan District, Zibo City, Shandong Province. It plays an important role in ensuring the water supply, supporting social and economic development, and maintaining the ecological balance. Zhang et al. (2021) [2] emphasized the challenges in water pollution control and the weak water ecological protection in the downstream section of the Zihe River (Boshan section), advocating the need to enhance pollution control measures and research hydrogeochemical evolution in the watershed segment. Zhao (2020) [3] and Teng (2023) [4] carried out pollution source analyses of downstream groundwater and found that the main pollutants were derived from industrial, agricultural, and domestic waste. Ma et al. (2020) [5] unveiled and substantiated the high-yielding water target areas in the source region of the Zihe River through extensive field investigations and borehole core analyses, inferring the patterns of high-yielding water in the source area. Guo et al. (2017) [6] used Feflow to build a hydrogeological model to predict the production volume of the Dawu water source region (downstream) of the Zihe River and assessed the volume of regional groundwater resources. Based on the evaluation of karst groundwater resources in the Zihe River source region based on exploitative trial results, Qi et al. (2019) [7] and Yuan et al. (2020) [8] applied the compensation depletion method to perform a rational assessment.
Overall, previous researchers have explored the groundwater in the study region, either in its entirety or within specific areas, addressing aspects such as contaminant migration (Zhang, et al., 2021) [2], high-yielding water patterns (Ma, et al., 2020) [5], and the characteristics of downstream groundwater (Zhao 2020 [3] and Teng 2023 [4]). These studies have laid a foundational groundwork for more in-depth research in the Zihe River region and for the implementation of related engineering projects. Nevertheless, there is a noticeable gap in the existing literature pertaining to a fundamental, systematic, and multiple-component investigation of the hydrochemical composition of karst water in the Zihe River source region. Such research holds substantial theoretical and practical significance for the rational utilization of water resources in the source region and for the examination of local water and ecological environmental changes.
Due to the uncertainties associated with hydrogeological structure, lithology, residence times of the water, and human activities, investigating the geochemical characteristics and evolution patterns of groundwater presents significant challenges (Appelo and Postma, 2005; Devic et al., 2014) [9,10]. Effective methods for determining ion sources in groundwater include the utilization of Piper trilinear diagrams, ion ratios, ion correlation coefficients, saturation indices, statistical approaches, and Gibbs diagrams (Hamed and Dhahri, 2013; Han et al., 2014) [11,12]. In addition to these traditional methods, geochemical modeling has gradually started to play a substantial role in this research field, especially with the advent of digitalization, in explaining complex hydrochemical datasets to gain detailed insights into the geochemical evolution of groundwater (Karroum et al., 2017; Singh et al., 2017) [13,14]. Recently developed hydrogeochemical models primarily fall into three categories: mass balance models, mass transformation models, and mass migration models. This study predominantly employed the more mature mass balance model, which is grounded in the principles of mass, energy, and charge conservation. It essentially involves solving and describing coupled equations for solute mass balance and is widely used for the quantitative assessment of mass transfer processes along groundwater flow paths from one point to another (Wang et al., 2003; Acero et al., 2015; Liu et al., 2020) [15,16,17].
Considering the above, this study, following initial hydrogeological investigations and water quality analyses conducted at the potential water source site in Xiejia Dian Village, Shimazhen, Boshan District, Zibo City, Shandong Province, conducted a comprehensive collection of karst water samples in combination with the local geological and hydrogeological conditions of the Zihe River source region. By employing a combination of conventional hydrogeochemical analytical methods such as Piper trilinear diagrams, Gibbs diagrams, ion ratio coefficients, and correlation analysis, along with geochemical modeling, this study achieved the following: (1) the determination of the regional groundwater chemical types; (2) the identification of the major ion sources in the groundwater; and (3) the identification of the controlling factors influencing the geochemical evolution of the water bodies in the study area. This research serves as a reference for subsequent karst water chemical zoning and contributes to defining the background context for water pollution analyses. It offers a scientific foundation for future improvements in groundwater resource management, the prevention of water pollution, and the rational development and protection of karst groundwater.

2. Zihe River Source Region Overview

2.1. Physical Geography

The Zihe River source region is located in the southern part of Boshan District, Zibo City, extending north to the Laiwu Qingshiguan Village–Gu Mountain–Yuanquan Town line and southeast and south to the administrative boundary between Boshan District and Yiyuan District, which serves as the surface watershed. The northeast part is the administrative border between Boshan District and Zichuan District. To the west, it extends to the Laiwu City metamorphic rocky mountainous area of the surface watershed (as shown in Figure 1). The administrative division involves the Laicheng District of Laiwu City and the Boshan District of Zibo City. The geographic coordinates are latitude 36°15′43′′ to 36°26′58′′ north and longitude 117°48′44′′ to 118°12′44′′ east, with an area of 605 km2. A hydrogeological survey was performed of the source area and the water source exploration well project, mainly in Boshan Town, Boshan District, and the North Bo Mountain Village–Xiejiadian–Invite Rabbit Cliff Village area. This region has a temperate semi-moist continental monsoon climate; the average temperature for many years has been 12 °C, and the average precipitation is 720.6 mm. The regional topography comprises predominantly low to medium mountains in the periphery, with a central zone characterized by the topography of the Zihe River valley. The surface water features within the area are primarily represented by the Shimawan Reservoir and the seasonal Zihe River. The northwest tributary of the Zihe River originates in the Lushan Mountain range, while the southwest tributary originates at the foothills of Mount Yuwang. These two tributaries confluence at Quanhe Village in Yuanspring Town and join the main course of the Zibo River, which continues to flow northward.

2.2. Stratigraphy and Tectonics

The age of the strata exposed in this area ranges from old (in the southeast) to new (northwest). The stratigraphic order (from old to new) is Archean Taishan Group (Art), Paleozoic Cambrian Changqing Group (∈2–3 C ^ ), Zhushadong Formation (∈2 z ^ ), Mantou Formation (∈2–3m), the Ordovician to Lower Silurian Jiaojie Group (∈3–O1J) (which consists of the Zhangxia Formation (∈3 z ^ ), Gushan Formation (∈3–4g), and Chaomidian Formation (∈4O1 c ^ )), and the Cambrian to Ordovician Jiaojie Group Sanshanzi Formation (∈4O1s). Additionally, there is the Ordovician Majiagou Group (O23M) with the Donghuangshan Formation (O2d), Beianzhuang Formation (O2b), Tuyu Formation (O2t), Wuyangshan Formation (O2w), Gezhuang Formation (O2g), and Badan Formation (O2–3b). The Neogene Quaternary Hongji Formation (Q) is also present. The overall structural dip of the stratigraphy trends northwest, with an inclination angle ranging from 5 to 20°.
Since the Yan Mountain Movement, because of multiple tectonic events, the structural features in this region are primarily characterized by well-developed fault structures with relatively few folds, especially extensive and large-scale extensional faults. The major faults in the area include the Qinglong Mountain Fault, Longtou Mountain Fault, Shima Fault, Penquan–Beibo Mountain Fault, and Ganquan Fault, etc.

2.3. Hydrogeological Conditions

According to the occurrence conditions of groundwater and the lithology characteristics of the water-bearing medium, this area can be divided into three water-bearing rock groups: (I) Quaternary loose-pore water-bearing rock, (II) carbonate fracture–karst water-bearing rock, and (III) massive weathered fissure water-bearing rock. The aquifers and distribution ranges of the main groundwater types are shown in Table 1 and Figure 1.
I.
Quaternary loose-pore water-bearing rock group
This aquifer is mainly distributed in the floodplains and valleys of Zihe River and its tributaries. The lithology of the aquifer is sandy gravel and pebble, and the thickness is generally 10~30 m. The water level and water volume change with the seasons. It is mainly supplied by atmospheric precipitation infiltration, surface water seepage, and gneiss weathered fissure water. The water output of a single well in wet years is greater than 1000 m3/d, but it dries up in normal and dry seasons. Therefore, it is not a significant water supply source.
II.
Carbonate karst fracture water-bearing and fractured karst water-bearing rock group
II1.
Carbonate fracture karst water-bearing rock group (Majiagou Group, Chaomidian Formation)
The Sanshanzi Formation (∈4 O 1s)–Chaomidian Formation (∈4 O 1 c ^ ) is a fissure karst water-bearing rock formation. The upper part of the aquifer is composed of gray and medium-thin layers of micrite limestone and a small amount of bamboo leaf-like limestone, and the middle part is oolitic gray. The lower part is a medium-thin layer of micrite limestone with leaf-like limestone, mainly dolomitic limestone (the main chemical component is calcite ( C a C O 3 )), intercalated with sulfide minerals such as gypsum and anhydrite, and with joints and fissures that have developed to accept the atmosphere. Recharge is through precipitation infiltration and surface water leakage. It is highly water-rich and the water inflow volume in a single well is greater than 1000 m3/d. This layer has developed karst fissures and is extremely water-rich. Dissolution fissures and honeycomb caves are particularly well-developed. It is one of the main aquifers in the area.
The Beianzhuang Formation (O2b) limestone aquifer is mostly buried underground except for parts exposed on the surface to the west of the Zihe River and in the graben zone. The main lithology of the aquifer is dark-gray thick limestone, intercalated with multiple layers of gray-yellow thin dolomite (the main chemical component is calcite ( C a C O 3 )) and massive gypsum and anhydrite layers. The roof burial depth is 25.00~130.09 m, and there are karst fissures. The dissolution fissures and caves are rich in water and are some of the main aquifers in the study area.
The Wuyangshan Formation (O2w) limestone is exposed at a higher position and is mostly exposed on the surface. Although it is partially buried underground, the lower part is blue-gray chert-containing nodule limestone (the main chemical component is C a C O 3 ), and the middle and upper parts are gray thick-layered limestone, intercalated with leopard-skin-like limestone; the burial depth is shallow, and the water volume is small.
II2.
Carbonate karst fissure water-bearing rock group (Zhangxia Formation, Zhushadong Formation)
The karst fissure water of the Zhangxia Formation mainly exists in the limestone and oolitic limestone at the top and bottom. The lithology is mainly limestone. It is exposed on both sides of the valley east of Chishang Village in the southeast region of the study area, with a thickness of 60~80 m. The water inflow volume of a single well in this aquifer is generally less than 1000 m3/d, and it occurs in structurally favorable locations or in areas where the aquifer is buried deeply. The water quality of the karst fissures in this layer is excellent, and natural mineral water deposits suitable for drinking can be formed in some areas.
The karst fissure water in the Zhushadong Formation is mainly distributed in limestone, dolomitic limestone, and dolomite. It is mainly distributed in the Chishang Town area in the southeast region of the study area. The distribution range is small, and the water content is low. The water inflow volume of a single well is generally less than 100 m3/d, and the groundwater quality is good.
III.
Massive weathered fissure water-bearing rock group
Mainly distributed in the southeast, south, and southwest regions of the study area, the lower part of the aquifer is intact, and the bedrock is mostly granite gneiss, which mainly contains mica ( K A l 2 ( A l S i 3 O 10 ) ( O H ) 2 ), albite ( N a A l S i 3 O 8 ), anorthite ( C a A l 2 S i 2 O 8 ), and quartz ( S i O 2 ), The thickness of the weathered layer is 10~30 m, and the thickness of the aquifer is 8~25 m. Groundwater mainly exists in the fissures and weathered layers of granite gneiss and belongs to the fissure phreatic type. The main supply source of groundwater is atmospheric precipitation, and the water level is 2~3 m deep. The water richness of the rock formation is relatively uniform, but the water output of a single well is small (less than 100 m3/d) and the annual dynamic changes in the water level and water volume are significant. It serves as an aquifer that can be used by people and livestock in the local mountainous areas. The quality of groundwater in this layer is good.
The groundwater recharge in the study area is primarily derived from atmospheric precipitation. Some atmospheric precipitation directly recharges groundwater through fissures, while other atmospheric precipitation forms surface runoff in areas with favorable terrain and is discharged downstream or recharges groundwater through river seepage. The hydrogeological flow patterns are controlled by the surface topography and fault structures. Due to the presence of the Shi-Ma Fault to the north, which acts as an impermeable barrier, groundwater flow is directed from the southwestern and southern regions of the study area towards the Zihe River valley. The Zihe Fault Zone (including the Penquan–North Bo Mountain Fault) serves as a high-velocity groundwater flow zone, with groundwater continuing to flow northeastward along the Zihe Graben after converging towards the Zihe River valley. The groundwater discharge mechanisms primarily include (1) artificial extraction, (2) discharge into river channels, and (3) natural spring outlets and groundwater overflow.

3. Analysis of Shallow Groundwater Properties

3.1. Water Sampling and Analytical Techniques

In this study, 57 water samples were collected from 20 to 30 June 2020, including 12 samples of pore water from the quaternary loose rock pore water, 4 samples of weathered fracture water from blocky rock, and 41 samples of karst fracture water from carbonate rocks and salt rocks. Given that the study area is predominantly characterized by karst mountainous regions, the sampling locations primarily included domestic wells, geological boreholes, and natural springs, as shown in Figure 1. All water samples were immediately preserved in pre-cleaned polyethylene bottles with watertight lids at 4 °C. They were transported back to the laboratory in opaque sample containers.
In the laboratory, each water sample was divided into two equal portions using a 0.45 μ m filter membrane. One portion was adjusted to a pH value less than 2 using high-purity H N O 3 for cation testing, while the other portion was left untreated for anion testing. On-site measurements included parameters such as water temperature, pH, and electrical conductivity (EC), etc., which were determined using a portable HACH water quality parameter instrument. The H C O 3 concentration was determined on the day of sampling using acid–base titration.
K + , N a + , C a 2 + , M g 2 + , etc., cation analysis was carried out using Inductively Coupled Plasma Optical Emission Spectroscopy (ICP-OES) with an ICAP 6300 instrument which is manufactured by Thermo Fisher Scientific, with its headquarters located in Wilmington, Massachusetts, USA, while anion analysis on S O 4 2 ,     C l ,     N O 3 ,   etc., was performed using an ICS-1100 ion chromatograph. In total, 57 water samples were collected for this study. All samples were tested at the laboratory of the Shangdong Institute of Geological Engineering Exploration.

3.2. Analysis of Water Chemical Characteristics

The chemical composition and concentration of groundwater in the three aquifers in the study area were obtained (Table 2). ① According to the “Groundwater Quality Standards” (GB/T 14848-2017) [18], the water quality conforms to Class III standards; the pH range is between 7.00 and 8.40, indicating a weak alkaline nature. ② The concentrations of N a + in the three aquifers are all lower than 20 mg/L. It can be roughly inferred that the contents of rock salt (NaCl) and mirabilite ( N a 2 S O 4 10 H 2 O ) in the aquifers are very small. ③ The average TDS values in the three aquifers all fall within the China GB 5749-2006 “Standards for Drinking Water Quality ”[19] for tap water (TDSs of 260~600 mg/L). The overall water quality is good, with only local artificial drainage areas G121 and G8 reaching 600 mg/L. These high values, with coefficients of variation of 0.12, 0.30, and 0.18, respectively, belong to the medium fluctuation range (0.10~0.30), indicating that the spatial distribution of TDS values is fairly uniform. The overall regional groundwater quality was less affected by the outside world, and rainfall and human pollution did not have too much of an impact on the water quality. ④ In all three aquifers, the predominant cations are C a 2 + and M g 2 + , while the anions mainly consist of H C O 3 and S O 4 2 . ⑤ The coefficients of variation for C a 2 + , M g 2 + , and H C O 3 in the carbonate rock fissure–karst water are relatively small, measuring 0.25, 0.21, and 0.27, respectively. This indicates that the concentrations of these ions in the aquifer are relatively stable with small variations. On the other hand, N a + , K + , N O 3 , and C l exhibit larger coefficients of variation, measuring 0.40, 0.69, 0.63, and 0.41, respectively, suggesting a larger fluctuation range. This implies that these ions experience significant variations due to environmental factors. It is worth noting that the sample sizes for the other two functions are limited, and thus, those evaluations were deferred.
This study employed the Schuler classification method to identify HCO3·SO4-Ca·Mg-type water as the primary hydrochemical classification in the study area, accounting for 71.9% of the water samples. In the quaternary loose rock pore water, HCO3·SO4-Ca·Mg-type water predominates in the groundwater of aquifer formations. In the weathered fractures of blocky rocks, HCO3·SO4-Ca-type water is predominant, while in the carbonate rock fractures and karst aquifers, HCO3·SO4-Ca·Mg-type water prevails. Based on the inferred direction of water flow, the overall evolution of the hydrochemical types suggests a transformation from HCO3·SO4-Ca-type water to HCO3·SO4-Ca·Mg-type water. This study mapped different water quality components onto a Piper trilinear diagram (Figure 2) and revealed that the three groundwater types are generally similar, with the main distinctions being between HCO3·SO4-Ca·Mg-type water and HCO3·SO4-Ca-type water. Given the prevalence of significant fault structures in the study area, it was postulated that there is strong hydraulic connectivity between various aquifers. In the quaternary loose-pore water-bearing rock group, the concentration of S O 4 2 is relatively high. It is speculated that this could be attributed to the decomposition of organic matter in groundwater, releasing S O 4 2 , or it may be introduced through atmospheric precipitation. This will be discussed in subsequent sections.

4. Geogenic Sources of Chemical Components of Groundwater

4.1. Ion Concentration Ratio (ICR) Analysis

In order to assess the ion sources more effectively, this study conducted a concentration ratio analysis for 57 water samples, resulting in a groundwater ion concentration ratio diagram for the study area, depicted in Figure 3.
In the karst aquifer of the study area, the minerals that primarily influence the groundwater chemical composition are calcite, dolomite, gypsum, and anhydrite. The ratio of milliequivalent concentrations of γ H C O 3 to γ S O 4 2 + C l can reflect the degree of carbonate dissolution in the water. As depicted in Figure 3a, all data points are situated on the side of the 1:1 line, indicating a high proportion of H C O 3 in the groundwater. This phenomenon suggests that the primary process contributing to the hydrochemical composition of groundwater is the dissolution of carbonate minerals (Hong et al., 2016) [
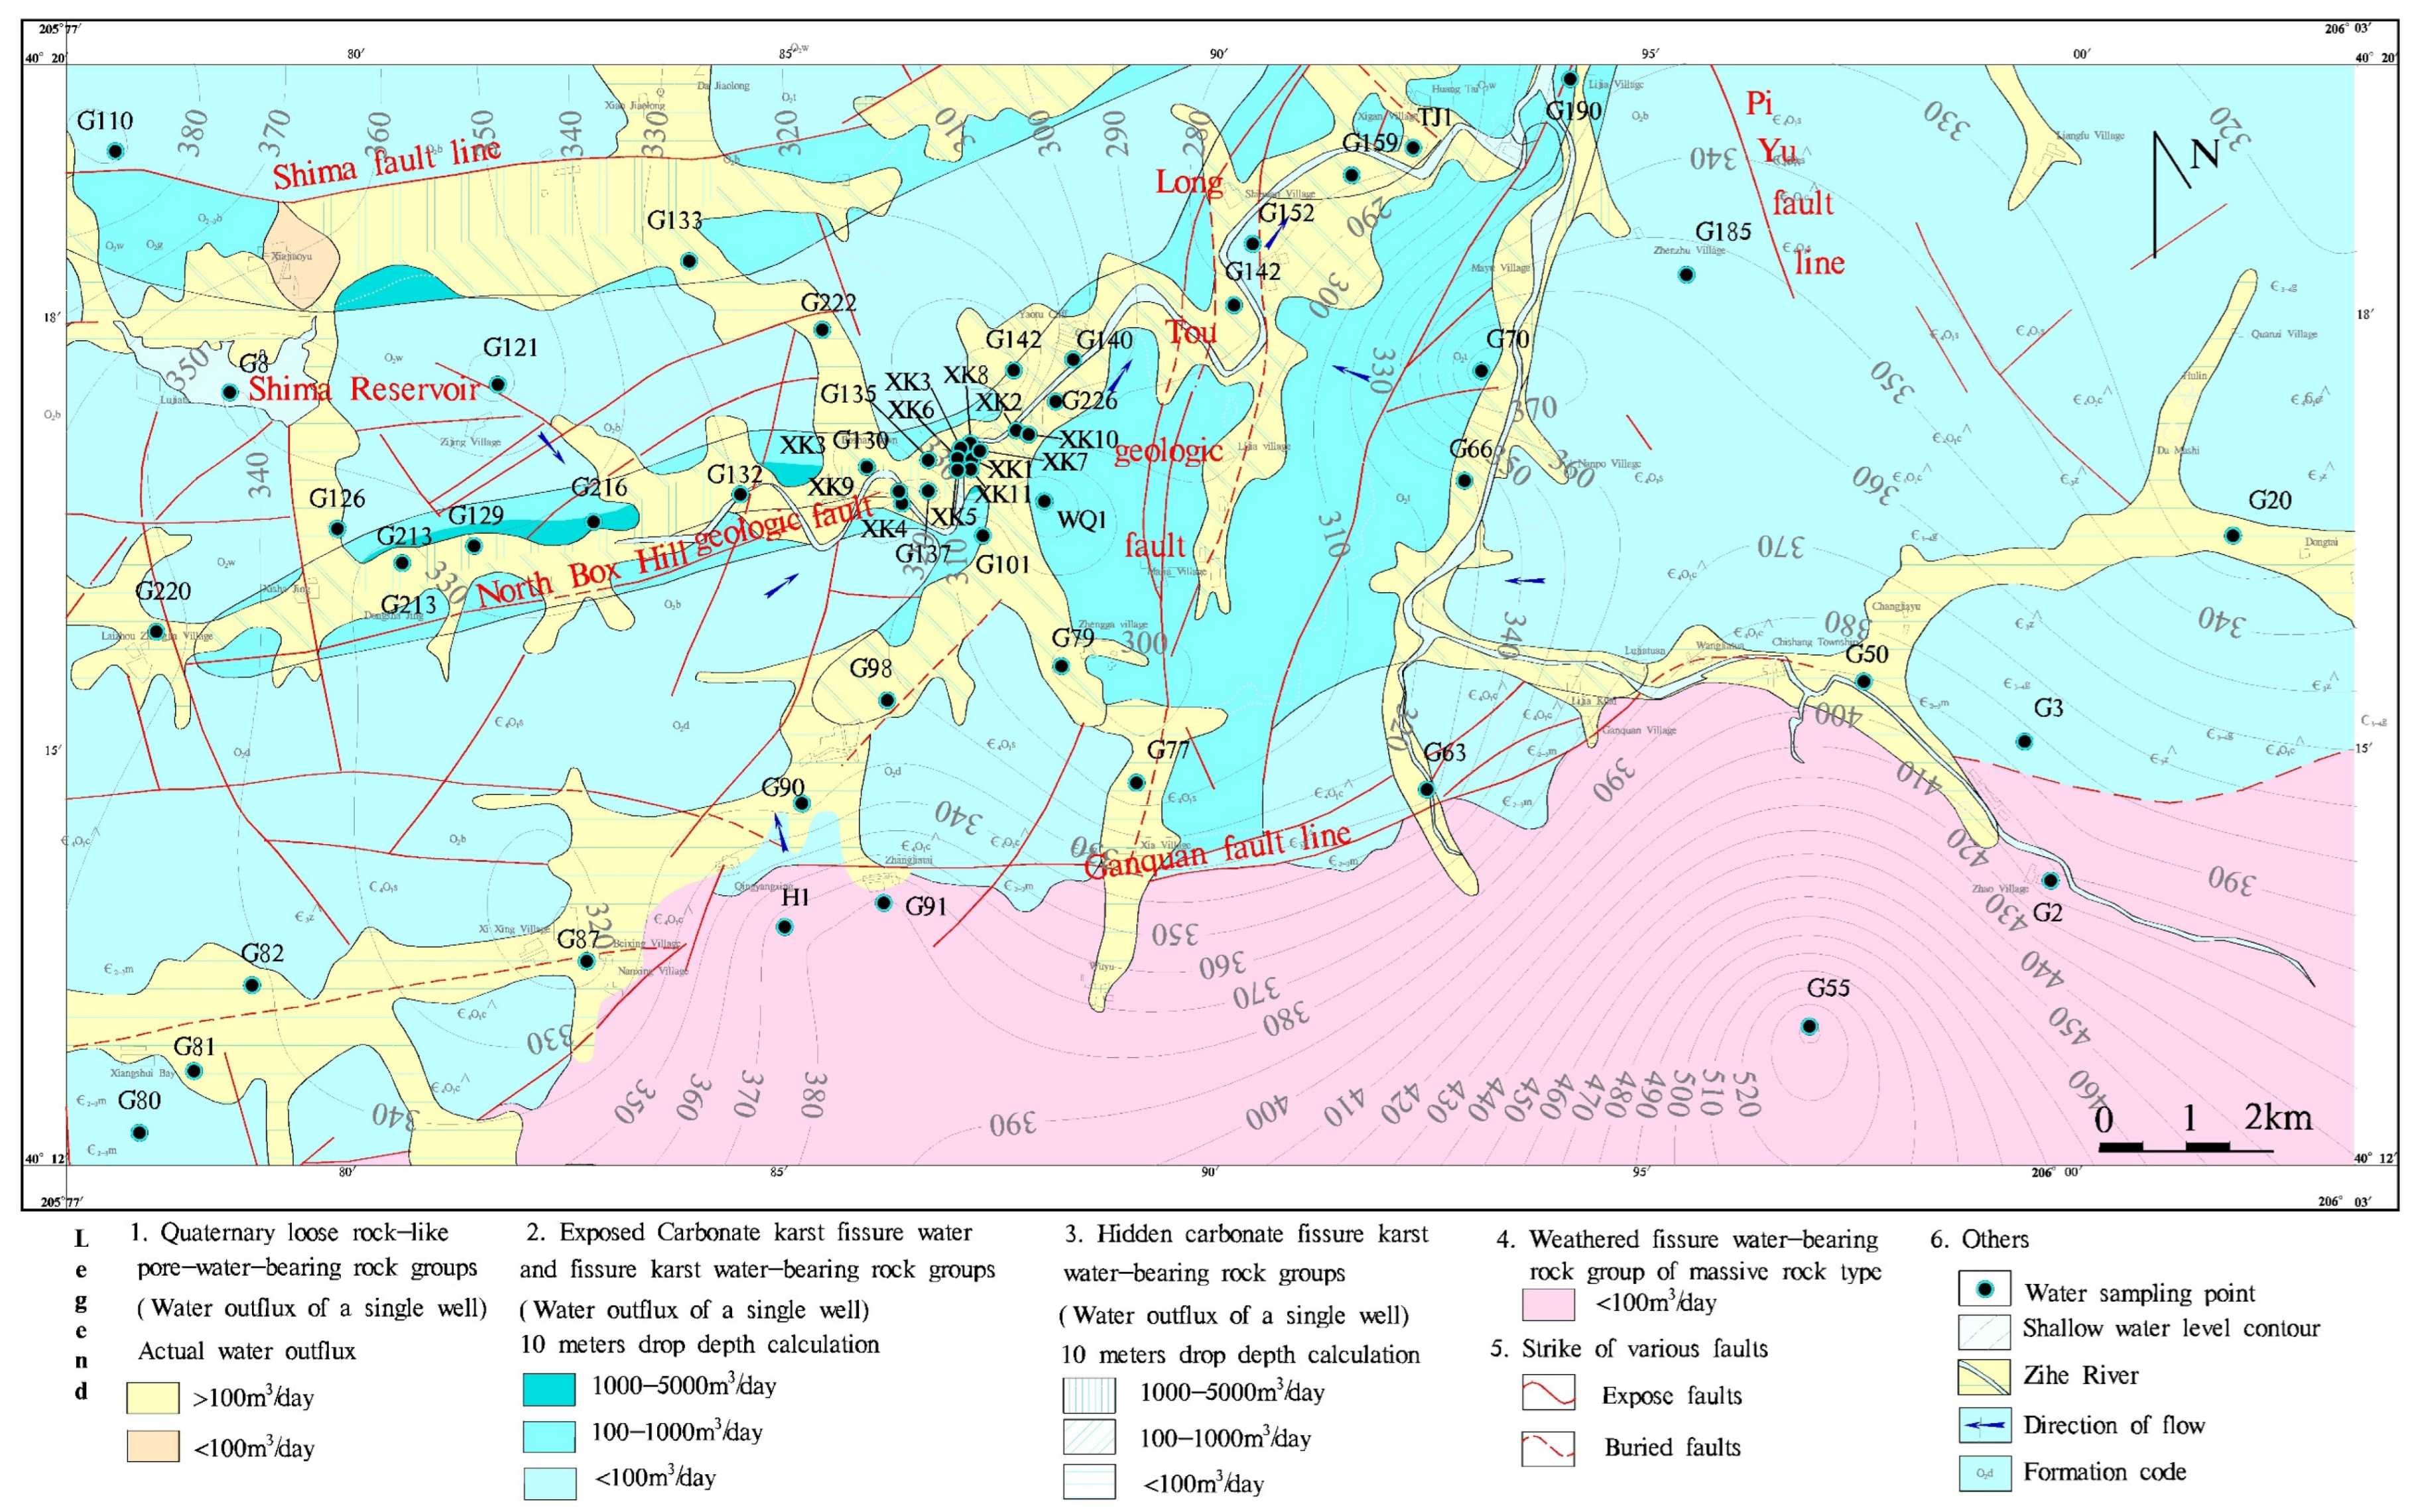
20], aligning with the fact that the Xiejiadian Water Source Protection Area is predominantly characterized by the wide distribution of carbonate rocks. Furthermore, it is inferred that gypsum, anhydrite, and other sulfate rocks and rock salt have a limited distribution, occurring only in localized regions where they are in contact with carbonate rock formations. Combining the hydrogeological and stratigraphic data from Section 2.3, it can be observed that blocky gypsum and anhydrite are only present in the aquifer lithological groups of the Sanshanzi Formation (∈4O1s), Chaomidian Formation (∈4O1 c ^ ), and Beianzhuang Formation (O2b). These gypsum occurrences are sporadically distributed in the central and low mountainous areas east of the Zihe River, in the western graben zone, and near the main river channel.
The carbonate and sulfate rock dissolution chemical reactions (Equations (1) and (2)) are as follows:
C a C O 3 + C a M g C O 3 2 + 3 C O 2 g + 3 H 2 O = 2 C a 2 + + M g 2 + + 6 H C O 3
C a S O 4 = C a 2 + + S O 4 2
According to Equations (1) and (2), it is understood that if the milliequivalent concentration ratio of γ C a 2 + + M g 2 + to γ H C O 3 + S O 4 2 is close to 1, then C a 2 + and M g 2 + should come from the dissolution of carbonate and sulfate minerals such as calcite, dolomite, and gypsum. If the ratio is greater than 1, it indicates the dissolution of silicate minerals, while a ratio less than 1 suggests that filtration processes are accompanied by ion exchange adsorption processes (Abdelilader R et al., 2012) [21]. As depicted in Figure 3b, the concentration ratio of the samples approximately follows a linear distribution, deviating from the 1:1 line. This implies some dissolution of silicate minerals, but the majority of the analysis results are concentrated on both sides of the 1:1 equilibrium line. This indicates that carbonate rocks and sulfate rocks are the primary reactants in groundwater. Furthermore, due to minimal sulfur dioxide in rainwater, the rainwater has little contribution to the S O 4 2 in groundwater. Hence, this study hypothesizes that the current composition of groundwater in the study area is related to atmospheric precipitation, but it is not a controlling factor. Various water–rock interactions occur during groundwater flow (Equations (1) and (2)), and our results indicate that these interactions are the controlling factors influencing the regional groundwater chemical composition.
To investigate the dissolution intensity of dolomite and calcite in the study area, an ion concentration ratio chart of γ C a 2 + S O 4 2 to γ H C O 3 (Figure 3c) was utilized. The 1:2 and 1:4 ratio lines represent the dissolution equilibria of calcite and dolomite, respectively. Most of the samples are distributed between the 1:4 and 1:2 equilibrium lines, with a tendency towards being in the vicinity of the 1:2 equilibrium line. This suggests that the C a 2 + and H C O 3 in karst water primarily originate from the co-dissolution of calcite and dolomite (Wang et al., 2006) [22].
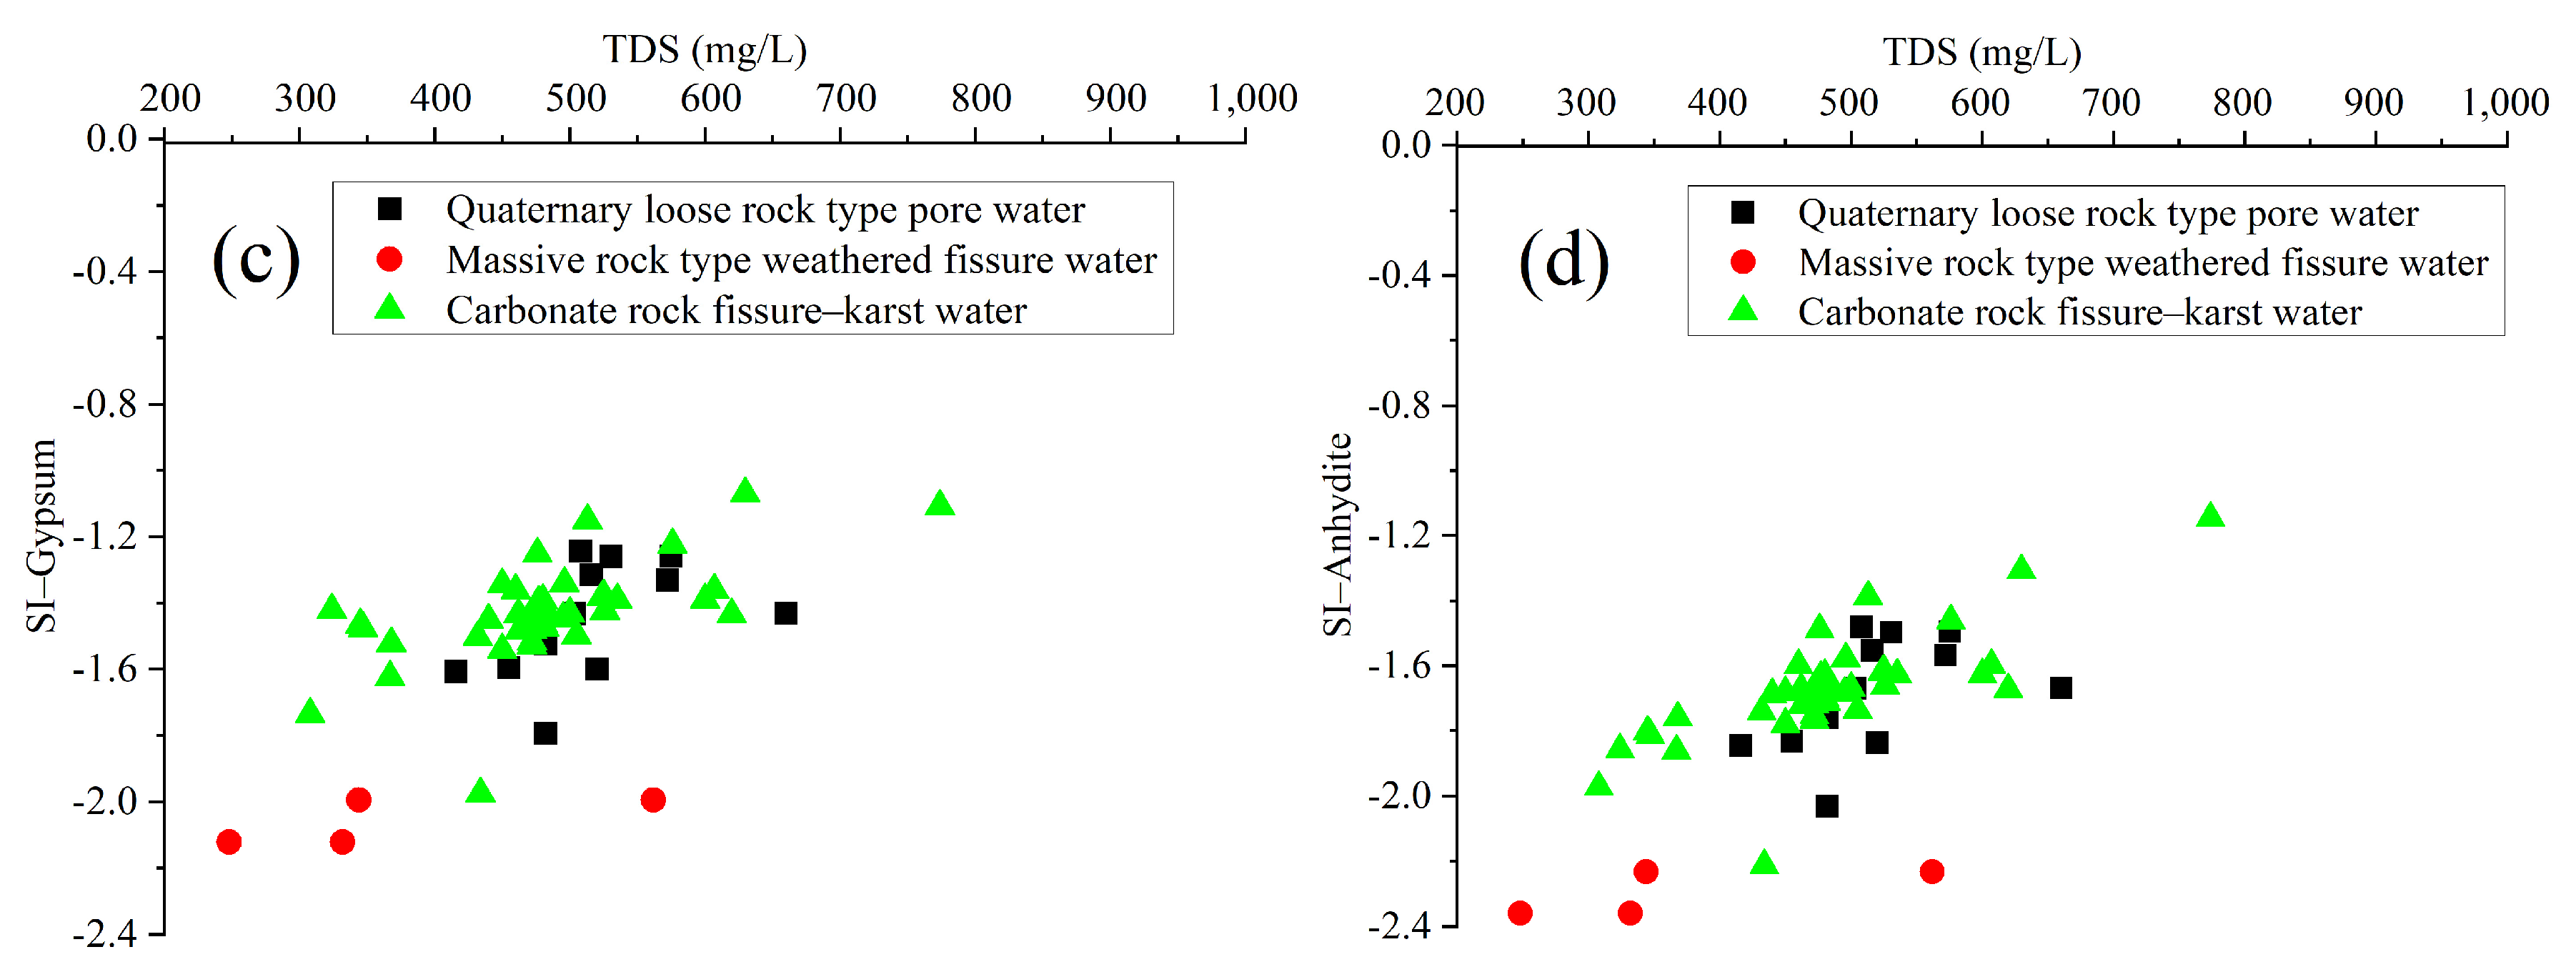
Ion concentration ratio charts of γ C a 2 + 0.33 H C O 3 to γ S O 4 2 are commonly used to identify the contribution of gypsum dissolution to the content of calcium ions ( C a 2 + ) in groundwater (Huang, et al., 2010) [23]. From Figure 3d, the coefficient of 0.33 was calculated based on the molar ratio of C a 2 + to H C O 3 using the reaction equation (Equation (1)). Moreover, C a 2 + 0.33 H C O 3 is defined as the C a 2 + content from non-carbonate rock sources. From Figure 3d, it can be observed that the collected water samples are mainly distributed above the 1:1 complete gypsum dissolution curve. Some water samples are close to the equilibrium dissolution curve, indicating that the dissolution of gypsum contributes to a certain amount of the C a 2 + content in the groundwater. However, besides the dissolution of gypsum, there are other calcium-containing substances that also contribute to the C a 2 + concentration in groundwater.
The cation exchange process Is a common chemical reaction in groundwater systems, which occurs through the electrostatic attraction between cations and the breaking and formation of other chemical bonds (Li, et al., 2019) [24]. In order to validate the hypothesis that cation exchange is one of the geochemical processes controlling the chemical properties of the groundwater, the relationship between N a + + K + and C l and between C a 2 + + M g 2 + and H C O 3 + S O 4 2 was examined. If cation exchange significantly influences the chemical composition of groundwater, the slope of the equation would be −1 (Fisher et al., 1997) [25]. Observing the ratio of γ N a + + K + C l   to   γ C a 2 + + M g 2 + H C O 3 + S O 4 2 milliequivalent concentrations in the study area (Figure 3f), a linear regression equation (Equation (3)) was fitted based on the distribution of all water samples in the figure; the slope of the equation is −1.518. This deviation from the theoretical value of −1 indicates that ion exchange processes are not pronounced within the study area, signifying that they are a weak controlling factor for the groundwater’s chemical characteristics.
The Schoeller Index proposed by Schoeller (Schoeller 1965) [26] offers a viable indicator of ion exchange reactions between groundwater and the surrounding environment (CAI–I and CAI–II). The calculation formulas for these indices are provided in Equations (4) and (5), with ion measurements expressed in meq/L. A negative CAI value signifies a cation exchange process (as per Equation (6) in the forward direction), characterized by Na+ desorption and the concurrent absorption of Ca2+ or Mg2+. Conversely, a positive CAI value indicates a reverse ion exchange process (as per Equation (6) in the reverse direction) (Wang et al., 2017) [27].
Figure 3e provides information on the ratio between CAI–I and CAI–II.
Evidently, the water samples from the various aquifers within the study area predominantly fall in the upper-right quadrant of the CAI-I and CAI-II distribution charts, with the majority exhibiting positive values. This indicates that ion exchange reactions in the study area are occurring in the reverse direction, as described by Equation (6), following the fundamental principles of chemical equilibria. According to these principles, a substantial concentration of N a + ions is required in the groundwater system of the study area to drive the reverse reaction described by Equation (6). Based on the regional groundwater chemical characteristics, the mean N a + concentration is 12.97 mg/L, while the average C a 2 + concentration is 117.85 mg/L. This does not meet the conditions for the equation evolution. Furthermore, considering the relative strength of the ion exchange capacity and geological conditions, it further confirms that the cation exchange process in the study area is relatively weak, and its impact on the chemical composition of groundwater is minor.
Y = 1.518 X + 0.248 R 2 = 0.394
CAI–I = C l N a + + K + C l
CAI–II = C l N a + + K +   H C O 3 + S O 3 2 + C O 3 2 + N O 3
N a 2 X + C a 2 + 2 N a + + C a X

4.2. Correlation Analysis

Groundwater from the same source and similar flow paths often exhibits similar chemical characteristics. Based on this, a correlation analysis of the chemical components of groundwater can be conducted to reveal the consistency and differences in the sources of major components. This study utilized SPSS 24 version software to calculate the Pearson correlation coefficients among the ten chemical indicators of groundwater in the study area. Two-tailed tests were performed at the 0.05 and 0.01 levels to assess the significance of the correlation coefficients. The resulting correlation matrix is presented in Table 3. Ions with correlation coefficients (R) greater than 0.7 exhibit a strong correlation, while ions with correlation coefficients between 0.4 and 0.7 show a moderate correlation between them.
From the ratio analysis in Section 4.1, it is evident that TDS values are primarily influenced by water–rock interactions. The TDS value exhibits strong correlations with C a 2 + (0.68), M g 2 + (0.50), S O 4 2 (0.58), and H C O 3 (0.48), indicating that the dissolution of these ions contributes to the increase in groundwater TDSs. Notably, there is a strong correlation between C a 2 + and M g 2 + with H C O 3 (both are 0.65), suggesting that calcium and magnesium ions mainly originate from the widespread dissolution of carbonate rocks (calcite ( C a C O 3 ), dolomite C a M g C O 3 2 ) in the study area. This further validates that HCO3 is derived from the common dissolution of calcite and dolomite, aligning with the ratio analysis results. However, the correlation coefficient between Ca2+ and Mg2+ is 0.23, indicating some differences in their sources.
There is a significant correlation between C a 2 +   and   S O 4 2 (0.68), suggesting that the S O 4 2 ion content is closely associated with the dissolution of gypsum ( C a S O 4 ). Besides the strong correlations between C a 2 + and H C O 3 (0.65) and S O 4 2 (0.68), there is also some correlation between C a 2 + and C l (0.67) and N O 3 (0.67), indicating that, apart from water–rock interactions, some of the C a 2 + might be related to the infiltration and C a 2 + dissolution of contaminants containing C l and N O 3 (Zhang et al., 2014) [28]. This aligns with the conclusion drawn in Section 4.1 for the ICR analysis that “besides the dissolution of gypsum, other calcium-containing substances also contribute to the Ca2+ concentration in groundwater”. M g 2 + , in addition to its strong correlation with H C O 3 (0.65), also has weak correlations with other conventional ions, indicating that its primary source is solely related to the dissolution of dolomite. COD (Chemical Oxygen Demand) is an indicator of organic pollutant levels in water, with the main sources of organic pollution in groundwater being industrial and agricultural pollution, as well as domestic pollution. The correlations between COD and K + (0.34), N a + (0.14), C l (0.15), and S O 4 2 (0.10) are not high, suggesting that the sources of these three ions have little relationship with the use of pesticides and fertilizers, domestic and industrial wastewater discharge, and solid waste and industrial waste.

5. Evolution of the Geochemical Components of Groundwater

Next, a hydrogeochemical simulation analysis was conducted using PHREEQC software to calculate the mass transfer of dissolved or precipitated minerals and gases at the starting and ending points along the groundwater flow path (Parkhurst and Appelo, 2004) [29]. Based on the principles of mass balance and chemical reactions occurring along the flow path, the changes in chemical properties of two water samples, representing the initial water and final water, were calculated with respect to the molar quantities of mineral and gas transfer (Li et al., 2010) [30]. Additionally, the saturation indices for each potential mineral phase can be used to constrain the dissolution and precipitation modes of minerals. To ensure the reliability of the geochemical simulations, a comprehensive understanding of geochemical processes is essential prior to conducting geochemical simulations (Güler and Thyne, 2004) [31].

5.1. Study of Evolution Control Factors

Prior to conducting geochemical modeling of the study area, it is essential to first elucidate the primary mechanisms controlling the groundwater chemistry within the study area, including rock weathering processes, atmospheric precipitation, and evaporation–crystallization effects. A comparative analysis of these various dominant mechanisms in natural settings can be accomplished using Gibbs diagrams (Gibbs, 1970) [32].
According to the statistical data, the TDSs (total dissolved solids) in the study area ranges from 248 to 774 mg/L, with an average value of 482.87 mg/L. The concentration ratio of Na+ in N a + + C a 2 + varies from 0.02 to 0.35, with an average value of 0.11, while the concentration ratio of C l in C l + H C O 3 ranges from 0.04 to 0.21, with an average value of 0.08. Plotting these data on a Gibbs diagram (Figure 4), it becomes evident that all groundwater samples fall within the region controlled by rock weathering, indicating that rock weathering dominates the regional hydrochemical evolution process, and this process is minimally influenced by evaporation–crystallization and atmospheric precipitation.
Possible reasons for this phenomenon are as follows: Firstly, the study area is located in the eastern part of the southern end of the Zibo syncline basin. The area features steep mountain peaks, deep valleys, and a wide distribution. The valleys developed along fault zones, with a relative elevation difference of 150 to 468 m. The region has a strong surface runoff capacity, with numerous waterfalls and tributaries that reduce the evaporative effects of water. Additionally, the study area’s bedrock is exposed, with a small coverage of vegetation and crops. The limited surface water storage capacity and the enhanced ability of groundwater to receive surface recharge contribute to the weakening of the evaporation–crystallization effect.
Secondly, the surface layer in the study area consists mainly of carbonate rocks, such as Cambrian and Ordovician limestone and dolomite. The distribution area of the quaternary soil layer is small, and the layer is thin. The exposed rock directly contacts the atmosphere, which is dominated by south and southwest winds, with a monthly average wind speed of 3.3 m/s and a monthly average maximum wind speed of 4 m/s. This results in severe physical weathering, increasing the contact area between the surface rock and water, and promoting chemical weathering reactions due to the moisture in the air and rainfall. This leads to the entry of water with high concentrations of calcium and bicarbonate ions into the groundwater system, significantly altering the chemical composition of the groundwater derived from rainwater and recharge water. Hence, climate factors are the dominant controlling factors in this hydrochemical evolution process.

5.2. Hydrogeochemical Modeling Analysis

Chemical reactions in groundwater are highly diverse and complex, even within a single aquifer. In order to enhance the model’s accuracy and achieve the desired objectives, each reaction path selected traverses only one aquifer. The upstream location serves as the initial solution, while the downstream serves as the terminal solution. The total dissolved solid (TDS) concentration is used as a benchmark to distinguish between upstream and downstream along the path, and the straight-line distance of the path does not exceed 10 km. The final selected simulation paths are shown in Table 4.
Subsequently, to further explore the mineral dissolution and precipitation patterns, the saturation indices (SI) of calcite, dolomite, gypsum, and anhydrite were computed using the geochemical software PHREEQC and compared with the TDS values of all collected water samples. The scatterplots of SI versus TDS for the three sample groups are presented in Figure 5.
The dissolution reaction equations for calcite, dolomite, gypsum, and stibnite as groundwater flows through carbonate formations are as follows:
Calcite:
C a C O 3 + H 2 O + C O 2 = 2 H C O 3 + C a 2 +
Dolomite:
C a M g C O 3 2 + 2 H 2 O + 2 C O 2 = C a 2 + + M g 2 + + 4 H C O 3
Gypsum:
C a S O 4 2 H 2 O = C a 2 + + S O 4 2 + 2 H 2 O
Anhydrite:
C a S O 4 = C a 2 + + S O 4 2
From Figure 5a,b, it can be observed that the SI values for carbonate minerals (calcite and dolomite) in all water samples are consistently greater than 0. This indicates that carbonate minerals in the groundwater are in a state of oversaturation and tend to precipitate. In contrast, the SI values for carbonate minerals in the weathered fracture-porous aquifer fall within the range of 0 to 0.5, indicating a state close to equilibrium.
Furthermore, because the SI values for carbonate rock dissolution also reflect the rate of groundwater circulation, a higher SI value suggests a slower groundwater circulation rate. This suggests that the quaternary aquifer and the karst fracture-porous aquifer in the study area have a slower groundwater circulation, while the weathered fracture-porous aquifer exhibits better water circulation and a faster flow rate. Based on the saturation state, it can be inferred that all three aquifers have a rich content of carbonate rocks in their surrounding formations.
Furthermore, from Figure 5c,d, it can be observed that the SI values for gypsum and anhydrite in all three types of groundwater are consistently less than 0. These values show a positive correlation with the TDSs, indicating that the increase in TDSs is primarily attributed to the dissolution of gypsum and anhydrite. Notably, the gypsum and anhydrite SI values are lowest in the blocky rock weathered fracture-porous aquifer, and in the other two aquifers receiving recharge, the SI values for gypsum have increased. This is due to groundwater typically having a residence time exceeding two years, even decades, in aquifers. Gypsum is an easily soluble mineral, and under normal conditions, such a reactive mineral is unlikely to remain undersaturated in groundwater (Zhang et al., 2018) [33]. It can be inferred that gypsum-type minerals in the aquifer gradually dissolve and have lower concentrations along the groundwater flow direction (Liu et al., 2015) [34].
Subsequently, the chemical composition data for the starting and ending points of each simulated pathway were extracted from all water samples, as presented in Table 5. The saturation indices for the potential mineral phases were calculated, as shown in Table 6.
From Table 5 and Table 6, it is evident that the three minerals—anhydrite, gypsum, and rock salt—in the study area are all in a state of undersaturation, indicating a tendency for further dissolution. The SI values for gypsum and anhydrite suggest that the regional groundwater has the capacity to accommodate S O 4 2 .
The SI values for calcite and dolomite indicate that both carbonate minerals are in a state of saturation. However, in the groundwater aquifers, the precipitation of carbonate minerals is not guaranteed, as the precipitation and dissolution of carbonate minerals are also influenced by the partial pressure of C O 2 . Research has shown that when carbonate minerals are in a state of saturation in groundwater, there is no observed precipitation of carbonate minerals, which can ultimately be attributed to the partial pressure of C O 2 (Abril G et al., 2003) [35]. Nevertheless, it is certain that minerals with SI values greater than 0 are more likely to precipitate.
From the table, it can be concluded that the SI values for C O 2 in all solutions are less than 0, indicating a relatively low C O 2 content, but there is still a tendency for carbonate rock precipitation.

5.3. Quantitative Assessment of Geochemical Processes along Flow Paths

Based on the preparatory work conducted earlier, PHREEQC software was used to perform mass balance simulations for the six selected reaction pathways, utilizing the chemical data presented in Table 6. Within the defined allowable deviation range, specific mineral mole transfer quantities and ion molar exchange values along the reaction pathways were calculated. This analysis aimed to explore the shallow groundwater flow field in the study area and the factors controlling the groundwater chemical evolution process. Due to the trace element analysis of water samples, a minute quantity of strontium (Sr) was detected in all samples. The two primary strontium-bearing minerals are celestite ( S r S O 4 ) and strontianite ( S r C O 3 ). As strontianite is relatively uncommon within the geological formations in China, it was inferred that all three aquifers in the study area likely contain a certain amount of celestite.
Based on the results of the ion concentration ratio analysis and saturation index analysis, the potential mineral phases in the simulation path were set as shown in Table 7.
Water–rock interactions are diverse and encompass various processes, including dissolution–filtration, cation exchange adsorption, decarbonation, desulfation, and more. To balance the uncertainty in the water samples, a range of uncertainties from 0.07 to 0.12 was set for each simulated pathway. Through PHREEQC simulations, between 4 and 12 possible models were generated, taking into account factors such as the cation exchange capacity, saturation indices, hydrochemical types, and hydrogeological conditions. By considering these factors and eliminating unreasonable models, the optimal model was selected. The results of the mass balance simulations are presented in Table 8.
Combining the results of the mass balance simulations in Table 8 with the plots of changes in major ion concentrations for each water-bearing rock group (Figure 6), the following conclusions can be drawn:
① In route 1, none of the three cations participated in the reaction. In route 2, only a minimal N a - C a ion exchange occurred (0.08 mmol/L of N a + dissolved and 0.06 mmol/L of C a 2 + adsorbed). This suggests that the intensity of cation exchange is relatively low in the quaternary unconsolidated porous aquifer. In routes 1 and 2, 0.62 and 1.51 mmol/L of calcite were dissolved, respectively, and 0.38 and 1.07 mmol/L of dolomite were precipitated, indicating a significant decalcification process (Equation (11)) in this aquifer. Additionally, gypsum ( C a S O 4 ) dissolved at a rate of 1.35 mmol/L, primarily contributing to the elevated concentrations of C a 2 + and S O 4 2 in the solution. This aligns with the saturation index analysis. Importantly, the dissolution of gypsum leading to the decarbonation process significantly increased the H C O 3 concentration in route 2 (from 223.56 to 327.89 mg/L). Overall, the hydrogeochemical processes in both routes are similar, but route 2 exhibits more intensive hydrogeochemical interactions compared to route 1. The decalcification process is more prominent than the ion exchange process. The ion concentrations in the groundwater from both routes meet the standards for Class III water in the “Groundwater Quality Standards” (GB/T 14848-2017) [18]. The concentrations of total dissolved solids are all less than 1000 mg/L, and the aquifer along these routes is minimally affected by human activities.
C a M g C O 3 2 + C a 2 + = M g 2 + + 2 C a C O 3
The ion exchange occurring in the weathered fissure water-bearing rock group is strong. In routes 3 and 4, there is a net efflux of N a + with C a 2 + and M g 2 + entering the solution. However, it is unreasonable to judge this based on the strength of cation exchange. Since in this study area the primary source of N a + in groundwater is the dissolution of rock salt (NaCl), from the dissolution of rock salt in routes 3 and 4, it was found that N a + does not participate in the reaction in route 3, and only 0.04 mmol/L of N a + dissolves in route 4. Based on the spatial variation in the major chemical components, it can be inferred that the regional groundwater aquifer contains a low concentration of rock salt. Additionally, external water sources along the route contribute to the decreasing trend in N a + concentration along the flow direction. This aquifer exhibits strong water–rock interactions and is the primary recharge area for the study region. Due to its higher elevation and significant hydraulic gradient, it offers favorable groundwater circulation conditions, increasing the contact area between groundwater and air. Recharge water carries more C O 2 , resulting in a lower pH of the solution, which enhances the groundwater’s corrosive capability.
There was 1.34 mmol/L and 0.70 mmol/L dissolved calcite in routes 3 and 4, respectively, leaving the dolomite undissolved or in equilibrium due to the presence of unequal dissolution.
Observing the changes in major ion concentrations in the simulated pathways of the fractured aquifer in Figure 6b, at the endpoint G91 of route 4, there is a significant increase in the concentration of various ions compared to the starting point H1. The C a 2 + , C l , S O 4 2 , and H C O 3 concentrations show a noticeable rise, with the N O 3 content reaching 106 mg/L. Based on on-site surveys and previous data, it is suspected that this increase may be due to anthropogenic factors such as domestic sewage and agricultural fertilizers. These contaminants may percolate into the aquifer through rivers or surface infiltration, causing a rapid rise in the ion composition of the groundwater in some areas of the study region. Therefore, the simulation results for this route lack reliability. In route 3, calcite dissolution and cation exchange processes dominate.
At greater burial depths, typically ranging from −245 m to 355 m, the carbonate and evaporite fracture-porous rock formations are found. The primary aquifer in this region is the Ordovician Majiagou Formation limestone, which serves as the main prolific water-bearing zone, with individual well yields exceeding 1000 m3/d. Upon observing the major ion concentration changes along the simulated pathway in Figure 6c, it is evident that four locations exhibit similar major ion concentrations. The hydrochemical type is characterized by HCO3·SO4-Ca·Mg, and the ion concentrations comply with the standards for Class III water as defined in the “Groundwater Quality Standards” (GB/T 14848-2017) [18]. This suggests that the groundwater is minimally impacted by human activities. Examining pathways 5 and 6 presented in Table 7, it is apparent that, in these routes, the water–rock interactions are weak, with a limited dissolution and precipitation of minerals. Cation exchange and adsorption processes are more active, indicating an overall state of water–rock equilibrium. This observation aligns with the hydrogeochemical characteristics of the discharge area, where the hydrochemical type is uniform, the chemical characteristics remain stable, and water is abundantly available.

6. Results

(1)
In the groundwater in the three major aquifers in the Zihe River source region, the cations mainly consist of C a 2 +   and   M g 2 + , while the anions are mainly H C O 3   and   S O 4 2 . All water quality parameters comply with Class III water standards. The concentrations of C a 2 + , M g 2 + ,   and   H C O 3 remain relatively stable within the aquifers. However, within the study area, there is greater variability in the concentrations of N a + , K + , N O 3 , and C l , indicating a more pronounced influence of environmental factors. Groundwater in the quaternary loose rock pore water is primarily characterized by a hydrochemical type of HCO3·SO4-Ca·Mg. Groundwater in fractured weathered rock formations is predominantly of the HCO3·SO4-Ca type, while karst groundwater in carbonate rock formations exhibits a dominant HCO3·SO4-Ca·Mg hydrochemical type.
(2)
In the Zihe River source region, C a 2 + in shallow groundwater primarily originates from the dissolution of gypsum-bearing sediments, calcite, dolomite, and other minor calcium-containing contaminants. M g 2 + is primarily sourced from the dissolution of magnesium-containing carbonate rocks, such as calcite and mudstone. The source of S O 4 2 in shallow groundwater within a region is influenced by various factors. The southwest part of the region features the dissolution of sulfate minerals, such as gypsum and mirabilite, within Cambrian limestone sedimentary rocks. Additionally, H C O 3 primarily originates from the common dissolution of calcite and dolomite, with additional influence from atmospheric precipitation.
(3)
By establishing a retrograde geochemical model for the Zihe River source area, it was revealed that intense rock weathering and water–rock interactions are the primary controlling factors for the groundwater flow field and groundwater chemical evolution in the Zibo River source area. The geological and hydrogeological conditions govern the groundwater flow field, subsequently influencing the scale of water–rock interactions.
(4)
The groundwater quality and low total dissolved solid (TDS) values in the study area indicate strong groundwater filtration processes, with the quality of shallow groundwater primarily influenced by groundwater flow conditions and the presence of exposed or shallowly buried carbonate rocks. The regional groundwater quality is good, especially the deeply buried carbonate salt karst fissure water-bearing rock groups, and the source area demonstrates effective ecological preservation, meeting the essential water quality criteria for emergency water supply site development.

7. Conclusions and Discussion

In this study, a combination of various traditional geochemical methods and geochemical modeling was applied to investigate the geochemical characteristics and controlling factors of shallow groundwater in the Zihe River source area in China. Through the statistical analysis of the ion concentrations in three aquifers, an evaluation of three types of groundwater quality was completed, identifying C a 2 + and M g 2 + as the main cations and H C O 3 and S O 4 2 as the main anions. Based on the TDS variance coefficient, it was inferred that the regional groundwater is less influenced by external factors. Supported by Gibbs diagrams and geochemical models, it was determined that internal rock weathering and water–rock interactions are the primary controlling factors for the chemical characteristics of the groundwater.
The classification of three groundwater chemical types was successfully determined using Piper trilinear diagrams. Through an ICR analysis and with the use of geochemical models, the geochemical processes in the aquifers, including the dissolution and precipitation of calcite, dolomite, gypsum, anhydrite, and mirabilite, were demonstrated. The sources of the major ions were identified, and cation exchange was found to not be significant. By analyzing the regional hydrochemical evolution process on a spatial scale, the study also briefly evaluated the influence of rainwater recharge on the groundwater composition.
In a broad sense, this work not only demonstrates the effectiveness of traditional geochemical methods and hydrogeochemical modeling in studying the characteristics, evolution, and controlling factors of groundwater in carbonate karst regions but also provides a scientific basis for delineating the karst groundwater protection zone in the Zihe River source area, as well as for formulating strategies for the development, utilization, and protection of karst groundwater resources.
In the future, exploration in the northeast and southeast areas of the study area should be strengthened to fill in the data gaps and improve the original geological data. On the other hand, further research work can also be carried out through a regional isotope analysis (2H, 18O, 15N, etc.), geophysical techniques (resistivity tomography, hydraulic tomography), and numerical simulations to gain a more in-depth understanding of the sources of nitrogen and chlorine, water resource circulation methods, and groundwater resource reserves in the study area.
It is necessary to increase research on the evolution of groundwater chemical characteristics in the study area over a larger time scale and evaluate changes in groundwater characteristics in the study area in a single hydrological year. Raw data can be searched in Supplementary Materials.

Supplementary Materials

The following supporting information can be downloaded at: https://www.mdpi.com/article/10.3390/w16020298/s1.

Author Contributions

J.Y.: Data curation, Formal analysis, Writing—original draft, Writing—review and editing. Y.Q.: Investigation, Resources, Writing—review and editing. G.S.: Methodology, Project administration, Writing—original draft, Supervision. C.M.: Investigation, Writing—review and editing. All authors have read and agreed to the published version of the manuscript.

Funding

This research was funded by National Natural Science Foundation of China grant number 41741020, and Jiangsu University Advantageous Discipline Construction Project Funding Program. And The APC was funded by Zijin Mining Group Company Limited.

Data Availability Statement

The data that support the findings of this study are available from the corresponding author upon reasonable request or click the link below to obtain the original water sample test data https://pan.baidu.com/s/1DttSdu84MnaidJFSqgX6XQ?pwd=hdnn.

Acknowledgments

The authors are grateful to our colleagues for their assistance in the data collection and field investigation. Special thanks go to the editor and the reviewers for their constructive comments.

Conflicts of Interest

Author Jing You was employed by the company Zijin Mining Group Company Limited. The remaining authors declare that the research was conducted in the absence of any commercial or financial relationships that could be construed as a potential conflict of interest.

References

  1. Pu, Y. Characterization of groundwater chemistry in the Pearl River Delta Economic Zone. Groundwater 2013, 35, 43. [Google Scholar]
  2. Lei, Z.; Lili, Z. Comprehensive remediation countermeasures and suggestions on the tributaries of Zihe river Chishang. Shandong Water Resour. 2021, 12, 52–54. [Google Scholar] [CrossRef]
  3. Yanli, Z.; Changlock, L. Analysis of chemical pollution sources of groundwater in Zihe river Basin of Shandong Province. People’s Yangtze River 2022, 53, 37–43+49. [Google Scholar] [CrossRef]
  4. Yue, T.; Wenqiang, Z.; Jinxiao, W. Characterization of karst groundwater chemistry and controlling factors in Zihe River Basin. Environ. Chem. 2023, 42, 1945–1956. [Google Scholar]
  5. Chao, M.A.; Turnip-Bin, S.U.; Guangyu, S.H.O.; Qi, Y. Research on the characteristics of aquifer medium and water enrichment law in Zihe source area. Arid. Zone Resour. Environ. 2020, 34, 173–180. [Google Scholar] [CrossRef]
  6. Dapeng, G.U.; Fengxin, K.G.; Huanliang, C.H.; Jianmei, C.H.; Wei, L.U. Karst water system simulation and water source optimization mining prediction in Zibo Fengshui Spring domain, Shandong. China Karst 2017, 36, 327–338. [Google Scholar]
  7. Yueming, Q.I.; Dongmei, Y.A.; Chao, M.A.; Guangyu, S.A.; Jing, Y.U.; Yaqi, Y.A. Evaluation of extractable resources of karst groundwater in Zihe source area. J. Southwest Norm. Univ. (Nat. Sci. Ed.) 2019, 44, 65–72. [Google Scholar] [CrossRef]
  8. Dongmei, Y.A.; Yueming, Q.I.; Junping, W.A.G.; Yuxi, M.A. Calculation of extractable resources in karst underground water source—Taking the example of Xiejiadian water source in Zibo City. Sci. Technol. Eng. 2020, 20, 7589–7595. [Google Scholar]
  9. Appelo, C.A.J.; Postma, D. Geochemistry, Groundwater and Pollution; AA Balkema: Rotterdam, The Netherlands, 2005. [Google Scholar]
  10. Devic, G.; Djordjevic, D.; Sakan, S. Natural and anthropogenic factors affecting the groundwater quality in Serbia. Sci. Total Environ. 2014, 468–469, 933–942. [Google Scholar] [CrossRef]
  11. Hamed, Y.; Dhahri, F. Hydro-geochemical and isotopic composition of groundwater, with emphasis on sources of salinity, in the aquifer system in Northwestern Tunisia. J. Afr. Earth Sci. 2013, 83, 10–24. [Google Scholar] [CrossRef]
  12. Han, D.M.; Song, X.F.; Currell, M.J.; Yang, J.L.; Xiao, G.Q. Chemical and isotopic constraints on evolution of groundwater salinization in the coastal plain aquifer of Laizhou Bay, China. J. Hydrol. 2014, 508, 12–27. [Google Scholar] [CrossRef]
  13. Karroum, M.; Elgettafi, M.; Elmandour, A.; Wilske, C.; Himi, M.; Casas, A. Geochemical processes controlling groundwater quality under semi arid environment: A case study in central Morocco. Sci. Total Environ. 2017, 609, 1140–1151. [Google Scholar] [CrossRef] [PubMed]
  14. Singh, C.K.; Kumar, A.; Shashtri, S.; Kumar, A.; Kumar, P.; Mallick, J. Multivariate statistical analysis and geochemical modeling for geochemical assessment of groundwater of Delhi, India. J. Geochem. Explor. 2017, 175, 59–71. [Google Scholar] [CrossRef]
  15. Li, W.A.G.; Jinsheng, W.A.G.; Lin, X. Progress of hydrogeochemical modeling. Hydrogeol. Eng. Geol. 2003, 06, 105–109. [Google Scholar]
  16. Acero, P.; Auqué, L.; Galve, J.; Gutiérrez, F.; Carbonel, D.; Gimeno, M.; Yechieli, Y.; Asta, M.; Gómez, J. Evaluation of geochemical and hydrogeological processes by geochemical modeling in an area affected by evaporite karstification. J. Hydrol. 2015, 529, 1874–1889. [Google Scholar] [CrossRef]
  17. Liu, F.; Wang, S.; Yeh, T.J.; Zhen, P.; Wang, L.; Shi, L. Using multivariate statistical techniques and geochemical modelling to identify factors controlling the evolution of groundwater chemistry in a typical transitional area between Taihang Mountains and North China Plain. Hydrol. Process. 2020, 34, 1888–1905. [Google Scholar] [CrossRef]
  18. GB/T 14848-2017; Works Cited Section: National Standardization Management Committee. Groundwater Quality Standard. China Standards Press: Beijing, China, 2017.
  19. GB 5749-2006; Ministry of Health of China, Standardization Administration of China. Standards for Drinking Water Quality. China Standards Press: Beijing, China, 2006.
  20. Tao, H.O.G.; Yunqiu, X.E.; Qiwen, Y.U.; Yi, Z.A.; Guangshuai, Z.A.; Lichao, Y.A.G. Characterization of groundwater hydrochemistry and analysis of causes in key areas of Wumeng Mountain. Earth Environ. 2016, 44, 11–18. [Google Scholar]
  21. Abdelilader, R.; Larbi, D.; Rihab, H.; Fethi, B.; Chemseddine, F.; Azzedine, H. Geochemical characterization of groundwater from shallow aquifer surrounding Fetzara Lake N. EAlgeria. Algeria. Arab. J. Geosci. 2012, 5, 1–13. [Google Scholar] [CrossRef]
  22. Wang, Y.; Guo, Q.; Su, C.; Ma, T. Strontium isotope characterization and major ion geochemistry of Karst water flow, Shentou, northern China. J. Hydrol. 2006, 328, 592–603. [Google Scholar] [CrossRef]
  23. Pinghua, H.U.A.; Jiansheng, C.E.; Chao, N.I.G.; Sumin, H.A. Hydrochemical characteristics of groundwater and its geochemical simulation in Jiaozuo mining area. Mod. Geol. 2010, 24, 369–376. [Google Scholar]
  24. Longfei, L.; Xing, L.; Li, Y. Optimization and improvement of soil cation exchange determination methods[J/OL]. Anhui Agric. Sci. 2019, 6, 1–2. [Google Scholar]
  25. Fisher, R.S.; Mullican, W.F., III. Hydrochemical evolution of sodium-sulfate and sodium-chloride groundwater beneath the northern Chihuahuan desert, Trans-Pecos, Texas, USA. Hydrogeol. J. 1997, 5, 4–16. [Google Scholar] [CrossRef]
  26. Schoeller, H. Qualitative Evaluation of Groundwater Resources; UNESCO: Paris, France, 1965. [Google Scholar]
  27. Wang, L.; Dong, Y.; Xu, Z. Hydrochemical and isotopic characteristics of groundwater in the northeastern Tennger Desert, northern China. Hydrogeol. J. 2017, 25, 2363–2375. [Google Scholar] [CrossRef]
  28. Zhang, X.; Qian, H.; Chen, J.; Qiao, L. Assessment of groundwater chemistry and status in a heavily used semi-arid region with multivariate statistical analysis. Water 2014, 6, 2212–2232. [Google Scholar] [CrossRef]
  29. Parkhurst, D.L.; Appelo, C.A.J. Description of Input and Examples for PHREEQC Version 3—A Computer Program for Speciation, Batch-Reaction, One-Dimensional Transport, and Inverse Geochemical Calculations; U.S. Geological Survey: Reston, VA, USA, 2013; Techniques and Methods, book 6, chapter A43; 497p. [CrossRef]
  30. Li, P.-Y.; Qian, H.; Wu, J.-H.; Ding, J. Geochemical modeling of groundwater in southern plain area of Pengyang County, Ningxia, China. Water Sci. Eng. 2010, 3, 282–291. [Google Scholar]
  31. Güler, C.; Thyne, G.D. Hydrologic and geologic factors controlling surface and groundwater chemistry in Indian Wells-Owens Valley area, southeastern California, USA. J. Hydrol. 2004, 285, 177–198. [Google Scholar] [CrossRef]
  32. Gibbs, R.J. Mechanisms controlling world water chemistry. Science 1970, 170, 1088–1090. [Google Scholar] [CrossRef]
  33. Kezheng, Z.A.G.; Zhou, C.E.; Changsheng, C.E.; Guiqing, Z.A. Numerical simulation of groundwater seepage and pollutant transport in a phosphogypsum dump in karst area. China Coal Geol. 2018, 30, 46–52. [Google Scholar]
  34. Shaohua, L.I.; Fang, G.U.; Guanghui, J.I.N.; Qingjia, T.A.G.; Xiaojiao, G.U.; Siyu, H.A.G. Characterization of karst hydrogeochemistry in the Fenglin Plain area of Guilin City. Earth Environ. 2015, 43, 55–65. [Google Scholar]
  35. Abril, G.; Etcheber, H.; Delille, B.; Frankignoulle, M.; Borges, A. Carbonate dissolution in the turbid and eutrophic Loire estuary. Mar. Ecol. Prog. Ser. 2003, 259, 129–138. [Google Scholar] [CrossRef]
Figure 1. Hydrogeology and water sample collection points in Zihe River source area.
Water 16 00298 g001
Figure 2. Piper diagram showing the chemical facies of groundwater classification.
Water 16 00298 g002
Figure 3. Scatter plots of some pairs of ions and Schoeller indices for each group. (a) The ratio chart of milliequivalent concentrations of γ H C O 3 to γ S O 4 2 + C l ; (b) The ratio chart of milliequivalent concentrations of γ C a 2 + + M g 2 + to γ H C O 3 + S O 4 2 ; (c) The ratio chart of ion concentration of γ C a 2 + S O 4 2 to γ H C O 3 ; (d) The ratio chart of ion concentration of γ C a 2 + 0.33 H C O 3 to γ S O 4 2 ; (e) The ratio chart between CAI–I and CAI–II; (f) The ratio chart of milliequivalent concentrations of γ N a + + K + C l to γ C a 2 + + M g 2 + H C O 3 + S O 4 2 .
Water 16 00298 g003
Figure 4. Gibbs plot of phreatic water samples in the study area: (a) N a + / N a + + C a 2 + and (b) C l / C l + H C O 3 versus TDSs.
Water 16 00298 g004
Figure 5. Scatterplots of saturation indices of (a) calcite, (b) dolomite, (c) gypsum, and (d) anhydrite for each group.
Water 16 00298 g005aWater 16 00298 g005b
Figure 6. Line graphs depicting changes in the concentration of major ions along various simulated pathways. (a) Routes 1 and 2; (b) routes 3 and 4; (c) routes 5 and 6.
Water 16 00298 g006
Table 1. Classification of groundwater types and water-bearing rock groups in the study area.
Groundwater TypeAquifer Lithological GroupRange
Quaternary loose-pore water-bearing rock type (I)Quaternary System (Q)Floodplains of the Zihe River and its tributaries, as well as both sides of the river valleys.
Carbonate rock type (II)Fractured karst water (II1)Sanshanzi Formation (∈4O1s) Chaomidian Formation (∈4O1 c ^ )The central and low mountainous areas east of the Zihe River and the main river channel.
Beianzhuang Formation (O2b) Wuyangshan Formation (O2w)Within the Zihe River graben area and vast regions to the west of the graben.
Karst fracture water (II2)Zhangxia Formation (∈3 z ^ )Both sides of the river valleys in the area east of Chishang Village in the southeast.
Zhushadong Formation (∈2 z ^ )In the area around Chishang Town in the southeast.
Massive weathered fissure water-bearing rock type (III)Taishan Group (Art)Southeastern, southern, and southwestern ends of the study area.
Table 2. Statistical summary of chemical parameters of phreatic water.
K + N a + C a 2 + M g 2 + C l S O 4 2 N O 3 H C O 3 pH1CODTDS
Quaternary loose-pore water rock type
Min(mg/L)0.513.5366.9312.886.8286.4512.43149.047.600.32416.00
Mean(mg/L)1.4214.16117.3723.7222.57116.2751.34276.757.820.43518.30
Max(mg/L)4.1621.35188.5841.2035.89159.08105.25425.358.300.57660.00
SD 11.036.0528.708.797.9022.2029.0479.300.200.1060.40
CV 10.720.430.240.370.350.190.570.290.030.220.12
Massive weathered fissure water rock type
Min(mg/L)0.469.1244.498.0210.2333.610.89187.797.700.36248.00
Mean(mg/L)1.1917.39117.0815.8723.01105.3161.39245.177.850.52371.50
Max(mg/L)2.1824.95201.4024.0939.20206.14106.00330.878.000.73562.00
SD 10.625.7058.796.3912.3272.1438.0156.220.110.15110.04
CV 10.530.330.500.400.540.690.620.230.010.290.30
Carbonate rock fissure–karst water
Min(mg/L)0.385.0048.9011.553.4142.440.01113.277.000.24308.00
Mean(mg/L)1.4712.01118.1623.3423.35116.0743.59277.307.800.55482.56
Max(mg/L)4.3127.08205.4138.6564.59206.14140.20372.188.404.77774.00
SD 11.024.7929.044.929.6135.4527.5146.800.260.6886.13
CV 10.690.400.250.210.410.310.630.170.031.220.18
Note: “1” represents a dimensionless quantity; SD represents standard deviation; VC represents Coefficient of Variation.
Table 3. Correlation coefficients between karst water chemical components.
K + N a + C a 2 + M g 2 + C l S O 4 2 H C O 3 N O 3 pHCODTDS
K + 1.000.33 *−0.250.07−0.120.01−0.20−0.100.060.34 **−0.07
N a + 1.00−0.070.030.260.36 **−0.220.070.080.14−0.02
C a 2 + 1.000.230.67 **0.69 **0.65 **0.72 **−0.27 *−0.200.68 **
M g 2 + 1.000.190.34 **0.65 **−0.02−0.12−0.140.36 **
C l 1.000.64 **0.29 *0.53 **−0.110.150.41 **
S O 4 2 1.000.29 *0.42 **−0.130.100.58 **
H C O 3 1.000.24−0.32 *−0.36 **0.48 **
N O 3 1.00−0.17−0.190.52 **
pH 1.000.02−0.25
COD 1.00−0.20
TDS 1.00
Note: * indicates significance at α = 0.05; ** indicates significance at α = 0.01.
Table 4. Main simulation path of shallow groundwater in the study area.
Aquifer GroupSimulation Paths
Quaternary loose-pore water-bearing rock groupXia Village (G77) → Zhengjia Village (G79)
Beixing Village (G87) → Qingyanghang Village (G90)
Massive weathered fissure water-bearing rock groupXia Hao Yu No. 1 well (G55) → Zhao Village (G2)
Liu Jia Bridge (H1) → Yinjiayu (G91)
Carbonate karst fissure water-bearing rock groupBonsen Oguchi (G216) → Boshan Town No. 1 well(G130)
Drill hole No. 5 (XK5) → Drill hole No. 2 (XK2)
Table 5. Chemical composition of the water at the start and end of each simulation pathway (mg/L).
Sampling PointS/E Route N a + C a 2 + M g 2 + C l S O 4 2 H C O 3 C O 3 2 Sr
G77Start 120.82131.6619.9320.45159.08241.4500.41
G79End 120.72114.0326.1327.27118.75241.452.930.23
G87Start 216.39116.6317.8632.3891.86223.5600.44
G90End 217.5190.9840.8327.27116.51327.8901.03
G55Start 324.9544.4911.5511.9340.33187.7905.79
G2End 39.1284.978.0210.2333.61202.700.24
G91Start 419.2201.424.0939.2206.14330.8700.83
H1End 416.3137.4719.8130.68141.16259.3300.36
G216Start 513.69131.4623.3320.45114.27310.0100.22
G130End 57.06119.0422.2417.9498.46307.8200.18
XK5Start 618.22114.6321.2725.3299.2283.9300.34
XK2End 65.22113.5825.223.75119.06265.2700.19
Table 6. Saturation index of each potential mineral phase at the start and end of each simulated pathway.
AquiferSampling
Point
S/E RouteCalciteDolomiteGypsumCelestiteRock Salt C O 2 g
QuaternaryG77Start 10.620.59−1.25−2.05−7.94−2.64
QuaternaryG79End 10.670.7−1.43−2.39−7.83−10.54
QuaternaryG87Start 20.480.3−1.49−2.22−7.84−2.56
QuaternaryG90End 20.350.52−1.5−1.74−7.89−2.19
FissuredG55Start 30.280.12−2.11−1.29−8.06−2.82
FissuredG2End 30.460.07−1.98−1.82−8.58−2.69
FissuredG91Start 40.710.65−1.02−1.7−7.71−2.31
FissuredH1End 40.580.44−1.26−2.14−7.87−2.51
KarstG216Start 50.640.66−1.36−2.46−8.12−2.43
KarstG130End 50.430.28−1.45−2.57−8.46−2.22
KarstXK5Start 60.30.03−1.46−2.29−7.90−2.15
KarstXK2End 60.951.42−1.39−2.46−8.47−2.89
Table 7. Selection of potential mineral phases in each aquifer.
Aquifer GroupPotential Mineral Phases
All aquifersCalcite, dolomite, gypsum, celestite, rock salt, C O 2 , N a X , C a X 2 , M g X 2
Note: the main chemical component of rock salt is N a C l .
Table 8. Simulation results of mass balance for each simulation path in the study area (mmol/L).
RouteAquiferStartEndCalciteDolomiteGypsumCelestiteRock Salt C O 2 (g) N a X C a X 2 M g X 2
1QuaternaryG77G79−0.620.380.0020.13
2QuaternaryG87G90−1.511.071.350.0070.81−0.060.08
3FissuredG55G21.34−0.510.0060.35−0.690.34
4FissuredH1G910.70−0.010.730.0050.040.79−0.220.020.09
5KarstG126G1300.12−0.06−0.25−0.290.14
6KarstXK5XK2−0.240.27−0.470.24
Note: Positive values indicate the dissolution of a substance into the solution, while negative values indicate the precipitation of a substance leaving the solution. “—“ denotes that the substance is not involved in the reaction. N a X , C a X 2 , and M g X 2 represent the moles of sodium ions, calcium ions, and magnesium ions transferred through ion exchange, with positive values indicating dissolution and negative values indicating migration out of the solution.
Disclaimer/Publisher’s Note: The statements, opinions and data contained in all publications are solely those of the individual author(s) and contributor(s) and not of MDPI and/or the editor(s). MDPI and/or the editor(s) disclaim responsibility for any injury to people or property resulting from any ideas, methods, instructions or products referred to in the content.

