Article

Rainfall Pattern Construction Method Based on DTW-HCA and Urban Flood Simulation: A Case Study of Nanchang City, China

1
School of Hydraulic & Ecological Engineering, Nanchang Institute of Technology, Nanchang 330099, China
2
State Key Laboratory of Simulation and Regulation of River Basin Water Cycle, China Institute of Water Resources & Hydropower Research, Beijing 100044, China
3
Jiangxi Vocational and Technical College of Information Application, Nanchang 330043, China
4
Nanchang Urban Planning and Design Research Institute, Nanchang 330038, China
*
Author to whom correspondence should be addressed.
Water 2024, 16(1), 65; https://doi.org/10.3390/w16010065
Submission received: 27 November 2023 / Revised: 19 December 2023 / Accepted: 21 December 2023 / Published: 23 December 2023
(This article belongs to the Special Issue Urbanization, Climate Change and Flood Risk Management)

Abstract

:
Due to the different design standards of urban drainage and water conservancy facilities, numerous coordination and linkage issues arise when confronting extreme rainfall. In this paper, three clustering methods were used to cluster rainfall events, and the results demonstrate that the dynamic time warping-hierarchical clustering algorithm (DTW-HCA) effectively captures the temporal similarity of time series. Then, the Pilgrim and Cordery rainfall distribution method was utilized to extract the characteristics of eight clusters of rainfall events, and eight kinds of rainfall patterns were obtained. Last, after importing the rainfall patterns into the MIKE model of Qingshan Lake to conduct flood simulations, the impacts of different rainfall patterns on municipal systems and water conservancy systems were assessed by the depth and area of urban waterlogging, as well as the water levels and discharge of rivers. Based on this, three rainfall patterns are proposed as a designed rainfall pattern (DRP), an extreme rainfall pattern for urban drainage facilities verification (ERPUDFV) and an extreme rainfall pattern for water conservancy facilities verification (ERPWCFV), which aim to provide a reference basis for designing region-specific extreme rainfall patterns, as well as the verification of urban drainage and water conservancy facilities.

1. Introduction

In the context of global climate change, the rise in extreme weather events has caused significant damage and losses in socioeconomic systems, as well as to the lives and properties of the general population [1,2,3]. Additionally, urban flooding disaster caused by extreme rainfall demands immediate attention. From 17 to 23 July 2021, Henan Province in China experienced an unprecedented extreme rainfall event, resulting in severe flooding. The disaster affected 150 counties (cities and districts) and 14.786 million people in Henan Province, with 398 deaths and missing persons reported. The direct economic loss amounted to CNY 120 billion, with Zhengzhou City accounting for CNY 40.9 billion, representing 34.1% of the provincial total [4]. In July 2022, Kentucky in the United States experienced consecutive days of extreme rainfall, resulting in devastating flood disasters in the eastern part of the state, which caused at least 37 deaths and displaced thousands of people [5]. From 29 July to 2 August 2023, Beijing, China, was hit by an unprecedented extreme rainfall event caused by Typhoon Doksuri [6]. The city experienced an average precipitation of 331 mm, which accounted for 60% of the annual average precipitation within a span of 83 h. Moreover, the average precipitation in the Mentougou District was 538.1 mm, and the average precipitation in the Fangshan District was 598.7 mm. On 10 September 2023, Hurricane Daniel struck the eastern part of Libya [7], with total rainfall reaching 400 mm in 24 h. As of September 12th, the death toll had exceeded 13,000, with at least 10,000 people missing and over 40,000 people displaced. Flood disasters caused by extreme rainfall have already attracted widespread attention from countries around the world.
As an important non-engineering measure in the prevention and control of urban flood disasters, flood simulation plays a vital role in flood research due to its convenience, effectiveness and strong reproducibility. Furthermore, with the recent advancement of smart cities, flood simulation has been extensively implemented [8]. The main flood models include the following: InfoWorks ICM, MIKE, SWMM and some other independently developed models. For instance, Sidek, et al. [9] presented an urban flood simulation using InfoWorks ICM hydrological−hydraulic modeling of the Damansara catchment as a case study and generated flood hazard maps based on several average return periods and uniform rainfall depths. Bisht, et al. [10] designed an efficient drainage system for a small urbanized area in the West Bengal region of India using SWMM and MIKE URBAN. Mustafa, et al. [11] developed an HEC-RAS 2-D flood dynamics model based on GIS, which was applied to estimate flood susceptibility and vulnerability in Erbil, Iraq.
Although the development of flood models has provided efficient technical support for urban flood management, it has also presented new demands and challenges [12]. In China, urban drainage belongs to the municipal system, while flood control belongs to the water conservancy system. Each adheres to its own industry standards [13]. The standards of different systems are not uniform, which leads to frequent issues with coordination and linkage [14]. Municipal departments usually apply rainfall patterns with a short duration and return period to design and build urban drainage facilities, which include drainage networks, reservoirs, pumping stations and so on. In contrast, water conservancy departments generally apply rainfall patterns with a long duration and return period to assess the flood control capabilities of dikes, dams, sluices and other water conservancy facilities. Therefore, this discrepancy creates conflicts or inconsistencies in urban planning and construction, leading to drainage systems being unable to effectively cope with different rainfall patterns, consequently increasing the risk of urban flooding disasters. Furthermore, rainfall patterning is a crucial input parameter for flood design and simulation, with the differences in input directly influencing the results of the simulation. Thus, it is crucial to take into account the rainfall patterns that specifically affect municipal and water conservancy systems when designing or verifying urban flood control and drainage systems.
There is a long history of research and development in designing rainfall patterns. In as early as the 1940s, researchers in the former Soviet Union analyzed rainfall data in Ukraine and established seven rainfall patterns [15]. In the 1960s, Keifer and Chu [16] conducted a comprehensive study on the interrelationship among rainfall intensity, duration and frequency, ultimately identifying an uneven rainfall pattern recognized as the Chicago rainfall pattern. Subsequently, there are numerous rainfall patterns that have emerged, including the Huff rainfall pattern [17], Pilgrim and Cordery rainfall pattern [18], triangular rainfall pattern [19] and so on. In recent years, numerous scholars have conducted research on rainfall patterns by analyzing historical rainfall data. Wang, et al. [20] analyzed rainfall events in Beijing using fuzzy recognition and statistical analysis methods, identifying the main rainfall patterns and calculating the values of extreme precipitation of different duration and return periods by using three distribution functions. Xu, et al. [21] applied cumulative rainfall duration curves and fuzzy recognition methods to identify rainfall patterns of heavy rainfall events and analyzed peak characteristics of the heavy rainfall events of different durations after clustering. Fu, et al. [22] used the dynamic time warping (DTW) algorithm to classify rainfall patterns and establish four separate rainfall type classification models using four different machine learning methods. The above-mentioned methods utilize clustering algorithms to compare and classify each rainfall event with the classic seven patterns [15]. However, this kind of method is subjective and may not fully reflect the characteristics of local rainfall patterns. Additionally, the K-means clustering algorithm measures the similarity between two rainfall events based on the difference in precipitation at the same time, which leads to a bias towards similarity in precipitation at the same moment and neglects the overall similarity of rainfall patterns along the time series.
In order to distinguish the impacts of different rainfall patterns on urban drainage and water conservancy facilities, this paper is based on the historical hourly precipitation data from meteorological stations in the urban area of Nanchang City, after extracting a total of 428 rainfall events. The rainfall events were clustered by a DTW distance matrix combined with the hierarchical clustering algorithm. Then, the Pilgrim and Cordery rainfall distribution method was applied to extract characteristics from the clusters and obtain the rainfall patterns. Based on the analysis of the effects of each rainfall pattern simulated by the flood model on urban waterlogging, river level and discharge at different return periods, this paper proposes three rainfall patterns, a designed rainfall pattern (DRP), an extreme rainfall pattern for urban drainage facilities verification (ERPUDFV) and an extreme rainfall pattern for water conservancy facilities verification (ERPWCFV), which can serve as references for designing extreme rainfall patterns that better align with local characteristics, as well as in the verification of urban drainage and water conservancy facilities (Figure 1).

2. Materials and Methods

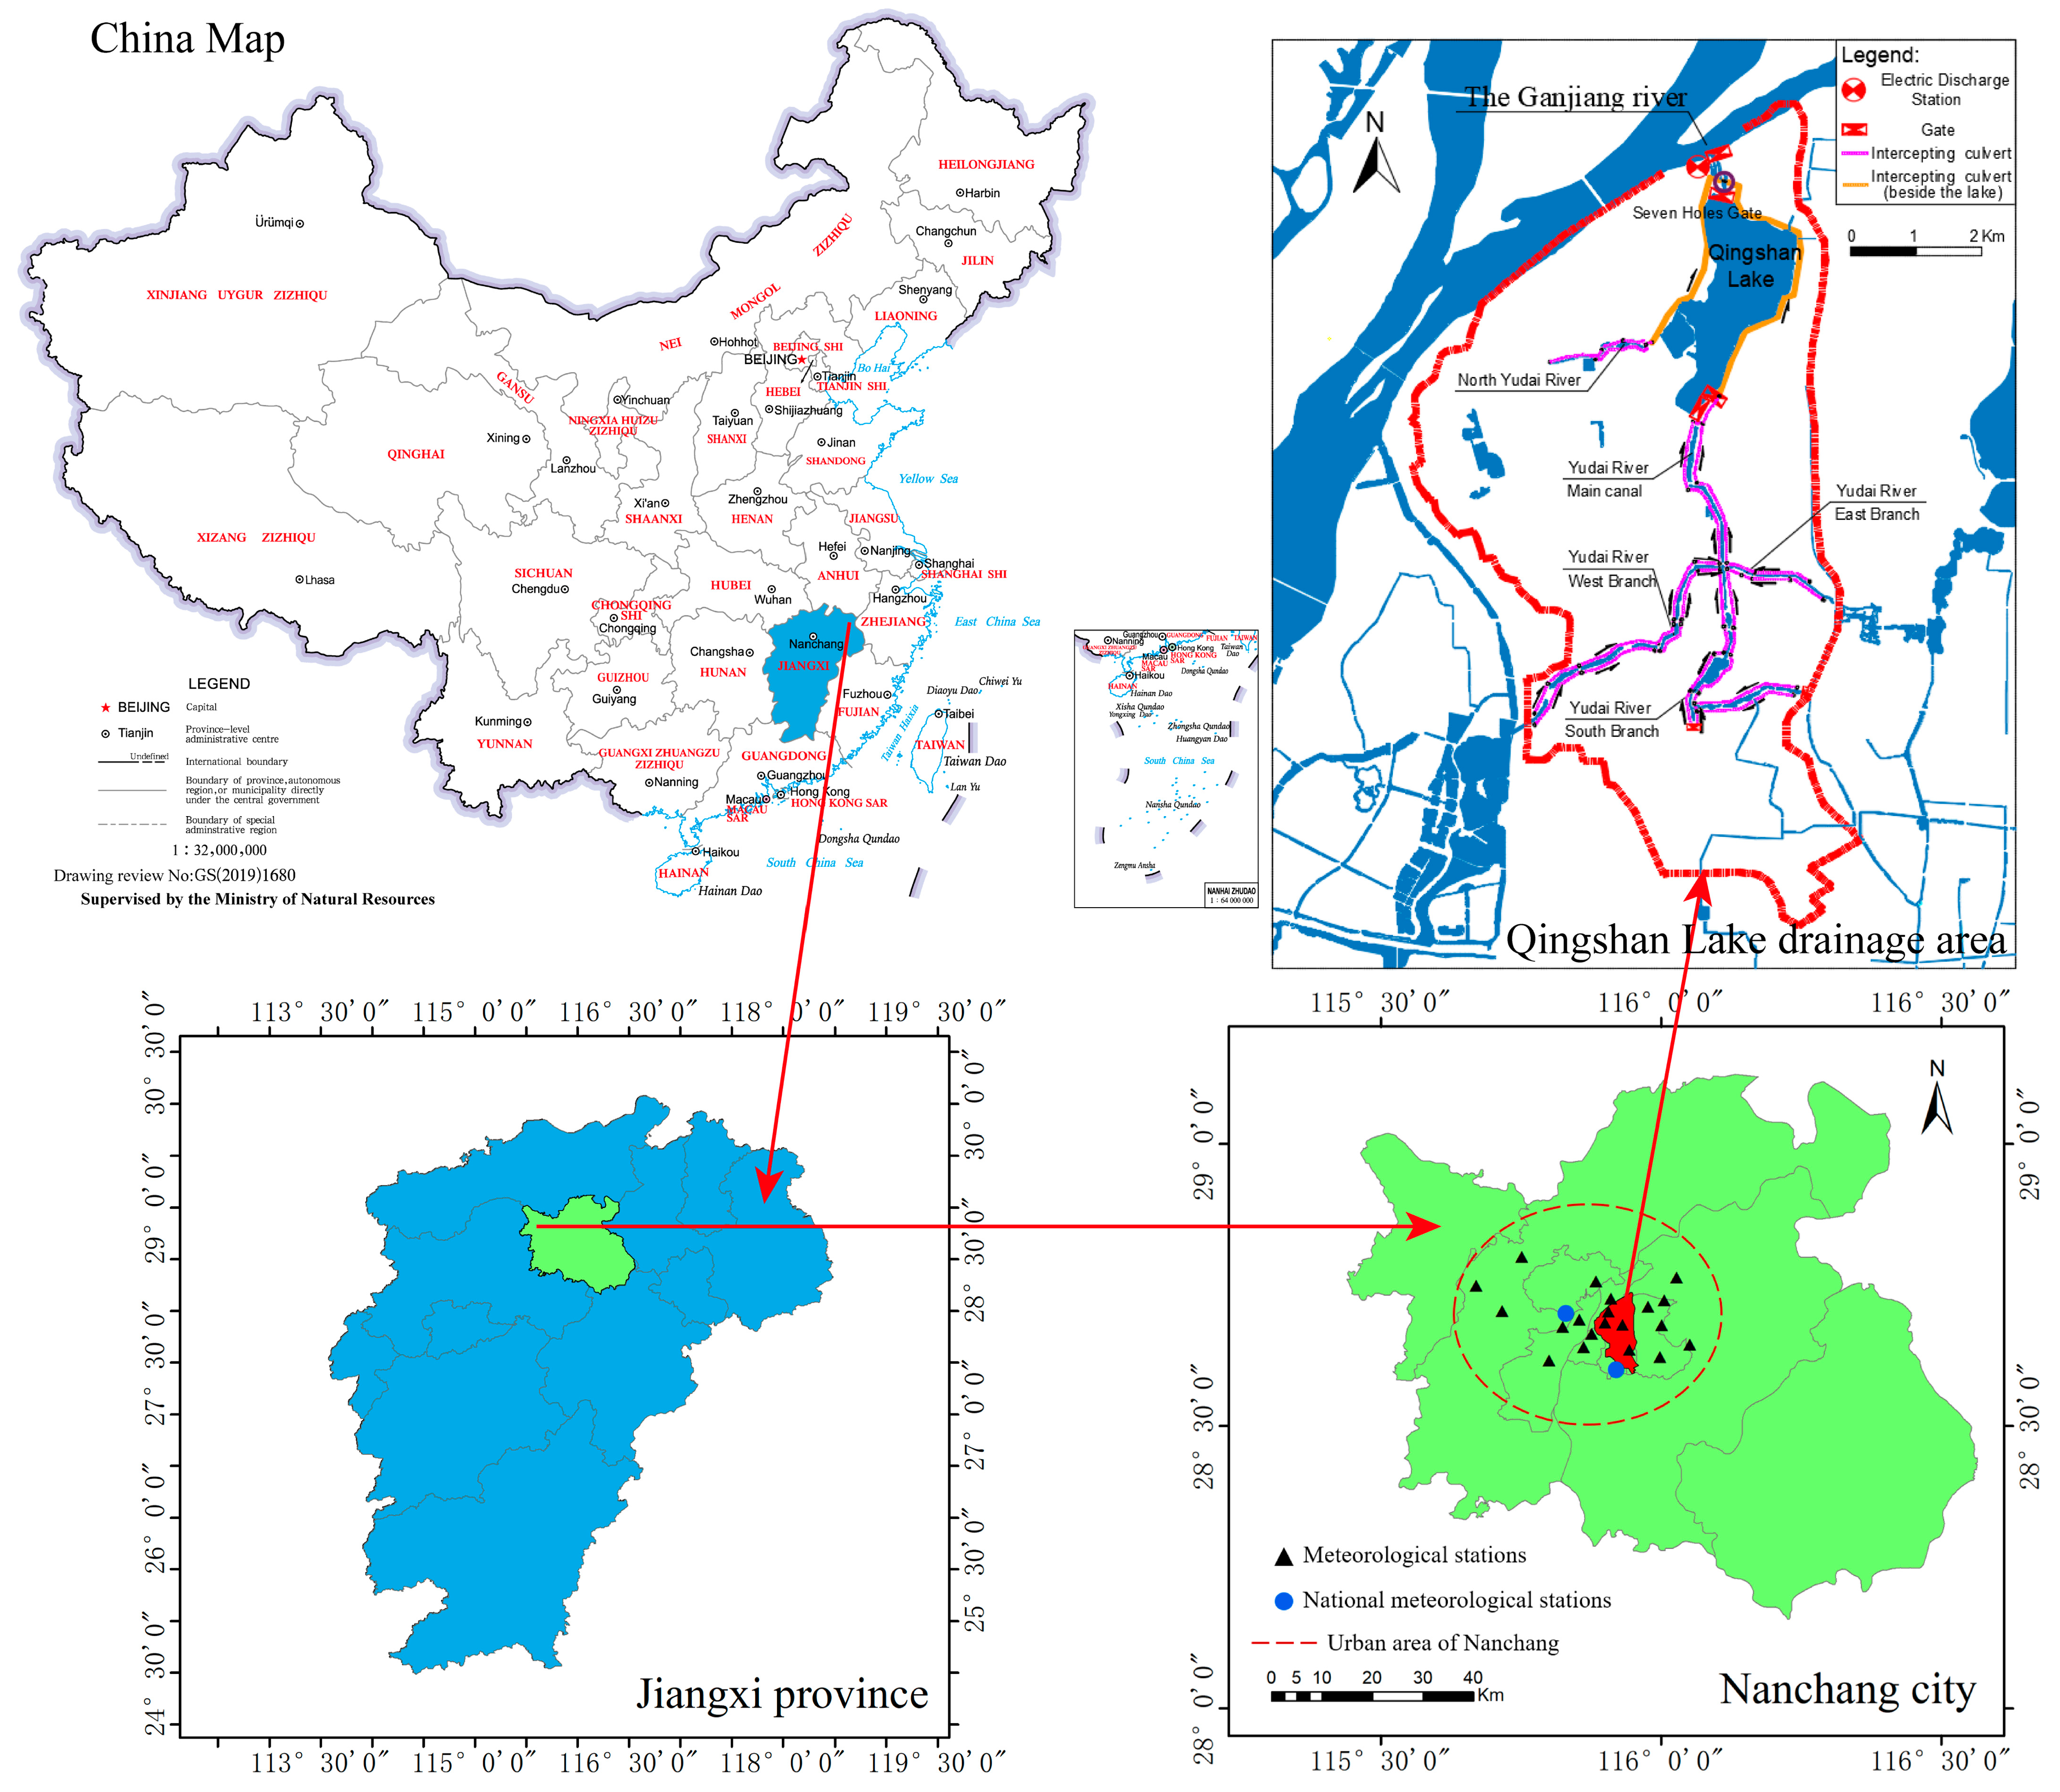
2.1. Study Area and Data Sources
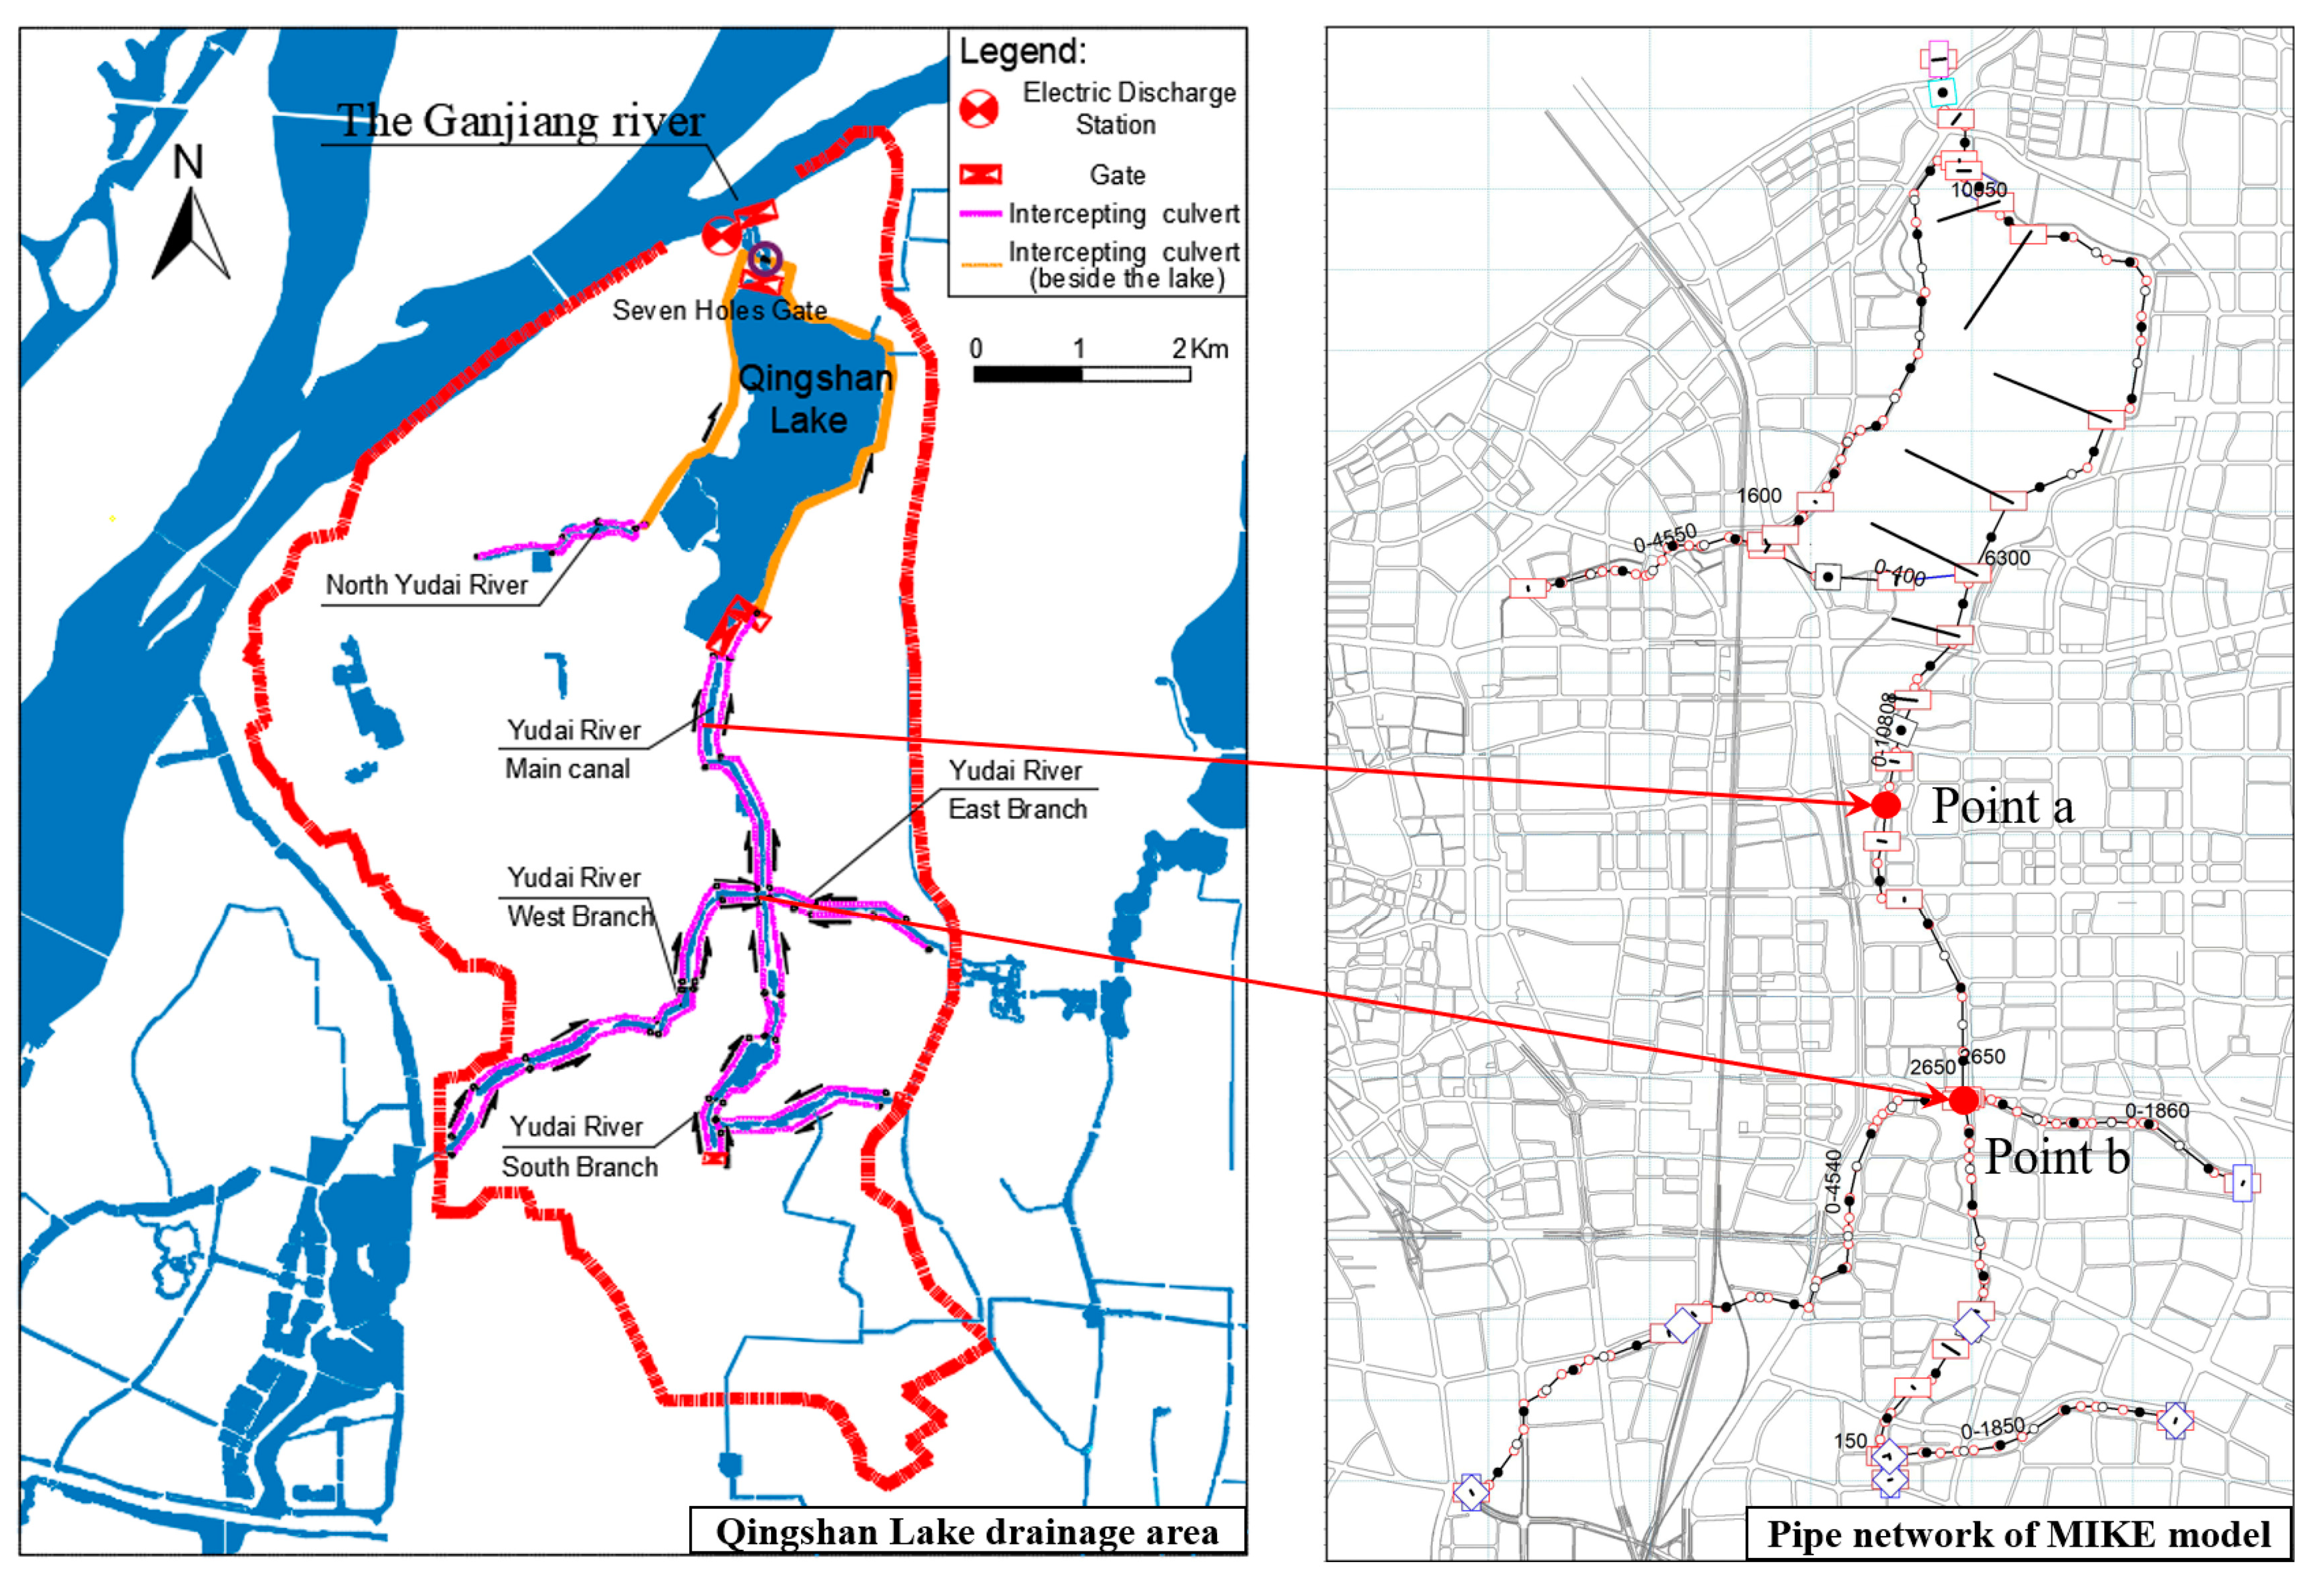
2.1.1. Study Area

Nanchang is the capital city of Jiangxi Province in China, which is located in the middle reaches of the Ganjiang River, with abundant water resources (Figure 2). It is situated in a subtropical monsoon region, experiencing plentiful rainfall. With the development of urbanization, the flow production capacity of the city land has greatly increased. Limited drainage capacity has been observed in the face of extreme rainfall events, leading to severe urban waterlogging, primarily due to the combination of a lower elevation and shorter design return period of the drainage network. In recent years, Nanchang has experienced multiple extreme rain events, such as the “7.12” in 2019, “6.29” in 2020, “5.10” in 2021 and “6.29” in 2022. These events caused significant economic losses due to severe flooding in the urban area. Although the municipal departments have made efforts to improve the construction of drainage systems and flood control projects, such as enhancing the construction of drainage systems and flood control projects, strengthening meteorological monitoring and early warning systems, urban flooding events continue to occur frequently in the face of extreme rainfall.
The Qingshan Lake drainage area is located in the urban area of Nanchang City and is characterized by flat and low-lying terrain, with a catchment area of 52 square kilometers. The ground elevation ranges from 19 to 23 m, and the designed standard of drainage is a 20-year return period. The incoming water of this drainage area is discharged into the Yudai River through the urban drainage network, and then it passes through the Qingshan Lake reservoir for regulation and storage, before finally being discharged into the Ganjiang River either through the Qingshan Lake sluice gate or the Qingshan Lake electric discharge station (Figure 2).

2.1.2. Data Sources

In this paper, hourly precipitation data from two national meteorological stations (Nanchang Station and Xinjian Station), as well as data from 20 automatic meteorological stations located in the urban area of Nanchang City, were adopted. The recorded period for Nanchang Station is from 1961 to 2020, for Xinjian Station, from 1979 to 2020, and for the meteorological stations, from 2009 to 2020. The distribution of these stations is shown in Figure 2.
It is common to consider rainfall with an hourly precipitation of greater than or equal to 0.1 mm and rainfall intervals not exceeding 2 h as a single rainfall event. Furthermore, precipitation exceeding 50 mm within a continuous 24 h period is referred to as a heavy rainfall event [23]. Additionally, in order to effectively identify the characteristics of rainfall events, it is necessary to normalize each rainfall event before clustering analysis.

2.2. Methods of Rainfall Clustering and Characteristic Extraction

2.2.1. Clustering Method of Rainfall Events

The DTW algorithm is a method used to measure the similarity between two time series. It has been widely applied in fields such as speech recognition [24], handwriting recognition [25] and motion capture [26]. The basic idea of the DTW algorithm is to calculate the distance between each point in a time series and all points in another sequence through dynamic programming and backtracking the optimal matching path (the path with the minimum cumulative distance), so as to determine the similarity between the two sequences. As shown in Figure 3a, the characteristic of point A in L i n e 1 should be similar to point A2 in L i n e 2 , rather than point A1. Euclidean distance presents the distance between A and A1, while the DTW distance presents the distance between A and A2. The distance between A and A2 is smaller than the distance between A and A1, indicating that the DTW distance is a more effective method of measuring the distance between two time series when considering time difference.
When the DTW algorithm is applied to a rain pattern, the first step is to assume two time series of rainfall, L i n e 1 and L i n e 2 , with lengths m and n, respectively.
L i n e 1 = ( L 11 , L 12 , , L 1 m )
L i n e 2 = ( L 21 , L 22 , , L 2 n )
A matrix D of size m × n is used to represent the cumulative distance matrix between two time series (Figure 3b). The element D ( i , j ) in the matrix represents the cumulative distance between the i-th element L1i in L i n e 1 and the j-th element L 2 j in L i n e 2 (Formula (3)). Find the optimal path from D ( 1 , 1 ) to D ( m , n ) that minimizes the cumulative distance along the path. This path corresponds to the optimal DTW path between L i n e 1 and L i n e 2 , and the value of D ( m , n ) at the end of this path represents the DTW distance. In addition, to prevent path deviation, a constraint can be added on the diagonal of the matrix, and we chose to constrain the path to three hours in this paper, which means that the precipitation at a specific moment was calculated only with the adjacent three hours. Similarly, the DTW distance can be calculated for all pairs of time series, enabling the construction of a DTW distance matrix that encompasses all clustering elements.
D ( m , n ) = { | L 1 m L 2 n | , m = 1 n = 1 | L 1 m L 2 n | + min { D ( m 1 , n ) D ( m , n 1 ) D ( m 1 , n 1 ) , m > 1 n > 1
where D ( m , n ) represents the cumulative distance matrix between two time series, L 1 m represents the m-th element in L i n e 1 and L 2 n represents the n-th element in L i n e 2 .
To ensure that the clustered rain patterns align with local characteristics, a hierarchical clustering method that did not require specifying the number of clusters in advance was employed in this study. Additionally, the DTW distance matrix was utilized to cluster rainfall events, providing strong visualization and interpretability.

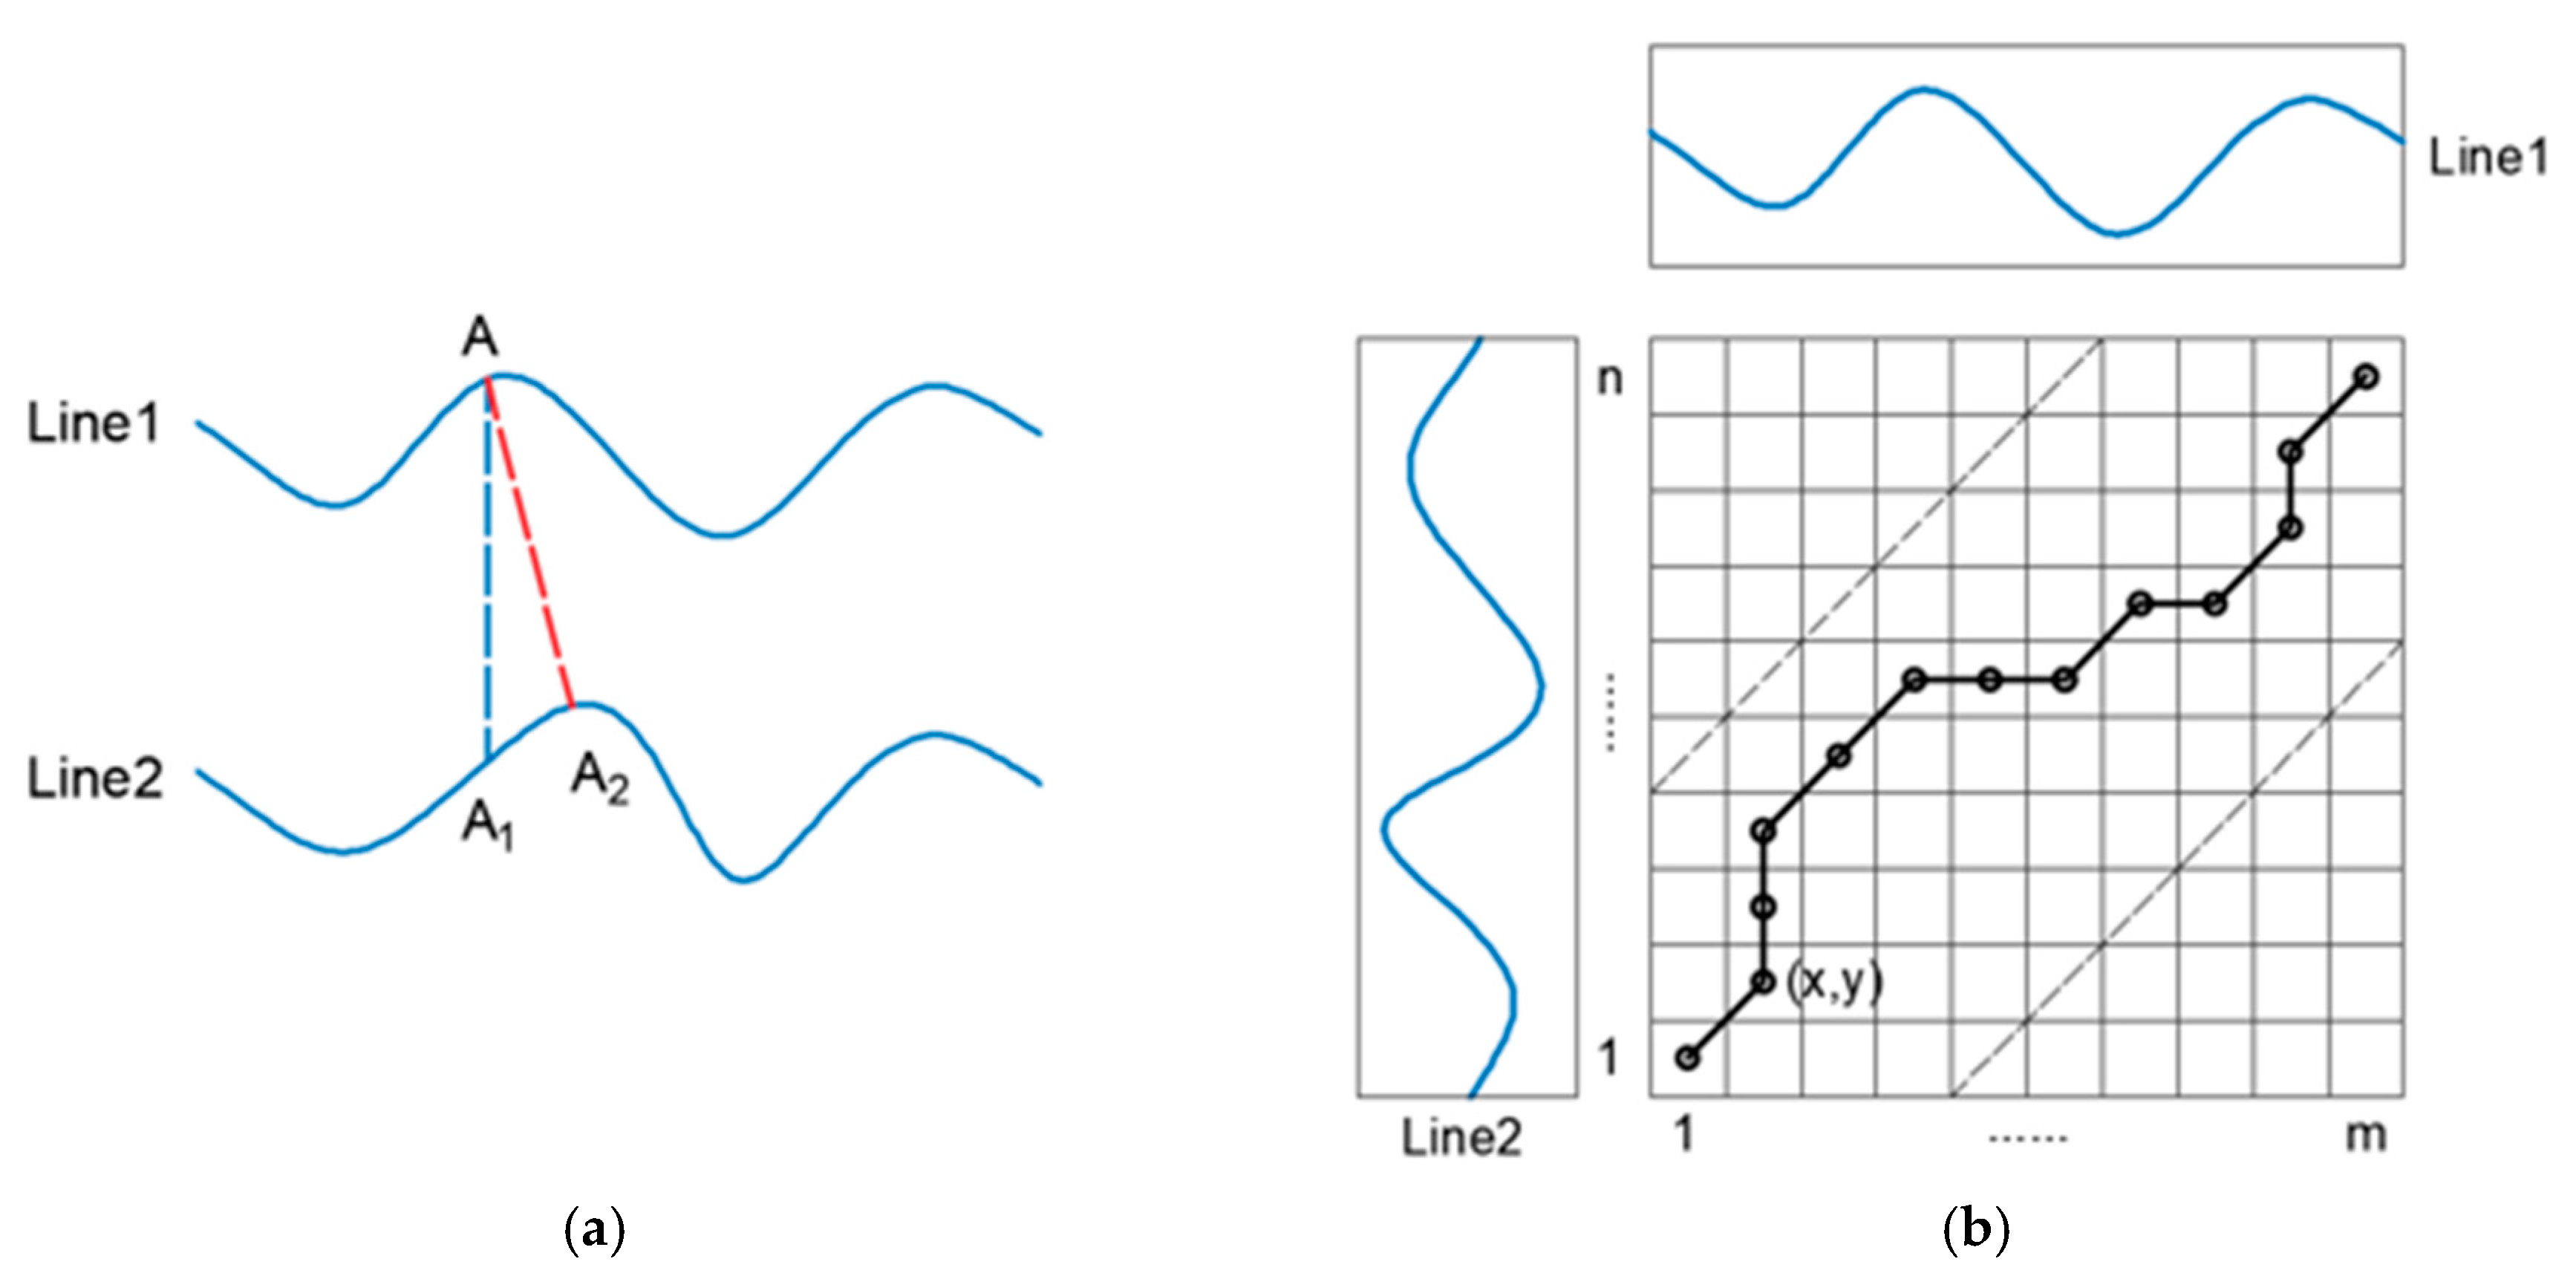
2.2.2. Characteristic Extraction Method of Rainfall Time Series

The commonly used method for characteristic extraction from clustering clusters is the mean method or directly using the cluster centers, but for rainfall patterns, calculating the mean of the clustering clusters with a large number of samples may lead to a decrease in peak values, thereby weakening the extracted features. The Pilgrim and Cordery rainfall distribution method positions the rainfall peak at the most probable occurrence, and the proportion of the rainfall peak period in the total precipitation is calculated as the average of the proportions of rainfall peaks in each rainfall event. The positions and proportions of other rainfall periods are also determined using the same method. Therefore, this rainfall pattern exhibits a relatively high resemblance to the actual rainfall event [27]. The specific methods are as follows.
(1) Each hour of rainfall is numbered by precipitation, with large precipitation corresponding to a small number and small precipitation corresponding to a large number. For example, the time period with the highest precipitation was assigned the number 1, and the time period with the lowest precipitation was assigned the number 24.
T i = ( t i 1 , t i 2 , , t i 24 )
N i = ( n i 1 , n i 2 , , n i 24 )
where T i represents the i-th rainfall event; t i j represents the precipitation in the j-th time interval of the i-th rainfall event, 1 t i j 24 ; N i represents the sequence of numbers of the i-th rainfall event; and n i j represents the number in the j-th time interval of the i-th rainfall event.
(2) Calculate the average number for the same time period of all rainfall events.
N a = ( i = 1 N n i 1 N , i = 1 N n i 2 N , , i = 1 N n i 24 N )
where N a represents the mean of the sequence of numbers assigned to N rainfall events.
(3) Calculate the ratio of hourly precipitation to the total precipitation for each rainfall event.
T r i = ( t i 1 j = 1 24 t i j , t i 2 j = 1 24 t i j , , t i 24 j = 1 24 t i j )
where T r i represents the ratio of precipitation in each time period of the i-th rainfall event to the total precipitation.
(4) Calculate the mean value of T r i in the same time period of all rainfall events.
T a r = ( i = 1 N t i 1 j = 1 24 t i j / N , i = 1 N t i 2 j = 1 24 t i j / N , , i = 1 N t i 24 j = 1 24 t i j / N )
where T a r represents the mean value of T r i in the same time period of all rainfall events.
(5) Place the elements in T a r in descending order at the positions of the elements in N a in ascending order. For example, place the largest value in T a r at the position of the smallest value in N a , place the second largest value in T a r at the position of the second smallest value in N a and so on, to obtain the rainfall pattern.

2.3. Method of Constructing a Designed Rainfall Pattern and Rainfall Pattern for Verification

2.3.1. Construction of a Flood Model

The MIKE model includes a complete set of urban water simulation modules, making it suitable for building and managing drainage pipe system models of various urban scales, as well as for urban flood control planning [28]. Therefore, in this study, the MIKE+ 2022 developed by the Danish Hydraulic Institute (DHI) was chosen to conduct flood simulation. The MIKE model of Qingshan Lake was constructed by collecting the data on its drainage network, river network and topography (Figure 4). The rationality of the parameters set in the coupled model was validated through the actual measured data, including rainfall intensity, river water levels, discharge from pumping stations, water depths and waterlogged areas. Since the Qingshan Lake MIKE model we constructed has already been applied in similar fields, this paper will not go into further detail about its construction [29].

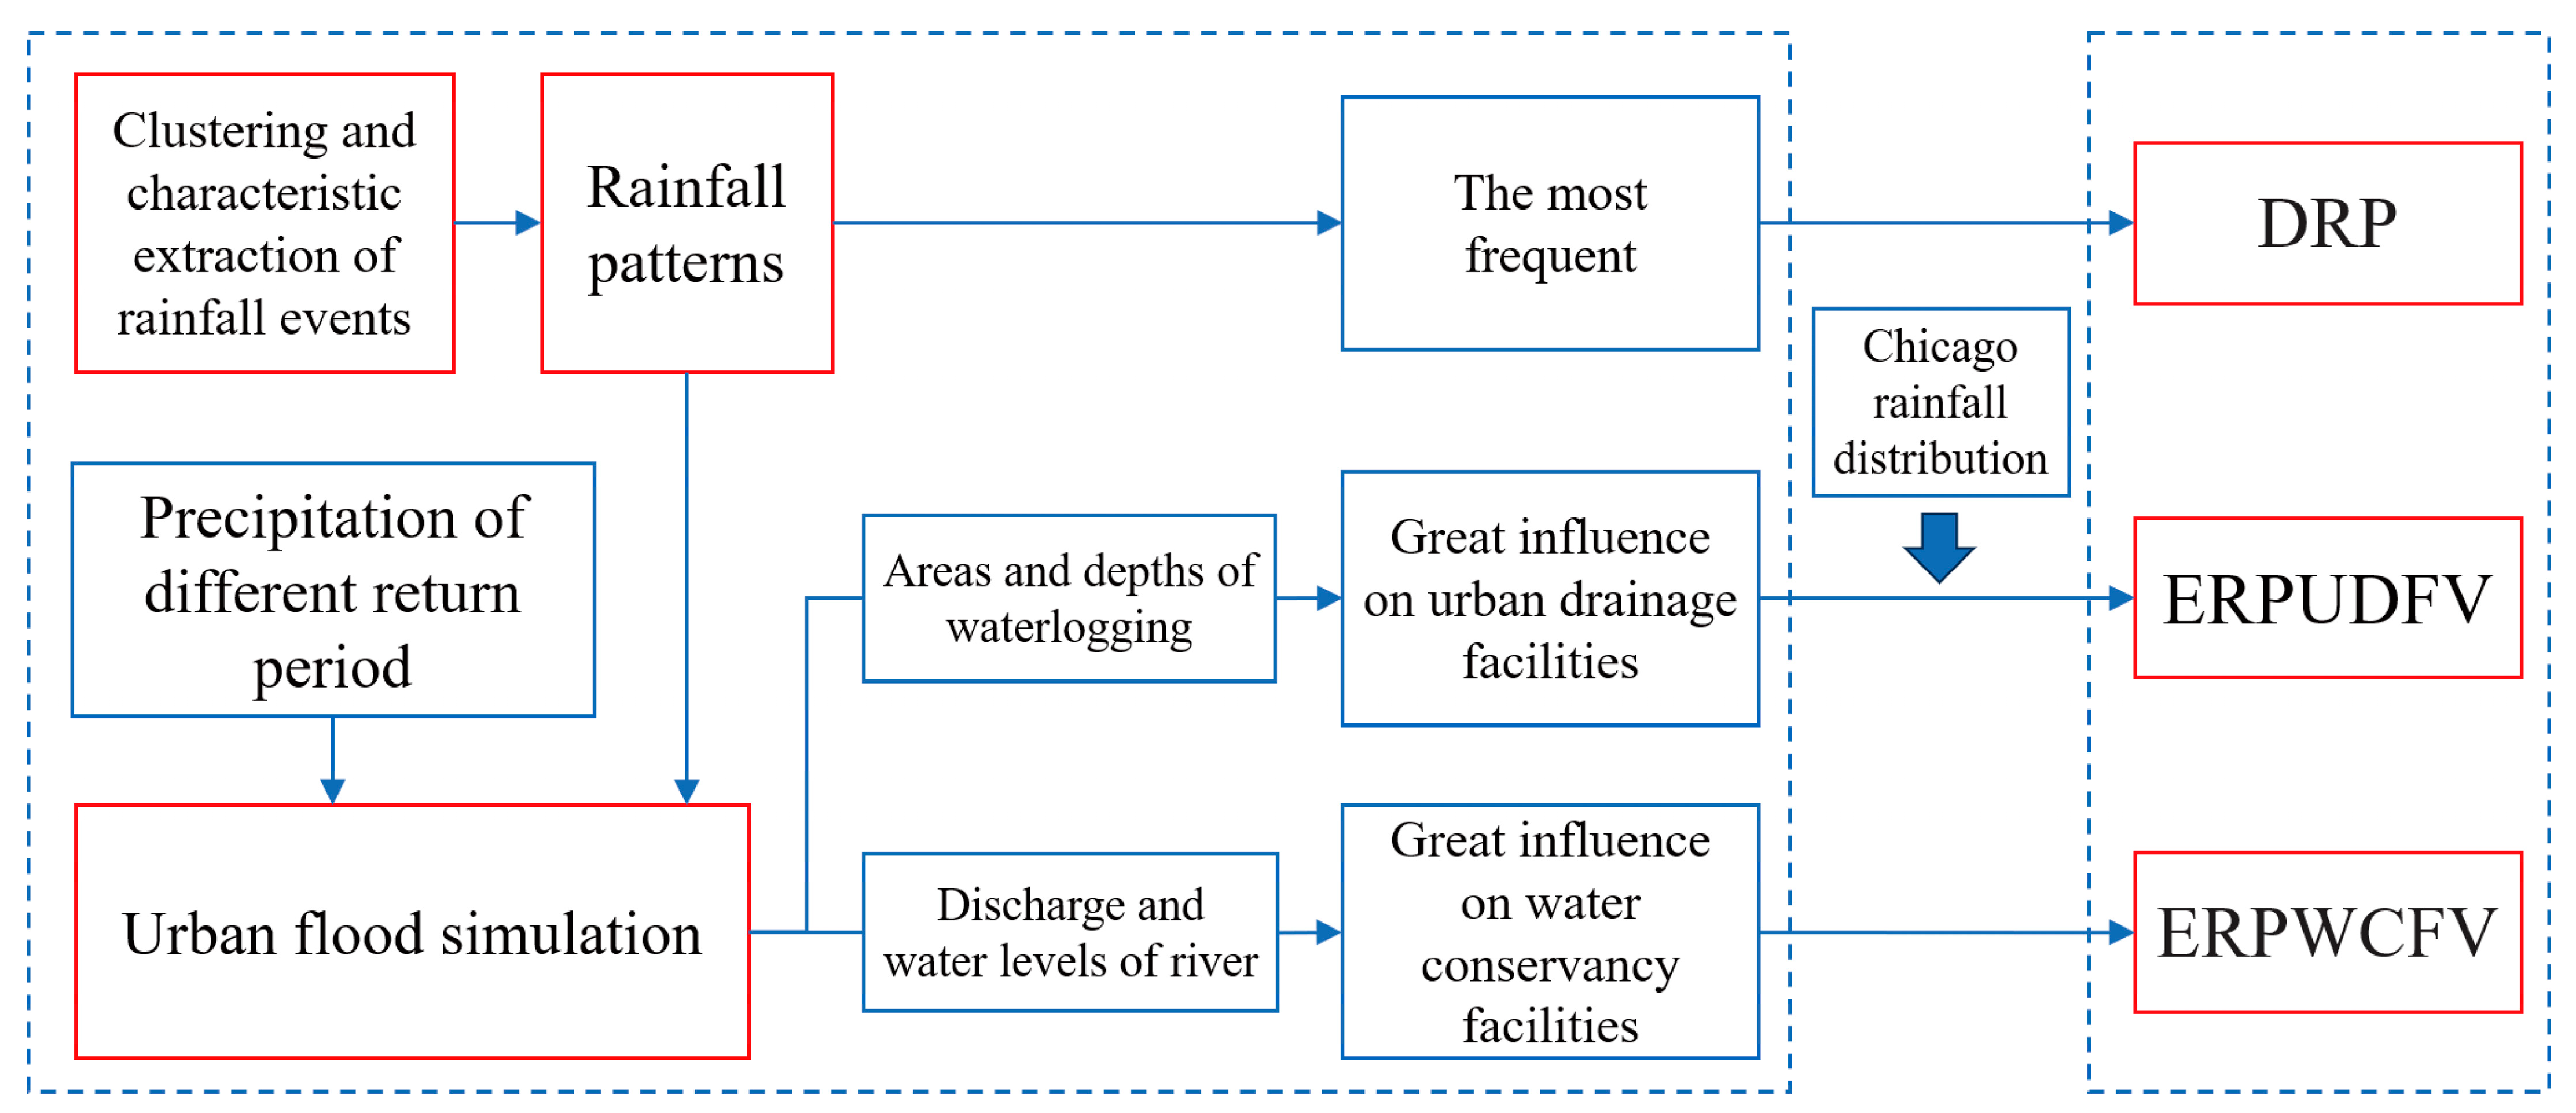
2.3.2. Methods of Constructing a Designed Rainfall Pattern

The DRP is the most representative rainfall pattern selected based on extensive statistical analysis of rainfall data [30]. Currently, there are two main methods for designing a DRP. One method involves directly using existing rainfall patterns, such as the Chicago rainfall pattern, PC rainfall pattern, Huff rainfall pattern and so on. The other method involves constructing rainfall patterns using measured precipitation data. Rainfall patterns constructed using this method can reflect local rainfall characteristics and provide more reasonable references for local urban and water conservancy projects. The impact of various rainfall patterns on municipal and water conservancy systems under a once-in-20-year precipitation was simulated in this paper and the most prevalent rainfall pattern was selected as the DRP.

2.3.3. Method of Constructing Rainfall Patterns for Verification

(1)
Method of Constructing an ERPUDFV
In an urban flood simulation, indicators such as the area of urban waterlogging and water levels directly reflect the impact of floods on the city [31,32], making them a focal point for municipal departments. Additionally, from the perspective of municipal management, they are particularly concerned about short-duration heavy rainfall because a large amount of rainfall in a short period can overload the city’s drainage system, leading to a higher risk of flooding [27]. By simulating and analyzing the impacts of various rainfall patterns on urban flooding areas and water levels under a once-in-100-year return period, the most influential rainfall pattern was identified. The selected rainfall pattern was further refined using the Chicago rainfall pattern to characterize the maximum one-hour rainfall process to obtain the ERPUDFV. This approach allows for testing the capacity of drainage facilities from the perspective of long-duration rainfall and evaluating the capability of the drainage pipe network for short-duration rainfall. It can effectively assess the capacities of both municipal drainage and watershed drainage systems [33].
(2)
Method of Constructing an ERPWCFV
Compared to municipal authorities, who focus on the impact of heavy rainfall on urban flooding, a water conservancy department pays more attention to its effects on the water levels and flow rates of rivers and lakes within a city [34]. Therefore, two monitoring points, labeled as “a” and “b”, were established at the main channel and the confluence of the three tributaries (the southern, western and eastern branches) of the Yudai River to measure water levels and discharge. By analyzing the influence of various types of rainfall on the water levels and discharge in the river, the most hazardous rainfall pattern was determined as the ERPWCFV.

3. Results and Discussion

3.1. Results of Rainfall Clustering and Characteristic Extraction

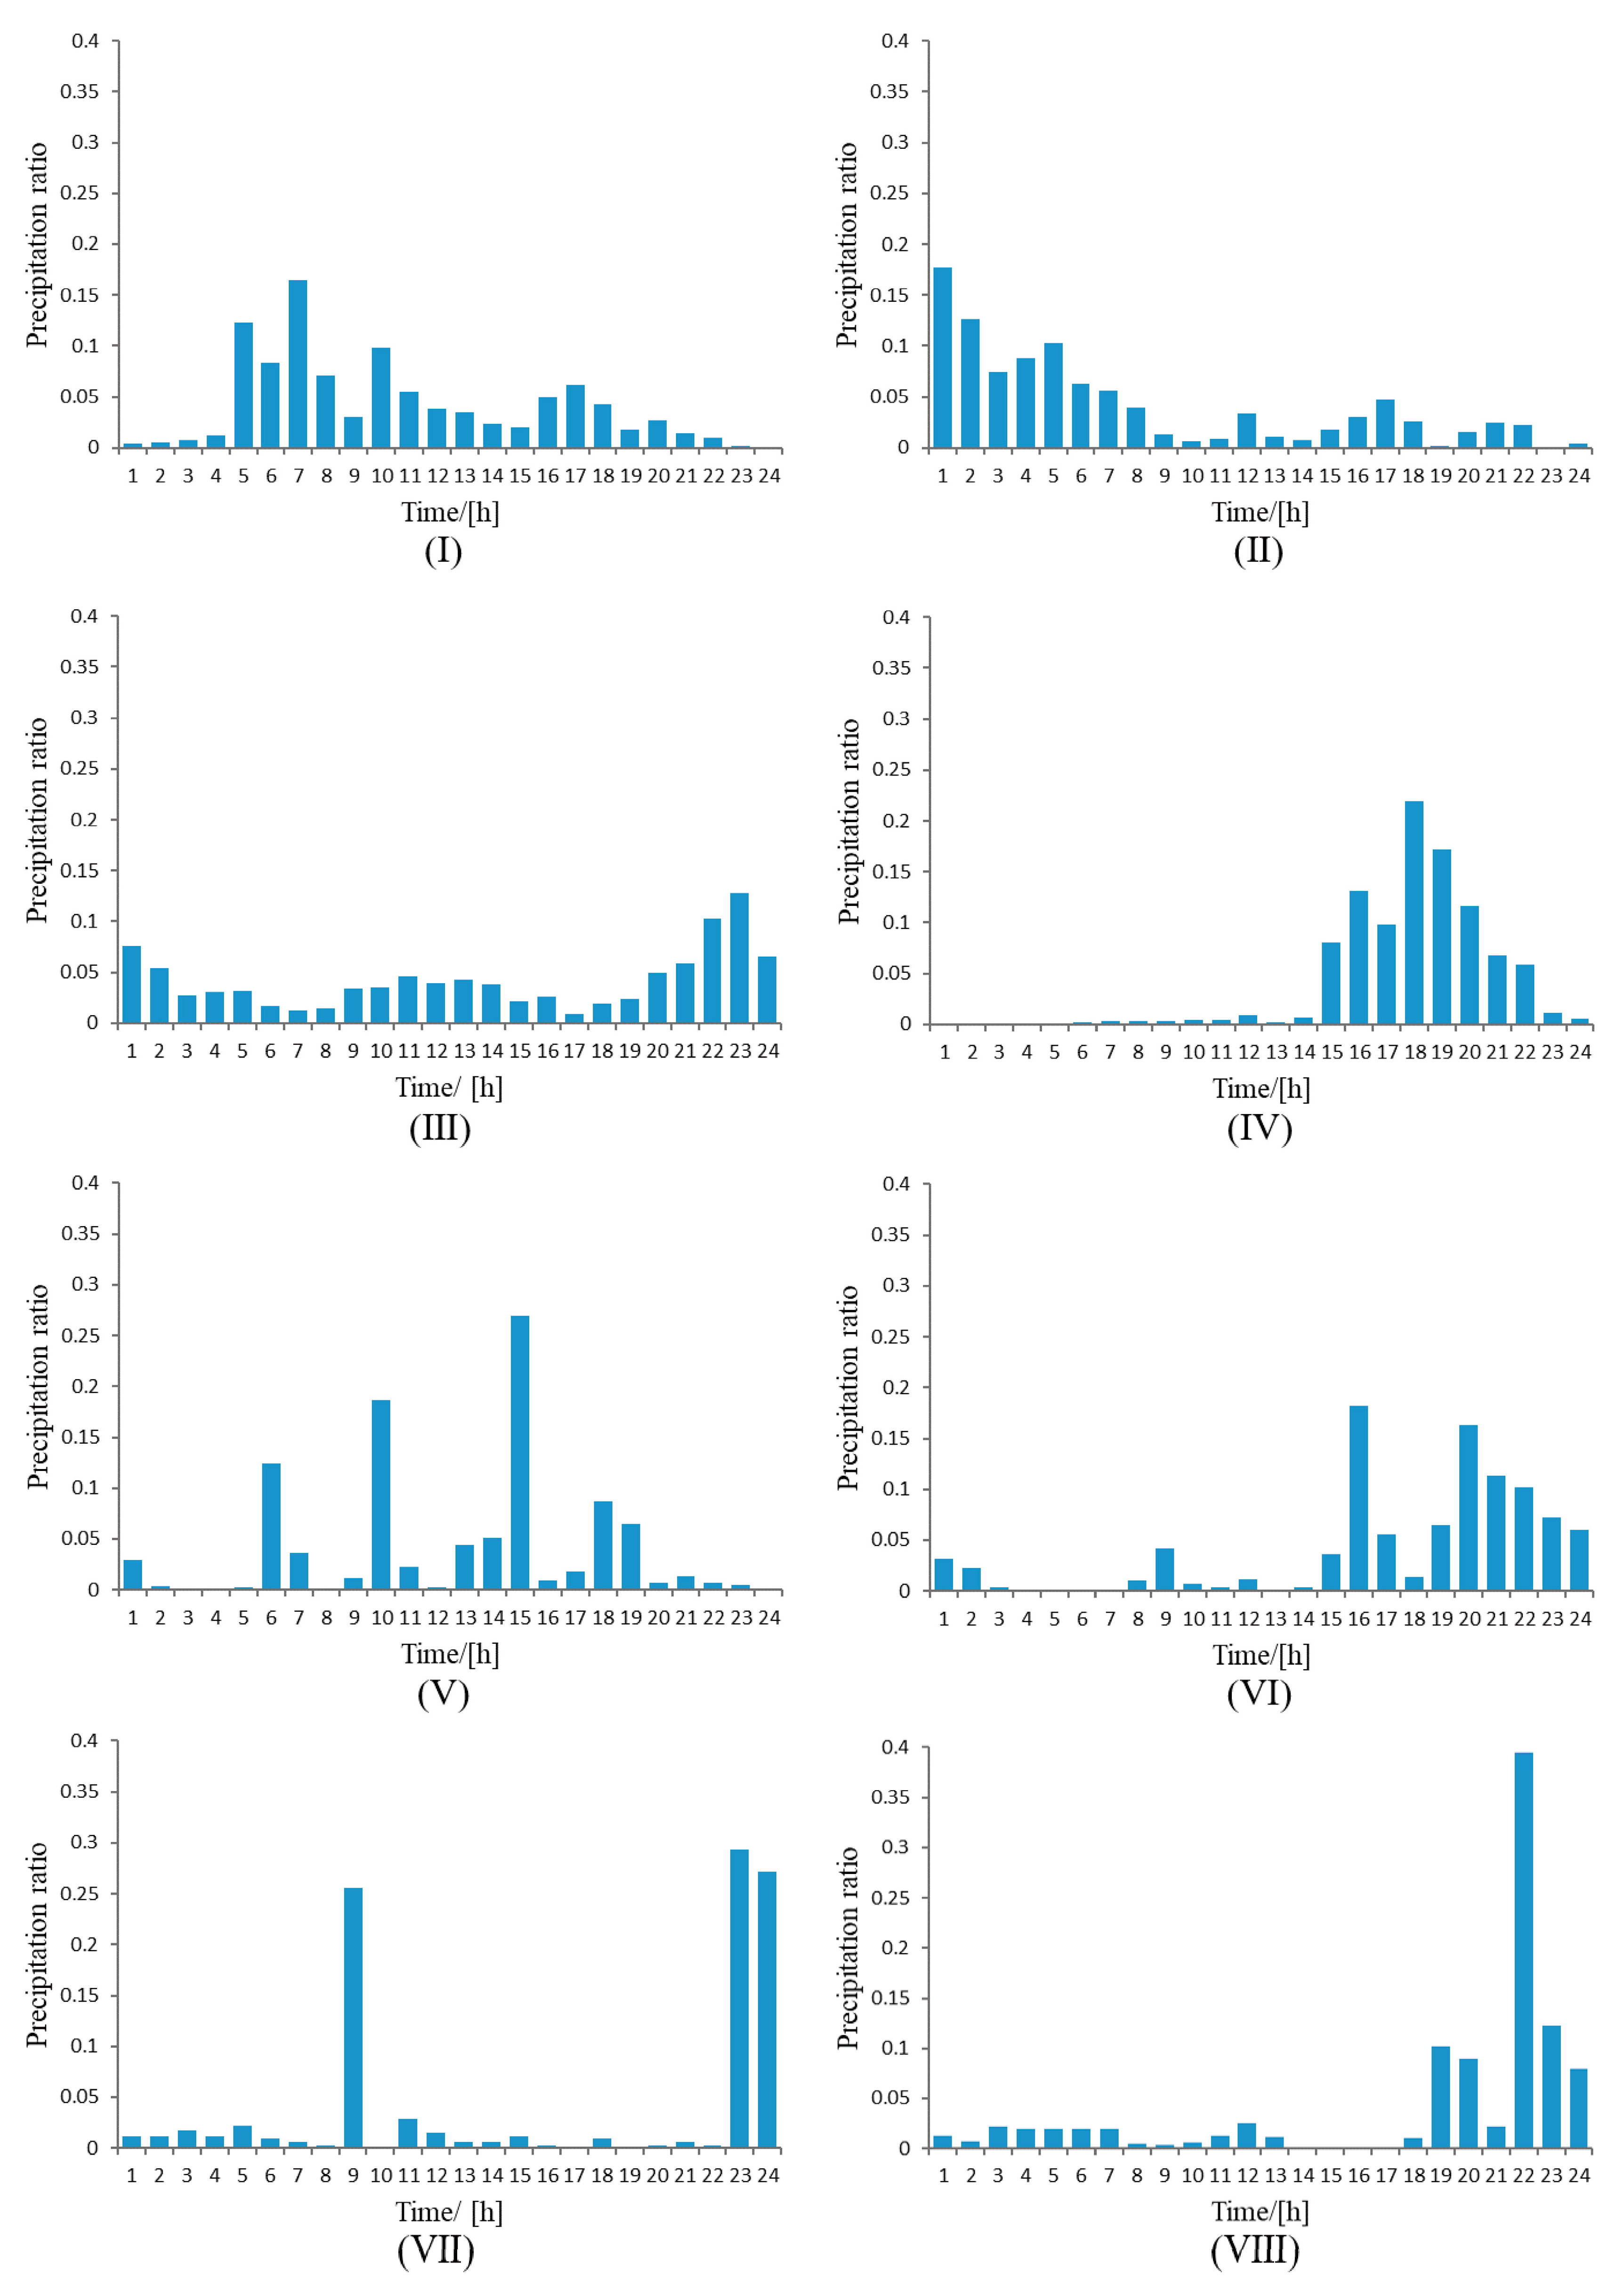
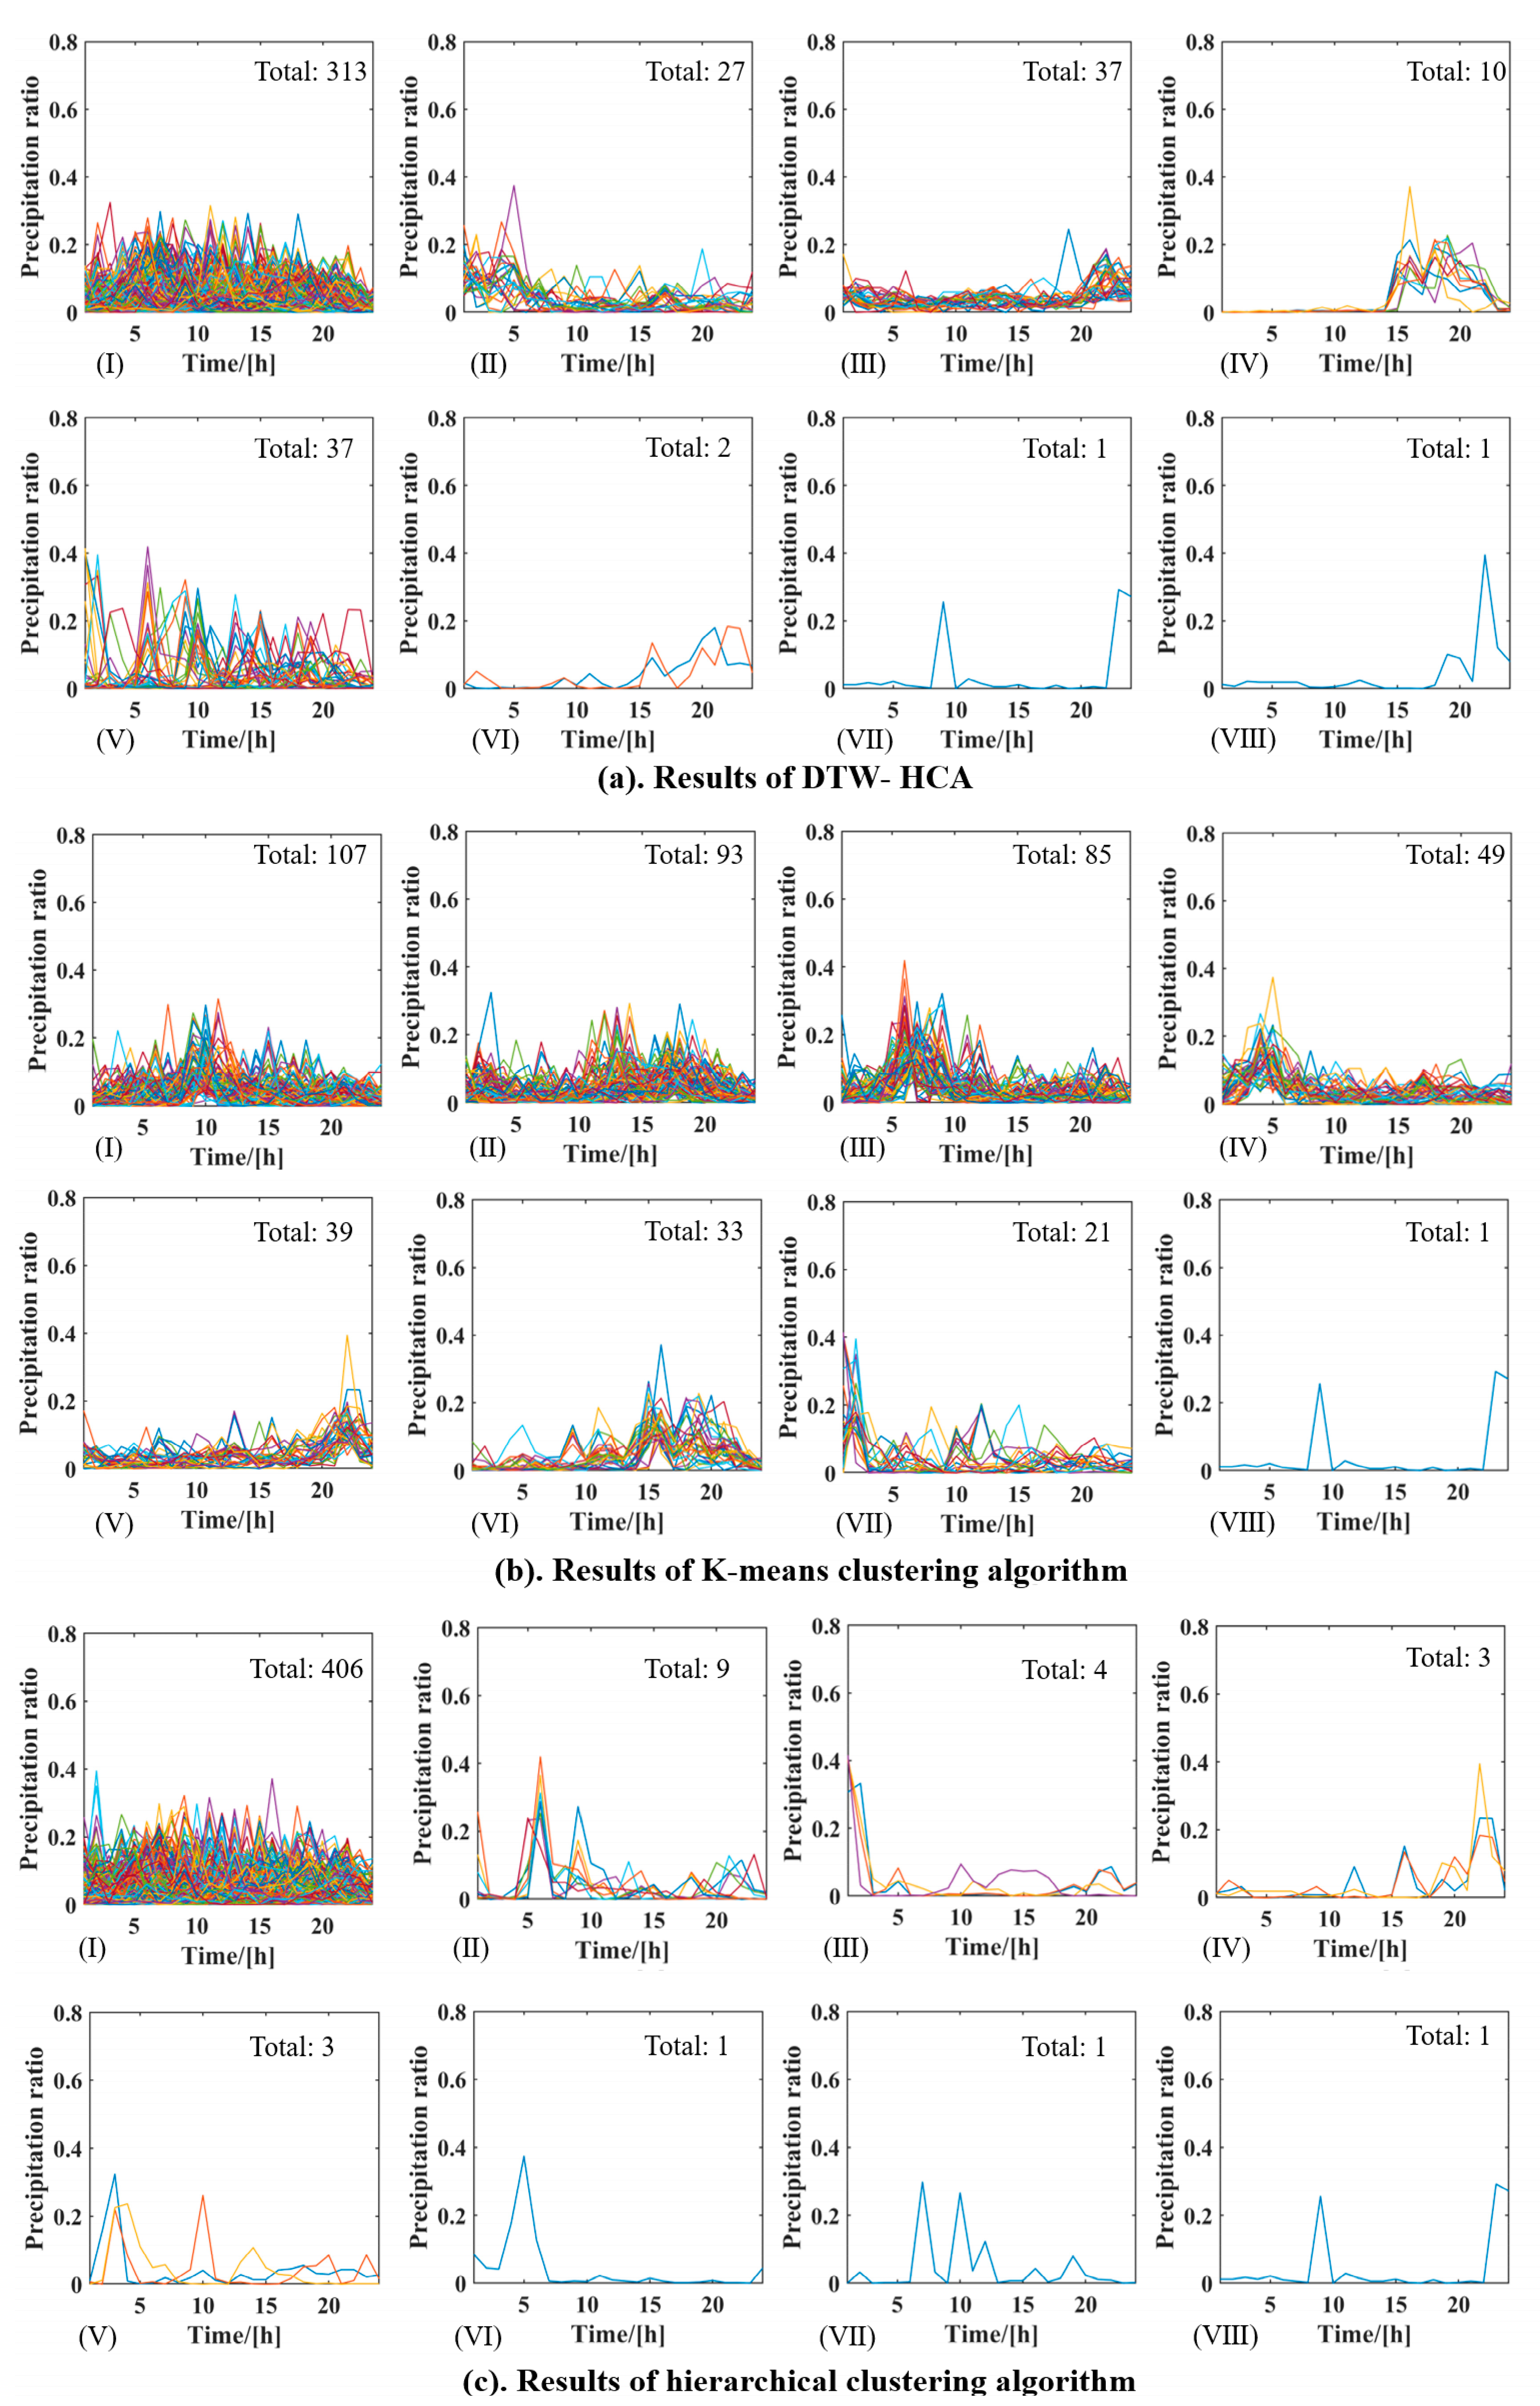
3.1.1. Results of Rainfall Clustering

The hourly precipitation data used were from two national meteorological stations and 20 automatic meteorological stations in the urban area of Nanchang City. In order to identify the heavy rainfall event, a classification criterion was applied, considering 24 h of precipitation equal to or greater than 50.0 mm and rainfall intervals not exceeding 2 h as a heavy rainfall event. Thus, a total of 428 rainfall events were identified, with 133 events categorized as severe rainfall with 24 h of rainfall exceeding 100 mm, accounting for 28.8% of the total heavy rainfall events.
DTW-HCA, the K-means clustering algorithm and the hierarchical clustering algorithm were applied to cluster 428 rainfall events, respectively. After comparing the results of the different clusters, the optimal number of clusters was determined to be eight. The clustering results are presented in Figure 5.
The results of the DTW-HCA (Figure 5a) indicate that each cluster possessed its own characteristics. In addition, Cluster I had the highest proportion of rainfall events, accounting for 73.1% of the total. Cluster III and Cluster V had the second highest proportions, representing uniform and multi-peak rainfall patterns, respectively. Cluster II had an advanced peak, while Clusters IV, VI and VIII had later peaks, and Cluster VII exhibited a double-peak rainfall pattern.
The results of the K-means clustering algorithm (Figure 5b) revealed that Cluster III and Cluster IV only differed in terms of temporal distribution, and they both actually belonged to the rainfall pattern with a peak in the early period. Furthermore, the K-means clustering algorithm only identified one type of extreme rainfall pattern b (VIII) and classified the other extreme double-peak rainfall pattern a (VIII) into b (V).
The results of the hierarchical clustering algorithm (Figure 5c) indicated that both Cluster II and Cluster VII exhibited the same characteristic of a double peak from the 5th to the 10th hour and were classified as the same rainfall pattern. Cluster III and Cluster VI belonged to rainfall with an advanced peak, where Cluster VI had a complete rain peak, while Cluster III described the entire rainfall event starting from the peak of the rainfall peak. Therefore, they were recognized as the same rainfall pattern.
In general, The K-means clustering algorithm and hierarchical clustering algorithm exhibited limitations in effectively capturing the temporal similarity of time series and identifying extreme rainfall patterns. The clustering results obtained by using the DTW-HCA demonstrated significant differences in the characteristics of the rainfall events. This method successfully distinguishes the most frequent rainfall events and typical extreme rainfall events with higher peaks. Meanwhile, it also indicates that relying solely on a single rainfall pattern input is far from adequate when conducting urban flood simulations. It is crucial to consider the various stages and intensities of rainfall peaks that may occur.

3.1.2. Results of Characteristic Extraction

The characteristics of each cluster were extracted by using the Pilgrim and Cordery rainfall distribution method, and the results are shown in Figure 6. The rainfall pattern of Class I represents rainfall events with peaks concentrated in the early–middle period. Class II is characterized by a concentrated peak in the early period, with the precipitation ratio in the first 8 h accounting for 72.8% of a total rainfall event. Class III exhibited a uniform rainfall pattern, with a difference of 11.8% between the maximum and minimum hourly precipitation. Class IV comprises rainfall events with peaks concentrated in the later period, and the precipitation ratio from the 15th to 22nd hour accounts for 94.4%. Class V represents multi-peak rainfall patterns, with the sum of the precipitation ratio at the 6th, 10th and 15th hours accounting for 58.1%. Class VI is characterized by a double-peak rainfall pattern with a peak in the later period, where the precipitation of the first peak was smaller than that of the second peak, but the maximum hourly precipitation of the first peak was larger than that of the second peak. Class VII also exhibited a double-peak rainfall pattern, with the maximum rainfall occurring within the three consecutive hours accounting for 82.1%. The rain peak of Class VIII occurred later and had the highest hourly precipitation ratio, accounting for 39.5%.

3.2. Flood Simulation and Construction of Rainfall Patterns

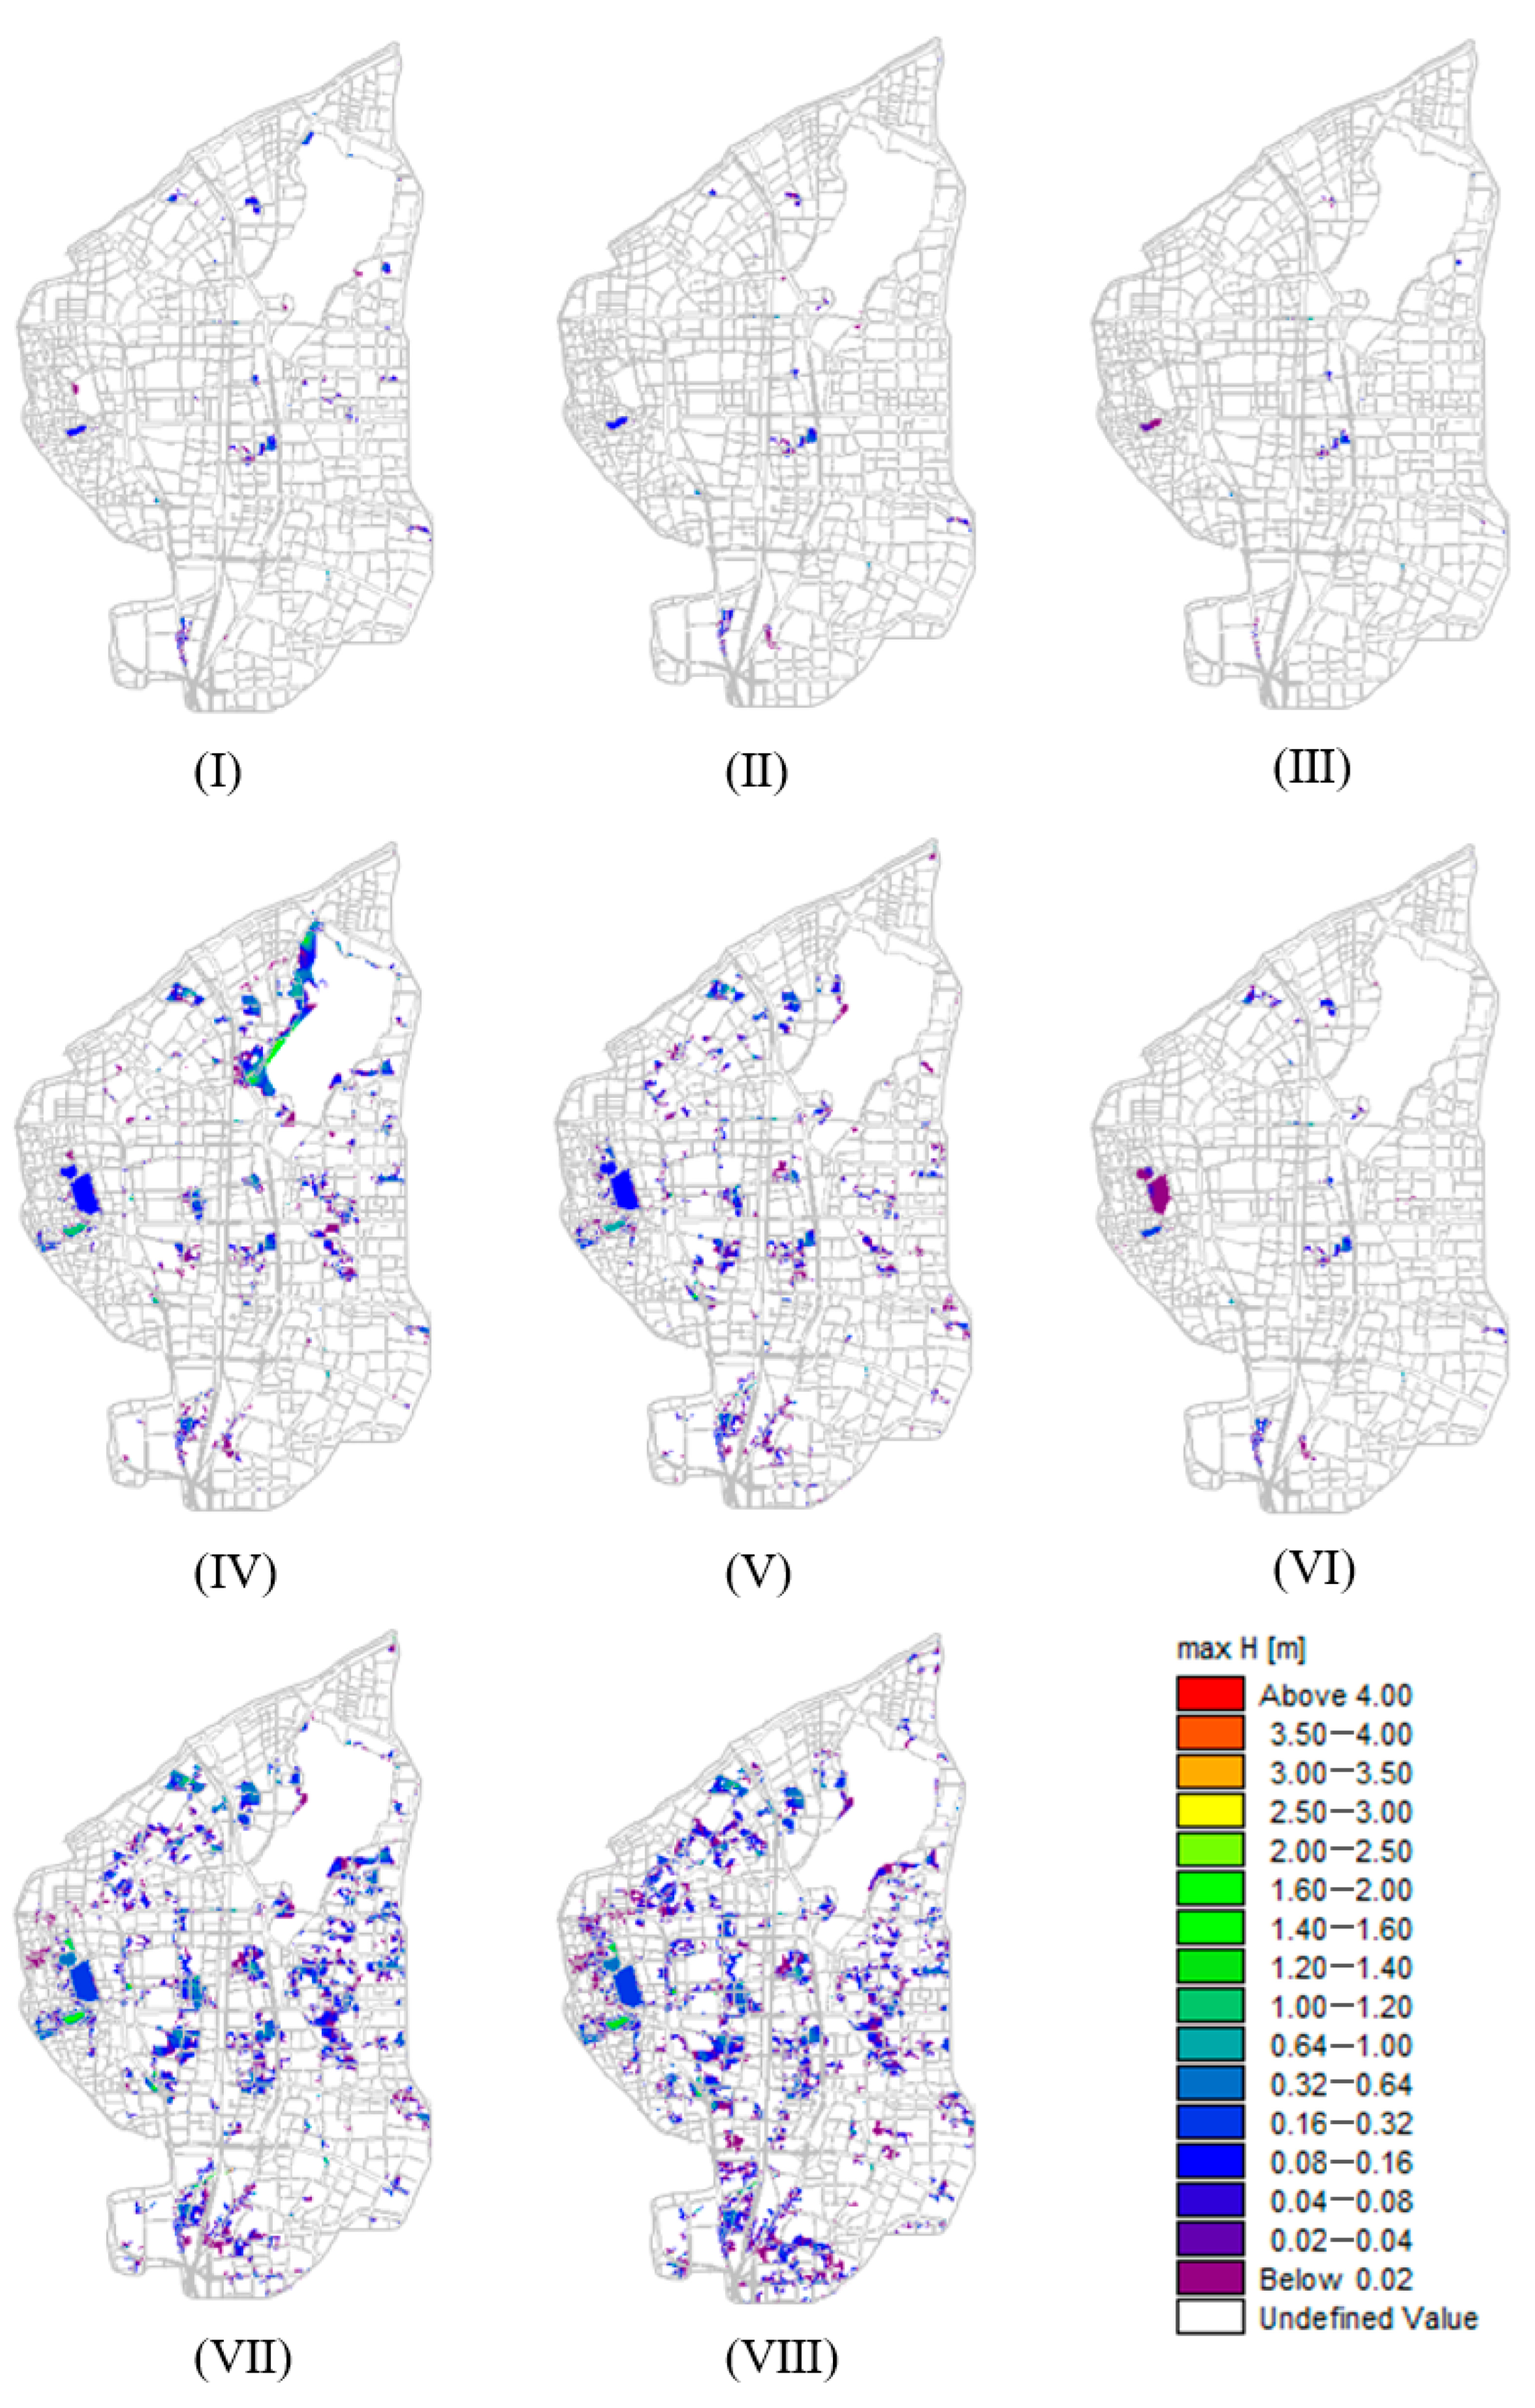
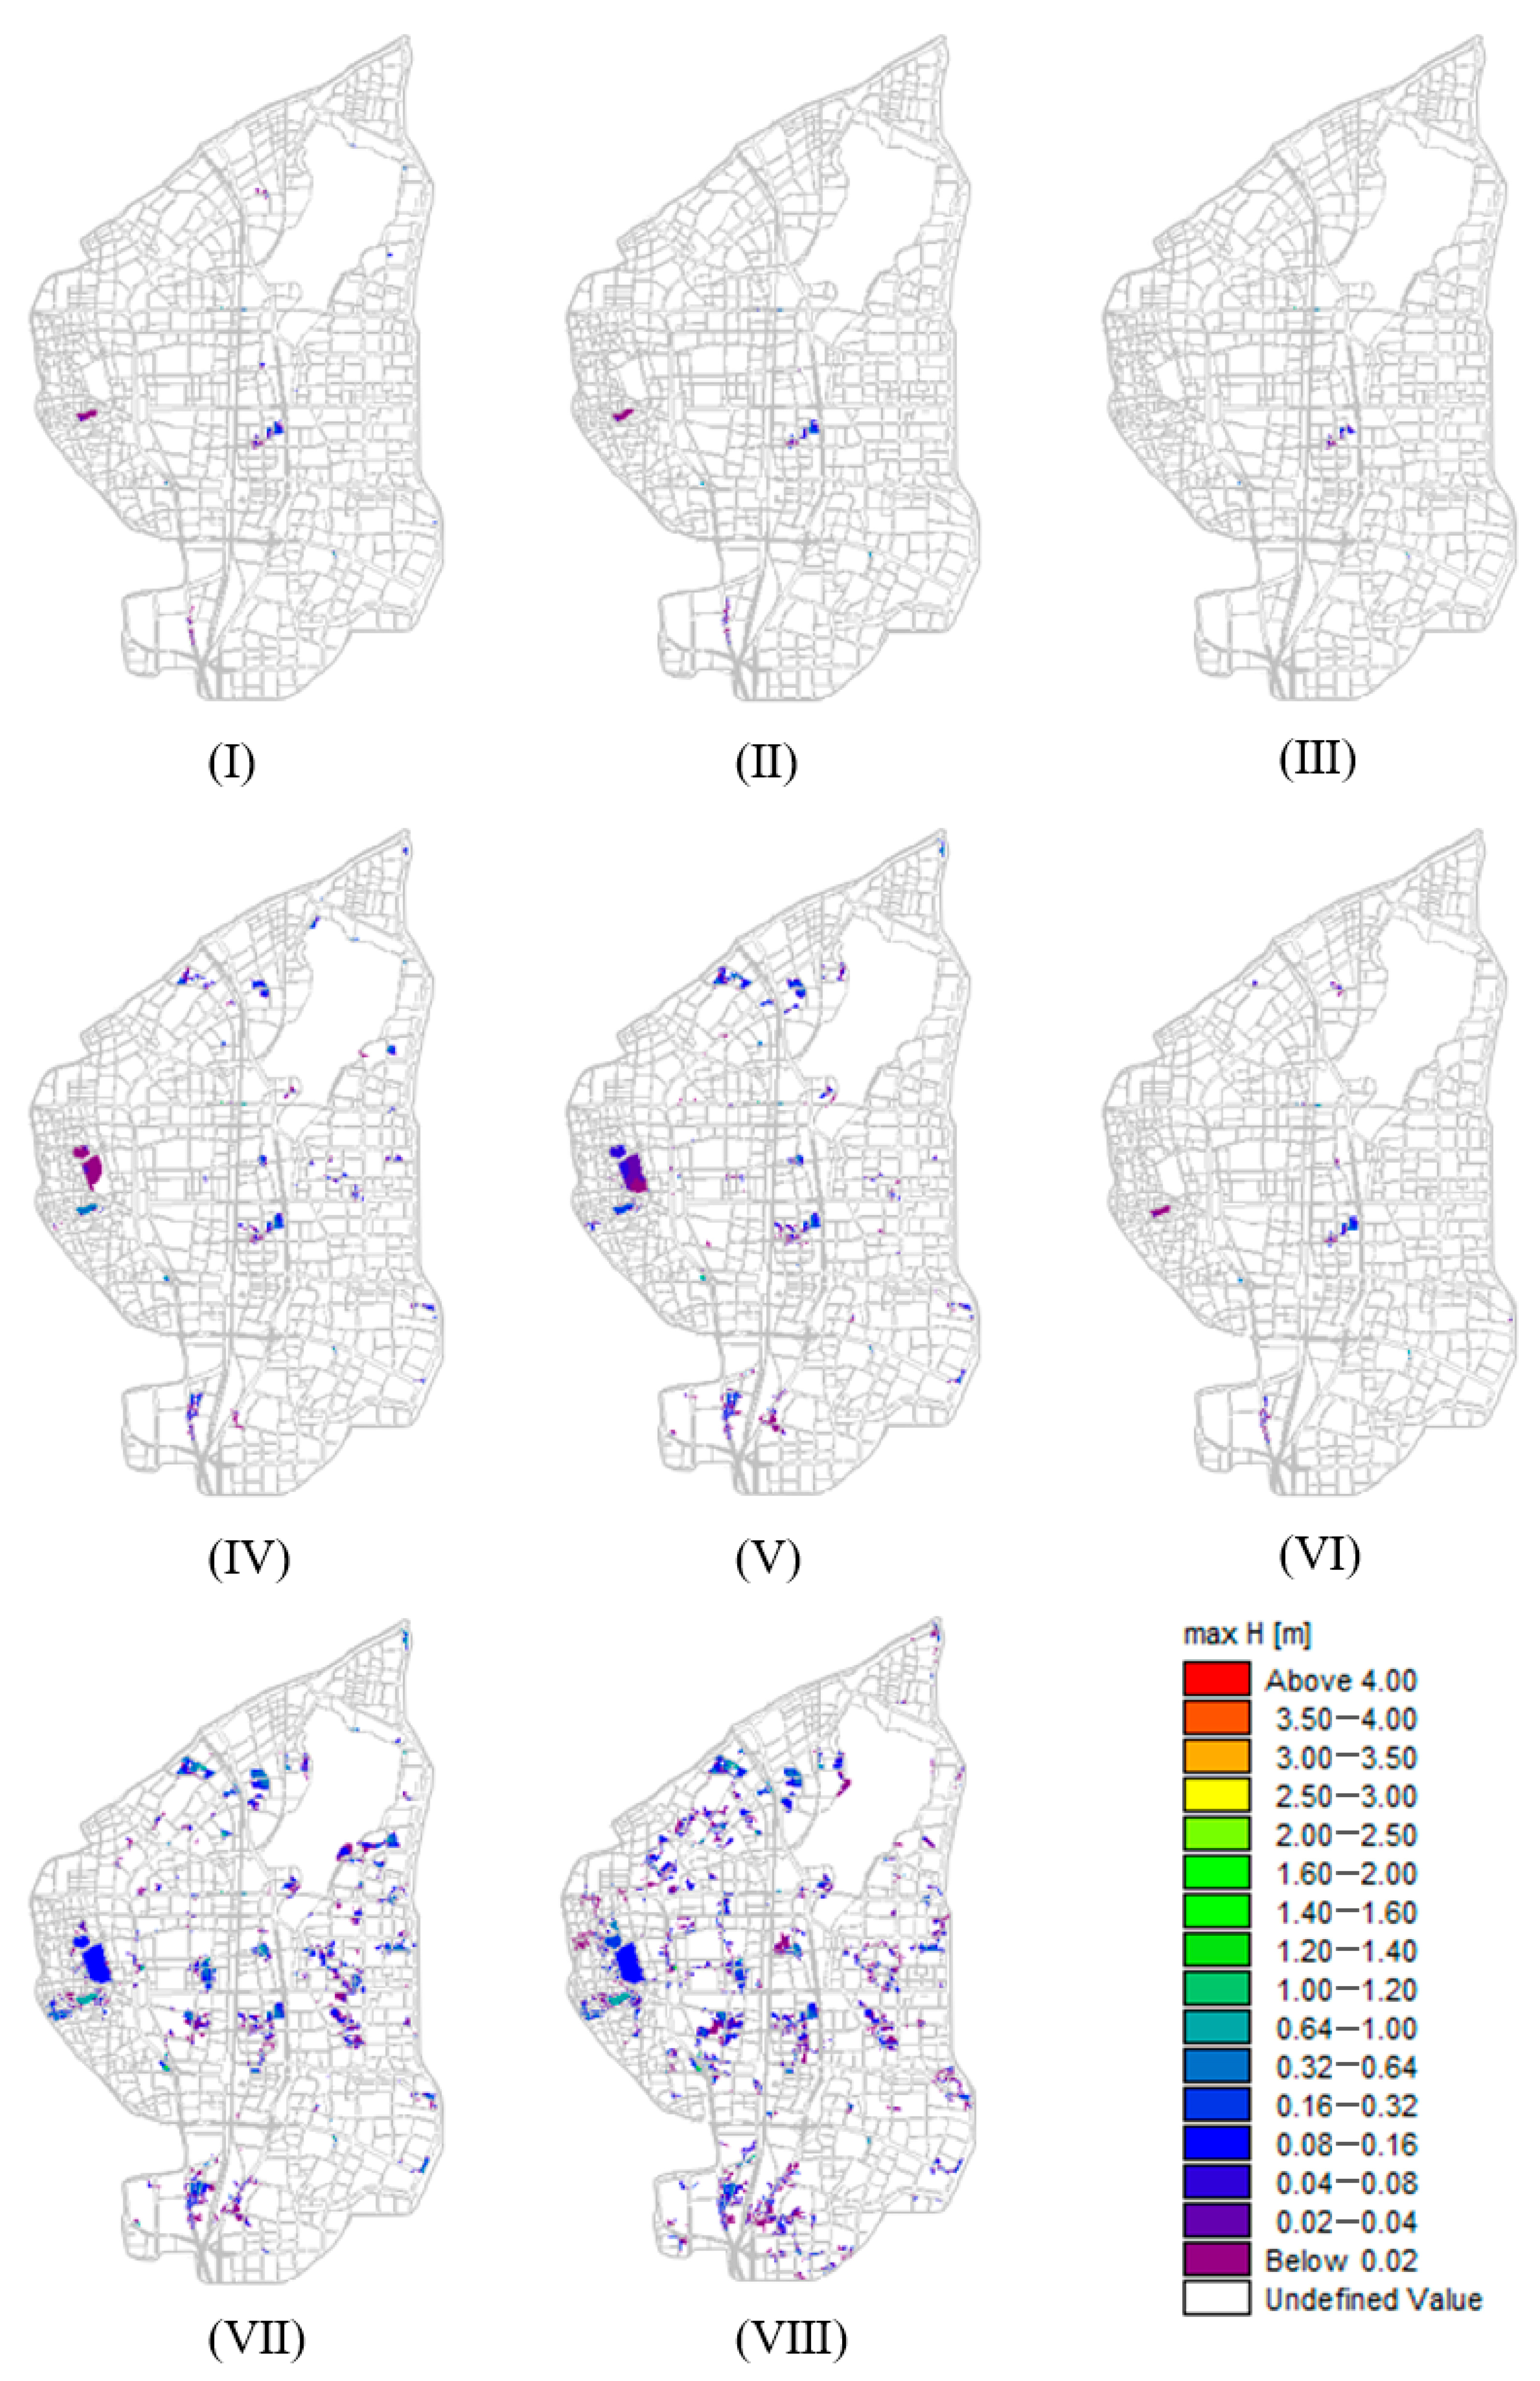
3.2.1. Analysis of the Simulation Results and Construction of a Designed Rainfall Pattern

The MIKE model was used to simulate eight rainfall patterns combined with a once-in-20-year precipitation (223.6 mm). The simulation results of urban waterlogging are shown in Figure 7. The Class II and III rainfall patterns resulted in the smallest waterlogged areas and depths. This is because the rainfall peak of Class II occurred earlier, discharging most of the stormwater before the convergence process. The Class III rainfall pattern was relatively uniform, allowing stormwater to penetrate into the soil easily, without rapidly accumulating on the surface as runoff, resulting in a smaller waterlogged area. Additionally, the Class VIII rainfall pattern mainly occurred in the later period, with approximately 40% of the total precipitation within one hour. As a result, it caused the widest flooded area and the deepest water accumulation.
According to Figure 8 and Table 1, the water level and discharge exhibited similar trends. Among them, the Class III rainfall pattern shows a relatively uniform pattern, which allowed stormwater to flow and discharge more steadily in river channels and drainage systems, resulting in the lowest maximum water level and maximum discharge. On the other hand, the Class VII rainfall pattern, characterized by a double-peak pattern, saturated the soil after the first intense rainfall, and the subsequent heavy rainfall accelerated surface runoff, leading to the maximum values of maximum water level and maximum discharge out of the eight rainfall patterns.
Furthermore, the comprehensive rainfall pattern (once in 20 years) (Figure 9) deduced by Nanchang’s water conservancy department [35] was input into the MIKE model for simulation, and the results are the following: the maximum waterlogged area was 3.61 km2 and the maximum waterlogged depth was 2.63 m. At monitoring point a, the maximum water level reached 18.13 m and the maximum discharge was 246 m3. At monitoring point b, the highest water level reached 18.66 m and the maximum discharge was 159.9 m3. These results indicate that the comprehensive rainfall pattern caused a smaller waterlogged area and depth compared to the Class VIII rainfall pattern. The water level and discharge were also lower compared to the Class VII rainfall pattern, which demonstrates the testing capability of the comprehensive rainfall pattern on urban drainage and water conservancy facilities. However, similar to the Class IV and VIII rainfall patterns, the comprehensive rainfall pattern is characterized by a single peak occurring later in the rainfall event, which accounted for only 2.6% of all rainfall events. As the designed rainfall pattern for Nanchang City, it lacks representativeness. On the other hand, the Class I rainfall pattern accounted for the highest proportion, 73.12%, which could represent the majority of rainfall scenarios. Therefore, it was chosen as the DRP.

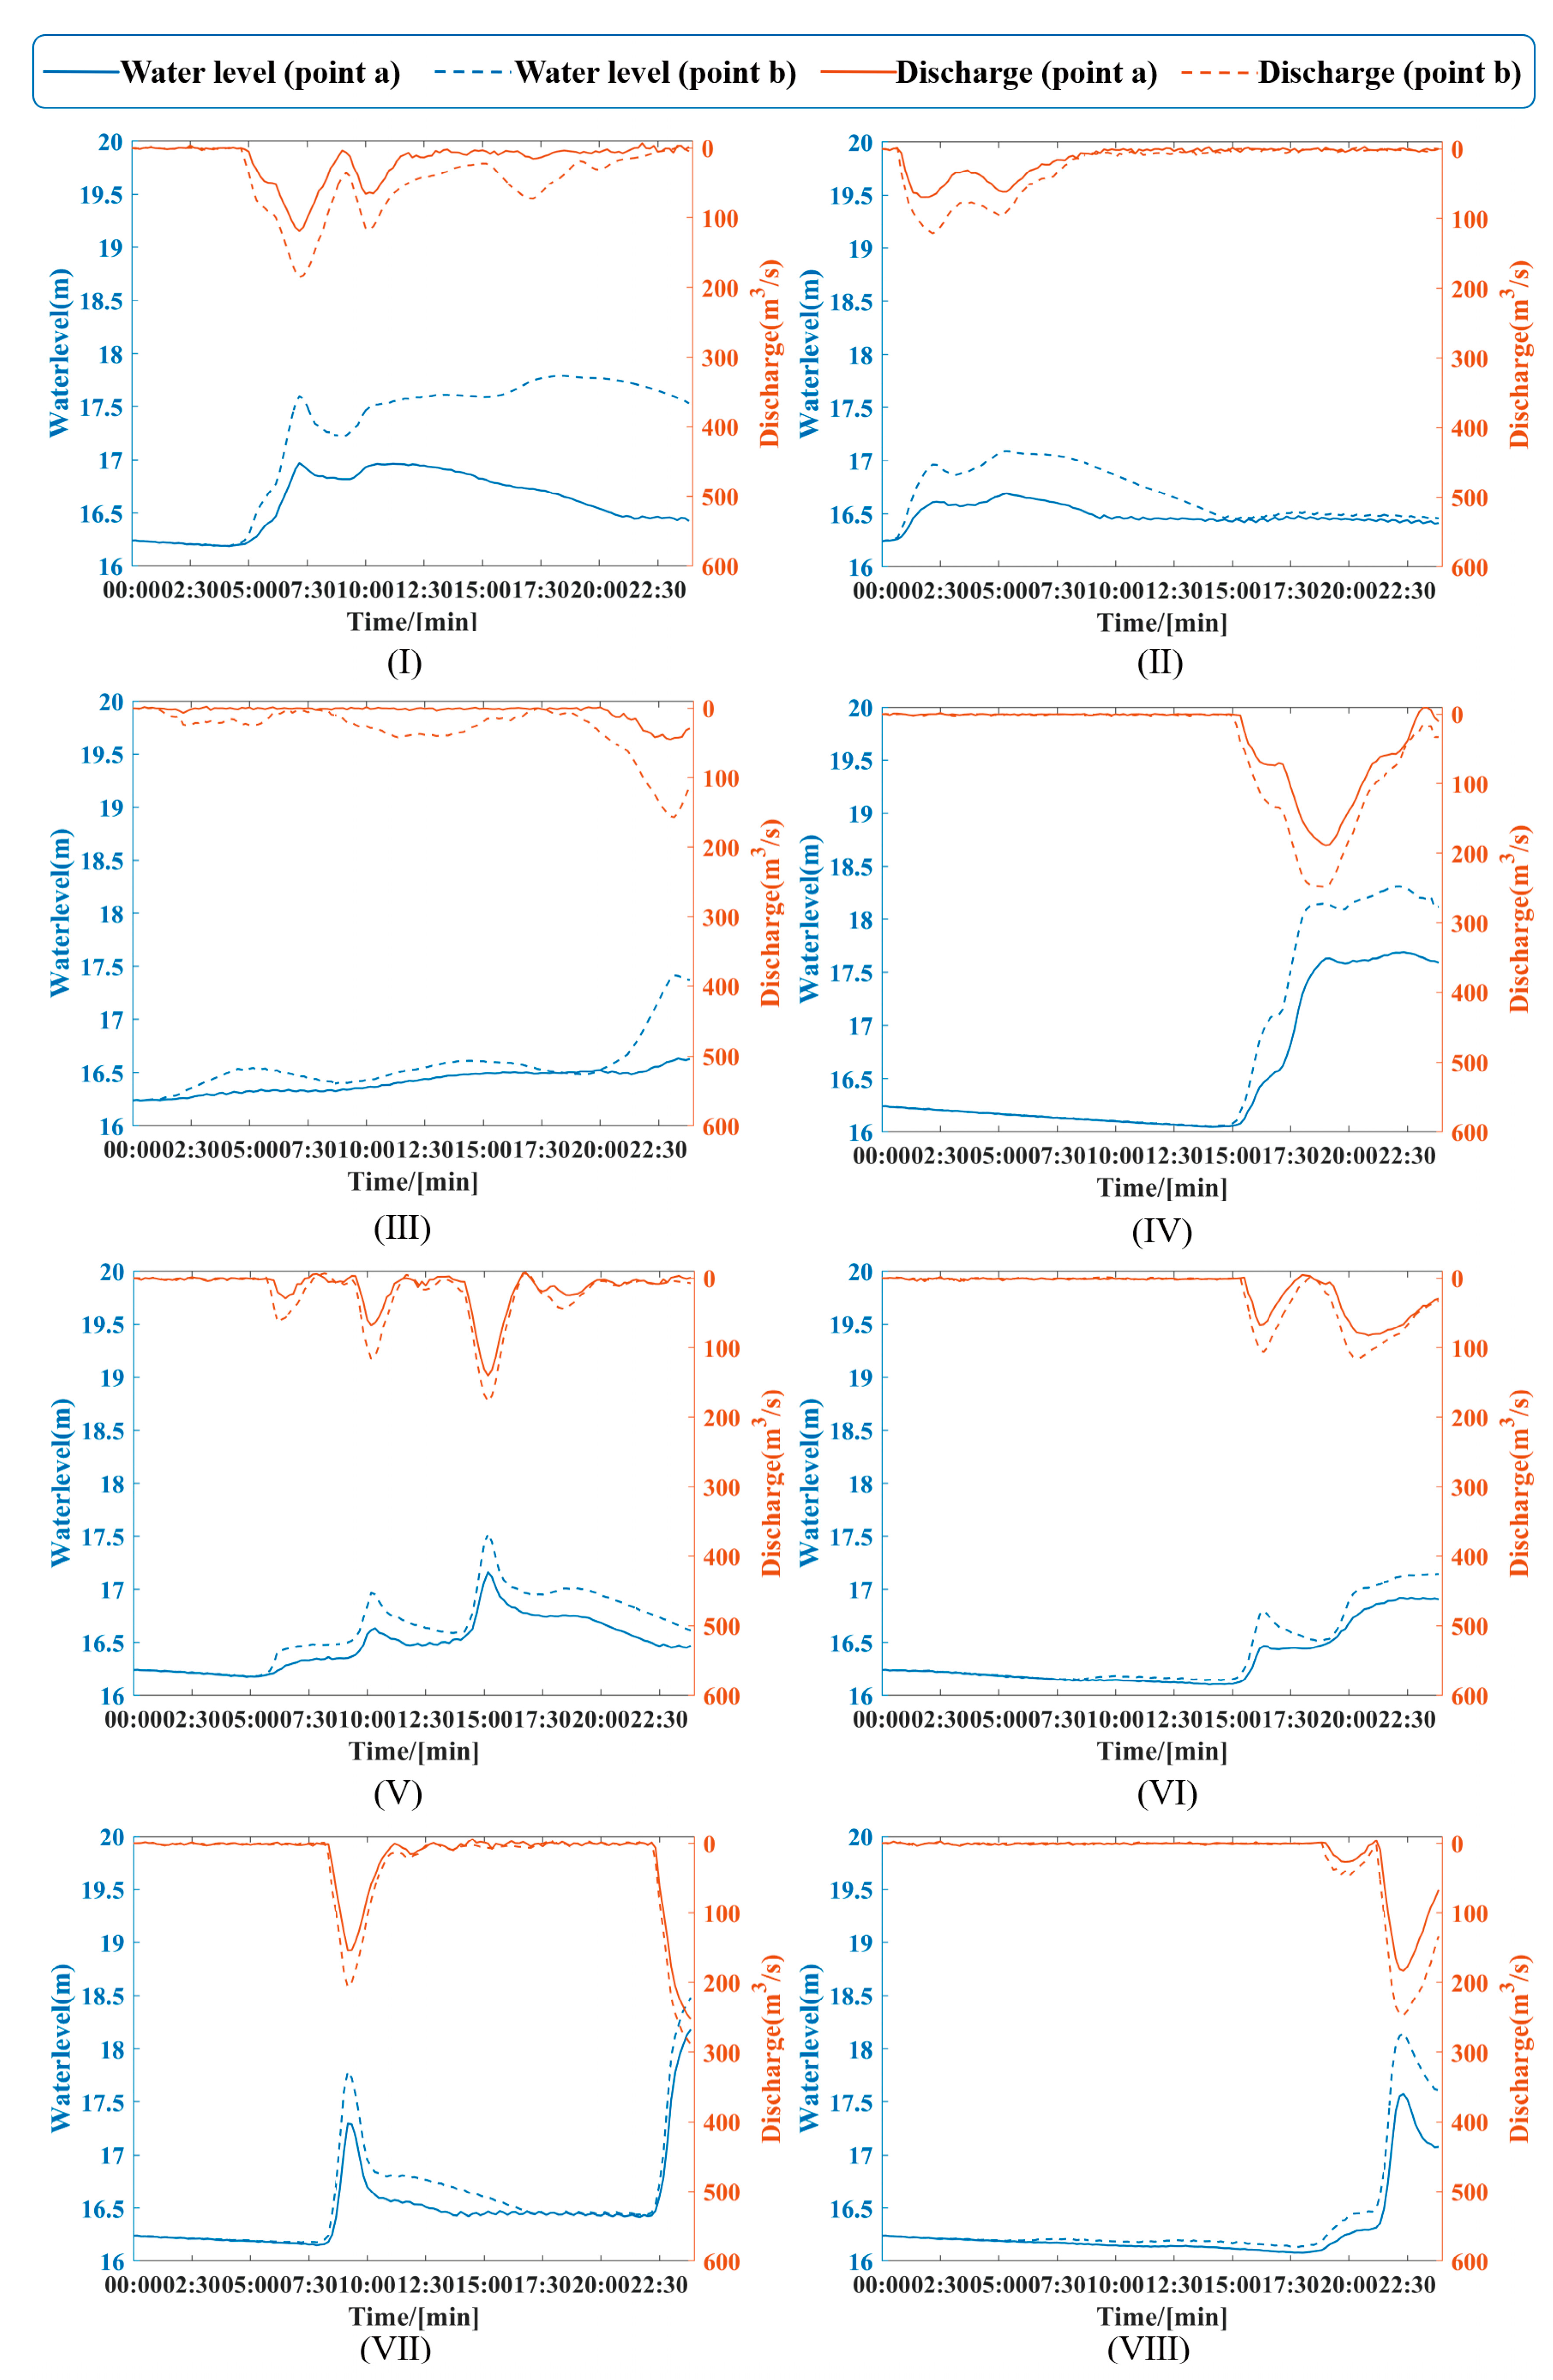
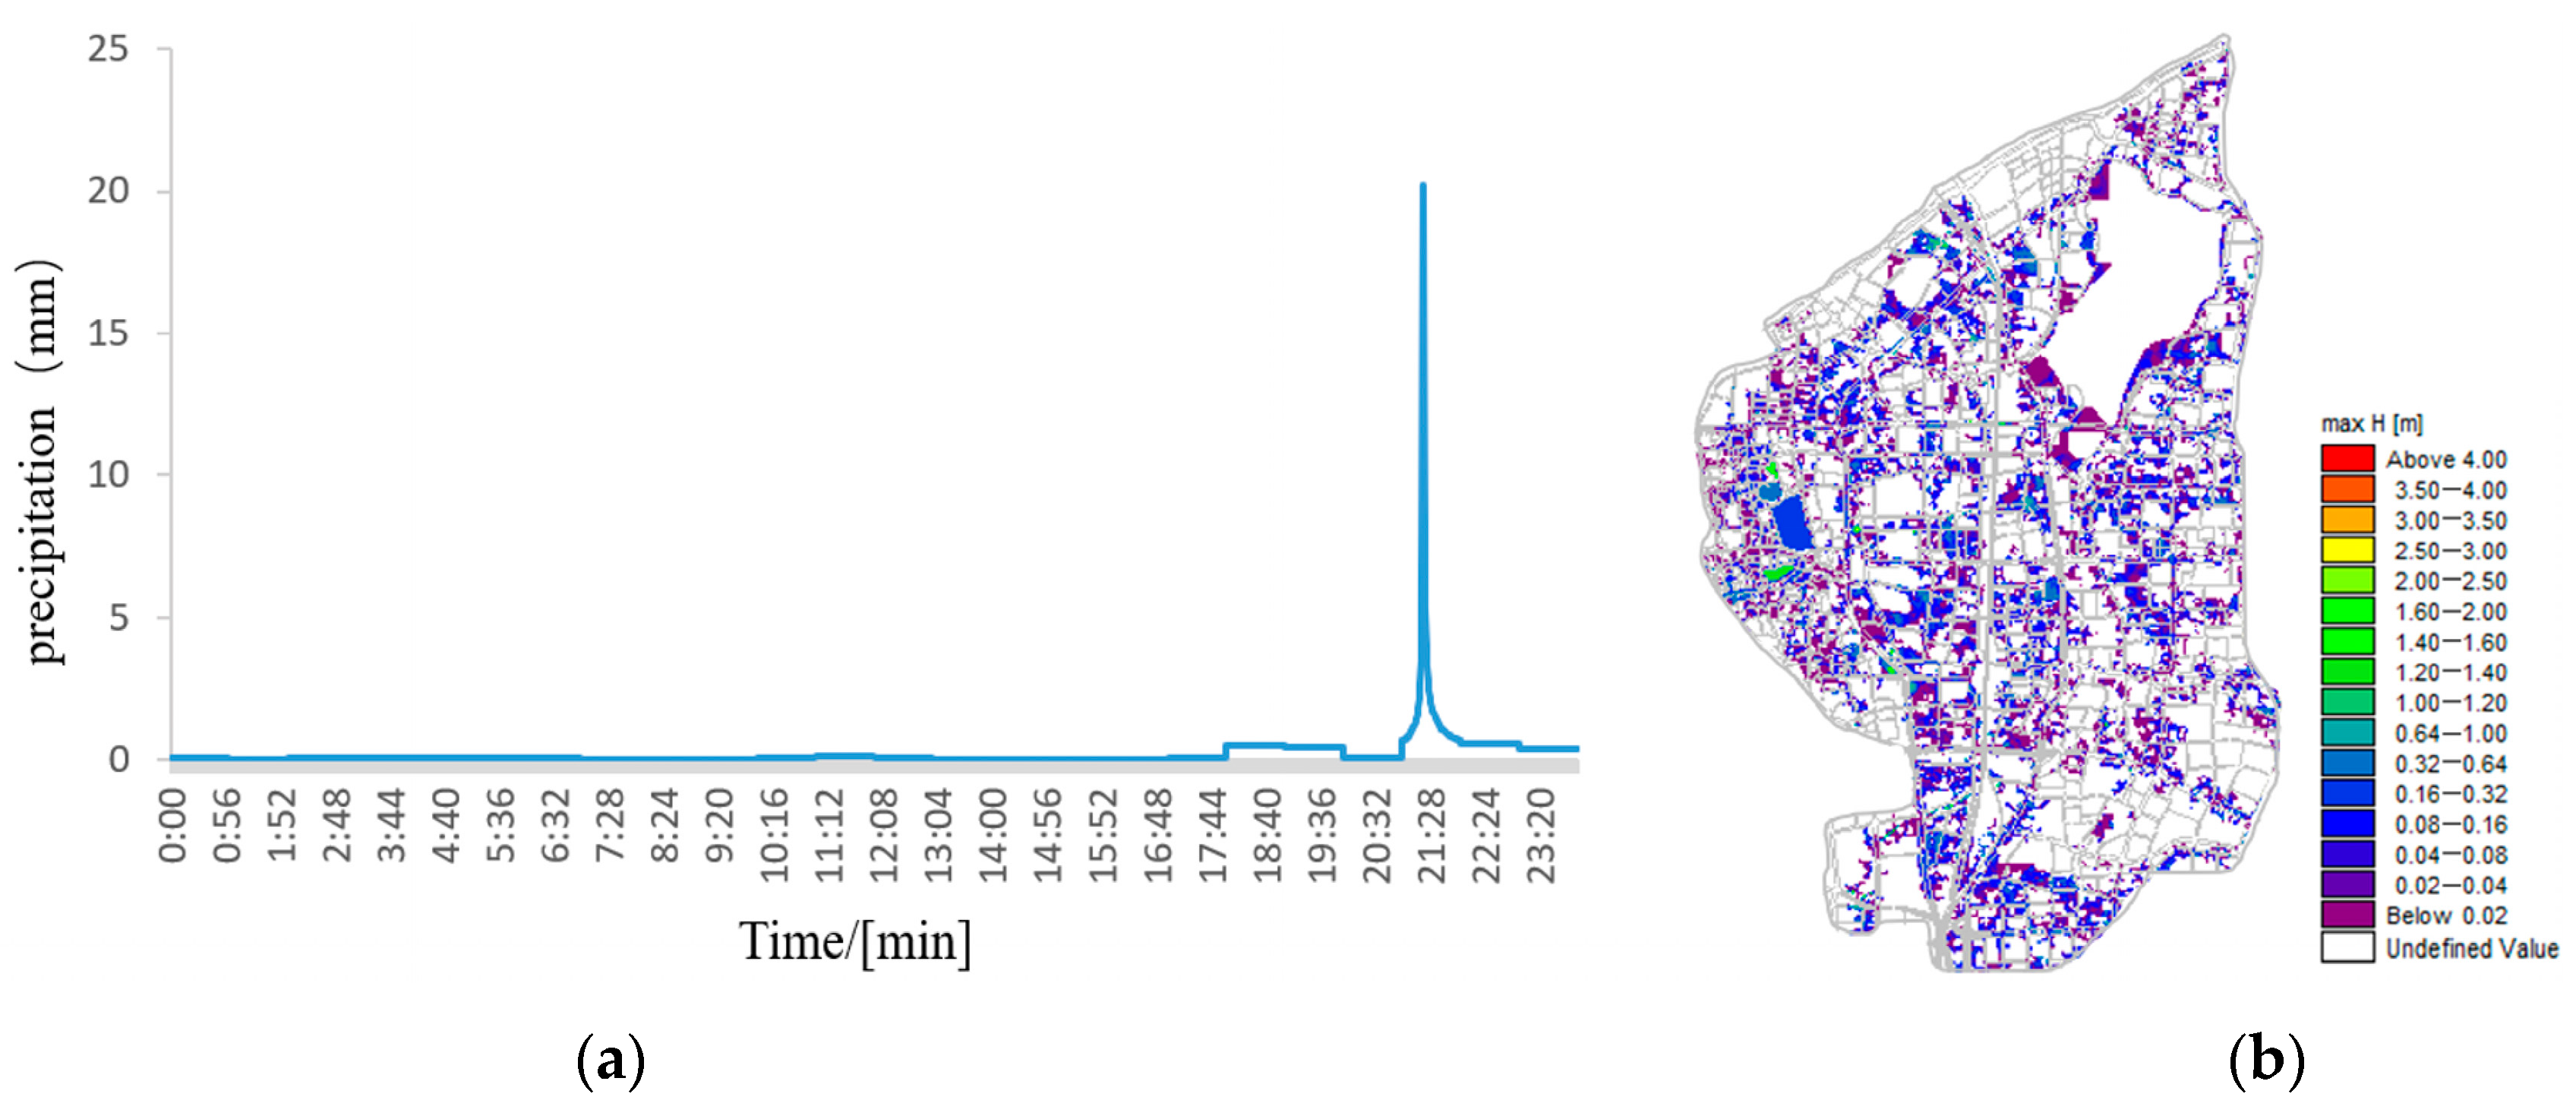
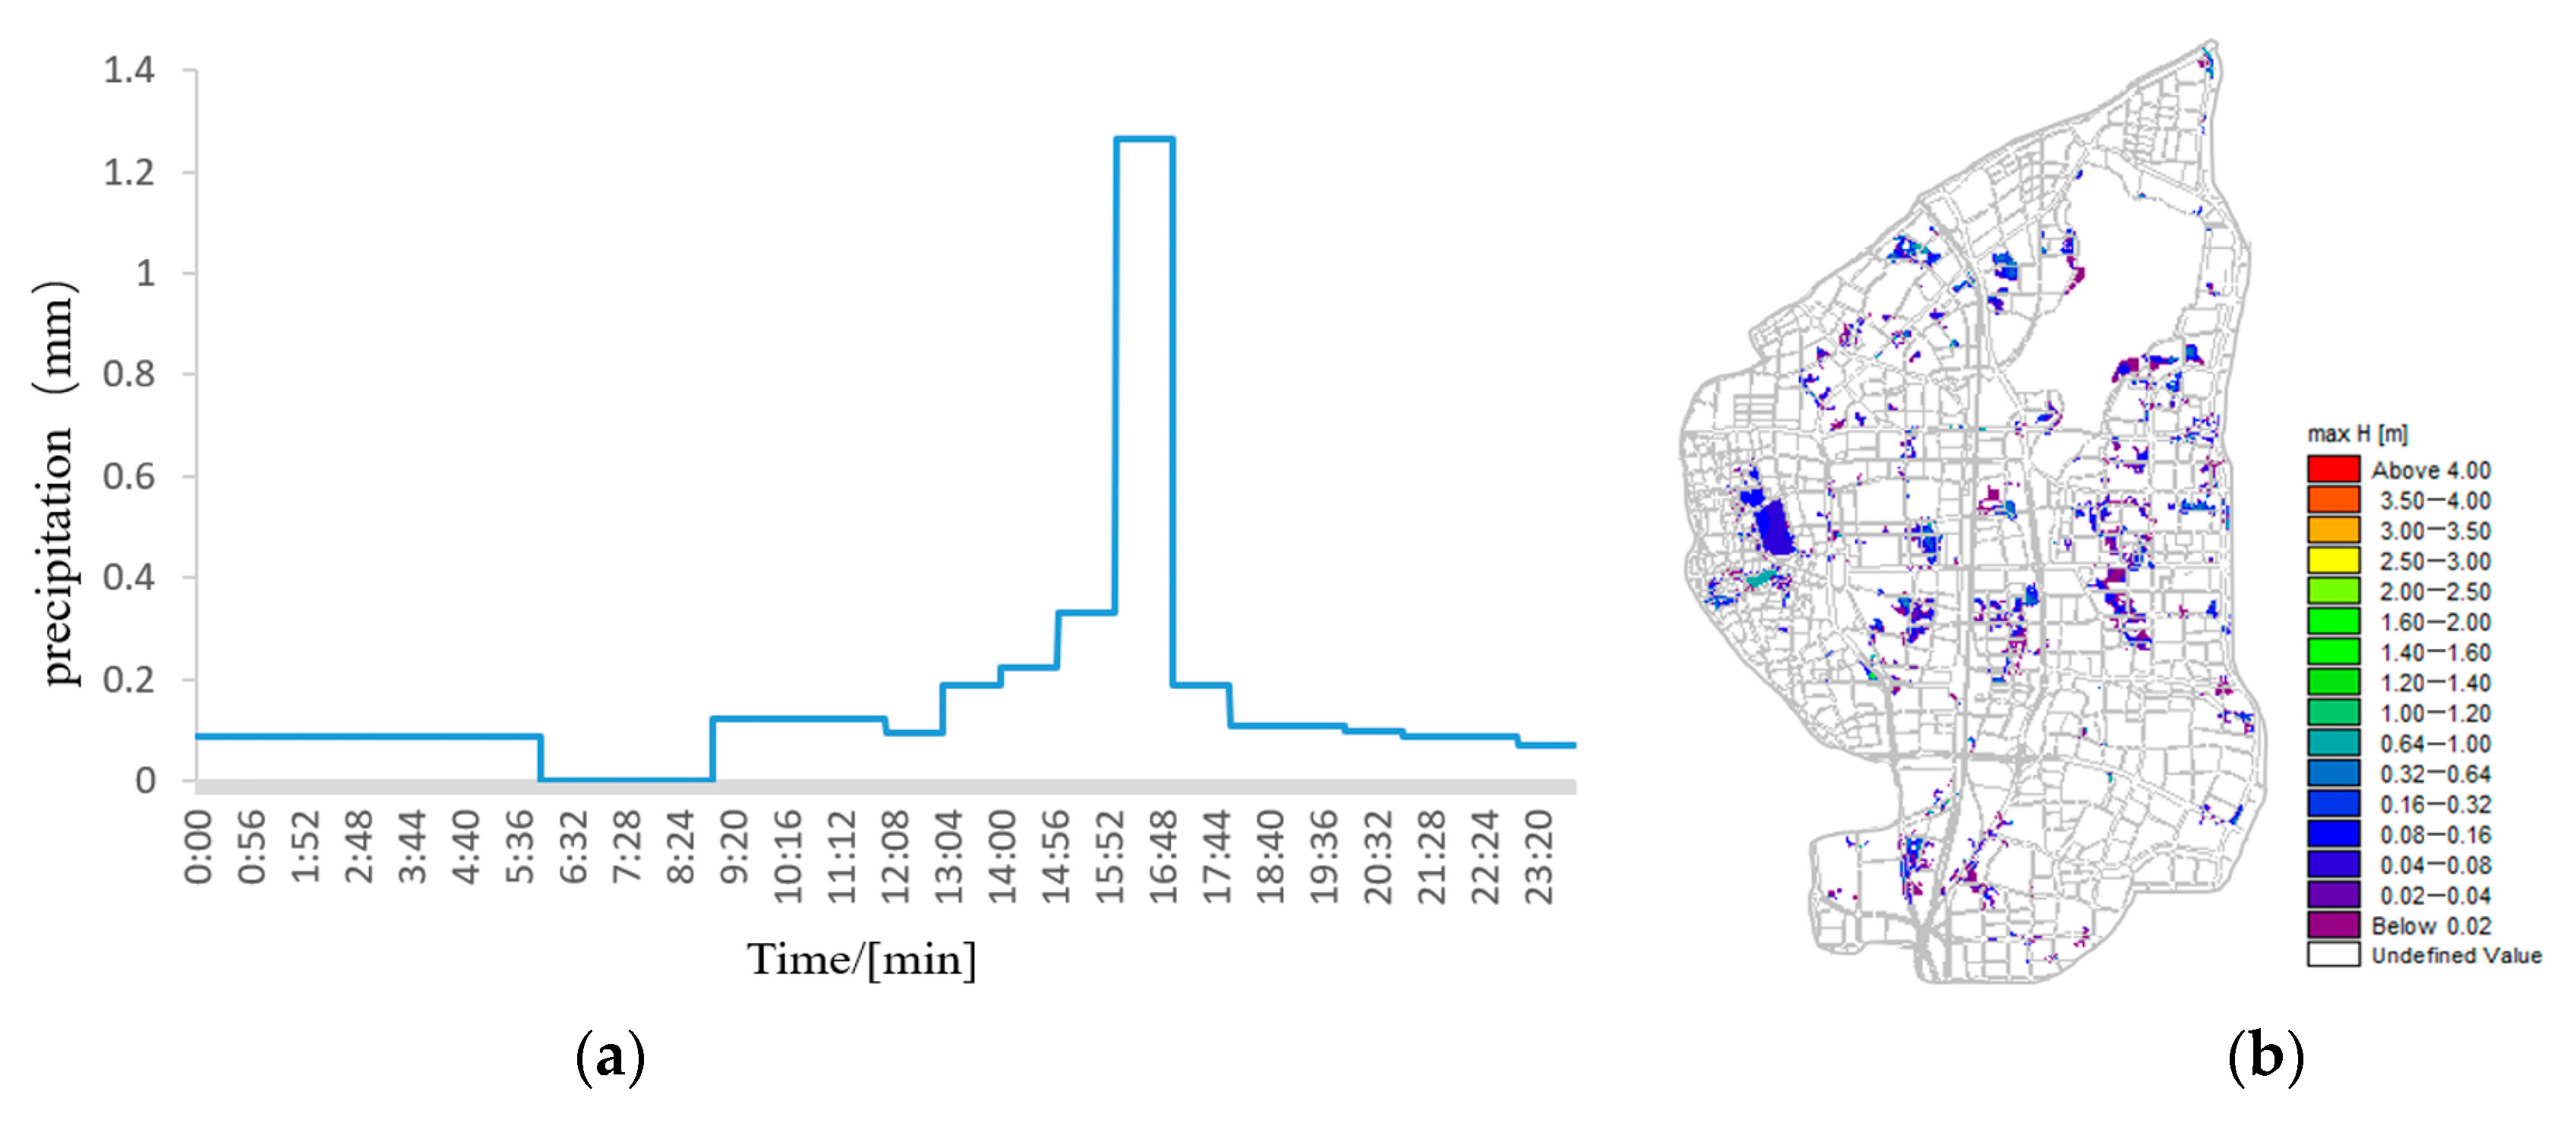
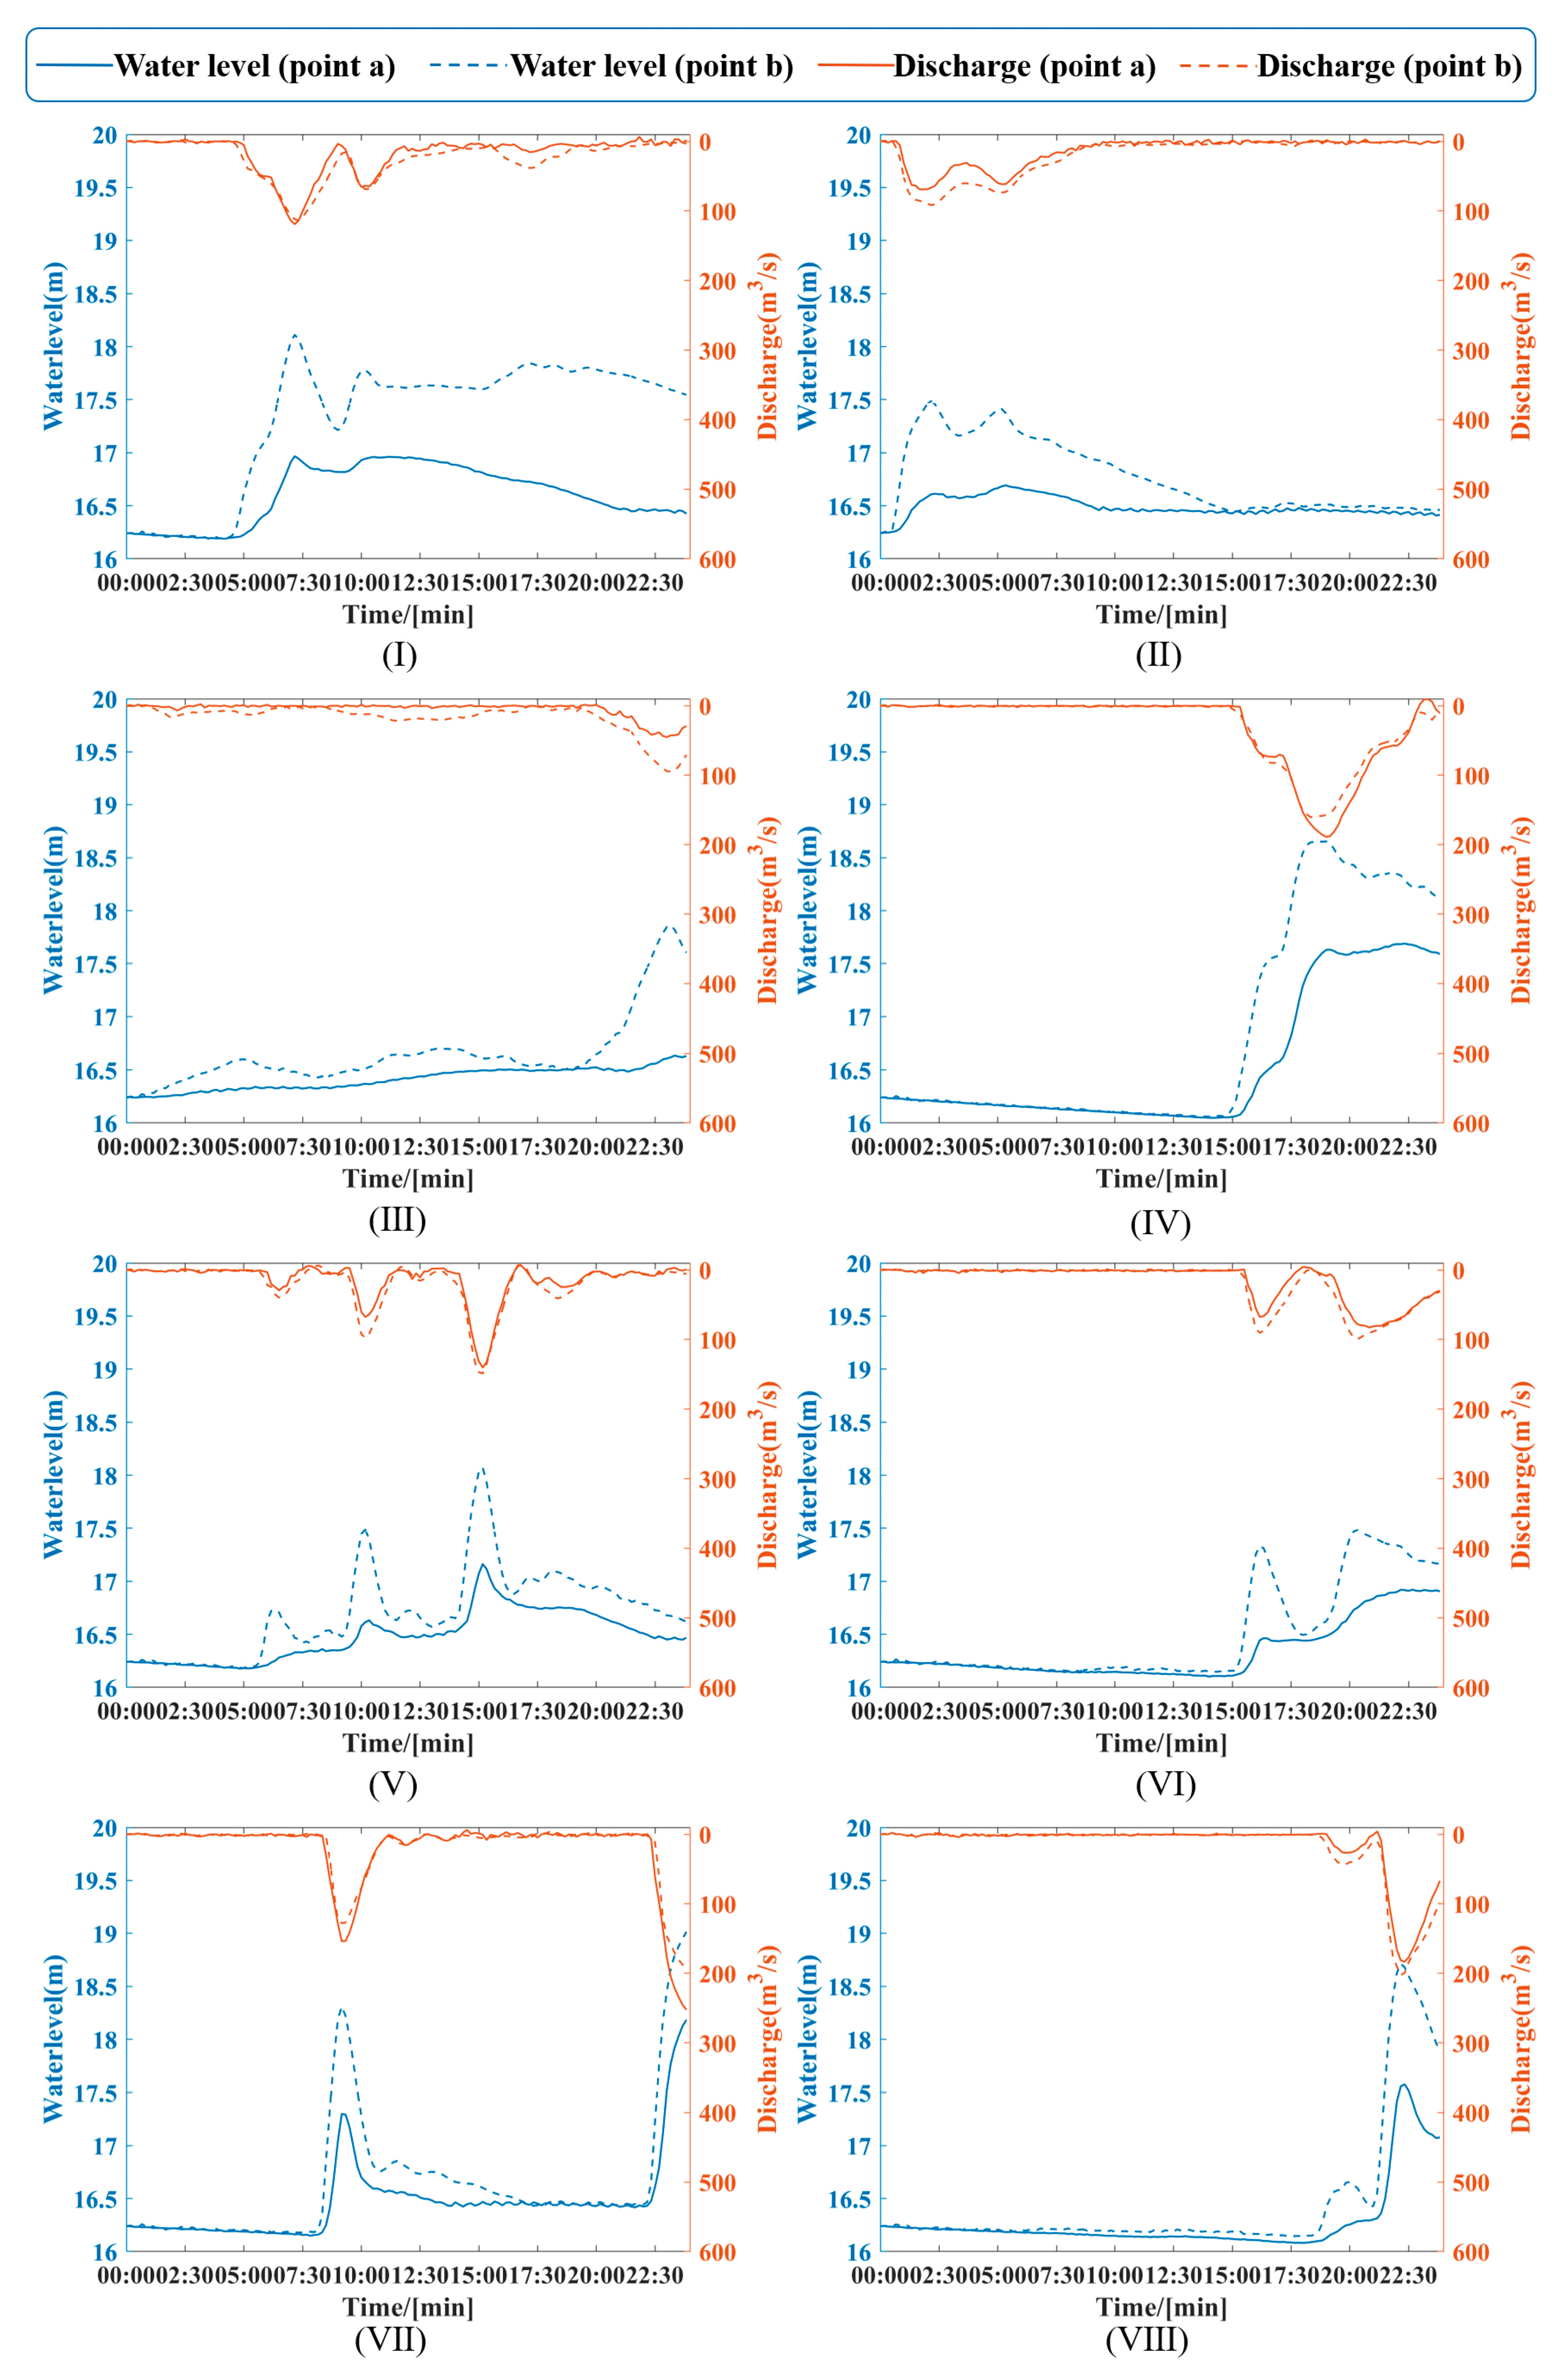
3.2.2. Analysis of the Simulation Results and Construction of a Rainfall Pattern for Verification

(1)
The Construction of an ERPUDFV
The MIKE model was used to simulate eight rainfall patterns combined with a once-in-100-year precipitation (287.4 mm). The simulation results of urban waterlogging are shown in Figure 10 and Table 2, indicating that the Class II and III rainfall patterns still resulted in the smallest waterlogged depth and areas. However, the Class VII rainfall pattern now caused the maximum water depth. This might have been due to the extremely high rainfall in the last two hours of Class VII’s rainfall pattern, leading to deeper water accumulation in certain areas. Nevertheless, based on the overall picture in Figure 8, the areas with significant water accumulation depth are not prominent. Therefore, the area of urban waterlogging was chosen as the primary criterion for constructing the ERPUDFV. Additionally, for Class IV’s rainfall pattern, due to the concentrated rainfall in the last eight hours, which accounted for 94.4% of the total rainfall, the water level in Qingshan Lake increased rapidly, reducing its storage capacity and resulting in severe waterlogging in the western underground tunnel.
The maximum one-hour rainfall process of Class VIII’s rainfall pattern and the comprehensive rainfall pattern were refined by using the Chicago rainfall pattern, so as to obtain the ERPUDFV and composite rainfall pattern (Figure 11 and Figure 12). The simulation results indicated that under the ERPUDFV, the maximum water depth in the city increased to 3.65 m and the waterlogged area was 17.8 km2. For the composite rainfall pattern, the maximum water depth was 3.93 m and the waterlogged area was 16.33 km2. Among them, the areas with water depths below 0.32 m for the ERPUDFV and the composite rainfall pattern were 16.7 km2 and 15.4 km2, accounting for 93.8% and 94.2% of the total waterlogged area, respectively. Overall, the ERPUDFV exhibited stronger drainage capacity for urban drainage facilities. Therefore, when dealing with drainage issues in Nanchang City, it is advisable to consider rainfall patterns with a delayed peak, as this often leads to severe waterlogging problems.
(2)
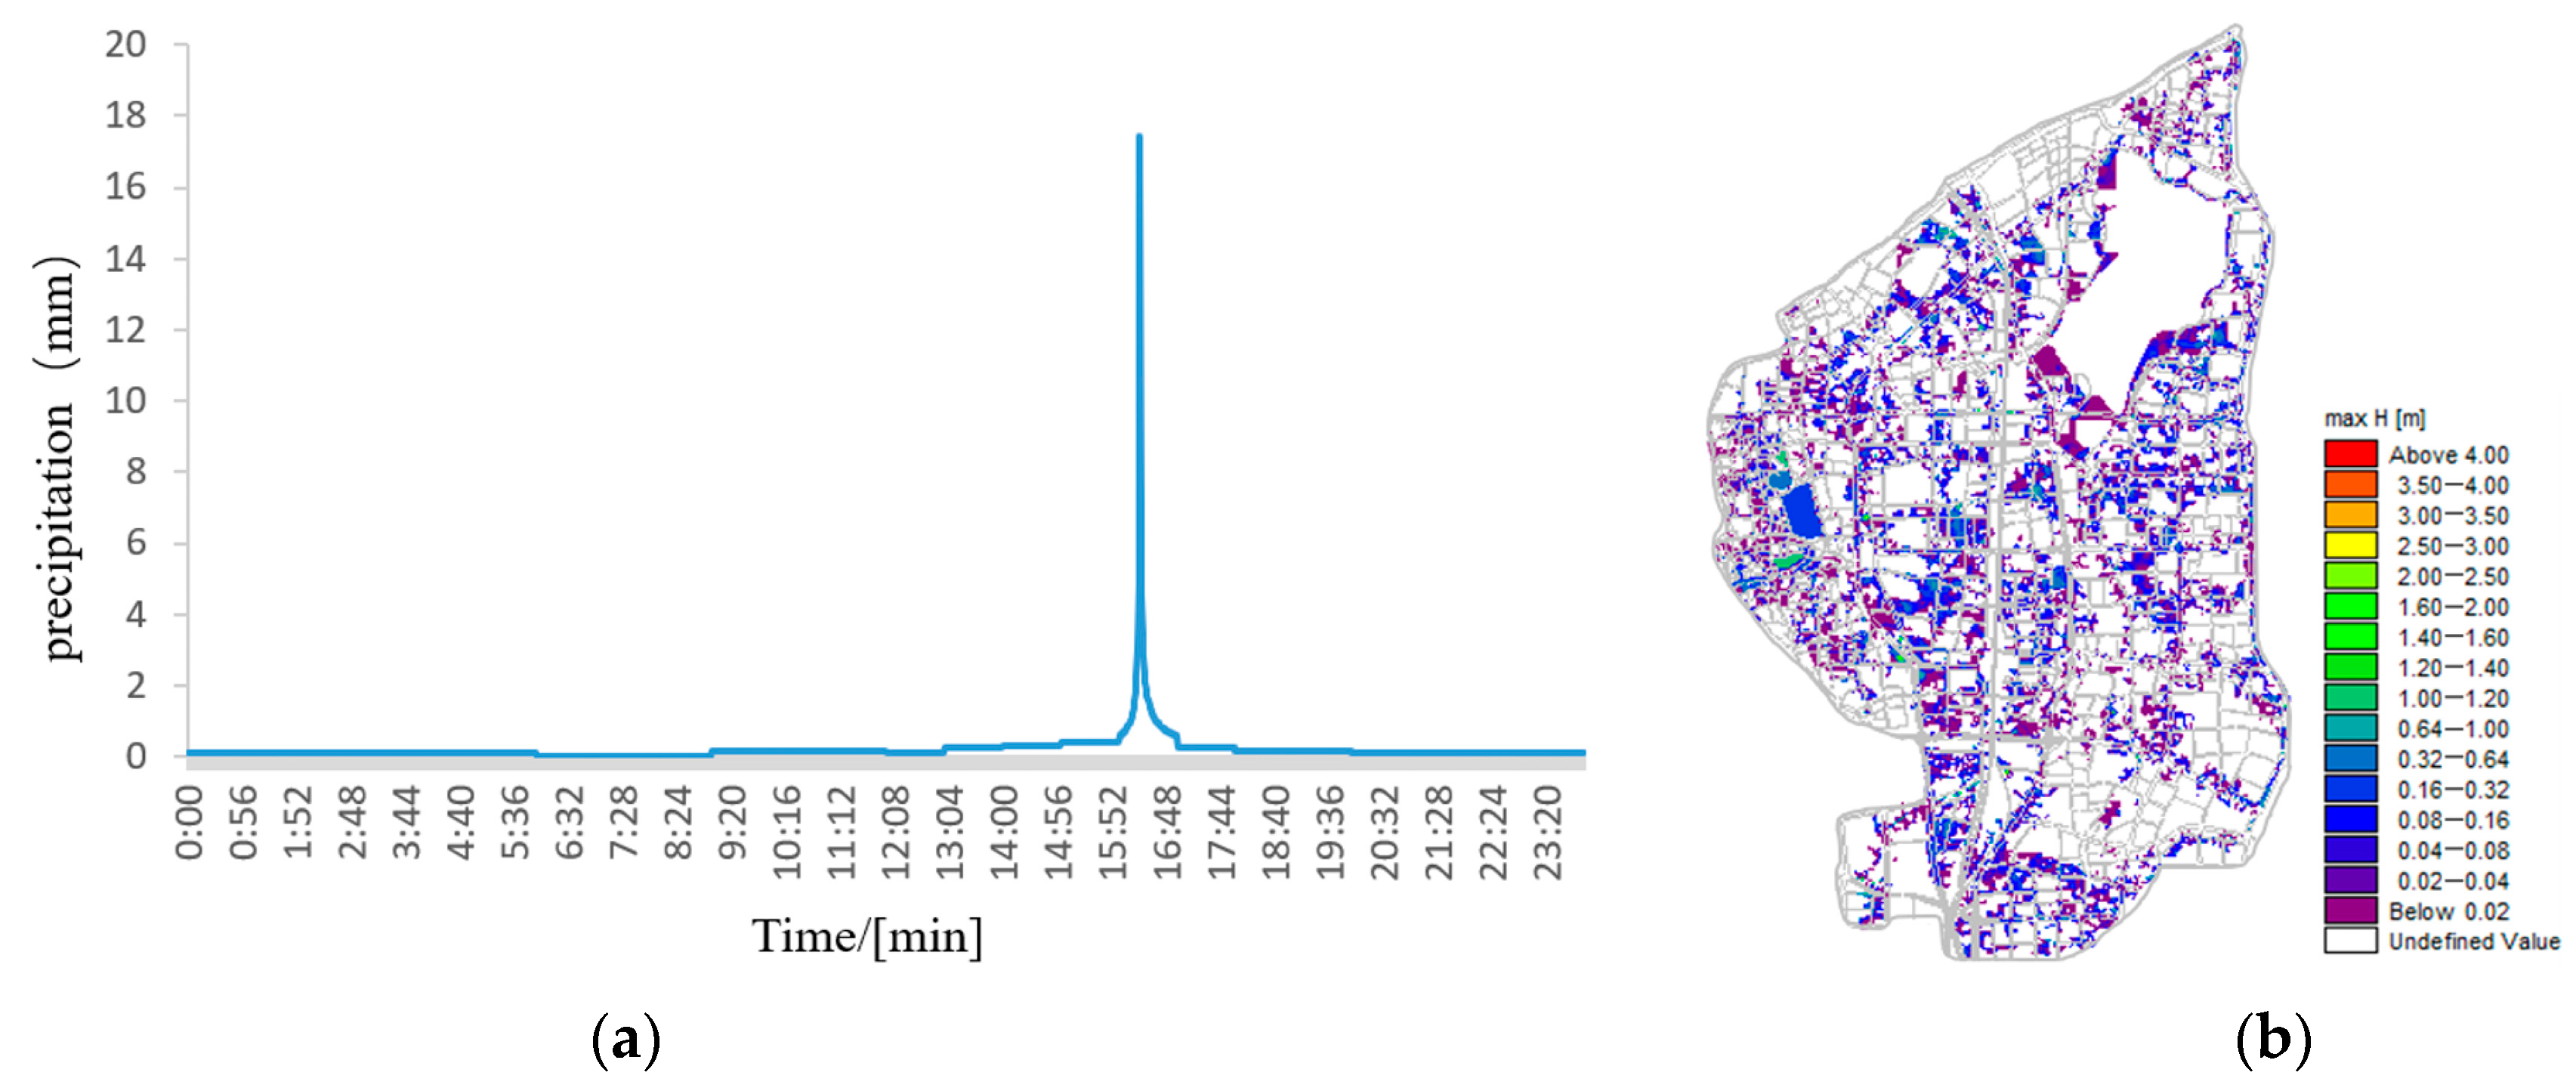
The Construction of an ERPWCFV
The simulation results of water level and discharge are shown in Figure 13 and Table 3, indicating that the rainfall pattern of Class III demonstrated a relatively uniform distribution, which allowed for the smooth and consistent discharge of rainwater in the drainage network and resulted in minimal impacts on river discharge and water levels. The rainfall pattern of Class II exhibited concentration in the early stage, as the soil moisture content was relatively low during this period and possessed strong permeability, which allowed for the rapid absorption of rainfall, reducing the surface water retention time and consequently minimizing its impact on river discharge and water levels. On the other hand, the rainfall pattern of Class I was more concentrated in the middle phase, with a slightly earlier peak. Although the water level caused by Class I was not significantly different from the two patterns mentioned earlier, the maximum observed discharge was much higher. The Class IV, VII and VIII rainfall patterns exhibited concentrated peaks in the later period, characterized by intense rainfall occurring when the soil moisture was close to saturation, which led to runoff and complex drainage flow, resulting in a significant increase in river and lake water levels. Among them, Class VII’s rainfall pattern had the greatest impact on water levels and discharge in rivers. Although the rainfall pattern of Class VI was concentrated in the later phase as for Class IV, it is a multi-peak rainfall pattern, which provides some buffering time for the drainage system. Therefore, it had a slightly weaker impact on the water levels and discharge of rivers.
In conclusion, due to the extreme water levels and discharge simulated by Class VII’s rainfall pattern, it is considered as the ERPWCFV. Therefore, when dealing with watershed drainage issues in Nanchang City, it is recommended to consider bimodal rainfall patterns (one peak in the middle period and another peak in the later period), which can lead to rivers or lakes reaching their alert water levels and discharge.

4. Conclusions

For this paper, we obtained eight rainfall patterns based on the DTW-HCA and the Pilgrim and Cordery rainfall distribution method and simulated the impacts of each rainfall pattern on a municipal system and water conservancy system using the MIKE model. The main conclusions are the following:
  • The DTW-HCA, K-means algorithm and hierarchical clustering algorithm were used to cluster 428 rainfall events in the urban area of Nanchang City. The results indicate that the DTW-HCA outperformed the other two algorithms in identifying temporal similarities among time series.
  • A designed rainfall pattern (DRP) and two rainfall patterns for verification (ERPUDFV and ERPWCFV) are proposed by flood simulation. Among them, the DRP had the highest proportion, accounting for 73.1% of the total, which could provide a reference for the design of municipal and water conservancy facilities. The ERPUDFV caused the most serious urban waterlogging, which could provide a reference for the verification of municipal facilities. The ERPWCFV resulted in the highest water levels and discharge at monitoring points, posing significant risks to water conservancy infrastructures, which could provide a reference for the verification of water conservancy facilities.
In summary, this paper introduces a more region-specific method for constructing rainfall patterns. Although using this method requires rebuilding flood models to adapt to different study areas, which can be cumbersome, and the accuracy of the final results is limited by the precision of the models, this method is still universal. The results can serve as a reference for designing extreme rainfall patterns and provide guidance for the coordination of urban drainage and water infrastructure development.

Author Contributions

All authors contributed to the study conception and design. Writing and editing, Y.W. and M.T.; data collection, M.Z.; data analysis, M.T., Y.W. and Z.Z.; algorithm development, Y.W., M.T. and J.C.; chart editing, Y.W. and Y.Z.; flood model construction, W.X. All authors have read and agreed to the published version of the manuscript.

Funding

This research was funded by the Joint Major Project of “Science and Technology + Water Conservancy” in Jiangxi Province (2022KSG01007).

Data Availability Statement

Data Sharing is not applicable.

Conflicts of Interest

The authors declare no conflict of interest.

References

  1. Mechler, R.; Singh, C.; Ebi, K.; Djalante, R.; Thomas, A.; James, R.; Tschakert, P.; Wewerinke-Singh, M.; Schinko, T.; Ley, D. Loss and Damage and limits to adaptation: Recent IPCC insights and implications for climate science and policy. Sustain. Sci. 2020, 15, 1245–1251. [Google Scholar] [CrossRef]
  2. Clarke, B.; Otto, F.; Stuart-Smith, R.; Harrington, L. Extreme weather impacts of climate change: An attribution perspective. Environ. Res. Clim. 2022, 1, 012001. [Google Scholar] [CrossRef]
  3. Frame, D.J.; Rosier, S.M.; Noy, I.; Harrington, L.J.; Carey-Smith, T.; Sparrow, S.N.; Stone, D.A.; Dean, S.M. Climate change attribution and the economic costs of extreme weather events: A study on damages from extreme rainfall and drought. Clim. Change 2020, 162, 781–797. [Google Scholar] [CrossRef]
  4. Liu, J.H.; Pei, Y.J.; Mei, C.; Liu, C.J. Waterlogging Cause and Disaster Prevention and Control of “7·20” Torrential Rain in Zhengzhou. J. Zhengzhou Univ. (Eng. Sci.) 2023, 44, 38–45. [Google Scholar] [CrossRef]
  5. LeComte, D.U.S. Weather Highlights 2022—Drought, Flash Floods, Severe Outbreaks, Hurricane Ian, Blockbuster Winter Storms. Weatherwise 2023, 76, 14–22. [Google Scholar] [CrossRef]
  6. Liu, J.H.; MEI, C.; Wang, J.; Wang, D.; Wang, H. Flood survey of “23 · 7” heavy rain in Mentougou Watershed of Beijing. China Flood Drought Manag. 2023, 33, 50–55. [Google Scholar] [CrossRef]
  7. Qiu, J.; Zhao, W.; Brocca, L.; Tarolli, P. Storm Daniel revealed the fragility of the Mediterranean region. Innov. Geosci. 2023, 1, 100036. [Google Scholar] [CrossRef]
  8. Zhang, H.P.; Li, M.; He, R.M.; Zang, W.B.; Liu, S.; Hu, C.H. Application Scenarios and Corresponding Technical Strategies of Urban Flood Modeling. Adv. Water Sci. 2022, 33, 452–461. [Google Scholar] [CrossRef]
  9. Sidek, L.M.; Jaafar, A.S.; Majid, W.H.A.W.A.; Basri, H.; Marufuzzaman, M.; Fared, M.M.; Moon, W.C. High-Resolution Hydrological-Hydraulic Modeling of Urban Floods Using InfoWorks ICM. Sustainability 2021, 13, 10259. [Google Scholar] [CrossRef]
  10. Bisht, D.S.; Chatterjee, C.; Kalakoti, S.; Upadhyay, P.; Sahoo, M.; Panda, A. Modeling urban floods and drainage using SWMM and MIKE URBAN: A case study. Nat. Hazards 2016, 84, 749–776. [Google Scholar] [CrossRef]
  11. Mustafa, A.; Szydłowski, M.; Veysipanah, M.; Hameed, H.M. GIS-based hydrodynamic modeling for urban flood mitigation in fast-growing regions: A case study of Erbil, Kurdistan Region of Iraq. Sci. Rep. 2023, 13, 8935. [Google Scholar] [CrossRef] [PubMed]
  12. Zhang, J.Y.; Wang, Y.T.; Liu, C.S.; He, R.M. Discussion on the standards of urban flood and waterlogging prevention in China. J. Hydroelectr. Eng. 2017, 36, 1–6. [Google Scholar]
  13. Liu, Z.M.; Xiong, S.M.; Lei, Y.; Hu, H.Y. Study on design standard matching between municipal drainage and water conservancy drainage in urban local flood control. Water Resour. Prot. 2022, 38, 125–132. [Google Scholar]
  14. Liu, Y.; Zhang, S.Y.; Liu, L.; Wang, X.W.; Huang, H.B. Research on urban flood simulation: A review from the smart city perspective. Prog. Geogr. 2015, 34, 494–504. [Google Scholar]
  15. Molokov, M.B.; Shigorin, G.G. Rain and Alloy Sewerage; Publishing house, Ministry of Urban Affairs of the Socialist Federal Republic: Moscow, Russia, 1954.
  16. Keifer, C.J.; Chu, H.H. Synthetic storm pattern for drainage design. J. Hydraul. Div. 1957, 83, 1332-1–1332-5. [Google Scholar] [CrossRef]
  17. Huff, F.A. Time distribution of rainfall in heavy storms. Water Resour. Res. 1967, 3, 1007–1019. [Google Scholar] [CrossRef]
  18. Pilgrim, D.H.; Cordery, I. Rainfall temporal patterns for design floods. J. Hydraul. Div. 1975, 101, 81–95. [Google Scholar] [CrossRef]
  19. Yen, B.C.; Chow, V.T. Design hyetographs for small drainage structures. J. Hydraul. Div. 1980, 106, 1055–1076. [Google Scholar] [CrossRef]
  20. Wang, B.Y.; Zhao, L.N.; Gong, Y.F.; Bai, X.M. Characteristics of temporal pattern and return period of short-duration rainfall at Beijing Observatory. Torrential Rain Disasters 2015, 34, 302–308. [Google Scholar]
  21. Xu, J.J.; Yang, Z.Y.; Gao, X.C.; Gao, K. Analysis of rainstorm pattern characteristics in typical cities in the Yangtze River Basin. J. China Inst. Water Resour. Hydropower Res. 2023, 21, 1–9+22. [Google Scholar] [CrossRef]
  22. Fu, X.; Kan, G.; Liu, R.; Liang, K.; He, X.; Ding, L. Research on Rain Pattern Classification Based on Machine Learning: A Case Study in Pi River Basin. Water 2023, 15, 1570. [Google Scholar] [CrossRef]
  23. Huang, G.R.; Chen, Y.S.; Yao, Z.J. Spatial and temporal evolution characteristics of extreme rainfall in the Pearl River Delta under high urbanization. Adv. Water Sci. 2021, 32, 161–170. [Google Scholar]
  24. Muda, L.; Begam, M.; Elamvazuthi, I. Voice Recognition Algorithms using Mel Frequency Cepstral Coefficient (MFCC) and Dynamic Time Warping (DTW) Techniques. J. Comput. 2010, 2, 138–143. [Google Scholar] [CrossRef]
  25. Lichtenauer, J.F.; Hendriks, E.A.; Reinders, M.J.T. Sign Language Recognition by Combining Statistical DTW and Independent Classification. IEEE Trans. Pattern Anal. Mach. Intell. 2008, 30, 2040–2046. [Google Scholar] [CrossRef] [PubMed]
  26. Rybarczyk, Y.; Deters, J.K.; Gonzalo, A.A.; Esparza, D.; Gonzalez, M.; Villarreal, S.; Nunes, I.L. Recognition of Physiotherapeutic Exercises through DTW and Low-Cost Vision-Based Motion Capture. In Advances in Human Factors and Systems Interaction; Springer International Publishing: Cham, Switzerland, 2018; pp. 348–360. [Google Scholar]
  27. Ni, Z.N.; Li, Q.F.; Du, F.R.; Jiang, H.T. Study on design of rainstorm pattern based on short duration in Nanjing City. J. Water Resour. Water Eng. 2019, 30, 57–62. [Google Scholar]
  28. Li, P.L.; Qin, G.H.; Cao, L.R.; Tong, X.; Wang, J.H. Application of MIKE URBAN-based urban waterlogging model. Water Resour. Hydropower Eng. 2018, 49, 11–16. [Google Scholar] [CrossRef]
  29. Tang, M.; Xu, W.B. Research on the Joint Scheduling Strategy of the Urban Drainage System Based on Scenario Simulation. China Rural. Water Hydropower 2020, 8, 76–81. [Google Scholar]
  30. Jiang, M. Study of Shanghai Design Rainstorm Profile Under the New Rainstorm Situation. J. Hunan Inst. Sci. Technol. (Nat. Sci.) 2015, 28, 69–73+80. [Google Scholar]
  31. Sarkar, S.K.; Rahman, M.A.; Esraz-Ul-Zannat, M.; Islam, M.F. Simulation-based modeling of urban waterlogging in Khulna City. J. Water Clim. Change 2021, 12, 566–579. [Google Scholar] [CrossRef]
  32. Yan, W.C.; Liu, J.H.; Mei, C.; Feng, J.; Yang, Z.Y.; Fu, X.R.; Zhang, D.J. Simulation and analysis of flood process under typical typhoon rainstorm scenarios. Water Resour. Hydropower Eng. 2021, 52, 12–23. [Google Scholar] [CrossRef]
  33. Zhang, G. Study on Design Rainstorm Pattern of Recurrence Interval for Urban Flooding Design. Sci. Technol. Innov. 2023, 19, 129–132. [Google Scholar]
  34. Li, X.N.; Yu, Y.; Wang, C.H.; Zheng, S.W.; Li, L.J.; Chen, G. Monitoring and characterization of the entire urban flooding process in the typical southern plain river network area. J. Hydraul. Eng. 2022, 53, 845–853. [Google Scholar] [CrossRef]
  35. Tang, M.; Xu, W.B.; Yao, J.H.; Tang, C.S. Design Rainstorm Patterns Based on Numerical Simulation of Urban Flooding. China Water Wastewater 2021, 37, 97–105. [Google Scholar] [CrossRef]
Figure 1. Study flow chart.
Water 16 00065 g001
Figure 2. Study area.
Water 16 00065 g002
Figure 3. The principle of the dynamic time warping algorithm. (a) The matching principle of the DTW algorithm. (b) Cumulative distance matrix.
Water 16 00065 g003
Figure 4. Qingshan Lake drainage area.
Water 16 00065 g004
Figure 5. The results of three clustering algorithms (I to VIII represent the identification numbers of each cluster and the numbers in the upper right corners of each frame represent the numbers of rainfall events).
Water 16 00065 g005
Figure 6. Rain patterns obtained by characteristic extraction. (I to VIII represent the eight rainfall patterns obtained from the characteristic extraction of clusters I to VIII in Figure 5a).
Water 16 00065 g006
Figure 7. Distributions of waterlogging (once in 20 years). (I to VIII represent the simulation results of waterlogging for eight rainfall patterns).
Water 16 00065 g007
Figure 8. The water level and discharge variation at the monitoring points (once in 20 years). (I to VIII represent the simulation results of the water level and discharge for eight rainfall patterns).
Water 16 00065 g008
Figure 9. The rainfall pattern of the comprehensive rain pattern and the distribution of waterlogging (once in 20 years). (a) Comprehensive rainfall pattern. (b) Distribution of waterlogging.
Water 16 00065 g009
Figure 10. Distributions of waterlogging (once in 100 years). (I to VIII represent the simulation results of waterlogging for eight rainfall patterns).
Water 16 00065 g010
Figure 11. ERPUDFV and the distribution of waterlogging. (a) ERPUDFV; (b) distribution of waterlogging.
Water 16 00065 g011
Figure 12. Composite rainfall pattern and the distribution of waterlogging. (a) Composite rainfall pattern; (b) distribution of waterlogging.
Water 16 00065 g012
Figure 13. The water level and discharge variation at the monitoring points (once in 100 years). (I to VIII represent the simulation results of the water level and discharge for eight rainfall patterns).
Water 16 00065 g013
Table 1. Simulated data (once in 20 years).
PrecipitationMonitoring
Point
Evaluation IndexRainfall Patterns
IIIIIIIVVVIVIIVIII
233.6 mm Maximum waterlogged
areas (km2)
0.19 0.16 0.07 0.76 1.12 0.21 2.77 4.33
Maximum waterlogged
depth (m)
1.76 1.70 1.95 2.09 2.32 1.91 2.53 3.01
aMax water level (m)16.97 16.69 16.64 17.69 17.16 16.92 18.18 17.58
Max discharge (m3/s)118.98 68.91 45.03 188.84 140.16 82.67 252.50 183.39
bMax water level (m)17.39 16.95 16.79 18.13 17.71 17.18 18.70 18.14
Max discharge (m3/s)70.95 61.02 44.89 116.75 116.61 65.18 161.34 158.44
Table 2. Maximum waterlogged areas and depths (once in 100 year).
PrecipitationEvaluation IndexRainfall Patterns
IIIIIIIVVVIVIIVIII
287.4 mmMaximum waterlogged
areas (km2)
0.5180.390.2013.1512.9960.7416.4398.215
Maximum waterlogged
depth (m)
1.8881.7892.1444.132.6652.154.673.194
Table 3. The water levels and discharge of the monitoring points (once in 100 years).
PrecipitationMonitoring
Point
Evaluation IndexRainfall Patterns
IIIIIIIVVVIVIIVIII
287.4 mmaMax water level (m)17.7917.0917.41318.30917.52317.14418.47918.142
Max discharge (m3/s)185.538120.886157.103248.522177.49115.412288.899247.549
bMax water level (m)18.1117.48617.86218.65418.07117.48319.01418.714
Max discharge (m3/s)113.63991.55894.76160.345148.8199.22195.336202.675
Disclaimer/Publisher’s Note: The statements, opinions and data contained in all publications are solely those of the individual author(s) and contributor(s) and not of MDPI and/or the editor(s). MDPI and/or the editor(s) disclaim responsibility for any injury to people or property resulting from any ideas, methods, instructions or products referred to in the content.

