Article

Evaluation of Water Resources Carrying Capacity of Zhangye City Based on Combined Weights and TOPSIS Modeling

1
College of Geography and Environmental Science, Northwest Normal University, 967, Anning East Road, Lanzhou 730070, China
2
Key Laboratory of Resource Environment and Sustainable Development of Oasis, Lanzhou 730070, China
3
Gansu Province Urban and Rural Planning Design Institute Co., Ltd., Lanzhou 730070, China
*
Author to whom correspondence should be addressed.
Water 2023, 15(24), 4229; https://doi.org/10.3390/w15244229
Submission received: 7 November 2023 / Revised: 26 November 2023 / Accepted: 27 November 2023 / Published: 8 December 2023

Abstract

:
According to the natural condition of water resources and the economic, social, and ecological environment status of Zhangye City, the water resources carrying capacity of Zhangye City is evaluated by using the water resources carrying capacity Technique for Order Preference by Similarity to an Ideal Solution (TOPSIS) model with combination assignment. The results show that: (1) From 2010 to 2020, the water resources carrying capacity of Zhangye City was generally stable at the macro level, ranking at grades III and IV. However, from the micro level, the water resources carrying capacity fluctuates to a certain extent and shows an increasing trend year by year. (2) The steady improvement of economic and social conditions is the main driving force for the improvement of the comprehensive water resources carrying capacity of Zhangye City, and the changes in the ecological environment are also important factors affecting the carrying capacity of water resources. The results provided a decision basis for future comprehensive development and utilization of water resources in Zhangye City and a reference for water resource carrying capacity and water resource security assessment in other arid and semi-arid areas in our country.

1. Introduction

Water resources are important resources on which human society relies for survival and development, and are the most basic conditions for the sustainable development of human society. In recent years, the continuous development of local economies and the expansion of population scale have gradually increased the demand for water resources, and the corresponding carrying capacity of water resources has been affected to a certain extent [1]. Carrying capacity is a term that originated in physics and was later used in ecology to indicate the maximum population size of a given area and population within a certain period of time [2]. Water resource carrying capacity is used to indicate the phenomenon that water resources in a certain region cannot satisfy socio-economic development. It usually refers to the size of the economy, population, and land that can be carried by water resources if water supply and demand are at a critical level without constraining the sustainable development of the socio-economy and meeting the needs of various sectors [3].
In recent years, domestic and foreign researchers have conducted more studies on water resources carrying capacity, and the evaluation of water resources carrying capacity has changed from basic qualitative to quantitative evaluation. There are fruitful results, but some problems still exist [4,5]. Various scholars have defined the concept of water resources carrying capacity differently and analyzed it from different angles, and the conclusions about water resources carrying capacity derived from the research are not the same. The methods of water resources carrying capacity evaluation are diverse, and the common ones are the fuzzy comprehensive evaluation method [6], the system dynamics method [7], the gray correlation degree method [8], the principal component analysis method [9], and the TOPSIS model [10,11]. Overseas scholars combine water resource carrying capacity with sustainable development. Varis and Vakkilainen [12] studied the water resources of the Yangtze River Basin in China, outlined the current situation of water resources in the basin and the challenges it faces, and analyzed the relationship between socio-economic conditions and water resource carrying capacity. Koop and Van [13] set up an international standardized index system for integrated water resources management (IWRM) in cities and used gray correlation analysis to evaluate subjective and objective indicators as well as assess the impacts of water resources management on urban water resources. The relative performance of subjective and objective methods was evaluated by gray correlation analysis. Ferenc Bognár et al. [14] integrated AHP-PRISM with TOPSIS and applied it to the assessment of nuclear power plant logistics business processes, effectively proving that the method can be more widely applied to practical decision-making problems. Kuspilić et al. [15] defined water resources carrying capacity as the maximum sustainable human population size limited by water resource availability, put forward an analysis method based on uncertainty and sensitivity, and assessed the water resources carrying capacity of Cres Island by setting two precipitation scenarios. Marganingrum [16] applied the concept of sustainable development of carrying capacity to basin analysis and combined the concept of maximum equilibrium with system dynamics to conduct a comprehensive study on the water resource carrying capacity of the Bandung Basin. Kunu et al. [17] analyzed the water carrying capacity and environmental capacity levels of several cities in Maruji Province, Indonesia, using availability limits. In view of the water resources situation in China, scholars in China have conducted many studies on IWRM. Xu Youpeng [18] conducted a scientific study on the water resource carrying capacity of the Hetian River in Xinjiang by using a comprehensive evaluation model and analytical calculation methods. Zhao and Jin et al. [19] studied a water resources risk evaluation model based on the subjective-objective combination of the empowerment method and verified it with the example of the Han River Basin. Gang et al. [20] listed three coupled systems for the water resources carrying capacity of nine provinces and two cities in the Yangtze River Economic Belt, and, from this perspective, a comprehensive evaluation of them was carried out by using the variable weight TOPSIS model. Zuo and Zhang et al. [21] used a combined assignment including hierarchical analysis, the entropy weight method, and the TOPSIS model, constructed three guideline layers, evaluated the water resources carrying capacity for four years during 2002–2017 for the nine provinces and regions of the Yellow River Basin, and applied the obstacle degree model for diagnosis. Yuan and Sha et al. [22] used two weight calculation methods: combined gray correlation analysis and a fuzzy comprehensive evaluation model, and then applied them to the evaluation of water resource carrying capacity in Jiangyin City, Jiangsu Province.Deng and Ping et al. [23] used the combined weights-TOPSIS method to evaluate the water resource carrying capacity of Xinxiang City. Tian and Li et al. [24] used the TOPSIS evaluation method to evaluate the carrying capacity of water resources in the western mining area. The increase in carrying capacity of water resources in the study area was due to the construction of reservoirs in the mining area, which increased the storage capacity of reservoirs while slowing down the decline of groundwater levels and the pressure of water supply in the reservoir area. Li and Zhao et al. [11] used the TOPSIS model to comprehensively evaluate the water resource carrying capacity of Jiangsu Province and found that the water supply modulus and water consumption rate were the main factors restricting the water resource carrying capacity.
Zhangye City belongs to the temperate continental climate, arid climate, perennial rainfall, and the overall water resources shortage, facing the double pressure of resource-type water shortage and water-quality water shortage. In 2010, the State Council implemented the inter-provincial water scheduling of the Heihe River in Zhangye City, transferring water downstream of the Justice Gorge to the provinces, exacerbating the shortage of surface water resources in Zhangye City. The contradiction between the supply of water and demand is prominent. And due to climate change, the ecological problems of the upstream water sources of the Black River are serious, making it difficult to guarantee the amount of incoming water. Due to economic and technological constraints, the total amount of water used in agriculture is large and wasteful, and the ecological environment in the region is fragile. Therefore, determining whether water resources in Zhangye City can guarantee the sustainable development of the economy, society, and ecology requires a scientific evaluation of water resource carrying capacity. Currently, there are fewer studies related to the evaluation of water resource carrying capacity in Zhangye City. Wang Penglong [25] constructs evaluation indicators from the degree of carrying capacity and evaluates the water resources carrying capacity of four counties and districts in Zhangye City from 2015 to 2017. Wang Miaomiao [26] used the structural decomposition analysis method to evaluate the stage of water resources management in Zhangye City during 2002–2012. The research on the evaluation of water resources carrying capacity and the diagnosis of obstacle factors in Zhangye City in the last decade is lacking, and the water resources situation in Zhangye City needs to be studied and explored further. In this study, the hierarchical analysis method (AHP) and the entropy weight method are used for the combination assignment. The AHP method determines the weights of the indicators according to the relative importance between the indicators, and the assignment results are subjective; the entropy weight method determines the weights of the indicators based on the discrete degree of each indicator, and it is more objective compared to the AHP method. In the process of selecting indicators for a comprehensive evaluation of water resource carrying capacity in Zhangye City, the combination of the two weighting methods can solve the problems of subjective limitations and inconsistency with the actual situation. The TOPSIS model is more suitable for the carrying capacity assessment of water resource shortage areas compared with the evaluation methods of the fuzzy comprehensive judgment method and the principal component analysis method [27,28]. Therefore, the results of the study also provide a certain basis for improving the carrying capacity of water resources and play a positive role in formulating reasonable water resource management measures in Zhangye City.
Based on the above research background, this paper adopts combined weights and the TOPSIS model to study the water resource carrying capacity of Zhangye City from both subjective and objective aspects. The research results mainly analyzed the evaluation of water resources carrying capacity and sub-systems of water resources carrying capacity, which provided a decision-making basis for the future comprehensive development and utilization of water resources in Zhangye City and provided references for the evaluation of water resources carrying capacity and water resources security in other arid and semi-arid areas in China.

2. Application Example

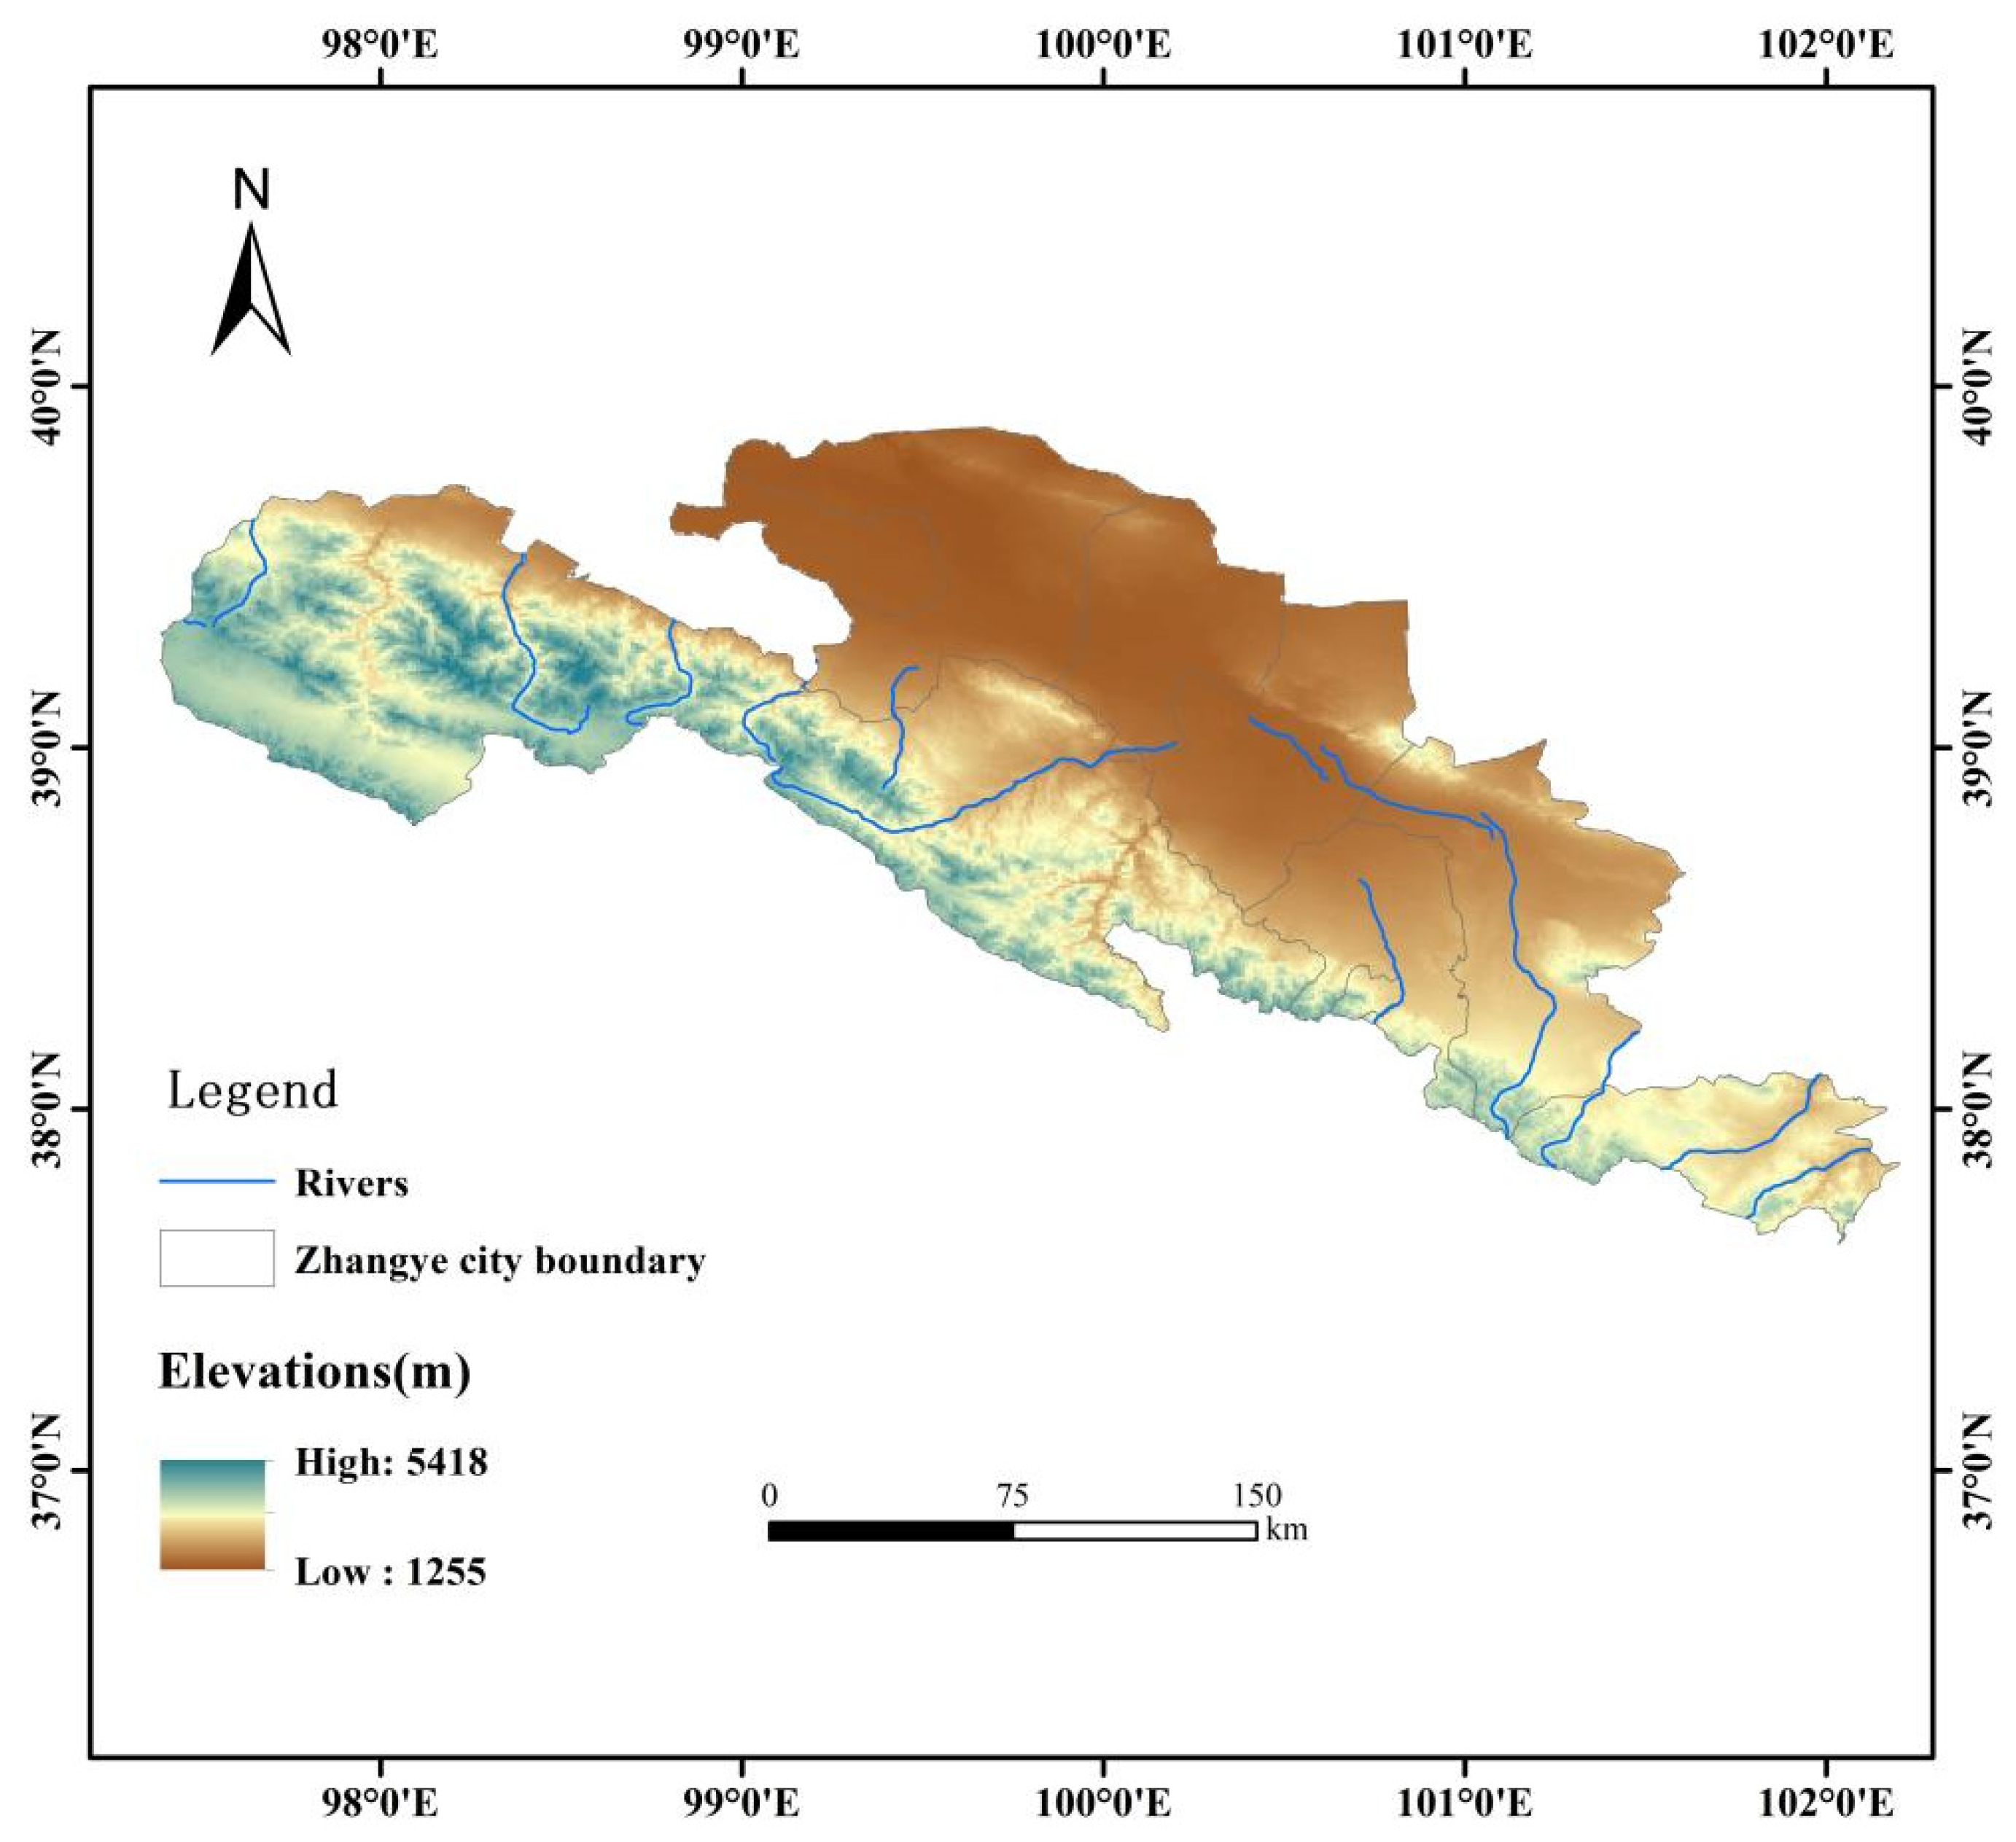
2.1. Overview of the Study Area

Zhangye (97°20′ E~102°12′ E; 37°28′ N~39°57′ N), a provincial municipality in Gansu Province, is located in the central part of the Hexi Corridor and the northern part of the Tibetan Plateau, as shown in Figure 1. Zhangye has a continental climate with a large temperature difference, dryness, low rainfall, an uneven distribution of annual precipitation, and high evapotranspiration. The national modern agricultural demonstration area is the region, from east to west, divided into three major water systems: the Shule River, Black River, and Shiyang River. It has a series of resource advantages, from south to north, divided into three major topographic areas: the southern Qilian Mountains, the central oasis plains, and the northern mountainous terrain. This is the territory of the fertile land, where sunshine irradiation is sufficient [29]. Zhangye is an excellent tourist city in China, with a total area of 38,600 square kilometers, governing Ganzhou District, Shandan County, Gaotai County, Linze County, Sunan County, Minle County, one district, and five counties. For the year 2020 the city’s resident population is 1,129,900 people, with an urban population of 579,500 people, urbanization rate of 51.29%, the city’s Gross Domestic Product (GDP) of CNY 46,705 million, and a total annual water consumption of 1998 billion m3, of which the living water consumption of the city is CNY 1998 billion. The annual total water consumption is 1.998 billion m3. Among this water consumption, the domestic water consumption is 0.46 billion m3, the industrial water consumption is 0.19 billion m3, the agricultural water consumption is 1.775 billion m3, the ecological water consumption is 158 million m3, the annual average precipitation is 182.40 mm, decreasing from the southeast to the northwest, the Chemical Oxygen Demand (COD) is 2.90 million ton, and the ammonia nitrogen discharge is 0.12 million ton.

2.2. Data Sources

Data on surface and underground water resources and water consumption for irrigation, industry, and the ecological environment from 2010 to 2020 come from the Annual Report of Comprehensive Water Resources Statistics of the Zhangye Water Affairs Bureau and the Gansu Water Resources Bulletin of the Gansu Provincial Water Resources Department. Economic and social data such as regional population, regional GDP value, and ecological data such as chemical oxygen demand and ammonia nitrogen emissions are from the Zhangye City Statistical Yearbook and the Zhangye City National Economic and Social Development Statistical Bulletin.

3. Research Method

3.1. Construction of Water Resources Carrying Capacity Index System

Water resource carrying capacity is affected by many aspects, including water resource endowment, socio-economic development, and the state of the water ecosystem. Zhangye City, Gansu Province, is a serious resource-based water-scarce region, and due to the rapid development of the regional economy, the demand for water resources has increased dramatically, increasing the pressure on water resources, so the evaluation of water resource carrying capacity is imperative.

3.1.1. Construction of Water Resources Carrying Capacity Index System

In this study, the selection of evaluation indexes is carried out through two aspects. A large portion of the literature on water resources carrying capacity evaluation was consulted, and the indicators that were used more frequently were selected [30,31,32]. For the regional characteristics and water resources conditions and status quo of Zhangye City, and following the principles of scientificity, representativeness, reliability, and accessibility [33], the corresponding 12 indicators were selected.
Constructing 1 target layer A; 3 guideline layers B, i.e., water resource development and utilization; economic, social, and ecological environment; and 12 indicator layers C, which are combined to form a comprehensive evaluation index system. The polarity of indicators is divided into positive and negative. The larger the value of the positive indicator, the larger the carrying capacity of water resources; the larger the value of the negative indicator, the smaller the carrying capacity of water resources [34]. The indicator system is shown in Table 1.

3.1.2. Status Evaluation Level Is Determined

In order to more accurately evaluate the water resources carrying capacity, so that the results are more objective and in line with the actual situation, according to the water resources situation in Zhangye City and the country, taking into account the use of water resources, economic and social development, and other constraints, with reference to the relevant norms at home and abroad and the more widely recognized evaluation of water resources carrying capacity indicators grading standards [19,35,36], the evaluation indexes are divided into five levels: I for carrying capacity, II for weak carrying capacity, III for critical carrying capacity, IV for overloading, and V for serious overloading. Specific information is shown in Table 2.

3.2. Determination of Weights

The AHP method determines the weights with strong subjective judgment and field visits to the study area profile, starting from the actual situation and based on the experience of experts, to determine the degree of influence of the evaluation indicators on the evaluation results. The entropy weighting method [37] utilizes the degree of difference of each indicator, which can make the weighting results more objective [38].

3.2.1. AHP Method for Determining Weights

Zhangye City has a high proportion of agricultural water use; its water use efficiency is extremely low, and the per capita water resources are insufficient. Based on the characteristics of regional water resources and the experience of experts, when the AHP method is used to measure the relative importance of the 12 indicators of water resources in Zhangye City, the focus should be on the average acre-foot water use for agricultural irrigation and the per capita water resources possession, so as to make the results of the measurements more explanatory, and then to determine the subjective weights. The main steps are as follows:
(1)
Construct a judgment matrix A containing 12 indicators   A = ( a i j ) m × n . a i j representing the factors   a i relative to the a j importance values (i, j = 1, 2, ……, n), with values ranging from 1 to 9.
(2)
Calculate the importance ranking. According to the judgment matrix, the weights are derived and normalized, and then sorted by the importance of each evaluation indicator according to the numerical value, i.e., the weights of each indicator ω j utilize the formula A ω j = λ m a x ω j to find the maximum characteristic root of A λ m a x .
(3)
Consistency test. In order to verify that the resulting weights are within the allowed range, the formula C R = C I / R I Consistency test is performed. When CR < 0.1 or λ m a x = n , CI = 0, the consistency requirement is satisfied. Otherwise, the judgment matrix should be adjusted.

3.2.2. Entropy Weighting Method for Determining Weights

Select and organize the corresponding values of 12 kinds of indicators in Zhangye City from 2010 to 2020, and calculate the weights according to the steps. The steps of the entropy weight method are as follows [39]:
(1)
Take j indicators in year i and form an initial data matrix A = ( Z i j ) m × n (i= 1, 2, …, m; j=1, 2, …, n), where Z i j is the value of the jth indicator in the ith year; the raw data corresponding to the 12 indicators are organized to form the initial matrix.
(2)
Normalization of the indicators to form a normalization matrix R i j , according to Equations (1) and (2).
Positive indicators:
R i j = Z i j m i n   ( Z 1 j , Z 2 j , Z m j ) max Z 1 j , Z 2 j , Z m j m i n Z 1 j , Z 2 j , Z m j + 1
Negative indicators:
R i j = min Z 1 j , Z 2 j , Z m j Z i j max Z 1 j , Z 2 j , Z m j m i n Z 1 j , Z 2 j , Z m j + 1
(3)
Perform entropy value calculation according to Formula (3), where   B j is the entropy value of the jth evaluation index.
B j = 1 lnm j = 1 m R i j j = 1 m R i j ln ( R i j j = 1 m R i j )
The weight calculation is carried out according to Equation (4), and ω j is the weight of the jth evaluation indicator
ω j = 1 B j j = 1 n 1 B j

3.2.3. Determination of Composite Weights

In response to the subjective and objective advantages of the two methods, the subjective and objective weights determined are used to determine the comprehensive weights of each evaluation index. The comprehensive weights can highlight the advantages of the AHP method and the entropy weight method and avoid their respective disadvantages. Its calculation formula is in accordance with Formula (5) [40]:
ω j = α ω j + 1 α ω j                     0 ω j 1
Equation: ω j is the combined calculated weight; ω j is the value of weights obtained via the hierarchical analysis method; ω j is the weight value calculated by entropy weight method;   α is the decision-making correlation coefficient. Both weight calculation methods are equally important; therefore, α 0.5 is taken.

3.3. Evaluation of Water Resource Carrying Capacity Based on TOPSIS Modeling

The TOPSIS model was proposed by Hwang, C.L., and Yoon, K.S., in 1981. This model calculates the Euclidean distance between the optimal solution and the selected evaluation object [41], the worst solution and the selected evaluation object, and the relative closeness of the selected evaluation object to the optimal solution [42] to select the object with the largest degree of closeness as the most ideal solution, and then gives a reasonable recommendation [43]. The TOPSIS method has authenticity and reliability, and it has been widely used in multiple-objective decision analysis problems. Its calculation steps are as follows:
(1)
With N objects to be evaluated and M evaluation indicators, forming the original data matrix and processing matrix, we have the matrix   U , U = ( u i j ) n × m .
(2)
To normalize the matrix U Normalized according to Equation (6), we obtain the quantile normalized decision matrix   A :
A = ( a i j ) n × m ( m a t h . ) g e n u s a s s u m e o f f i c e A i j = u i j i = 1 n u i j 2
(3)
Determination of optimal and worst solutions [11,26,27].
The optimal solution is A + = ( max A 11 ,     A 21 ,   ,   A n 1 ,   max A 12 ,   A 22 ,     ,   A n 2 ,   ,   max A 1 m ,     A 2 m ,     ,     A n m ) .
The worst solution for A = ( min A 11 , A 21 ,   ,     A n 1 ,     min A 12 ,     A 22 ,     ,     A n 2 ,     ,   min A 1 m ,   A 2 m ,   , A n m ) .
(4)
Calculate the distance of each evaluation object to the optimal solution according to Equations (7) and (8)   B i + and the distance to the worst solution B i and normalize to determine the relative closeness of each evaluation object to the optimal solution, i.e., the closeness degree T i , the larger the value, the closer to the optimal solution. For T i , the larger the value, the closer it is to the optimal solution. For T i , the value is between 0 and 1, and the closer to 1, the closer the level is to the optimal solution, and vice versa.
B i + = j = 1 m [ ω j ( A j + A i j ) ] 2
B i = j = 1 m [ ω j ( A j A i j ) ] 2
According to Equation (9), to obtain the value of posting progress T i ,
T i = B i B i + B i +

3.4. Calculation of Barrier Degree Factor

Calculating the closeness can reflect the overall water resources carrying capacity situation in Zhangye City, but it cannot clearly describe the important factors affecting water resources carrying capacity [44]. The use of the obstacle degree model can measure the obstacle factors and the obstacle degree of water resources carrying capacity and then derive the relevant factors that mainly affect the water resources carrying capacity. The handicap model calculates the contribution of the factors and the degree of deviation of the indicators based on the combination of the weights, and then calculates the product of the two as a proportion of the total number of indicators to obtain the handicap degree [45]. The relationship between the degree of obstacle and evaluation indicators is as follows: the greater the degree of obstacle of the water resources carrying capacity evaluation indicators, the stronger the obstacle of the indicator to the regional water resources carrying capacity, and vice versa. According to Formula (10), the obstacle degree of each evaluation indicator is calculated as [21,46]
F i j = D j E i j j = 1 n D j E j × 100 %
included among these, D j = ω j ω j *   E i j = 1 u i j .
F i j is the barrier degree; D j is the factor contribution degree; ω j * is the weight of the criterion layer to which indicator j belongs; ω j is the combined calculated weight; u i j is the value of the original data matrix after the normalization process; E i j is the indicator deviation degree; i = 1, 2, …, m.

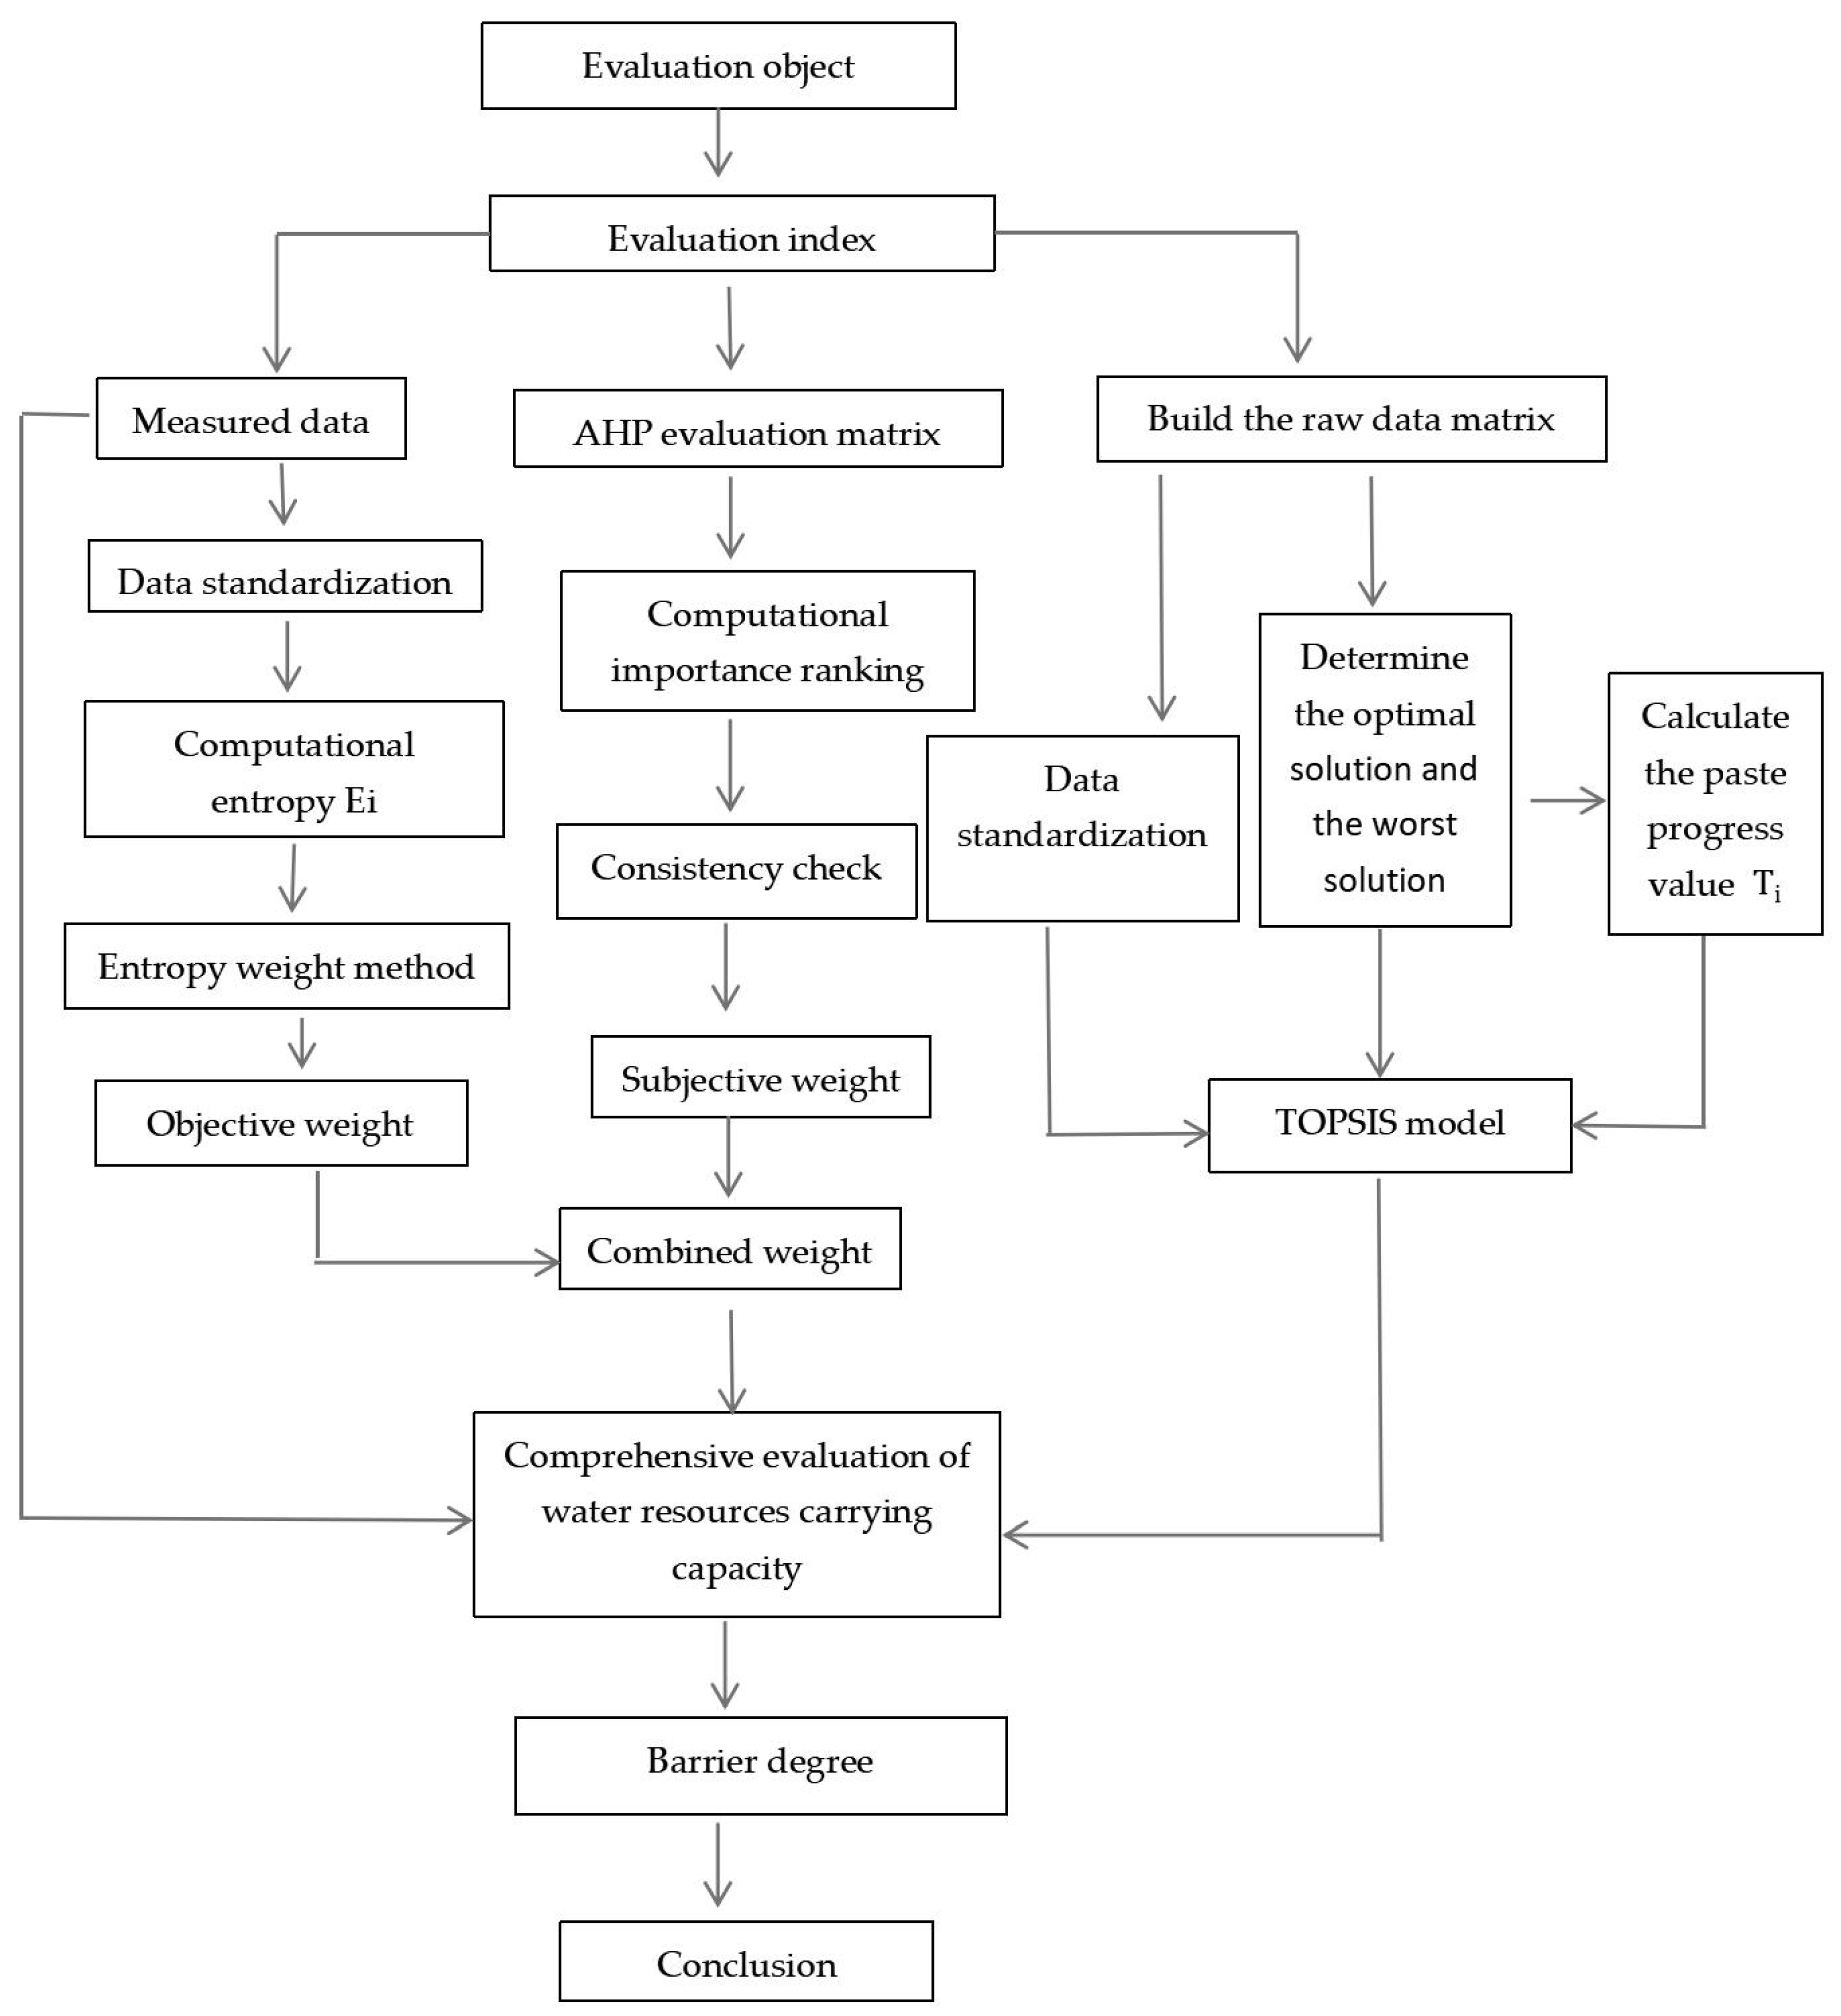
3.5. Water Resources Carrying Capacity Evaluation Flow Chart

The evaluation process of combined weights and TOPSIS models is shown in Figure 2. The evaluation process includes three main modules: weight calculation, evaluation of water resource carrying capacity, and diagnosis and analysis of obstacle degree. Firstly, the combination weight of the evaluation system is obtained by substituting subjective weight and objective weight into the combination weight formula. Secondly, the weighted measured data are substituted into the TOPSIS model to calculate the progress and obtain the evaluation grade of water resource carrying capacity. At last, the obstacle diagnosis method was used to evaluate the model, and the influence of each evaluation index on the evaluation result of regional water resource carrying capacity was explored.

4. Analysis of Results

4.1. Combination Weight

The hierarchical analysis method was used to determine the subjective weights, CR = 0.086 < 0.1, through the consistency test, proving that the assignment is reasonable; collect data to determine the objective weights using the entropy weighting method to obtain the results of the two kinds of weights, and calculate the composite weights as shown in Table 3.
Combinatorial weights are evaluated by combining AHP and entropy weights. It can be seen that the comprehensive weight of surface water resources per unit area is the largest, which is 0.161. Followed by per capita water consumption, groundwater resources per unit area, and urbanization rate, the comprehensive weight is 0.142, 0.106, and 0.092, respectively. The weight of average water consumption per m3 of farmland irrigation is the smallest, which is 0.036. In general, the comprehensive weight is closer to reality, which improves the shortcomings of the AHP and entropy weight methods so as to avoid the problem that the evaluation results are divorced from the actual situation.

4.2. Analysis of Evaluation Results of Each Subsystem of Water Resources Carrying Capacity

The grade criteria for water resource carrying capacity in Zhangye City are as follows: [0, 0.216) as grade V extreme level; [0.216, 0.403) as grade IV relatively poor level; [0.403, 0.607) as grade III medium level; [0.607, 0.821) as grade II. [0.821, 1] is a very high level of class I. Using the water resources carrying capacity TOPSIS model, the water resources carrying capacity closeness of the molecular system in Zhangye City from 2010 to 2020 was calculated Ti. The calculation results are shown in Figure 3.

4.2.1. Overall Analysis

From Figure 3, it can be seen that during the period of 2010–2020, the environmental carrying capacity of water resources in Zhangye City basically shows an upward trend. Specifically, the environmental carrying capacity of water resources in Zhangye City is in a decreasing trend from 2010 to 2014, and further analysis reveals that it is mainly due to the imbalance between supply and demand of water resources, such as the total water consumption increasing year by year, with the total water consumption rising from 2354 million m3 in 2010 to 2412 million m3 in 2014; the rapid development of industry and agriculture leads to the high water consumption level in agriculture and industry, such as industrial value added from CNY 5.540 billion in 2010 to CNY 8.523 billion in 2014, and the water consumption of agricultural irrigation has been at a high level from 2010 to 2014. It can be seen that the combined effect of the above reasons has a large impediment to the environmental carrying capacity of water resources, resulting in Zhangye City, where the environmental carrying capacity of water resources has shown a clear downward trend. The environmental carrying capacity of water resources has been gradually increasing since 2014, and the carrying capacity index in 2020 reached 0.615, which is more than double that in 2014. Analyzing the reasons in depth, the achievement is, on the one hand, due to the innovation of the water-saving technology model, which improves the utilization efficiency of agricultural water. For example, in 2010, the General Office of Gansu Provincial People’s Government issued the document “Gansu Provincial People’s Government on the Issuance of Gansu Provincial Hexi and Along the Yellow Main Irrigation Areas of High-efficient Farmland Water Saving Technology Promotion Support Measures and Gansu Provincial Hexi and Along the Yellow Main Irrigation Areas of High-efficient Farmland Water Saving Technology Promotion Three-Year Plan”; in 2013, Gansu Provincial Department of Agriculture and Animal Husbandry, and another four departments and offices jointly issued the document “On the issuance of the province’s 2013 high-efficiency farmland water-saving technology promotion plan notice”. Technology Promotion Plan” document, Zhangye City, provided a demonstration and promotion of membrane drip irrigation and another three high-efficiency farmland water-saving technologies, so that, in Zhangye City, the amount of water used for farmland irrigation can achieve a substantial reduction in the usage of water resources of Zhangye City, significantly improving the environmental carrying capacity of water resources in Zhangye City.

4.2.2. Analysis of Water Resources Development and Utilization Subsystems

From the view of the water resources development and utilization subsystem, the water resources carrying capacity indicators of surface water resources per unit area, underground water resources per unit area, per capita water resource possession, and average annual precipitation all showed a faster growth rate relative to each indicator in 2018 and reached a peak in 2019. The water resources development and utilization situation in Zhangye City from 2010 to 2020 is basically in a stable state, but the carrying capacity is basically at a poor and medium level because Zhangye is located in northwestern China and belongs to a resource-type water-scarce city (Wang Y et al., 2009) [47]. Zhangye has low precipitation, a dry climate, and an imbalance between supply and demand of water resources. Three of the four indicators of the water resources subsystem rank in the top six in terms of surface water resources per unit area, underground water resources per unit area, and water resources per capita, which also indicates that the main obstacle factor restricting the rise of water resources carrying capacity in Zhangye City is the exploitation and utilization of water resources. From the statistical data, the precipitation in 2014 was 218.85 mm, which was 18.18% higher than the 179.07 mm in 2013, and the amount of regional surface water resources was 3.057 billion m3, which was 5.72% higher than the 2.882 billion m3 in 2013, and the total amount of regional water resources increased from 3.042 billion m3 to 3.182 billion m3, and the amount of underground water resources was 125 million m3 (minus duplicates), a decrease of 0.35 billion m3 from 160 million m3 in 2013, a decrease of more than 20%. Although the problem of overexploitation of groundwater has been managed, the overall supply of water resources in the region is still in a disadvantageous position, which also reduces the amount of water resources in Zhangye City according to the Ministry of Water Resources’ “Heihe River Water Allocation Program” of Zhangye City’s discharged water volume. Four of the water resources development and utilization subsystems in 2019 indicators have all increased compared to the previous year, and the water resources carrying condition has significantly improved, indicating that the management measures formulated by Zhangye City in recent years in terms of water resources development and utilization have played a role.

4.2.3. Economic and Social Subsystem Analysis

From Figure 3, Zhangye’s economic development power rises from 0.431 in 2010 to 0.672 in 2020, indicating that economic development is steadily improving and also showing that Zhangye’s economic strength is increasing, providing more solid economic resources to the economic and social subsystems. In 2010, the city began to promote the construction of ten major projects, accelerating the construction of leading enterprises and experimental demonstration zones, developing the specialty tourism industry, and moving toward an urban and rural development integration that was close to the value of regional GDP, the urbanization rate, and other indicators of the value of the rapid increase year by year. The economic and social subsystem of Zhangye City shows a steady upward trend after 2014, and the economic and social conditions have been at a high level in the past four years. The GDP value of 2014 was CNY 3,125,400,000, and the GDP value of 2012 was CNY 2,495,300,000, with an increase of more than 20% in the two years. The urbanization rate increased from 34.84% in 2010 to 41.01% in 2014, and the degree of its obstacle basically shows an increasing trend, which indicates that the increase in water demand in agriculture, industry, and other economic aspects increases the demand for water resources and hinders the enhancement of the carrying capacity of water resources. From 2015 to 2020, per capita water consumption, water consumption of CNY 10,000 of value added in industry, water consumption in agriculture, and CNY 10,000 of GDP show a decreasing trend, in which the water consumption of CNY 10,000 of value added in industry decreases from 0.42 billion m3 in 2015 to 0.19 billion m3, which is attributed to the development of industry in Zhangye City and the commitment to promote agricultural and industrial water-saving measures to build a water-saving society in a comprehensive way, which is consistent with the conclusion of Wang Yan [47].

4.2.4. Ecological Subsystem Analysis

From the viewpoint of the ecological environment subsystem, the ecological environment condition of Zhangye City from 2010 to 2020 is still below the medium level, but it also shows that the effect of ecosystem management in Zhangye City is improving year by year. The ecological environment condition of Zhangye City dropped sharply from 2010 to 2011, and according to the statistical data, the chemical oxygen demand in 2011 was 37,400 tons, which is higher than that of 16,400 tons in 2013, which is a rise of 56.15%. This was affected by urban development in Zhangye City, which led to poor local water quality, resulting in a rapid decline in the carrying capacity of water resources. After 2011, there was a trend of steady improvement, decreasing year by year, which to a certain extent led to the improvement of the ecological environment, which in turn affected the water resource carrying capacity of Zhangye City. The ecological water use rate indicator is also an important influence factor; the ecological environment water use in 2010 was 146 million m3 to 158 million m3 in 2020, and the ecological water use rate average obstacle ranked sixth, which indicates that the ecological water use percentage still needs to be increased in order for the water resources carrying capacity to be further improved.

4.3. Obstacle Degree Analysis of Water Resources Carrying Capacity Evaluation Index

As can be seen from Table 4, the top 5 factors in terms of obstacle degree are surface water resources per unit area, per capita water consumption, per unit area groundwater resources, urbanization rate, and per capita water resource occupancy. These factors belong to the ecological environment and water resources subsystem and are the main obstacles to water resources carrying capacity. In different years, the first, second, and third places are basically surface water resources per unit area, groundwater resources per unit area, and per capita water consumption. Therefore, surface water resources and groundwater resources significantly affect the water resource carrying capacity of Zhangye City, followed by alternating per capita water consumption and urbanization rate. From the perspective of occurrence frequency, urbanization rate has a more significant impact on water resource carrying capacity. Four of the top five indicators come from the water resources subsystem, which indicates that water resources are the main obstacle factors, which significantly restricts the improvement of urban water resources carrying capacity. Therefore, in view of the factors with high environmental barriers, the following countermeasures are proposed in combination with the actual situation of the region: strengthen the supervision of water use processes and total water use control; accelerate the adjustment of industrial structure and research and development of water-saving technology; and further improve water use efficiency. In addition, it is necessary to grasp the evolution trend of water resources in time and accurately achieve the optimal allocation of water resources; strengthen the control of sewage discharge; effectively ensure ecological water use; and improve the water ecological environment.

5. Conclusions

In order to scientifically evaluate regional water resources carrying capacity, an improved TOPSIS model based on combined weights was constructed to evaluate the water resources carrying capacity of Zhangye City by taking advantage of the combined weights, which can be comprehensively determined by AHP and entropy weight methods. This model makes up for the defect of insufficient differentiation of evaluation results in the application of traditional TOPSIS methods for a comprehensive evaluation. Taking the evaluation of water resource carrying capacity in Zhangye City as an application example, the conclusions are as follows:
(1)
The combinatorial weight method combines subjective cognition and objective laws of data, making combinatorial weights more scientific and reasonable.
(2)
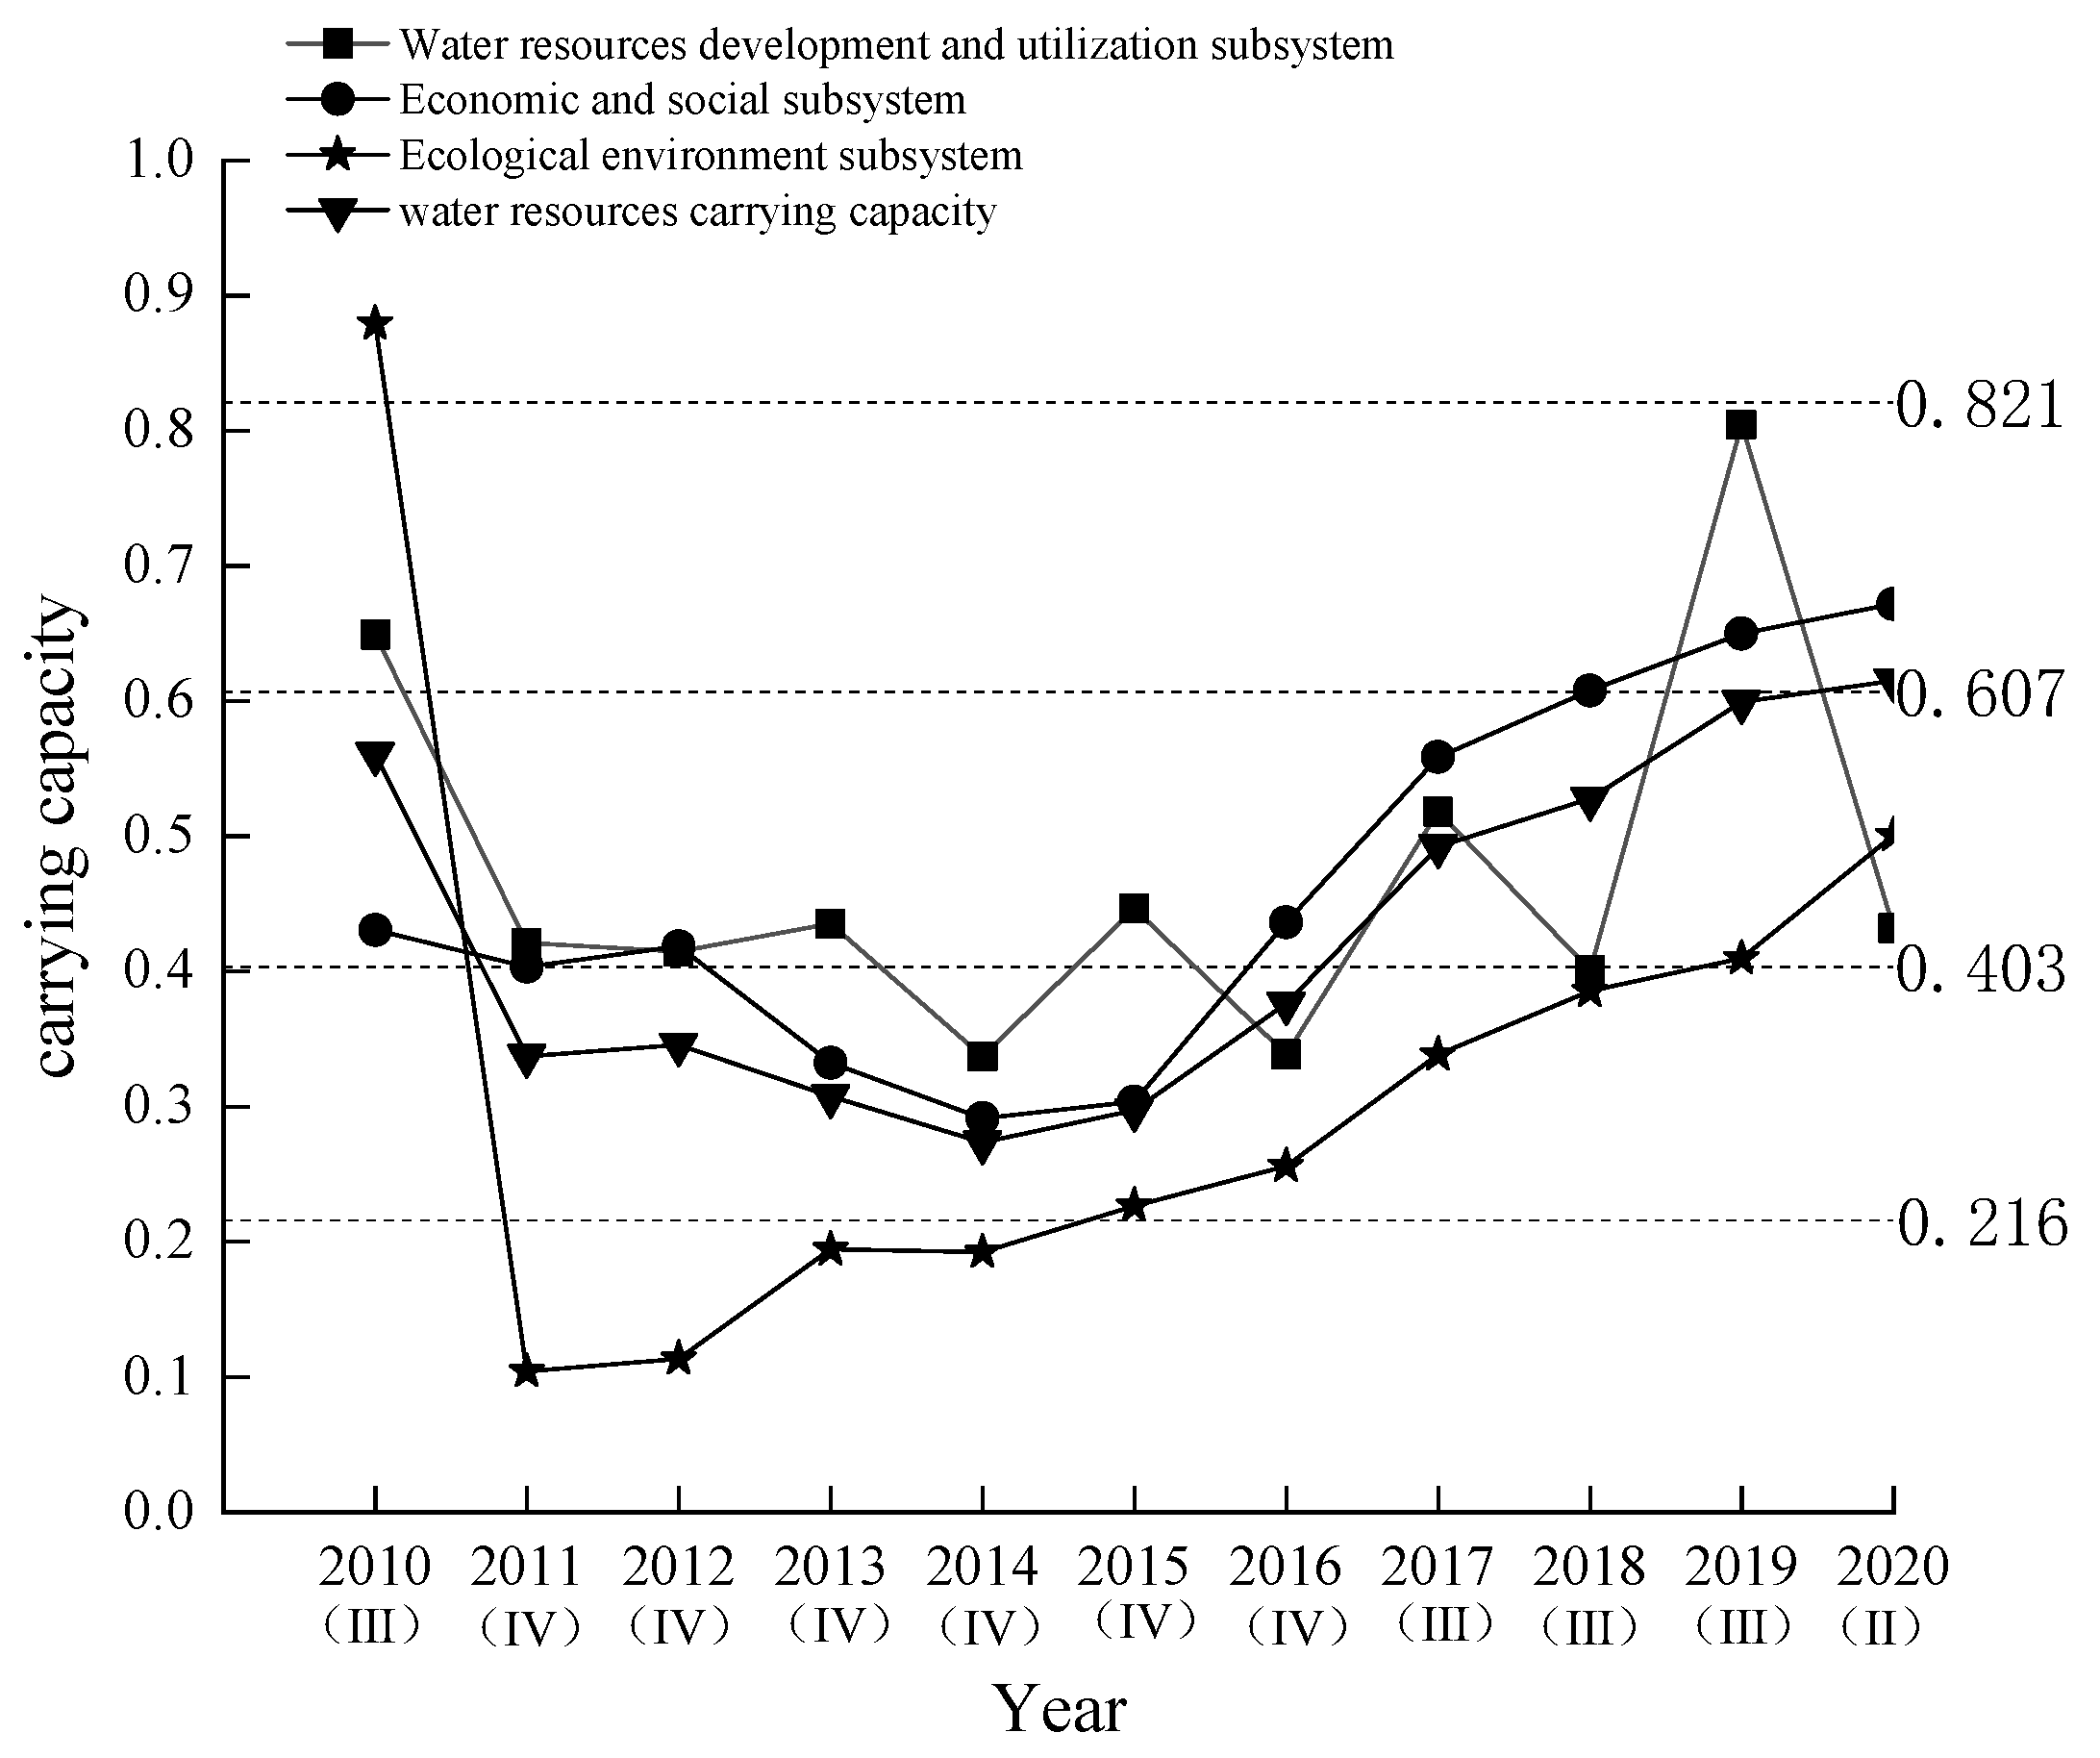
The evaluation results show that the water resources carrying capacity from 2010 to 2014 is generally stable on the macro level, but from the micro level, the water resources carrying capacity has a certain fluctuation and shows an increasing trend year by year. The closeness value of water resources carrying capacity in Zhangye City is between 0.273 and 0.561, and the grade of water resources carrying capacity is in grades III and IV. From 2014 to 2020 (except 2020), the water resources carrying capacity of Zhangye City showed an increasing trend year by year, and the closeness value of the water resources carrying capacity was between 0.297 and 0.615. The water resources carrying capacity level was still at grade III and grade IV, belonging to the medium or below medium level, indicating that the overall water resources carrying capacity of the region was weak and needed to be further improved.
(3)
From 2010 to 2020, the carrying capacity of water resource development and utilization in Zhangye City fluctuates greatly; the carrying capacity of economic and social society is basically synchronized with the carrying capacity of water resources; and the carrying capacity of the ecological environment increases the most. The steady improvement of economic and social conditions is the main factor for the improvement of the comprehensive carrying capacity of water resources in Zhangye City, and the impact of the ecological environment is also an important factor influencing the carrying capacity of water resources in Zhangye City.
(4)
The six indicators of per capita water consumption, surface water resources per unit area, per capita water resource possession, underground water resources per unit area, urbanization rate, and ecological water use rate are the main obstacles to the water resources carrying capacity of Zhangye City, of which the most influential are the indicators of surface water resources per unit area and per capita water consumption, and the main criterion layer of the water resources carrying capacity of Zhangye City is the water resources exploitation and utilization criterion layer.
(5)
Zhangye City should strengthen water resources management, optimize the water use structure of various industries, vigorously promote the whole society to save water, implement precise policies, fine-tune the water use process, improve the water utilization rate, scientifically carry out ecological protection and restoration projects, rationally carry out ecological water replenishment, and gradually eliminate environmental risks so as to further improve the water resources carrying capacity of the region.

Author Contributions

Investigation, Y.S. and S.Y.; Data curation, B.L. and W.L.; Writing—original draft, M.Y.; Writing—review & editing, D.Q.; Supervision, D.Q. All authors have read and agreed to the published version of the manuscript.

Funding

This research was funded the Higher Education Innovation Fund Project of Gansu Provincial Department of Education, (2020B-098); Northwest Normal University Young Teachers Research Ability Enhancement Program (NWNU-LKQN2020-05).

Data Availability Statement

Data are contained within the article.

Conflicts of Interest

Author Bin Liu was employed by the company Gansu Province Urban and Rural Planning Design Institute Co., Ltd. The remaining authors declare that the research was conducted in the absence of any commercial or financial relationships that could be construed as a potential conflict of interest.

References

  1. Bao, C.; Fang, C.-L. Water Resources Flows Related to Urbanization in China: Challenges and Perspectives for Water Management and Urban Development. Water Resour. Manag. 2012, 26, 531–552. [Google Scholar] [CrossRef]
  2. Hixon, M.A. Carrying Capacity. Encycl. Ecol. 2008, 265, 528–530. [Google Scholar] [CrossRef]
  3. Yang, Z.; Song, J.; Cheng, D.; Xia, J.; Li, Q.; Ahamad, M.I. Comprehensive evaluation and scenario simulation for the water resources carrying capacity in Xi’an city, China. J. Environ. Manag. 2019, 230, 221–233. [Google Scholar] [CrossRef] [PubMed]
  4. Zhang, L.; Wang, J. Progress and evaluation of domestic water resources carrying capacity research based on bibliometrics. J. Water Resour. Water Eng. 2012, 23, 56–60. [Google Scholar]
  5. Yang, Y.; Meng, G.A. A bibliometric analysis of comparative research on the evolution of international and Chinese ecological footprint research hotspots and frontiers since 2000. Ecol. Indic. 2019, 102, 650–665. [Google Scholar] [CrossRef]
  6. Cao, F.; Lu, Y.; Dong, S.; Li, X. Evaluation of natural support capacity of water resources using principal component analysis method: A case study of Fuyang district, China. Appl. Water Sci. 2020, 10, 1–8. [Google Scholar] [CrossRef]
  7. Randers, J. Elements of the system dynamics method. J. Oper. Res. Soc. 1997, 48, 1144–1145. [Google Scholar] [CrossRef]
  8. Chen, H.; Zhao, X. Dynamic monitoring of green credit risk using a hybrid gray correlation degree-TOPSIS method. Environ. Sci. Pollut. Res. 2023, 30, 23589–23612. [Google Scholar] [CrossRef]
  9. Greenacre, M.; Groenen, P.J.; Hastie, T.; d’Enza, A.I.; Markos, A.; Tuzhilina, E. Principal component analysis. Nat. Rev. Methods Primers 2022, 2, 100. [Google Scholar] [CrossRef]
  10. Behzadian, M.; Otaghsara, S.K.; Yazdani, M.; Ignatius, J. A state-of the-art survey of TOPSIS applications. Expert Syst. Appl. 2012, 39, 13051–13069. [Google Scholar] [CrossRef]
  11. Li, S.; Zhao, H.; Wang, F.; Yang, D. Evaluation of water resources carrying capacity of Jiangsu Province based on AHP-TOPSIS model. Water Resour. Prot. 2021, 37, 20–25. [Google Scholar] [CrossRef]
  12. Varis, O.; Vakkilainen, P. China’s 8 challenges to water resources management in the first quarter of the 21st Century. Geomorphology 2001, 41, 93–104. [Google Scholar] [CrossRef]
  13. Koop, S.H.A.; Van Leeuwen, C.J. Assessment of the Sustainability of Water Resources Management: A Critical Review of the City Blueprint Approach. Water Resour. Manag. 2015, 29, 5649–5670. [Google Scholar] [CrossRef]
  14. Bognár, F.; Szentes, B.; Benedek, P. Development of the PRISM risk assessment method based on a multiple AHP-TOPSIS approach. Risks 2022, 10, 213. [Google Scholar] [CrossRef]
  15. Kuspilić, M.; Vukovic, Ž.; Halkijević, I. Assessment of water resources carrying capacity for theIsland of Cres. Gradevinar 2018, 70, 305–313. [Google Scholar] [CrossRef]
  16. Marganingrum, D. Carrying capacity of water resources in Bandung Basin. In Proceedings of the IOP Conference Series: Earth and Environmental Science; IOP Publishing: Bristol, UK, 2018; Volume 118, p. 12026. [Google Scholar] [CrossRef]
  17. Kunu, P.J.; Talakua, S.; Pesulima, Y.; Uyara, L.; Laimeheriwa, S.; Osok, R.M. Carrying capacity and environmental capacity of water resources analysis in Maluku Province of Indonesia. In Proceedings of the IOP Conference Series: Earth and Environmental Science; IOP Publishing: Bristol, UK, 2021; Volume 883. [Google Scholar] [CrossRef]
  18. Xu, Y. Comprehensive evaluation of water resources carrying capacity in arid zones—A case study of Hetian River Basin in Xinjiang. J. Nat. Resour. 1993, 229–237. [Google Scholar] [CrossRef]
  19. Zhao, J.; Jin, J.; Zhu, J.; Xu, J.; Hang, Q.; Chen, Y.; Han, D. Water Resources Risk Assessment Model based on the Subjective and Objective Combination Weighting Methods. Water Resour. Manag. 2016, 30, 3027–3042. [Google Scholar] [CrossRef]
  20. He, G.; Xia, Y.; Qin, Y.; Zhu, Y.; Wang, W. Evaluation and Spatial-Temporal Dynamic Change of Water Resources Carrying Capacity in the Yangtze River Economic Belt. Res. Soil Water Conserv. 2019, 144, 287–292+300. [Google Scholar] [CrossRef]
  21. Zuo, Q.; Zhang, Z.; Wu, B. Evaluation of water resources carrying capacity of nine provinces and districts in the Yellow River Basin based on the combined weights TOPSIS model. Water Resour. Prot. 2020, 36, 1–7. [Google Scholar]
  22. Yuan, Y.; Sha, X.; Liu, Y.; Gao, Y.; Liu, J. Application of improved fuzzy comprehensive evaluation method in water resources carrying capacity evaluation. Water Resour. Prot. 2017, 33, 52–56. [Google Scholar] [CrossRef]
  23. Deng, Q.; Ping, J.; Mei, X.; Lv, P.; Miao, C. Evaluation of water resources carrying capacity in Xinxiang City based on combined weight TOPSIS model. J. Water Resour. Water Eng. 2022, 33, 81–87. [Google Scholar]
  24. Tian, X.; Li, C.; Cao, Z.; Wang, Y. Comprehensive evaluation of water resources carrying capacity in western mining areas based on TOPSIS method. Min. Res. Dev. 2020, 40, 170–175. [Google Scholar]
  25. Wang, P.; Song, X.; Xu, B.; Wang, Q.; Wang, B. Evaluation of water resources carrying capacity of Zhangye section of the Heihe River Basin and countermeasures to improve it. Glacial Permafr. 2020, 42, 1057–1066. [Google Scholar] [CrossRef]
  26. Wang, M.; Ma, Z.; Hui, X. Evaluation of water resources management based on SDA method—A case study of Zhangye City in the Black River Basin. Manag. Rev. 2018, 30, 158–164. [Google Scholar]
  27. Lv, B.; Liu, C.; Li, T.; Meng, F.; Fu, Q.; Ji, Y.; Hou, R. Evaluation of the water resource carrying capacity in Heilongjiang, eastern China, based on the improved TOPSIS model. Ecol. Indic. 2023, 150, 110208. [Google Scholar] [CrossRef]
  28. Zhang, Y.; Song, X.; Wang, X.; Jin, Z.; Chen, F. Multi-Level Fuzzy Comprehensive Evaluation for Water Resources Carrying Capacity in Xuzhou City, China. Sustainability 2023, 15, 11369. [Google Scholar] [CrossRef]
  29. Shao, W.; Zhang, Z.; Guan, Q.; Yan, Y.; Zhang, J. Comprehensive assessment of land degradation in the arid and semiarid area based on the optimal land degradation index model. CATENA 2024, 234, 107563. [Google Scholar] [CrossRef]
  30. Liu, Y.; Gao, C.; Ji, X.; Zhang, Z.; Zhang, Y.; Liu, C.; Wang, Z. Simulation of water resources carrying capacity of the Hangbu River Basin based on system dynamics model and TOPSIS method. Front. Environ. Sci. 2022, 10, 1045907. [Google Scholar] [CrossRef]
  31. Makropoulos, C.; Natsis, K.; Liu, S.; Mittas, K.; Butler, D. Decision support for sustainable option selection in integrated urban water management. Environ. Model. Softw. 2008, 23, 1448–1460. [Google Scholar] [CrossRef]
  32. Murgatroyd, A.; Hall, J.W. Selecting indicators and optimizing decision rules for long-term water resources planning. Water Resour. Res. 2021, 57, e2020WR028117. [Google Scholar] [CrossRef]
  33. Fan, J.; Liang, Y.-T.; Tao, A.-J.; Sheng, K.-R.; Ma, H.-L.; Xu, Y.; Wang, C.-S.; Sun, W. Energy policies for sustainable livelihoods and sustainable development of poor areas in China. Energy Policy 2011, 39, 1200–1212. [Google Scholar] [CrossRef]
  34. Zhang, J.; Zhang, C.; Shi, W.; Fu, Y. Quantitative evaluation and optimized utilization of water resources-water environment carrying capacity based on nature-based solutions. J. Hydrol. 2019, 568, 96–107. [Google Scholar] [CrossRef]
  35. Meng, Z.; Tang, D.; Wei, Y.; Zhang, F. Application of Harmonization Theory in Comprehensive Evaluation of Water Resources Carrying Capacity. Water Resour. Conserv. 2016, 32, 54–58. [Google Scholar] [CrossRef]
  36. Wang, J.; Zhai, Z.; Sang, X.; Li, H. Research on water resources carrying capacity index system and judgment criteria. J. Water Resour. 2017, 48, 1023–1029. [Google Scholar] [CrossRef]
  37. Kumar, R.; Singh, S.; Bilga, P.S.; Jatin; Singh, J.; Singh, S.; Scutaru, M.-L.; Pruncu, C.I. Revealing the benefits of entropy weights method for multi-objective optimization in machining operations: A critical review. J. Mater. Res. Technol. 2021, 10, 1471–1492. [Google Scholar] [CrossRef]
  38. Chen, P. Effects of the entropy weight on TOPSIS. Expert Syst. Appl. 2021, 168, 114186. [Google Scholar] [CrossRef]
  39. Oztaysi, B.A. A decision model for information technology selection using AHP integrated TOPSIS-Grey: The case of content management systems. Knowl. Based Syst. 2014, 70, 44–54. [Google Scholar] [CrossRef]
  40. Becker, W.; Saisana, M.; Paruolo, P.; Vandecasteele, I. Weights and importance in composite indicators: Closing the gap. Ecol. Indic. 2017, 80, 12–22. [Google Scholar] [CrossRef]
  41. Yoon, K.P.; Hwang, C.-L. Multiple Attribute Decision Making: An Introduction; Sage Publications, Inc.: Thousand Oaks, CA, USA, 1995; Volume Vii, p. 75. [Google Scholar] [CrossRef]
  42. Li, X. TOPSIS model with entropy weight for eco geological environmental carrying capacity assessment. Microprocess. Microsyst. 2021, 82, 103805. [Google Scholar] [CrossRef]
  43. Ruan, Y.; Gao, C.; Li, Z.; Liu, K. Evaluation of expansion and contraction grade cloud model of expansive soil based on improved AHP and entropy weight method. J. Jiangsu Univ. 2017, 38, 218–223. [Google Scholar] [CrossRef]
  44. Deng, Z.; Dai, L.; Deng, B.; Tian, X. Evaluation and spatial-temporal evolution of water resources carrying capacity in Dongting Lake Basin. J. Water Clim. Chang. 2021, 12, 2125–2135. [Google Scholar] [CrossRef]
  45. Yang, Z.; Lu, Z.; Liu, D.; Yuan, M.; Wang, F.; Rong, Z.; Huang, Y. Evaluation of ecological security in coal resource cities—The case of Xilinhot. J. Ecol. 2021, 41, 280–289. [Google Scholar] [CrossRef]
  46. Sun, Z.; Wu, Y.; Liu, W. Evaluation of water poverty and analysis of barrier factors in Dalian based on entropy weight TOPSIS method. Water Resour. Conserv. 2017, 33, 1–8. [Google Scholar] [CrossRef]
  47. Wang, Y.; Xiao, H.; Wang, R. Water scarcity and water use in economic systems in Zhangye City, Northwestern China. Water Resour. Manag. 2009, 23, 2655–2668. [Google Scholar] [CrossRef]
Figure 1. The location of the study area.
Water 15 04229 g001
Figure 2. Flow chart of water resources carrying capacity evaluation.
Water 15 04229 g002
Figure 3. Temporal variation of water resources carrying capacity in Zhangye city from 2010 to 2020.
Water 15 04229 g003
Table 1. Comprehensive evaluation index system of water resources carrying capacity status.
Target LevelStandardized LayerIndicator LayerUnit (of Measure)FormulaIndicator Polarity
Water carrying capacity (A)Water Resources Development and Utilization (B1)Surface water resources per unit area (C1)million m3·km−2Regional surface water resources/regional areagreater than zero
Groundwater resources per unit area (C2)million m3·km−2Volume of regional groundwater resources (net of duplicates)/area of regiongreater than zero
Water resources per capita (C3)m3/peopleRegional water resources (net of duplicates)/total number of people living in the regiongreater than zero
Precipitation (C4)mmAnnual precipitation in the regiongreater than zero
Economic and social (B2)Urbanization rate (C5)%Urban resident population/total resident population of the areaturn one’s back on
Per capita water use (C6)m3/personWater consumption/total resident population of the regionturn one’s back on
Water consumption of GDP (C7)m3/millionTotal regional water use/regional GDPturn one’s back on
Average acre-foot water use for agricultural irrigation (C8)m3/muAgricultural irrigation water consumption/cultivated land areaturn one’s back on
Water consumption per CNY 10,000 of industrial added value (C9)m3/millionIndustrial water consumption/industrial value addedturn one’s back on
Ecology (B3)Chemical Oxygen Demand (C10)million tstatistical dataturn one’s back on
Ammonia emissions (C11)million tstatistical dataturn one’s back on
Ecological water use rate (C12)%Ecosystem water use/total water resourcesgreater than zero
Table 2. Grading criteria for indicators for evaluating the state of water resources carrying capacity.
RatingClass IClass IIClass IIIClass IVClass V
C1: Surface water resources per unit area/(10,000 m3·km−2 )≥25[20, 25][15, 20][10, 15]<10
C2: Groundwater resources per unit area/(10,000 m3·km−2)≥7[6, 7)[5, 6][4, 5)<4
C3: Per capita water availability/(m3/person)≥2000[1700, 2000][1000, 1700][500, 1000)<500
C4: Average annual precipitation/(mm)≥800[600, 800][400, 600][200, 400]<200
C5: Urbanization rate/(%)<40[40, 45][45, 50][50, 55]≥55
C6: Per capita water consumption (m3/person)<200[200, 300][300, 400][400, 500]≥500
C7: GDP water use (m3/million dollars)<200[200, 400][400, 600][600, 800]≥800
C8: Average acreage water use for agricultural irrigation (m3/mu)<300[300, 400][400, 500][500, 600]≥600
C9: Water consumption per CNY 10,000 of industrial added value (m3/10,000 CNY)<15[15, 50][50, 100][100, 200]≥200
C10: Chemical Oxygen Demand (million tons)<1[1, 3)[3, 5)[5, 10]≥10
C11: Ammonia nitrogen emissions (million tons)<0.1[0.1, 0.3)[0.3, 0.5)[0.5, 1)≥1
C12: Ecological water use rate (%)≥5[3, 5)[2, 3)[1, 2)<1
Table 3. Results of weighting calculations.
Evaluation IndicatorsAHP WeightingEntropy WeightPortfolio Weighting
C10.2320.0890.161
C60.2050.080.142
C20.1150.0980.106
C50.0980.0860.092
C120.0830.0820.083
C100.0690.0760.073
C30.0550.0820.068
C110.0490.0860.067
C90.0340.0970.066
C70.0230.0980.061
C40.0230.0670.045
C80.0140.0590.036
Table 4. Barrier degree of water resources carrying capacity evaluation indicators in Zhangye City, 2010–2020.
VintagesC1C2C3C4C5C6C7C8C9C10C11C12
201018.0911.447.714.896.3915.798.454.999.141.833.377.92
201116.7710.867.124.905.9614.706.634.297.038.286.976.48
201216.5211.347.164.616.5714.326.204.416.947.677.696.55
201316.9310.947.164.947.1616.715.683.736.267.447.175.88
201416.2411.756.894.497.6317.125.453.976.177.256.406.66
201516.3611.406.904.508.4716.695.394.145.697.306.196.96
201615.9213.726.785.039.3514.045.193.545.667.276.177.32
201716.7312.687.064.7110.7512.475.363.405.687.235.977.96
201819.4611.768.125.3211.2711.204.992.435.587.105.457.31
201919.419.827.994.9012.6410.575.092.755.557.295.898.07
202020.8412.258.655.7213.158.644.872.084.946.605.306.96
average value17.5711.637.414.919.0313.845.753.616.246.846.057.10
Disclaimer/Publisher’s Note: The statements, opinions and data contained in all publications are solely those of the individual author(s) and contributor(s) and not of MDPI and/or the editor(s). MDPI and/or the editor(s) disclaim responsibility for any injury to people or property resulting from any ideas, methods, instructions or products referred to in the content.

