Abstract
Understanding the residence time, flow velocities, and storage volumes in fractured rock aquifers is essential for assessing the sustainable use of groundwater in island aquifer systems. Environmental tracers such as tritium (3H) and sulfur hexafluoride (SF6) that enter the aquifer systems through natural hydrological processes are effectively used to quantify the “apparent age” of young groundwater (<60 years) to calculate these aquifer characteristics. The island of Tobago is predominantly a fractured rock aquifer system that contains groundwater sub-basins that produce 100–1000% more than their calculated recharge. In this study, we analyzed ten samples from groundwater wells throughout the island for environmental tracers to establish the “apparent age” of the groundwater. We then estimated the active flux and storage volume of the aquifer. The 3H results of ten wells throughout the island range between 0.02 and 0.60 TU. The groundwater samples to the south of the island possess more pre-modern groundwater ages (older ages) than samples in the north of the island. These tritium values reveal age ranges between 18 and 60–plus years. This finding suggests that fractures create flow paths oriented towards the southern parts of the basin that enable the transport of groundwater across significant topographic boundaries and watershed divides. Additionally, the data may support that southern wells are connected to isolated old sources of groundwater. SF6 values range between 0.91 and 7.97 (part per trillion volume) with an interpreted age range between 18 and 39 years. Both tracers support the original hypothesis that longer residence time waters are located south of the island except for three SF6 samples which are believed to be affected by “excess air”.
1. Introduction
Severe droughts in the Caribbean such as the Pan-Caribbean Drought of 2013 to 2016 led to increased water shortages throughout the region [1]. This phenomenon has urgently increased the necessity of the Caribbean islands to understand their water resources and practice sustainable use. Small islands are more susceptible to groundwater shortages because of their limited surface area catchment sizes and storage capacities, and they are at higher risk for water supplies to be affected by pollution and overuse [1,2,3]. Climate models predict that projected precipitation will be reduced in the region, leading to longer dry seasons and further stressing surface and groundwater resources [4].
Fractured bedrock aquifers have been shown to be reliable sources of potable water which can store and sometimes transport large quantities of groundwater [5]. These aquifers, in contrast to porous media aquifer systems, present a myriad of challenges since fractures may possess an array of hydrologic conductivities, storage capacities, and flow velocities [6,7,8]. Therefore, the assessment of these water deposits requires the use of multiple methods of analysis [9,10]. Furthermore, an agglomerate of fractures and faults may transport and mix groundwater at various transit times and distances, some of which defy surficial groundwater divides or topographical boundaries [11,12].
The island of Tobago contains a geologically complex aquifer system that is predominantly igneous and metamorphic rocks. There are small sedimentary deposits scattered throughout the island and a carbonate platform in the southern region which overlays basaltic basement rocks [10] (Figure 1). The bedrock of Tobago also contains many fractures, faults, and lineaments which are remnants of the active tectonic history of the region [13].
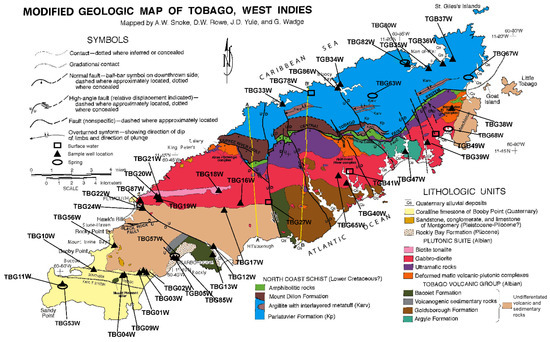
Figure 1.
Modified Geological Map of Tobago from [10], showing sample locations of groundwater, surface water and springs, structural features, and lithological units. Reprinted/adapted with permission from Arthur Snoke. Copyright 2001, The Geological Society of America.
A recent hydrological assessment of the island’s fractured rock aquifer system [11] used an integrated approach that included isotopic analysis, annual recharge estimates, and steady-state groundwater modeling (Figure 2). They found that some groundwater catchments were overproducing 100–1000% more water than their local calculated recharge [11] (Figure 2). These results raised new questions about this aquifer system: (1) What is the source or source of this excess water? (2) What are the roles of the fractures and faults in this system in groundwater transport? (3) How will this aquifer react to changes in seasonal recharge?
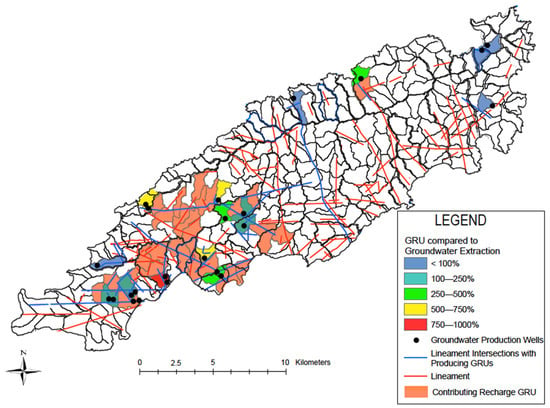
Figure 2.
Map illustrating the relationship between total amount of in place groundwater recharge units (GRU) and groundwater extraction in percentages from [11] (adapted with permission of David Boutt, 2021).
The analysis of Tobago’s groundwater “apparent age” using environmental tracers’ tritium (3H) and sulfur hexafluoride (SF6) measurements aims to prove that the groundwater in the southern region of the island is older than the groundwater in the north. Additionally, the “apparent age” will be used as groundwater residence times to calculate storage volume, effective porosity, and groundwater velocity of the basins.
2. Geology and Hydrogeology of the Island
The islands Republic of Trinidad and Tobago are located northeast of Venezuela and are the last two islands of the Lesser Antilles. Tobago is the smaller of the two and is approximately 300 square kilometers, with its highest elevation in the Tobago Forest Reserve, ~580 m above sea level [11]. The island contains a population of 1.395 million people, according to the World Bank in 2019, and is well known as a vacation destination.
Tobago is predominantly composed of igneous and metamorphic rocks, ranging from Mesozoic to Cenozoic in age: the North Coast Schist, the Tobago Volcanic Group, and a Plutonic Suite [10,14,15,16]. The sedimentary Holocene surficial deposits include limestone, sandstones, fossiliferous clays, and gravels that represent archives of sea-level changes (Figure 1) [13]. The island’s geographical location near the South American Plate and Caribbean Boundaries has created multiple deformation events, forming N–S to NW–SE and W–E faults [11,13]. Most of the aquifers on the island are not composed of porous media [17]. Instead, they contain saprolite covers ranging from 1–8 m deep and faults and fractures that provide storage and preferential flow paths [11]. The production wells located in these igneous and metamorphic rocks have historically been shown to produce significant amounts of potable water [11]. The unconsolidated sedimentary deposits, such as The Rockly Bay formation, contain mixed layers of sand, gravel, and clay. The permeable layers in these deposits provide and transmit a moderate amount of recharge of the fractured rocks below [11]
The carbonate to the south of the island has the lowest elevations above sea-level and is approximately 12 m thick. This deposit contains some areas of high secondary porosity, but the base of this unit is 10 m below sea-level, making it susceptible to sea water intrusions.
Tobago has a tropical climate, and the air masses that provide precipitation are transported by the Atlantic Trade Winds from the north/northeast direction. There are two distinct seasons: the wet season from June to December, and the dry season January to May. A 50-year record of precipitation from 16 stations that was >95% complete was used to calculate the monthly average precipitation on the island [11]. Precipitation amount and intensity vary due to the orographic effect caused by the elevation of the mountain ridge (580 m), and surficial flow is radial in direction from the middle elevated ridge region of the island [11]. During the dry season, the maximum rainfall is recorded in March as ~40 mm, and the wet season maximum rainfall was recorded in November as ~300 mm [11]. The annual mean precipitation on the island is approximately 1900 mm, and the terrain is affected by high evapotranspiration of ~1200 mm/year and annual mean stream discharge of ~380 mm/year [11]. There are many rivers and streams on the island, and their flow intensities reflect seasonal changes with lower flows during the dry season [11].
3. Methodology
3.1. Tritium as a Tracer for Groundwater Age Determination
Tritium (3H) is a radioactive isotope with a half-life of 12.43 years and is a reliable tracer for the dating of young waters < 60 years old [18]. Tritium concentrations are measured in tritium units where 1 TU equals 1 3H atom in 1018 atoms of hydrogen. Before the initiation of nuclear testing in 1953, the tritium concentration in the atmosphere ranged from 2–8 TU; however, after the advent of nuclear testing, the concentration spiked in the atmosphere between 1953 and 1964 [18]. There are still many unknowns about the amount of tritium pre-1952; however, it has been calculated that before this event, waters contained a maximum tritium concentration of 0.1 to 0.4 TU [18]. Water safter this period contains increased tritium, which allows it to be utilized as a chemical marker for water age calculation. We decided to use this method of young groundwater age dating because tritium is one of the most reliable tracers for young groundwaters.
3.2. Sulfur Hexafluoride as Method for Groundwater Age Determination
Sulfur Hexafluoride (SF6) is also used to age date water < 50 years old and aid in resolving the extent of mixing in groundwaters [17]. SF6 is a gas commonly used in the production of electrical switches and metal casting processes because of its inert characteristics [19,20]. Long-term monitoring of this gas in the atmosphere shows it is increasing at a rate of 7% per year, dissolving in precipitation and making its way into groundwater, so serving as a reliable tool in the calculation of groundwater age and water flow paths [17,19]. There is also a small percentage of SF6 that is introduced into the atmosphere and groundwater through terrigenic processes, such as the weathering of mineral fluorite and volcanic activity [10].
3.3. Sampling Procedure
Ten wells throughout the island were chosen for environmental tracers’ tritium analysis and sulfur hexafluoride analysis (TBG85W, TBG16W, TBG20W, TBG03W, TBG37W, TBG18W, TBG12W, TBG04W, TBG38W and TBG88W). Tritium samples were collected from access points delivered from municipal large-diameter water supply wells in 1 L high-density polyethylene (HDPE) bottles, while the samples of SF6 were collected 1 L plastic-coated, amber glass bottles with polyseal cone-lined caps. The samples were collected by a water displacement method using copper tubing and a metal bucket to prevent contamination from atmospheric gases.
3.4. Laboratory Techniques/Analytical Procedure
Tritium and SF6 were analyzed at the University of Utah Noble Gas Laboratory, Salt Lake City, UT, USA. Tritium concentrations were determined through helium ingrowth where waters are degassed in a stainless-steel flask, given approximately six months to decay, and then measured by a Mass Analyzer (Model 215-50 Magnetic Sector Mass Spectrometer). The SF6 samples were analyzed by gas chromatography. The instrument is calibrated to bulk air standards (a referenced air sample from Niwot Ridge, Colorado) (Climate Monitoring and Diagnostics Laboratory (CMDL)) and methods described in [21,22,23].
3.5. Groundwater “Apparent Age” Dating Using Tritium
Groundwater dating using tritium requires historical tritium precipitation data for the calculation of natural background tritium levels. This data also allows assumptions to be made so that sample ages can be grouped as modern, mixed or premodern groundwater [18]. Historical or current measurements of tritium in Trinidad and Tobago do not exist, so monthly tritium precipitation data from 1964 to 1991 from the island of Barbados was used to represent tritium levels for Tobago due to its geographical and climatic proximity. This data was acquired from the International Association of Atomic Energy Agency (IAEA) and was essential for our interpretation of the well samples since tritium concentration in precipitation decreases towards the equator [24]. The monthly precipitation data was then converted to the annual average, which ranged in values from 1 to 154 TU’s. Each annual tritium average was then decayed to 2019 using the below equation [25]:
where N is the number of atoms; N0 is the number of tritium atoms at time zero; t is the time in years; λ is equal to ln (2)/t1/2; and t1/2 is equal to 12.43 years. The equation of the line from the exponential curve was used to calculate the tritium precipitation projected to the year 2019 (Figure 3) (red dashed line). The lowest tritium precipitation level from the Barbados precipitation raw data was 1.87 TU; however, the lowest value from the exponential curve was 1.37 TU. We decided to use the value (1.37 TU) to represent the background tritium level in the atmosphere that is created by natural nuclear reactions in the upper atmosphere. It was also assumed to be the modern water threshold, meaning all groundwater tritium samples above this amount are modern groundwater (Table 1) (Figure 3).
Tritium (3H): N = N0e−λt or ln = ln N0e−λt.
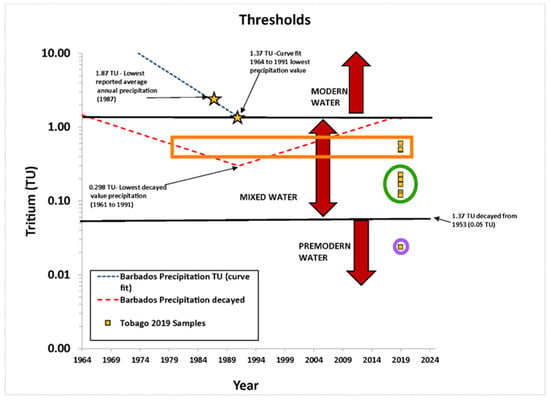
Figure 3.
Tritium analysis of Tobago’s groundwater using thresholds from historical precipitation tritium data of Barbados.

Table 1.
Tritium and sulfur hexafluoride with analytical errors and uncorrected values.
3.6. Groundwater “Apparent Age” Dating Using Sulfur Hexafluoride
The sulfur hexafluoride analysis was performed using the methods described in [26] (air curve revised in 2011) and equations discussed in [27]. In summary, SF6 concentrations were tabulated using the approximate value of 1 mL “excess air” from the sample bottle, atmospheric recharge temperature of 24 °C, and well elevation (m) asl. The resulting values are seen in Table 2 as the uncorrected values and corrected values. The recharge year and apparent age were then calculated using the Piston Flow Model.

Table 2.
SF6 uncorrected and corrected values and 3H well samples ages.
3.7. The Use of “Apparent Age” in Storage Volume, Effective Porosity, and Flow Velocity Calculations
The “apparent age” can be used to assess the important characteristics of aquifers, such as the total water volume, effective porosity (ne), and flow velocities of basins and GRUs by the manipulation of the residence time equation (Equations (2)–(5)), with the addition of aquifer thickness (well depth), basin and GRU flux, and area data from [3]. Please note these quantities were calculated for both the GRU and basins in the Supplementary Section.
Residence time (τ) = Volume of water (Vw)
Flux (Q)
Flux (Q)
Volume of water (Vw) = τ * Q
Effective porosity (ne) = Vw/Va
Groundwater velocity = Distance to the top of the basin/τ
The “apparent age” is substituted as the residence time, and the flux is represented by the steady state model result groundwater recharge fluxes from [3]. These inputs allow the calculation of the amount in the basin and GRU reservoirs.
3.8. Kriging Prediction Maps
Only 10 wells were sampled for environmental tracer analysis, so geostatistical analysis was used to create prediction maps to show possible age values for the rest of the island. The kriging tool in ArcGIS 2.8 was used to interpolate age values throughout the entire island for both 3H and SF6. Please note two control points were added to the tritium data near TBG20W, because the program treated the highest value (>60 years) as an outlier without them.
4. Results
4.1. Tritium
To establish the concentration of premodern groundwater, we need to constrain the historical tritium concentration in the input (precipitation). As mentioned earlier, tritium in precipitation has never been measured in Trinidad and Tobago; however, we had access to and used Barbados precipitation tritium measurements for our age calculations. The precipitation tritium data is fit to an exponential function because the equation could be used to project tritium levels in the atmosphere for dates after 1991, which are needed for our analysis. The lowest tritium value of (1.37 TU) is used as the background tritium amount in precipitation in Tobago today, and it was also used to represent the atmospheric tritium value in Tobago precipitation before nuclear testing 1953 (Figure 3) [27]. We then decay that value to 2019 using Equation (1), which resulted in a tritium concentration of 0.05 TU. This value represents what precipitation tritium preatomic bomb would be in the year 2019 after decay. This value is also used as the premodern ground water threshold, meaning all tritium values beneath that amount indicate premodern water, therefore older than 60 years (Figure 3).
The region in between the modern and premodern tritium groundwater values are considered mixed in composition. All of Tobago’s groundwater tritium values range from 0.02 to 0.60 TU (yellow squares, Figure 3) (Table 2). The results of the ten wells analyzed illustrates that there is a variety of age groups in the island’s aquifer system.
The sample grouped in the orange rectangle could potentially have two ages since the orange rectangle connects to two locations on the red dashed decayed value line. The age values for those samples can be 12 to 22 years, or 32 to 42 years old (TGB16W, TBG37W, TBG39W). The sample in the green circle (TBG03W, TBG04W, TBG12W, TBG18W, TGB85W and TBG88W) fall beneath the decay line, which suggests that all these samples are older than 27 years. Finally, sample TBG20W is located beneath the premodern threshold line, which indicates that this water is older than 60 years (purple circle).
The groundwater tritium results were then plotted spatially on the GRU comparison map with pie charts to represent the modern groundwater (orange segments) and premodern/older water (black). This map further revealed that the older ground waters are located to the south of the island (Figure 4).
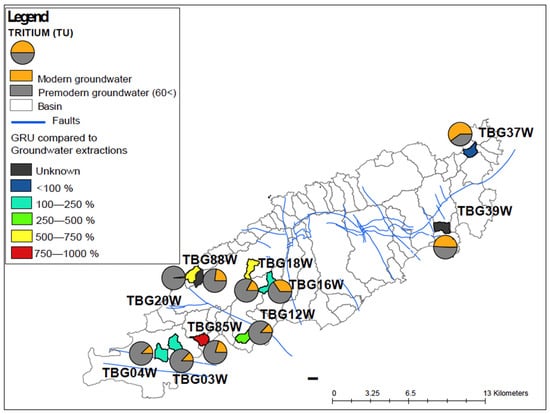
Figure 4.
Percent groundwater age represented in pie charts (grey represents premodern water, and orange represent, modern water) and GRU compared to groundwater extraction map.
4.2. Sulfur Hexafluoride
The sulfur hexafluoride results present a range of values between 0.91 and 7.27 Pptv with interpreted age ranges between 18 and 39 years (Table 1 and Table 2). Since this environmental tracer has been increasing at a rate of 7% per year since the 1960′s [19], we expect to see larger values for premodern waters and smaller values for young water. Unlike the tritium results, SF6 results show that both the oldest and youngest waters are in the southern region of the island, with the oldest water located in wells TBG03W, TBG12W, and TBG88W, and the youngest water are in wells TBG04W, TBG20W, and TBG085W (Table 2). Samples with larger concentrations of SF6 contain 2.4 to 2.85 Pptv less than the atmospheric level measured in mid-2018 (Figure 5).
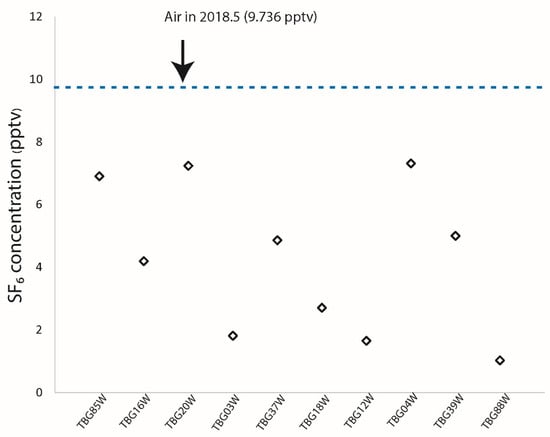
Figure 5.
SF6 water concentration per well location Pptv.
5. Discussion
5.1. Tracers
The tritium results directly support the hypothesis that water sampled from wells in the southern region of the island contains more premodern water. The SF6 data, however, displayed mixed results, which is illustrated in Figure 5 and Figure 6. When tritium and SF6 are assessed in a bivariant plot, we expect to see lower tritium and SF6 to represent premodern water and the reverse for modern waters. Most of the environmental tracer results support the hypothesis that premodern water samples are located to the south of the island, except for three SF6 samples (Figure 6). These values are considered very high, and the samples were expected to contain very little SF6 because the tritium results show that they are some of the oldest waters in the island. We consider that these outliers contain “excess air” which is modern air dissolved in the groundwater, causing the large increases of SF6 in the samples. Tritium results are considered to be more reliable because the hydrogen atom is part of the water molecule and its values are decay dependent [28]. Therefore, if the SF6 age values of these three wells were correct, then the 3H values would also reflect younger ages. SF6 can increase in groundwater through terrigenic sources (dissolution of fluorite and volcanism) [19,26,28]. The higher SF6 values in groundwater samples can originate from compressed air used in well installation or trapped air in the subsurface high recharge locations [29]. Though methods to clearly distinguish between these two sources are still being developed, the SF6 atmospheric concentration from the year that the wells were installed can be used to assess if the “excess air” was added to the system during the drilling. Other possible causes of “excess air” that have not been thoroughly studied include the effect of fracture rock aquifer wells that have histories of production above the safe yield thresholds. An analysis of the island’s production wells and their adjacent monitoring wells were completed, and it showed that these three wells were producing above their safe yields for some years in the past. The large drawdowns of these wells especially during dry periods could increase the amount of modern air in the fractures, which can become trapped as the well water storage is replenished.
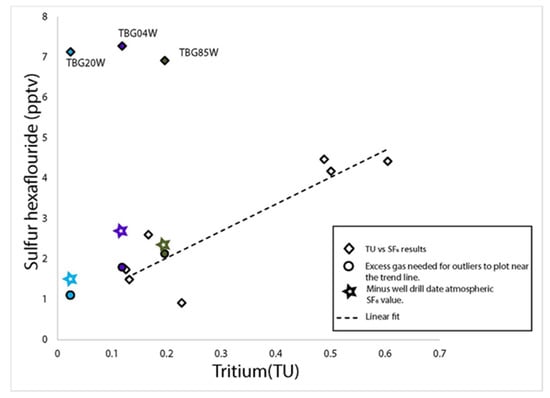
Figure 6.
Bivariant plotting of SF6 and 3H showing the SF6 outliers (colored diamonds). The linear fit was calculated, excluding the outliers. Colored circles represent outliers corrected by the approximation of “excess air”, and colored stars represent the outliers corrected for “excess air” using the SF6 concentration in the atmosphere during the year the wells were drilled.
We used two methods to assess the corrections needed for the three SF6 outliers. The first method was discussed by [30], where the of SF6 concentration in the atmosphere during the well installation year is used as the correction value (Figure 6 and Table 3). Please note that the installation year for TBG20W is not known, so we used the year the well production data record began in 2006. The result is seen in Figure 6 where the colored diamonds represent the wells with this correction.

Table 3.
SF6 outlier data with excess air calculations.
We also calculated the approximate amount of “excess air” that needs to be subtracted from these samples to plot close to the linear fit line (Table 3). We subtracted between 15 mL and 35 mL of “excess” air from their measured results to fall within the expected range of correct values. The colored circles in Figure 6 show where these samples will plot after the concentrations of the excess air is subtracted.
The ages of the tritium and the SF6 results with an approximation of corrected values were plotted spatially and made visually comparable by bar graphs on a modified [10] geological map (Figure 7). The result implies that the wells in the island’s southern region contain the oldest groundwater.
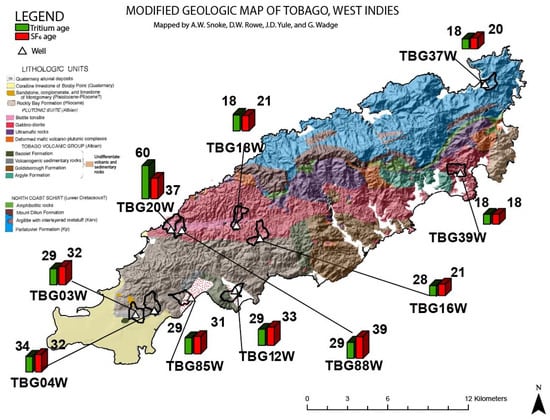
Figure 7.
Modified geological map from [10] showing the locations and lithology of wells, and their age comparisons. Reprinted/adapted with permission from Arthur Snoke. Copyright 2001, The Geological Society of America.
Kriging statistical projection maps of both environmental tracers were created to calculate ground water ages throughout the island based on the results of the ten wells (Figure 8a,b). These interpolated results show similar trends of increases to the southwest of the island.
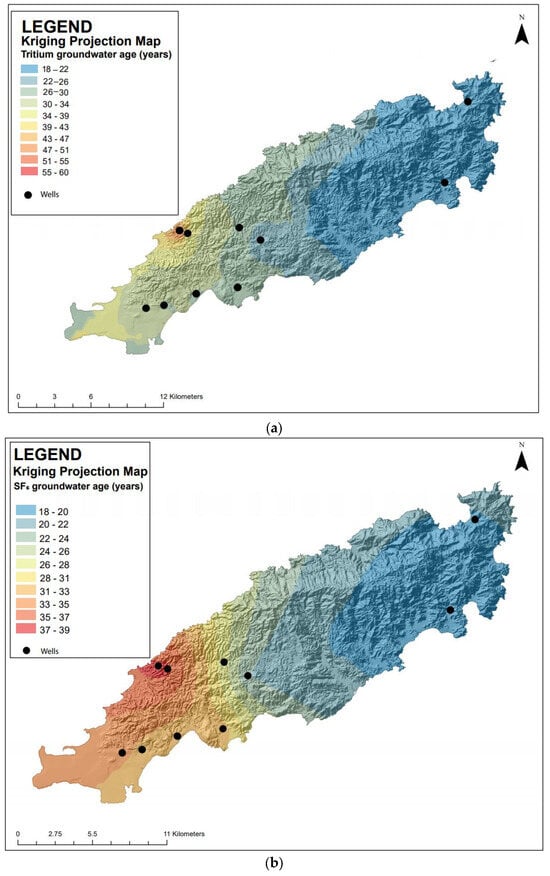
Figure 8.
Kriging projections for both (a) tritium and (b) sulfur hexafluoride throughout Tobago.
Tobago’s groundwater tritium levels were also compared to groundwater tritium publications of other island aquifers at similar latitudinal locations (Figure 9) [28,29,31]. The dates, to which the samples in these studies were collected, were all decayed to 2019. The results reflect similar value ranges; however, Tobago’s samples contain the lowest median and mean results, suggesting that it has older water ages in general compared to all the other islands. It is also very significant due to the fact the Tobago is located close to the equator and its aquifer was expected to contain only younger groundwater.
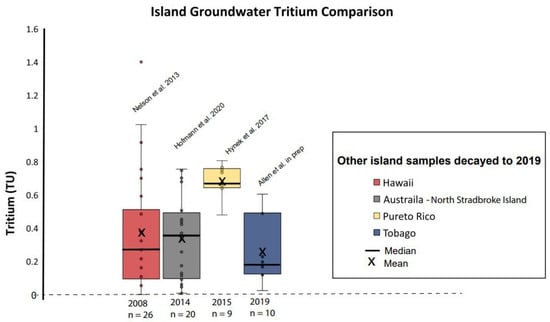
Figure 9.
Tobago groundwater tritium results compared to other islands [28,29,31].
5.2. Storage and Residence Time and Flow Velocities
The “apparent age” results of Tobago’s groundwater also presented an opportunity to calculate other aquifer characteristics by substituting its values for the residence times for the groundwater in these wells. These calculations were completed with data from [11], which included all of the basin and GRU fluxes presented by their steady state model, as well as the GRU and basin volume and area measurements. We calculated aquifer storage volume size, flow velocity, and effective porosity (specific yield) of the aquifer (Equations (2)–(5)) (Table S1).
All the watershed volumes for these ten wells are multiple orders of magnitude greater than the volume of water that can be contained in the GRU’s (Table S1). Therefore, the production level can be maintained once there is consistent recharge. However, there are few wells with notable characteristics: Well TBG20W GRU and basin volumes are nearly proportional to each other (8,362,011 and 8,415,465 m3 respectively). Since this is the only well in this highly producing GRU and it is already producing more than 99% of the watershed recharge, new wells should not be placed in this watershed or GRU. This well also possesses one of the smaller groundwater velocities compared to the other wells (0.30 km/yr); however, the aquifer is very productive because both the GRU and the basin’s highly effective porosity increases flow capacity (0.160 and 0.136 respectively) (Table S1).
It must also be noted that the flow velocity has a direct correlation to the groundwater age in this aquifer. For example, wells with the most premodern waters possess the slowest velocities though there are smaller distances between the well and the top of their watersheds (TBG20W, TBG88W). These calculations provide preliminary insight into these aquifer systems, which can be compared to groundwater models that are created for the island. They also provide tools to effectively manage these watersheds, especially during periods of droughts. Safe yield production levels can now be more efficiently calculated, especially in changing climate scenarios. During severe drought periods, the wells whose productions are supported by a majority of premodern water can be used at increased capacities.
6. Conclusions
Ten wells were sampled for “apparent age” analysis of environmental tracers tritium and sulfur hexafluoride. The age range of the tritium samples was 18 to >60 years old, while the SF6 ranged between 18 and 39 years. Both methods suggest that the waters in the southern region are older than waters in the north, except for three SF6 samples which are believed to be affected by “excess air” contamination. Therefore, caution should be used when interpreting this environmental tracer in a fracture rock system.
We calculated the effective porosities of both GRUs and basins, and it was found that the GRUs where TBG03W and TBG20W are located contain values similar to those of gravels. The most important revelation of these findings is that there are waters greater than 60 years old on such a small island; however, it is still not known if a deep old groundwater source or longer flow paths are providing this premodern water.
This research can be improved by observing how this system reacts to changing climate scenarios over long periods of time. This observation can be achieved by annual environmental tracer testing and transient groundwater modelling, the results of which can aid in safe yield production levels for individual wells and promote the sustainable use of this aquifer.
Supplementary Materials
The following supporting information can be downloaded at: https://www.mdpi.com/article/10.3390/w15244231/s1, Excel Table S1. Storage volume, effective porosity, and flow velocity calculations.
Author Contributions
Conceptualization, M.A. and D.B.; methodology, M.A. and D.B.; software, M.A.; validation, M.A. and D.B.; formal analysis, M.A. and D.B.; investigation, M.A. and D.B.; resources, M.A. and D.B.; data curation, M.A. and D.B.; writing—original draft preparation, M.A.; writing—review and editing, M.A. and D.B.; visualization, M.A.; supervision, D.B.; project administration, M.A.; funding acquisition, M.A. All authors have read and agreed to the published version of the manuscript.
Funding
This research was partly funded by the International Association of GeoChemistry.
Data Availability Statement
This data is available upon request.
Acknowledgments
This research would not have been possible without support from the Trinidad and Tobago Water and Sewage Authority (WASA), more specifically field technicians Junior A. Paul, Carissa Caton Phillips, Allison Jordan, and Priscilla Jacob. Special thanks to the International Association of Atomic Energy Agency for access to their tritium precipitation database.
Conflicts of Interest
The authors declare no conflict of interest.
References
- Herrera, D.A.; Ault, T.R.; Fasullo, J.T.; Coats, S.J.; Carrillo, C.M.; Cook, B.I.; Williams, A.P. Exacerbation of the 2013–2016 Pan-Caribbean Drought by Anthropogenic Warming. Geophys. Res. Lett. 2018, 45, 10619–10626. [Google Scholar] [CrossRef] [PubMed]
- Karmalkar, A.V.; Taylor, M.A.; Campbell, J.; Stephenson, T.; New, M.; Centella, A.; Benzanilla, A.; Charlery, J. A review of observed and projected changes in climate for the islands in the Caribbean. Atmosfera 2013, 26, 283–309. [Google Scholar] [CrossRef]
- Schneider, J.C.; Kruse, S.E. A comparison of controls on freshwater lens morphology of small carbonate and siliciclastic islands: Examples from barrier islands in Florida, USA. J. Hydrol. 2003, 284, 253–269. [Google Scholar] [CrossRef]
- UNESCO (1986) Final Report. In Proceedings of the First Workshop on the Hydrogeological Atlas of the Caribbean Islands, Santo Domingo, Dominican Republic, 7–10 October 1986; UNESCO/ROSTLAC: Montevideo, Uruguay, 1986; p. 229.
- Gustafson, G.; Krásný, J. Crystalline Rock Aquifers: Their Occurrence, Use and Importance. Appl. Hydrogeol. 1994, 2, 64–75. [Google Scholar] [CrossRef]
- Earnest, E.; Boutt, D. Investigating the role of hydromechanical coupling on flow and transport in shallow fractured-rock aquifers. Hydrogeol. J. 2014, 22, 1573–1591. [Google Scholar] [CrossRef]
- Enemark, T.; Peeters, L.J.; Mallants, D.; Batelaan, O. Hydrogeological conceptual model building and testing: A review. J. Hydrol. 2019, 569, 310–329. [Google Scholar] [CrossRef]
- Morin, R.H.; Savage, W.Z. Effects of crustal stresses on fluid transport in fractured rock: Case studies from northeastern and southwestern USA. Hydrogeol. J. 2003, 11, 100–112. [Google Scholar] [CrossRef][Green Version]
- Bense, V.F.; Gleeson, T.; Loveless, S.E.; Bour, O.; Scibek, J. Fault zone hydrogeology. Earth-Sci. Rev. 2013, 127, 171–192. [Google Scholar] [CrossRef]
- Snoke, A.W.; Rowe, D.W.; Yule, J.D.; Wadge, G. Petrologic and structural history of Tobago, West Indies: A fragment of the accreted Mesozoic oceanic arc of the southern Caribbean. In Special Paper 354: Petrologic and Structural History of Tobago, West Indies: A Fragment of the Accreted Mesozoic Oceanic Arc of the Southern Caribbean; Geological Society of America: Boulder, CO, USA, 2007. [Google Scholar] [CrossRef]
- Boutt, D.F.; Allen, M.; Settembrino, M.; Bonarigo, A.; Ingari, J.; Demars, R.; Munk, L.A. Groundwater recharge to a structurally complex aquifer system on the island of Tobago (Republic of Trinidad and Tobago). Hydrogeol. J. 2021, 29, 799–818. [Google Scholar] [CrossRef]
- Genereux, D.P.; Jordan, M. Interbasin groundwater flow and groundwater interaction with surface water in a lowland rainforest, Costa Rica: A review. J. Hydrol. 2006, 320, 385–399. [Google Scholar] [CrossRef]
- Shapiro, A.M.; Evans, C.E.; Hayes, E.C. Porosity and pore size distribution in a sedimentary rock: Implications for the distribution of chlorinated solvents. J. Contam. Hydrol. 2017, 203, 70–84. [Google Scholar] [CrossRef] [PubMed]
- Aitken, T.; Mann, P.; Escalona, A.; Christeson, G.L. Evolution of the Grenada and Tobago basins and implications for arc migration. Mar. Pet. Geol. 2011, 28, 235–258. [Google Scholar] [CrossRef]
- Speed, R.C.; Smith-Horowitz, P.L. The Tobago Terrane. Int. Geol. Rev. 1998, 40, 805–830. [Google Scholar] [CrossRef]
- Speed, R.C.; Smith-Horowitz, P.L.; Perch-Nielsen, K.v.S.; Saunders, J.B.; Sanfilippo, A.B. Southern Lesser Antilles Arc Platform: Pre-Late Miocene Stratigraphy, Structure, and Tectonic Evolution; Geological Society of America: Boulder, CO, USA, 1993; Volume 277. [Google Scholar] [CrossRef]
- Gooddy, D.C.; Darling, W.G.; Abesser, C.; Lapworth, D.J. Using chlorofluorocarbons (CFCs) and sulphur hexafluoride (SF6) to characterise groundwater movement and residence time in a lowland Chalk catchment. J. Hydrol. 2006, 330, 44–52. [Google Scholar] [CrossRef]
- Kendall, C.; Doctor, D.; Young, M. Environmental Isotope Applications in Hydrologic Studies. In Treatise on Geochemistry, 2nd ed.; Elsevier: Amsterdam, The Netherlands, 2014; Volume 7, pp. 273–327. [Google Scholar]
- Darling, W.; Gooddy, D.; MacDonald, A.; Morris, B. The practicalities of using CFCs and SF6 for groundwater dating and tracing. Appl. Geochem. 2012, 27, 1688–1697. [Google Scholar] [CrossRef]
- Svoray, T.; Assouline, S.; Katu, G. Introduction to a special section on ecohydrology of semiarid environments: Confronting mathematical models with ecosystem complexity. Water Resour. Res. 2015, 51, 8677–8683. [Google Scholar] [CrossRef]
- Bullister, J.L.; Wisegarver, D.P.; Sonnerup, R.E. Sulfur hexafluoride as a transient tracer in the North Pacific Ocean. Geophys. Res. Lett. 2006, 33, 1–5. [Google Scholar] [CrossRef]
- Busenberg, E.; Plummer, L.N. Dating young groundwater with sulfur hexafluoride: Natural and anthropogenic sources of sulfur hexafluoride. Water Resour. Res. 2000, 36, 3011–3030. [Google Scholar] [CrossRef]
- Dutay, J.-C.; Bullister, J.; Doney, S.; Orr, J.; Najjar, R.; Caldeira, K.; Campin, J.-M.; Drange, H.; Follows, M.; Gao, Y.; et al. Evaluation of ocean model ventilation with CFC-11: Comparison of 13 global ocean models. Ocean Model. 2002, 4, 89–120. [Google Scholar] [CrossRef]
- Chatterjee, S.; Gusyev, M.A.; Sinha, U.K.; Mohokar, H.V.; Dash, A. Understanding water circulation with tritium tracer in the Tural-Rajwadi geothermal area, India. Appl. Geochem. 2019, 109, 104373. [Google Scholar] [CrossRef]
- Jasechko, S. Partitioning young and old groundwater with geochemical tracers. Chem. Geol. 2016, 427, 35–42. [Google Scholar] [CrossRef]
- Busenberg, E.; Plummer, L.N. Dating groundwater with trifluoromethyl sulfurpentafluoride (SF5CF3), sulfur hexafluoride (SF6), CF3Cl (CFC-13), and CF2Cl2(CFC-12). Water Resour. Res. 2008, 44, W02431. [Google Scholar] [CrossRef]
- Lindsey, B.D.; Jurgens, B.C.; Belitz, K. Tritium as an Indicator of Modern, Mixed, and Premodern Groundwater Age; Scientific Investigations Report 2019-5090; USGS: Reston, VA, USA, 2019; Volume 1, p. 30.
- Hofmann, H.; Newborn, D.; Cartwright, I.; Cendón, D.I.; Raiber, M. Groundwater mean residence times of a subtropical barrier sand island. Hydrol. Earth Syst. Sci. 2020, 24, 1293–1318. [Google Scholar] [CrossRef]
- Nelson, S.T.; Tingey, D.G.; Selck, B. The denudation of ocean islands by ground and surface waters: The effects of climate, soil thickness, and water contact times on Oahu, Hawaii. Geochim. Cosmochim. Acta 2013, 103, 276–294. [Google Scholar] [CrossRef]
- Poulsen, D.L.; Cook, P.G.; Dogramaci, S. Excess Air Correction of SF6 and Other Dissolved Gases in Groundwater Impacted by Compressed Air from Drilling or Well Development. Water Resour. Res. 2020, 56, e2020WR028054. [Google Scholar] [CrossRef]
- Hynek, S.; Comas, X.; Brantley, S.L. The Effect of Fractures on Weathering of Igneous and Volcaniclastic Sedimentary Rocks in the Puerto Rican Tropical Rain Forest. Procedia Earth Planet. Sci. 2017, 17, 972–975. [Google Scholar] [CrossRef]
Disclaimer/Publisher’s Note: The statements, opinions and data contained in all publications are solely those of the individual author(s) and contributor(s) and not of MDPI and/or the editor(s). MDPI and/or the editor(s) disclaim responsibility for any injury to people or property resulting from any ideas, methods, instructions or products referred to in the content. |
© 2023 by the authors. Licensee MDPI, Basel, Switzerland. This article is an open access article distributed under the terms and conditions of the Creative Commons Attribution (CC BY) license (https://creativecommons.org/licenses/by/4.0/).