
Evaluation of Drought Resilience Reflecting Regional Characteristics: Focused on 160 Local Governments in Korea


Abstract
:1. Introduction
2. Methodologies
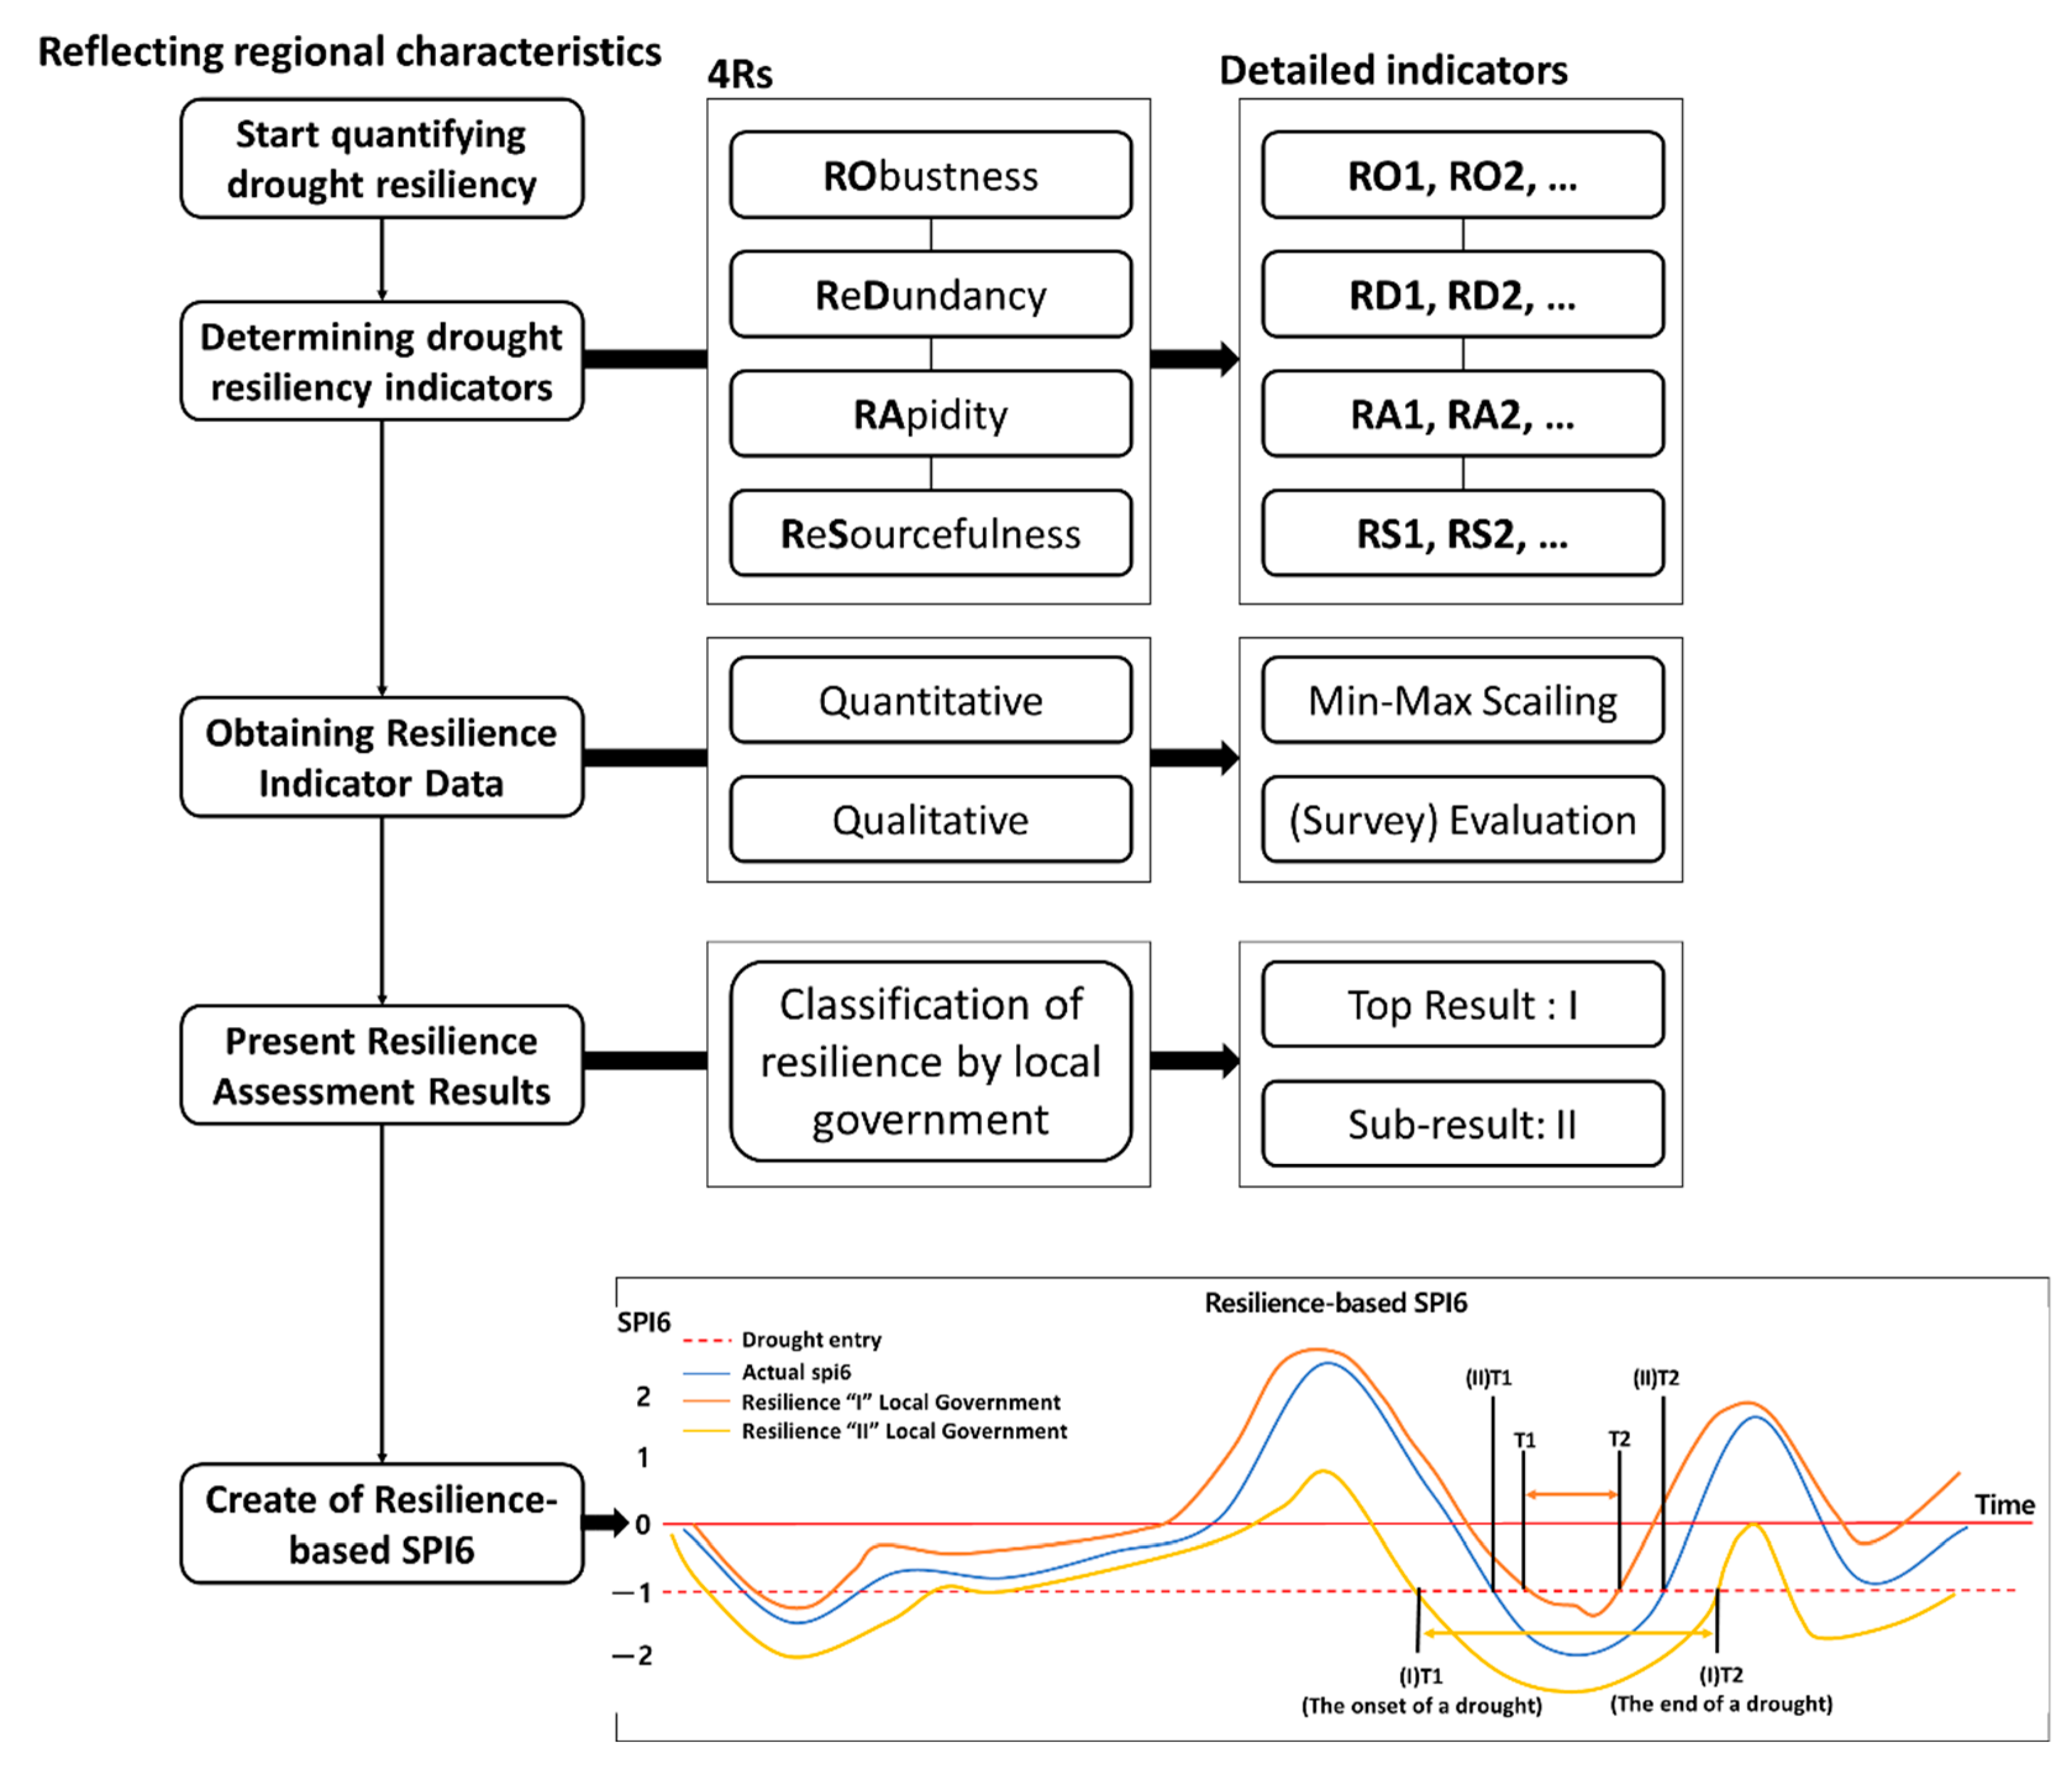
2.1. Research Flow
2.2. Determining Drought Resilience Indicators
3. Application and Results
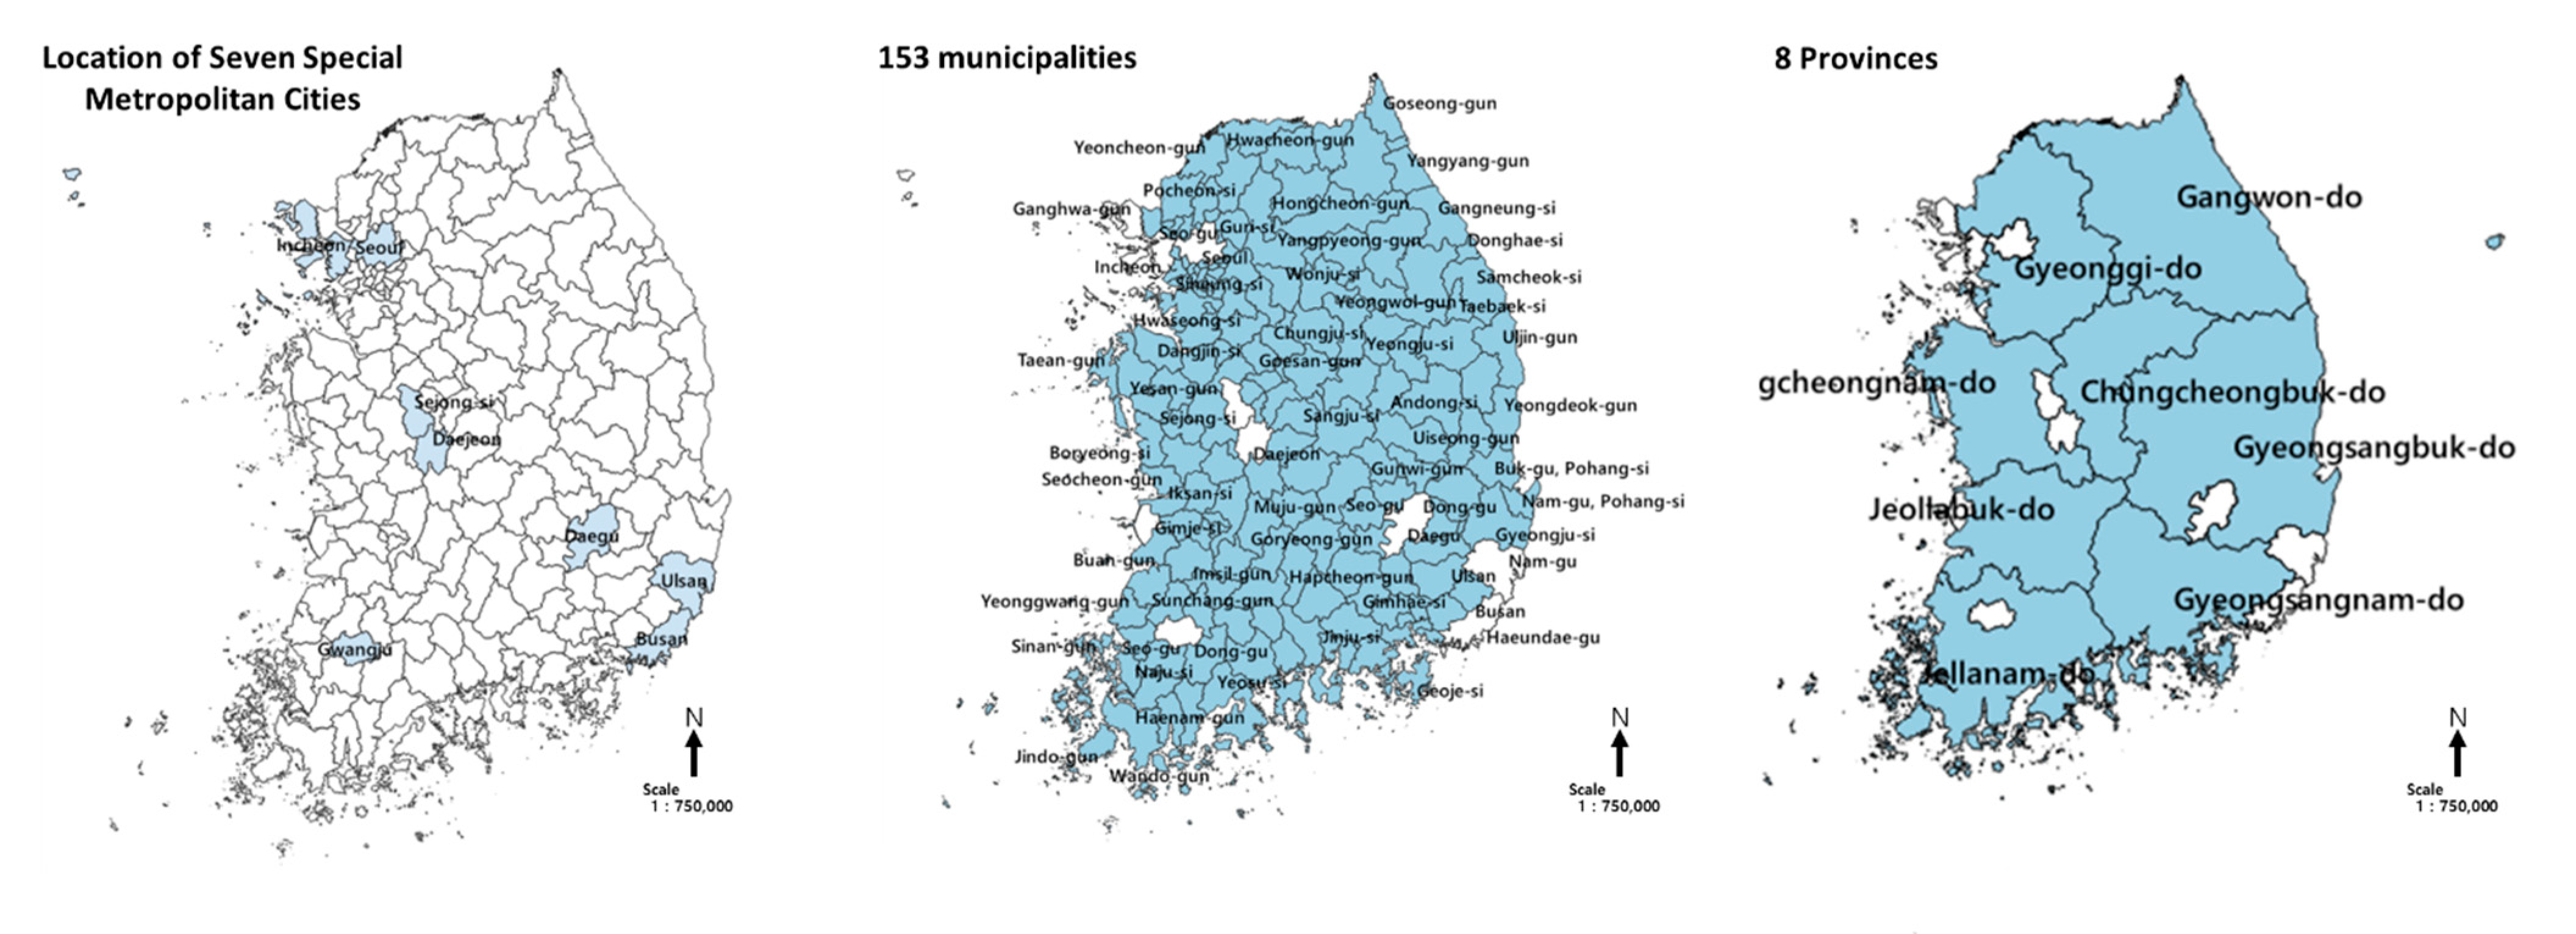
3.1. Target Region
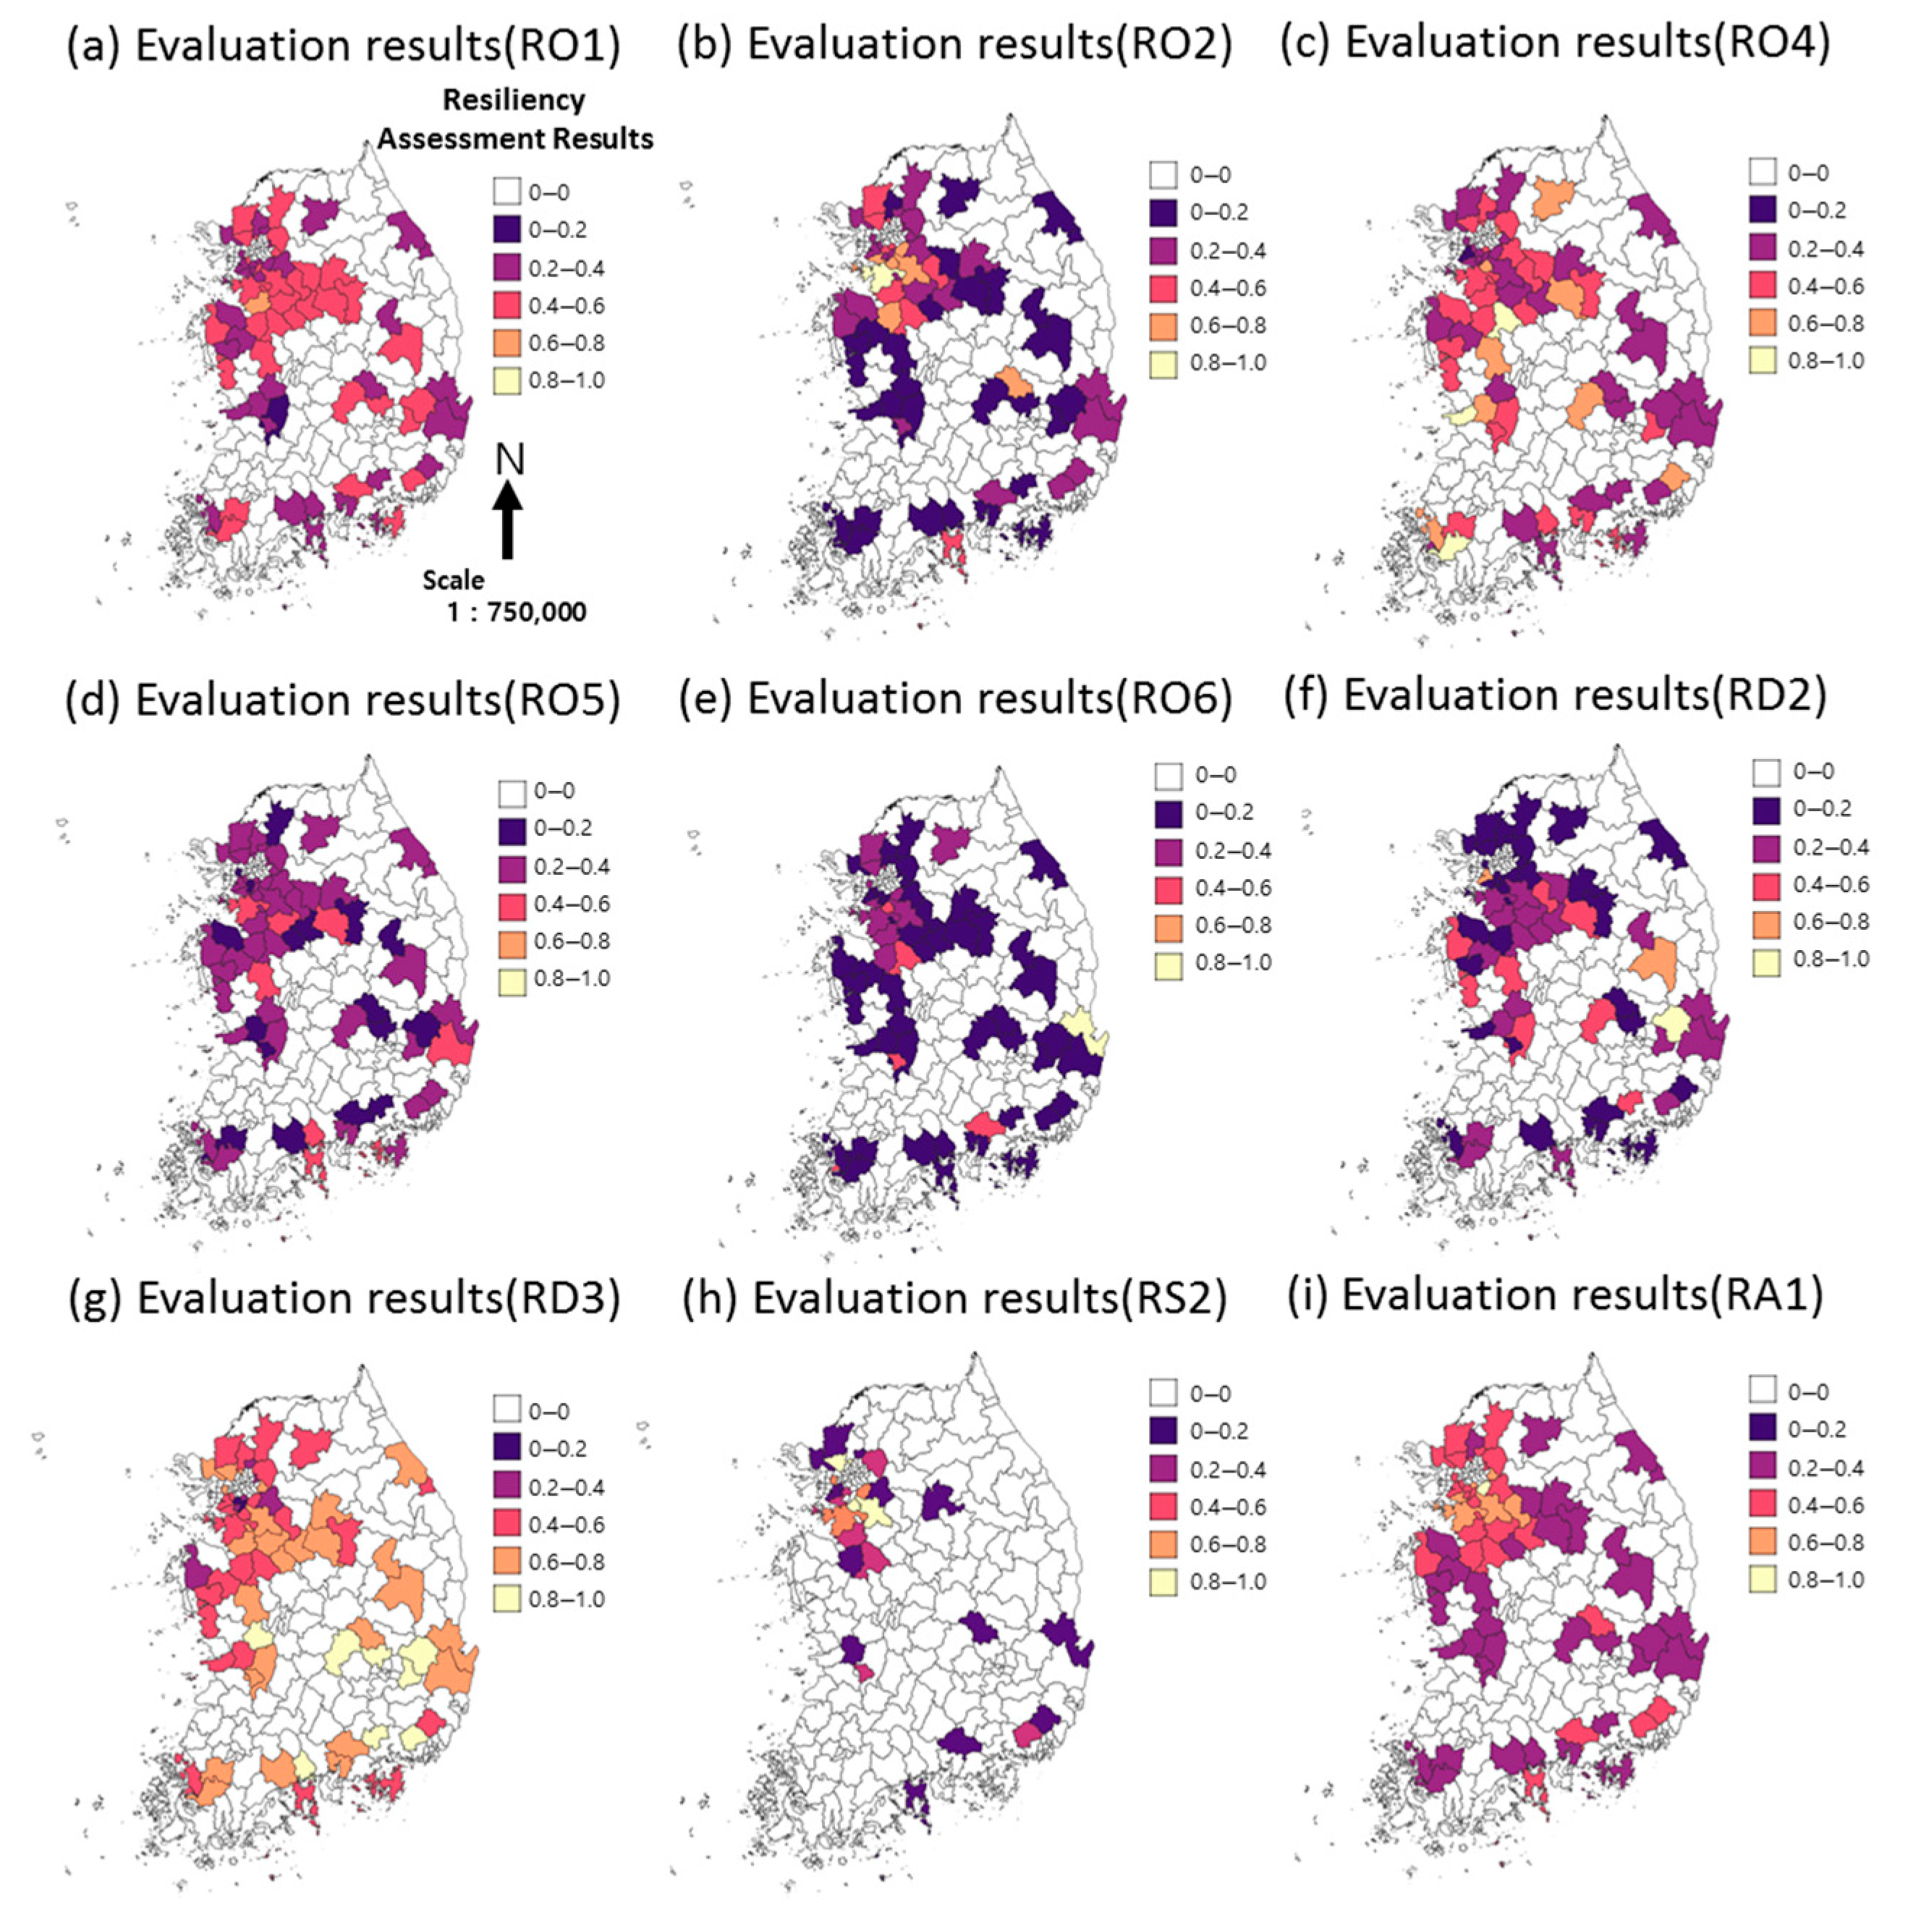
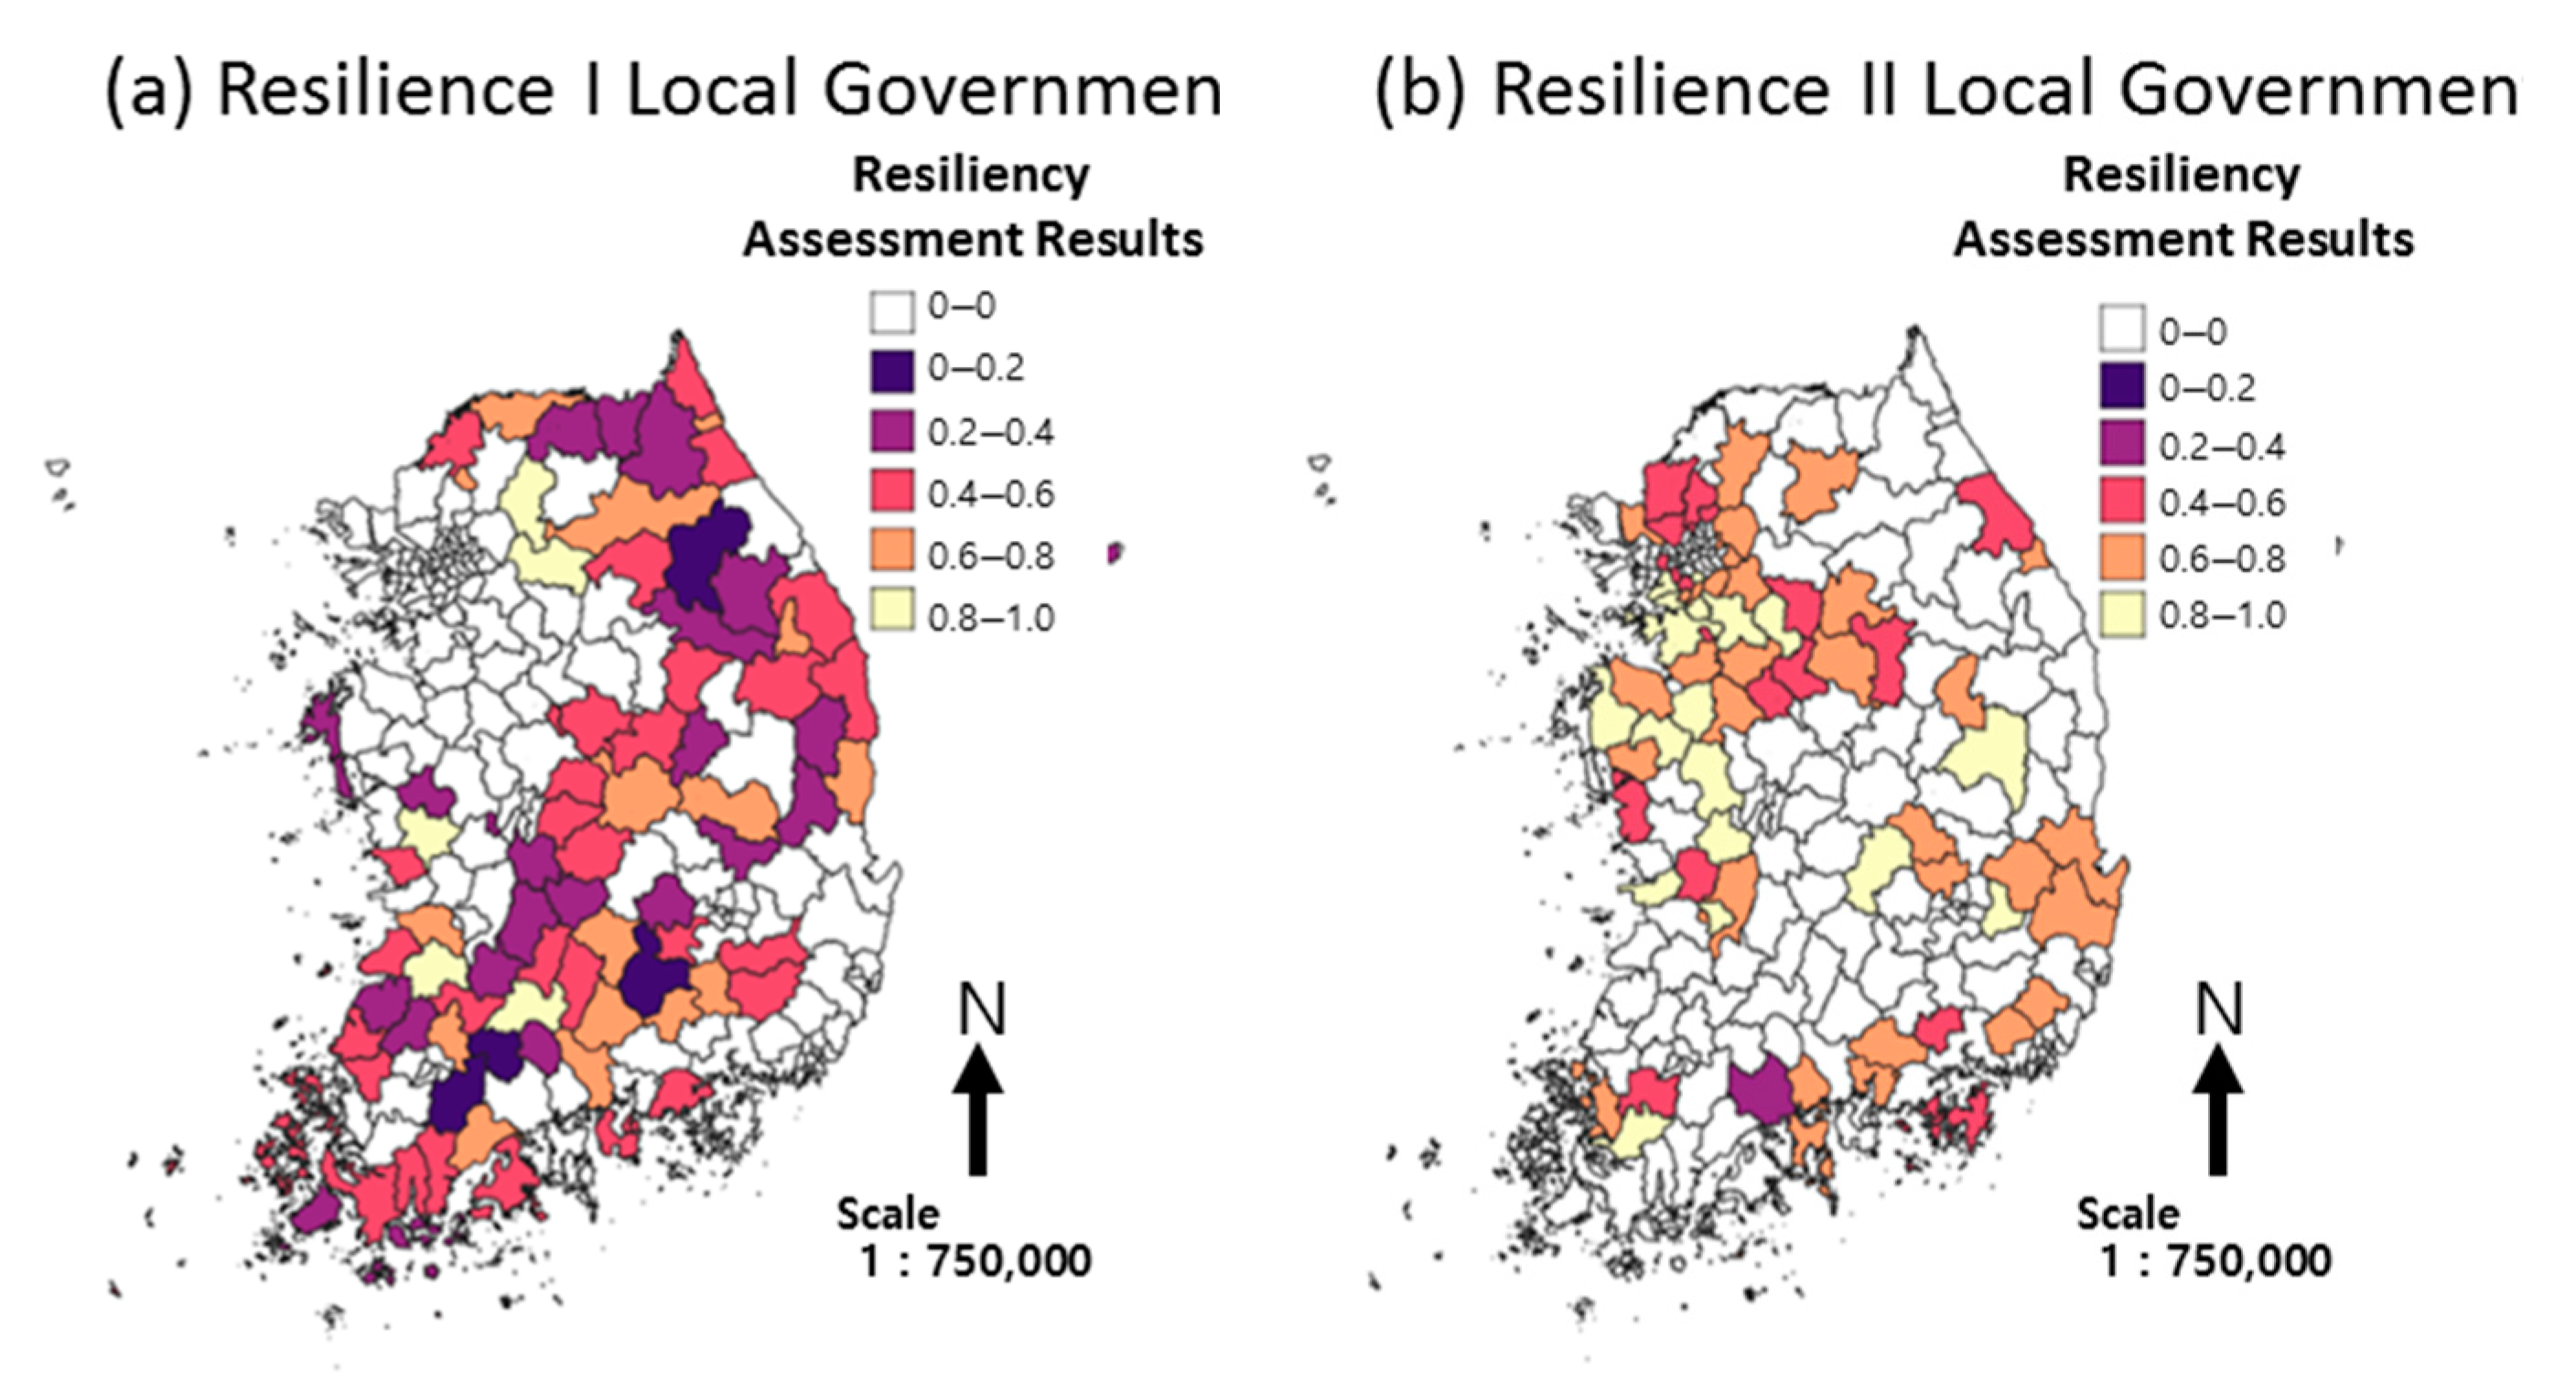
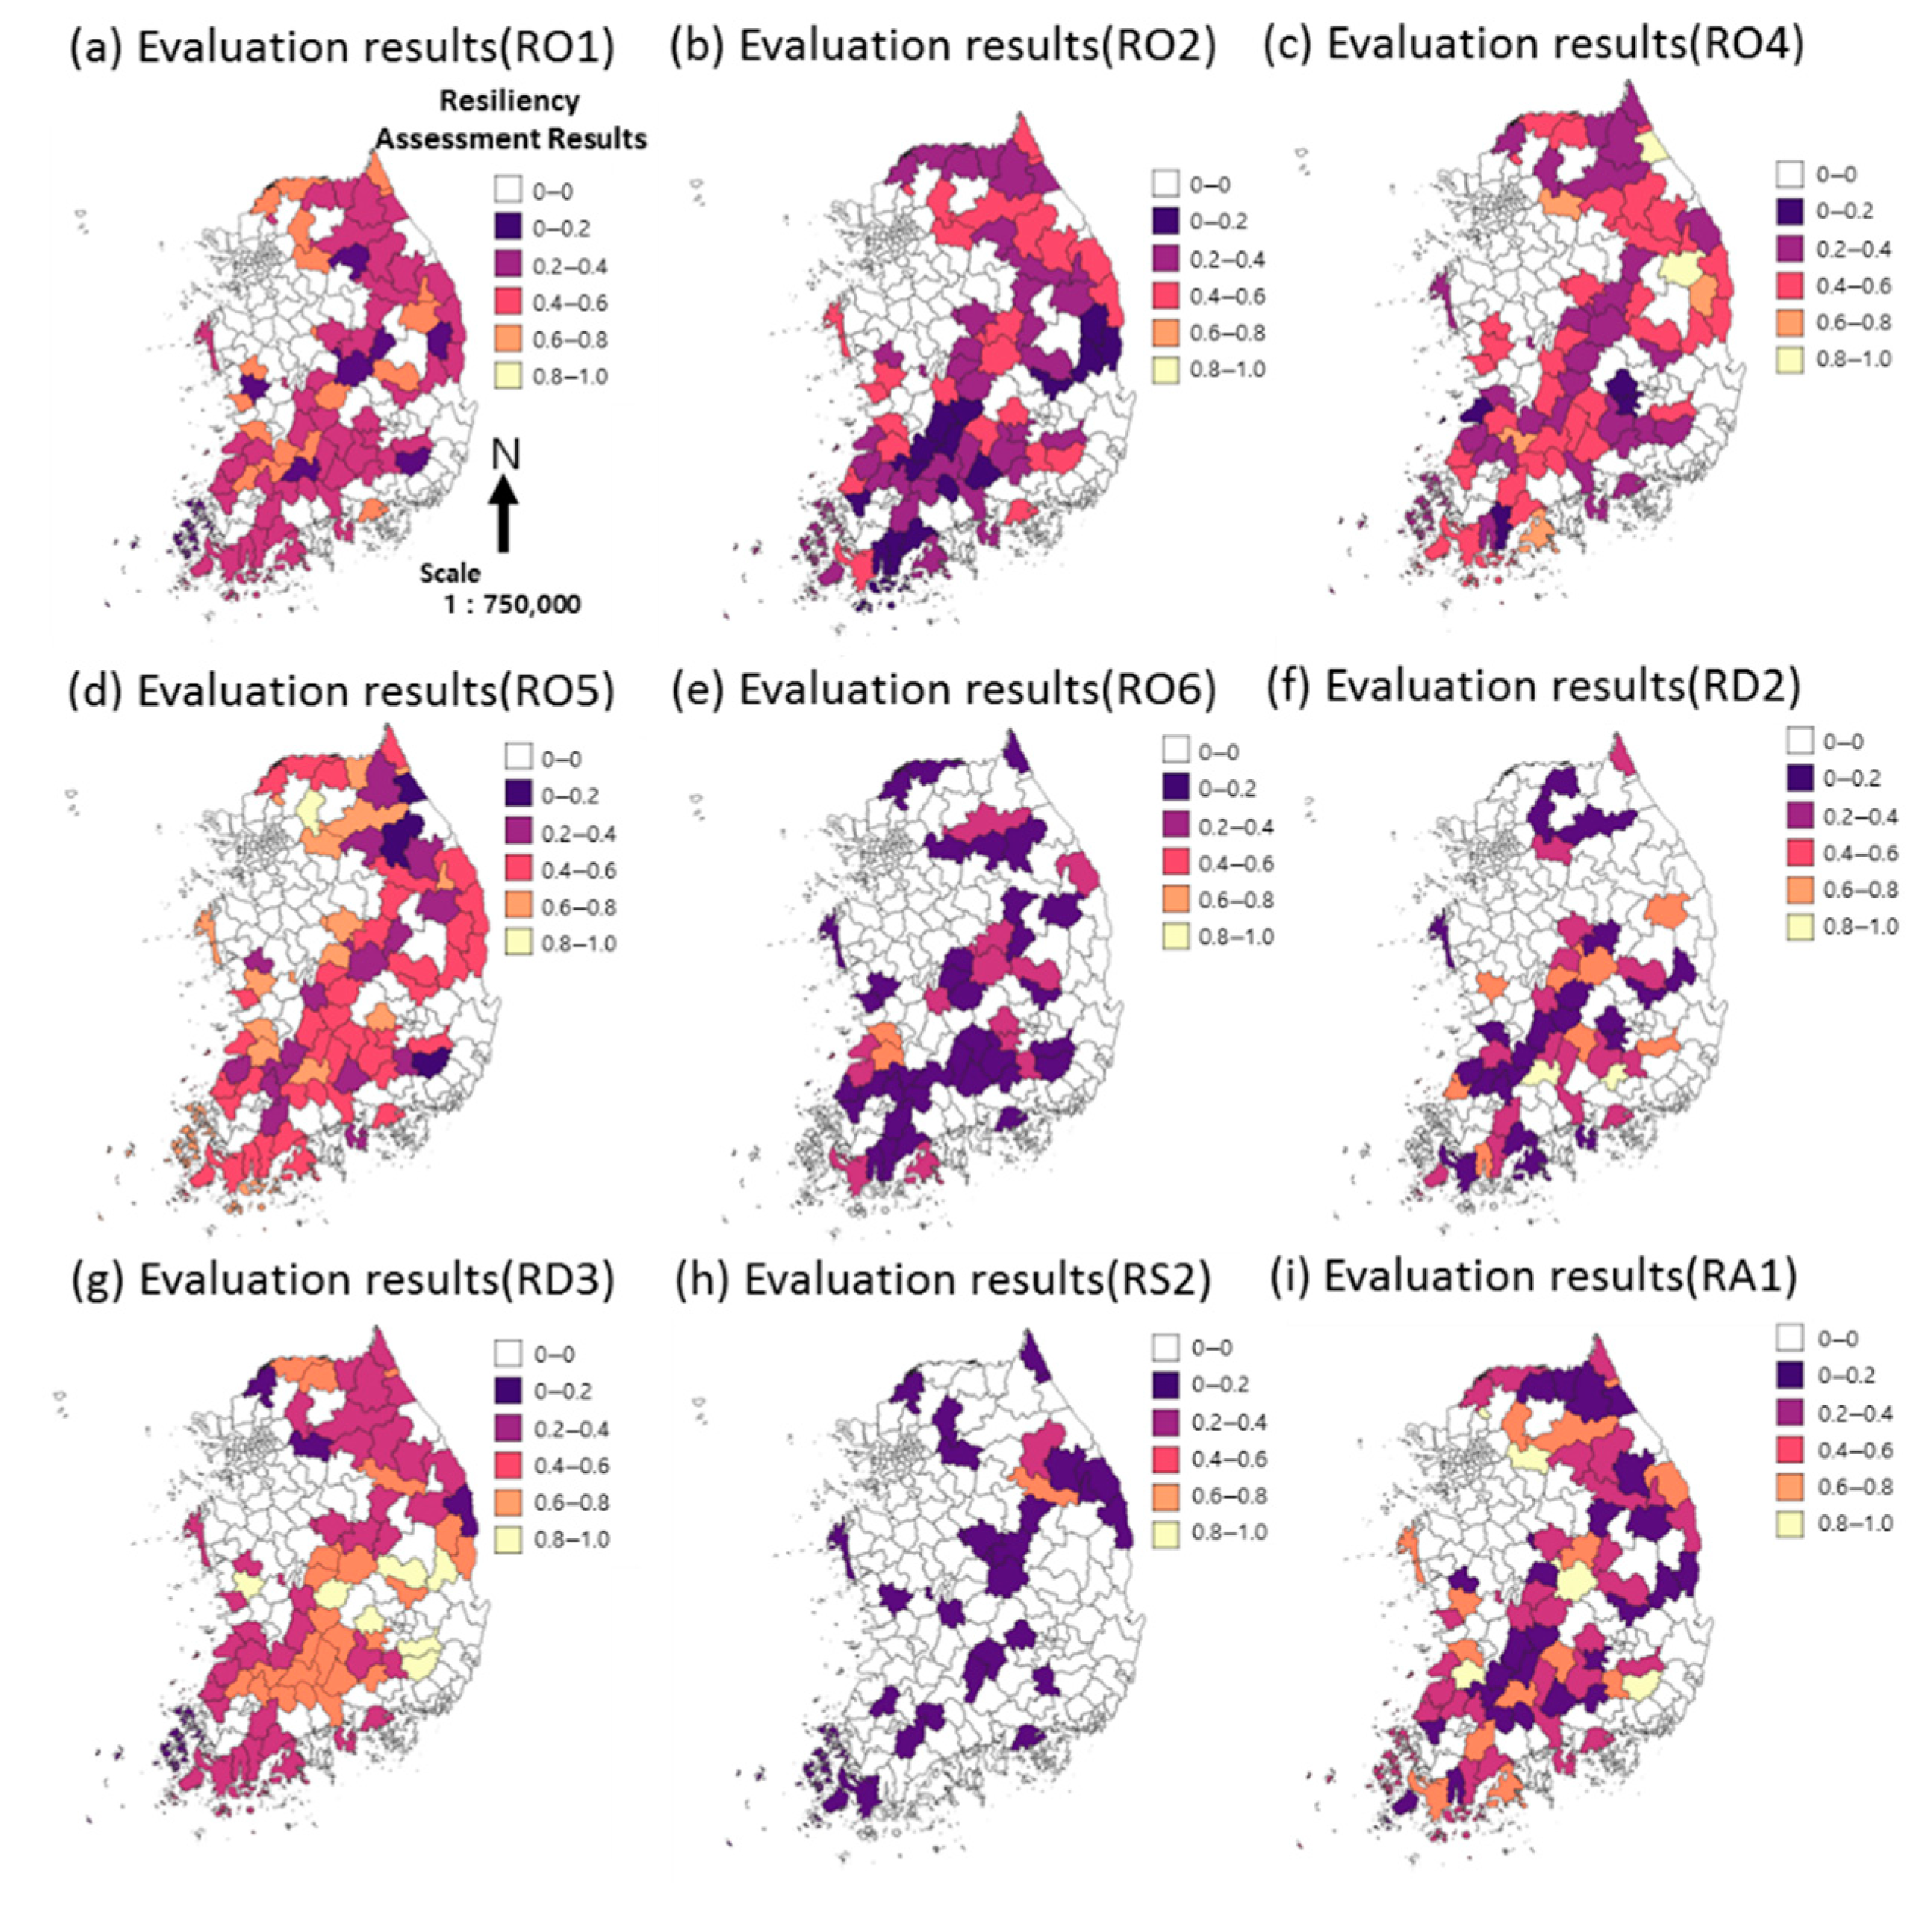
3.2. Drought Resilience Evaluation Results (Nationwide)
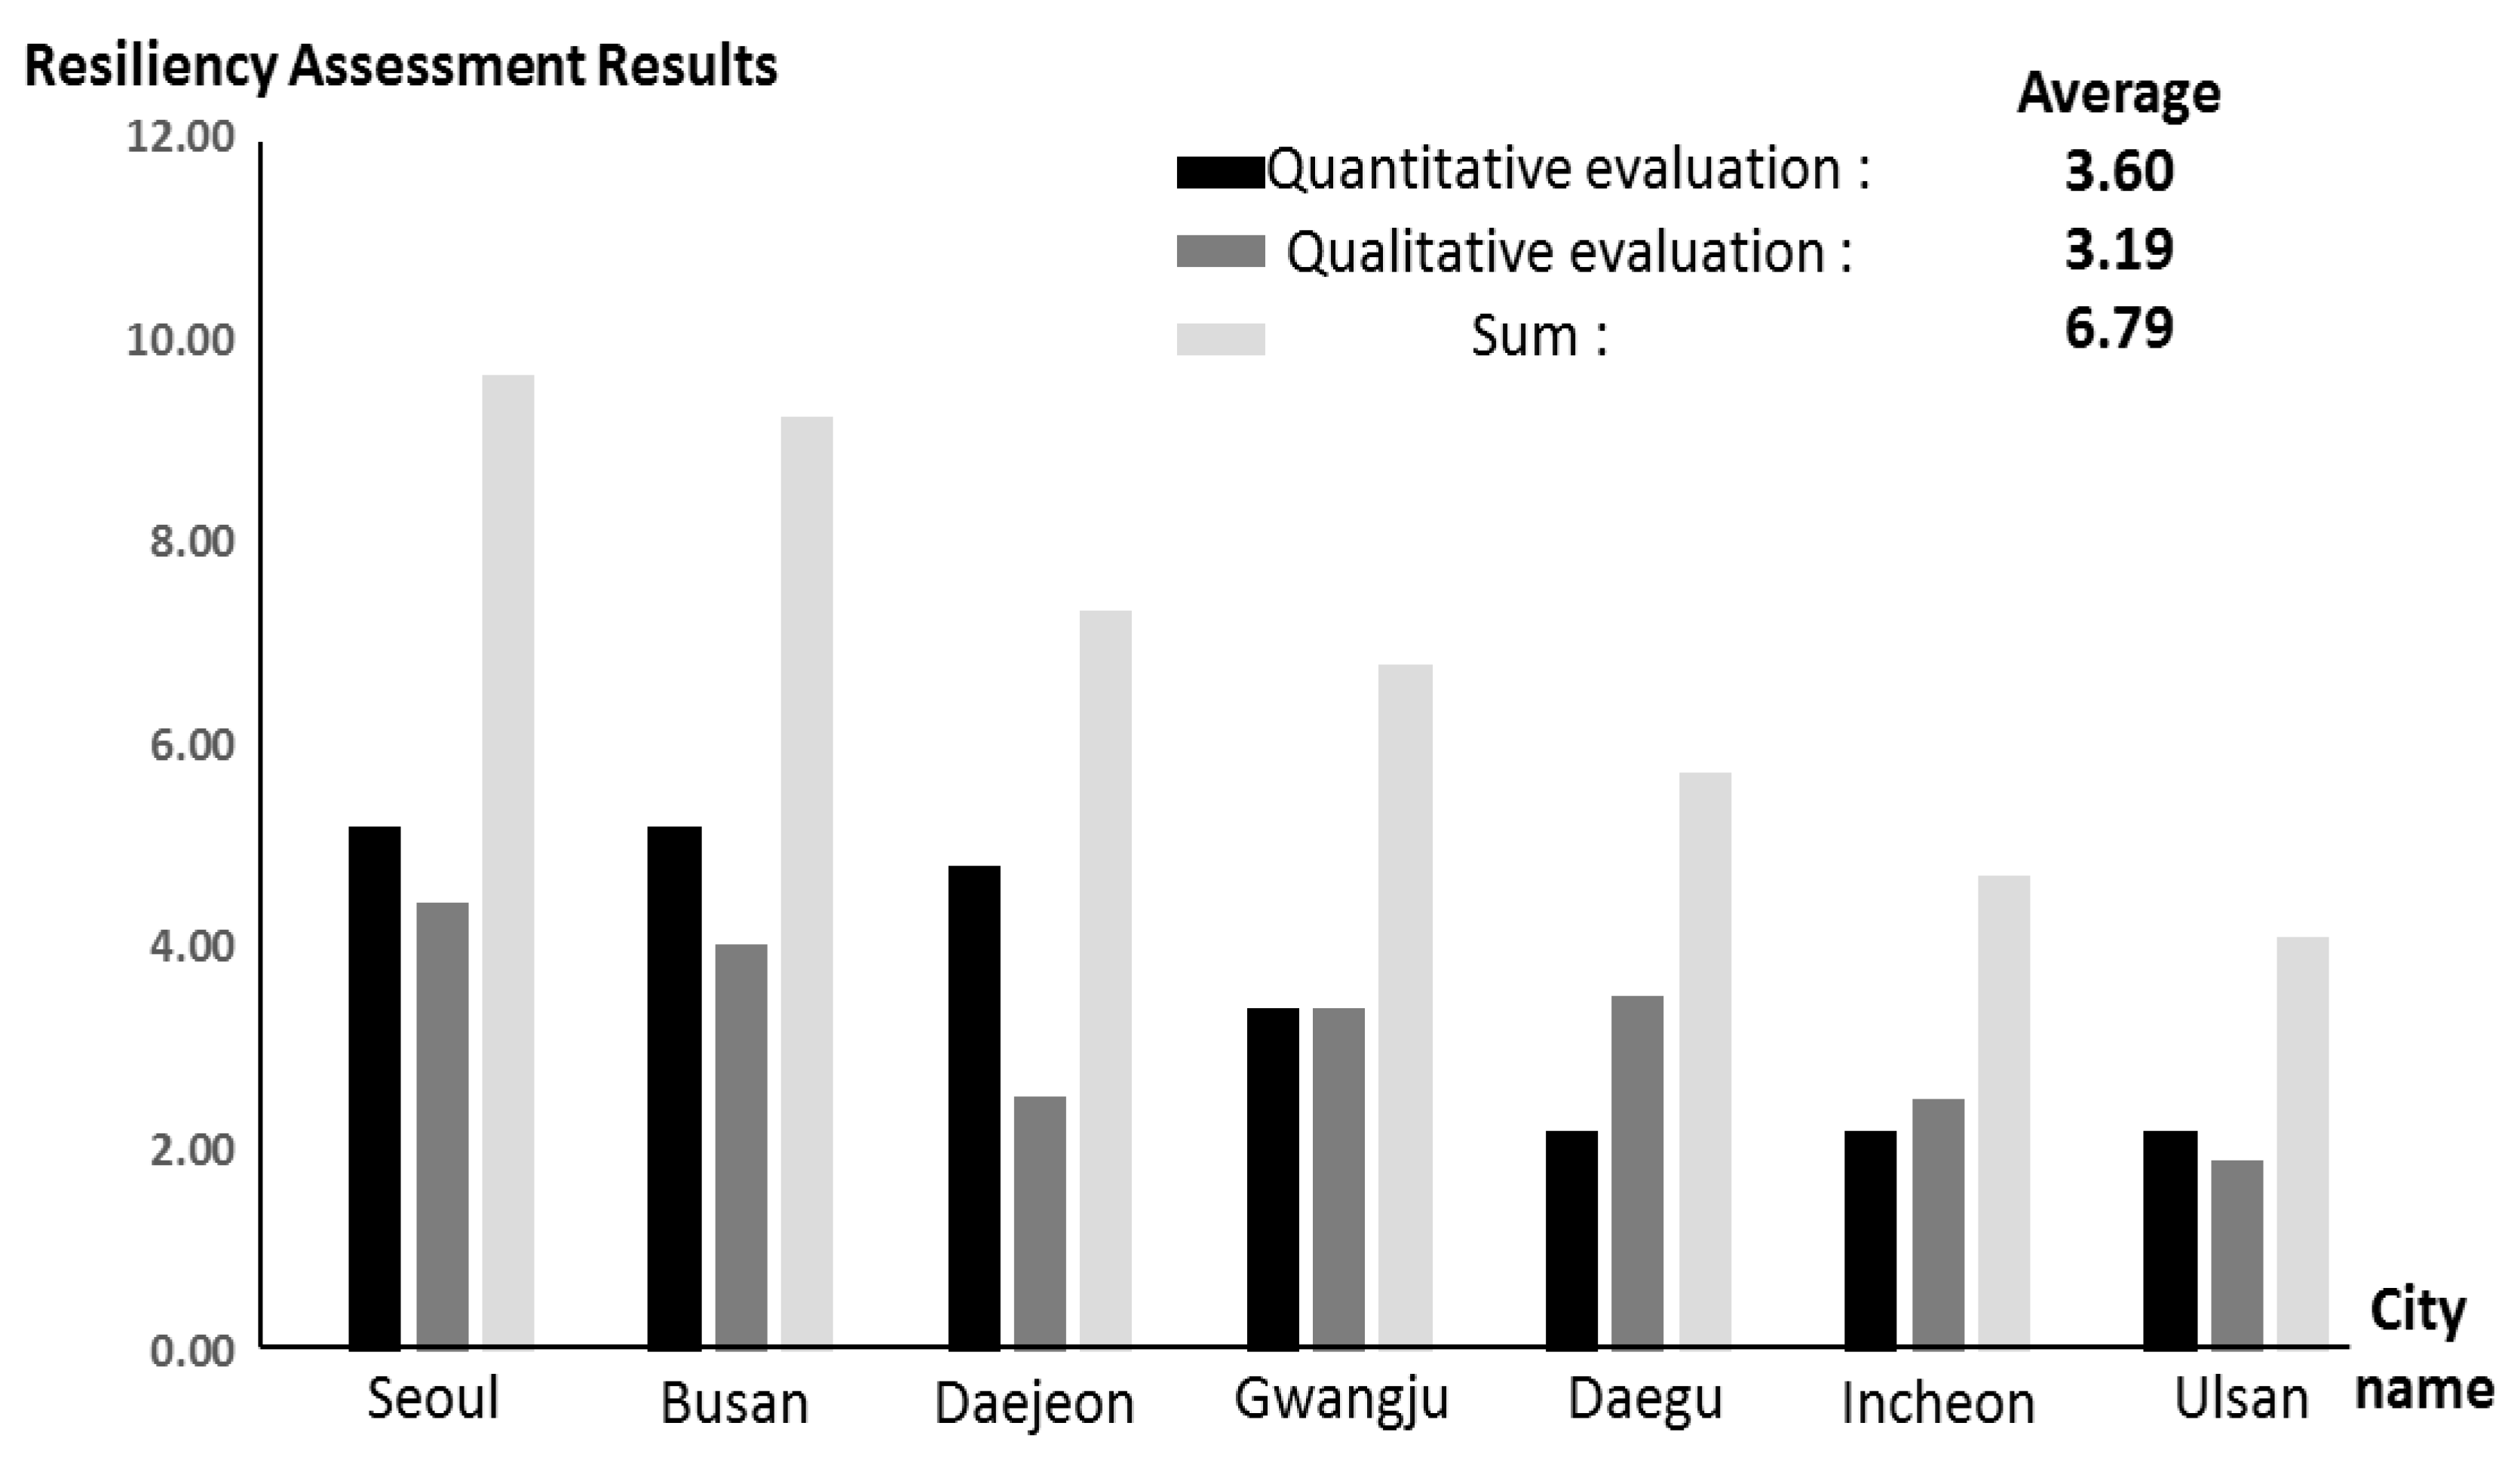
3.2.1. Drought Resilience Evaluation Results (Metropolitan Cities; 7 Locations)
3.2.2. Drought Resilience Evaluation Results (City and County Region; 153 Locations)
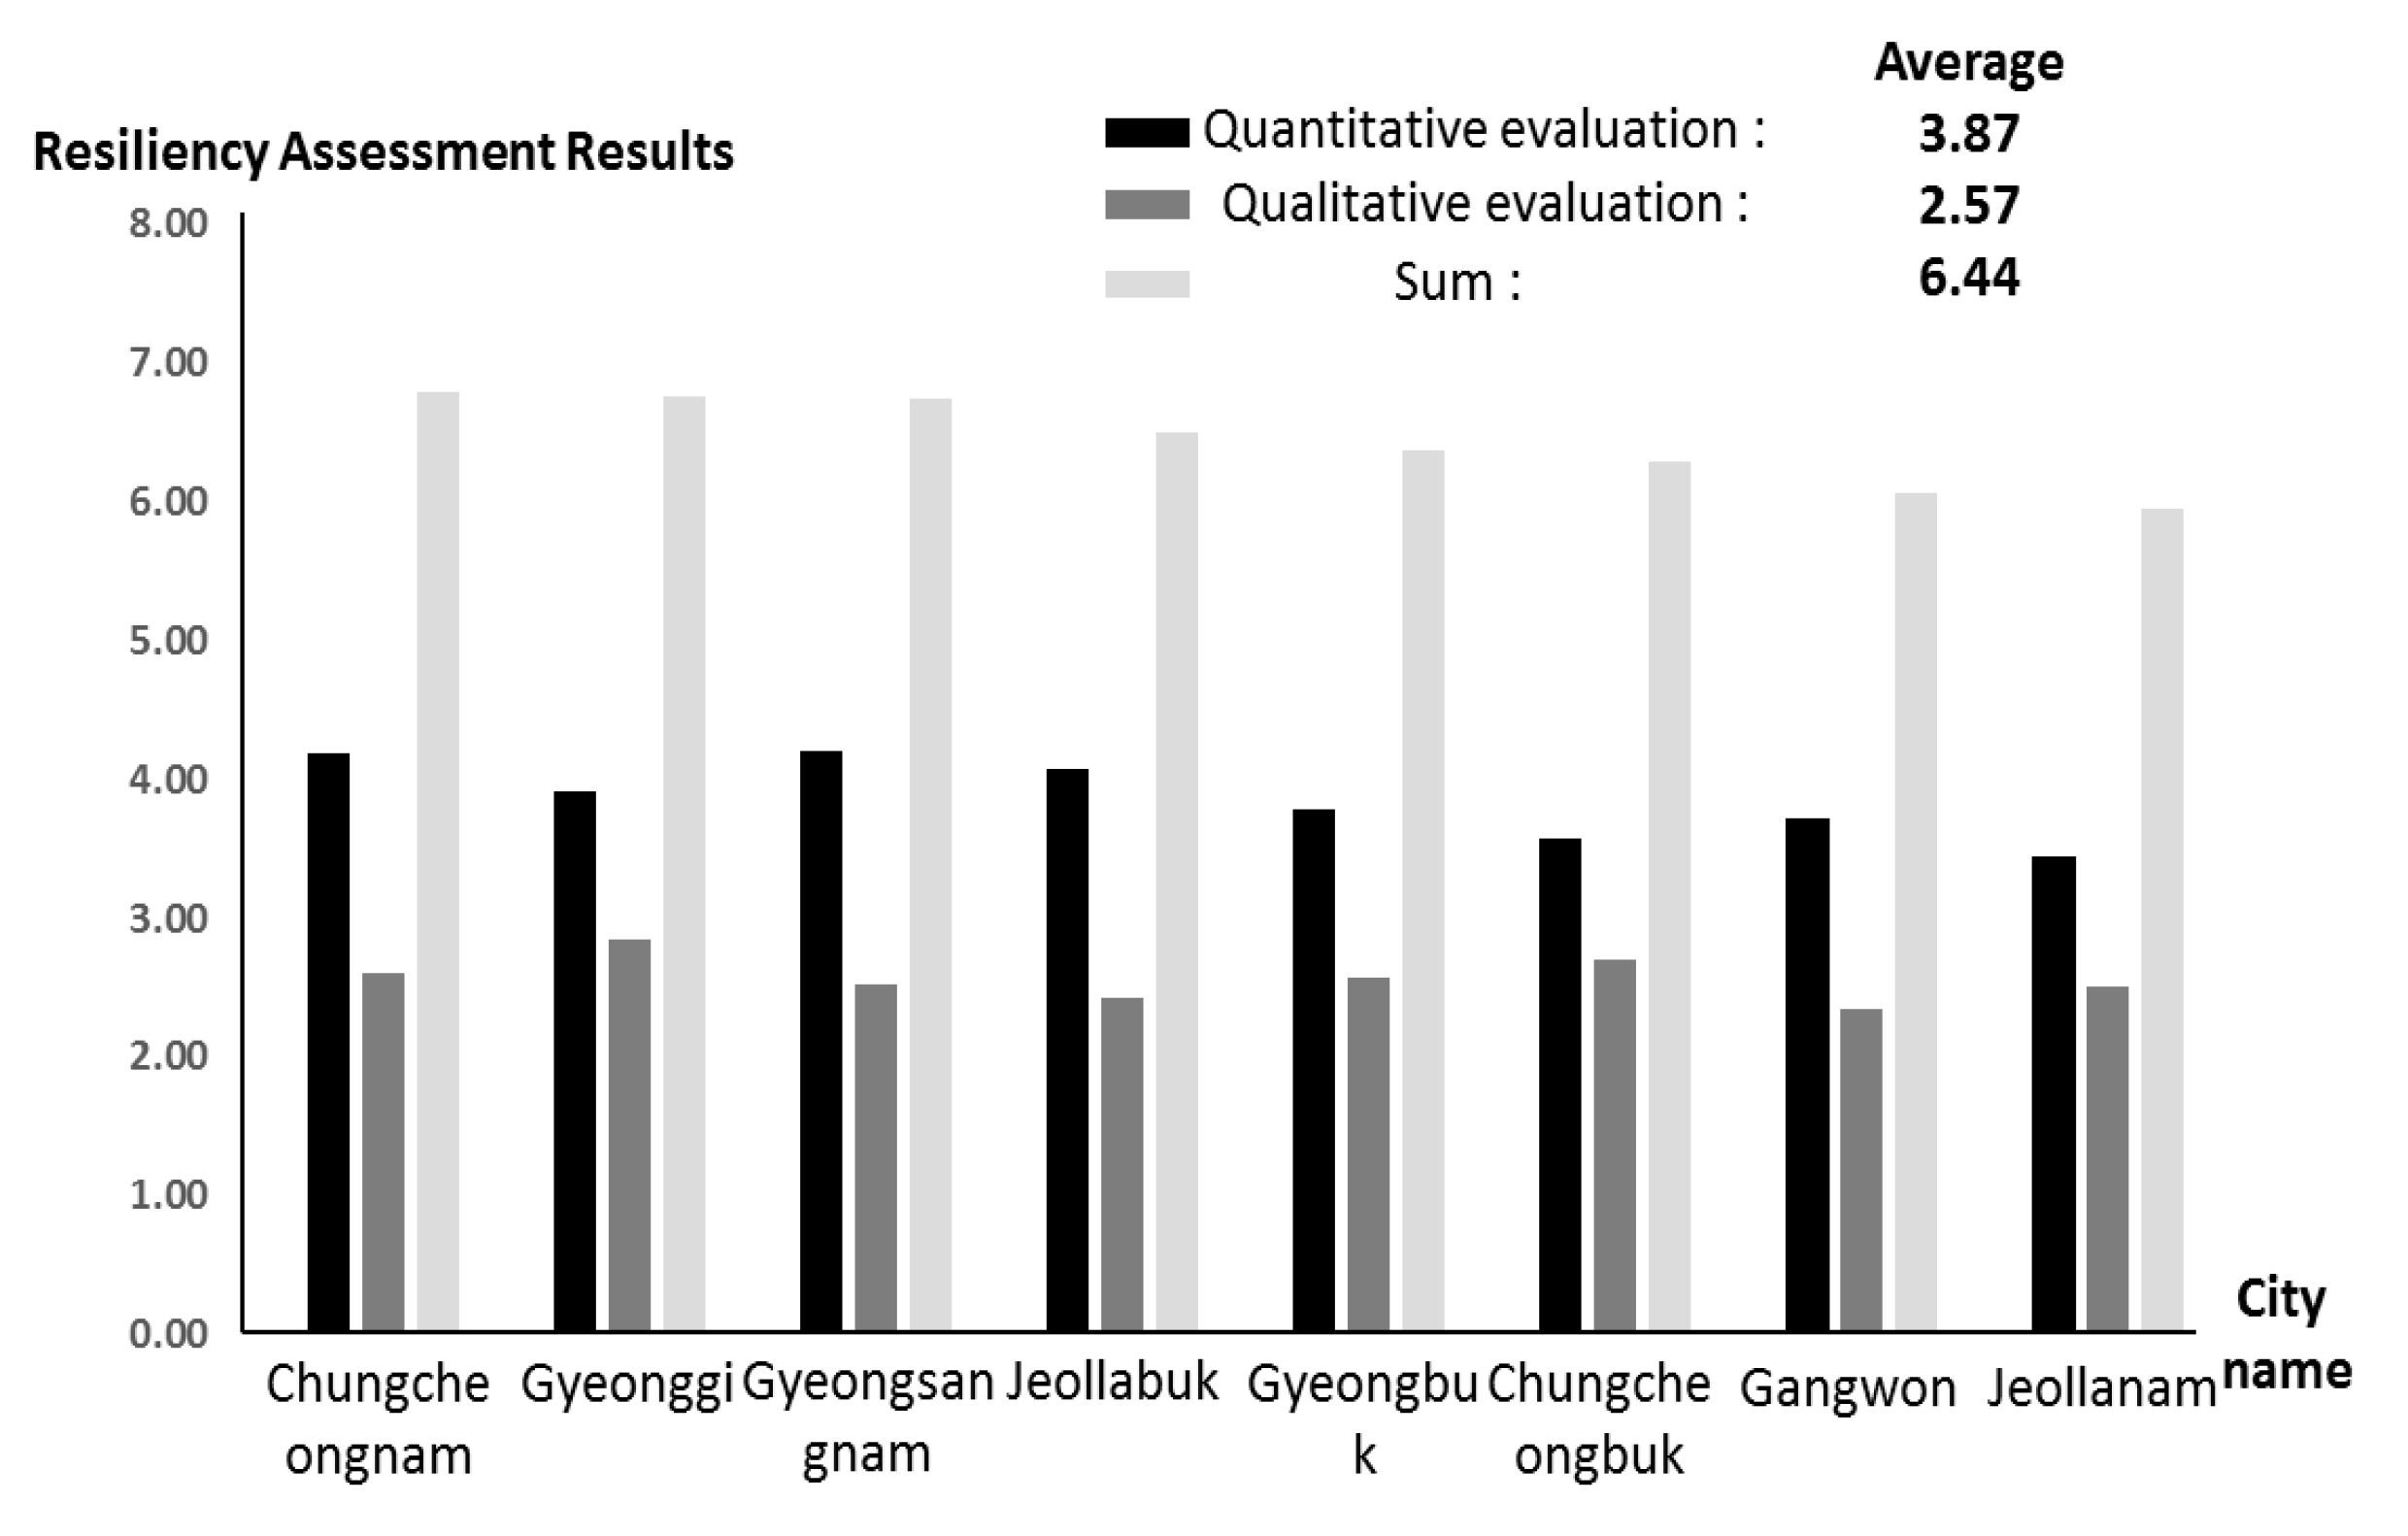
3.3. Drought Resilience Evaluation (“Province” Unit)
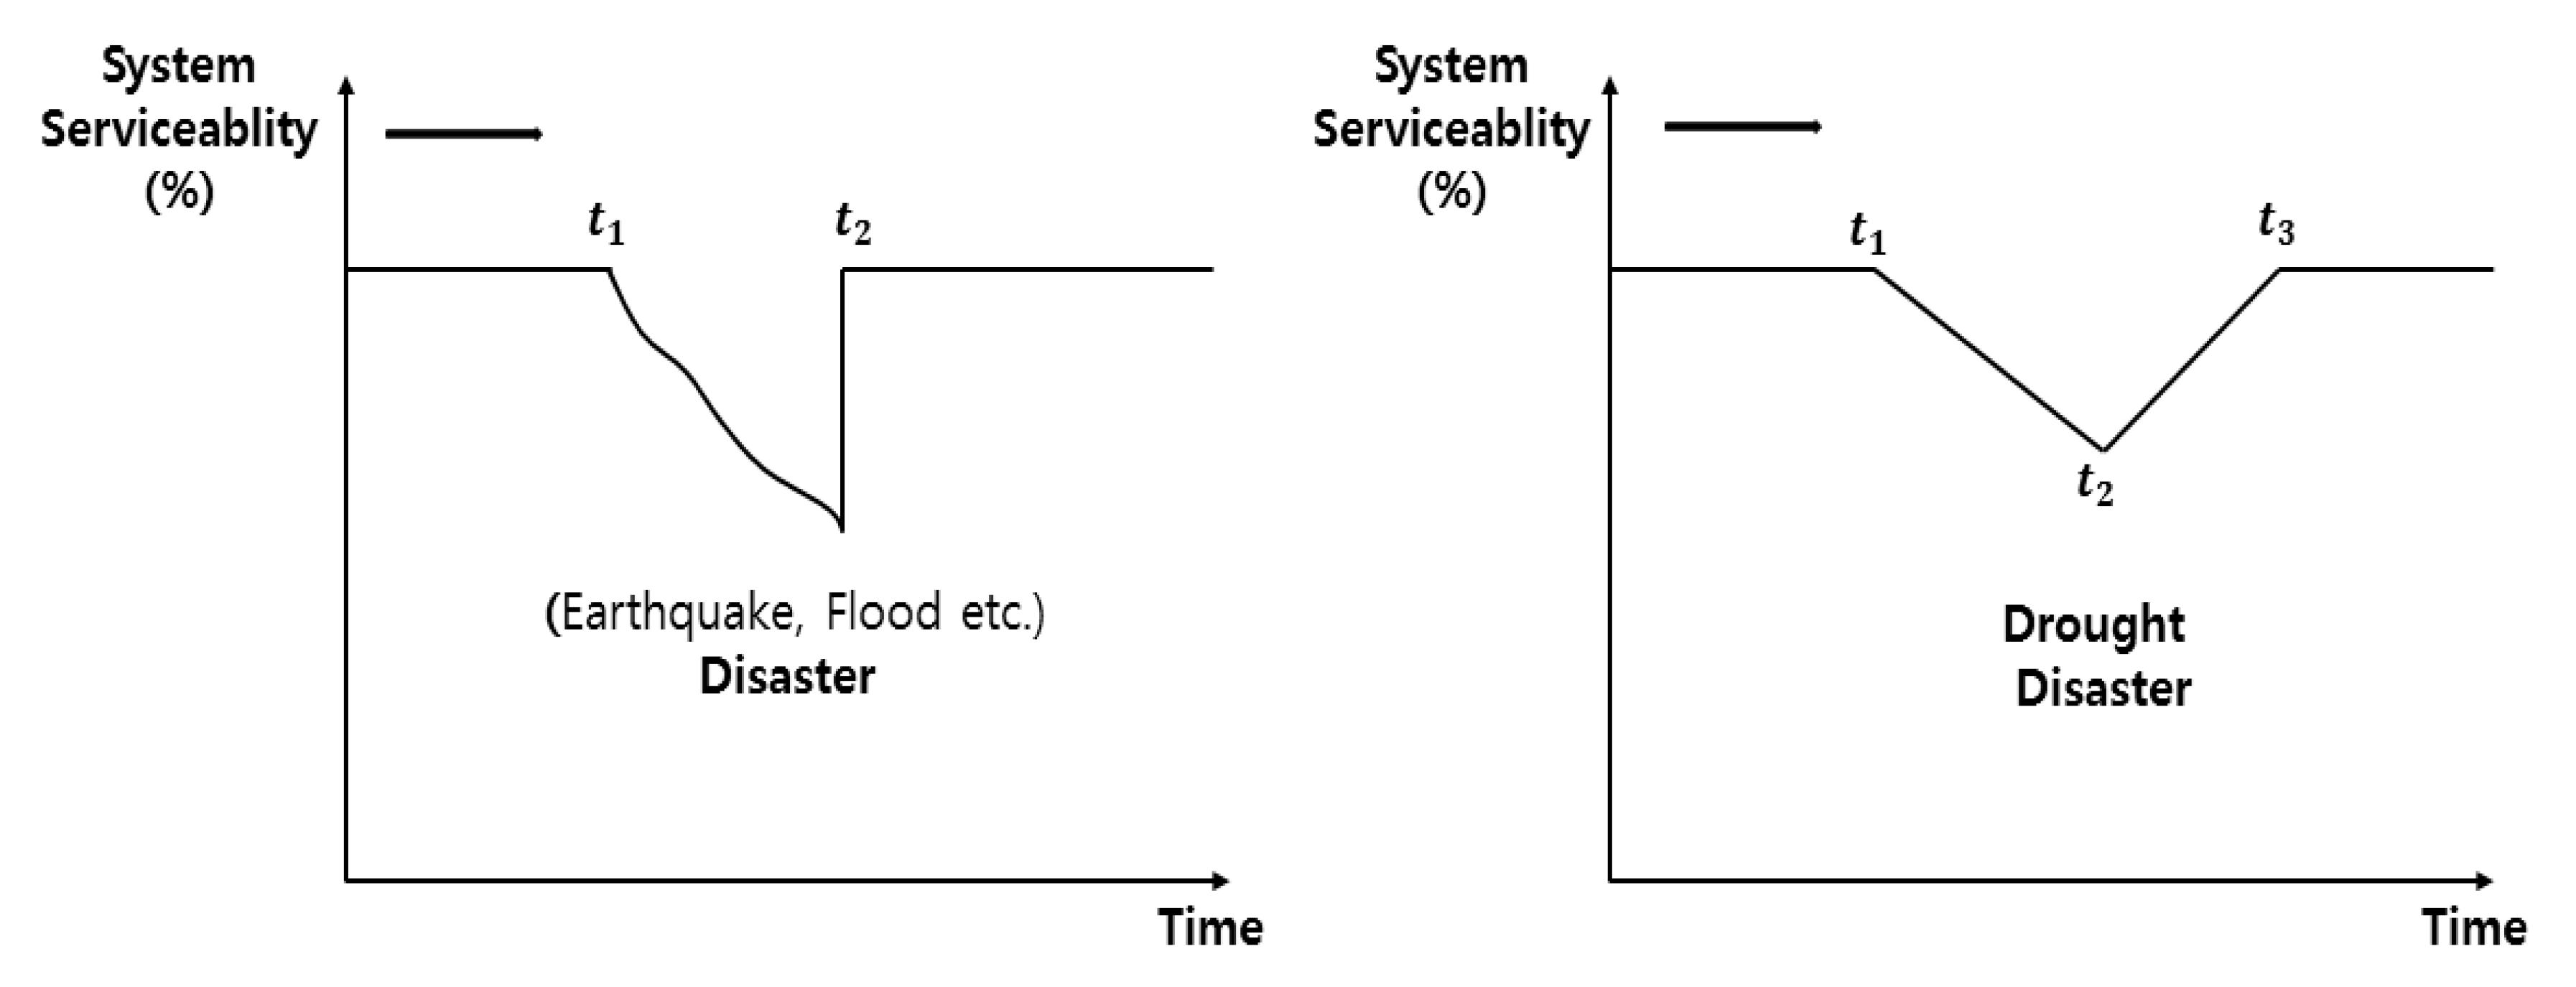
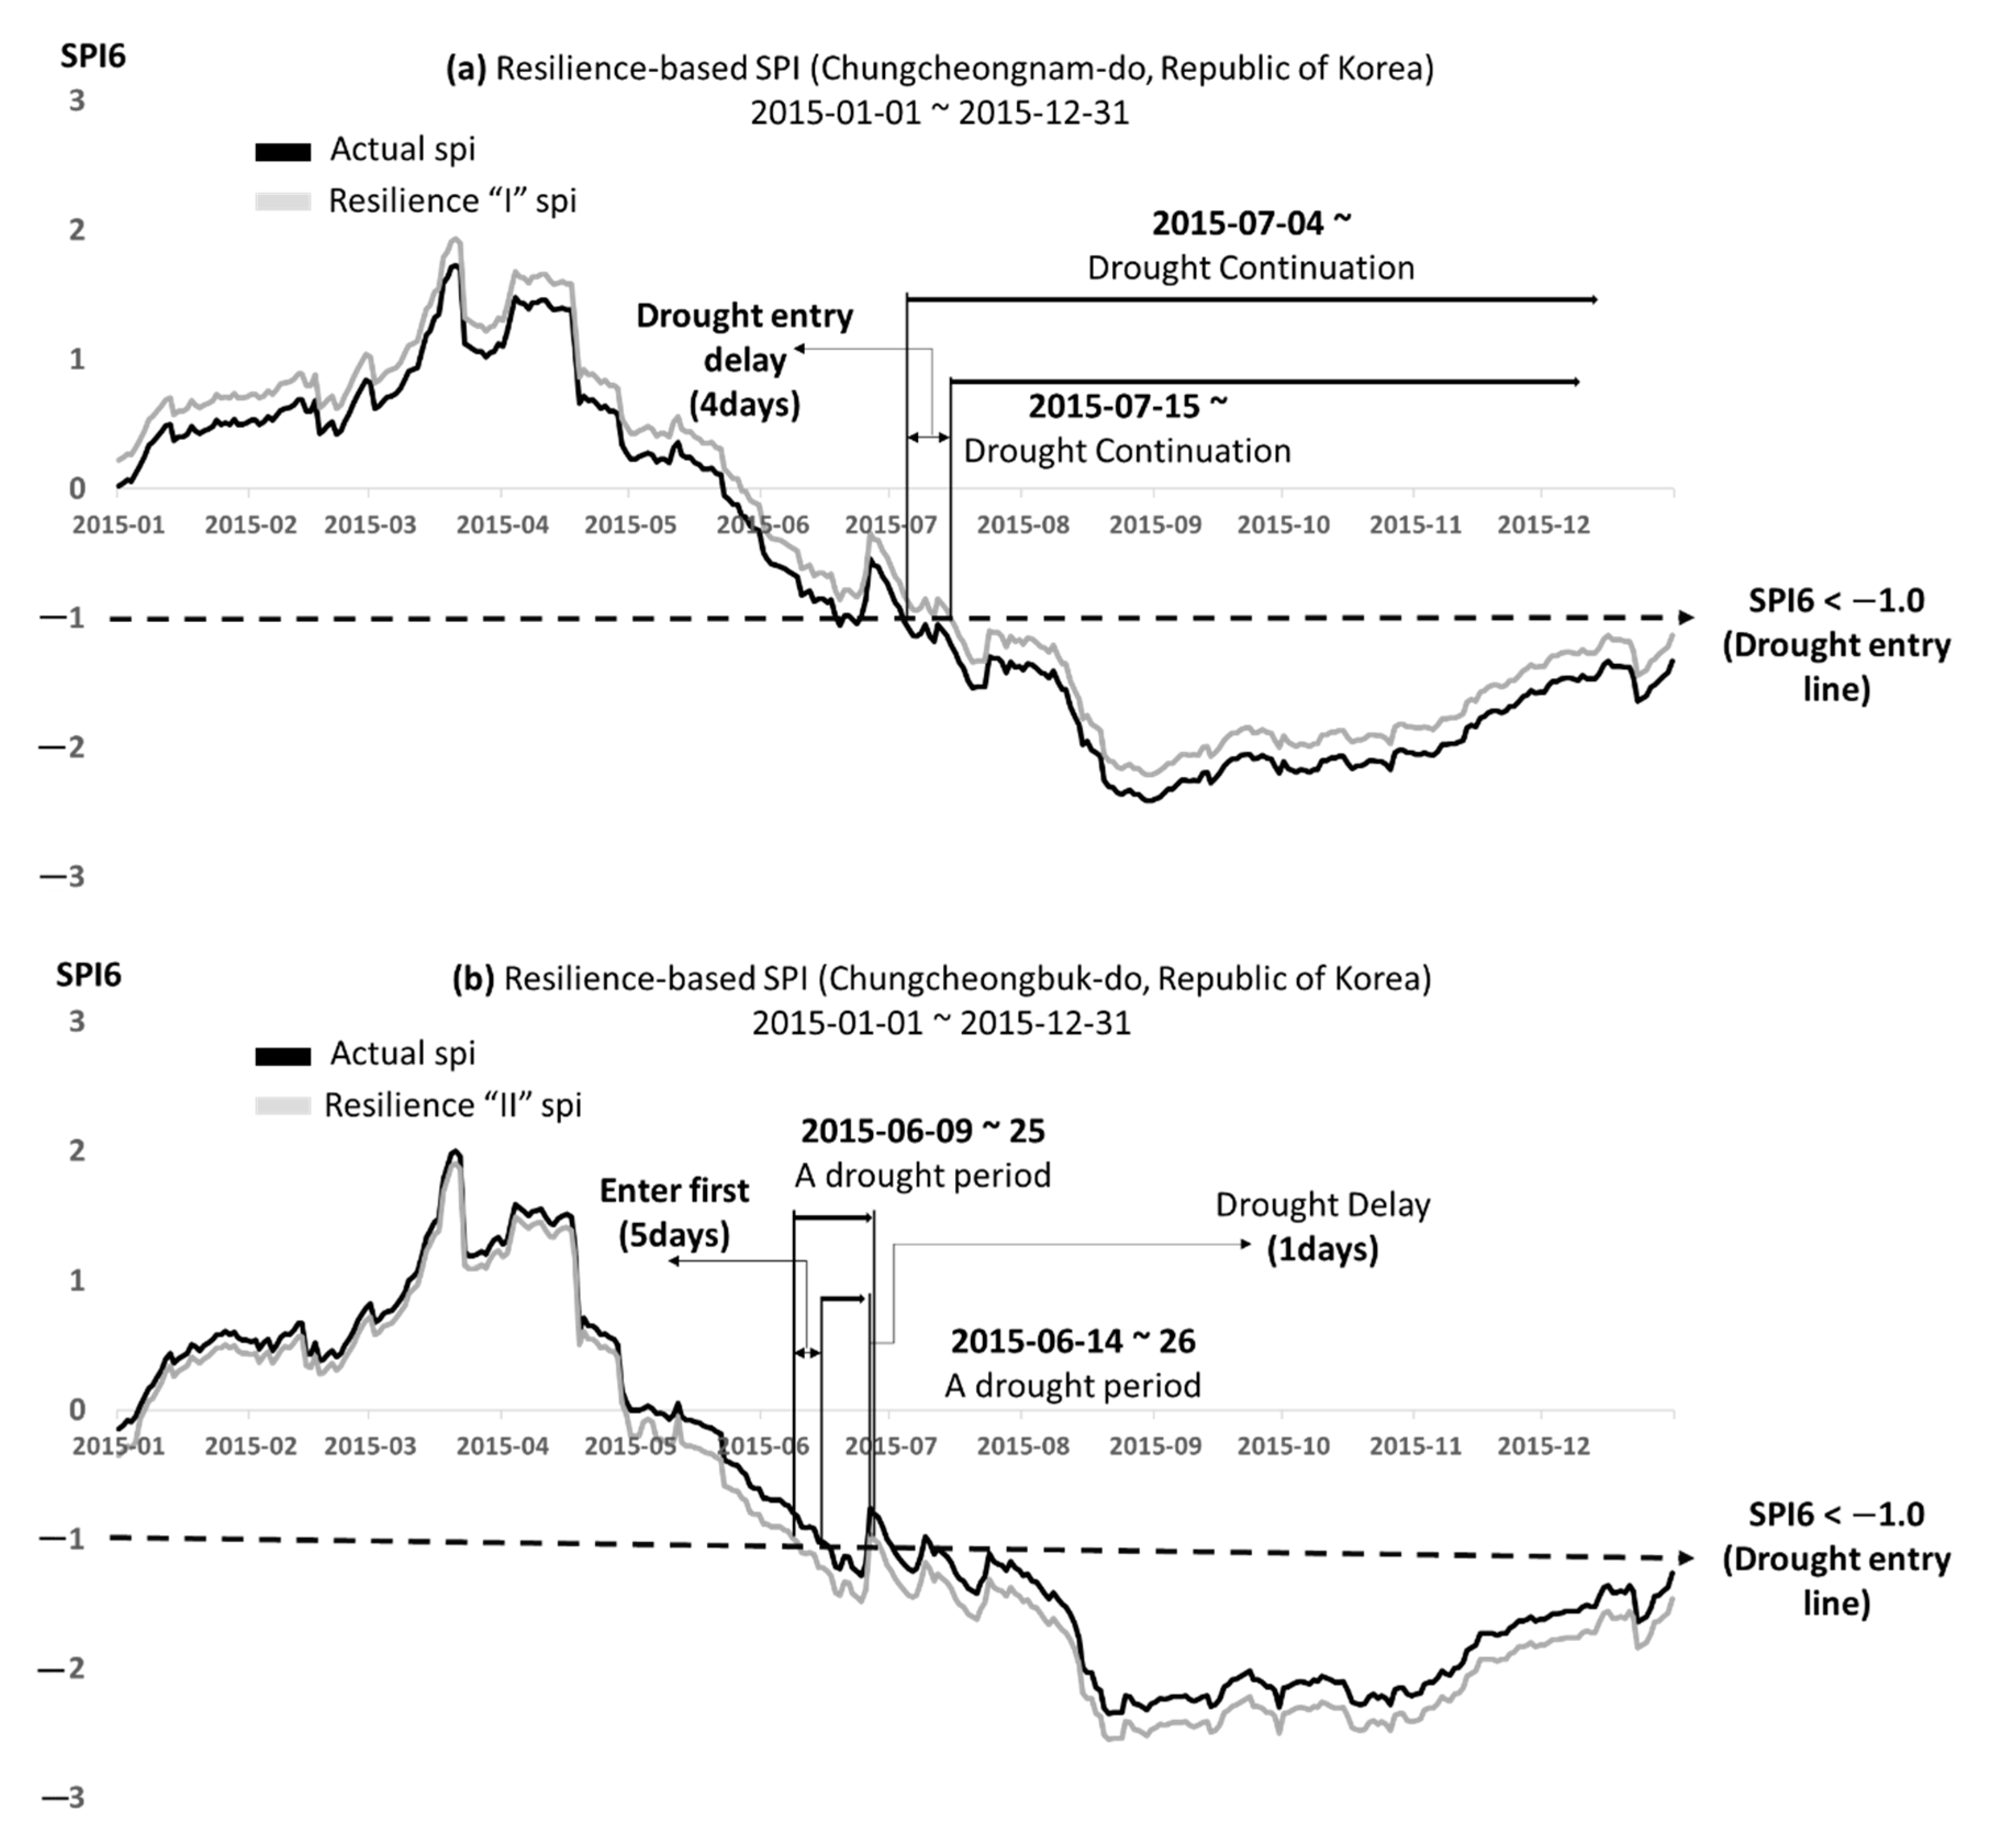
3.4. Drought Resilience Curve
4. Conclusions
Author Contributions
Funding
Conflicts of Interest
Appendix A. Indicators for Quantifying Drought Resiliency (Robustness)
| 4Rs (Robustness) | Indicator | Sub-Indicator | Calculation Data | Sources |
| Robustness (RO) | [RO1] Available Regional Water Resources | Water supply rate (representing the percentage of the total population receiving tap water) | Utilize water supply (%) data | Ministry of Environment (water supply statistics) |
| Regional reservoir capacity (total reservoir capacity in the region) | Utilize local reservoir capacity () data | Water Resources Management Information System (regional reservoir capacity) | ||
| Total amount of local tube-well information (use of groundwater irrigation in the region) | Use the total amount of local government information data (annual usage) | K-water (tube-well management information) | ||
| [R02] Regional Economic Vulnerability | Financial self-reliance (tax analysis indicators indicating the ability to self-provision financial income) | Use fiscal self-reliance (%) data | Statistics Korea (General Regional Statistics Department) | |
| Gross regional product (GRDP, production by unit, consumption, prices, etc.) | Use gross regional product (GRDP) | |||
| [R03] Average Annual Precipitation and Variability of the Region (Coefficient of Variation) | The average annual precipitation in the region | Utilization of annual precipitation data (local distribution based on observatory) | Korea Meteorological Administration (average annual precipitation) | |
| Variation of regional annual precipitation (coefficient of variation) | Coefficient of variation based on annual average precipitation data | |||
| [R04] Historical drought experience and local adaptation to drought levels | Meteorological: SPI6 standard (number of days) the number of past severe drought anomalies | Calculation and utilization of the number of SPI6 drought standards (SPI6 < 2.0) that lasted more than 30 days | Hydrologic Weather, Drought Information Analysis System (drought index) | |
| Agricultural: Number of occurrences of severe drought in the past based on the soil moisture index (SMI) | Calculation and utilization of the number of heavy SMI droughts (15% or less) occurred | Agricultural Drought Management System (drought index) | ||
| Water for living: past number of water-outage, intermittent water supply | Utilization of past number of water-outage, intermittent water supply | National Drought Information Portal (emergency water supply status) | ||
| [RO5] Regional average water consumption | The amount of water used per person | Leverage annual usage data | Water Resources Management Information System (usage of living, agricultural and industrial water) | |
| Amount of industrial water used per person | ||||
| Amount of agricultural water used per person |
Appendix B. Indicators for Quantifying Drought Resiliency (Redundancy)
| 4Rs (Redundancy) | Indicator | Sub-Indicator | Calculation Data | Sources |
| Redundancy (RD) | [RD1] Availability of water resources in surrounding areas | Securing data through interviews with disaster officials | ||
| [RD2] Groundwater resource availability | Total amount of local tube well—use of groundwater irrigation in the region | The amount of planned tube well water intake | K-water (Annual water intake plan) | |
| [RD3] Agricultural water use method (irrigation status, etc.: ratio of field irrigation) | The ratio of irrigated paddy—paddies supplied with water by irrigation facilities such as reservoirs, waterworks, reservoirs, and groundwater pipes | The ratio of irrigated paddy | Water Resources Management Information System (cultivated acreage) | |
| Percentage of field irrigation—fields supplied by agricultural water supply facilities | Percentage of field irrigation | |||
| [RD4] Presence of water allocation priorities for drought | Securing data through interviews with disaster officials | |||
| [RD5] Presence of reservoir operation policy during drought | ||||
Appendix C. Indicators for Quantifying Drought Resiliency (Resourcefulness)
| 4Rs (Resourcefulness) | Indicator | Sub-Indicator | Calculation Data | Sources |
| Resourcefulness (RS) | [RS1] Specified degree of drought comprehensive measures | |||
| [RS2] Degree of budgeting for water resource (drought) disasters | Ratio of local taxes among past disaster management-related expenditures | Use local tax rate (%) data | The Ministry of the Interior and Safety (MOIS) (Statistical Yearbook of Local Taxes) | |
| Percentage of self-recovery expenses in case of natural disasters | Utilize recovery cost ratio (%) | e-Country Indicators: public data request required (natural disaster recovery expenses) | ||
| [RS3] Drought prediction and alarm system availability and utilization | Securing data through interviews with disaster officials | |||
| [RS4] Drought vulnerability map existence and utilization | ||||
| [RS5] Specified degree of organizational management in drought | ||||
Appendix D. Indicators for Quantifying Drought Resiliency (Rapidity)
| 4Rs (Rapidity) | Indicator | Sub-Indicator | Calculation Data | Sources |
| Rapidity (RA) | [RA1] A local population | Population count by administrative district (city) | Use the population by city and county | The Ministry of the Interior and Safety (MOIS) (resident registered population status) |
| Percentage of vulnerable class by administrative district (city) | Ratio of 63 years of age or older by city and county | The Ministry of the Interior and Safety (MOIS) (resident registered population status) | ||
| [RA2] Virtual drought training status and specificity | Securing data through interviews with disaster officials | |||
| [RA3] Public awareness and understanding of the concept of drought | ||||
References
- Wilhite, D.A.; Glantz, M.H. Understanding: The drought phenomenon: The role of definitions. Water Int. 1985, 10, 111–120. [Google Scholar] [CrossRef] [Green Version]
- Palmer, W.C. Meteorological Drought; US Department of Commerce Weather Bureau: Washington, DC, USA, 1965; Volume 30.
- McKee, T.B.; Doesken, N.J.; Kleist, J. The relationship of drought frequency and duration to time scales. In Proceedings of the 8th Conference on Applied Climatology, Anaheim, CA, USA, 1–22 January 1993; Volume 17, pp. 179–183. [Google Scholar]
- Nalbantis, I. Evaluation of a hydrological drought index. Eur. Water 2008, 23, 67–77. [Google Scholar]
- Shafer, B.A.; Dezman, L.E. Development of surface water supply index (swsi) to assess the severity of drought condition in snowpack runoff areas. In Proceeding of the Western Snow Conference, Reno, NV, USA, 19–23 April 1982. [Google Scholar]
- Kwon, H.J.; Kim, S.J. Evaluation of semi-distributed hydrological drought using SWSI (Surface Water Supply Index). J. Korean Soc. Agric. Eng. 2006, 48, 37–43. [Google Scholar]
- Dyer, J.A.; Baier, W. An index for soil moisture drying patterns. Can. Agric. Eng. 1979, 21, 117–118. [Google Scholar]
- Karamouz, M.; Zeynolabedin, A.; Olyaei, M.A. Regional drought resiliency and vulnerability. J. Hydrol. Eng. 2016, 21, 05016028. [Google Scholar] [CrossRef]
- Karamouz, M.; Rasouli, K.; Nazif, S. Development of a hybrid index for drought prediction: Case study. J. Hydrol. Eng. 2009, 14, 617–627. [Google Scholar] [CrossRef]
- Park, J.H.; Lee, J.H.; Kim, T.W.; Kwon, H.H. A development of multivariate drought index using the simulated soil moisture from a GM-NHMM model. J. Korea Water Resour. Assoc. 2019, 52, 545–554. [Google Scholar]
- Balint, Z.; Mutua, F.; Muchiri, P.; Omuto, C.T. Monitoring drought with the combined drought index in Kenya. In Developments in Earth Surface Processes; Elsevier: Amsterdam, The Netherlands, 2013; Volume 16, pp. 341–356. [Google Scholar]
- Al-Bakri, J.T.; Alnaimat, M.J.; Al-Karablieh, E.; Qaryouti, E.A. Assessment of combined drought index and mapping of drought vulnerability in Jordan. Int. J. Eng. Res. Appl. 2019, 9, 59–68. [Google Scholar]
- Skoulikaris, C.; Makris, C.; Katirtzidou, M.; Baltikas, V.; Krestenitis, Y. Assessing the Vulnerability of a Deltaic Environment due to Climate Change Impact on Surface and Coastal Waters: The Case of Nestos River (Greece). Environ. Model. Assess. 2021, 1–28. [Google Scholar]
- Bruneau, M.; Chang, S.E.; Eguchi, R.T.; Lee, G.C.; O’Rourke, T.D.; Reinhorn, A.M.; Von Winterfeldt, D. A framework to quantitatively assess and enhance the seismic resilience of communities. Earthq. Spectra 2003, 19, 733–752. [Google Scholar] [CrossRef] [Green Version]
- Hollnagel, E. Resilience Engineering and Safety Management; Mines Paris Tech: Paris, France, 2011. [Google Scholar]
- Karamouz, M.; Rasoulnia, E.; Zahmatkesh, Z.; Olyaei, M.A.; Baghvand, A. Uncertainty-based flood resiliency evaluation of wastewater treatment plants. J. Hydroinform. 2016, 18, 990–1006. [Google Scholar] [CrossRef]
- Karamouz, M.; Rasoulnia, E.; Olyaei, M.A.; Zahmatkesh, Z. Prioritizing investments in improving flood resilience and reliability of wastewater treatment infrastructure. J. Infrastruct. Syst. 2018, 24, 04018021. [Google Scholar] [CrossRef]
- Harrison, C.G.; Williams, P.R. A systems approach to natural disaster resilience. Simul. Model. Pract. Theory 2016, 65, 11–31. [Google Scholar] [CrossRef] [PubMed]
- Paton, D.; Johnston, D. Disaster Resilience: An Integrated Approach; Charles C Thomas Publisher: Springfield, IL, USA, 2017. [Google Scholar]
- Zhou, H.; Wan, J.; Jia, H. Resilience to natural hazards: A geographic perspective. Nat. Hazards 2010, 53, 21–41. [Google Scholar] [CrossRef]
- Mihunov, V.V.; Lam, N.S.; Zou, L.; Rohli, R.V.; Bushra, N.; Reams, M.A.; Argote, J.E. Community resilience to drought hazard in the south-central United States. Ann. Am. Assoc. Geogr. 2018, 108, 739–755. [Google Scholar] [CrossRef]
- Mihunov, V.V.; Lam, N.S. Modeling the dynamics of drought resilience in South-Central United States using a Bayesian Network. Appl. Geogr. 2020, 120, 102224. [Google Scholar] [CrossRef]
- Kamara, J.K.; Sahle, B.W.; Agho, K.E.; Renzaho, A. Governments’ policy response to drought in eswatini and lesotho: A systematic review of the characteristics, comprehensiveness, and quality of existing policies to improve community resilience to drought hazards. Discret. Dyn. Nat. Soc. 2020, 2020, 3294614. [Google Scholar] [CrossRef]
- Khatibi, S.A.; Golkarian, A.; Mosaedi, A.; Sojasi Qeidari, H. Assessment of Resilience to Drought of Rural Communities in Iran. J. Soc. Serv. Res. 2019, 45, 151–165. [Google Scholar] [CrossRef]
- Lin, Y.C.; Kuo, E.D.; Chi, W.J. Analysis of Meteorological Drought Resilience and Risk Assessment of Groundwater Using Signal Analysis Method. Water Resour. Manag. 2021, 35, 179–197. [Google Scholar] [CrossRef]
- Venton, C.C. Economics of Resilience to Drought; USAID: Washington, DC, USA, 2018; p. 43.
- Korea Meteorological Administration (KMA) Drought Monitoring, South Korea. 2019. Available online: https://hydro.kma.go.kr (accessed on 7 August 2019).


| Drought Category | SPI Values | Ref. | |
|---|---|---|---|
| Mild drought | 0~−0.99 | [3] | |
| Moderate drought | −1.00~−1.49 | ||
| Severe drought | 1.50~−1.99 | ||
| Extreme drought | Experience | −2.00 ≥ SPI | |
| Metropolitan City | ||||
|---|---|---|---|---|
| Area Name | Quantitative Indicators (A) | Qualitative Indicators (B) | (A) + (B) | Resilience Level |
| Seoul | 5.20 | 4.45 | 9.65 | I |
| Busan | 5.20 | 4.04 | 9.24 | |
| Daejeon | 4.80 | 2.53 | 7.33 | |
| Gwangju | 3.40 | 3.40 | 6.80 | |
| Daegu | 2.20 | 3.52 | 5.72 | II |
| Incheon | 2.20 | 2.51 | 4.71 | |
| Ulsan | 2.20 | 1.90 | 4.10 | |
| Average | 3.60 | 3.19 | 6.79 | |
| Stdev | 1.44 | 0.91 | 2.13 | |
| CV (Coefficient of Variation) | 0.40 | 0.29 | 0.31 | |
| Evaluation Results | |||||||
|---|---|---|---|---|---|---|---|
| Quantitative Indicators (A) | Qualitative Indicators (B) | (A) + (B) | |||||
| Resilience Level | I | II | I | II | I | II | I + II |
| Average | 5.06 | 2.79 | 2.70 | 2.49 | 7.76 | 5.28 | 6.45 |
| Stdev | 0.82 | 0.81 | 0.47 | 0.36 | 0.76 | 0.81 | 1.47 |
| CV (Coefficient of Variation) | 0.16 | 0.29 | 0.17 | 0.15 | 0.10 | 0.15 | 0.23 |
| Province (“Do”) | Quantitative Indicators (A) | Qualitative Indicators (B) | (A) + (B) | Resilience Level |
|---|---|---|---|---|
| Chungcheongnam-do | 4.20 | 2.60 | 6.80 | I |
| Gyeonggi-do | 3.92 | 2.85 | 6.76 | |
| Gyeongsangnam-do | 4.21 | 2.53 | 6.74 | |
| Jeollabuk-do | 4.09 | 2.42 | 6.51 | |
| Gyeongsangbuk-do | 3.79 | 2.58 | 6.37 | II |
| Chungcheongbuk-do | 3.58 | 2.70 | 6.29 | |
| Gangwon-do | 3.72 | 2.35 | 6.07 | |
| Jeollanam-do | 3.45 | 2.51 | 5.96 | |
| Average | 3.87 | 2.57 | 6.44 | - |
| Stdev | 0.28 | 0.16 | 0.32 | |
| CV (Coefficient of Variation) | 0.07 | 0.06 | 0.05 |
| Resilience Level | Metropolitan City | Other Local Governments Based on “Province” |
|---|---|---|
| I | Seoul | Chungcheongnam-do |
| Busan | Gyeonggi-do | |
| Daejeon | Gyeongsangnam-do | |
| Gwangju | Jeollabuk-do | |
| II | Daegu | Gyeongsangbuk-do |
| Chungcheongbuk-do | ||
| Incheon | Gangwon-do | |
| Ulsan | Jeollanam-do |
Publisher’s Note: MDPI stays neutral with regard to jurisdictional claims in published maps and institutional affiliations. |
© 2021 by the authors. Licensee MDPI, Basel, Switzerland. This article is an open access article distributed under the terms and conditions of the Creative Commons Attribution (CC BY) license (https://creativecommons.org/licenses/by/4.0/).
Share and Cite
Lee, C.-W.; Yoo, D.-G. Evaluation of Drought Resilience Reflecting Regional Characteristics: Focused on 160 Local Governments in Korea. Water 2021, 13, 1873. https://doi.org/10.3390/w13131873
Lee C-W, Yoo D-G. Evaluation of Drought Resilience Reflecting Regional Characteristics: Focused on 160 Local Governments in Korea. Water. 2021; 13(13):1873. https://doi.org/10.3390/w13131873
Chicago/Turabian StyleLee, Chan-Wook, and Do-Guen Yoo. 2021. "Evaluation of Drought Resilience Reflecting Regional Characteristics: Focused on 160 Local Governments in Korea" Water 13, no. 13: 1873. https://doi.org/10.3390/w13131873
APA StyleLee, C.-W., & Yoo, D.-G. (2021). Evaluation of Drought Resilience Reflecting Regional Characteristics: Focused on 160 Local Governments in Korea. Water, 13(13), 1873. https://doi.org/10.3390/w13131873