Abstract
Flooding is one of the main weather-related disasters that cause numerous fatalities every year across the globe. This study examines flood fatalities reported in the contiguous United States (US) from 1959 to 2019. The last two decades witnessed major flood events, changing the ranking of the top states compared to previous studies, with the exception of Texas, which had significantly higher flood-related fatalities than any other state. The rankings of counties within some states changed as well. The study aims to improve understanding of the situational conditions, demographics, and spatial and temporal characteristics associated with flood fatalities. The analysis reveals that flash flooding is associated with more fatalities than other flood types. In general, males are much more likely to be killed in floods than females. The analysis also suggests that people in the age groups of 10–19, 20–29, and 0–9 are the most vulnerable to flood hazard. Purposely driving or walking into floodwaters accounts for more than 86% of total flood fatalities. Thus, the vast majority of flood fatalities are preventable. The results will help identify the risk factors associated with different types of flooding and the vulnerability of the exposed communities.
1. Introduction
Different types of weather events, including floods, lightning, tornadoes, hurricanes, and heat waves, can harm society and result in morbidities and mortalities. Flooding is one of the main weather-related disasters that cause a vast number of deaths every year across the globe [1,2,3,4]. Based on the Emergency Events Database, 6.62 million people were killed by floods worldwide in the 20th century [5]. Jonkman [6] investigated fatalities related to different types of flooding and different regions around the world from 1975 to 2002. The study found floods to be the most significant natural hazard, and flash floods caused the highest fatalities on average per event than other flood types. More than 100,000 people died in flood events across the globe in the last 10 years of the 20th century according to Jonkman [6].
Smith and Ward [7] provided detailed information on the causes and consequences of river and coastal floods and the different approaches adopted by practitioners to respond to different types of flood hazards. French and Holt [8] classified floods into three main categories: Flash floods, river floods, and coastal floods. The same classification method was adopted by other researchers who compiled data from the database maintained by the National Climatic Data Center (e.g., [9]). Flash floods are defined as floods that rise and fall rapidly within six hours or even within three hours; river floods are caused by river water overflowing its banks; and coastal floods are caused by extratropical and tropical cyclone surges [8,10]. Floods are caused by a variety of natural and man-made processes and conditions [9,10]. Specifically, several factors can contribute to flooding, including rainfall amounts and intensity, regional topography, regional land use, soil types, and antecedent moisture conditions. For example, the absence of vegetation can contribute to flash flooding; steep slopes can cause fast surface runoff; rapid snowmelt in mountain areas can lead to the sharp rise of downstream rivers; and the breach of a dam or levee can lead to flash floods [8]. These reasons have led to several researchers calling for the adoption of an integrated approach for studying devastating flooding events that includes observations and modeling e.g., [11,12,13].
In a study that examined the detailed circumstances of more than 1000 flash flood fatalities across the US, Terti et al. [14] observed that the fatality circumstances exhibited certain characteristics related to season, time of day, duration of flood, location, and age and gender groups. Hamilton et al. [15] performed psycho-cognitive analysis of the beliefs of people who willingly drive into flood water in Australia. They identified key attitudinal, social expectations, and efficacy beliefs that guide willingness to drive through flooded waterways, including fear of being stranded, pressure from others, and seeing other drivers doing it, among others. Diakakis [16] analyzed 60-year flood fatality data from Greece and found a strong association between the risk-taking behavior during floods and the demographics of the victims, the type of the surrounding environment, and vehicle use, and used this information to develop a statistical model to predict the behavior of a flood victim based on the characteristics of the individual and the environment. Vinet et al. [17] examined fatalities resulting from two flood events in France—a total of 67 fatalities. They found that the individual vulnerability is the product of internal factors including personal knowledge, age, and health, and awareness of the risk, and external factors such as the availability of shelter and building type. They stressed the need to address all of these specific vulnerabilities in prevention and warning messages. Diakakis et al. [18] studied flood fatalities in Greece and identified factors and behaviors leading to increased vulnerability and found them to be different between urban and nonurban environments.
According to weather-related fatality and injury statistics from the National Weather Service (NWS) for the 10-year average of 2009–2018 and for the 30-year average of 1989–2018, floods caused the second-highest number of weather-related fatalities in the US, surpassed only by heat waves [19]. However, Borden and Cutter [20] listed flooding as the fourth deadliest weather-related disaster behind heat/drought, severe weather, and winter weather. Kunkel et al. [21] observed and discussed a generally increasing trend of flood-related damages and fatalities in the last 25 years of the 20th century in the US. Freshwater flooding from 1970 to 1999 caused more than one-half of 600 water-related fatalities in the contiguous US [22].
Several researches have examined flood-related fatalities in the United States e.g., [1,9,10,23]. French et al. [23] reported that flash floods contributed to the most flood fatalities, identifying 1185 fatalities caused by 32 flash flood events from 1977 to 1981. According to the study, forty-two percent (42%) of reported drowning deaths were vehicle-related. In four flood events involving dam breaks, warnings for heavy rain, and flash flooding were issued, but none for dam failure. Dittmann [1] estimated a total of 3934 flood fatalities from 1959 to 1991 in the United States with an annual average of 119 fatalities, while Ashley and Ashley [10] reported a total of 4586 fatalities related to flooding in the contiguous US from 1959 to 2005, with an annual average of 97.6 fatalities (excluding the data of Hurricane Katrina, which occurred in 2005). Ashley and Ashley [10] suggested that heavy rain, snowmelt, structural failure, and a combination of these factors all contributed to flooding. They also found that flash floods accounted for the majority of flood-related fatalities and identified high-fatality regions, such as the Ohio River valley, the northeast Interstate-95 corridor, and near the Balcones Escarpment in south-central Texas. Sharif et al. [9] conducted research on Texas from 1959 to 2008 and observed that the edge of Balcones Escarpment is a region of remarkably high fatalities. According to the study, a total of 840 flood-related fatalities occurred in Texas and flash floods caused a majority of those fatalities.
This study is motivated by several major floods that occurred in the US in recent years and resulted in a significant number of fatalities. The analysis investigates the demographic aspect (gender and age), spatial aspect, and temporal aspect (time of the day and month of the year), flood type, and circumstances leading to flood fatalities in the contiguous US between 1959 and 2019. The purpose of this study is to improve understanding of the situational conditions, demographics, and spatial and temporal characteristics of flood fatalities and describe how the results can be used to improve flood fatality prevention measures and warning messages taking into account compounding situations, such as the recent COVID-19 pandemic.
2. Study Area and Data Source
The study area includes the contiguous (conterminous) United States (CONUS), which consists of the 48 adjoining US states and the District of Columbia (DC). The study area excludes the non-contiguous states of Alaska and Hawaii. Together, the 48 contiguous states and the District of Columbia occupy an area of 8,080,464 km2. The climate of CONUS is controlled to changes in latitude and a range of geographic features, including mountains and deserts. Generally, the climate of CONUS becomes warmer in the north-south direction and drier in the east-west direction except for very wet areas along the West Coast. West of 100° W, the climate is cold and semi-arid in the interior upper western states, whereas the climate is warm, hot desert, and semi-arid in southwestern US. East of 100° W, the climate becomes humid continental in northern areas, transitioning into a humid temperate climate from the Southern Plains and lower Midwest east to the Middle Atlantic states. In addition to local climate and type of precipitation, flooding potential is controlled by local topography and other land surface characteristics [24]. For example, the steep mountainous terrain and major urban centers exposed to tropical storms and convective rainfall systems are more prone to flooding [25]. Another example is the encounter of warm and humid air from the south, the Gulf, and the cold air from the north that occurs right above the Balcones escarpment curve in Texas causing heavy rains and floods (Flash Flood Alley of Texas). At the same time, tropical storms from the Gulf are another contributor to the heavy rains and floods in the Alley [9].
The flood fatality data used in this study were compiled from Storm Data publications [26]. Storm Data is maintained by the National Climatic Data Center (NCDC) as monthly reports including detailed information on severe weather events across the US and their impacts, especially injuries and fatalities. The NWS started producing the “Climatological Data” publication, which only reported information on tornadoes and their impacts in 1950 and later added information on thunderstorms, wind, and hail in 1955. In 1959, the “Climatological Data” was officially renamed “Storm Data” and started to include data on all storms and other severe weather phenomena. NWS-designated officials compile the information included in the Storm Data publication from numerous sources. These sources include, but are not limited to, emergency management officials in different administration levels, law enforcement, media, insurance companies, and the public [26]. Storm Data provides some details about flood fatalities and victims. The description of the flood type in Strom Data is confusing to a large degree and include categories that seem to overlap including “flood”, “flash flood”, “flash flood and flood”, “flash flooding and river flooding”, “rain”, “heavy rain and flooding”, “flooding due to hurricane/tropical storm”, and “storm/tornadoes/cyclones”. The causal activity/setting/location of the fatality includes “in water”, “vehicle”, “permanent home”, “mobile home”, “outside”, “camping”, “boat”, “business”, and “equipment”. The gender and age of the victims are provided for some of the victims. The time of the fatality occurrence is often provided in broad terms. Detailed information is missing for many fatalities. For example, the time of occurrence was not mentioned for 62% of the fatalities.
Currently, Storm Data is the primary and most comprehensive source for flood fatality data, despite it containing several problems. For example, quality control is an important concern for all large databases such as Storm Data. The flood fatality data in Storm Data is generally conservative and underreported [9]. Some of the flood fatality records lack certain details, such as the age and gender of the victims, time of the fatality occurrence, and the specific location. Moreover, the description of the events is not always consistent, and the amount of details may vary among states. Nevertheless, the fatality data listed in Storm Data are well documented in general and the dataset is the best available source of this kind of flood fatality data [7,10,14,27]. Lastly, a review of event descriptions in Storm Data reveals that they have become more thorough over the years. Population data was obtained for the US Census Bureau [28].
3. Methods
Flood fatality data used in this study were compiled from Storm Data. The fatality data is listed in five broad categories that define the main flood types. These categories are coastal flood, flash flood, flood, heavy rain, and tropical storm. Moreover, fatality data from 1959 to 1995 were only available by manually reviewing the PDF files. We downloaded and reviewed these files to manually extract the needed data from each file. Data for years after 1995, were directly downloaded from the website in a tabular format. To compare the flood fatality risk for each state in the contiguous United States, the number of flood-related fatalities of each state is standardized by the corresponding population estimate for the state in the corresponding year (annual fatalities/population of the year). The description provided in Storm Data was used to categorize fatality data, e.g., by flood type, activity/setting/location, time, and age/gender although these descriptions were missing from a significant number of fatalities as will be explained in the analysis. The population data of each state in each year was based on estimates of the US Census Bureau [28]. The percentages of population in different age groups were obtained from the average of population percentages for different age groups of 1960, 1970, 1980, 1990, 2000, and 2010 following the approach described by Dittmann [1]. To verify the age-related vulnerability to flood hazards, the fatality numbers were standardized by multiplying fatality numbers in each age group and the corresponding percentage of population in each age group. Flood fatality data for each state were downloaded for each year and then combined when necessary. In-house R scripts were developed to extract the data needed for the analysis. Excel was used to perform analysis of variance (ANOVA) to compare variables, such as gender. One-sample chi-square test was used to confirm the seasonality of fatalities.
4. Results and Discussions
4.1. Spatial Distribution of Flood Fatalities
The spatial distribution of flood fatalities has been investigated at the state, NWS Weather Forecast Office service region, and county levels. As can be seen in Table 1, Texas had the most fatalities (1069) during the 61-year study period while Louisiana (693) and California (340) were a distant second and third, respectively. Moreover, Texas is the only state that reported flood fatalities consistently in every year from 1959 to 2019, except for the year 2011 in which the state witnessed a historic drought. All previous studies show Texas as the leading state in flood fatalities but the other leading states were ranked differently in the studies. For example, Ashley and Ashley [10] found the top three states with the most flood fatalities to be Texas (760), Pennsylvania (256), and South Dakota (244), respectively, for the 1959–2005 period. Sharif et al. [9] examined the period from 1959 to 2008 and found Texas (840), Louisiana (621), and Pennsylvania (265) to be the three states with the most flood fatalities.

Table 1.
Flood fatalities in the 48 contiguous states and District of Columbia (DC) and their ranks from (1959–2019).
Standardized flood fatality is a better measure of the risk of being killed in a flood. The fatality rates for all states, expressed as the average annual number of fatalities per million inhabitants, are shown in Table 2. After standardization, Texas’ ranking drops to 6th place behind South Dakota, Louisiana, West Virginia, Colorado, and Arizona. However, unlike Texas, fatalities in these states were caused by one or two major events such as the major dam failure in South Dakota and Hurricane Katrina in Louisiana. Moreover, as expected, states with relatively small population sizes such as Montana and Wyoming have higher fatality rates, and populous states such as California, Pennsylvania, and New York have much lower rankings in Table 2 than in Table 1. These fatality rates are generally higher than rates observed in Europe. Petrucci et al. [29] observed rates (fatalities per million inhabitants) ranging between 37.7 for south France and 6.7 for Italy when they standardized the total fatality by the 2019 population. If similar standardization was done for US data, European numbers would be between the 11th- and 40th-ranked US states. Fatality rates estimated for Australia (decadal average rates [30]) during the same period are similar to those for the 41st-ranked US state. Sharif et al. [9] highlighted the effect of population when they investigated flood fatalities at the county level in Texas. Coates [30] reported similar observations showing that the Northern Territory of Australia with small population size had a significantly higher fatality flood rate than other regions of the country.
Table 2.
Average annual fatality rates per one million persons of the 48 contiguous states and DC and their ranks (1959–2019).
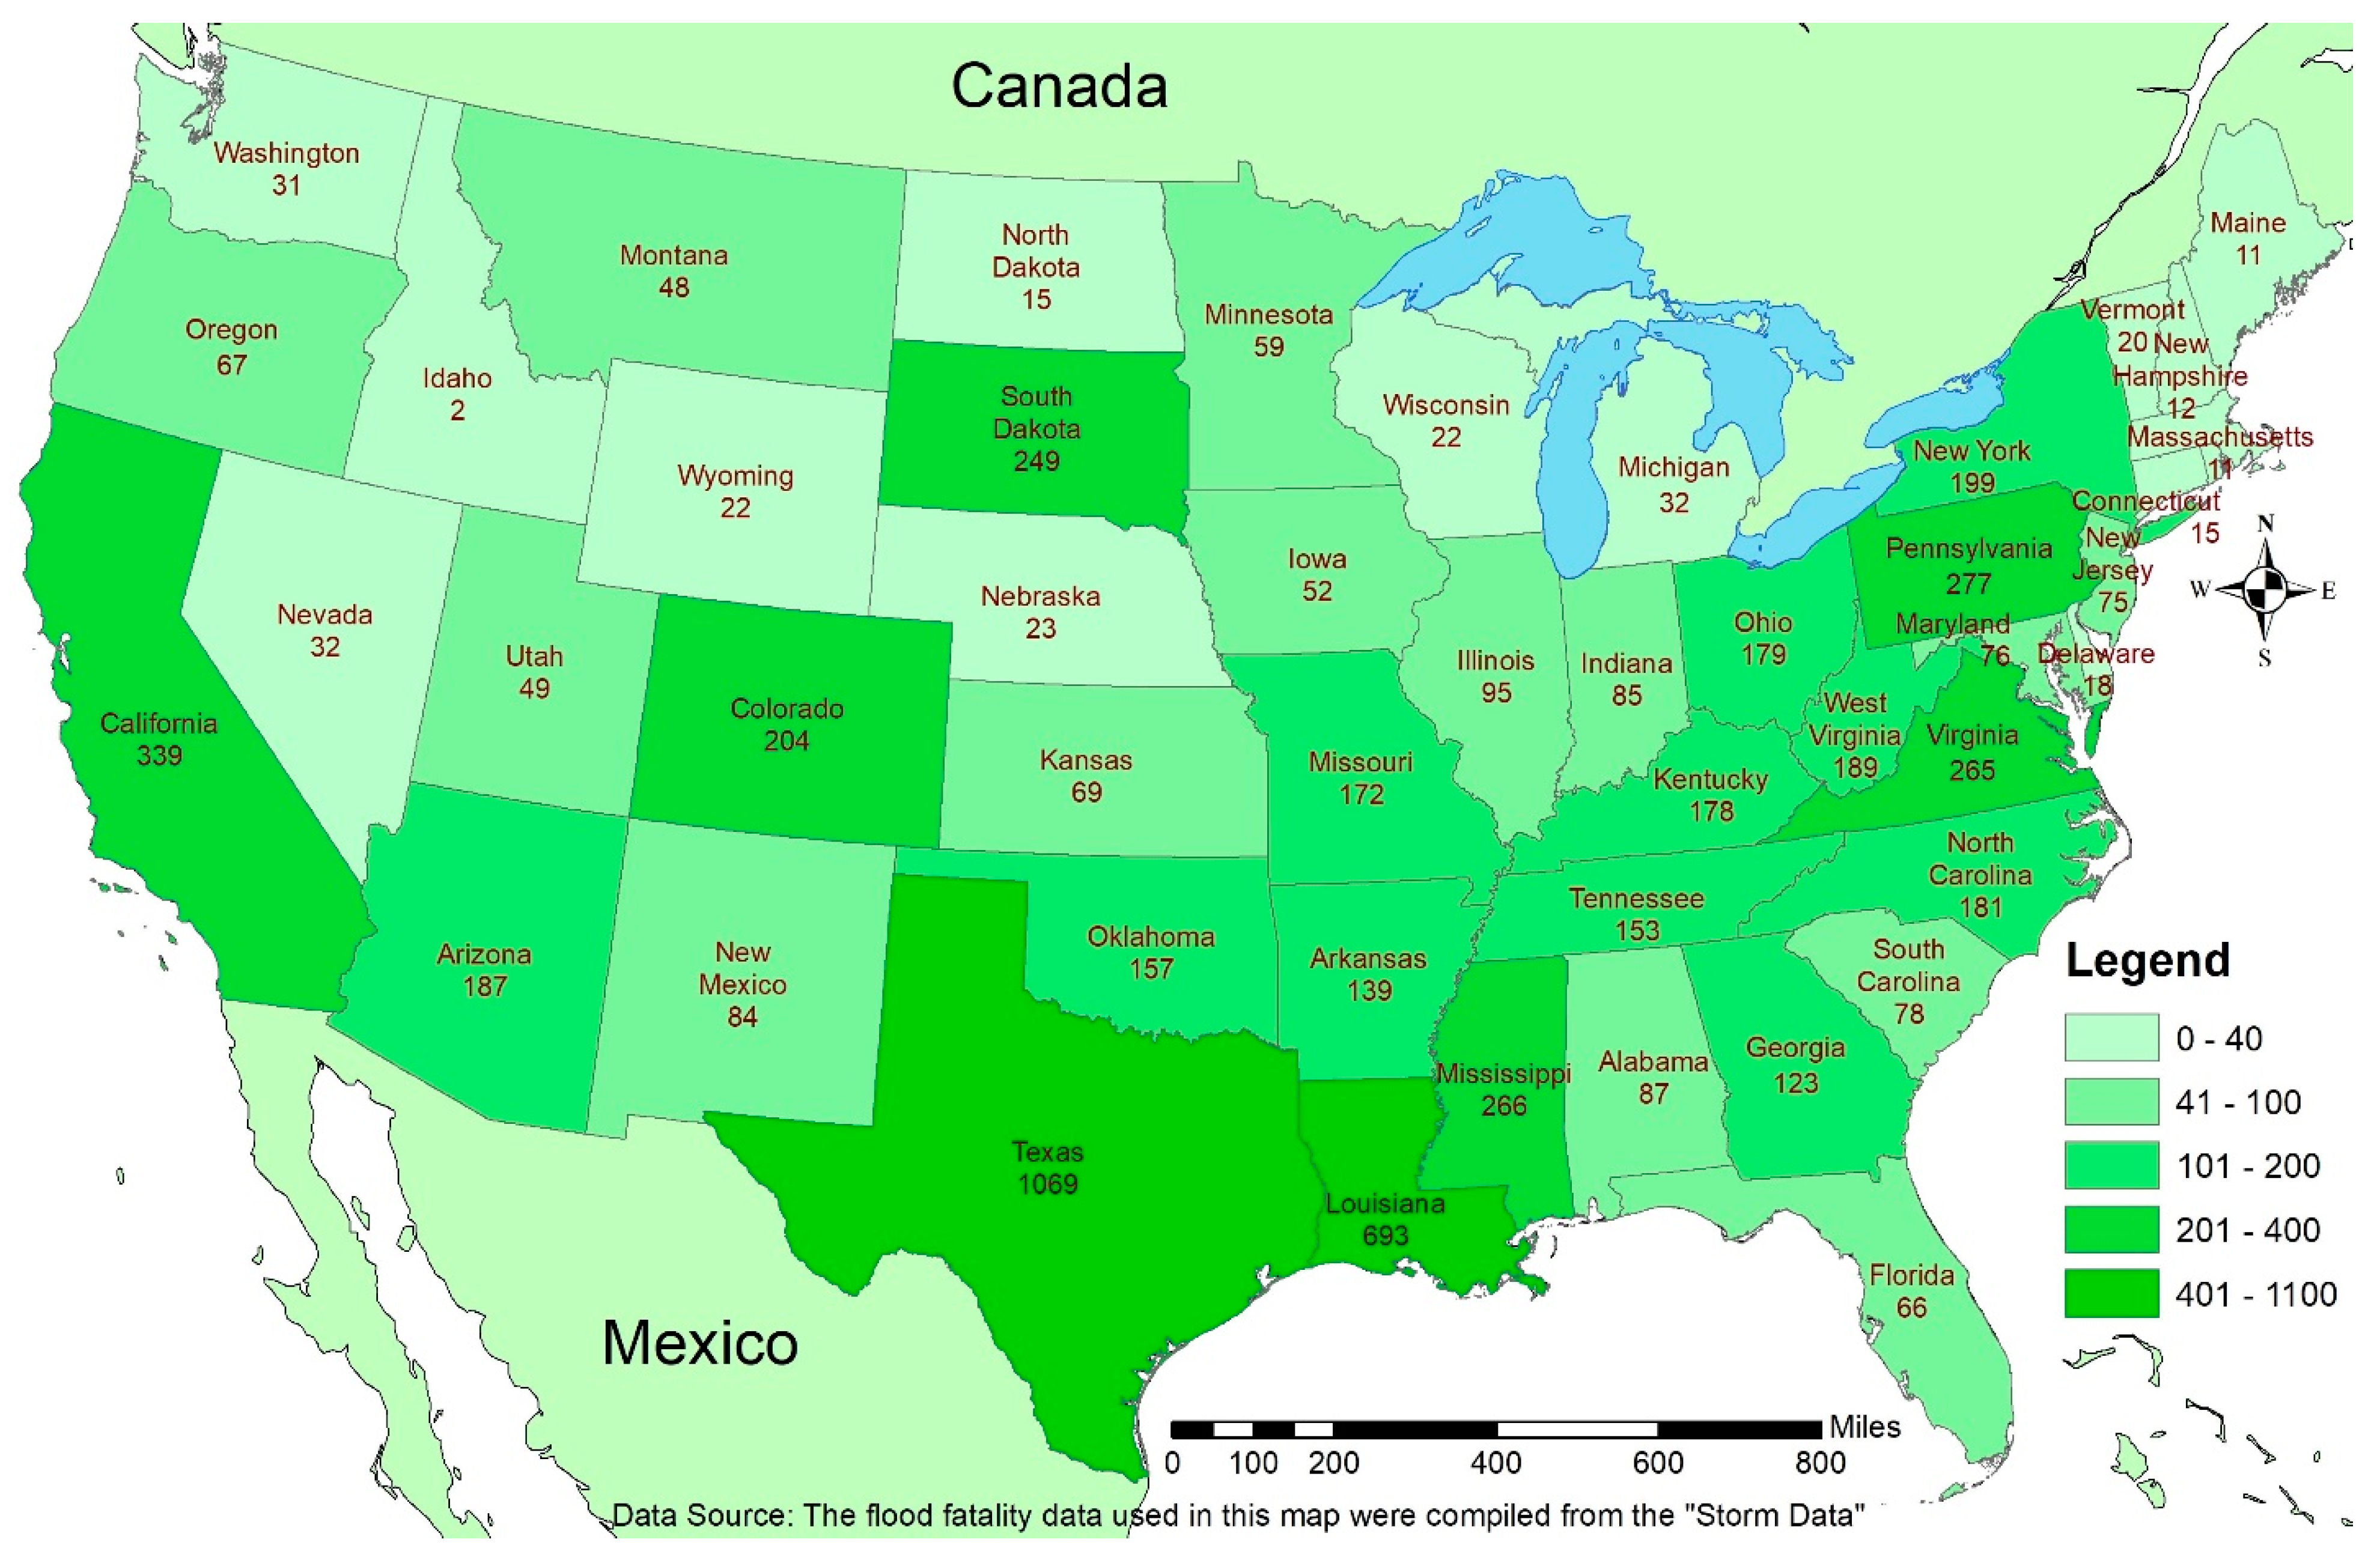
Figure 1 shows that states with the lowest number of fatalities are mostly located at the northeastern corner and northern border of the United States. Flood fatalities are not directly related to the amount of precipitation, area of the state, population, or topography, but due to local considerations [1,31]. The eastern states of the United States had more flood fatalities than the western states, in general. The steep mountainous terrain (e.g., parts of Texas, Appalachian Mountains in the eastern US, and the foothills of the Rocky Mountains in Colorado), populous cities exposed to tropical storms, and convective rainfall systems suffer from higher flood fatalities [25].
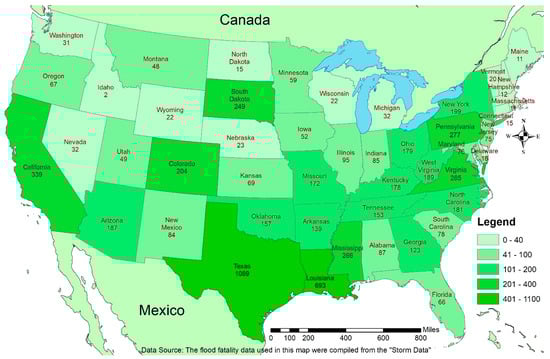
Figure 1.
Flood fatalities in the contiguous US (1959–2019) by state.
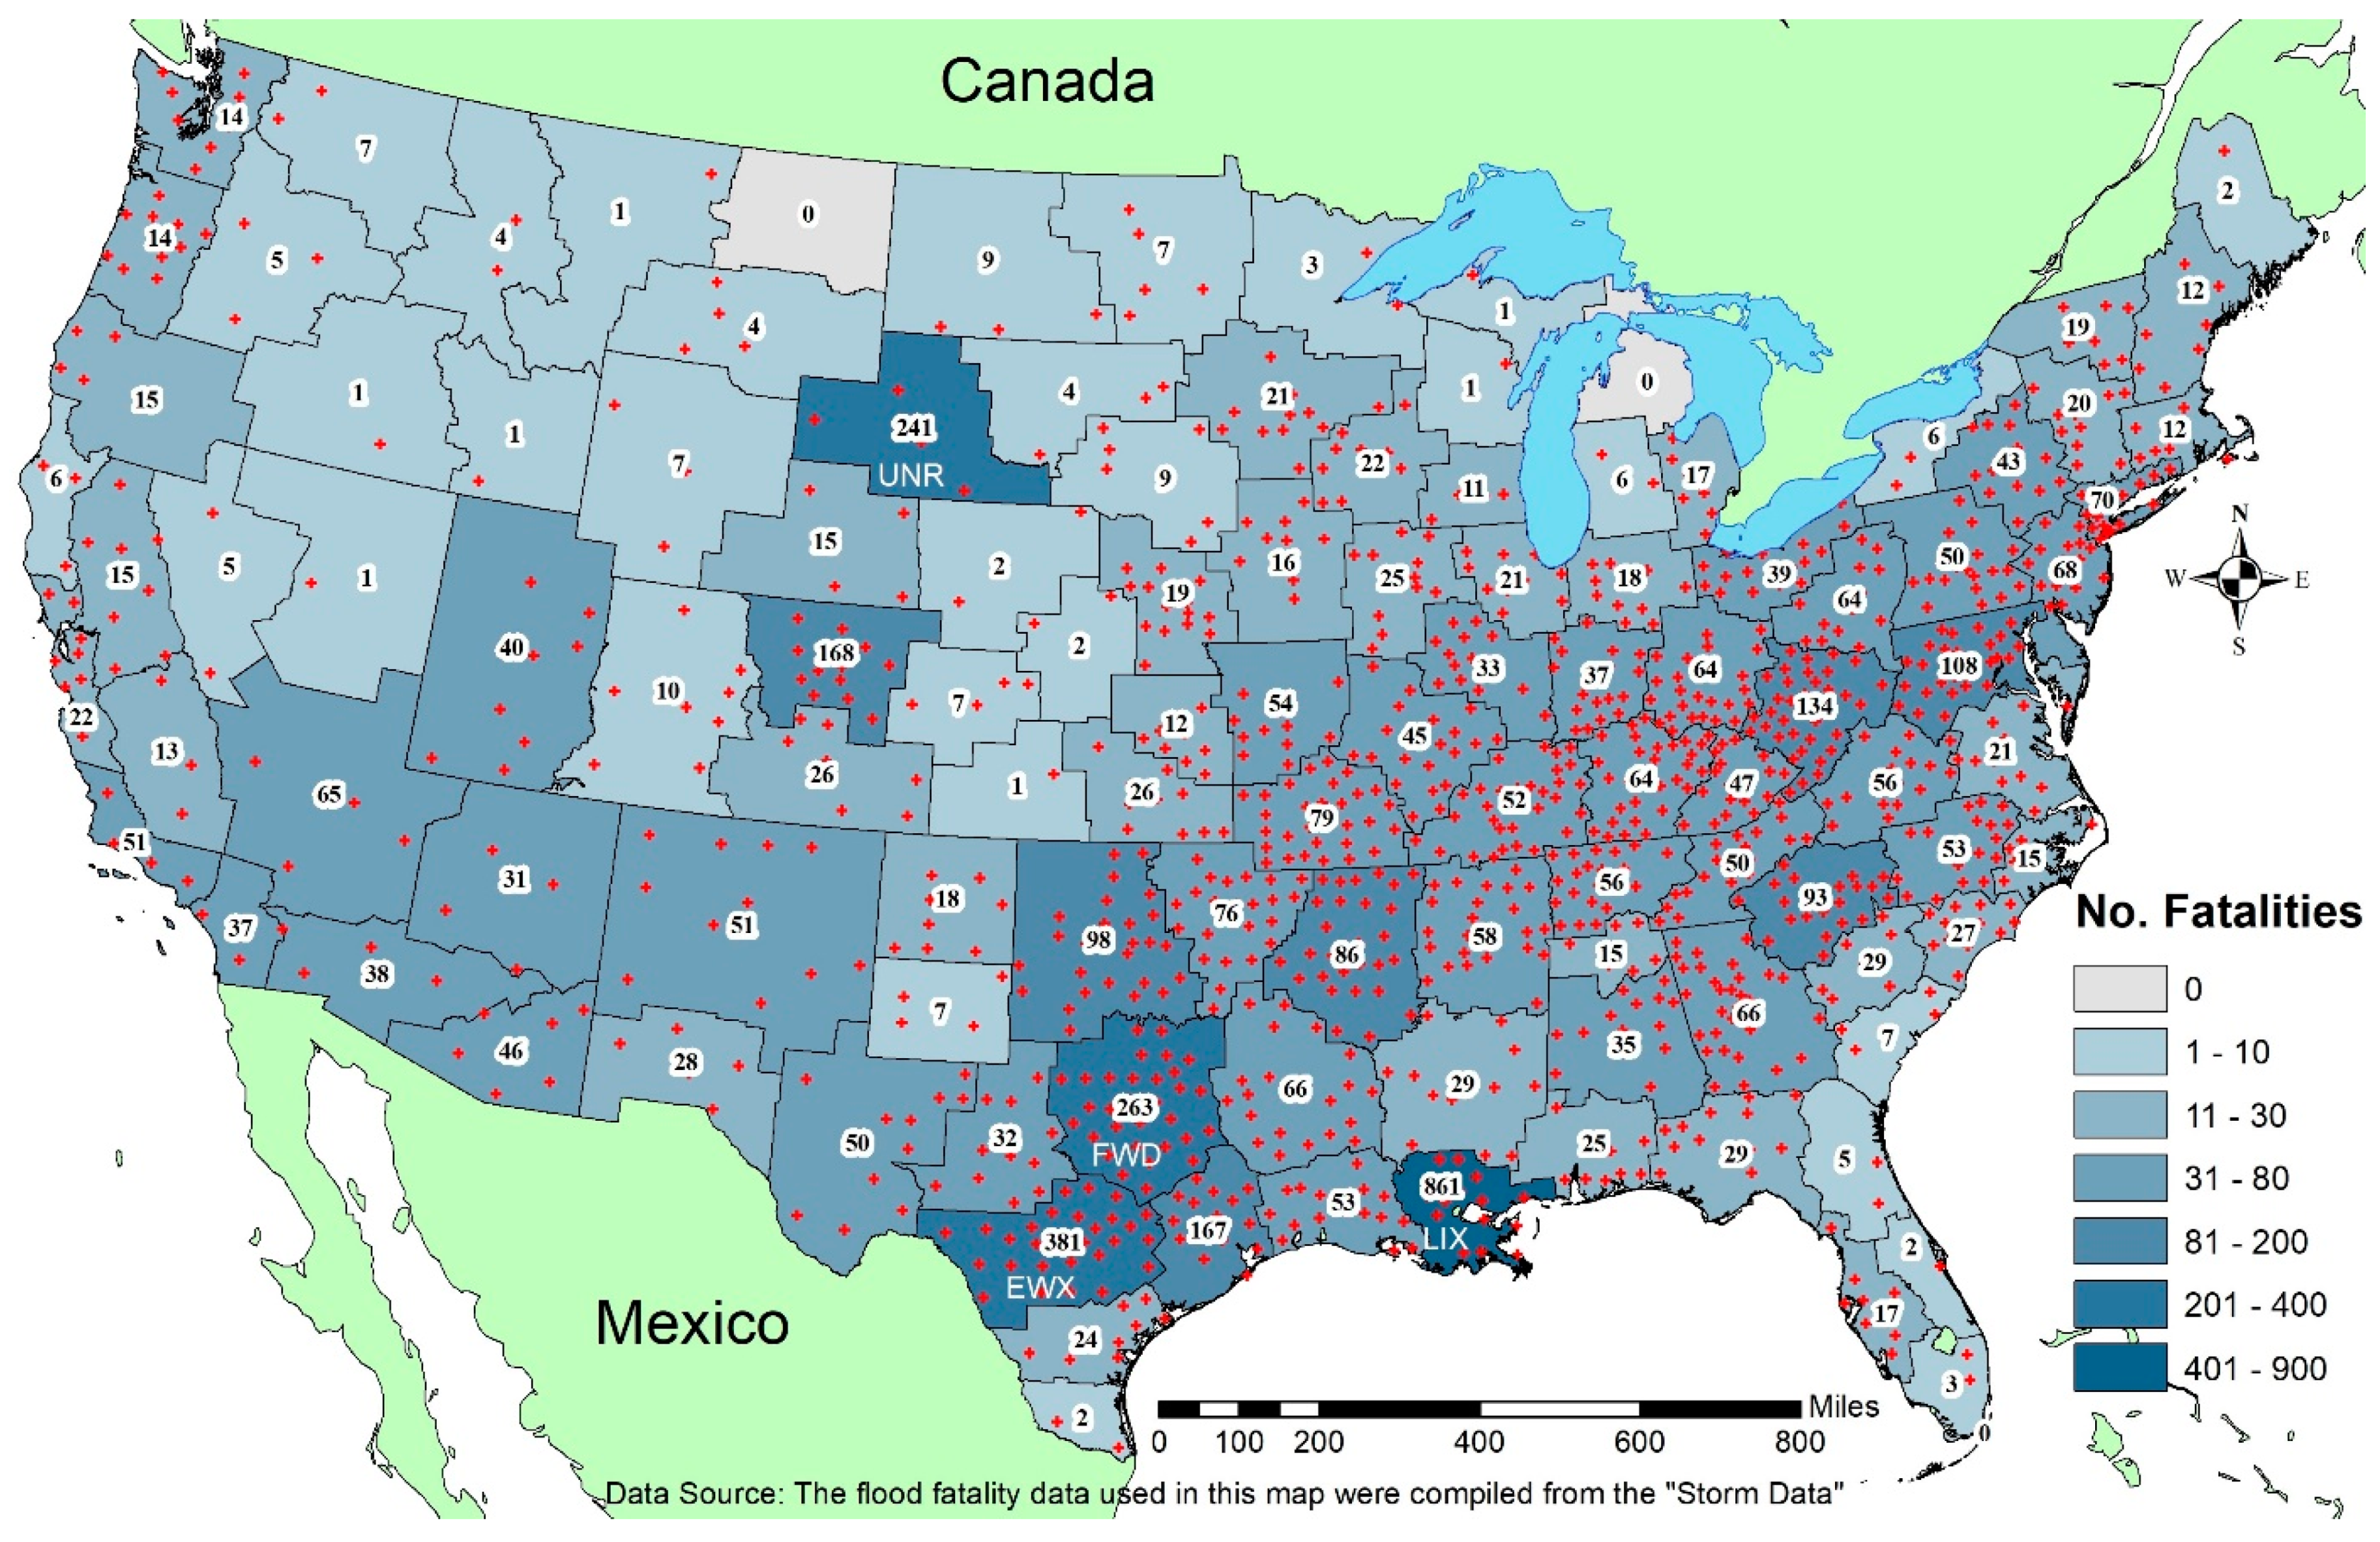
The NWS has 122 weather forecast offices across the US. Each weather forecast office (WFO or NWSFO) has a geographic area of responsibility (county warning area) for issuing local public, marine, aviation, fire, and hydrology forecasts as well as severe weather warnings and coordinates with local agencies in flood mitigation efforts. As risks and vulnerability are not defined by state lines, we also show the distribution of flood fatalities at the NWS WFO service area level in Figure 2. Some of the WFOs in the north have not reported any fatalities in the study periods while others have witnessed hundreds of fatalities. In general, the information is similar to that of Figure 1 but shows some contrasts within some of the states. For example, some WFOs on the Atlantic and Gulf coasts reported relatively very low numbers of fatalities. The New Orleans/Baton Rouge WFO (LIX), where Hurricane Katrina occurred, had the highest number of flood fatalities (861) in the nation. The second and third WFOs are the Austin/San Antonio WFO (EWX) and the Fort Worth/Dallas WFO (FWD) with 381 and 263 fatalities, respectively, both located in the Flash Flood Alley area in Texas. The Rapid City WFO (UNR) reported 241 flood fatalities of which 237 were due to a dam failure in June 1972.

Figure 2.
Flood fatalities by NWS WFO service area. The dots represent counties where fatalities were reported (many counties reported more than one fatality).
The spatial distribution of flood fatality has been further examined in detail at the county level. As can be seen in Figure 3, only 64 counties (or political equivalents) out of 23,218 in the contiguous US had more than 10 fatalities during the study period. These 64 counties have 2572 flood fatalities in total, accounting for 39% of US flood fatalities. The county (political equivalent) with the most flood fatalities (654) is the Orleans parish of Louisiana, the epicenter of the fatalities caused by Hurricane Katrina in 2005. There are four other counties with more than 100 flood fatalities: Pennington County (237) of South Dakota, St. Bernard County (154) of Louisiana, Larimer County (143) of Colorado, and Harris County (101) of Texas. Three other counties, Bexar (75), Dallas (69), and Travis (60), all located in Texas, had more than 50 flood fatalities.
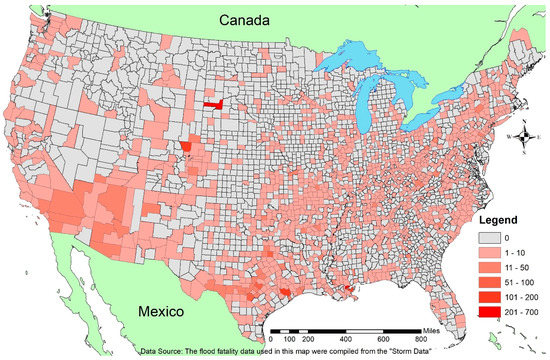
Figure 3.
Flood fatalities by county (or equivalent).
Figure 3 shows two county clusters with more than 10 fatalities. The first is the area of Arizona and the southern part of California and Nevada. Kellar and Schmidlin [32] also found a similar spatial pattern of flood fatalities in this area when they focused only on vehicle-related flood fatalities. Heavy rains caused by the Mexican monsoon from July to September over the southwest result in floods in that area [33]. High population density in this area is another contributor to flood fatalities [32]. The second one is a region in Texas, including the only three counties in the US with flood fatalities between 50 and 100. This region includes a band of counties with flood fatalities mainly from 11 to 100 in Texas. Local researchers refer to this area as the Flash Flood Alley. The Alley consists of 27 counties and includes large cities such as Dallas, Austin, and San Antonio. The counties in the Flash Flood Alley are clustered on the edge of the Balcones Escarpment. The encounter of warm and humid air from the south, the Gulf, and the cold air from the north occurs right above the escarpment curve causing heavy rains and floods. At the same time, tropical storms from the Gulf are another contributor to heavy rains and floods in the Alley [9]. Kellar and Schmidlin [32] also found a cluster of vehicle-related flood fatalities in this area. Similar to the change in rankings of states, recent events affected the ranking of counties within some states in terms of flood fatalities. For example, Harris County went from being the fourth [9] to the first county in Texas due to a marked recent increase in fatalities in eastern Texas.
4.2. Flood Fatalities by Year
Floods caused about 106 flood fatalities per year on average in the contiguous US over the 61-year period, for a total of 6478 flood fatalities. This is lower than the average of 119 estimated by Dittman [1] for the 1959 to 1991 period and an average of 135 fatalities per year from 1972 to 1991 in the US and Puerto Rico. However, Ashley and Ashley [10] estimated the average annual flood fatalities at 97.6 with a total of 4586 flood fatalities for the 47-year period from 1959 to 2005. Flood fatalities happened every year from 1959 to 2019 in the contiguous United States according to Storm Data. The vast majority of lethal flooding events resulted in only one or two fatalities. The annual fatalities numbers fluctuated from a minimum of 25 (1988) to a maximum of 640 (2005) and did not show any statistically significant trend over the last 61 years (Figure 4). The number of flood fatalities in 1969, 1972, and 2005 were significantly higher than in other years. The numbers of fatalities vary significantly from year to year, especially for states where fatalities are dominated by one or a few significant events, e.g., South Dakota and Mississippi.
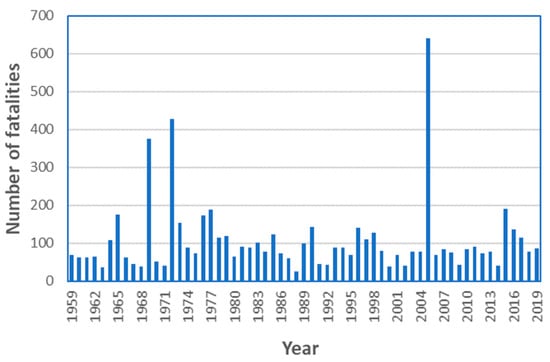
Figure 4.
Annual flood fatalities in the contiguous US (1959–2019).
In 2005, Hurricane Katrina hit the US, especially the Gulf Coast, and moved ashore near Buras-Triumph of Louisiana as a category 3 storm. The total number of people killed during Hurricane Katrina is still uncertain 14 years later and varies among different studies [9,34,35,36,37]. Boyd [34] suggested that the flood fatality rate would range from 0.7% to 1.1% of all populations of around 63,000 people exposed to floodwater. Similarly, Jonkman et al. [36] estimated the flood fatality rate at 1% and the exposed population at 44,000. The Katrina flood fatalities calculated in these two studies were 441–693 and 440, respectively. Sharif et al. [9] estimated flood fatalities due to Hurricane Katrina, based on the studies of Brunkard et al. [35] and Knabb et al. [37], and calculated the numbers as 520 fatalities in Louisiana and 80 in Mississippi. Storm Data classifies the deaths due to Hurricane Katrina in the categories of “Hurricane (Typhoon)” but details about the fatalities are still waiting for updates. In 1969, Camille, a category 5 hurricane, struck the Gulf Coast and inundated an area of 320 square miles along the Mississippi-Alabama coast. Later, Camille moved inland and eastward over the central part of Virginia and merged with heavy rain and thunderstorms [38]. Camille resulted in 132 flood fatalities in Mississippi and 109 in Virginia. In 1972, thunderstorms caused rare heavy rains and then flash flooding in Rapid City, South Dakota; the Canyon Lake Dam near Rapid City was clogged due to the debris carried by a large amount of upstream flood water and then failed in the night [39]. The Rapid City had been swept through by floodwaters and 237 flood fatalities were recorded. Lastly, Colorado suffered from a notable flash flood event in July 1976. The Big Thompson River flash flood resulted in 131 fatalities, including locals and campers, in the narrow and steep Big Thompson Canyon [40].
Beside the above years, the five costliest storms of all the 284 hurricanes that struck the mainland of the US during 1851–2019 all happened within the last 15 years. These were Katrina (2005), Harvey (2017), Sandy (2012), Irma (2017), and Ike (2008), respectively [41]. In 2012, Hurricane Sandy struck the Caribbean and the mainland of the US. Twenty-four (24) states of the US were affected by Sandy while New Jersey and New York were the two states with the most severe damage [18]. According to Storm Data, a total of 38 flood fatalities resulted in New York on 29 October 2012, and four in New Jersey. In 2017, a category 4 hurricane, Harvey, moved ashore on Texas. A total of 67 out of 70 fatalities that occurred in Texas during the hurricane period were caused by flash floods.
4.3. Flood Fatalities by Month
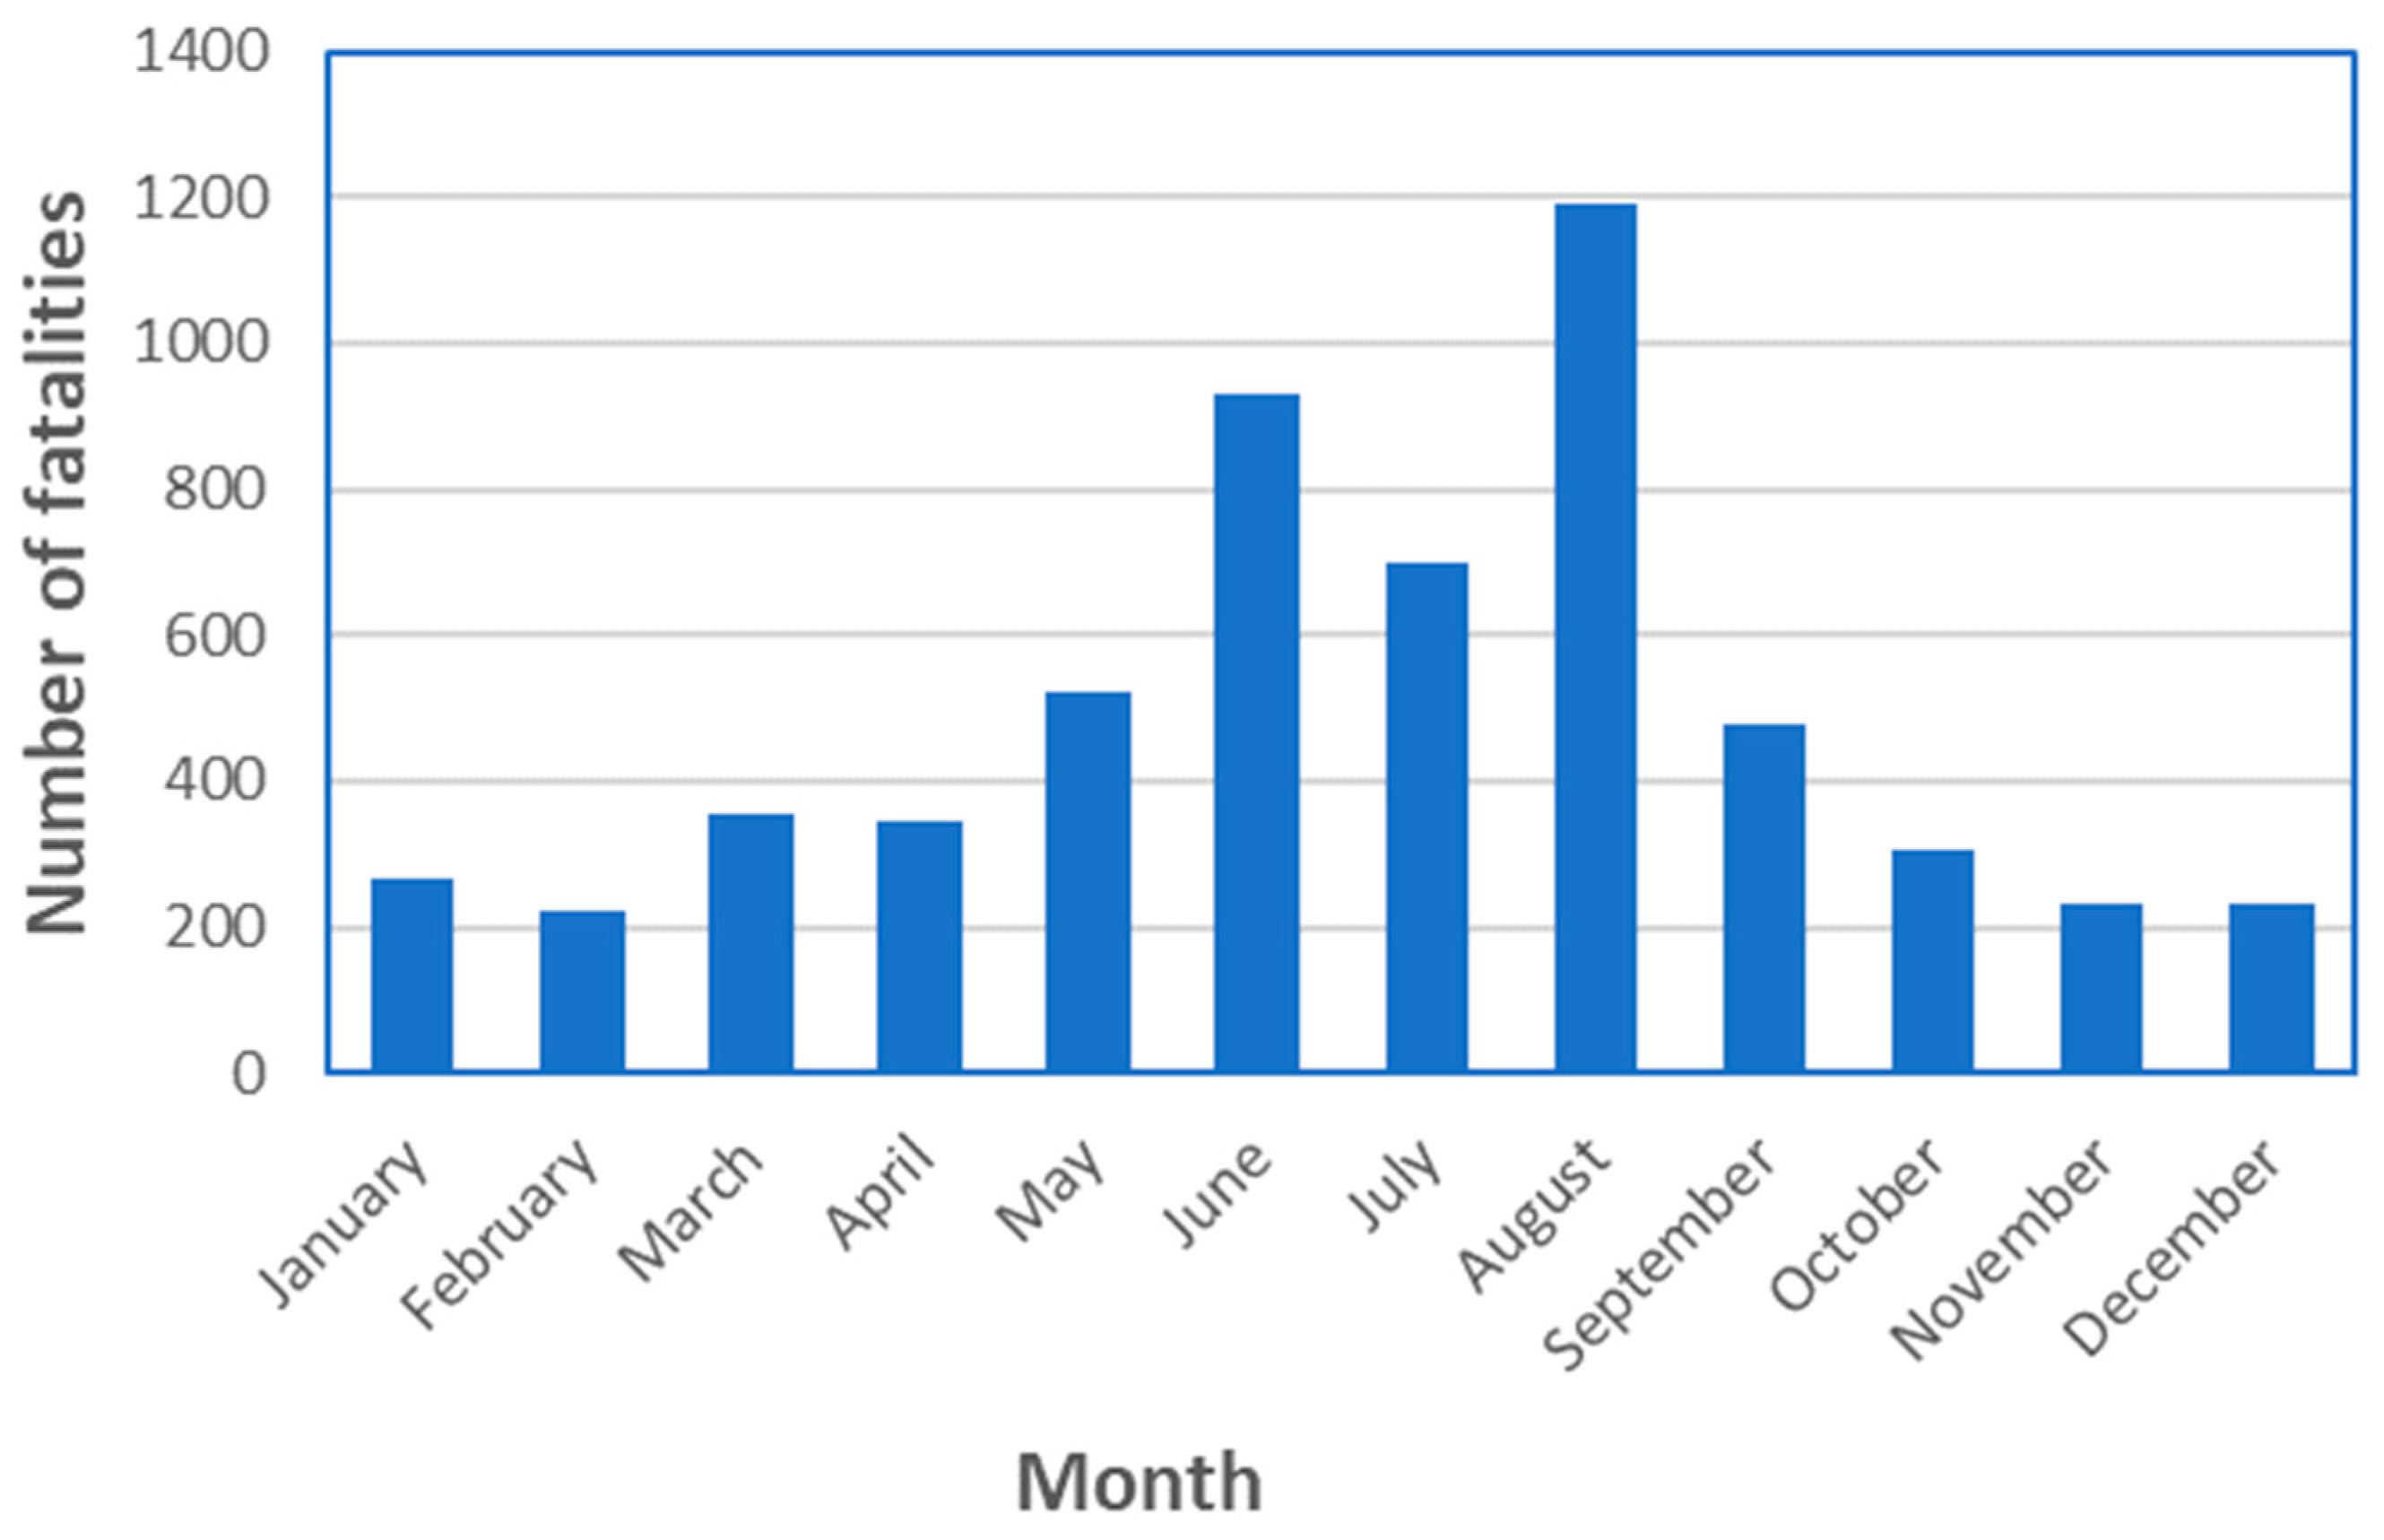
The monthly distribution of flood fatalities in the US is shown in Figure 5, indicating the top three months to be August (1191), June (933), and July (700). This is generally consistent with monthly distributions of flood fatalities reported by other researches. However, there are some differences among the state in terms of the monthly distribution of fatalities. A one-sample chi-square test has been applied and the result (p < 0.01) shows a statistically significant seasonality in the distribution of monthly flood fatalities. French et al. [23] reported that 20 of 34 major flood events occurred from July to September during the period of 1969–1981. Ashley and Ashley [10] found June to be the top month for fatalities between 1959 and 2008, not including those caused by Hurricane Katrina. Hurricanes Katrina (2005) and Harvey (2017) both occurred in August. All months from May to August had more than 500 flood fatalities each.

Figure 5.
Monthly distribution of flood fatalities in the contiguous US (1959–2019).
Several related studies tried to explain why high flood fatalities happened during these months in the contiguous US. Brook and Stensrud [42] conducted research on heavy rain events that could have caused flash floods in the US during 1948–1993. According to the study, heavy precipitation events peak in July with the remaining months showing an almost symmetrical decrease around July, and heavy rainfall events from April to September accounting for 81% of the total events [36]. Ashley et al. [43] reported that 86% of mesoscale convective complex events, typically associated with extreme rainfall, occurred in the warm season (May, June, July, and August), with a peak in July. According to Changnon [44], thunderstorms accounted for more than 50 percent of the total precipitation in the US, and summer (June to August) thunderstorm rainfall accounted for 20–40 percent of the total over two thirds of the area of the contiguous US. More than 83% of all the 284 hurricanes that struck the mainland of the US from 1851 to 2010 occurred from August to October [4]. Douglas [33] reported similar results regarding precipitation peaks.
4.4. Flood Fatalities by Flood Type
A total 5381 flood fatalities were recorded with flood (event) type information. The main flood type associated with fatalities is flash flooding accounting for 41.80% of the total flood fatalities that have flood type information recorded (Table 3). However, the authors suspect that many of the fatalities labeled in Storm Data as flood fatalities are actually flash flood-induced and were embedded within a large flood context or simply mislabeled. Moreover, the flood types in Storm Data are too broad as described in the Study Area and Data Source section. Different events, such as heavy rain, tropical storm, structural failure, snow melting, and a combination of these events, can also cause flash flooding. Zevin [45] reported that flash floods caused 80–90% of annual flood fatalities in the US. Ashley and Ashley [10] found flash flooding, primarily caused by heavy rain, to be the major flood type causing flood fatalities. Flood (river flooding or just simply flood in Storm Data) is second to flash flooding in causing deaths. It caused 1425 fatalities, accounting for 26.3% of total flood-related fatalities. Rain and flooding due to hurricane/tropical storm/tornadoes/cyclones both caused more than 10 percent of total flood fatalities. Other types of fatality-causing flood types identified in Storm Data are listed in Table 3. A rip current, often associated with stormy weather, is a specific kind of water current that can occur near beaches with breaking waves.
Table 3.
Number of food fatalities caused by different flood (event) types.
4.5. Flood Fatalities by Circumstance and Time of Occurrence
Storm Data also provides information on the circumstances leading to flood fatalities. However, only 59 percent of the total fatalities had such information. Flood fatalities that involved vehicles accounted for 57.80% of total fatalities with known circumstances (Table 4). The high percentage of vehicle-related flood fatalities was reported in other studies with percentages varying for different locations and study periods. Mooney [27] reported that 49% of flood fatality victims died in their vehicles or while trying to escape from their vehicles; French et al. [23] and Zevin [45] found lower percentages of 42% and 40%, respectively; and Ashley and Ashley [10] estimated a higher percentage of 63%. Some drivers overestimate the ability of vehicles to overcome fast moving water and/or were not able to realize the depth and speed of floodwater [9,46]. Some of the victims were not willing to give up their vehicles and then were trapped inside [47]. In Water (IW) was the second most frequent category of circumstances accounting for 28.34 percent of total fatalities with known circumstances. “In Water” is defined as people who walked into the floodwater purposely. For instance, some people may walk into floodwater to rescue some people or retrieve personal properties. This percentage in this study (28.34%) is significantly higher than the 9% reported by Ashley and Ashley [10]. The combined percentage of fatal driving or walking into floodwater (86.13%) indicates that the vast majority of victims underestimated or did not realize the potential danger of flood water. Table 4 lists seven other categories of circumstances associated with flood fatalities accounting together for 13.87% of fatalities. The first five rows of Table 4 describe the location where the fatality occurred. “Camping” indicates that the victim dies while camping. “Business” indicates that the fatality occurred at a work place. “Equipment” indicate that the fatality was caused by equipment failure, e.g., water draining pump, although not enough details were provided in Storm Data.
Table 4.
Number of flood fatalities by location/circumstances.
Only 38% of total flood-related fatalities included the time of occurrence in Storm Data. Approximately, half of all fatalities happened during the night (Figure 6). When only focusing on Texas, Sharif et al. [9] found similar results and estimated that 52% of flood fatalities happened at night. Diakakis [16] found a similar proportion in a study of flood fatalities in Greece. Petrucci et al. [29] found higher flood fatalities during nighttime than daytime in some European countries while acknowledging that the time was unknown for most of the fatalities studied. According to Mooney [27], around 75% of flash flood fatalities happened during the evening and darkness hours in the US. As flash flooding was the dominant category among all flood types resulting in flood fatalities, this high fatality percentage at night can be explained by the unexpected nature and rapid development of flash floods and the limited perceptive range in the dark.
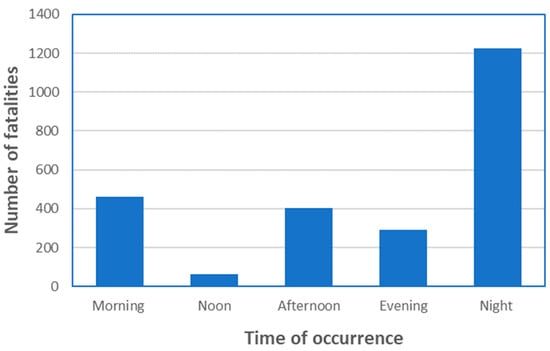
Figure 6.
Number of flood fatalities by time of occurrence in the contiguous US (1959–2019).
4.6. Flood Fatalities by Age and Gender
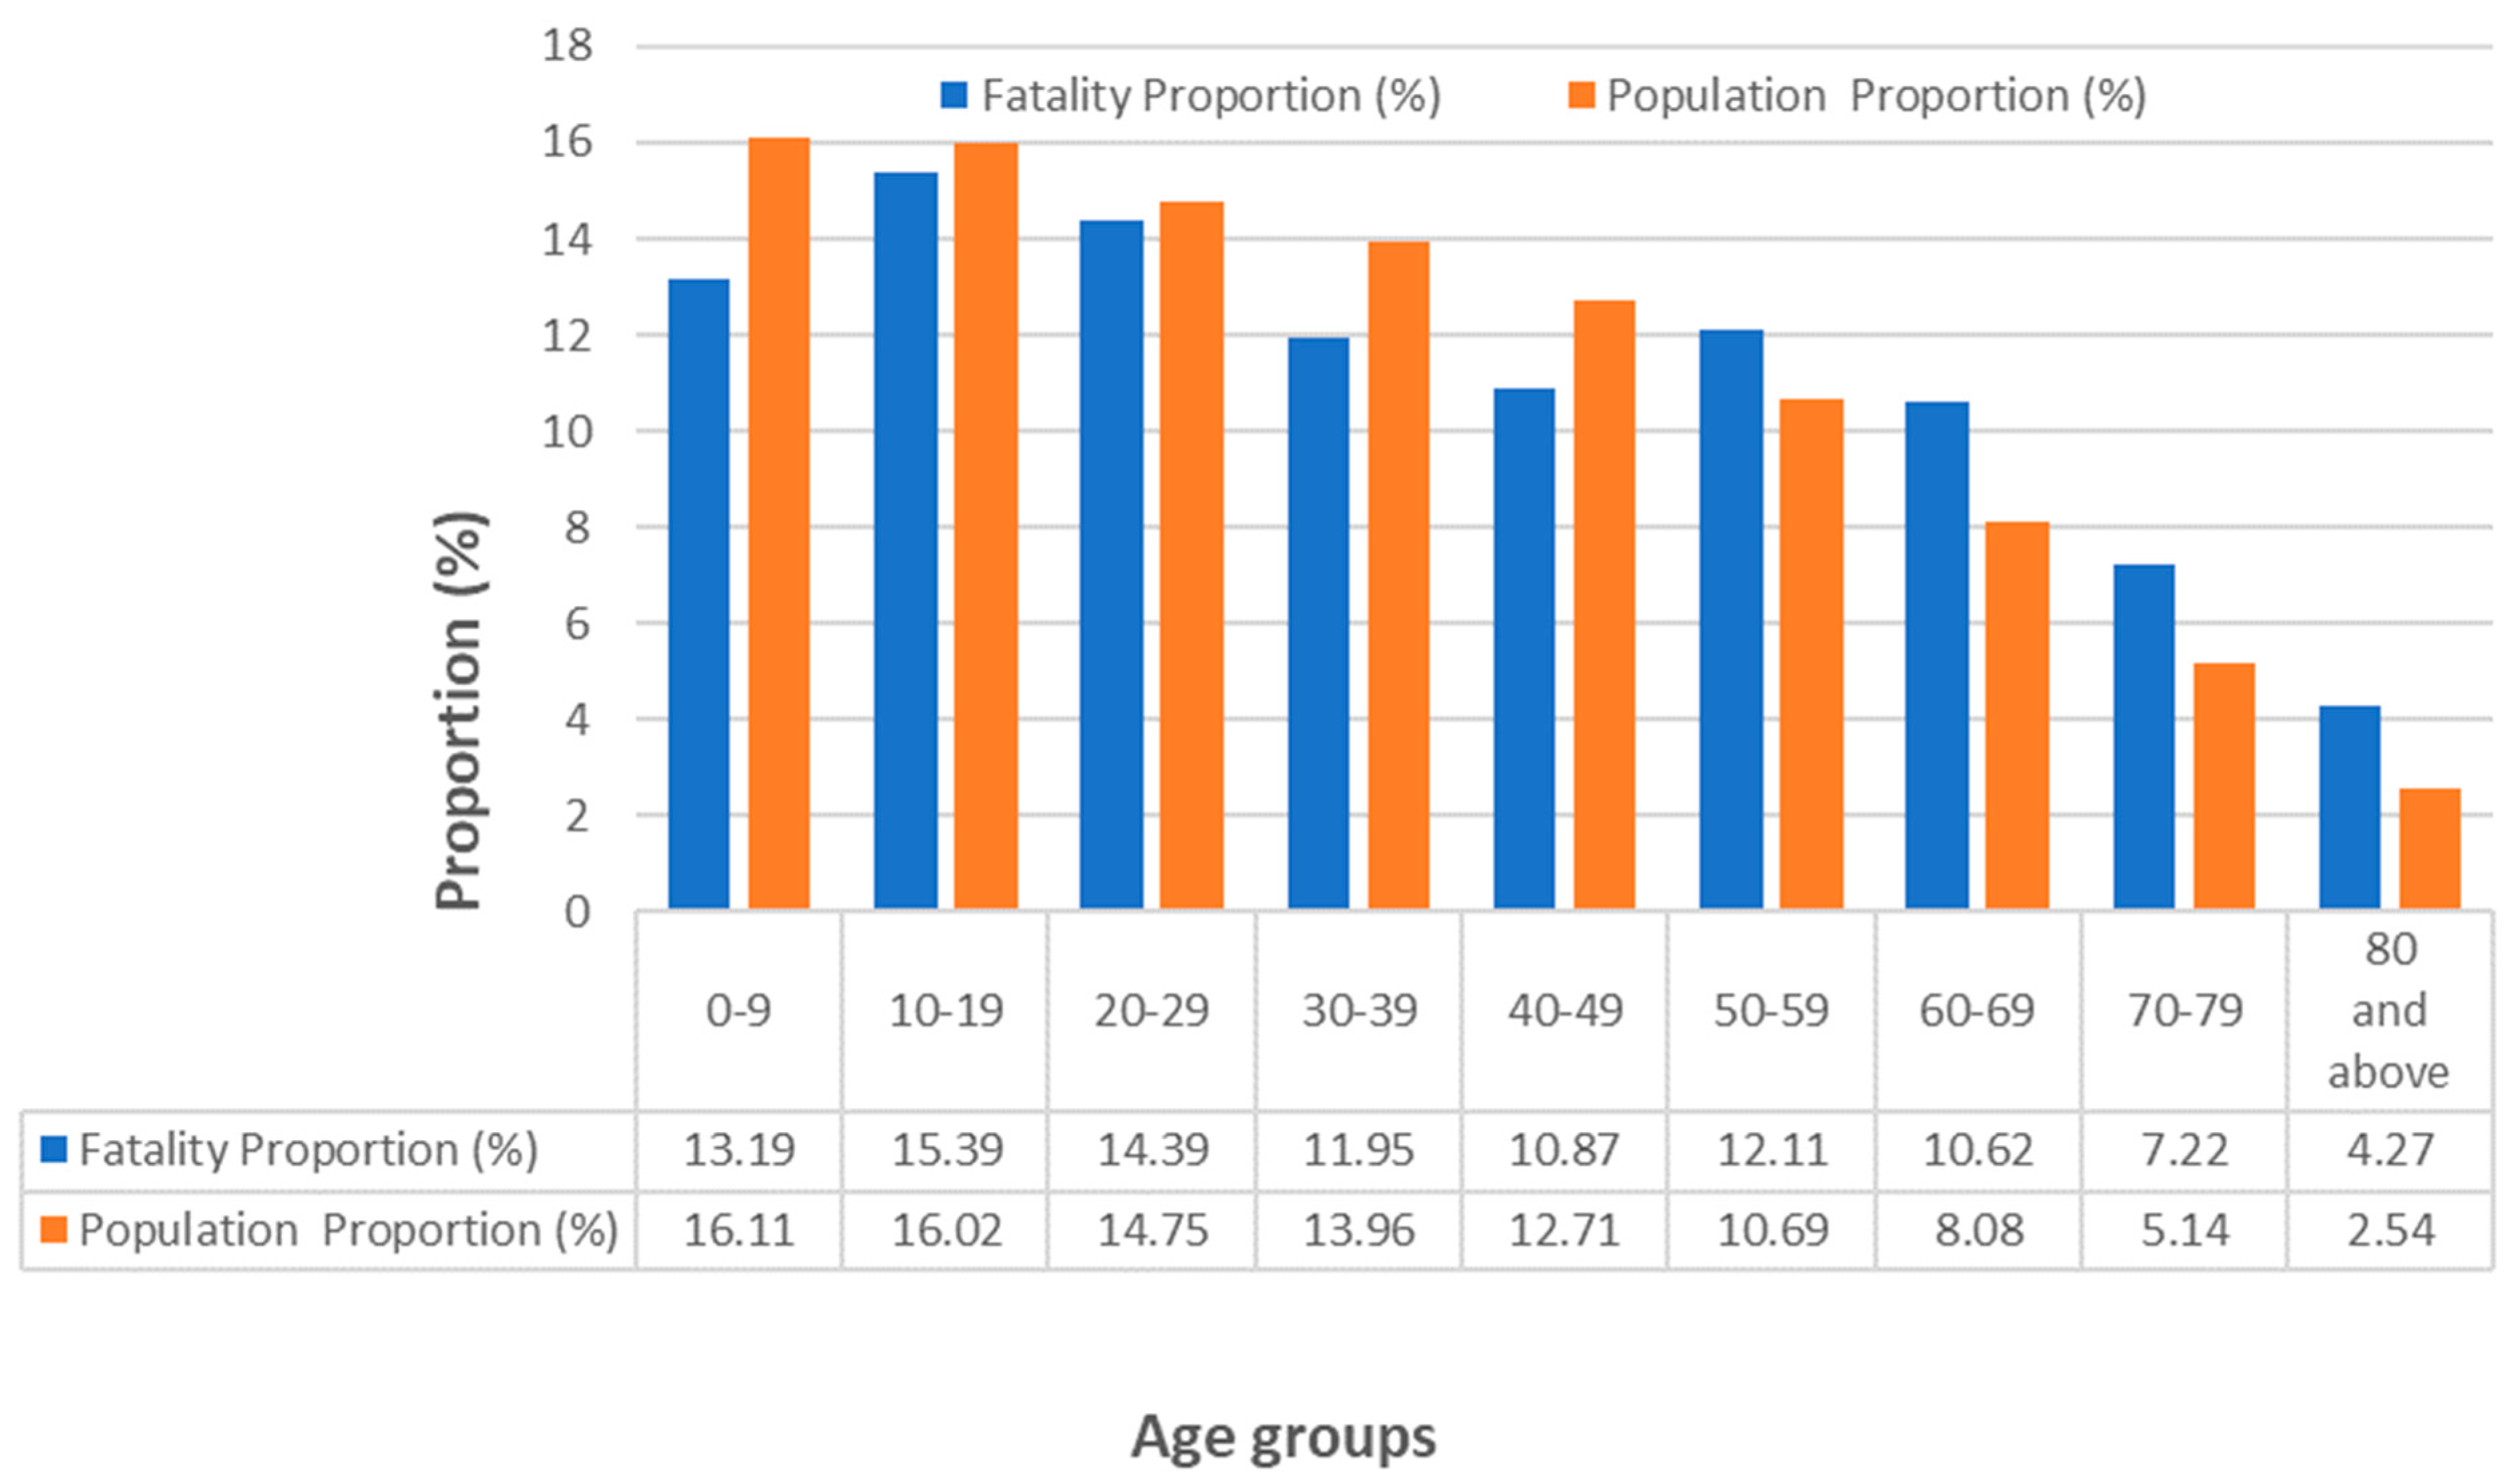
A total of 37 percent of total flood fatalities are recorded with the victim’s age in Storm Data. These fatalities are categorized into different age groups. The p-value of a one-sample chi-square test applied on age groups was less than 0.01 indicating that the distribution of flood fatalities by age group is not random. The age groups of 10–19, 20–29, and 0–9 were the top three age groups, respectively in terms of flood fatalities (Figure 7). The fatalities in these three age groups accounted for 43 percent of total fatalities with age information. The percentage of population in different age groups was obtained from the average of US population percentages in different age groups in 1960, 1970, 1980, 1990, 2000, and 2010. In addition to the young (under 30), the age groups of 50 and above had the fatality percentage exceeding the population percentage in the corresponding age group, indicating that people in these age groups are more vulnerable to flood hazard. Ashley and Ashley [10] reported that people in the age groups 10–19, 20–29, and 60 and above were more vulnerable to flooding during the period of 1959–2005. The large percentage of flood fatalities in the age group of under 29 and above 50 may indicate that the elderly are less able to escape from floodwater and young people are more likely to take risks [30]. To verify the age-related vulnerability to flood hazard, the fatality data had been standardized by multiplying fatality numbers in each age group and the corresponding percentage of population in each age group [9]. Age groups of 10–19, 20–29, and 0–9 were the top three age groups with the most age-adjusted flood fatalities among the nine age groups shown in Table 5.
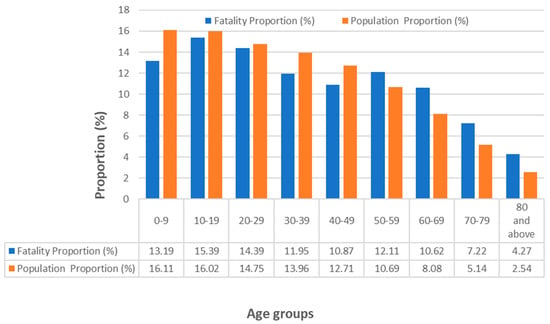
Figure 7.
Distribution of flood fatalities by age group and average proportion of population in each age group in the contiguous US (1959–2019).
Table 5.
Flood fatalities by age group. The third column shows age-adjusted fatalities after multiplying by the proportion of population for each age group.
Only about 42 percent of total flood fatalities were recorded with gender information in Storm Data. Males are about 1.6 times more likely to be killed by a flood than females, and represent 62% of total flood fatalities with known gender information (Table 6). Males are overrepresented in all states with 10 or more fatalities with known gender. Jonkman and Kelman [46] reported a higher percentage of 70% for males. Ashley and Ashley [10] reported similar results. Males in flood are more likely to drive through flood water, more likely to be working as staff of emergency and supporting services, and more likely to exhibit other risk-taking behaviors. The observation that males outnumbered females in flood fatalities can be attributed to many factors including the high involvement of males in driving, the high proportion of males working in emergency services and utility maintenance, males’ risk-taking behavior, and more males swimming and pursuing water sports [32,48,49].
Table 6.
Flood fatalities by gender.
5. Summary and Conclusions
This paper examined flood-related fatality data in the contiguous US from 1959 through 2019. The study extends the period of analysis of US flood fatalities reported in previous studies, computes the fatality rate for each state, and provides more details on the situational conditions, demographics, and spatial and temporal characteristics of flood fatalities. A total of 6478 flood fatalities occurred during the study period. The last two decades witnessed major flood events that changed the ranking of the top states compared to previous studies except for Texas (1069) with significantly higher flood-related fatalities than any other state. Rankings of counties within some states changed as well. The analysis included the temporal patterns of flood fatalities, the circumstances leading to the fatalities, the demographics of the victims, and the types of fatal flooding. The spatial analysis identified clusters of flood fatalities related to local conditions (e.g., climate or terrain) such as the Flash Flood Alley in Texas and the Gulf Coast region.
The analysis indicated that most flood fatalities could be prevented as most fatalities were related to voluntary contact with floodwaters. This conclusion is supported by other research. For example, Diakakis [16] found that more than 74% of flood fatalities in Greece resulted from victims moving into or approaching floodwaters from an initial position of safety and Coates [30] reported that only about 31% of flood victims in Australia died while waiting in their homes or camps, some unaware of the flood. Similar to almost all flood studies conducted in the US, this comprehensive analysis showed that the majority of fatalities were vehicle-related events and males are much more likely to be killed in a flood than females. Alderman et al. [50] cited several studies that demonstrated the overrepresentation of males and older individuals among flood victims, especially in medium- and high-income countries.
The results will help identify the risk factors associated with different types of flooding and the vulnerability of exposed communities. However, more detailed analysis is needed to identify individual vulnerability factors of exposed communities as conditions may be very different for different regions. Nonetheless, the study helps identify states with more conditions that lead to flood fatalities and detailed studies at a higher level of detail are necessary. Understanding the influence of local conditions and flooding risk factors is the first step to reducing flood fatalities. Flooding risk in urban areas will increase as the US continues to urbanize, limiting natural runoff mitigation mechanisms. Scientific and engineering knowledge, modeling tools, and data can be used not only to better characterize the frequency of severe storms, accurately delineate flood plains, and predict flood impacts, but also to plan quick responses when a major storm is imminent. Hydrometeorological forecasting needs to be improved. Policy makers, city planners, and engineers need to take proactive measures to protect urban communities against these impacts.
The spatial analysis of flood fatalities at multiple scales is necessary because most mitigation efforts are better to implement at the community level through various strategies, such as flood-proofing buildings [51] and acquiring open spaces, conserving wetlands, land use management, and continuous monitoring [52]. NWS offices can coordinate with local agencies in regards to flood risk communication and response strategies and evacuation training [53]. States can coordinate with the federal government regarding insurance programs and tax incentives for flood risk [54]. Moreover, one of the most common problems with flash floods is the unexpected overbank flow, which leads to city and settlement flooding. In many cases, the overbank flow is the result of human intervention in streams’ hydraulic characteristics (reduction of stream cross section) due to intense and unplanned urban sprawl [11,55,56].
Non-stationary methods of flood frequency analysis [57] can help communities and policy makers understand the rising flood risk and the need for investment in robust flood protection measures. Identifying and prioritizing runoff mitigation projects can provide some solutions to flooding problems (e.g., [58]). However, structural solutions are not enough. The information provided in this study can help tailor educational campaigns to specific vulnerable groups. In addition to education campaigns typically organized by local authorities and NWS offices, transportation agencies, insurance companies, and auto manufacturers can help educate the public about the risks of driving into flood water. Most vulnerable individuals, such as drivers and certain age groups, must be the main target of awareness campaigns. However, there remains the question: Will improvement of flood warning technology and education programs necessarily lead to a significant change in behavior?
A timely issue that should be addressed by researchers is the compounding of disasters. Compound flooding (pluvial, fluvial, and storm surge) can increase the human toll of flooding events. However, flooding can be combined with other life-threatening occurrences such as power loss and interruptions of health and emergency services. The COVID-19 pandemic is the latest example of compounding disasters due to its significant impact on medical and emergency services and the lockdown requirements that can greatly restrict mass evacuation and mass sheltering that might become necessary during a flooding event. Extreme weather warnings may need to consider these and other impacts of a concurrent pandemic and direct individuals on what to do during a compound extreme event. Emergency officials should also be aware of and prepared for compound disasters. Disaster kits should now also include supplies recommended by the US Centers for Disease Control and Prevention to help prevent the spread of COVID-19, such as facemasks, gloves, and hand sanitizer.
Finally, there is evidence that major tropical storms have been increasing in the last four decades (e.g., [59]), which underscores the need for prone communities to adapt to the shifting climate and weather realities. Flood zones are being expanded, placing financial burden on local governments and causing some residents to leave the affected localities altogether, resulting in loss of taxes and/or loss of eligibility for state and federal assistance due to the decrease in population. Moreover, repeated disasters prompt some relatively wealthier people to migrate, leaving citizens with lower capacity to adapt behind (e.g., [60,61]). Multidisciplinary research is needed to better understand this problem and develop appropriate policies and interventions.
Author Contributions
H.O.S. guided this research, contributed significantly to preparing the manuscript for publication, and developed the research methodology. Z.H. processed the data and conducted the analysis. Z.H. prepared the first draft. H.O.S. performed the final overall proofreading of the manuscript. All authors have read and agreed to the published version of the manuscript.
Funding
The first author was funded through a scholarship from the Chinese Scholarship Council (no. 201606300024).
Institutional Review Board Statement
Not applicable.
Informed Consent Statement
Not applicable.
Data Availability Statement
Publicly available datasets were analyzed in this study. The data can be found here: https://www.ncdc.noaa.gov/stormevents// (accessed on 18 June 2021).
Conflicts of Interest
The authors declare no conflict of interest.
References
- Dittman, R.H. Annual Flood Death Statistics Per State Per Capita for the United States and Puerto Rico during the Period 1959–1991; NWS SR-153; NOAA Tech. Memo: US, Northeast Region 1994. p. 11. Available online: https://repository.library.noaa.gov/view/noaa/7259 (accessed on 18 June 2021).
- Barredo, J.I. Major flood disasters in Europe: 1950–2005. Nat. Hazards 2007, 42, 125–148. [Google Scholar] [CrossRef]
- Barredo, J.I. Normalised flood losses in Europe: 1970–2006. Nat. Hazards Earth Syst. Sci. 2009, 9, 97–104. [Google Scholar] [CrossRef]
- Hall, J.; Arheimer, B.; Borga, M.; Brázdil, R.; Claps, P.; Kiss, A.; Kjeldsen, T.R.; Kriaučiūnienė, J.; Kundzewicz, Z.; Lang, M.; et al. Understanding flood regime changes in Europe: A state-of-the-art assessment. Hydrol. Earth Syst. Sci. 2014, 18, 2735–2772. [Google Scholar] [CrossRef] [Green Version]
- EM-DAT. The Emergency Events Database; The Emergency Events Database-Université Catholique de Louvain (UCL)-CRED: Brussels, Belgium, 2021; Available online: www.emdat.be (accessed on 4 June 2021).
- Jonkman, S.N. Global Perspectives on Loss of Human Life Caused by Floods. Nat. Hazards 2005, 34, 151–175. [Google Scholar] [CrossRef]
- Smith, K.; Ward, R. Floods: Physical Processes and Human Impacts; Wiley: Chichester, UK, 1998; ISBN 978-0-471-95248-0. [Google Scholar]
- French, J.G.; Holt, K.W. Floods. In The Public Health Consequences of Disasters; Gregg, M.B., Ed.; US Department of Health and Human Services, Public Health Service, CDC: Atlanta, GA, USA, 1989; pp. 69–78. [Google Scholar]
- Sharif, H.; Jackson, T.L.; Hossain, M.; Zane, D. Analysis of Flood Fatalities in Texas. Nat. Hazards Rev. 2015, 16, 04014016. [Google Scholar] [CrossRef]
- Ashley, S.T.; Ashley, W.S. Flood Fatalities in the United States. J. Appl. Meteorol. Clim. 2008, 47, 805–818. [Google Scholar] [CrossRef]
- Kastridis, A.; Kirkenidis, C.; Sapountzis, M. An integrated approach of flash flood analysis in ungauged Mediterranean watersheds using post-flood surveys and unmanned aerial vehicles. Hydrol. Process. 2020, 34, 4920–4939. [Google Scholar] [CrossRef]
- Diakakis, M.; Andreadakis, E.; Nikolopoulos, E.; Spyrou, N.; Gogou, M.; Deligiannakis, G.; Katsetsiadou, N.; Antoniadis, Z.; Melaki, M.; Georgakopoulos, A.; et al. An integrated approach of ground and aerial observations in flash flood disaster investigations. The case of the 2017 Mandra flash flood in Greece. Int. J. Disaster Risk Reduct. 2019, 33, 290–309. [Google Scholar] [CrossRef]
- Kastridis, A.; Stathis, D. Evaluation of Hydrological and Hydraulic Models Applied in Typical Mediterranean Ungauged Watersheds Using Post-Flash-Flood Measurements. Hydrology 2020, 7, 12. [Google Scholar] [CrossRef] [Green Version]
- Terti, G.; Ruin, I.; Anquetin, S.; Gourley, J.J. A Situation-Based Analysis of Flash Flood Fatalities in the United States. Bull. Am. Meteorol. Soc. 2017, 98, 333–345. [Google Scholar] [CrossRef]
- Hamilton, K.; Peden, A.E.; Pearson, M.; Hagger, M.S. Stop there’s water on the road! Identifying key beliefs guiding people’s willingness to drive through flooded waterways. Saf. Sci. 2016, 89, 308–314. [Google Scholar] [CrossRef] [Green Version]
- Diakakis, M. Types of behavior of flood victims around floodwaters. Correlation with situational and demographic factors. Sustainability 2020, 12, 4409. [Google Scholar] [CrossRef]
- Vinet, F.; Lumbroso, D.; Defossez, S.; Boissier, L. A comparative analysis of the loss of life during two recent floods in France: The sea surge caused by the storm Xynthia and the flash flood in Var. Nat. Hazards 2011, 61, 1179–1201. [Google Scholar] [CrossRef]
- Diakakis, M.; Deligiannakis, G.; Katsetsiadou, K.; Lekkas, E. Hurricane Sandy mortality in the Caribbean and continental North America. Disaster Prev. Manag. Int. J. 2015, 24, 132–148. [Google Scholar] [CrossRef]
- NWS (National Weather Service). Weather Related Fatality and Injury Statistics. Available online: https://www.weather.gov/hazstat/# (accessed on 4 June 2021).
- Borden, K.A.; Cutter, S.L. Spatial patterns of natural hazards mortality in the United States. Int. J. Health Geogr. 2008, 7, 64. [Google Scholar] [CrossRef] [Green Version]
- Kunkel, K.; Pielke, R.A.; Changnon, S.A. Temporal Fluctuations in Weather and Climate Extremes That Cause Economic and Human Health Impacts: A Review. Bull. Am. Meteorol. Soc. 1999, 80, 1077–1098. [Google Scholar] [CrossRef] [Green Version]
- Rappaport, E.N. Loss of Life in the United States Associated with Recent Atlantic Tropical Cyclones. Bull. Am. Meteorol. Soc. 2000, 81, 2065–2073. [Google Scholar] [CrossRef] [Green Version]
- French, J.; Ing, R.; Von Allmen, S.; Wood, R. Mortality from flash floods: A review of national weather service reports, 1969–1981. Public Health Rep. 1983, 98, 584–588. [Google Scholar]
- Furl, C.; Sharif, H.; Zeitler, J.W.; El Hassan, A.; Joseph, J. Hydrometeorology of the catastrophic Blanco river flood in South Texas, May 2015. J. Hydrol. Reg. Stud. 2018, 15, 90–104. [Google Scholar] [CrossRef]
- Gaffin, D.M.; Hotz, D.G. A Precipitation and Flood Climatology with Synoptic Features of Heavy Rainfall across the Southern Appalachian Mountains. Available online: http://www.srh.noaa.gov/mrx/?n=heavyrainclimo (accessed on 4 June 2021).
- NWS (National Weather Service). Storm Data Operation Manual. National weather Service Instruction 10–160. Available online: http://www.weather.gov/directives/sym/pd01016005curr.pdf (accessed on 4 June 2021).
- Mooney, L.E. Applications and implications of fatality statistics to the flash flood problemsin. In Proceedings of the 5th Conference on Hydrometeorology, Tulsa, OK, USA, 17–19 October 1983; pp. 127–129. [Google Scholar]
- US Census Bureau. The United States Census Bureau. 2021. Available online: https://www.census.gov/topics/population/data.html (accessed on 4 June 2021).
- Petrucci, O.; Papagiannaki, K.; Aceto, L.; Boissier, L.; Kotroni, V.; Grimalt, M.; Llasat, M.C.; Llasat-Botija, M.; Rosselló, J.; Pasqua, A.A.; et al. MEFF: The database of MEditerranean Flood Fatalities (1980 to 2015). J. Flood Risk Manag. 2018, 12, e12461. [Google Scholar] [CrossRef] [Green Version]
- Coates, L. Flood Fatalities in Australia, 1788–1996. Aust. Geogr. 1999, 30, 391–408. [Google Scholar] [CrossRef]
- Jackson, T.L.; Sharif, H.O. Rainfall impacts on traffic safety: Rain-related fatal crashes in Texas. Geomat. Nat. Hazards Risk 2014, 7, 843–860. [Google Scholar] [CrossRef] [Green Version]
- Kellar, D.M.M.; Schmidlin, T.W. Vehicle-related flood deaths in the United States, 1995–2005: Vehicle-related flood deaths in United States. J. Flood Risk Manag. 2012, 5, 153–163. [Google Scholar] [CrossRef]
- Douglas, M.W.; Maddox, R.A.; Howard, K.; Reyes, S. The Mexican Monsoon. J. Clim. 1993, 6, 1665–1677. [Google Scholar] [CrossRef]
- Boyd, E.C. Estimating and Mapping the Direct Flood Fatality Rate for Flooding in Greater New Orleans Due To Hurricane Katrina. Risk Hazards Crisis Public Policy 2010, 1, 87–110. [Google Scholar] [CrossRef]
- Brunkard, J.; Namulanda, G.; Ratard, R. Hurricane Katrina Deaths, Louisiana, 2005. Disaster Med. Public Health Prep. 2008, 2, 215–223. [Google Scholar] [CrossRef] [PubMed] [Green Version]
- Jonkman, S.N.; Maaskant, B.; Boyd, E.; Levitan, M.L. Loss of Life Caused by the Flooding of New Orleans After Hurricane Katrina: Analysis of the Relationship Between Flood Characteristics and Mortality. Risk Anal. 2009, 29, 676–698. [Google Scholar] [CrossRef] [PubMed]
- Knabb, R.D.; Rhome, J.R.; Brown, D.P. Tropical Cyclone Report: Hurricane Katrina, 23–30 August 2005; National Hurricane Center: Miami, FL, USA, 2005. Available online: https://www.nhc.noaa.gov/data/tcr/AL122005_Katrina.pdf (accessed on 4 June 2021).
- Reid, J. Summary of Floods in the United States during 1969; Water-Supply Paper 2030; Geological Survey 1975; pp. 143–147. Available online: https://pubs.usgs.gov/wsp/2030/report.pdf (accessed on 4 June 2021).
- Carter, J.M.; Williamson, J.E.; Teller, R.W. The 1972 Black Hills-Rapid City Flood Revisited; Fact Sheet FS-037-02; Geological Survey; 2002; 6p. Available online: http://pubs.usgs.gov/fs/fs-037-02/ (accessed on 4 June 2021).
- Gruntfest, E.C. What People Did During the Big Thompson Flood; Working Paper; Natural Hazards Research and Applications Information Center: Boulder, CO, USA, 1977; 62p. [Google Scholar]
- Blake, E.S.; Landsea, C.W.; Gibney, E.J. The Deadliest, Costliest, and Most Intense United States Tropical Cyclones from 1851 to 2010; United States National Oceanic and Atmospheric Administration’s National Weather Service; NOAA Technical Memorandum NWS NHC-6. Available online: https://www.nhc.noaa.gov/pdf/nws-nhc-6.pdf (accessed on 4 June 2021).
- Brooks, H.E.; Stensrud, D.J. Climatology of Heavy Rain Events in the United States from Hourly Precipitation Observations. Mon. Weather. Rev. 2000, 128, 1194–1201. [Google Scholar] [CrossRef] [Green Version]
- Ashley, W.S.; Mote, T.; Dixon, P.G.; Trotter, S.L.; Powell, E.J.; Durkee, J.D.; Grundstein, A.J. Distribution of Mesoscale Convective Complex Rainfall in the United States. Mon. Weather. Rev. 2003, 131, 3003–3017. [Google Scholar] [CrossRef]
- Changnon, S.A. Thunderstorm Rainfall in the Conterminous United States. Bull. Am. Meteorol. Soc. 2001, 82, 1925–1940. [Google Scholar] [CrossRef] [Green Version]
- Zevin, S.F. Steps toward an Integrated Approach to Hydrometeorological Forecasting Services*. Bull. Am. Meteorol. Soc. 1994, 75, 1267–1276. [Google Scholar] [CrossRef] [Green Version]
- Jonkman, S.N.; Kelman, I. An Analysis of the Causes and Circumstances of Flood Disaster Deaths. Disasters 2005, 29, 75–97. [Google Scholar] [CrossRef]
- Morbidity and Mortality Weekly (MMWR). Flood-Related Mortality—Georgia, 4–14 July 1994 (43(29)); MMWR Report; Centers for Disease Control and Prevention: Atlanta, GA, USA, 1994; pp. 526–530. Available online: https://www.cdc.gov/mmwr/preview/mmwrhtml/00032058.htm (accessed on 4 January 2021).
- Becker, J.S.; Taylor, H.L.; Doody, B.J.; Wright, K.C.; Gruntfest, E.; Webber, D.A. Review of People’s Behavior in and around Floodwater. Weather Clim. Soc. 2015, 7, 321–332. [Google Scholar] [CrossRef]
- Paul, S.H.; Sharif, H.O.; Crawford, A.M. Fatalities Caused by Hydrometeorological Disasters in Texas. Geosciences 2018, 8, 186. [Google Scholar] [CrossRef] [Green Version]
- Alderman, K.; Turner, L.; Tong, S. Floods and human health: A systematic review. Environ. Int. 2012, 47, 37–47. [Google Scholar] [CrossRef] [PubMed] [Green Version]
- Veerbeek, W.; Ashley, R.M.; Zevenbergen, C.; Rijke, J.; Gersonius, B. Building adaptive capacity for flood proofing in urban areas through synergistic interventions. In Building the Water Sensitive Community, Final Program and Abstract Book, Proceedings of the WSUD 2012—7th International Conference on Water Sensitive Urban Design, Melbourne, Australia, 21–23 Febuary 2012; Engineers Australia: Barton, Australia, 2012; ISBN 9780858258952. [Google Scholar]
- Brody, S.D.; Highfield, W.E.; Blessing, R.; Makino, T.; Shepard, C.C. Evaluating the effects of open space configurations in reducing flood damage along the Gulf of Mexico coast. Landsc. Urban Plan. 2017, 167, 225–231. [Google Scholar] [CrossRef]
- Goniewicz, K.; Burkle, F.M. Analysis of the Potential of IT System Support in Early Warning Systems: Mitigating Flood Risk in Poland. Prehospital Disaster Med. 2019, 34, 563–565. [Google Scholar] [CrossRef]
- Ermolieva, T.; Filatova, T.; Obersteiner, M.; De Bruijn, K.; Jeuken, A. Flood catastrophe model for designing optimal flood insurance program: Estimating location-specific premiums in the Netherlands. Risk Anal. 2016, 37, 82–98. [Google Scholar] [CrossRef] [Green Version]
- Faccini, F.; Luino, F.; Paliaga, G.; Sacchini, A.; Turconi, L.; de Jong, C. Role of rainfall intensity and urban sprawl in the 2014 flash flood in Genoa City, Bisagno catchment (Liguria, Italy). Appl. Geogr. 2018, 98, 224–241. [Google Scholar] [CrossRef]
- Jodar-Abellan, A.; Valdes-Abellan, J.; Pla, C.; Gomariz-Castillo, F. Impact of land use changes on flash flood prediction using a sub-daily SWAT model in five Mediterranean ungauged watersheds (SE Spain). Sci. Total Environ. 2019, 657, 1578–1591. [Google Scholar] [CrossRef]
- Rootzén, H.; Katz, R.W. Design Life Level: Quantifying risk in a changing climate. Water Resour. Res. 2013, 49, 5964–5972. [Google Scholar] [CrossRef] [Green Version]
- Tasseff, B.; Bent, R.; Van Hentenryck, P. Optimization of Structural Flood Mitigation Strategies. Water Resour. Res. 2019, 55, 1490–1509. [Google Scholar] [CrossRef]
- Kossin, J.P.; Knapp, K.R.; Olander, T.L.; Velden, C.S. Global increase in major tropical cyclone exceedance probability over the past four decades. Proc. Natl. Acad. Sci. USA 2020, 117, 11975–11980. [Google Scholar] [CrossRef]
- Dewaard, J.; Johnson, J.E.; Whitaker, S.D. Out-migration from and return migration to Puerto Rico after Hurricane Maria: Evidence from the consumer credit panel. Popul. Environ. 2020, 42, 28–42. [Google Scholar] [CrossRef]
- Diakakis, M.; Deligiannakis, G.; Andreadakis, E.; Katsetsiadou, K.N.; Spyrou, N.I.; Gogou, M. How different surrounding environments influence the characteristics of flash flood-mortality: The case of the 2017 extreme flood in Mandra, Greece. J. Flood Risk Manag. 2020, 13, 12613. [Google Scholar] [CrossRef]


Publisher’s Note: MDPI stays neutral with regard to jurisdictional claims in published maps and institutional affiliations. |
© 2021 by the authors. Licensee MDPI, Basel, Switzerland. This article is an open access article distributed under the terms and conditions of the Creative Commons Attribution (CC BY) license (https://creativecommons.org/licenses/by/4.0/).