1. Introduction
In recent decades, there has been a significant increase in the frequency, intensity, and magnitude of flood events in different parts of the world [
1,
2]. In a large floodplain area, avoiding floods occurrence is challenging. Hence, communities within flood-prone areas are adapted to the floods by reducing its impacts [
1]. One of the cost-effective ways to manage and adapt to floods are through a flood risk assessment. This could be conducted by analyzing the probability of flood occurrences (hazard) and its (vulnerability) potential consequences [
3]. The flood depth and extent are the most important variables to assess flood probability [
4,
5]. On the other part, the vulnerability assesses the potential susceptibility consequences of the hazard to the exposed physical elements [
6].
Physical flood vulnerability assessment usually refers to the assessment of damage as a result of flooding to physical structures (human shelter), mainly buildings [
7]. The term damage used here refers to harm to the physical elements-at-risk, as well as the amount of resources needed to restore the affected elements to their original function. Understanding, quantifying, and analyzing the vulnerability of physical properties is essential for designing strategies and adopting an approach for its reduction [
8]. Studies specifically in Malaysia have shown that death from flood-related disasters has decreased; however, the number and value of physical property losses due to flood disasters has significantly increased [
9,
10]. The study of Chan [
11] has shown an increase in the annual expected flood damage (in terms of Malaysian ringgit). In 1982, the average annual value of expected flood damage is less than RM100 million (about
$25 million), which increases to RM915 million (about
$222 million) in 2010. Some of the notable floods in Malaysia are in 1996 with an estimated damage value of RM300 million (
$72 million), 2006 with an estimated damage value of RM1.55 billion (
$376 million), and the flood event of 2014 where about 300,000 people are affected with property and infrastructure losses estimated to about RM2.9 billion (
$704 million) [
12]. The majority of floods recorded in Malaysia are river floods that occur after prolonged precipitation over large basin areas [
9]. Usually, river floods do not occur suddenly, affect vast areas, and can last for some days to weeks [
13]. Currently, the development, management, and implementation of flood mitigation measures in Malaysia are under the Department of Irrigation and Drainage (DID) [
14]. The DID flood mitigation strategy and policy consist mainly of structural measures (e.g., construction of dams and embankments to control flood flows), non-structural measures (i.e., flood risk assessment and mapping, land use planning and flood forecasting, and warning systems to mitigate flood impacts), and flood disaster relief and preparedness machinery [
15]. Nevertheless, the study of Romali [
6] highlighted the necessity of having a balance between structural flood measures and non-structural flood measures in order to have a successful long-term flood risk management strategy.
Furthermore, flood risk is an outcome of interactions between flood hazard, exposure, and the vulnerability of the exposed elements-at-risk. Within the concept of flood risk, hazard refers to the probability of the occurrence of a potentially damaging flood event [
16]. Whether a hazard could lead to harm depend on the exposure and vulnerability of the element-at-risk to the hazard [
17]. Exposure in this concept refers to the presence of elements-at-risk (e.g., people, buildings, services, infrastructure, or other properties) that could be adversely affected [
18]. Vulnerability is the degree of harm expected under certain conditions of exposure, susceptibility, and resilience [
19]. Susceptibility is the likelihood of dangerous events occurring based on local element conditions or as a result of its inherent characteristics’ inability to withstand the hazard impact [
20]. Meanwhile, resilience is the ability of an element-at-risk to anticipate, absorb or cope with, resist, and recover from the impact of a flood hazard [
21]. The popular methods for assessing physical flood vulnerability are vulnerability curve, vulnerability matrices, and the indicator-based method [
22], which are used appropriately in different vulnerability assessment approaches within the phases of the risk cycle [
23]. The indicator-based methods have the strength of allowing significant factors (e.g., building material, construction type, number of floors, level of maintenance, ground floor material) that contribute to flood vulnerability to be considered during the vulnerability assessment [
20]. The method is flexible, easy to use, and able to be understood by decision makers. Unlike the quantitative method usually expressed by the vulnerability curve functions, the indicator-based method does not require a significant amount of field flood damage records and empirical studies that relate between flood hazard intensity and its corresponding building damages [
17,
23]. The primary practice of an indicator-based approach is the use of composite indicators. Vulnerability indicators are defined as variables that are operational representations of a characteristic or quality of the system able to provide information regarding the susceptibility, coping capacity, and resilience of a system to an impact of an albeit ill-defined event linked to a hazard of a natural origin [
23]. Usually, the result of an indicator-based approach is index and indices representing a degree of vulnerability on a scale. An index represents reality using numbers or a ratio derived from a series of observations used as indicators [
24]. To effectively implement an indicator-based approach, the priority weight of importance or vulnerability contribution of indicators and sub-indicators must be specified to create the final index [
25]. There are different techniques for assigning the weight of indicators. Some are statistical models, such as data envelopment analysis (DEA), principal component analysis (PCA), and factor analysis (FA). Some are participatory methods such as conjoint analysis (CA), analytic hierarchy processes (AHP), and budget allocation processes (BAP) [
21,
26]. The participatory approach also allows the use of expert opinion to assign weights of indicators to reflect policy priorities or theoretical factors better. Stakeholders such as experts, citizens, and policymakers can be used to assign weights. Participatory methods are recommended when the basis for a national policy is known and clearly defined [
27].
In 2008, the Malaysian Water Resources Council (MSAN) granted permission to the DID to develop flood risk maps in Malaysia for non-structural flood mitigation solutions [
28]. Since then, flood hazard assessment and maps for most river basins have been completed [
12,
15]. However, flood vulnerability assessment and mapping are not well developed [
14]. Detailed flood vulnerability maps of physical element-at-risk at a micro-scale are still not available. In addition, the development of a quantitative physical flood vulnerability model in Malaysia is always hampered by a lack of and unclear approach to field damage assessment [
12]. Hence, the contribution of this study is to develop a framework for flood vulnerability modeling and mapping in Malaysia using an indicator-based approach. This is important as a starting point for a comprehensive flood risk assessment in Malaysia. This study will help local authority reduce flood vulnerability and risk by introducing suitable building structures that can cope with the flood. This is important since a flood usually is an act of nature, and in this scenario, we have to live with this hazard. Similarly, this study developed an indicator-based physical flood vulnerability in Kota Bharu, which considers local building characteristics, flood intensity, and the surrounding area. Previous studies show that flood intensity has not been considered in the indicator-based modeling [
2,
20]. Specifically, the objectives of this paper are as follows:
To identify significant and suitable indicators for physical flood vulnerability of different buildings structures in an urban settlement of Kota Bharu, Malaysia.
To develop a physical flood vulnerability model of buildings based on the indicator-based approach by assigning the weight of importance for the selected physical flood vulnerability indicators using the AHP approach.
To produce a flood vulnerability map of the individual buildings in Kota Bharu by aggregating the flood vulnerability indicators and their weights into the flood vulnerability index.
3. Result
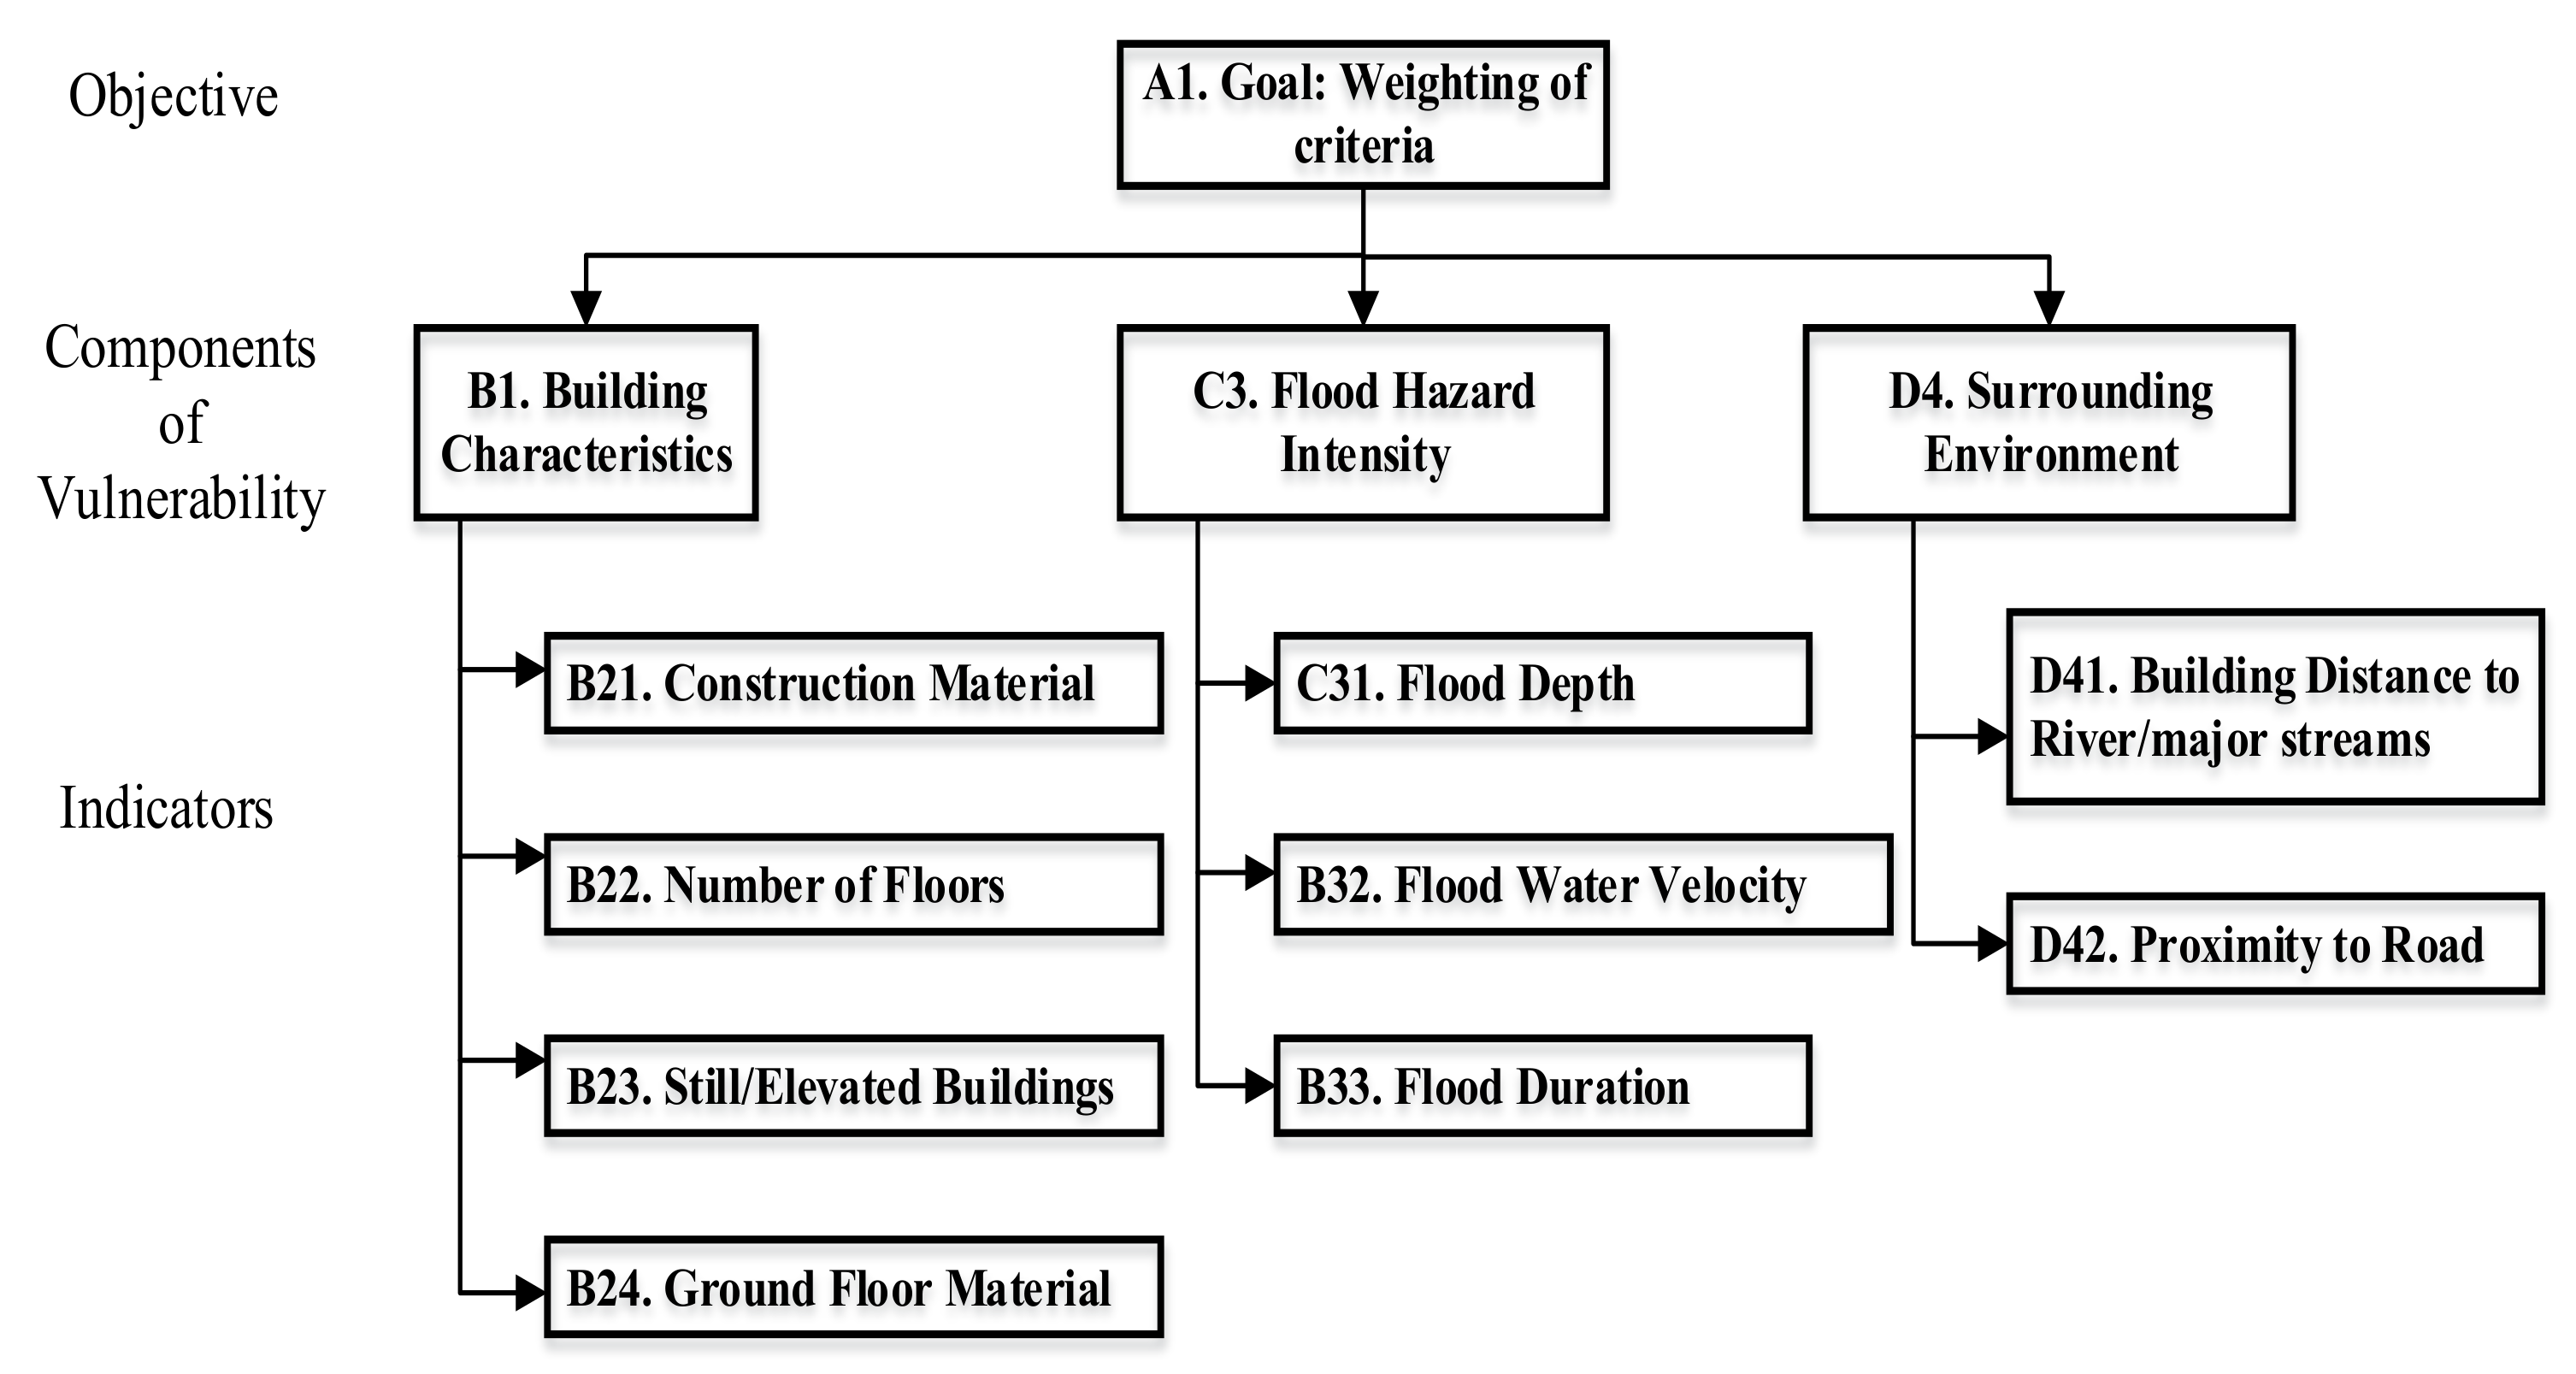
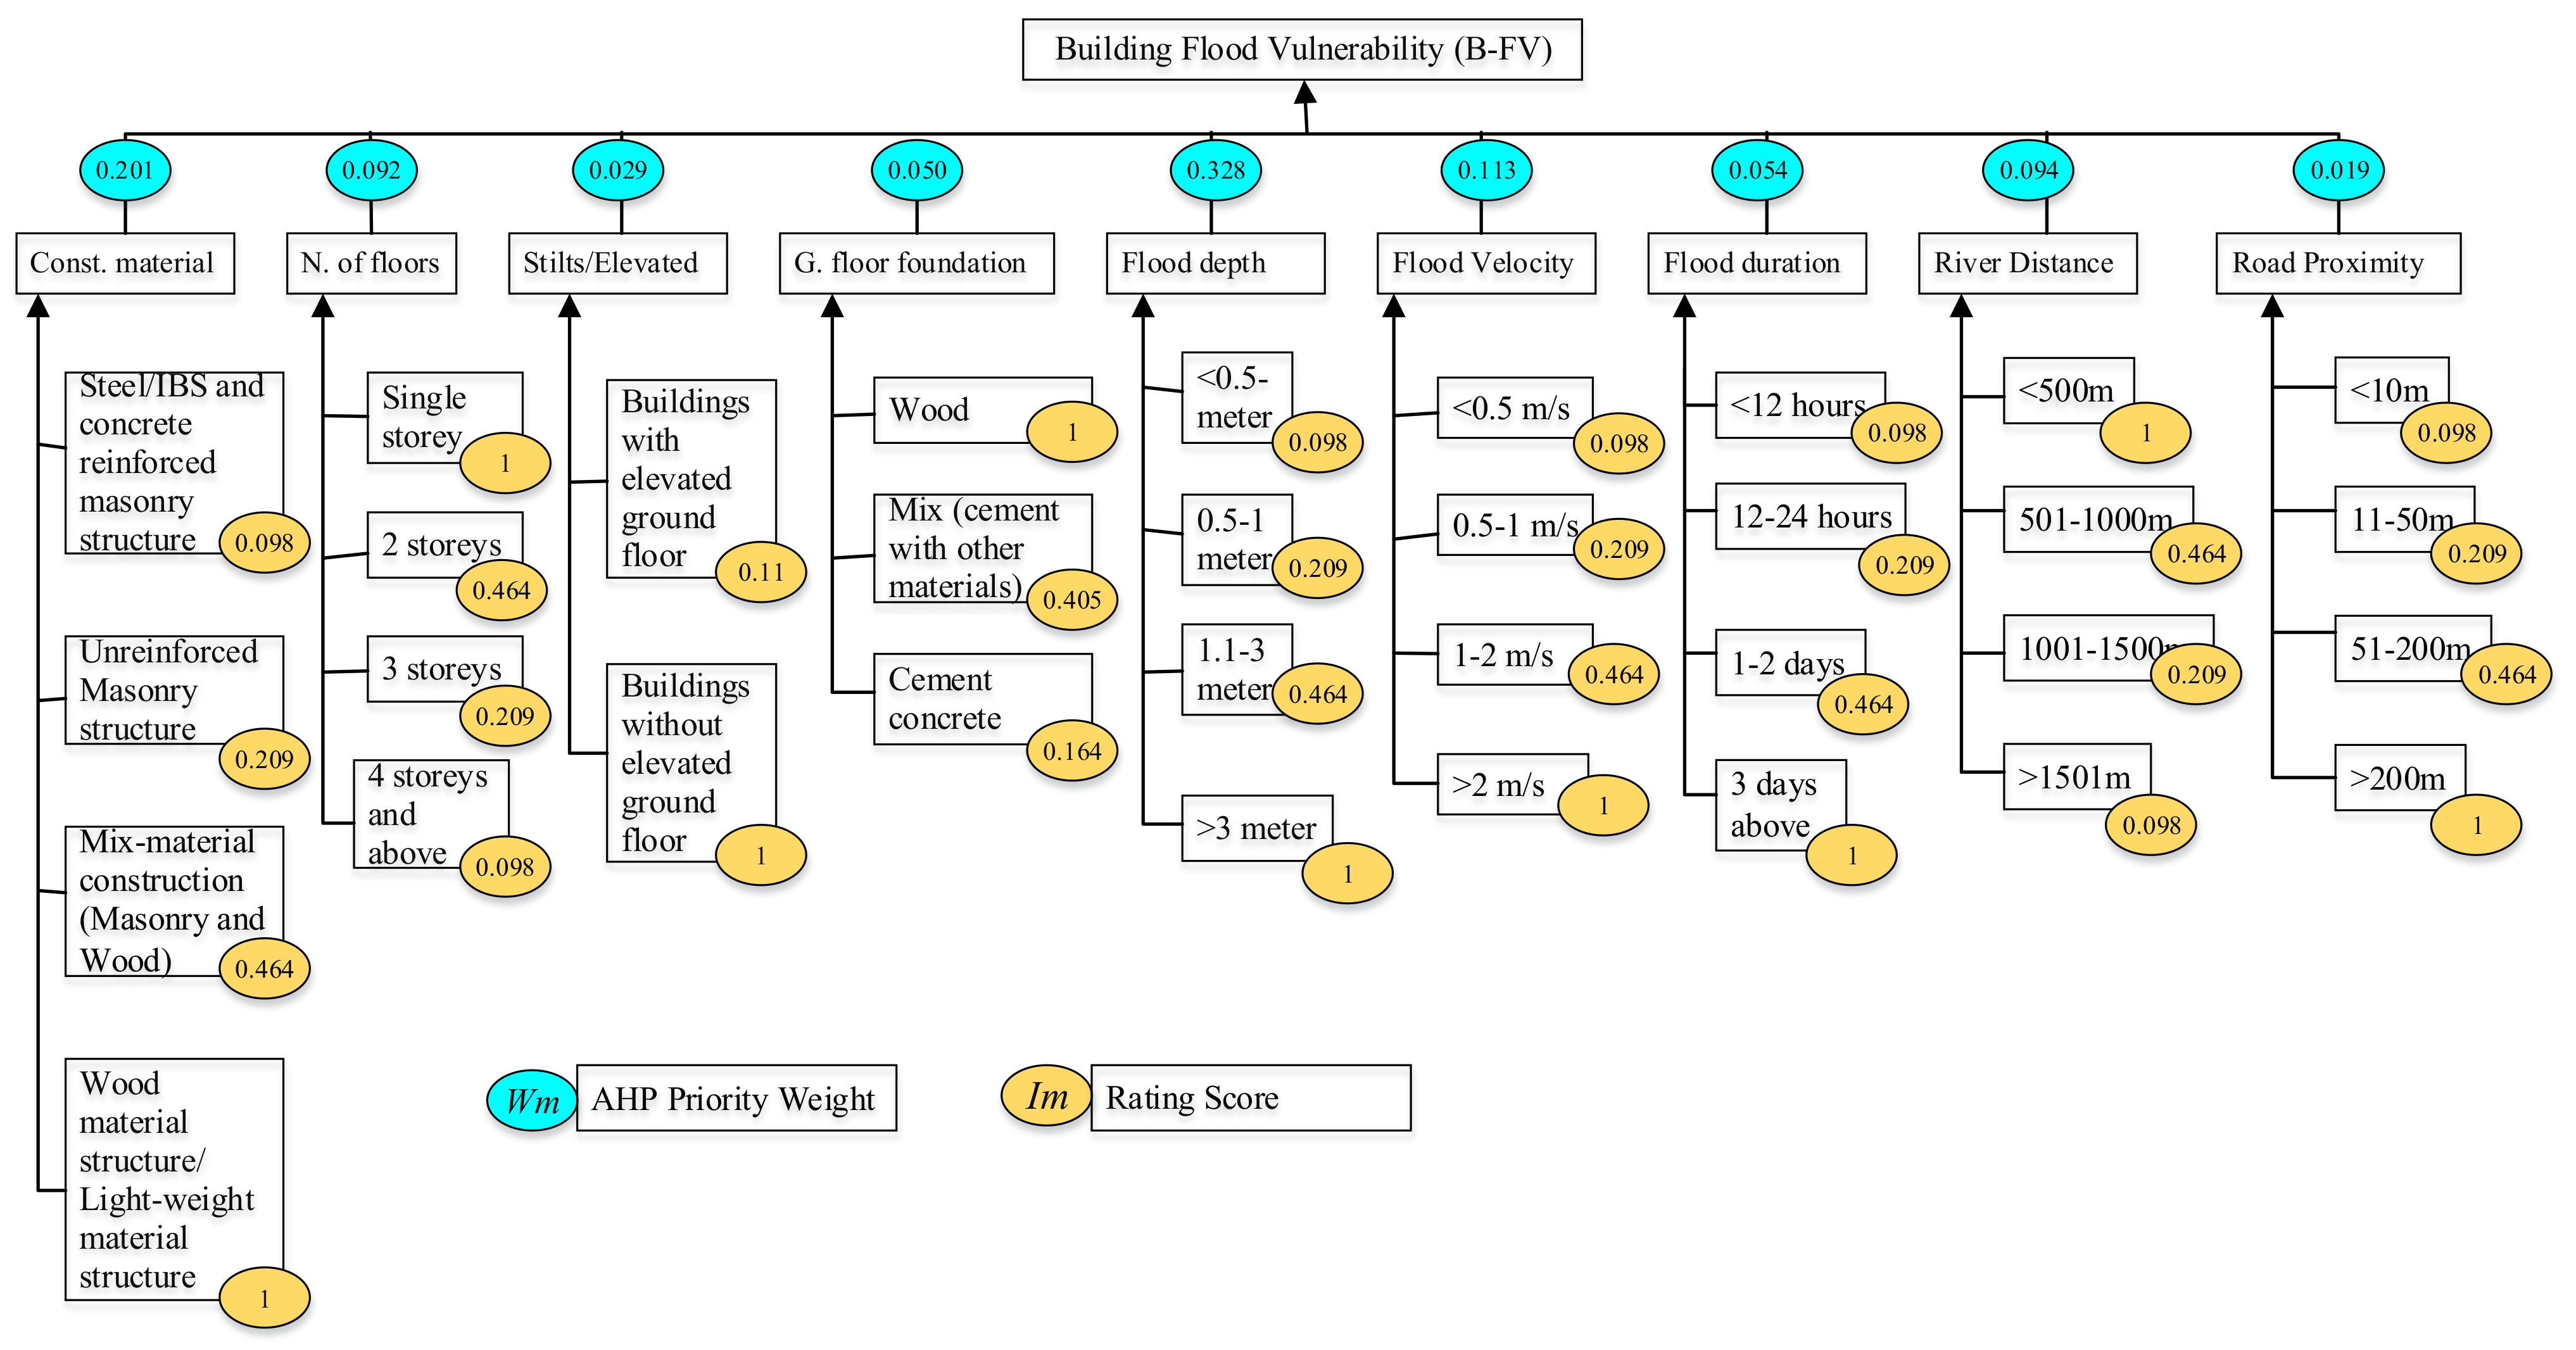
Table 4 shows the priority weights of vulnerability components and indicators as obtained from the pairwise comparison. The table also depicts an ideal priority weight of the indicators’ classes obtained from the AHP rating approach.
Accordingly, flood hazard intensity (I) is considered the most important with the priority weight of 0.52 (52%), which is followed by the building characteristics (C) 0.37 (37%) and lastly the characteristics of the surrounding environment (E) with the priority weight of 0.11 (11%). The total sum of the priority weight is 1.00 (100%), which is divided among the three components based on their pairwise comparison. The weight shows each component contribution in generating flood damage. Furthermore, the local weight highlights indicators relevant within each component, which is driven from the pairwise comparison. The local weight is multiplied by the component’s priority weight to obtain the global weights of indicators. Global weights indicate that ‘flood depth’ (0.328) is the most relevant and vital factor among the nine physical flood vulnerability indicators; it is highest ranked and is followed by ‘construction type and material’ (0.2014) and ‘flood velocity’ (0.139): these are the three most important indicators. The fourth relevant indicator is ‘distance to main streams and river’ (0.094), followed by the ‘number of floors’ (0.092) and ‘flood duration’ (0.054). Others in order of ranking are ‘ground floor foundation material’ (0.050) and ‘stilts/elevated building’ (0.0287). The lowest-ranked vulnerability indicator is ‘proximity to main road’ (0.019).
From the selected list of flood vulnerability indicators, the actual circumstances that determine physical flood vulnerability are site-specific, hazard-dependent, and elements-at-risk dependent. Therefore, the collection of hazard information is necessary to define flood vulnerability indicators that are related to hazard intensity and also to determine the flood inundation extent for the identification of exposed buildings. In this study, flood depth, over-land water velocity, and flood duration are indicators that defined hazard intensity and exposure.
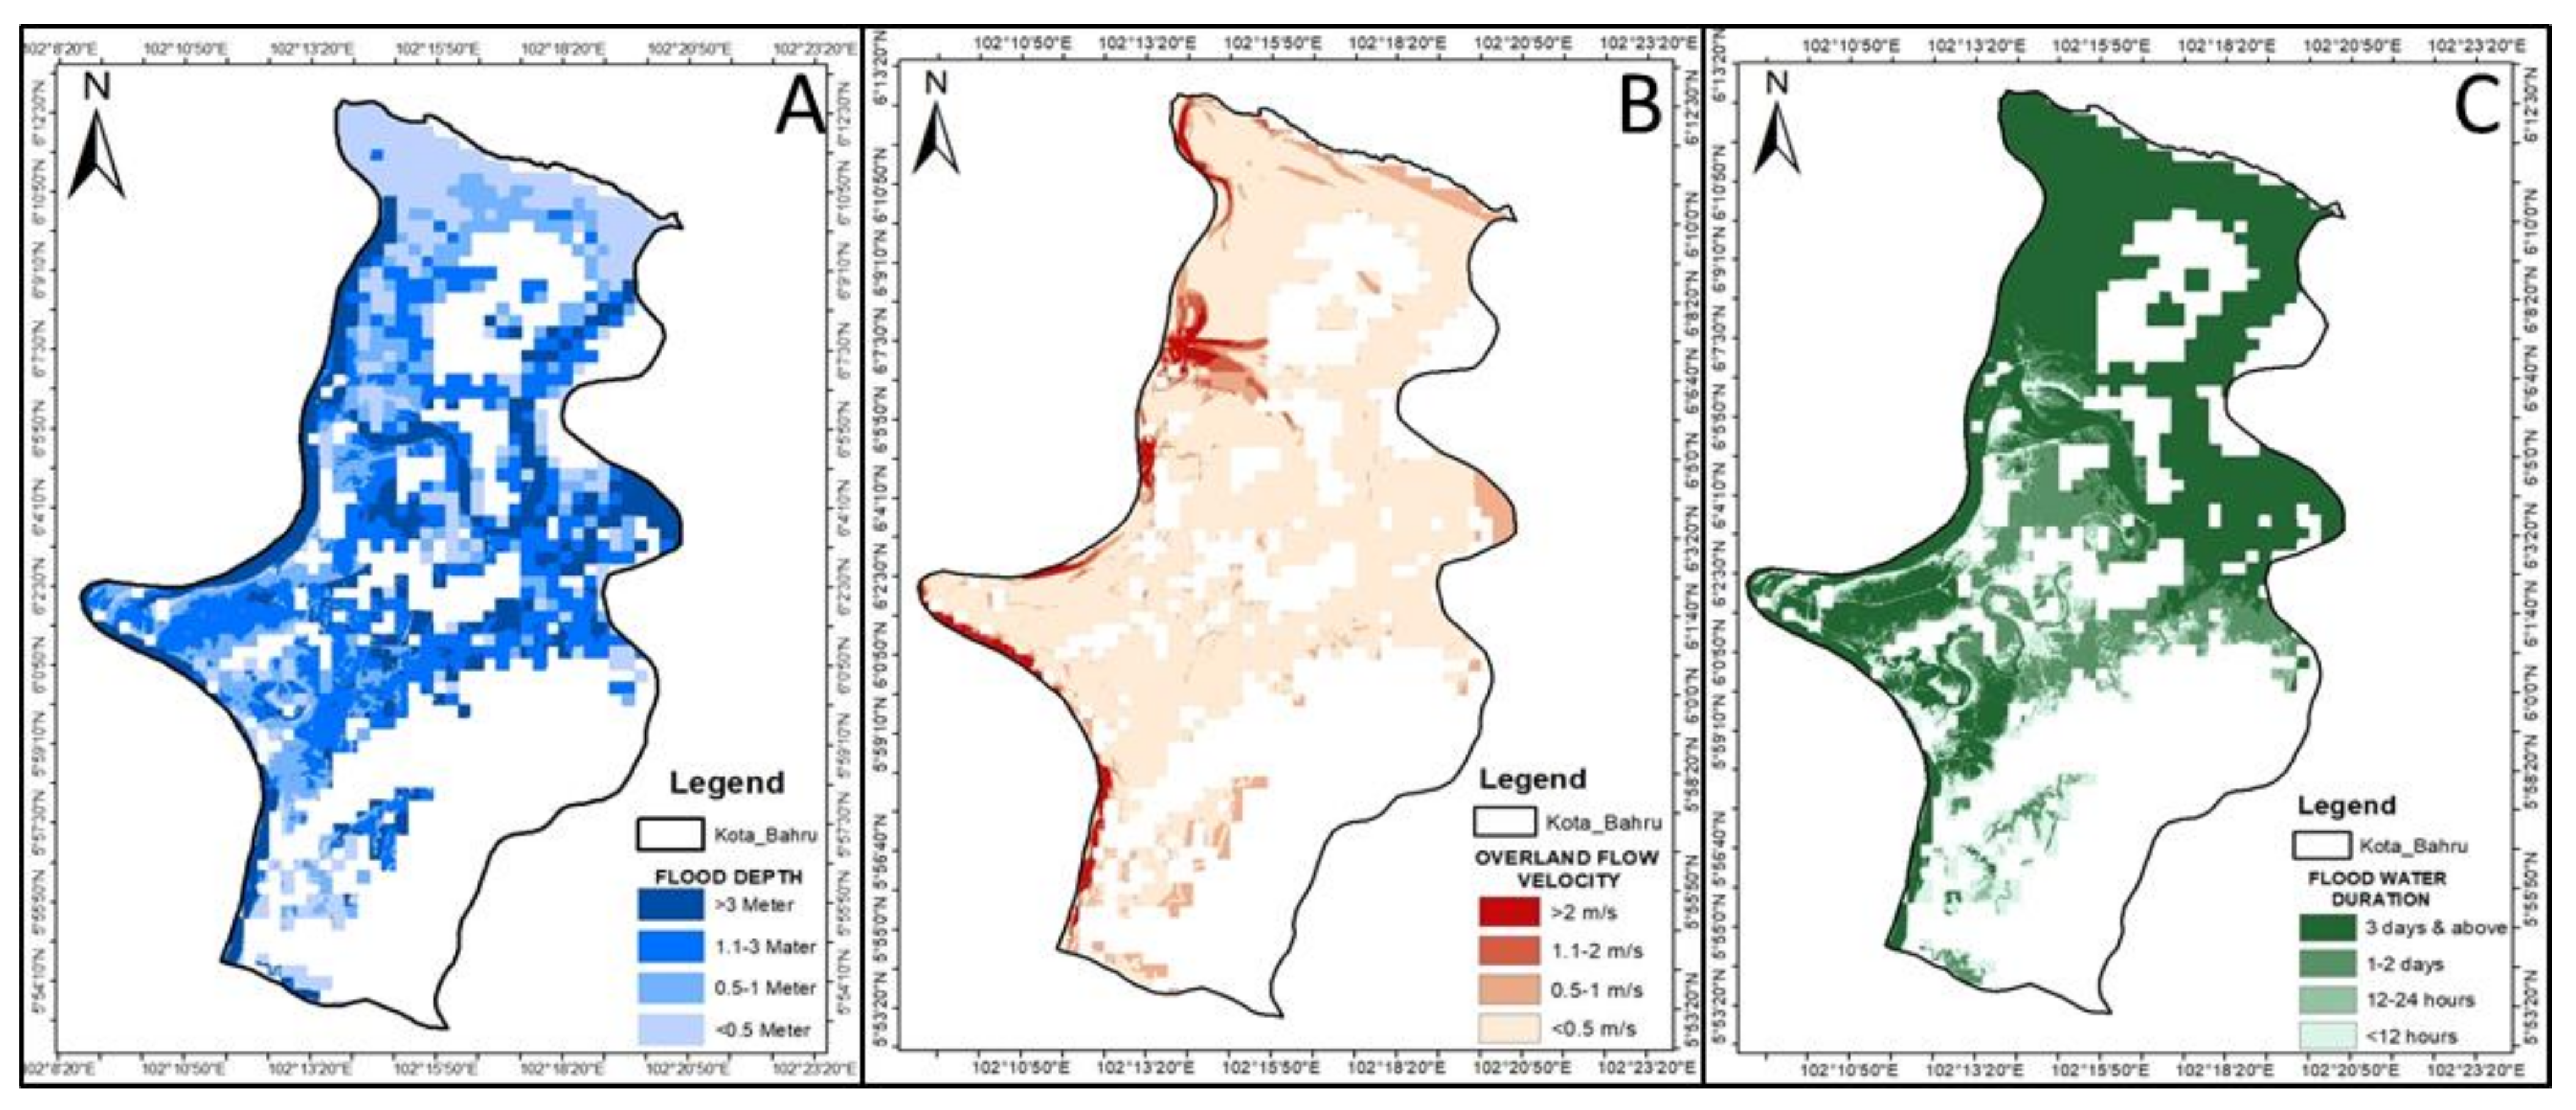
Footprints of affected buildings are the primary input for the flood vulnerability modeling developed in this study. Therefore, flood hazard maps are used to determine the exposure of affected buildings. As shown in
Figure 9, the flood hazard map was overlaid on a buildings polygon to extract on exposed buildings. One of the strong arguments of this study is that for a building to be vulnerable to flood, it has to be exposed to the hazard [
37].
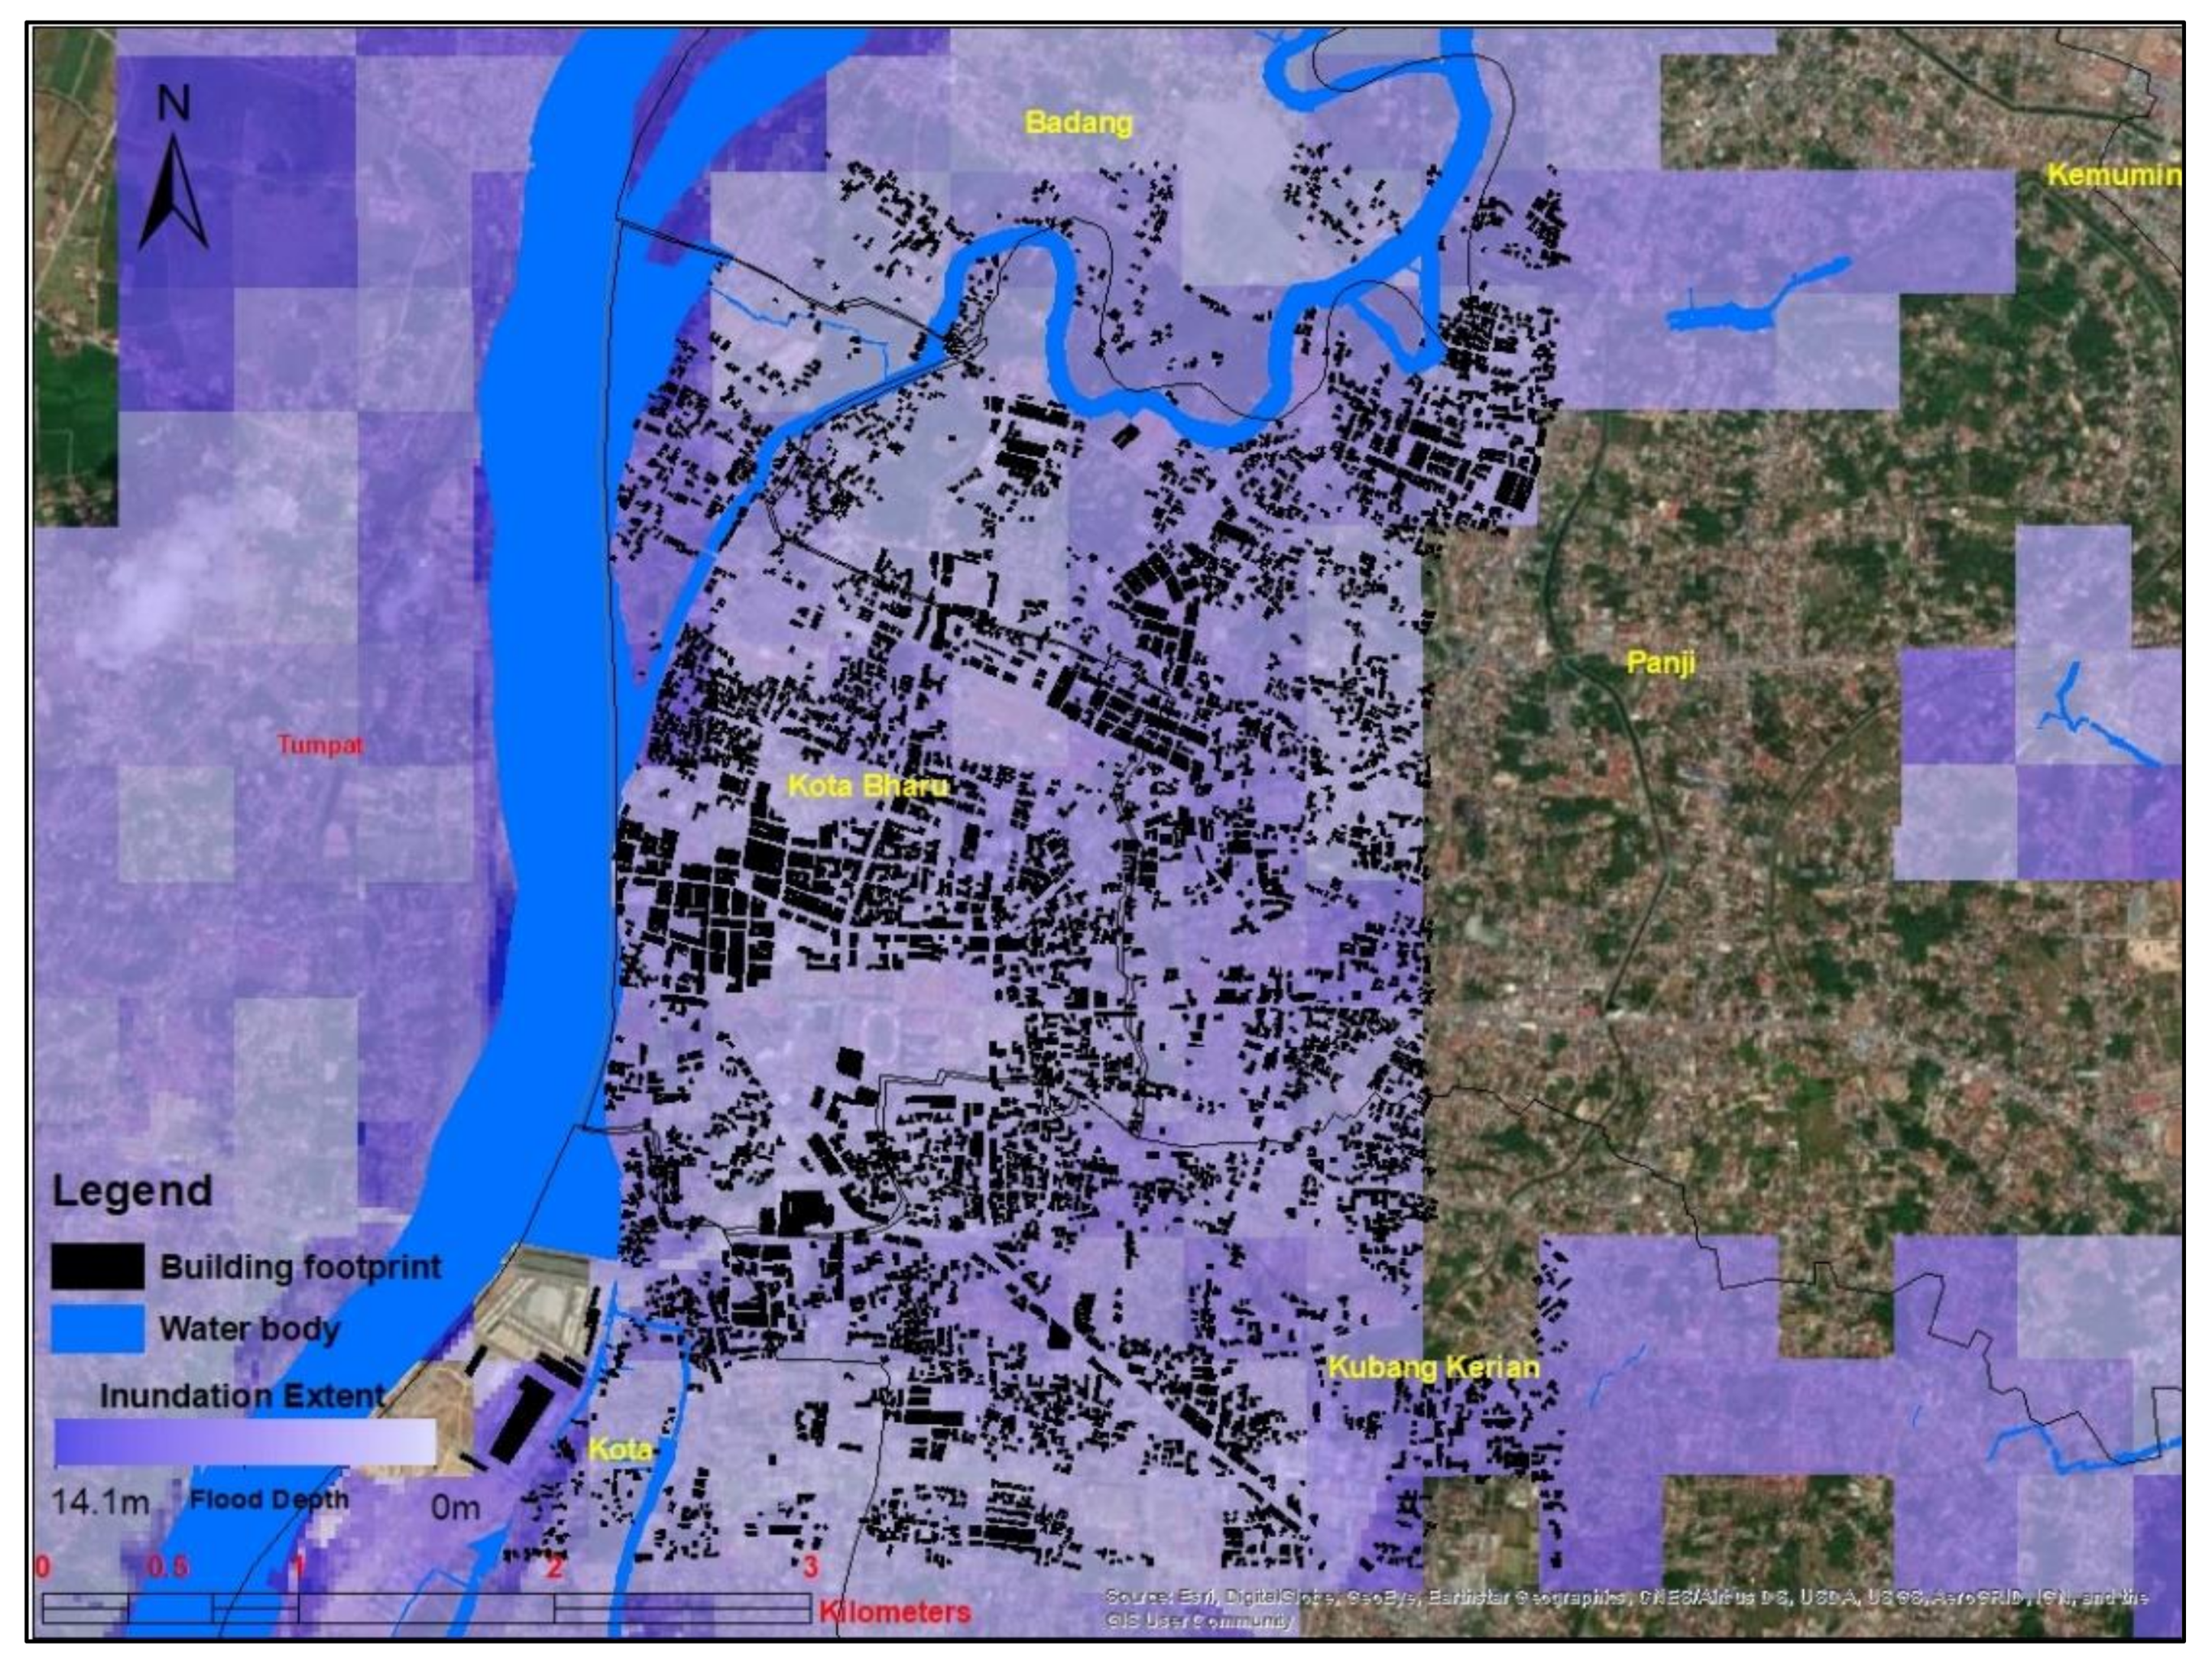
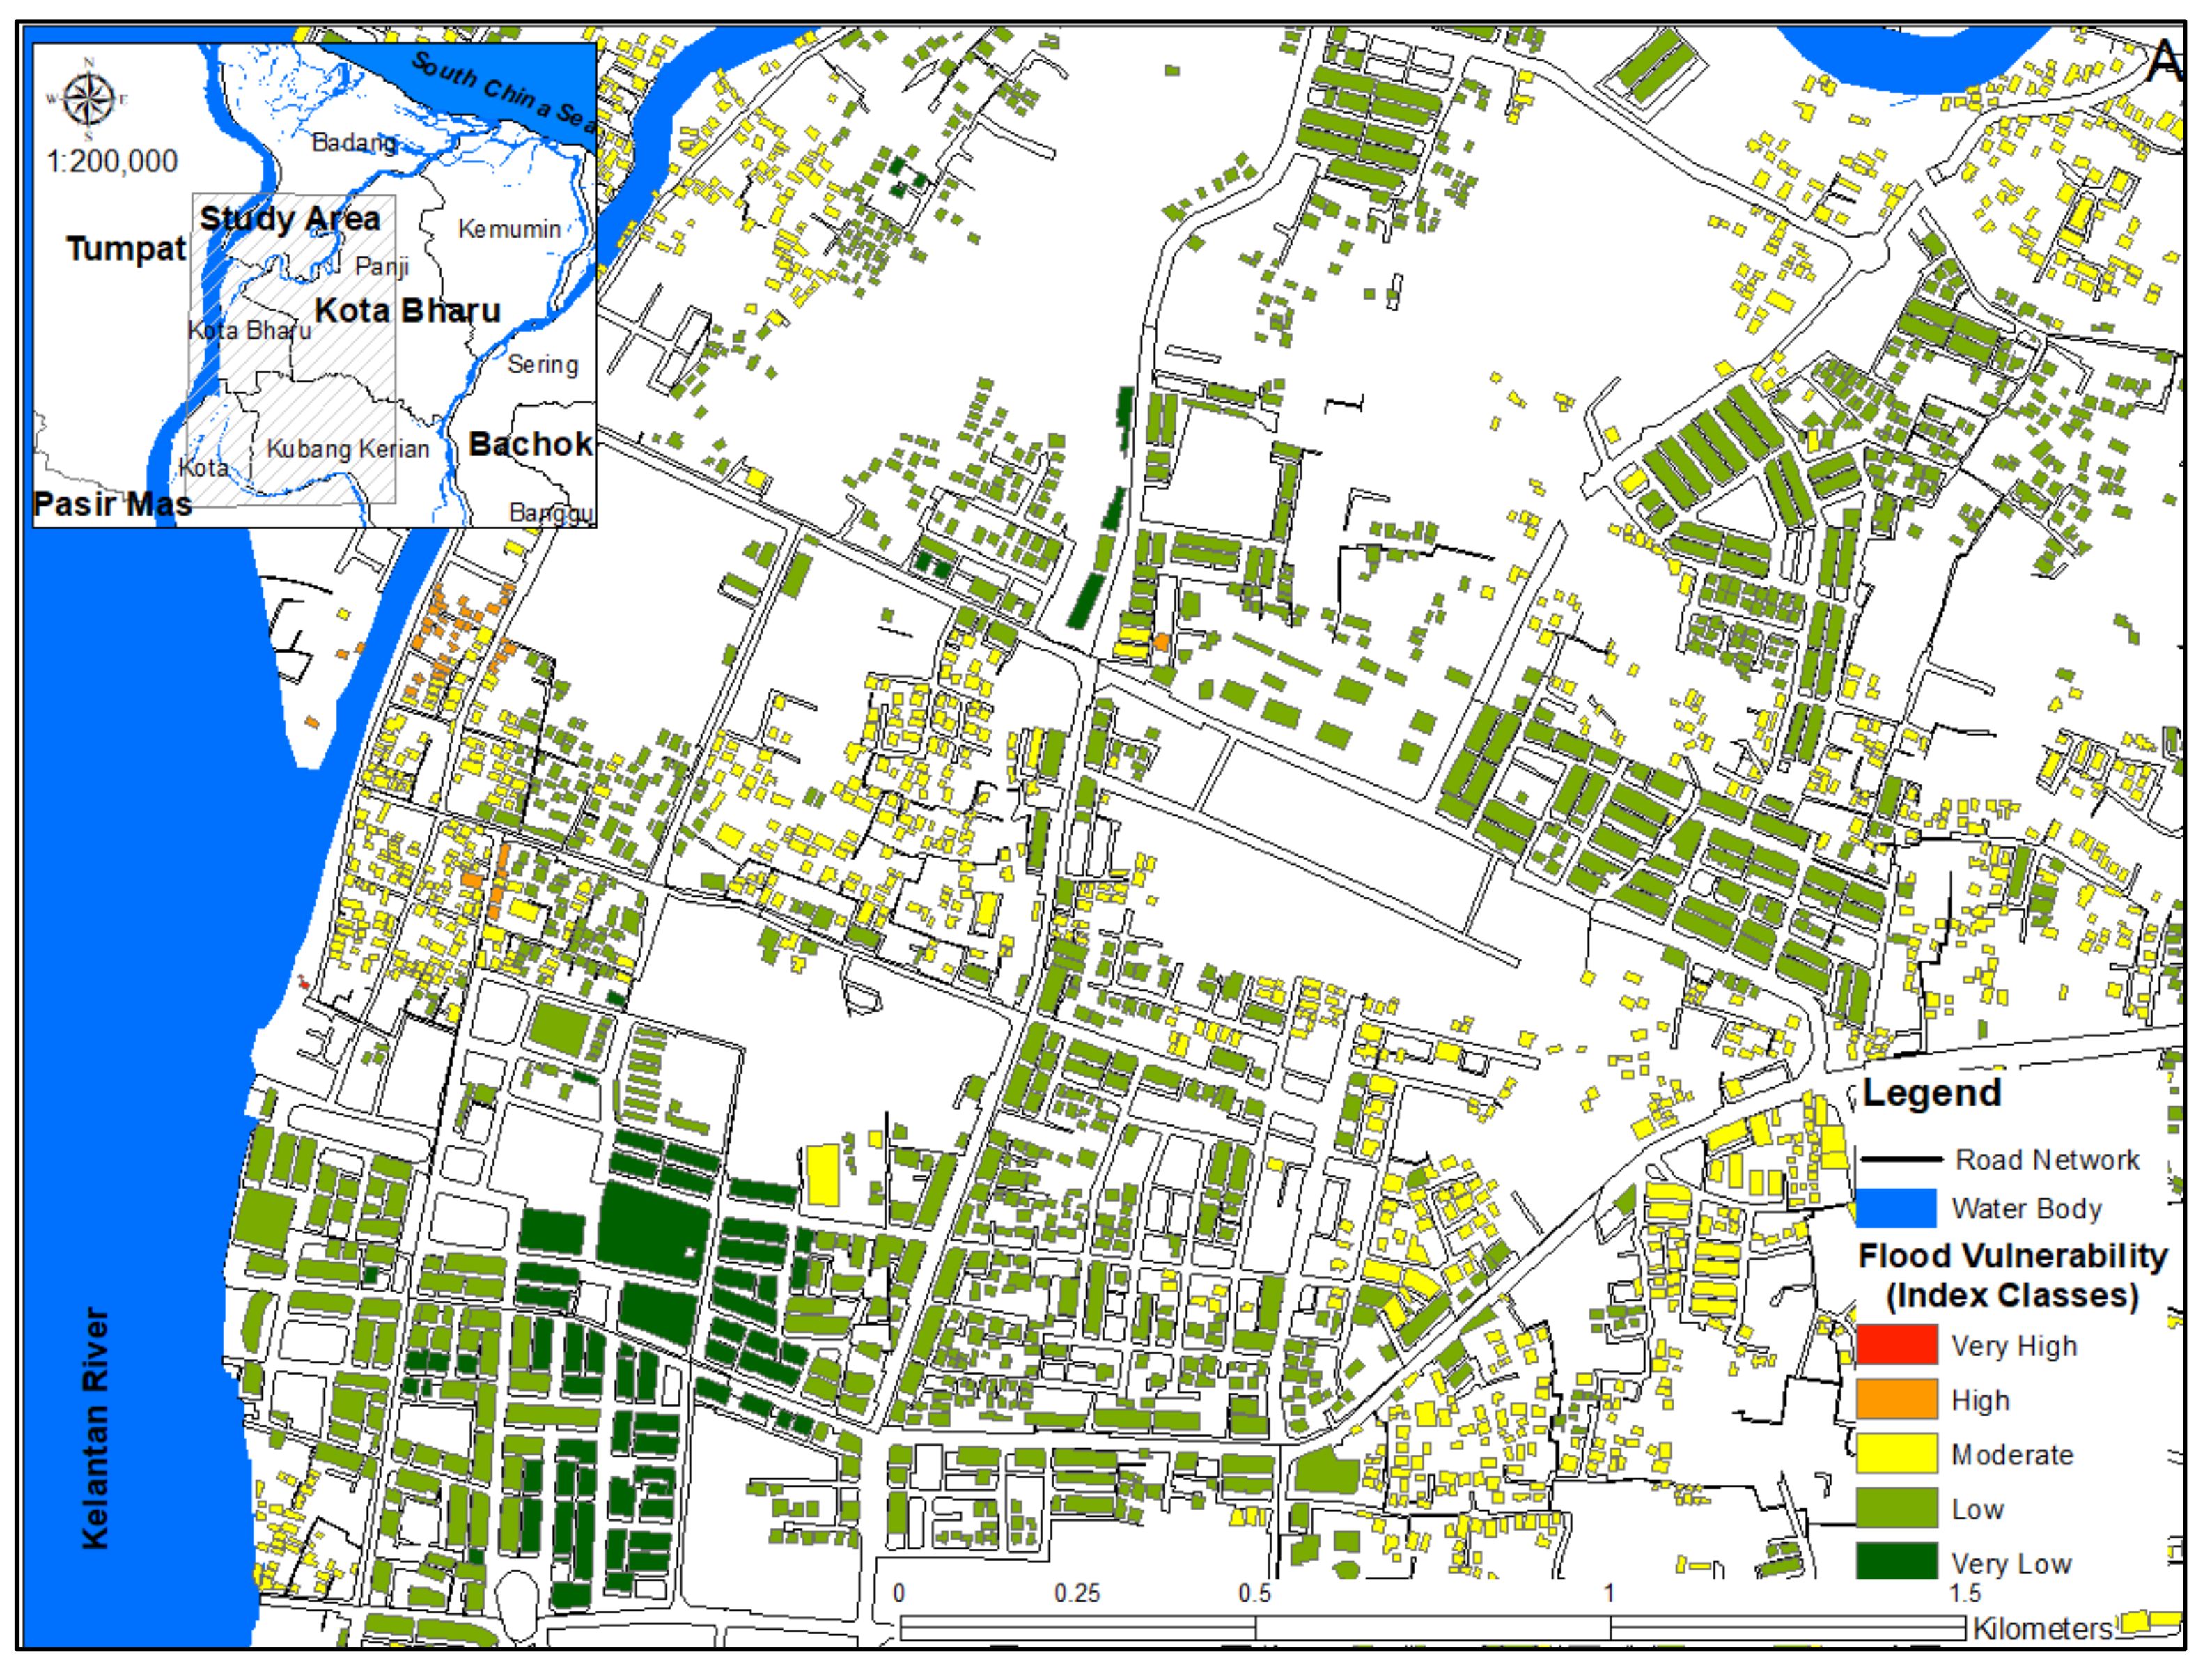
After identifying the exposed building structures, the vulnerability of the affected buildings is computed. Using the selected flood vulnerability indicators and developed weight for each indicator, the flood vulnerability index and map of the study location is generated. The buildings vulnerability Index (VI) presented in this study provides a scale of criticalities for individual buildings that will be severely affected at the occurrence of 100-year flood events. A total of 7780 building footprints located within the simulated 100-year flood inundated area of Kota Bharu city were successfully extracted for their vulnerability assessment. The generated flood physical vulnerability index (VI) as shown in
Figure 10 was classified into five categories based on the proposed vulnerability classes: 0.00–0.20 (very low), 0.21–0.40 (low), 0.41–0.60 (medium), 0.61–0.80 (high), and 0.81–1.00 (very high). The proposed description of the vulnerability index classes (see
Table 5) was determined from the field study-based 2014 flood record.
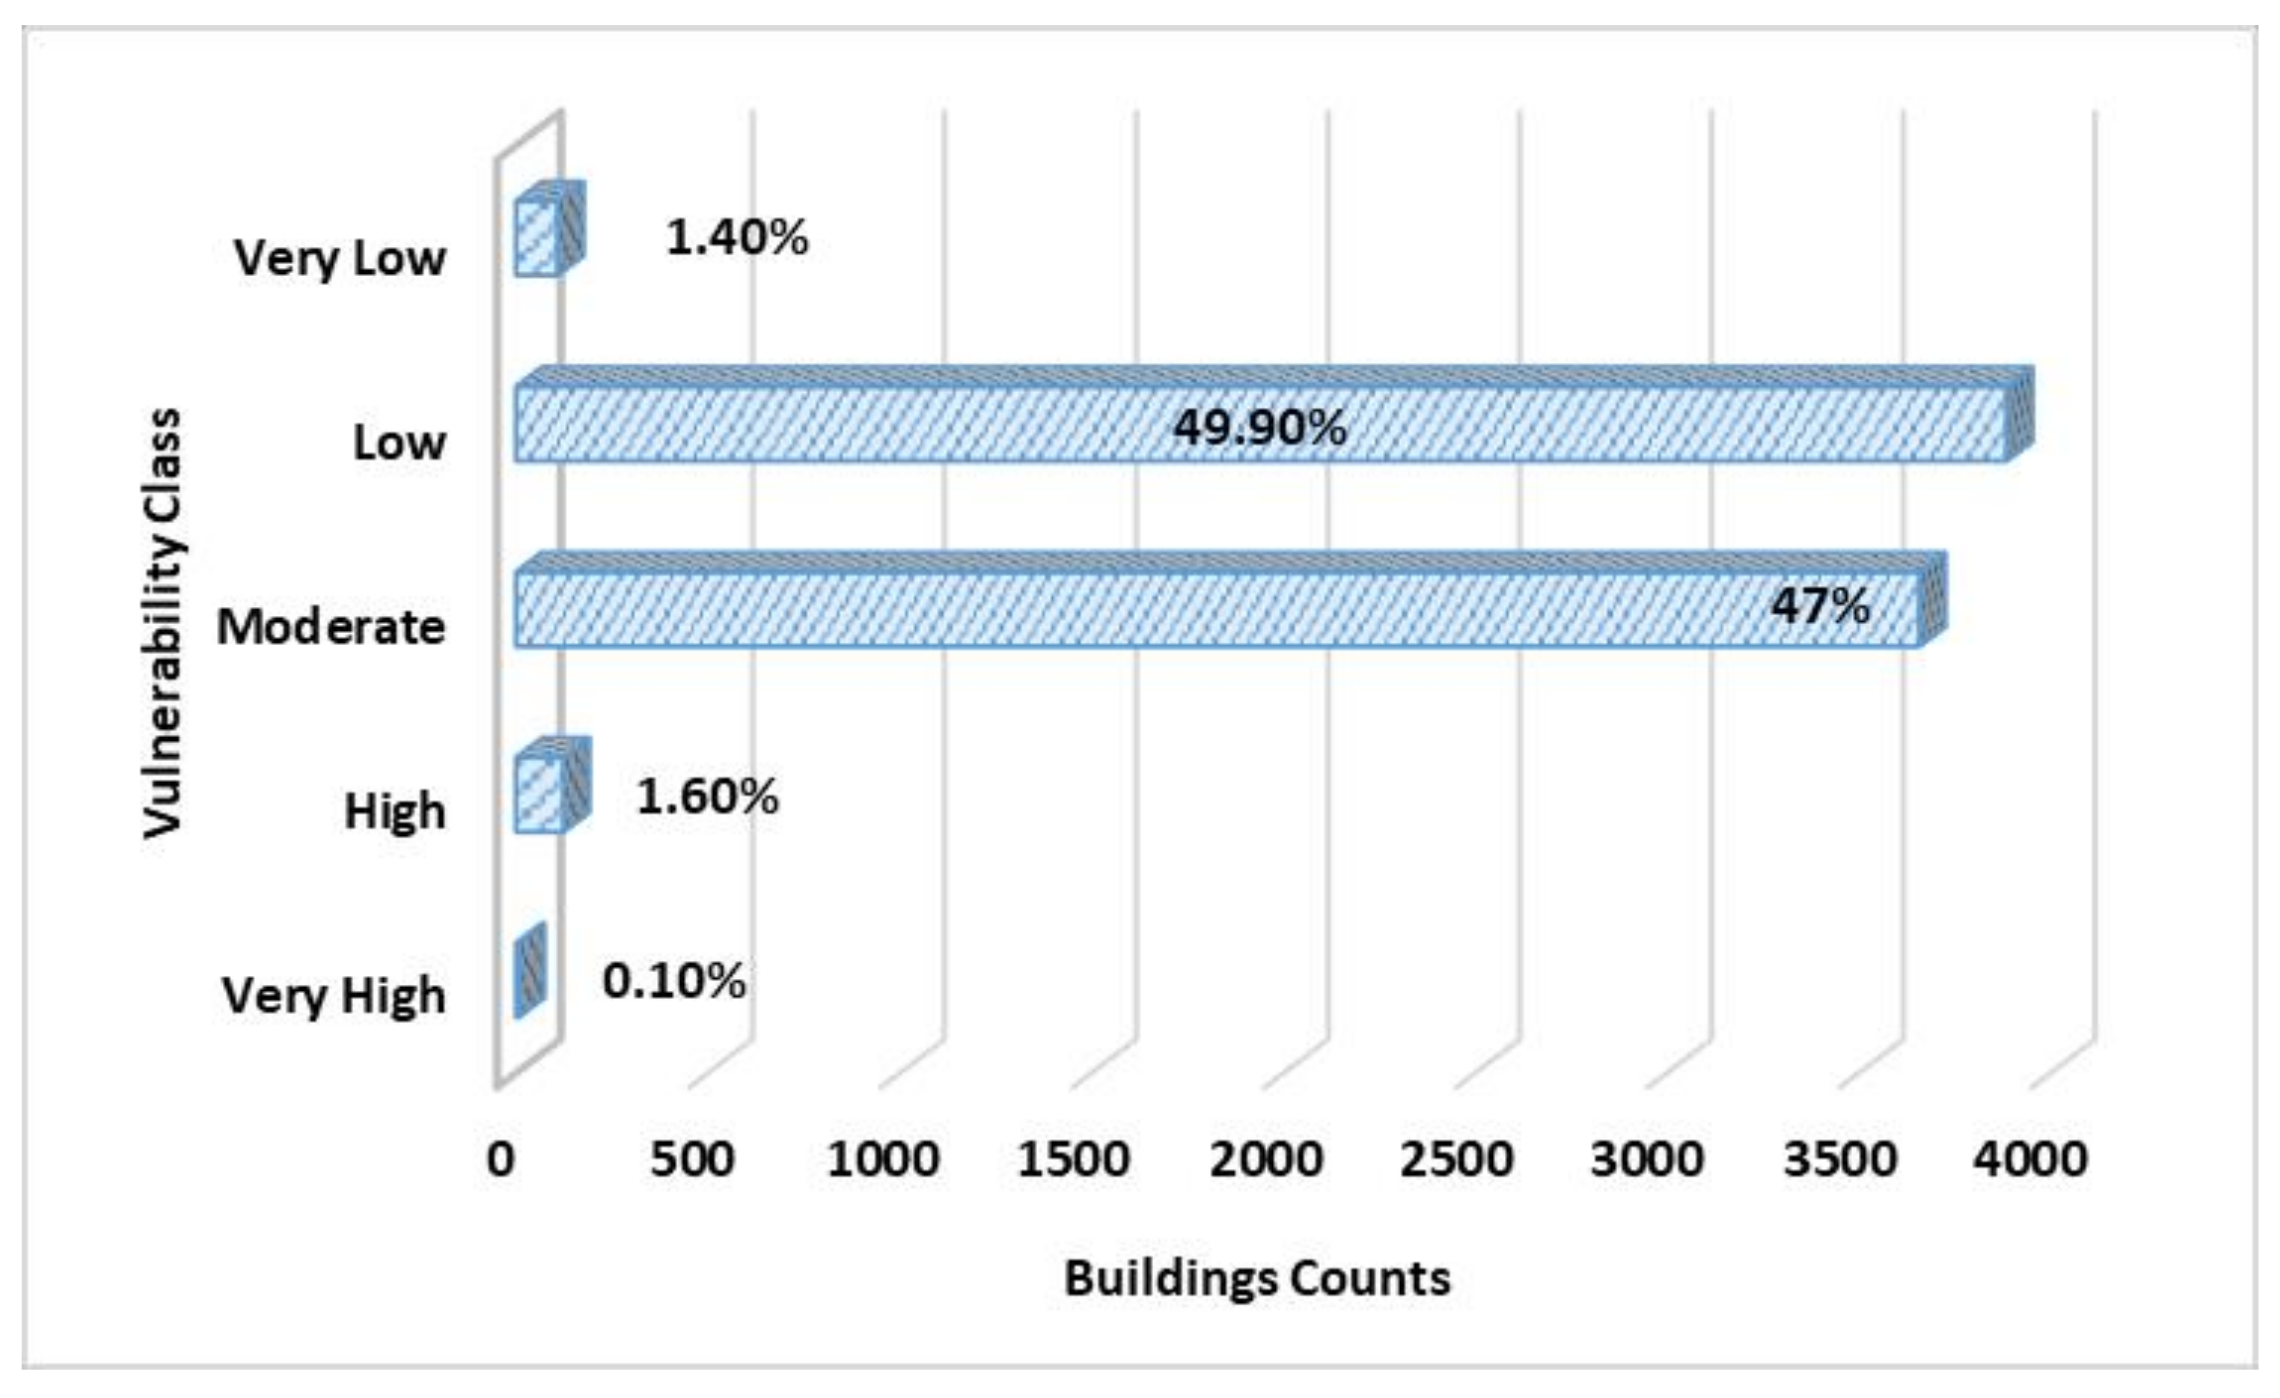
The frequency distribution of the VI classes is shown in
Figure 11. The cross-tabulation analysis shows that most of Kota Bharu buildings have moderate and low vulnerability classification. The model statistics shows that the average flood vulnerability index value is 0.38889. This shows that in an extreme (100–year) flood occurrence, most of the buildings that will be flooded may not experience any structural damage. However, building contents and fittings may be affected (wet of furniture at ground floor). Therefore, evacuation for most of the buildings may not be necessary. As investigated, most buildings have either low (49.9%) or moderate (47%) physical flood vulnerability; this is because the majority of modern building structures are reinforced concrete structures. As a result of the way they are constructed, they tend to have high resilience to flooding. In addition, most buildings in Kota Bahru city (especially urban center) are more than one story. As the number of floors increases, the vulnerability decreases.
Finally, the model output, which is the physical flood vulnerability index of buildings, was validated by relating the final index output with the 2014 flood damage description of buildings obtained from the field survey damage assessment. At this stage, the respondent descriptions of their property damage were used in validating the final flood vulnerability index developed in this study. Samples from 217 buildings were used for the validation. The description of buildings damage (from 2014 flooding) based on the respondents’ interview are coded into five categories with each category representing a specific flood damage description, as shown in
Table 5: very low = 1, low = 2, moderate = 3, high = 4, and very high = 5. The model output results and the presented survey result of the 2014 flood damage record were compared using Error Matrix (EM) accuracy assessment techniques. The categorizations of damage descriptions from the field damage assessment are used as reference data in the confusion matrix analysis. The accuracy assessment analysis from the error matrix (EM) is shown in
Table 6.
The confusion matrix reveals that out of the 217 buildings surveyed, the classification of vulnerability was found to be correct at 163 sampling units. The Overall Accuracy of the flood vulnerability index classification is 75.12%. A higher percentage of Overall Accuracy implies better reliability. The model classifications depicted a positive relationship when compared with field damage reference data. Similarly, the Kappa Coefficient (k) shows a moderate relationship of 0.63, which means that the model accuracy is “Substantially Accepted”. The User’s Accuracy (%) and the Producer’s Accuracy (%) of the vulnerability classes are computed from the confusion error matrix. The accuracy level is satisfactory and acceptable, except for the very high vulnerability class which as 0% accuracy for both User’s and the Producer’s Accuracy. This is because there are no buildings in this category among the surveyed buildings during the field study. Likewise, in the simulated flood vulnerability model, only a few buildings (1.40%) are in this category. At this stage, it is essential to discuss the possible sources of error that may affect the accuracy of the flood vulnerability model. Under or overestimation of the simulated flood hazard models affect the flood vulnerability modeling developed in this research. In this study, the simulated SOBEK flood model is validated by comparing the simulated flood depth with the observed visible flood watermarks of the 2014 flood event. From the comparison, the computed Mean Error (ME) is 0.31 m. The ME exhibits whether the simulated model measurements overestimate (positive ME) or underestimate (negative ME) the flood event. The error result shows that the simulated result overestimates the actual flood event based on the number of point samples used in this study.
4. Discussion
The study of [
20,
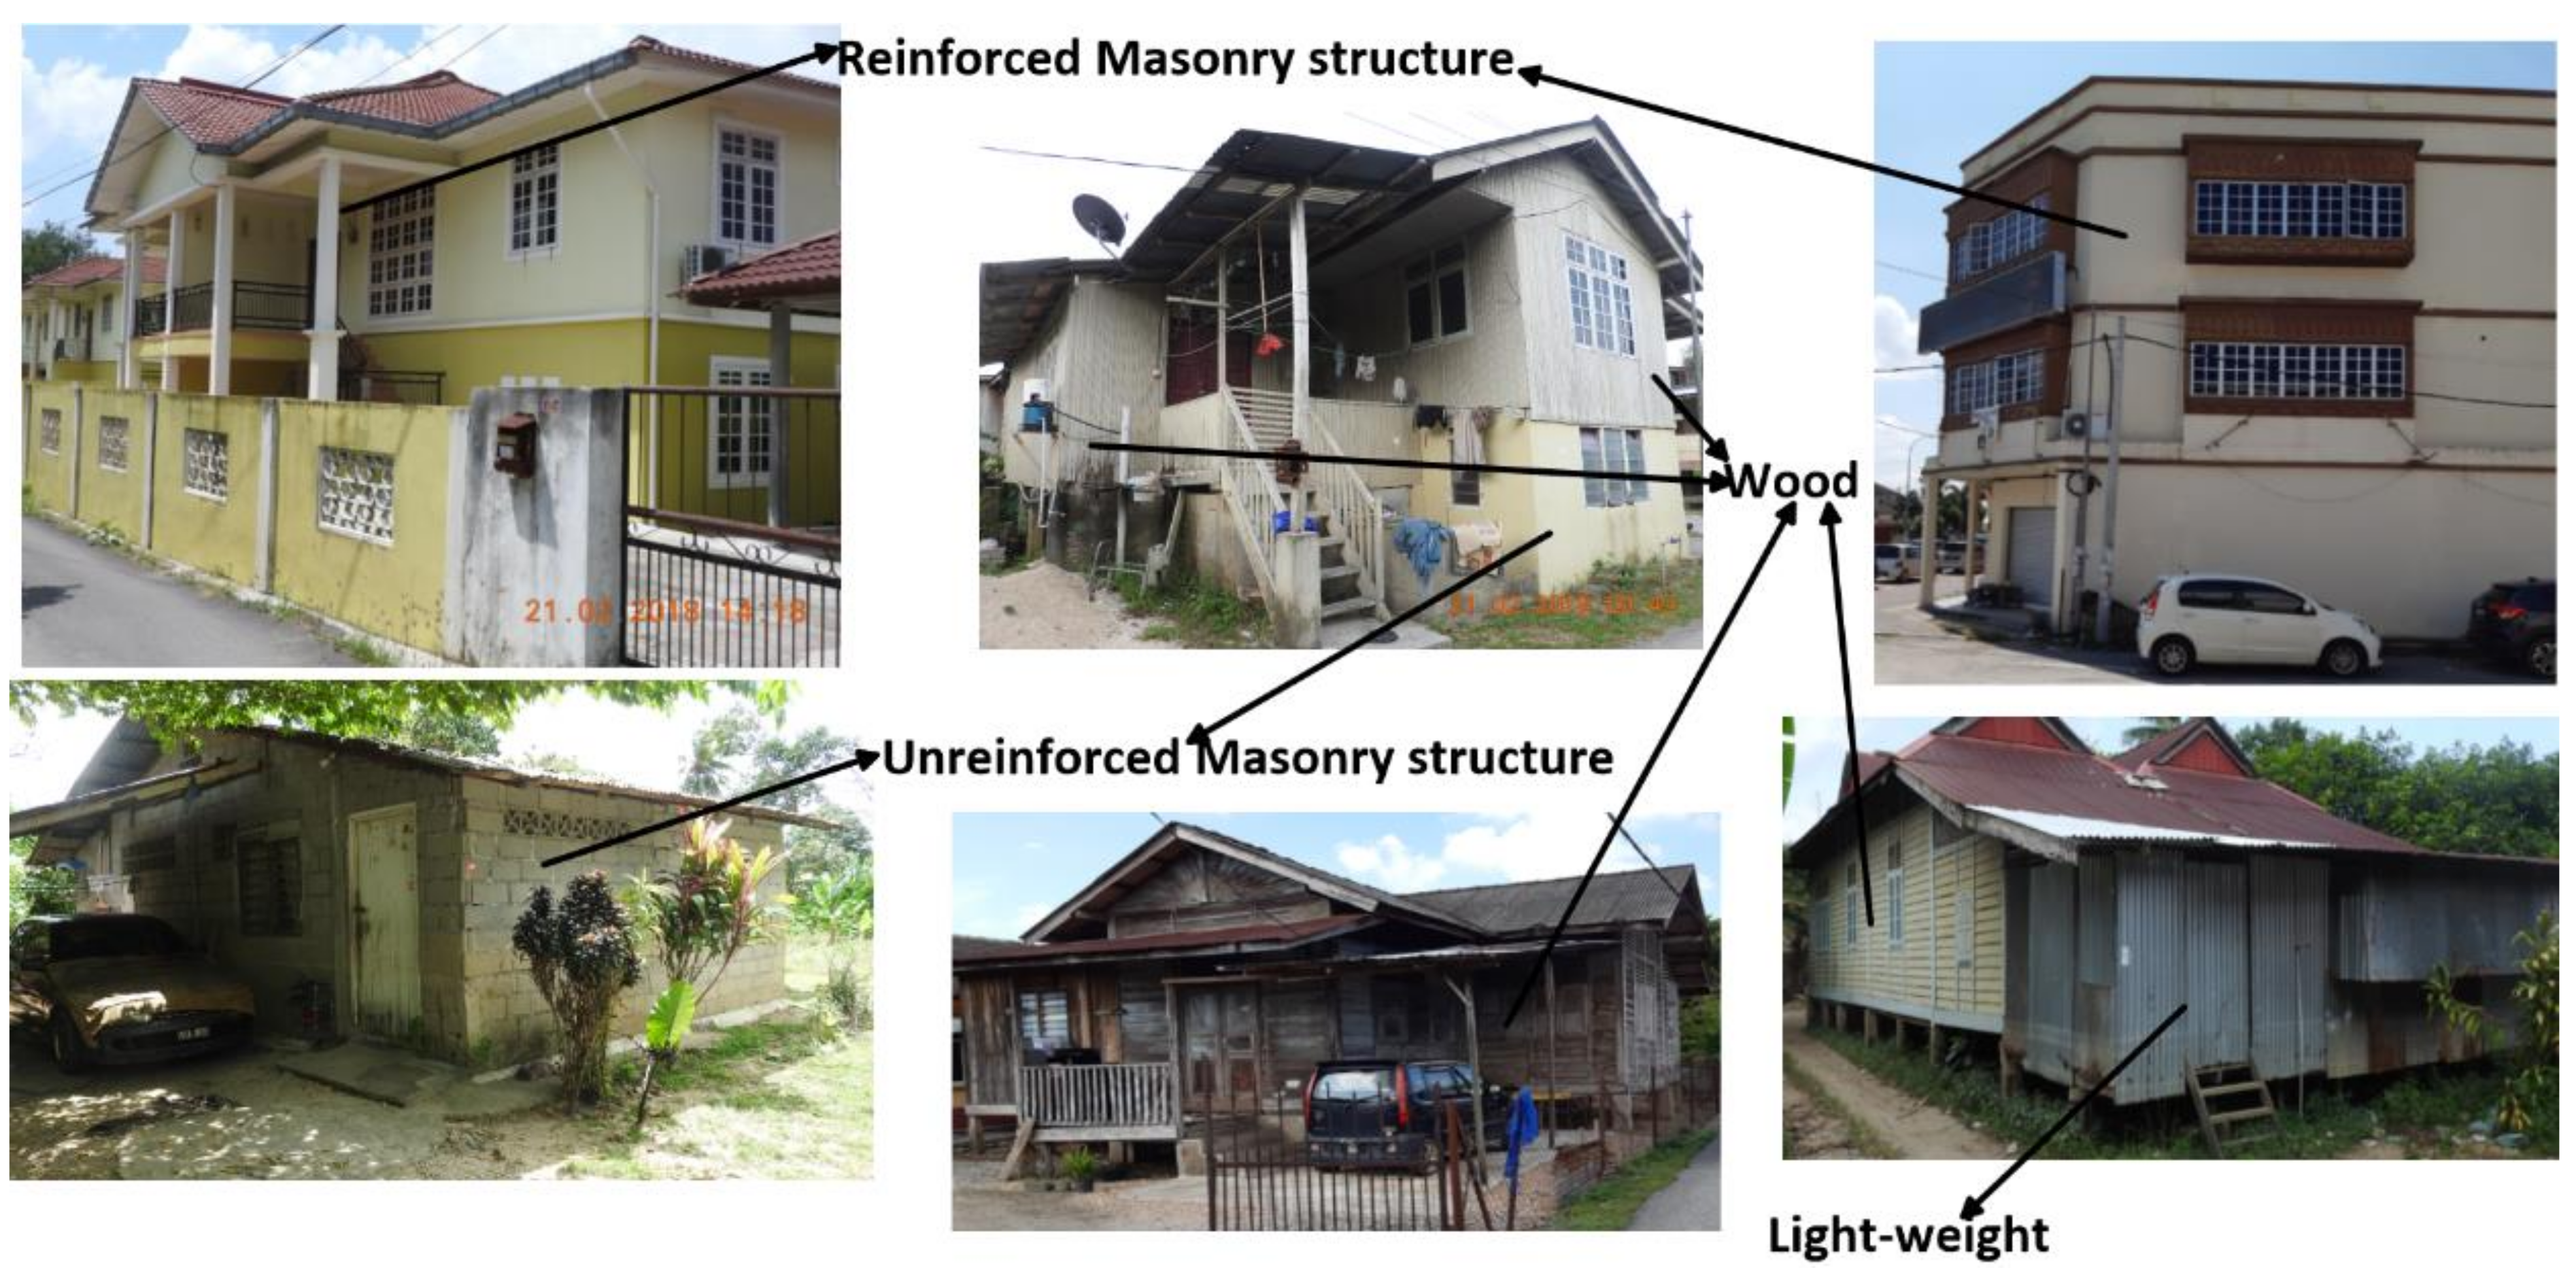
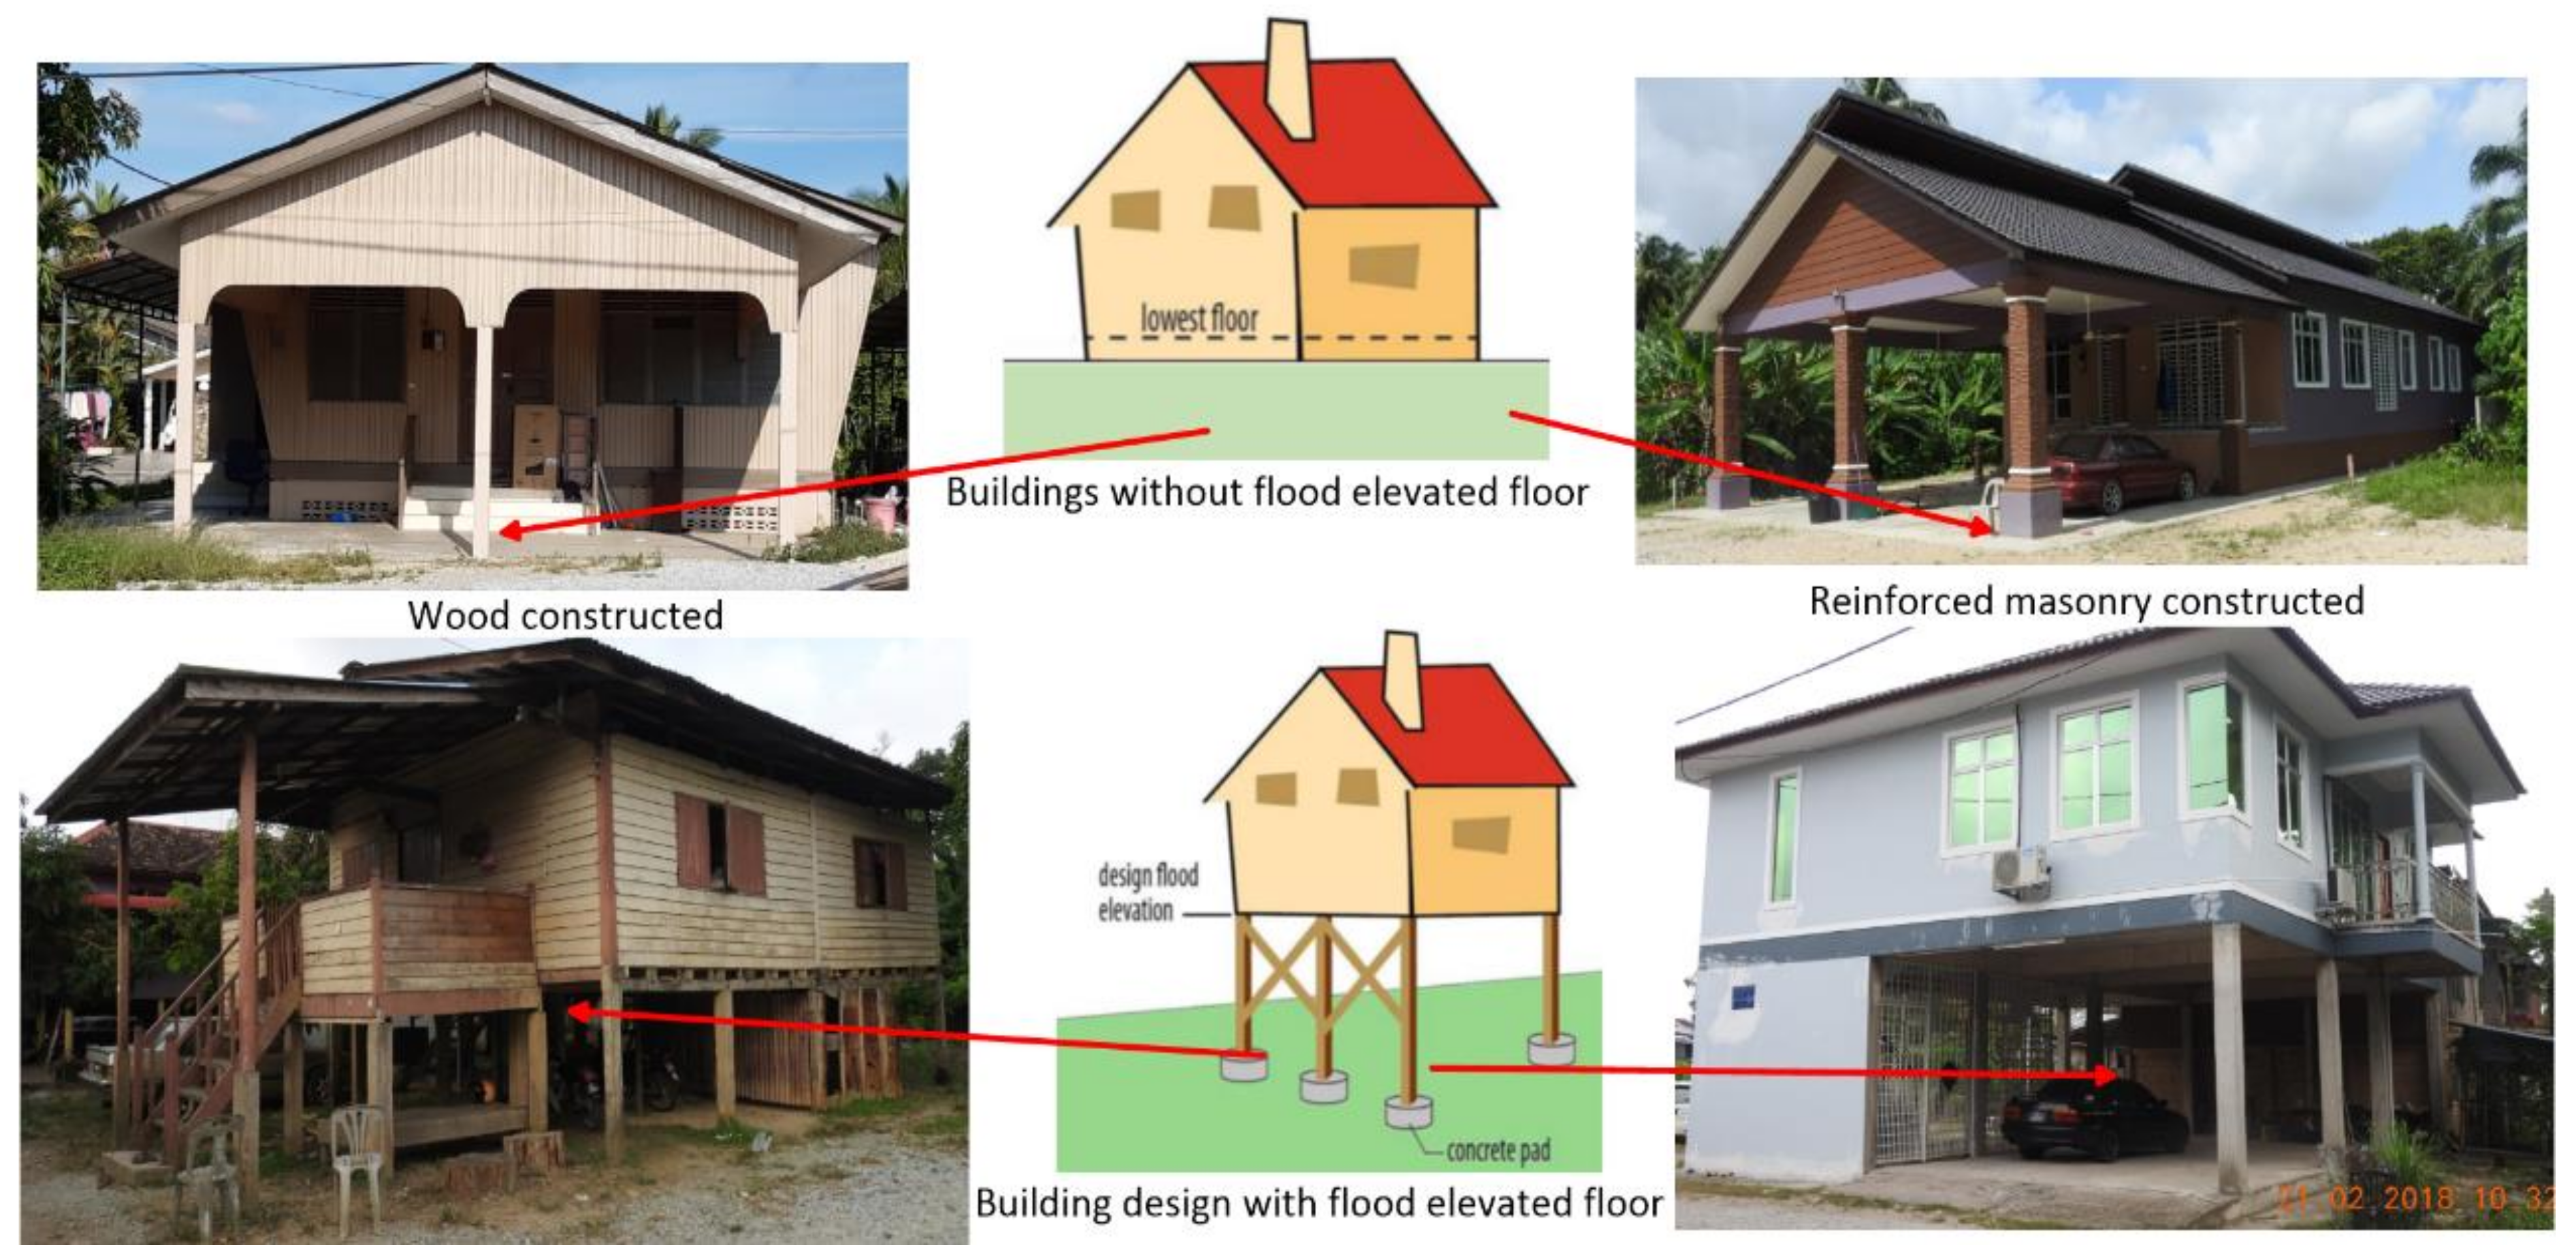
38] identified building walls’ strength as one of the critical indicators that reduce flood vulnerability and vulnerability of natural hazard. The material and the construction type are significant in determining how fast water infiltrates buildings. Likewise, when the building is subject to immense hydrostatic and hydrodynamic pressure, structural damage may occur depending on the building construction type and material. Based on the construction types that are common in Malaysia, the building construction type and material are group into four major classes, which are (a) Steel/IBS and concrete reinforced masonry structure, (b) Unreinforced masonry structure (c) Mixed-material construction (masonry and wood) (d) Wood material structure/Lightweight material structure (see
Figure 12). The purpose of classifying buildings into these groups as mentioned above is to categorize buildings based on their construction strength. According to available post flood field surveys [
39,
40,
41], lightweight material and wood-constructed buildings have always suffered more serious structural damage. Masonry-constructed buildings are considered to have a moderate vulnerability to flooding, while reinforced concrete structures and steel/IBS structures are considered to be highly resistant to flood hazard.
Steel structure buildings are buildings constructed using steelwork to form the skeleton frames. In contrast, IBS buildings are types of buildings that are constructed under a well-supervised control environment. Reinforced concrete buildings are mostly constructed using reinforced cement concrete in which steel rods are embedded. Thus, reinforced concrete, steel, and IBS structures tend to have high resilience to flooding because of how they are constructed. Typically, Malaysia’s urban masonry structures are made up of a single layer of cement bricks with reinforced concrete beams. They are considered to have a moderate vulnerability, but they can be affected under high intensity of flooding. It has been observed that in Kota Bharu, most of the modern urban buildings are masonry-constructed buildings. Most of the modern structures that came into contact with water during the 2014 flood event had a highly resistant their structural composition. Most of the damage that is experienced by such buildings is mostly on their fittings and internal properties. Unreinforced masonry structures are buildings where load-bearing walls and non-load-bearing walls are made of only cement bricks. Wood structure buildings are buildings constructed with wood or wooden parts, whether modern wooden construction or traditional wooden construction are both product of a more intricate fabrication process in which various wood strands, veneers, fibers, or other forms of wood are nail or glued together to construct a building. Both unreinforced masonry structures and wood buildings usually suffer serious consequences during flooding and thus are highly vulnerable to flood. Similar to wood structure buildings, buildings constructed with lightweight material are also very vulnerable to flood. In Kota Bharu suburban areas, it has been observed that many traditional buildings are constructed with wood material and others are constructed with both wood and masonry.
Furthermore, the level of flood damage is always associated with the type of building material and number of floors [
7,
14], suggesting that the number of stories is among the most vital indicators for building flood vulnerability. Likewise, if we acknowledge building structures as engineering structures, the foundation strength is a direct function of building weight, and buildings with more floors are expected to have more weight, which makes them difficult to be washed away by floodwater. It is always assumed that the higher the number of floors, the stronger the foundation and the ground floor. A 2006 post-flood survey study conducted in Java, Indonesia by [
39] shows that single-story buildings collapsed when the water depth is higher than 2 m, while multi-story buildings were resistant to damage even when the water flow depth reached 4 m. Evidence from the field study shows that most single-story buildings that are completely inundated by floodwater (during 2014 big yellow flood) were severely damaged, and some were completely destroyed. From the above observations, four indicator classes are selected based on the number of floors: single story, two stories, three-stories, and four-stories. Any building with four or more floors is strongly resilient to flood vulnerability due to the strength of the ground floor.
Another relevant indicator of flood vulnerability under building characteristics is the presence of stilts or an elevated ground floor. These are poles and pillars that are used to allow a building to stand at a distance above the ground. These buildings have their lowest elevated floor raised above ground level by foundation walls, shear walls, posts, piers, pilings, or columns (see illustration in
Figure 13). Although there are many reasons for these types of building construction, elevated and stilts buildings have been used in Malaysia right from the olden days for the adaptation and mitigation of floods [
42]. During flood events, elevated buildings allow water to pass under the buildings. It has been observed that in floodplain areas of Kota Bharu, especially along the river Kelantan, some traditional houses are built with stilts to mitigate floods. Unfortunately, modernization threatens this old practice and traditional lifestyle of flood mitigation. Elevated buildings are expected to reduce flood impact. Therefore, they have low flood vulnerability as compared to non-elevated buildings. Furthermore, information regarding ground floor material is also relevant for building flood vulnerability assessment. In the study area, the strength of the ground floor foundation material is broadly grouped into three different types of materials, which are cement concrete, mixed materials, and wood.
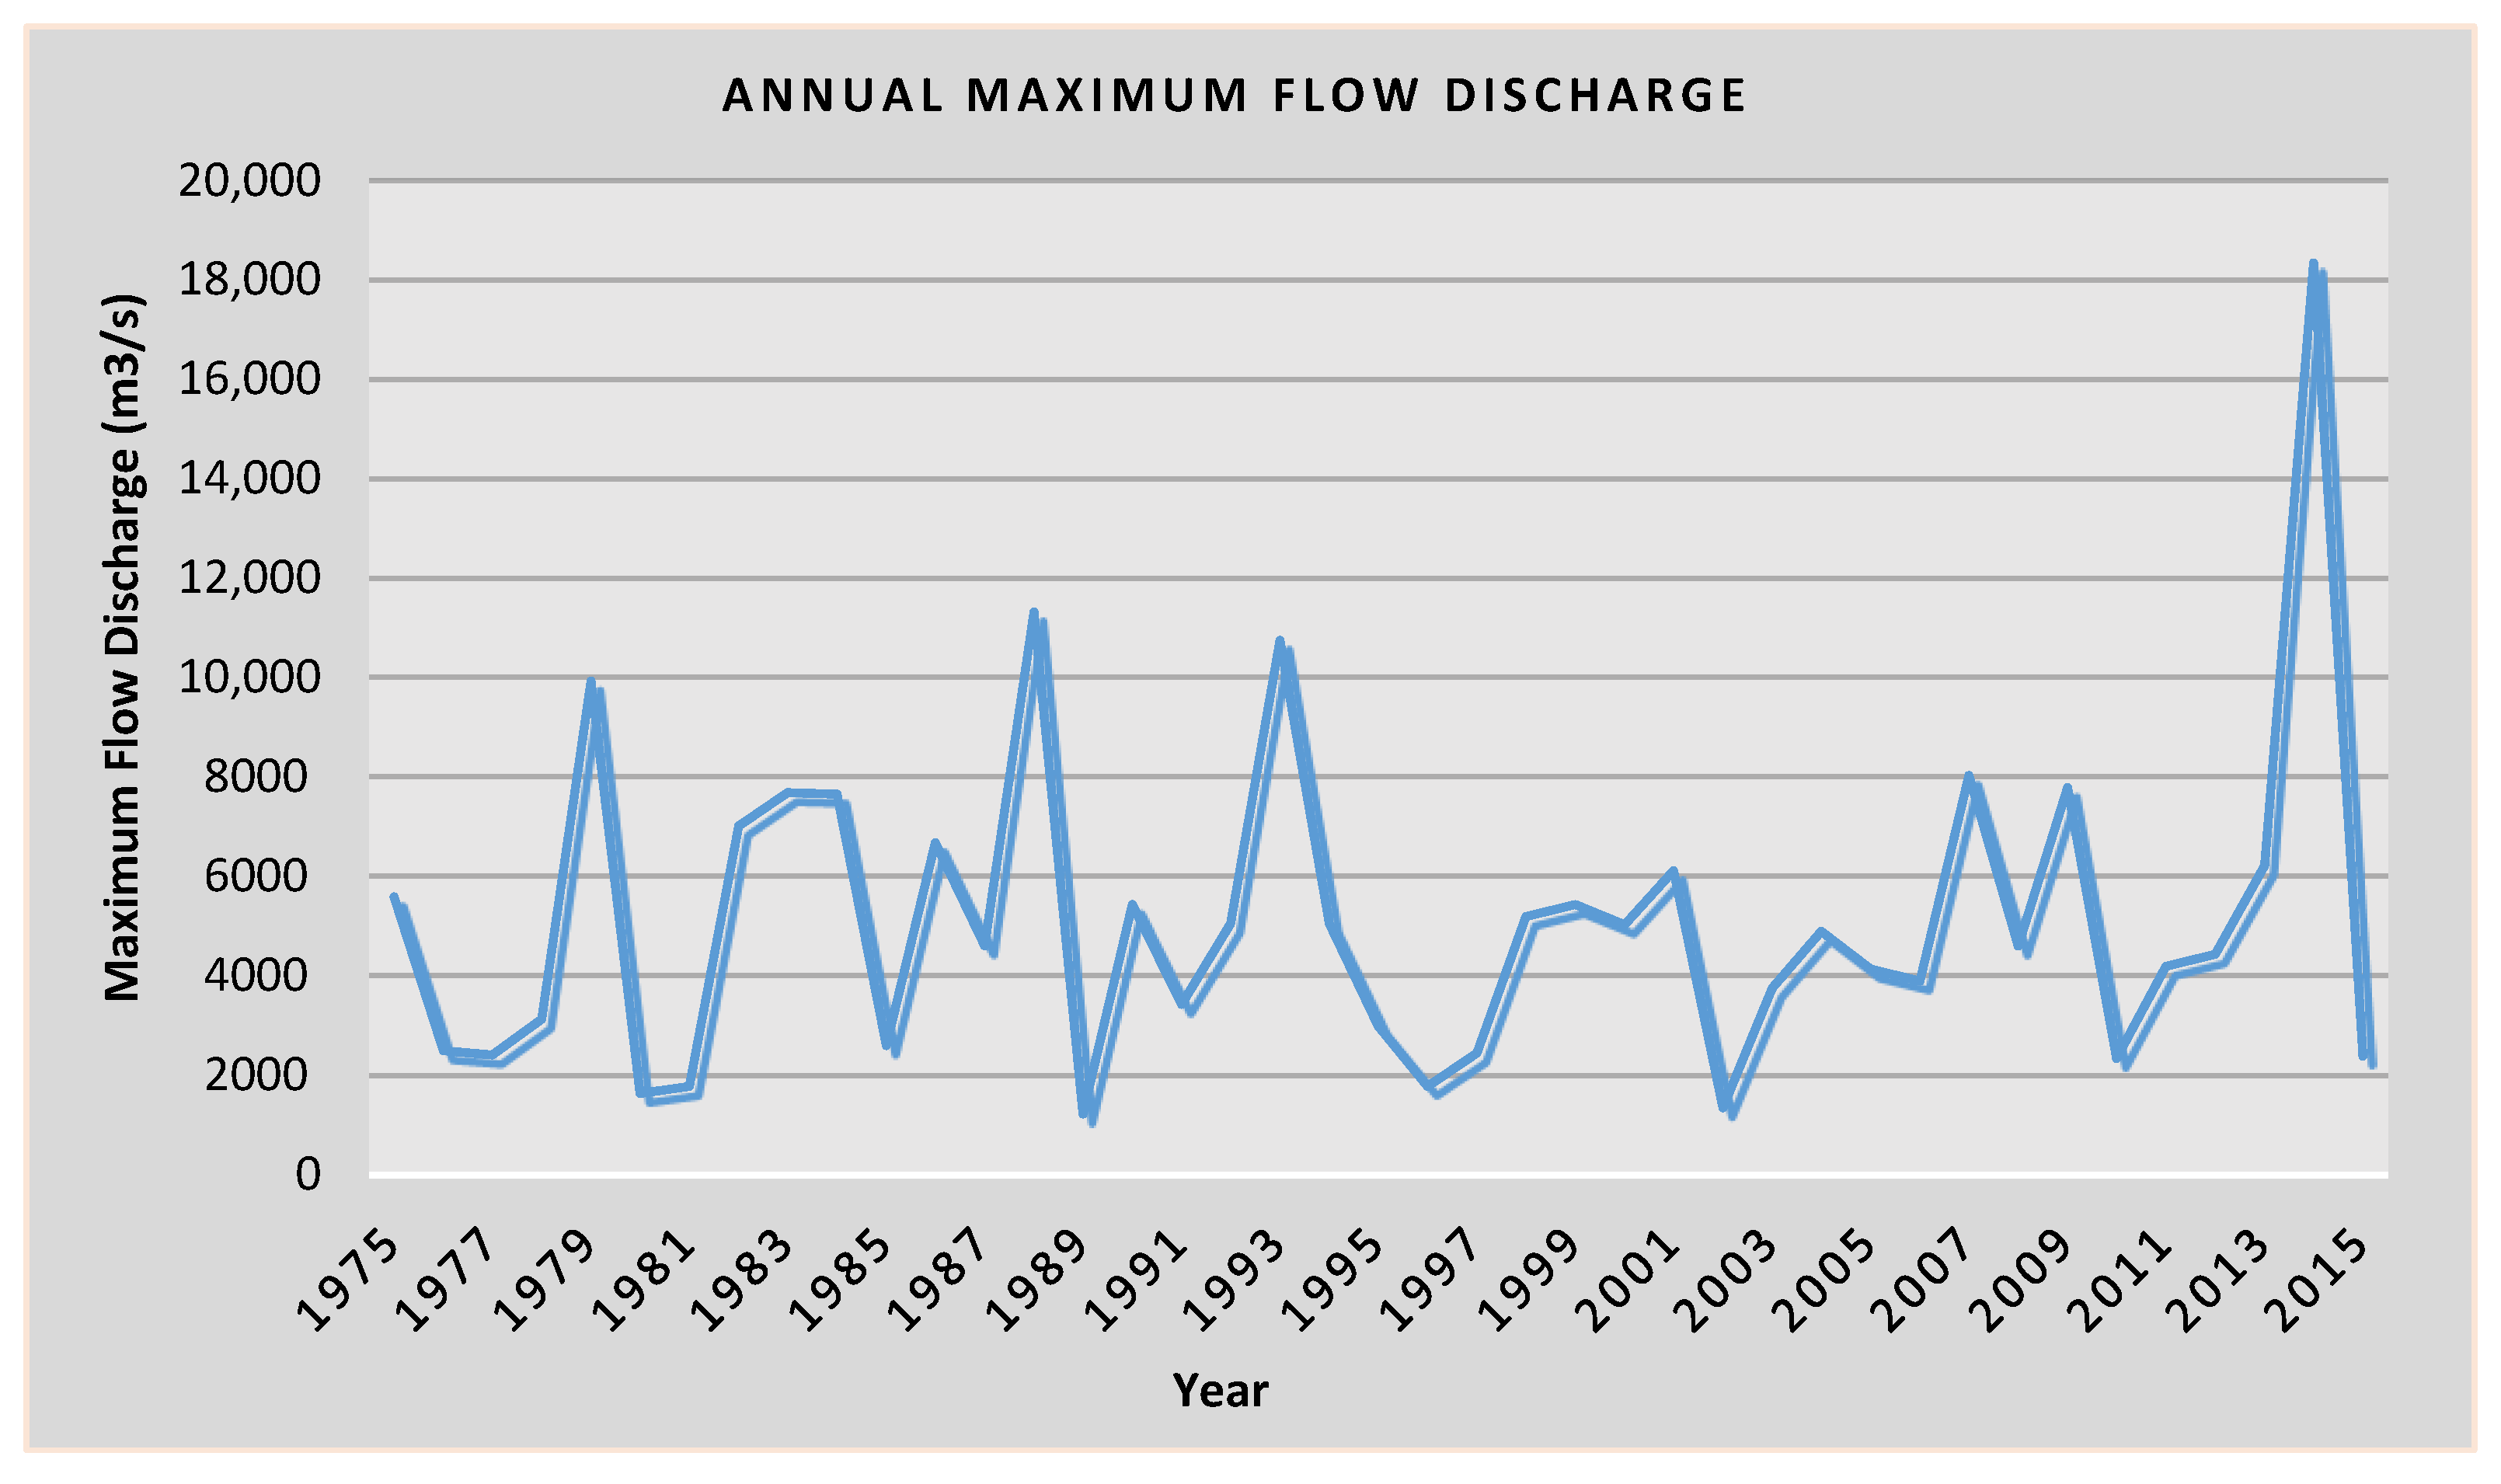
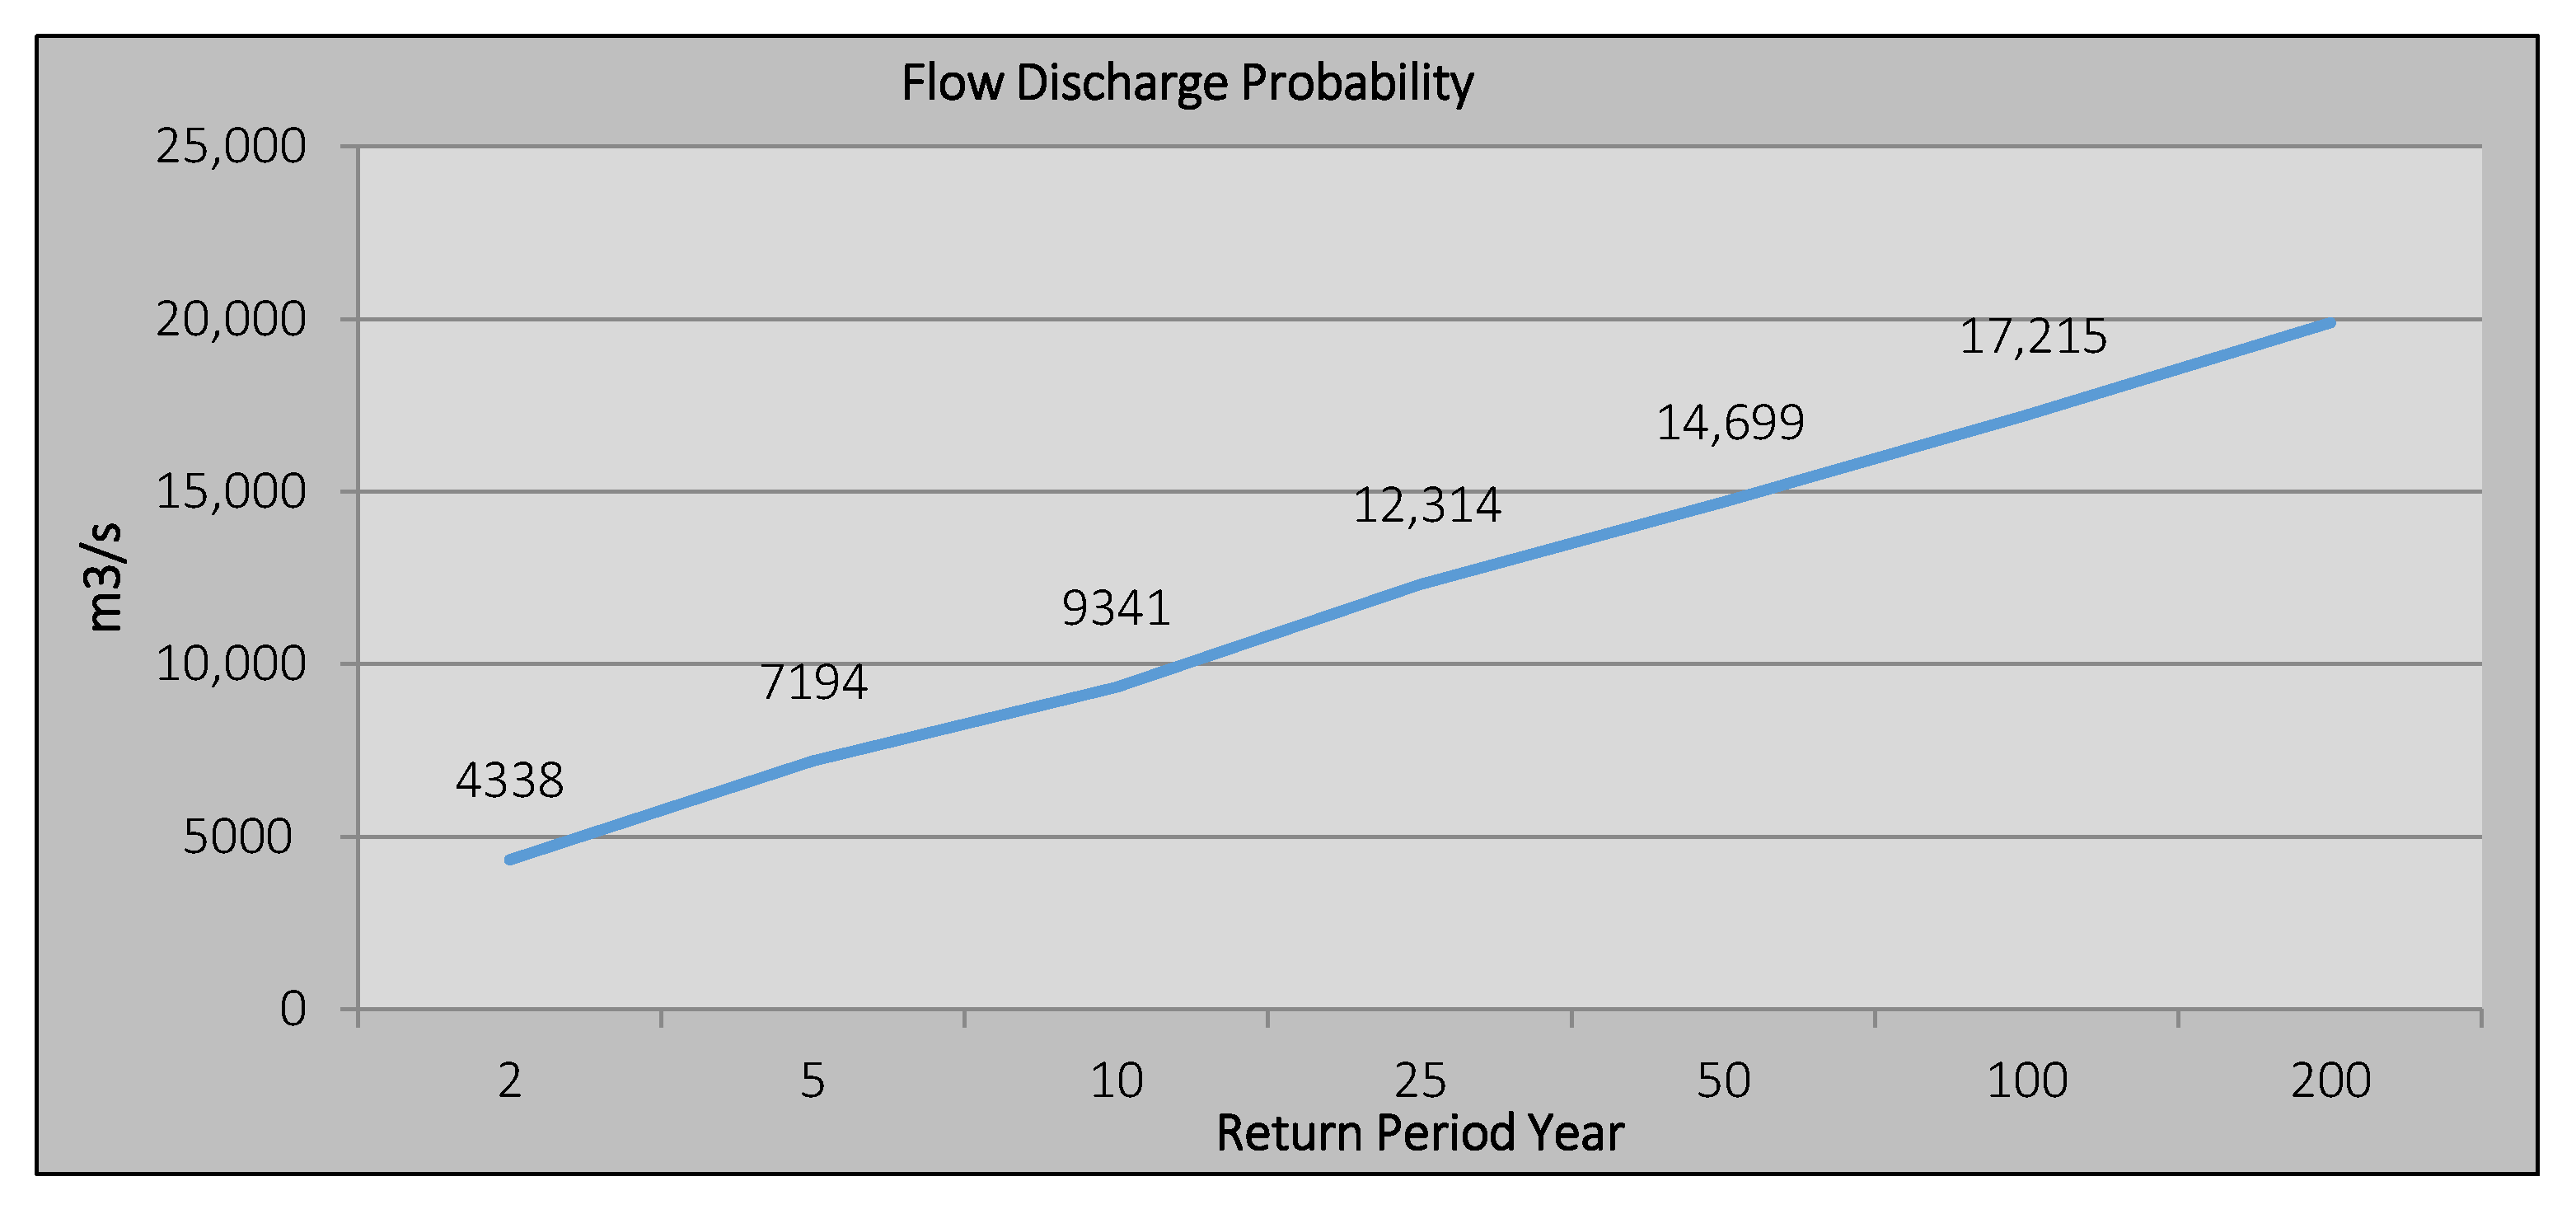
Another important determinant of the flood vulnerability of buildings is hazard intensity. As earlier emphasized, a flood vulnerability assessment is hazard-dependent; the intensity characteristics of flood hazard are essential. The collection of information regarding flood hazard is necessary. Three flood hazard attributes (flood depth, flood duration, and flood velocity) are rated relevant as indicators that define hazard intensity. Therefore, hazard intensity is the function of flood depth, duration, and water velocity. Although flood hazard probability (return period) is not considered among the indicators, it is used as a boundary condition (flood extent) to run the vulnerability assessment. It determines the buildings that are exposed to the hazard. Therefore, only the vulnerability of buildings that are within the selected return period should be computed. In this study, the 100-year return period is used, which is the maximum flood that has ever been recorded in the study area (Kota Bharu). The selected indicators and their intensity classes are presented below (see
Table 7).
Flood depth is an essential indicator among all the selected indicators. Without the impact of water depth, no damage is generated. An indication of how damaging floodwaters can be depends on their depth. The selected flood depth classes are supported by the study of [
30]. It is expected that most buildings inundated with less than 0.5 m floodwaters will stay dry. As the water level increases to 1 m, the ground floor will be covered, affecting electric and other equipment. Therefore, evacuation may be necessary. At 1 to 3 m, it is expected that the single-story building and ground floor (except elevated buildings) will be inundated with floodwater. The inhabitants have to be evacuated or move to the upper floors. Any floodwater depth of more than 3 m is classified as a total disaster. Buildings less than two stories will be completely inundated with a very high possibility of collapsing. Flood velocity is another consideration: flooding can be damaging based on its depth–velocity functions. Flooding with high depth and low velocities may cause less damage because the water is motionless or calmer (it will not generate force to move the object). On the other hand, high velocities with low flood depths may result in severe damage and risks to human lives and properties. High velocities and high flood depths are expected to produce high flood damages. In most cases, low flood velocities and low flood depths do not cause much damage, and therefore, low damage is expected. The classes for flood velocity are selected based on the available information on the Urban Storm-water Management Manual for Malaysia [
43]. Duration of flood inundation is also another critical indicator that determines flood hazard intensity. Extended flood durations tend to increase the damage of buildings and other structures. The longer the duration of the flood, the more damage it will cause to the building. This is mainly because the structures of many properties are made of porous solid materials, such as bricks, blocks, and concrete.
Furthermore, characteristics of the surrounding environment may reduce or increase the intensity of flooding on buildings and other elements-at-risk. Indicators regarding the surrounding environment are distance to water bodies, surrounding vegetation, surrounding fences, and artificial drainages. However, in this study, only the distance to major stream water bodies and proximity to main roads are rated high by the experts. This is because indicators considered for hazard intensity have already covered the surrounding environment’s significance. However, the distance to main streams and rivers is considered. Since there is evidence from post-flood studies that most of the flood-affected areas in Kota Bharu are located close to main rivers [
1,
30,
44], therefore, the distances of buildings from main streams and rivers should be considered as one of the indicators. The overflow of water bodies during the flood occurrence makes the adjacent area much more vulnerable and influences the water velocity as well. Likewise, proximity to the main road is also considered as a flood vulnerability indicator in this study. On the one hand, roads are a route, thoroughfare, or a way that has been built on land surfaces between places to allow the conveyance of people and motor vehicles. However, they also serve as drainage systems in urban areas by affecting the natural surface and subsurface drainage pattern of a watershed. In urban areas, major roads are mostly designed with an extra objective, which is removing excess rainwater from cities. Likewise, in Kota Bharu, it has been observed that most of the major roads and city roads serve as artificial drainage systems that aid rainwater to drain out of the city. The drainage system of the roads is into two parts: “drainage” and “dewatering”. Drainage refers to all the different infrastructural elements to keep the road structure dry, while dewatering covers the removal of rainwater from the surface of the road. Roads improve flood defenses by reducing the natural storage capacity of a landscape. In this study, proximity to roads is used as a factor that determines artificial drainage systems and artificial mitigation measures. The distance to major roads that are designed with artificial drainage plays a vital role in mitigating the effect of floods.
Furthermore, in this study, the expert survey’s fundamental objective is to evaluate the physical flood vulnerability indicators that affect buildings in an urban setting. As mentioned in the methodology section, indicators for physical flood vulnerability have different level of contribution to flood damage. It is not easy to assign a suitable weight to the selected indicators. Indeed, assigning the weight of indicators is a very sensitive and controversial step in developing the vulnerability index [
45,
46]. In this study, a weighting (Analytic Hierarchy Process) approach that allows expert participation is utilized to assign the weight of importance to the indicators. The whole idea of the process is to obtain the final response through the consensus of participating experts. In this situation, the participating experts determined the indicators to be included in the vulnerability assessment and their weights of vulnerability contribution. The stakeholders’ sense of ownership is likely to be improved through this approach, increasing the possibility that the results will be used.
5. Conclusions
This paper modeled the building vulnerability index using an indicator-based approach. It is a creative way to produce a flood vulnerability map, particularly at the details level. The model developed in this study is for non-monetary flood vulnerability assessment that provides a scale of flood vulnerability to element-at-risk. In anticipation of a flood disaster, the flood vulnerability index model developed in this study can be used to prevent significant losses.
Some of the disaster risk and vulnerability frameworks considered vulnerability to be independent of the magnitude of the hazard that was composed solely of susceptibility due to the element-at-risk characteristics. However, this study considers vulnerability to be a composition of both the inherent characteristics of elements-at-risk and hazard intensity. The benefit of a hazard-dependent vulnerability assessment is that it can be used to reduce the impact of floods by providing crucial information for strategy development and planning. One such piece of crucial information is to know the type of structural development that should or should not be allowed in an area with a certain probability of hazard intensity. Eliminating natural hazard is almost impossible and costly. Therefore, exposed communities must learn to live with it by developing adoption and copying capabilities, especially now that it has been proven that the magnitude and frequency of climate-related hazards are rising. The flood vulnerability modeling approach in this study can be utilized as a basis for decision making on flood proofing of buildings. Such a decision includes ensuring that all buildings within the flooding expected areas have a flood vulnerability index of less than a certain threshold. It can be achieved by replacing or renovating building structures that are highly susceptible to flood in the high hazard area.
The objective of national flood mapping in Malaysia is to have comprehensive flood risk models for future prediction, implementation of the mitigation project, and appropriate emergency response plans. Although this study is limited to a 100-year flood-return period, the basis for modeling flood vulnerability for the other flood-return period is provided. Likewise, the study explores the spatial distribution of flood vulnerability to urban buildings at risk, establishing a baseline to assess flood disaster risk. A high flood vulnerability to a building may be caused by a lack of drainage facilities, closeness to some natural drainage system or environmental settings, and its intrinsic characteristics. Evaluating these factors using the index model provides a simple answer to why some buildings are susceptible more than others.


 ,
, 


