
Water Quality Trading Framework with Uncertainty for River Systems Due to Climate and Population Characteristics

 ,
,  , and
, and
Abstract
:1. Introduction
2. Materials and Methods
2.1. Goal of Research Exercise
2.2. Climate Data Sources and Scenarios Applied
- RCP 4.5 and 8.5: These climate scenarios, using radiative forcing of 4.5 and 8.5 watts per square meter, respectively, employ the statistically downscaled climate data provided by the University of Idaho [34] derived through the Multiadaptive-Constructed Analogs [35]. Due to the temporal resolution of the data, temporal disaggregation routines were applied for yielding sub-daily climate data through an open-source package MELODIST (Version 0.1.1) [36], implementing statistical/analytical approaches for climate parameters (e.g., air temperature, solar radiation).
- RCP 6.0: This climate scenario, under a radiative forcing of 6.0 watts per square meter, used the dynamically downscaled climate data provided by the Department of Atmospheric Sciences from the University of Utah that implements the Community Climate Systems Model, Version 4 (CCSM4) on such hourly data [37].
- A.
- No-Removal Case: A simulation with no nutrient removals was implemented for deriving linkages among water quality constituents (e.g., DO, total nitrogen (TN), total phosphorus (TP)) against climatic and population growth characteristics. This case is compared against all other cases for assessing the WQT framework.
- B.
- Base Case: All point sources (e.g., WWTPs) were subject to 95% removal applied for each nutrient (e.g., nitrogen species only, phosphorus species only, CBOD only).
- C.
- Point-Nonpoint Trading under Same Constituent: All point sources in the model were subjected to 60% removal followed by a 50% removal of all nonpoint sources for each nutrient (e.g., point source TN vs. nonpoint source TN).
- D.
- Point-Nonpoint Trading upon Distinct Constituents: The trading mechanism in Case C is extended to allow trading between different nutrients, applying a 60% removal of a point source nutrient followed by a 50% removal of a distinct nonpoint source nutrient (e.g., point source TN vs. nonpoint source TP, point source TN vs. nonpoint source CBOD).
- E.
- Nonpoint Varying Levels of Removal upon All Pollutants: Levels of removal at 20, 40, 60 and 80% upon all pollutants simultaneously were sequentially applied to all tributary outfalls, storm drains and conduits. This case is included for evaluating the characteristics of climate change and population growth upon the removal of all nutrients combined for all nonpoint sources.
- F.
- Point and Nonpoint Varying Levels of Removal upon All Pollutants: Similar removal mechanisms from Case E were applied by sequentially varying levels of removal at 20, 40, 60 and 80% on all inflow nutrients. This case is applied for assessing the combination of population growth and climate change on the inflow nutrient removal.
2.3. Trading Framework with Population and Climate Change
- Since water temperature is simulated partially based on atmospheric inputs (e.g., radiative forcing, air temperature, solar radiation), climate change characteristics are represented by water temperature. Hence, this framework requires output from an in-stream water quality model that incorporates the simulation of water temperature, such as a heat model that involves atmospheric, groundwater and in-stream processes.
- Changes in population growth typically indicate changes in urbanization and land use and subsequent linkages to flow quantity and water temperature [38]. Therefore, population growth is indicated by changes in inflow quantity and water temperature relative to the historical scenario.
- The Ordinary Least-Squares Regression (OLS) time-series approach [39] was applied to all river segments for case A for the DO concentration explained by water temperature under each climate change scenario:The DO concentration at time step t, , in Equation (2) is explained by water temperature () and the predicted DO concentration at the previous time step , , by the OLS regression derived at the previous time step through coefficients a and b, respectively, with intercept c. The application of Equation (2) for associating the DO concentration to water temperature may yield a singularity matrix, so Equation (2) has been adjusted to the following relationship:Equation (3) includes an additional term that involves the summation of the concentrations of other nutrients , with , with regression coefficients . Meanwhile, for simulations with inflow quantity adjustments, an OLS regression with time-series approach is applied for linking changes in DO concentration explained by water temperature and by changes in segment inflow quantity, yielding the following relationship:The change in DO concentration at time step t, () is associated with the change in water temperature at time step t (), the change in inflow quantity at time step t and the predicted change in DO concentration at the previous time step () through regression coefficients a, b and c, respectively, with intercept d. For the simulations with flow quantity adjustments, population growth characteristics are incorporated in Equation (4) through (e.g., , etc.), with fut. representing simulations with inflow quantity adjustments and hist. indicating those without such inflow quantity adjustments. At the same time, if the inflow quantity adjustments appear to exhibit relatively minor effects on water temperature, such as yielding a relatively small value, then the application of Equation (4) may yield a singular matrix, where the regression coefficients cannot be evaluated. Consequently, was substituted with if for any time step t is within 1% of , or .
- OLS regression through the application of simultaneous equations [40] with time-series analyses [39] is applied for associating each nutrient (TN, TP, CBOD) against other nutrients (e.g., TN against other nutrients, TP against other nutrients, etc.) and climate change characteristics. The following relationship is employed for simulations for which no adjustments in inflow quantity are applied for describing the nutrient concentration by Case A.As indicated in Equation (5), the concentration of nutrient at current time step t is associated with water temperature at time step t, the predicted nutrient concentration from time step () and the concentrations of other nutrients j at time step t () described by coefficients a, b and c, respectively, with intercept . Similar procedures for incorporating population growth characteristics (e.g., Equation (2) for changes in DO concentration) are implemented per climate change scenario. Hence, for simulations with adjustments upon inflow quantity (e.g., 15% increase, 30% increase), the following relationship is implemented for associating the change in each nutrient concentration against climate change indicated by water temperature, changes in other nutrient concentrations and changes in inflow quantity.As indicated in Equation (6), the change in nutrient concentration for a nutrient at time step t, , is explained by the change in water temperature, change in segment inflow quantity, the predicted change in nutrient concentration from a previous time step , and the change in nutrient concentrations for other nutrients , for which , described by regression coefficients ,, and , respectively, through intercept . Meanwhile, similar to step (1), may be substituted with simply if .
- The nutrient concentration (TN, TP, CBOD) for each removal case (Cases E to F) is compared against the nutrient concentration under the no-removal case (e.g., Case A) for computing the difference through the following relationship.As indicated in Equation (7), the difference for each removal case is computed based on the concentration under each removal case, , relative to the no-removal case A, , for each nutrient .
- For each removal case k, the difference upon each removal level and all climate change scenarios (RCP 4.5, 6.0, 8.5) is implemented for suggesting relationships among climate change and removal level upon each inflow (e.g., WWTP, tributary). For the simulations without any adjustments upon inflow quantity, for each nutrient is associated with water temperature and other nutrients through the OLS regression with time-series analyses, yielding the following relationship under each time step t.As indicated in Equation (8), for each removal case k, the removal at the current time step t for each nutrient is described by water temperature, the predicted removal for nutrient from time step () and the removal for other nutrients for which described by coefficients a, b and , respectively, with intercept . In contrast with the application of Equations (1)–(6) that derives relationships on all river segments per time step and per RCP scenario, Equation (8) is implemented for all inflow segments subject to each of removal cases D to H per climate change projection. Meanwhile, if a removal case k does not involve the removal of all constituents (TN, TP and BOD) simultaneously (e.g., Case G), the application of Equation (8) on associating the removal amount for nutrient , with the removal amount for nutrient for which may potentially yield singular matrices (e.g., for nutrient , for nutrient for which ). Hence, for a removal case k that does not involve the removal of all constituents (TN, TP, and BOD) simultaneously, the removal amounts for nutrient , and/or the removal amount for nutrient for which , from Equation (7) will be replaced with the concentration of nutrient and/or , and/or , respectively. For simulations with inflow quantity adjustments, a similar application as the relationship indicated in Equation (4) is employed for associating the difference in nutrient concentration against water temperature, change in inflow quantity and changes upon other nutrient concentrations. The following relationship is employed for each removal case k with population growth characteristics upon levels of removal per nutrient.As indicated in Equation (9), the change in removal for nutrient and removal case k involves the removal from futuristic land use is subtracted by the removal from the historical land use. Such change in removal is associated with change in water temperature among the futuristic and historical land use, the change upon point/nonpoint source inflow, the predicted change in removal from the previous time step and the change in removal for other nutrients . Meanwhile, Equation (9) may be modified per removal case through substituting the change in removal for nutrient and/or , and , respectively, substituted with the change in concentration from the futuristic relative to the historical population growth projection, and/or , for a removal case k that may not involve the removal fractions applied upon all nutrients (TN, TP, BOD) simultaneously. Meanwhile, similar to steps (1) and (2), may be substituted with simply for Equation (9) if for any time step.
- The procedures in steps (1) to (4) above attempt suggesting climate change characteristics and population growth separately. For instance, Equations (3), (5) and (8) address climate change while Equations (4), (6) and (9) address population growth. The WQT framework extension further implements similar applications as Equations (4), (6) and (9) for predicting climate change and population growth combined through the following relationships.Equations (10)–(12) derive similar relationships as those from Equations (4), (6) and (9), respectively, but do not apply adjustments based on the historical population growth.
- The results derived from (1) to (4) were implemented into the WQT framework for determining levels of adjustment upon trade ratios as follows.
- (a)
- Uncertainty for Delivery Trade Ratio Component: The regression coefficient a from Equation (8) suggests the relationship among levels of removal against water temperature for the inflows, with positive values indicating increasing nutrient removal against increasing water temperatures. Hence, the regression coefficient a represents the uncertainty for trade ratios due to delivery characteristics from climate change per nutrient. Furthermore, the regression coefficients a and b from Equation (9) suggest relationship among levels of removal against change in water temperature and flow quantity from the futuristic relative to historical population growth projections. For instance, positive values for regression coefficients a and/or b from Equation (9) seem to suggest increasing levels of removal against increasing water temperature and/or flow quantity, respectively, under the futuristic relative to the historical population growth projections. Hence, the regression coefficients a and b from Equation (9) are applied for suggesting uncertainty in trade ratios for delivery due to population growth characteristics per nutrient.
- (b)
- Uncertainty for Downstream Trade Ratio Component: For the OLS regression coefficients obtained through simultaneous equations in (2), positive values for the regression coefficient a for water temperature in Equation (5) suggest that increasing water temperature increases the nutrient concentration, yielding greater removal needs for water quality benefit. Meanwhile, for the OLS regression coefficients obtained in (1), positive values for the regression coefficient a for water temperature in Equation (2) suggest that increasing water temperature increases the DO concentration. Therefore, for each climate change scenario, the regression coefficient a in Equation (2) is subtracted by the coefficient a in Equation (5) for yielding uncertainty in trade ratio due to downstream under climate change per nutrient. At the same time, the regression coefficient b in Equation (4) for DO suggests relationships among DO and flow quantity, with positive values for b implicating increasing DO concentrations under increasing additional flow quantity from the futuristic relative to historical population growth. Meanwhile, positive values for the regression coefficient b in Equation (6) suggest increasing nutrient concentrations under increasing additional flow quantity from the futuristic relative to historical population growth projections. Hence, the regression coefficients a and b in Equation (3) for DO are subtracted by the coefficients a and b from Equation (5) for other nutrients. For this exercise, this result is defined as suggesting uncertainty in trade ratio due to downstream under population growth characteristics per nutrient. Meanwhile, the regression coefficients a and b in Equation (10) for DO are further subtracted by the coefficients a and b from Equation (11) for other nutrients for suggesting uncertainty in trade ratio for downstream toward combining climate change and population growth characteristics per nutrient.
- (c)
- Uncertainty for Equivalency Trade Ratio Component: The OLS regression coefficients in Equations (5)–(9), (11) and (12) provide relationships among a nutrient against all other nutrients for suggesting uncertainty for equivalency ratios upon the WQT framework.
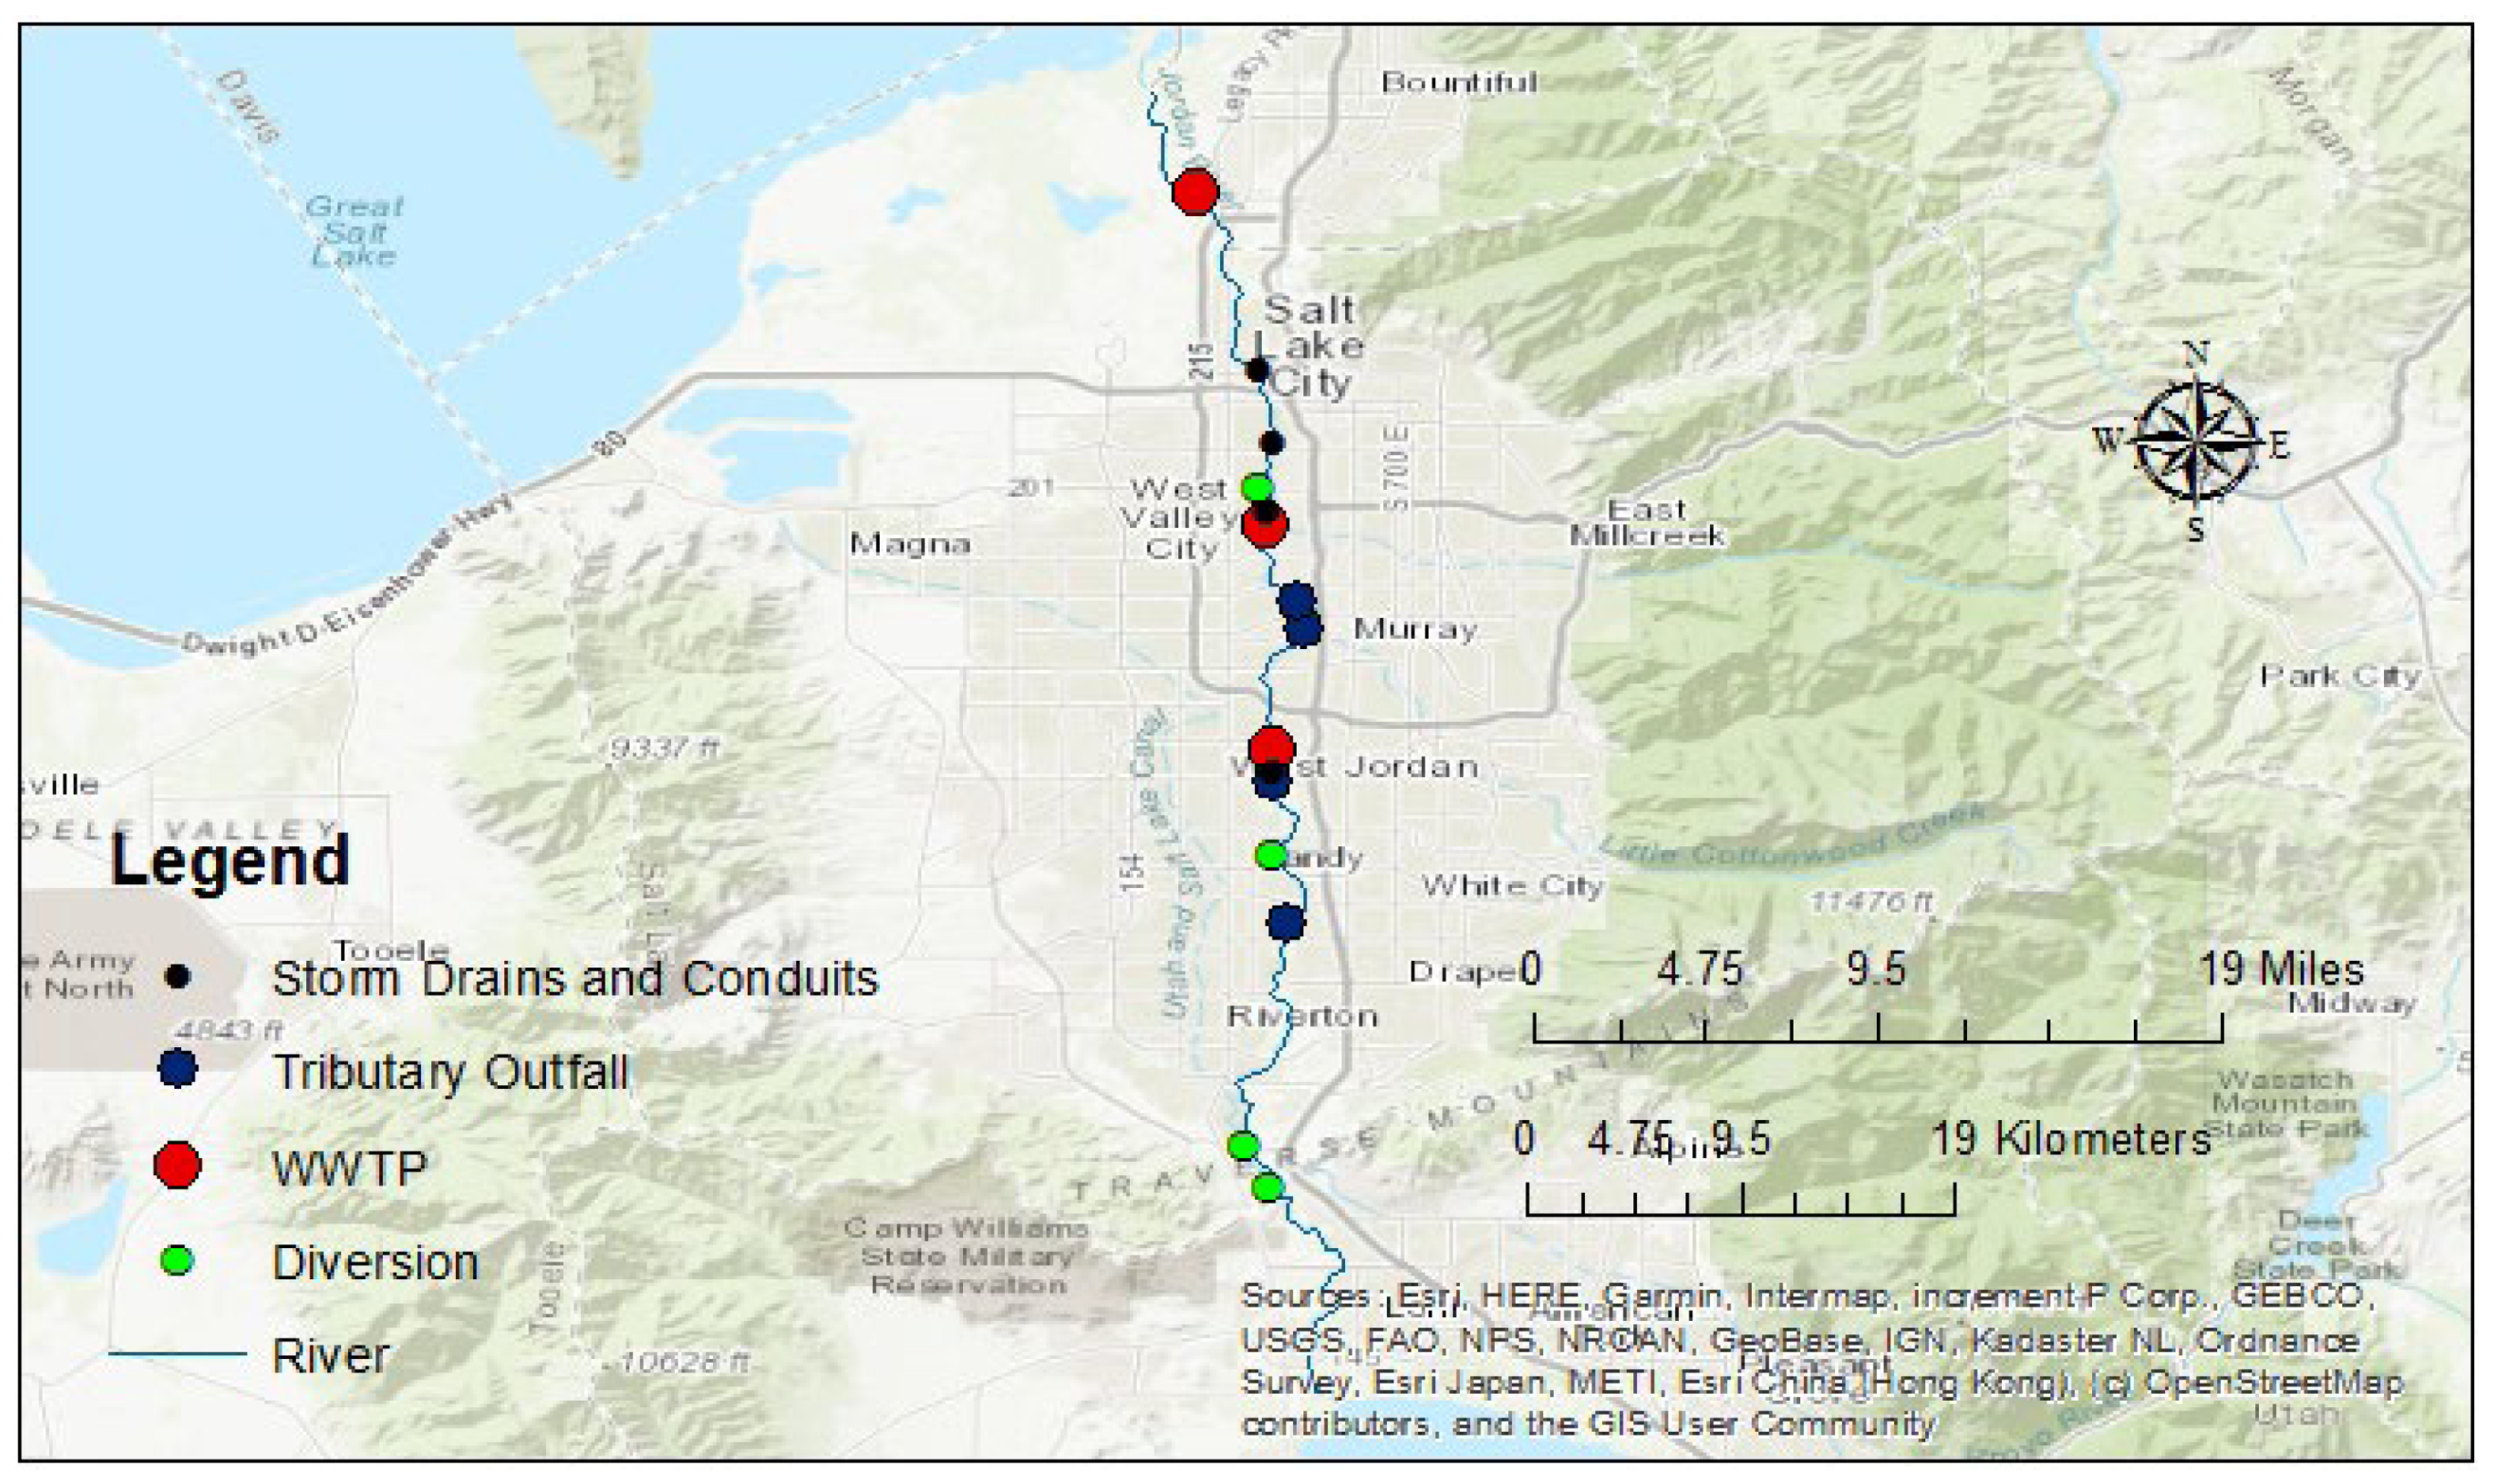
2.4. Case Study: Jordan River in Salt Lake City, UT
3. Results
3.1. Margins of Safety for Climate Change Characteristics
3.2. Margins of Safety for Population Growth Characteristics
3.3. Trade Ratios with Climate Change and Population Growth Characteristics
4. Discussion
4.1. Implications on Climate Change Characteristics upon WQT Conceptual Framework
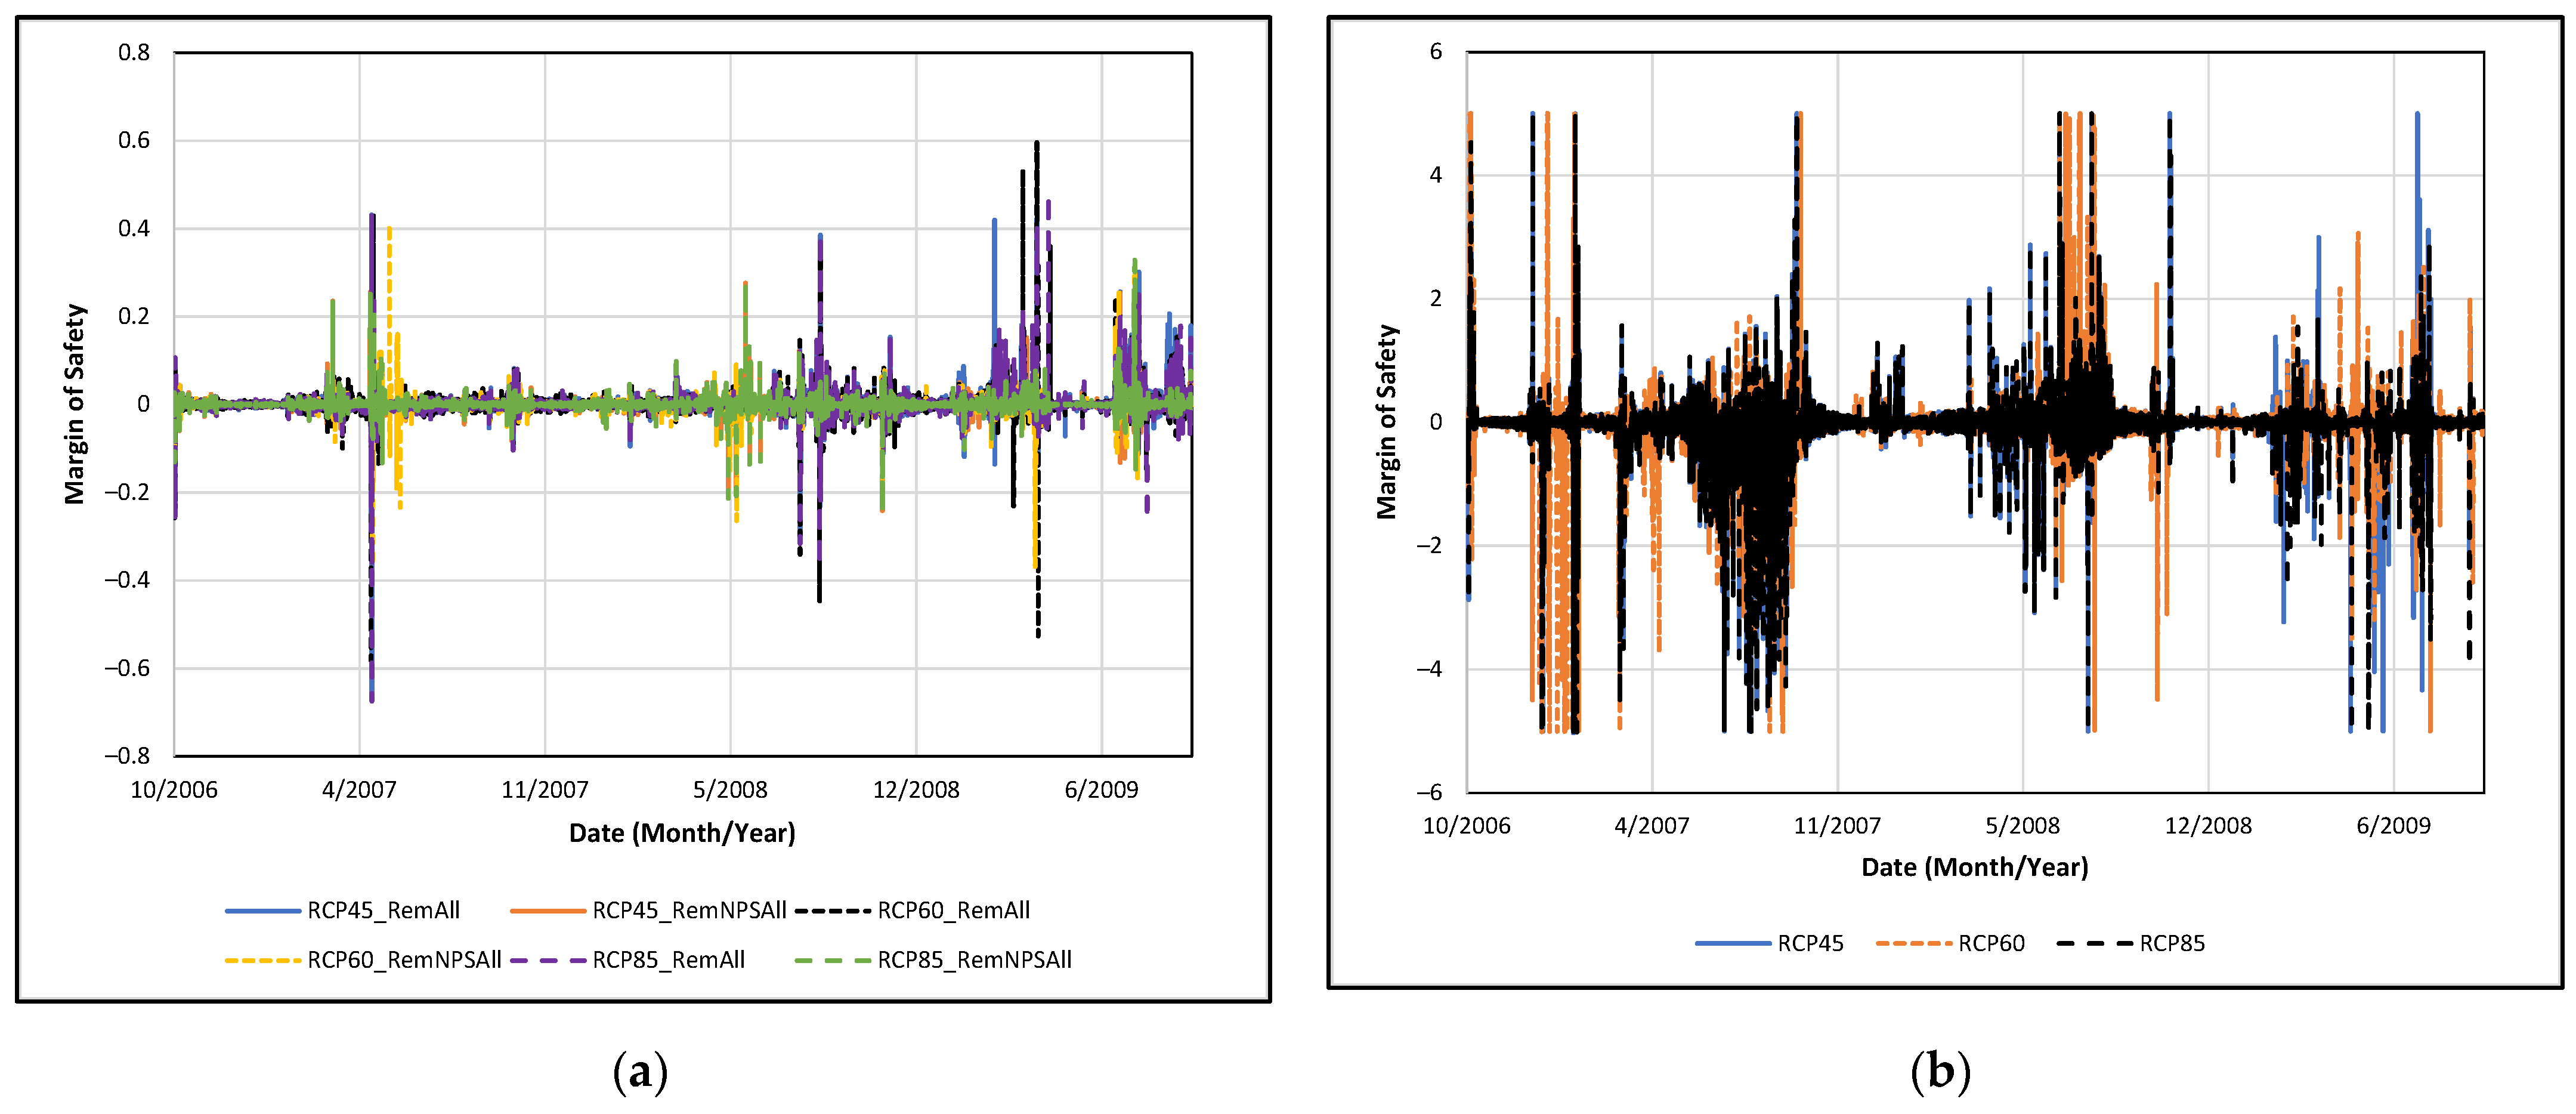
- Delivery Trade Ratio Component: Margins of safety for the delivery trade ratio component indicate the effects of water temperature on the level of removal achieved from a trade. Margins of safety above 0 suggest higher levels of removal expected from increasing water temperature, hence implicating improvement on levels of pollutant reduction credit achieved from a WQT program. However, negative margins of safety suggest lower levels of removal expected from increasing water temperature, indicating decreases upon such levels of reduction from a WQT program. The framework results over the Jordan River, UT suggest generally minor adjustments for the margins of safety among all RCP projections and upon all removal cases (e.g., case E over the performance of tributary outfalls, storm drains and conduits; case F over all inflows). For instance, all RCP projections on all removal cases suggest margins of safety within a magnitude of ±0.2 for a theoretical WQT TN buyer (e.g., Figure 2a) for most of the simulation period. On the other hand, relative extremes upon the margins of safety for the delivery component for climatic characteristics are observed involving RCP 6.0 and 8.5 that suggest an increase and decrease, respectively, by nearly 0.6 for WQT TN buyer. Nevertheless, conclusions regarding the margins of safety on the delivery trade ratio component ranging within to 0.2 for WQT TN buyer are likely attributed to uniform inflow data applied among all RCP climate projections. However, climate change is suggested to exacerbate pollutant loadings through effects on system water quantity performance [15,16] from projected changes in precipitation patterns [17]. Therefore, such relatively minor delivery trade ratios adjustments for climatic characteristics for WQT TN buyer appear to be only relevant for this exercise. Further studies are recommended for determining more exact relationships between climate characteristics and pollutant loadings, potentially developing upstream water quality and quantity models for assessing margins of safety impacts on the delivery trade ratio component.
- Downstream Trade Ratio Component: Margins of safety for the downstream trade ratio component for climate characteristics demonstrate the effects of water temperature on levels of water quality improvement achieved by a WQT program. Negative or positive values indicate decreased or increased levels of water quality improvement, respectively, expected from a WQT program in terms of increased water temperatures. The framework suggests greater margins of safety for the downstream component relative to those for the delivery trade ratio, implicating more significant impacts upon the water quality performance. All three RCP projections suggest margins of safety with magnitudes greater than 2 for all WQT buyer constituents (e.g., Figure 2b for WQT buyer TN) over most of the simulation. In particular, all climate projections suggest margins of safety nearly below from April to November 2007, indicating adverse effects on water quality performance. On the other hand, except for Water Year 2009, relatively minor variability is observed among the RCP projections involved for all nutrients subject to a trade.
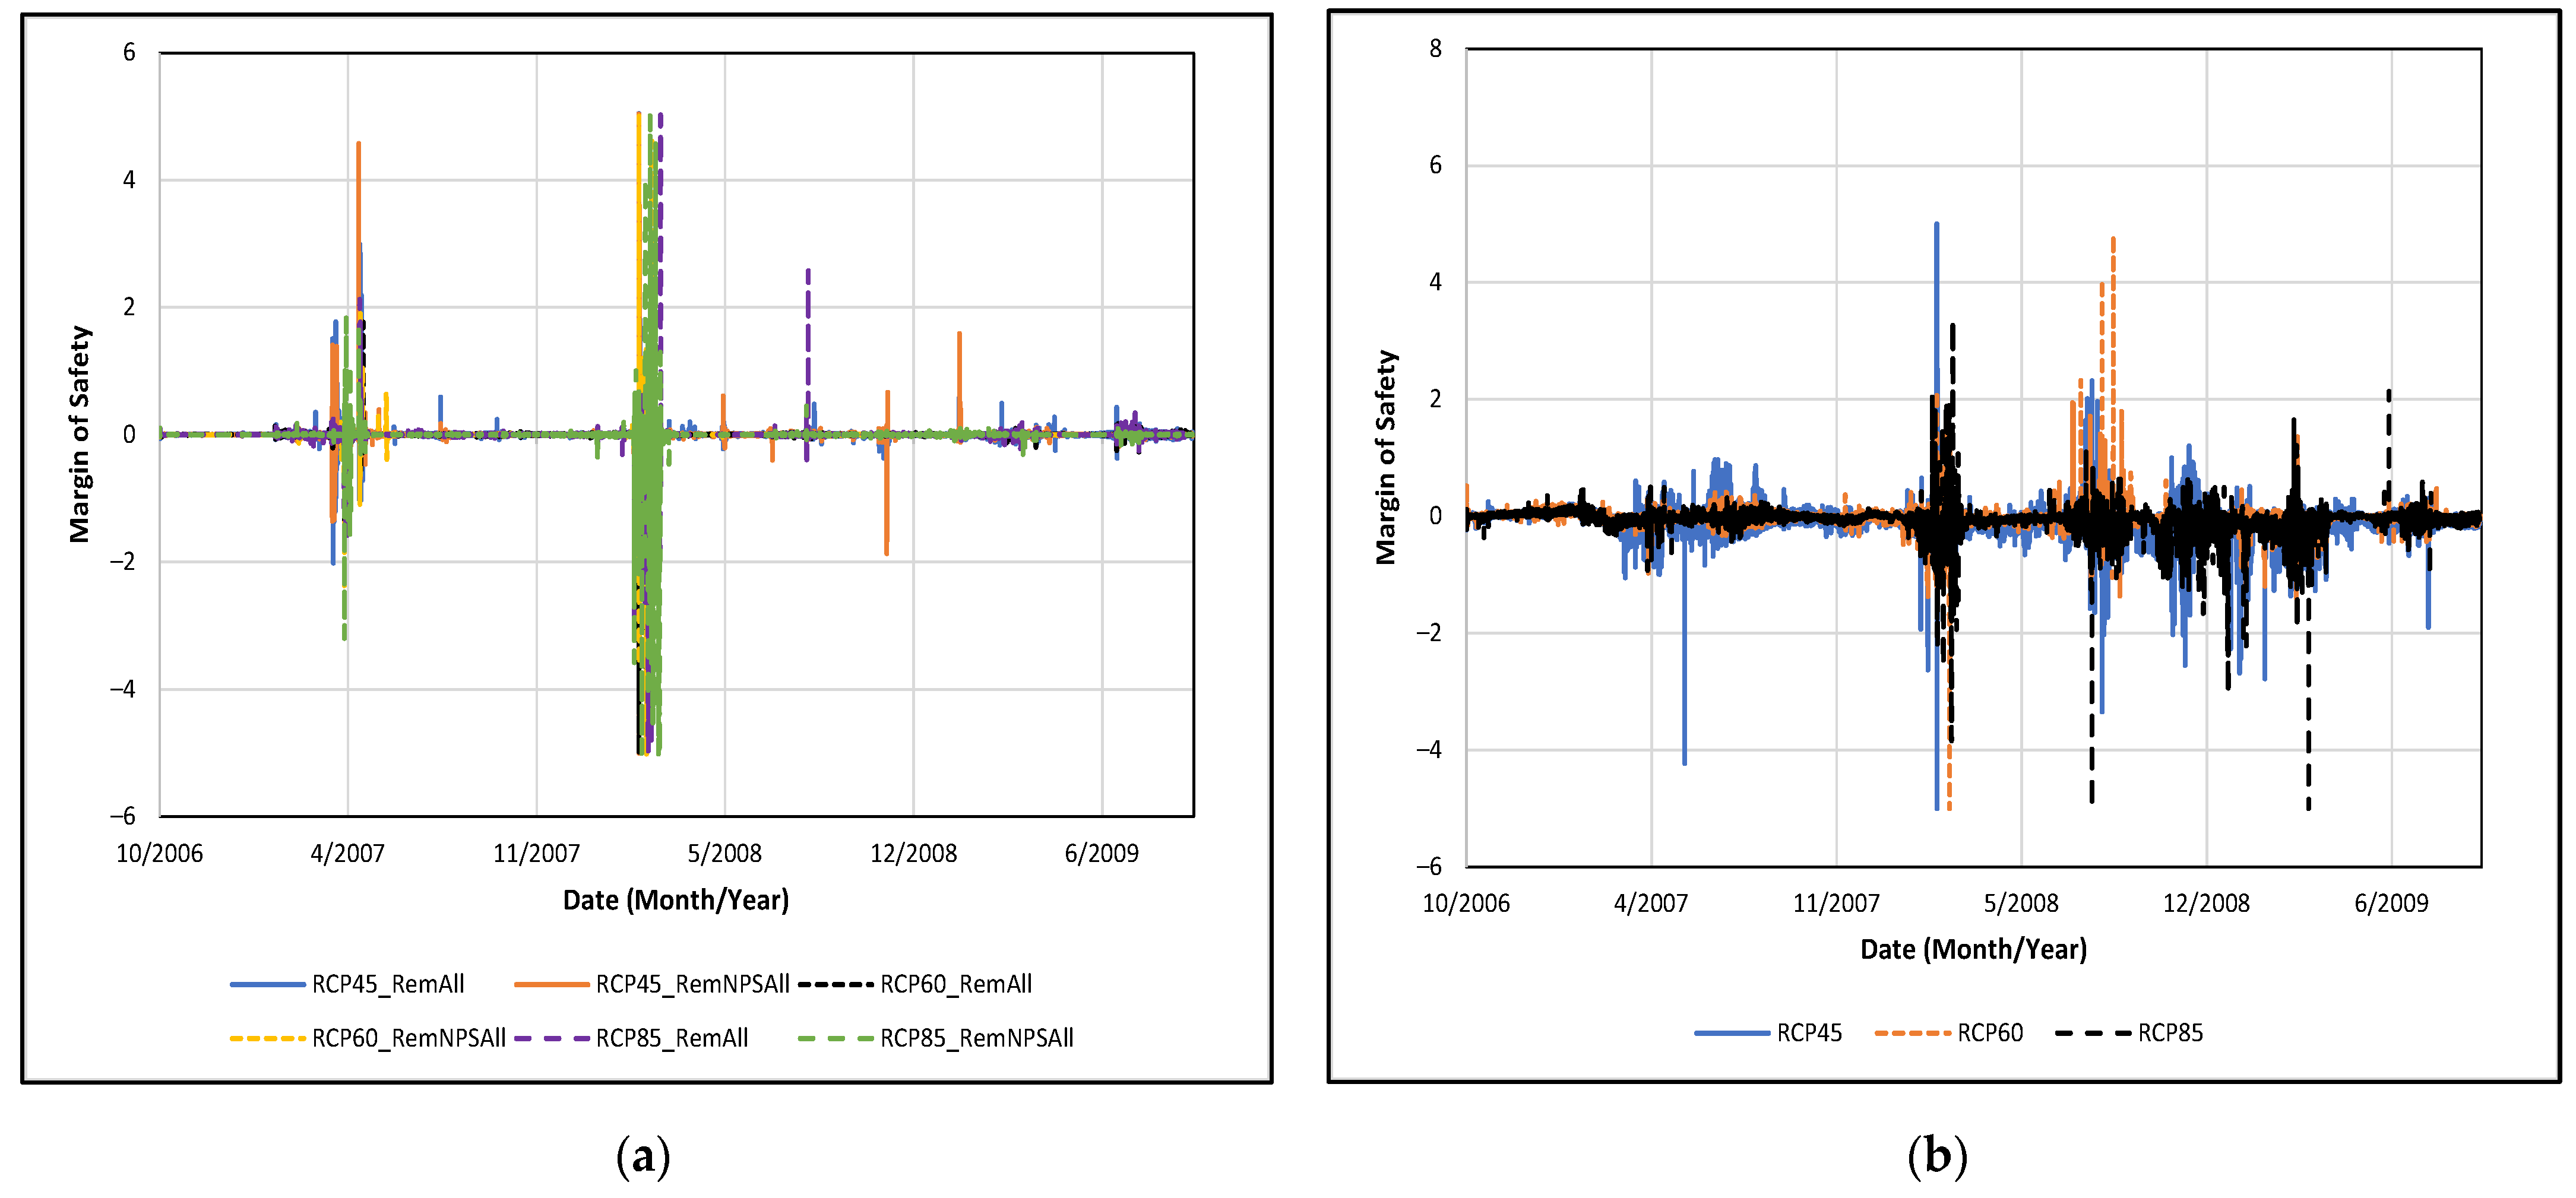
- Equivalency Trade Ratio Component: Margins of safety for the climate equivalency trade ratio component show the effects of water temperature on the levels of removal and water quality improvement achieved from a trade among distinct nutrients relative to a WQT program on a single constituent. Positive or negative margins of safety for buyer TN to seller TP suggest increased or decreased levels of removal, respectively, and water quality improvement achieved from a WQT program on increasing water temperature relative to a trade involving only TN. Significant oscillations of the suggested margins of safety are observed in conducting trading among WQT TN buyer to TP seller (Figure 3a), suggesting the relatively high sensitivity of trading among buyer TN to seller TP as compared to among buyer-to-seller TN. Such oscillations appear to rather not be observed for such suggested margins of safety among WQT buyer TN to seller BOD (Figure 3b). On the other hand, minor variability appears to be observed among the climate projections involved among all WQT buyer-to-seller nutrients. Such characteristics suggest the independence of the margins of safety upon all trade ratio components from the RCP projection applied. However, similar to the characteristics for the margins of safety for delivery and downstream components, such conclusions appear to simply be individualized toward the simulations only.
4.2. Implications on Population Characteristics upon WQT Conceptual Framework
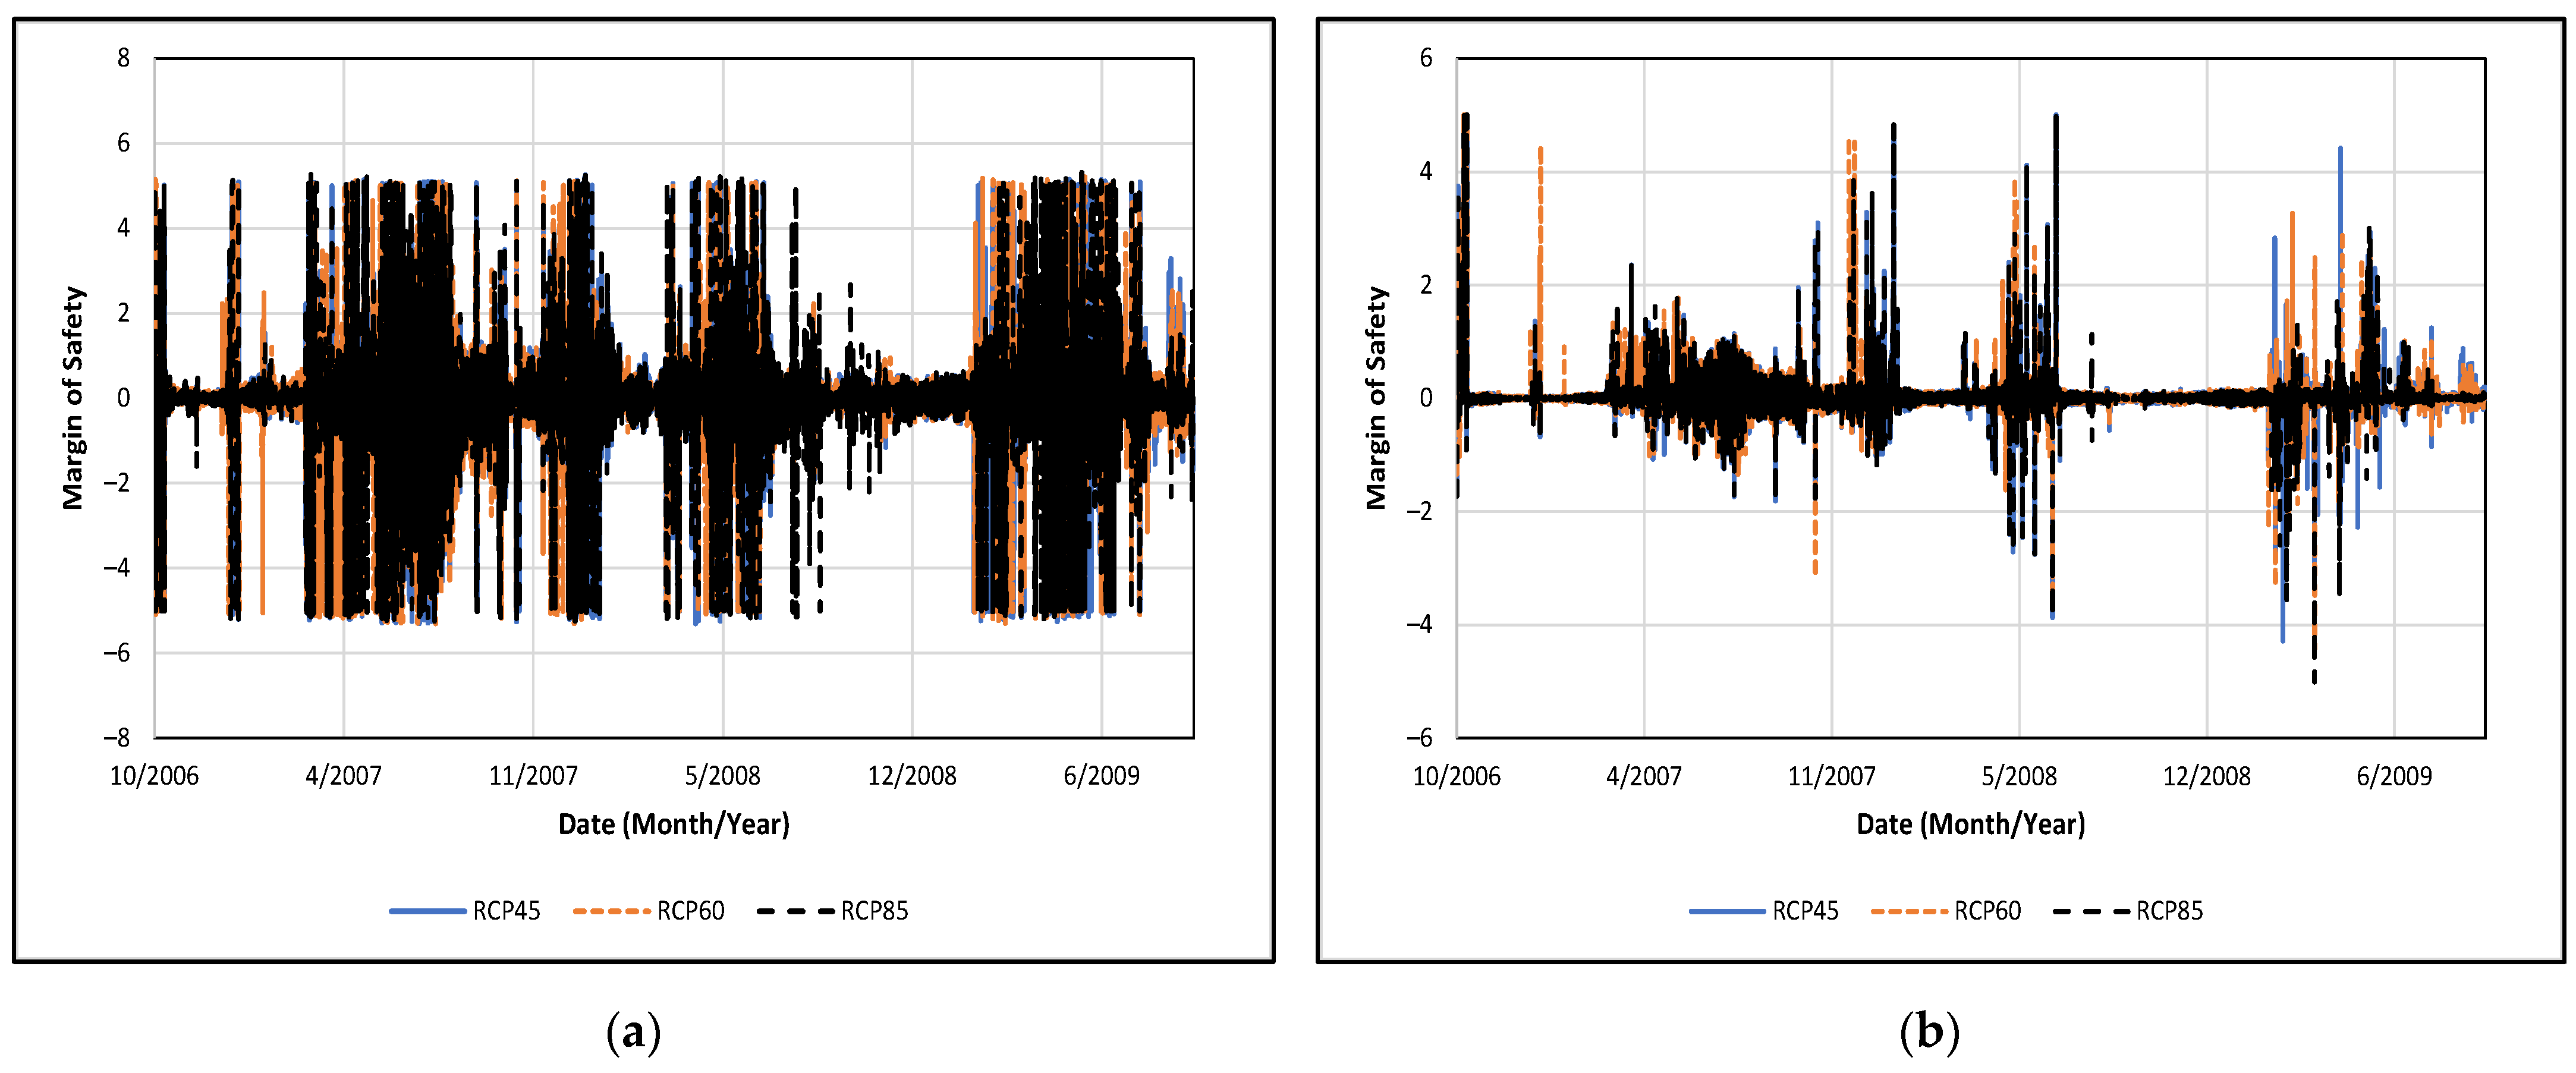
- Delivery Trade Ratio Component: Margins of safety for the delivery trade ratio component suggest the effects of population and inflow changes on levels of removal achieved from a trade. Positive or negative margins of safety suggest improved or decreased levels of removal achieved by a trade, respectively, under increasing inflow quantity. Population changes, represented by increasing the inflow sources by 1.15 followed by 1.30, suggest minor to rather negligible margins of safety on the delivery trade ratio component. For instance, except for a few time periods that yield high margins of safety, values generally range within magnitudes of 1 (e.g., Figure 4a). However, such conclusions may require a more comprehensive assessment of population impacts on the effectiveness of pollutant reduction credit, particularly for implications of futuristic growth. Addressing population characteristics on pollutant reduction credit may require an assessment of futuristic growth impacts upon projected pollutant loadings, such as increasing BOD loads under increasing levels of urbanization [14]. Hence, characteristics for the margins of safety appear rather individualized over the simulation period.
- Downstream Trade Ratio Component: Margins of safety for the downstream trade ratio component illustrate the effects of population and inflow changes on the levels of water quality improvement achieved from a trade. Positive or negative values for the margins of safety suggest increased or deteriorated levels of water quality improvement achieved by a trade, respectively, under increasing inflow quantity. The margins of safety for the Jordan River suggest deteriorating water quality performance against increases upon inflows. Such characteristics are observed among all climate projections (e.g., Figure 4b for WQT buyer TN), with the margins of safety generally falling below 0 that thus suggest decreases on the downstream trade ratio components for levels of water quality improvement. On the other hand, since inflow concentrations remain uniform among the inflow adjustments and all RCP projections, further analyses linking climate, population and system performance appear recommended before such conclusions can be obtained.
- Equivalency Trade Ratio Component: Margins of safety for the equivalency component implicate the effects of population and inflow changes upon the levels of removal and water quality improvement achieved by a trade among distinct nutrients relative to a WQT program involving a single constituent. For instance, positive or negative margins of safety for buyer TN to seller TP suggest increased or reduced levels, respectively, of removal and water quality improvement achieved by a trade under increasing inflow quantity relative to a WQT program involving only TN. The suggested margins of safety for addressing population and inflow changes appear dependent upon the buyer and seller nutrients subject to the trade followed by the climate projection. For instance, relatively greater oscillations appear observed among WQT buyer TN to seller TP (Figure 5a), ranging within the maximum magnitude (e.g., 5) as compared to buyer TN to seller BOD (Figure 5b) that generally falls within magnitudes of 2 for all RCP climate projections. Hence, such characteristics suggest the need for applying temporally-variant margins of safety for addressing changes in population upon such trade ratios, particularly for WQT programs that involve trading among distinct nutrients.
4.3. Implications on Combined Climate Change and Population Growth Characteristics upon WQT Conceptual Framework
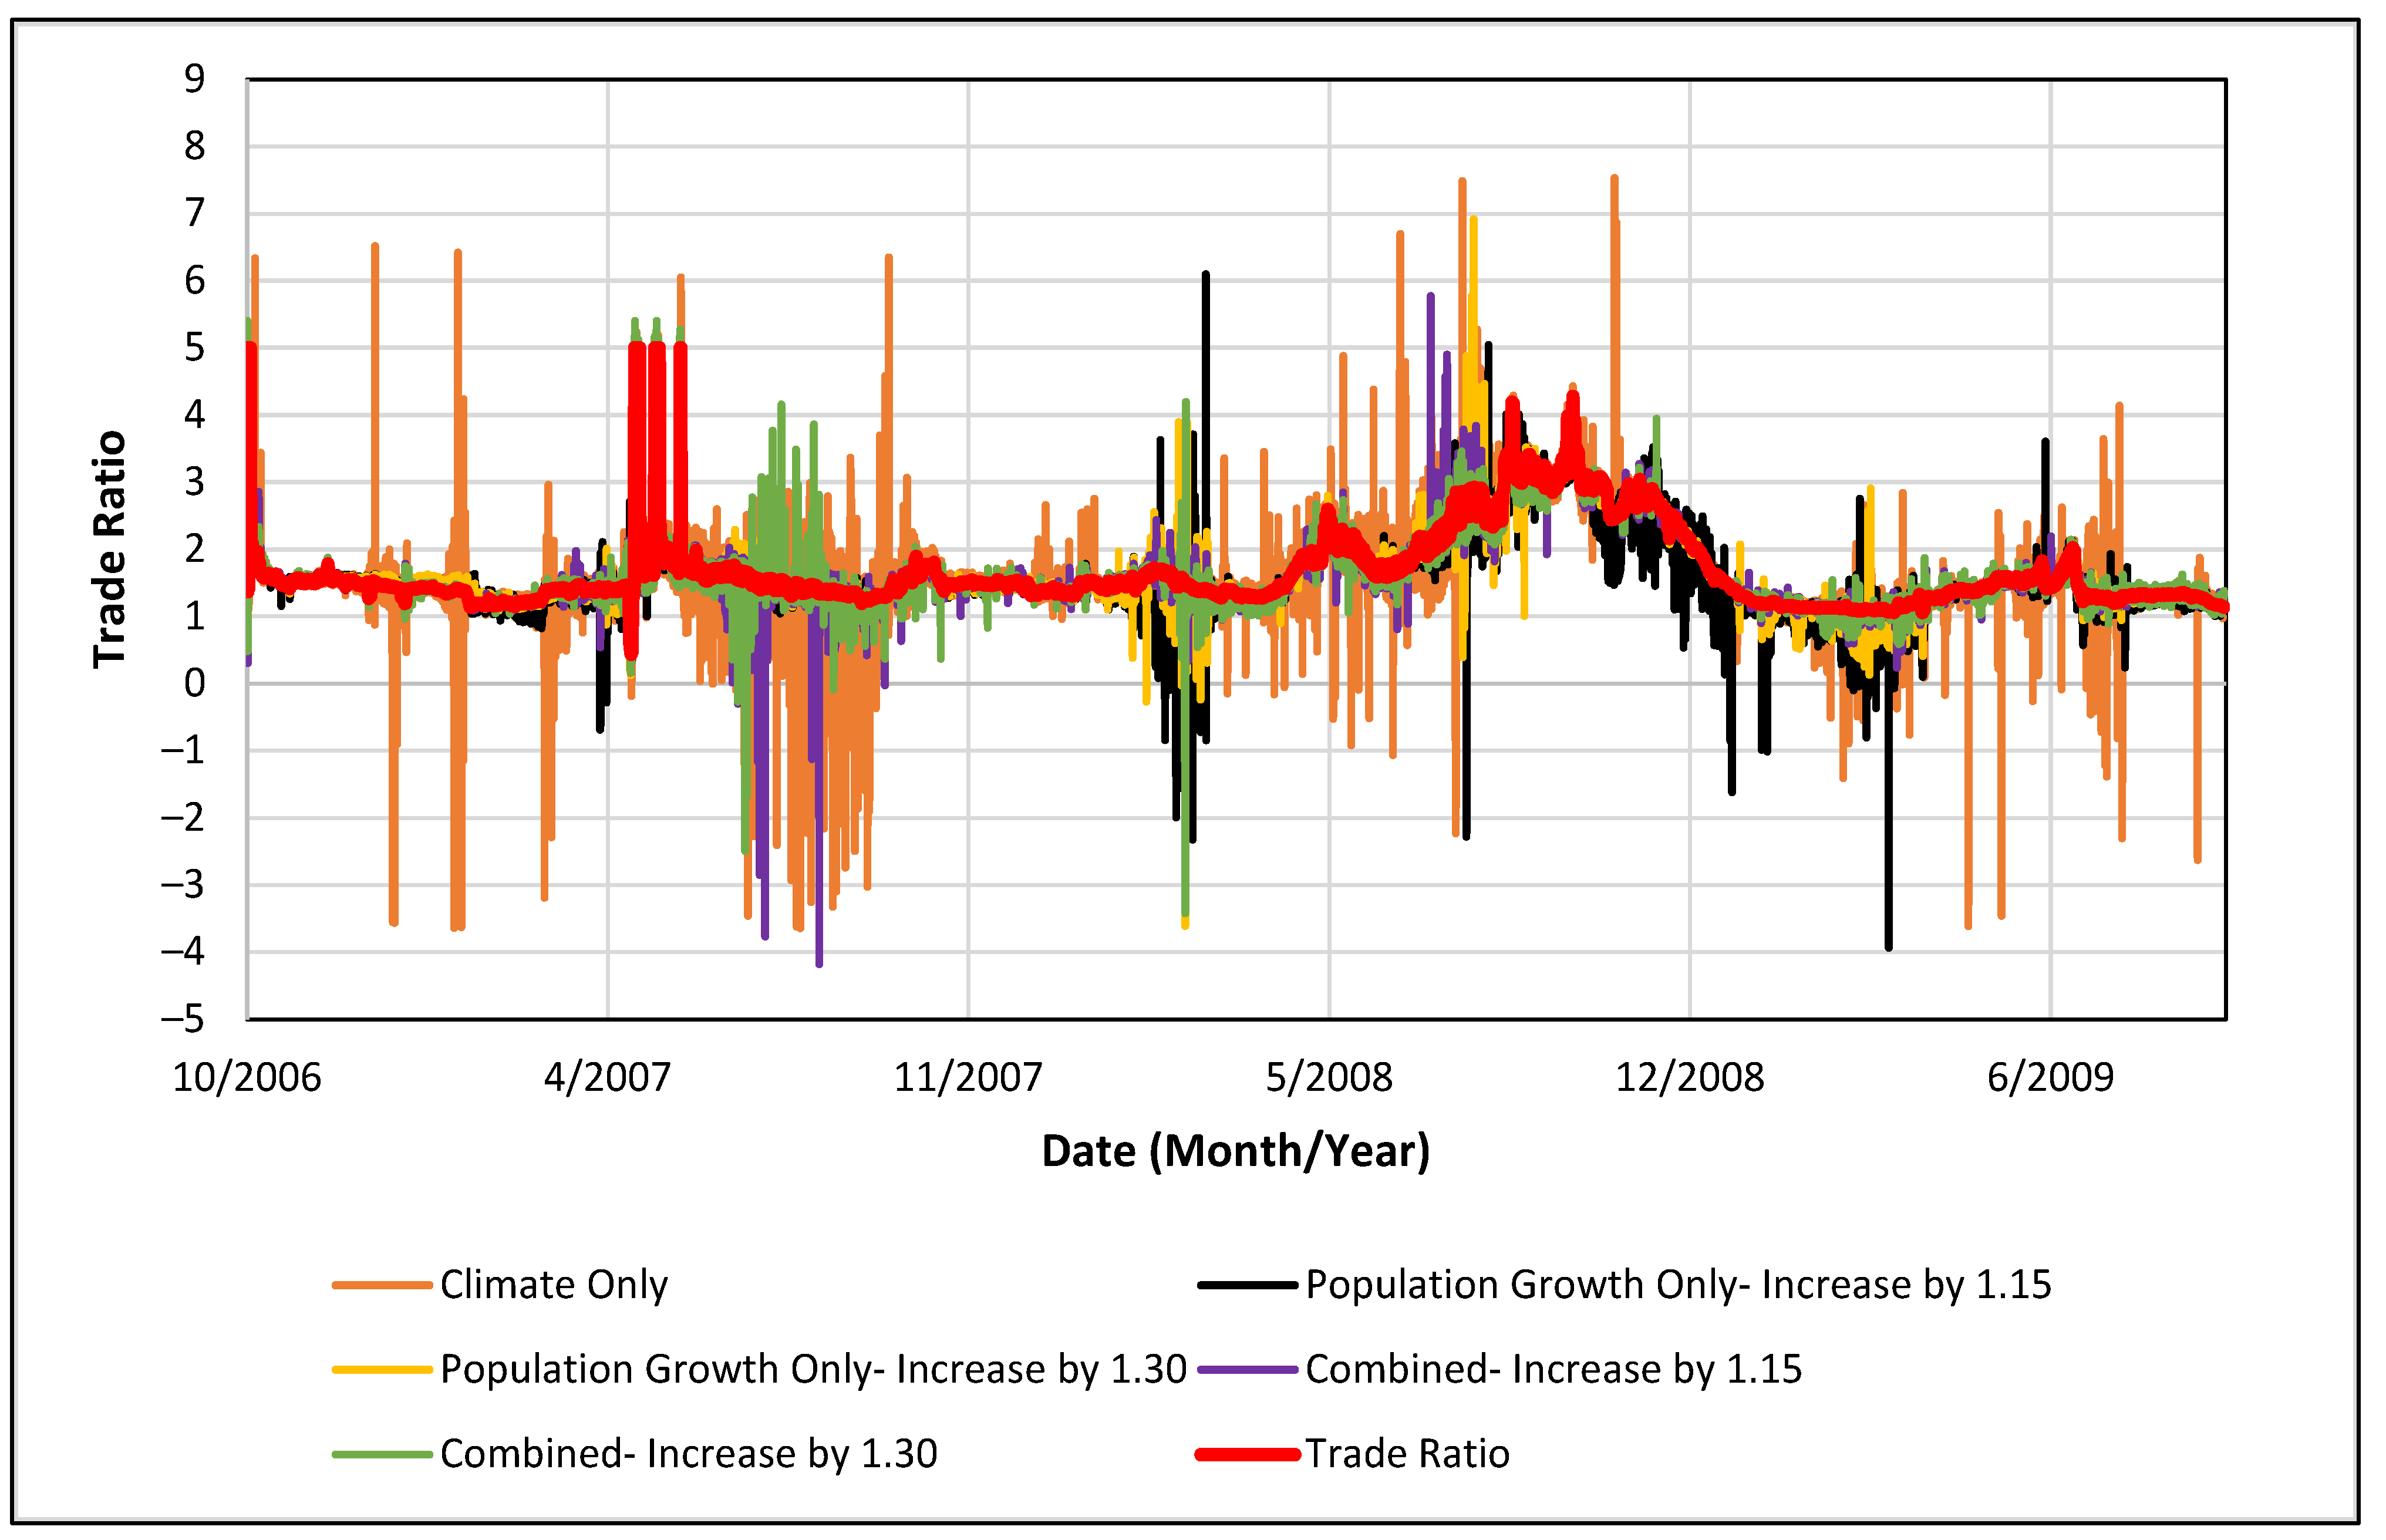
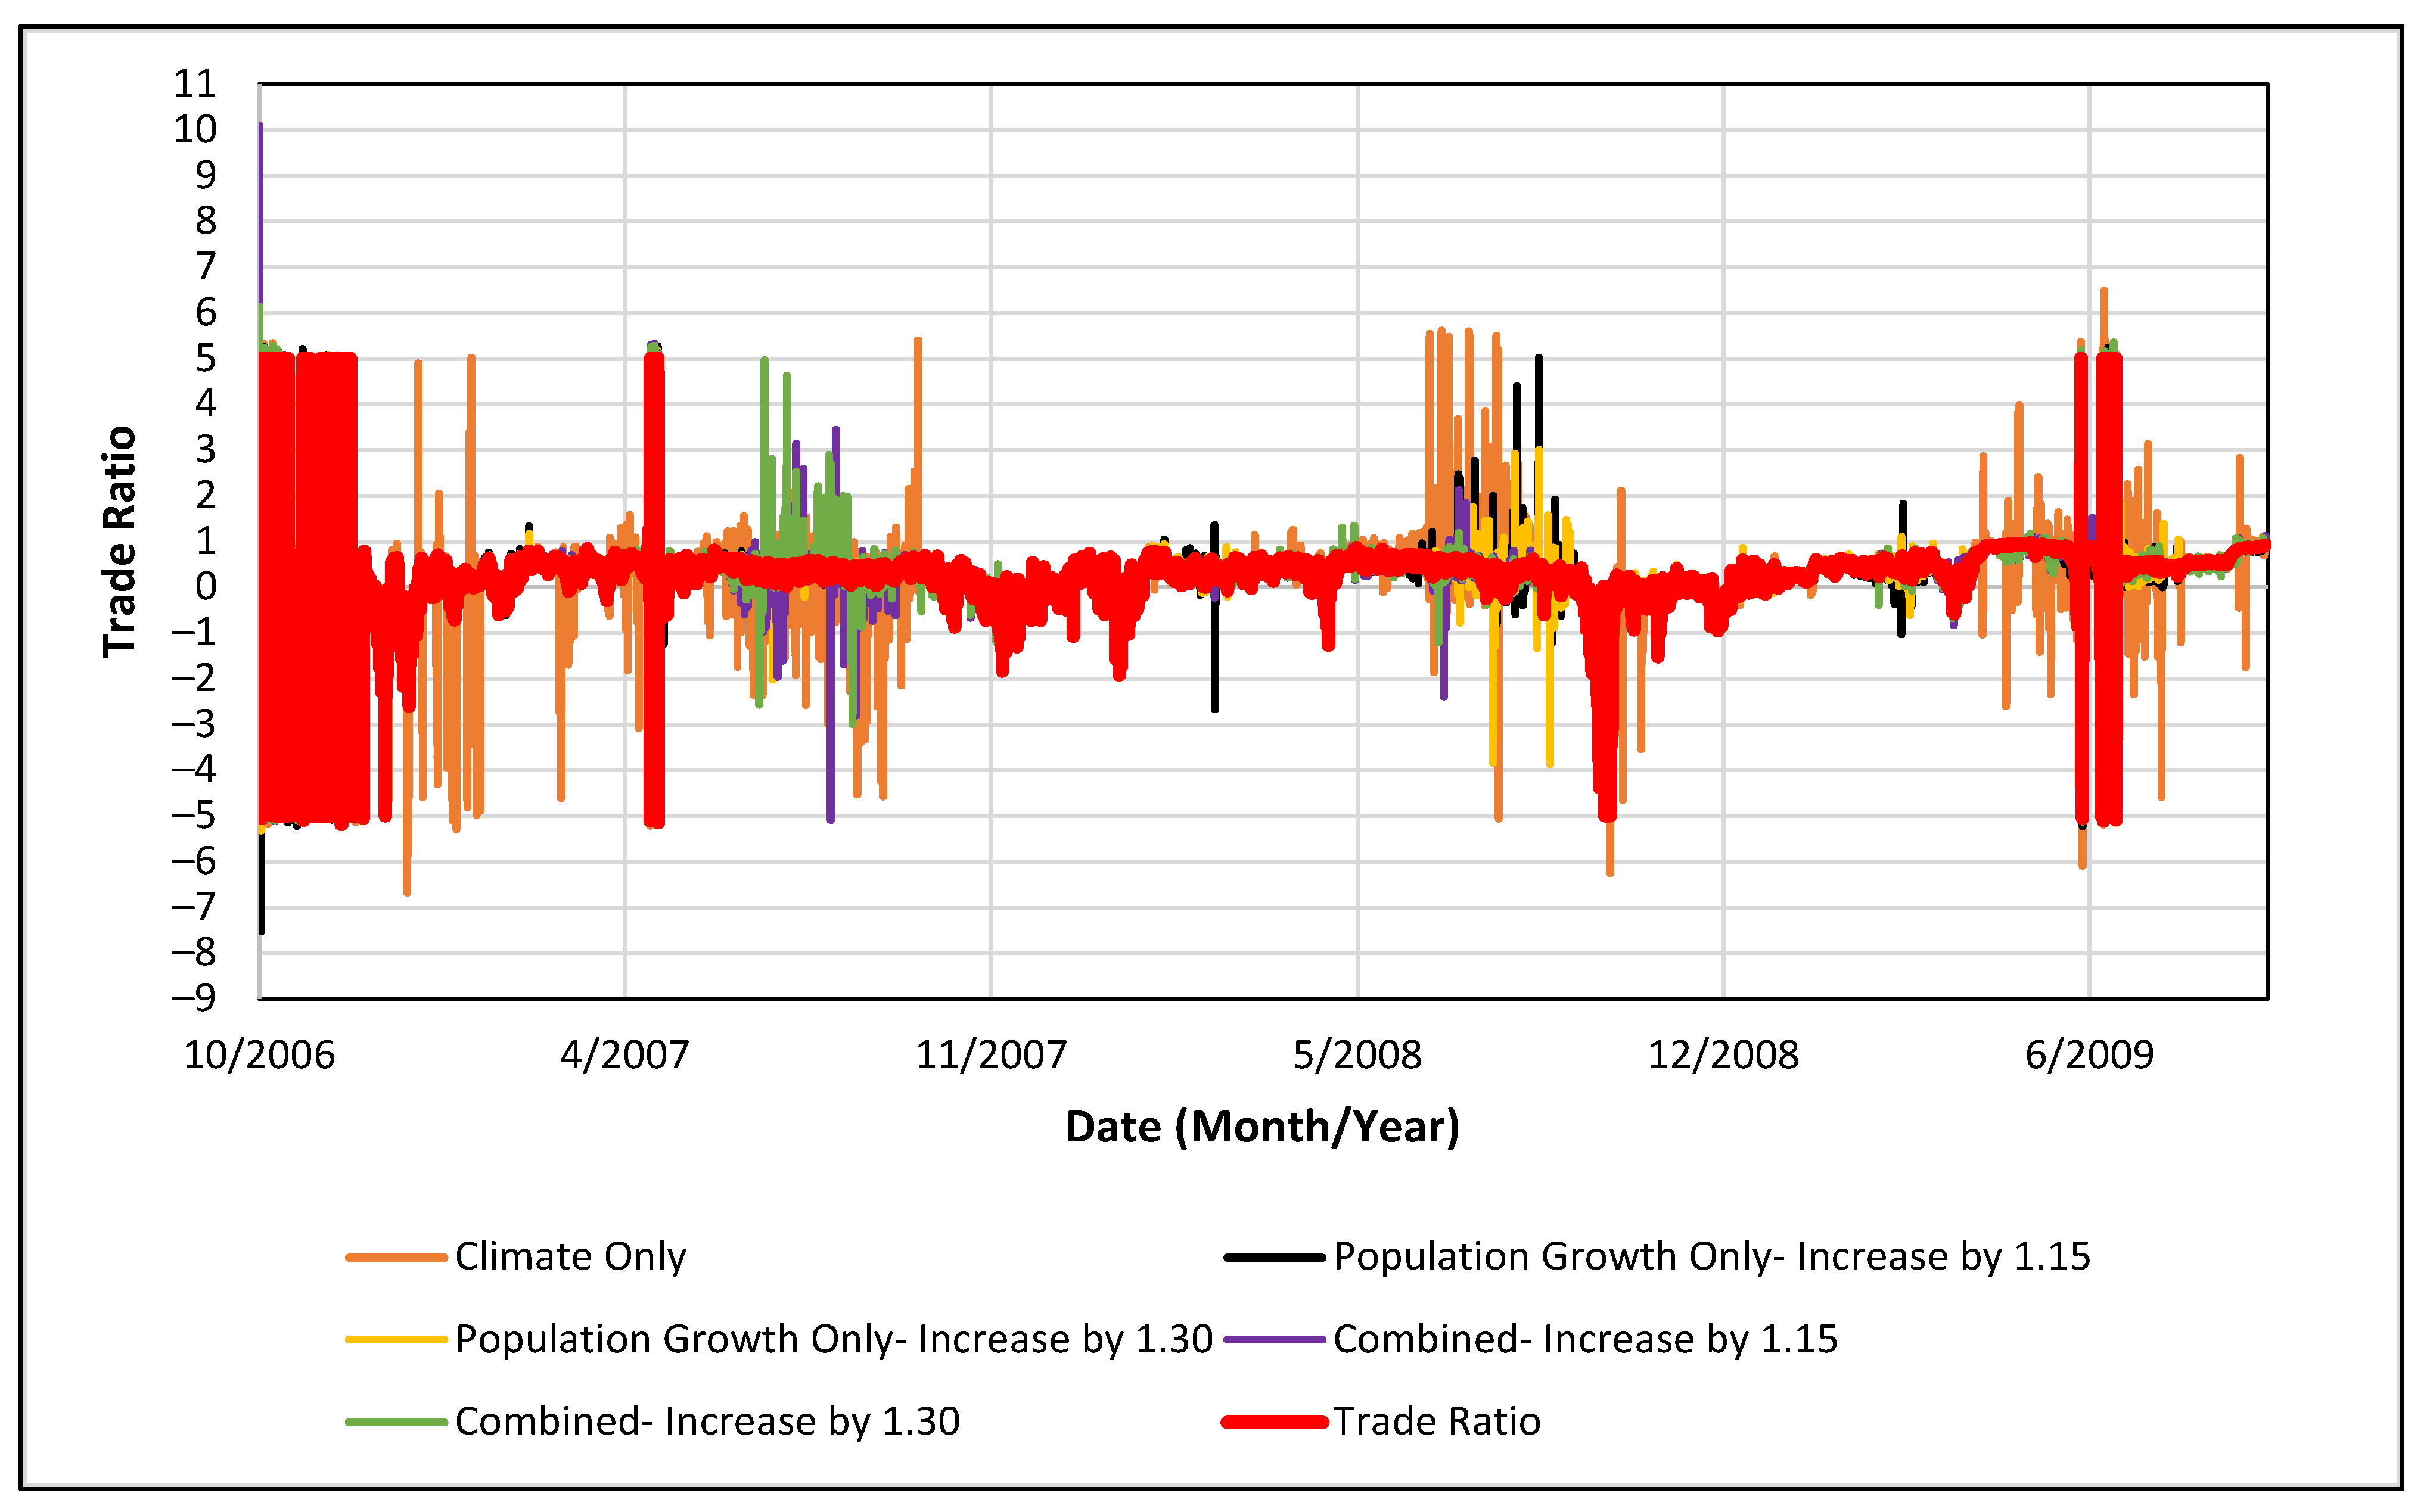
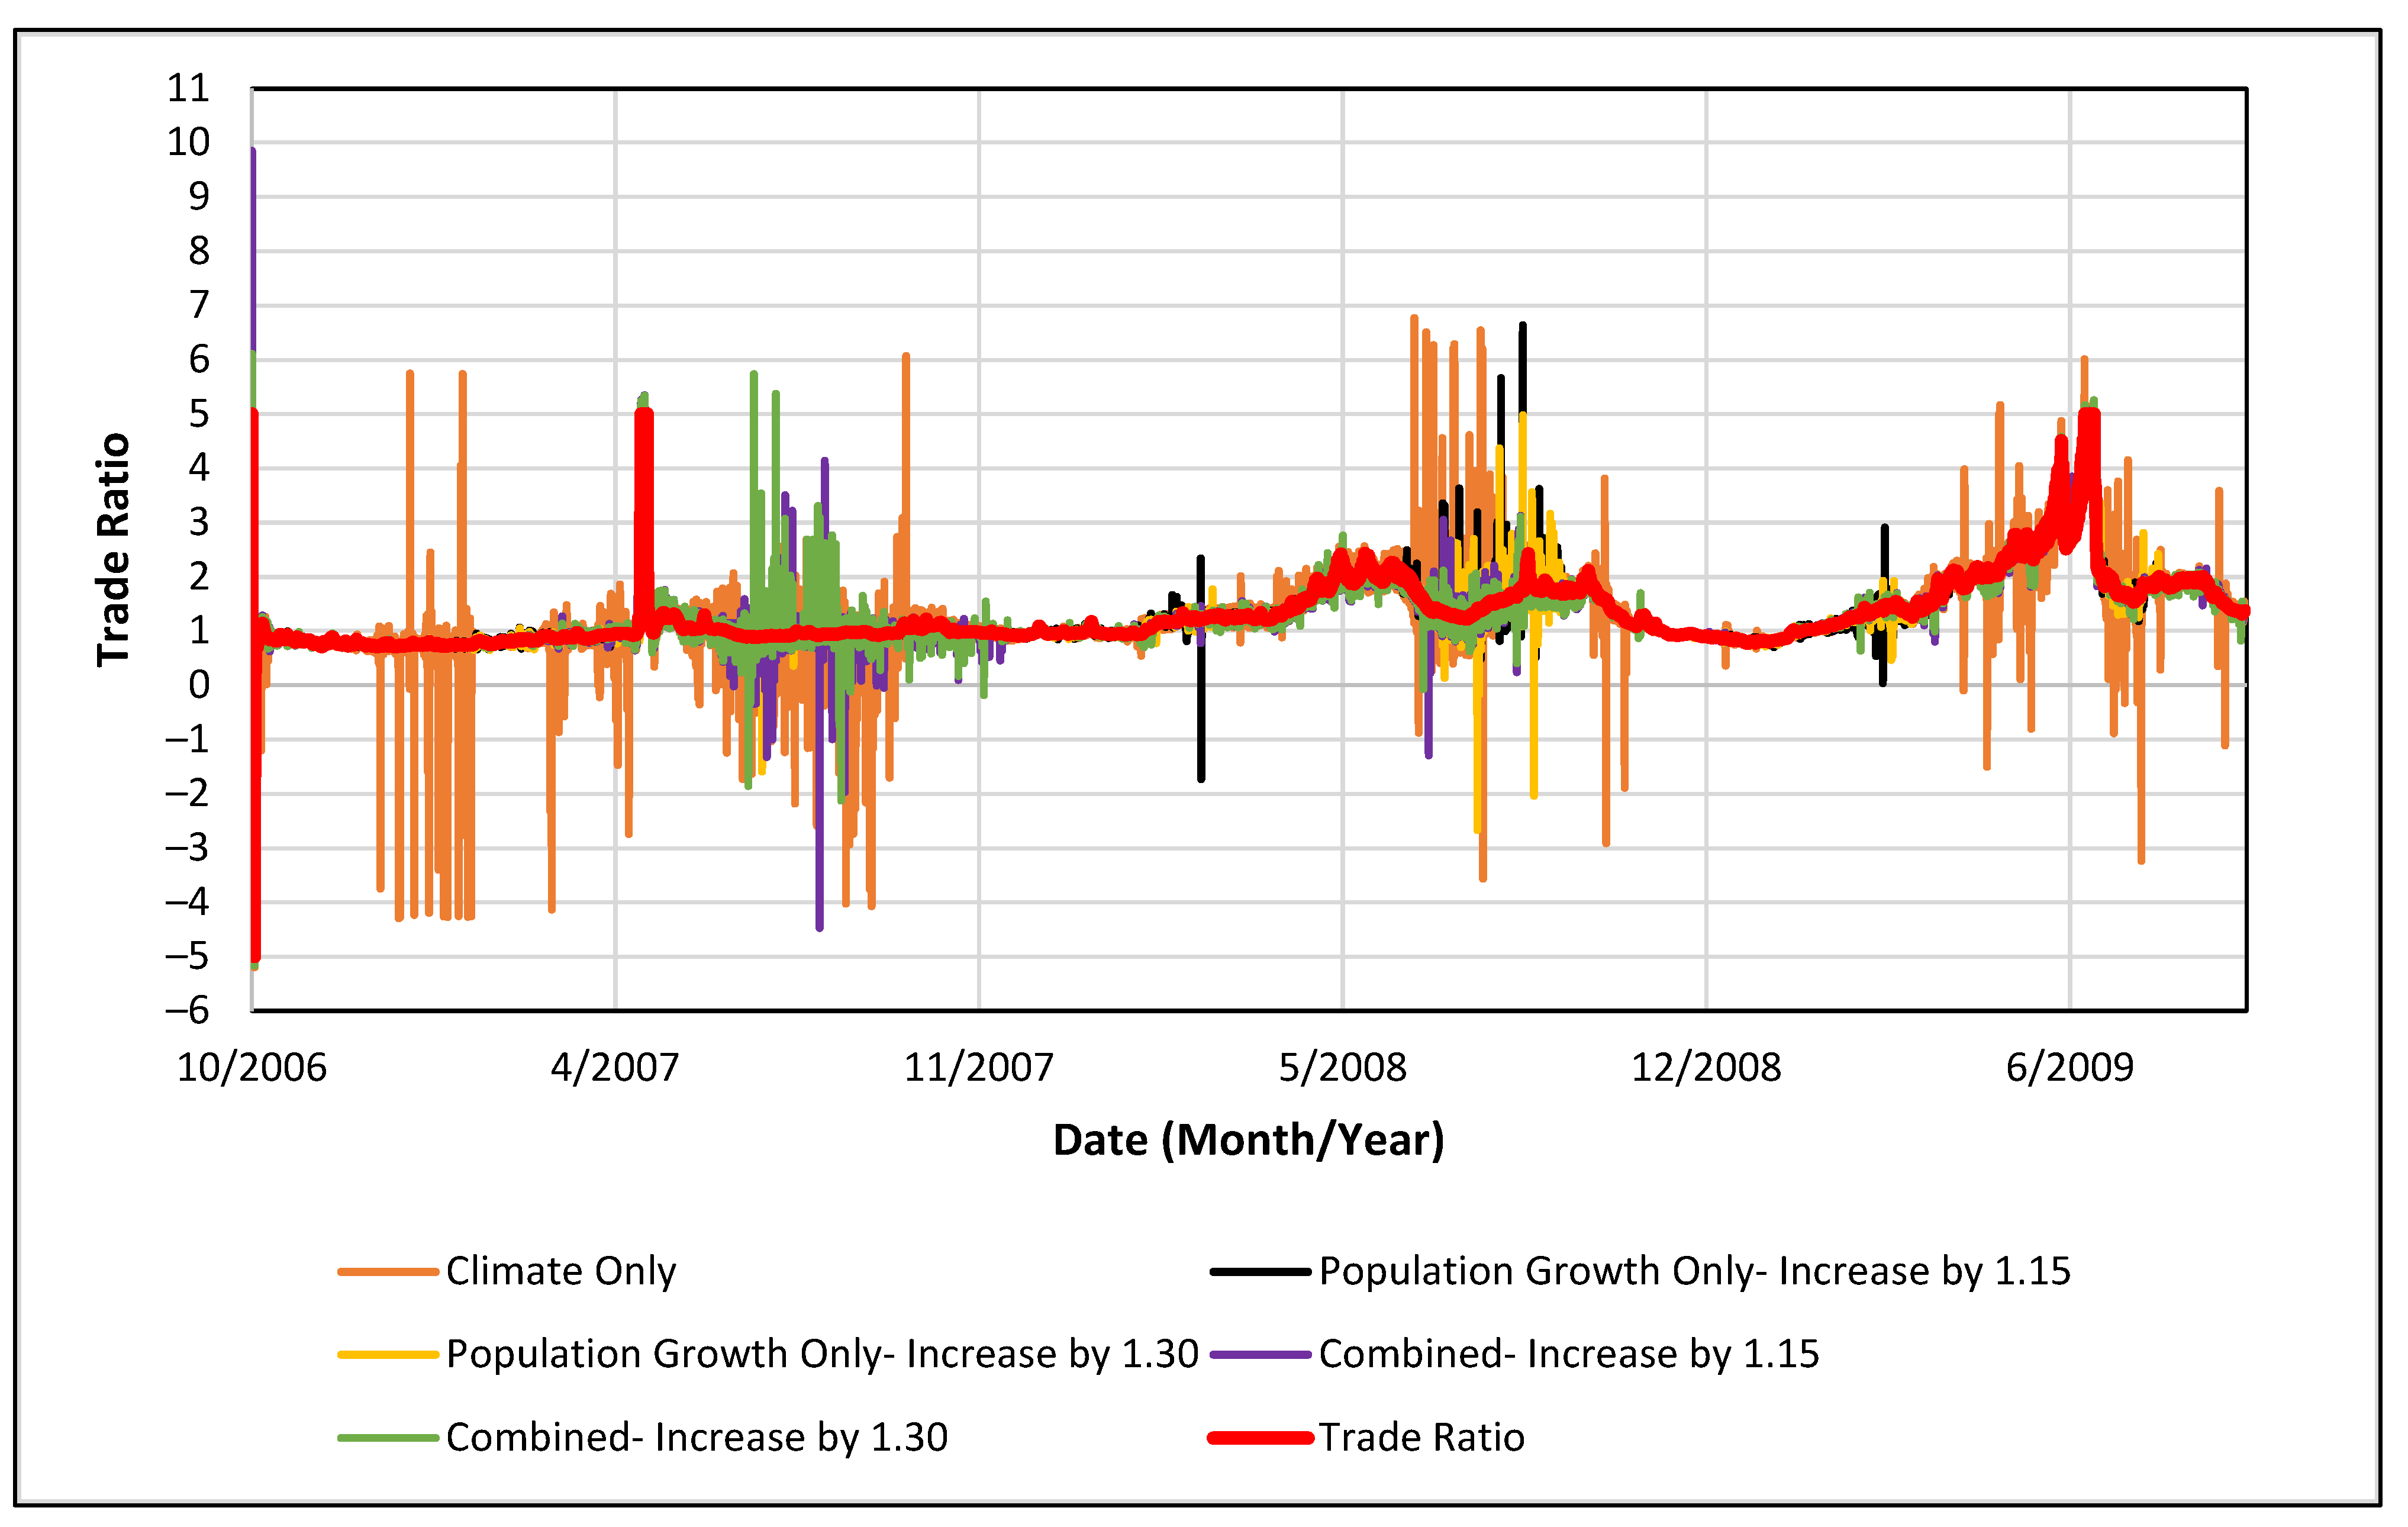
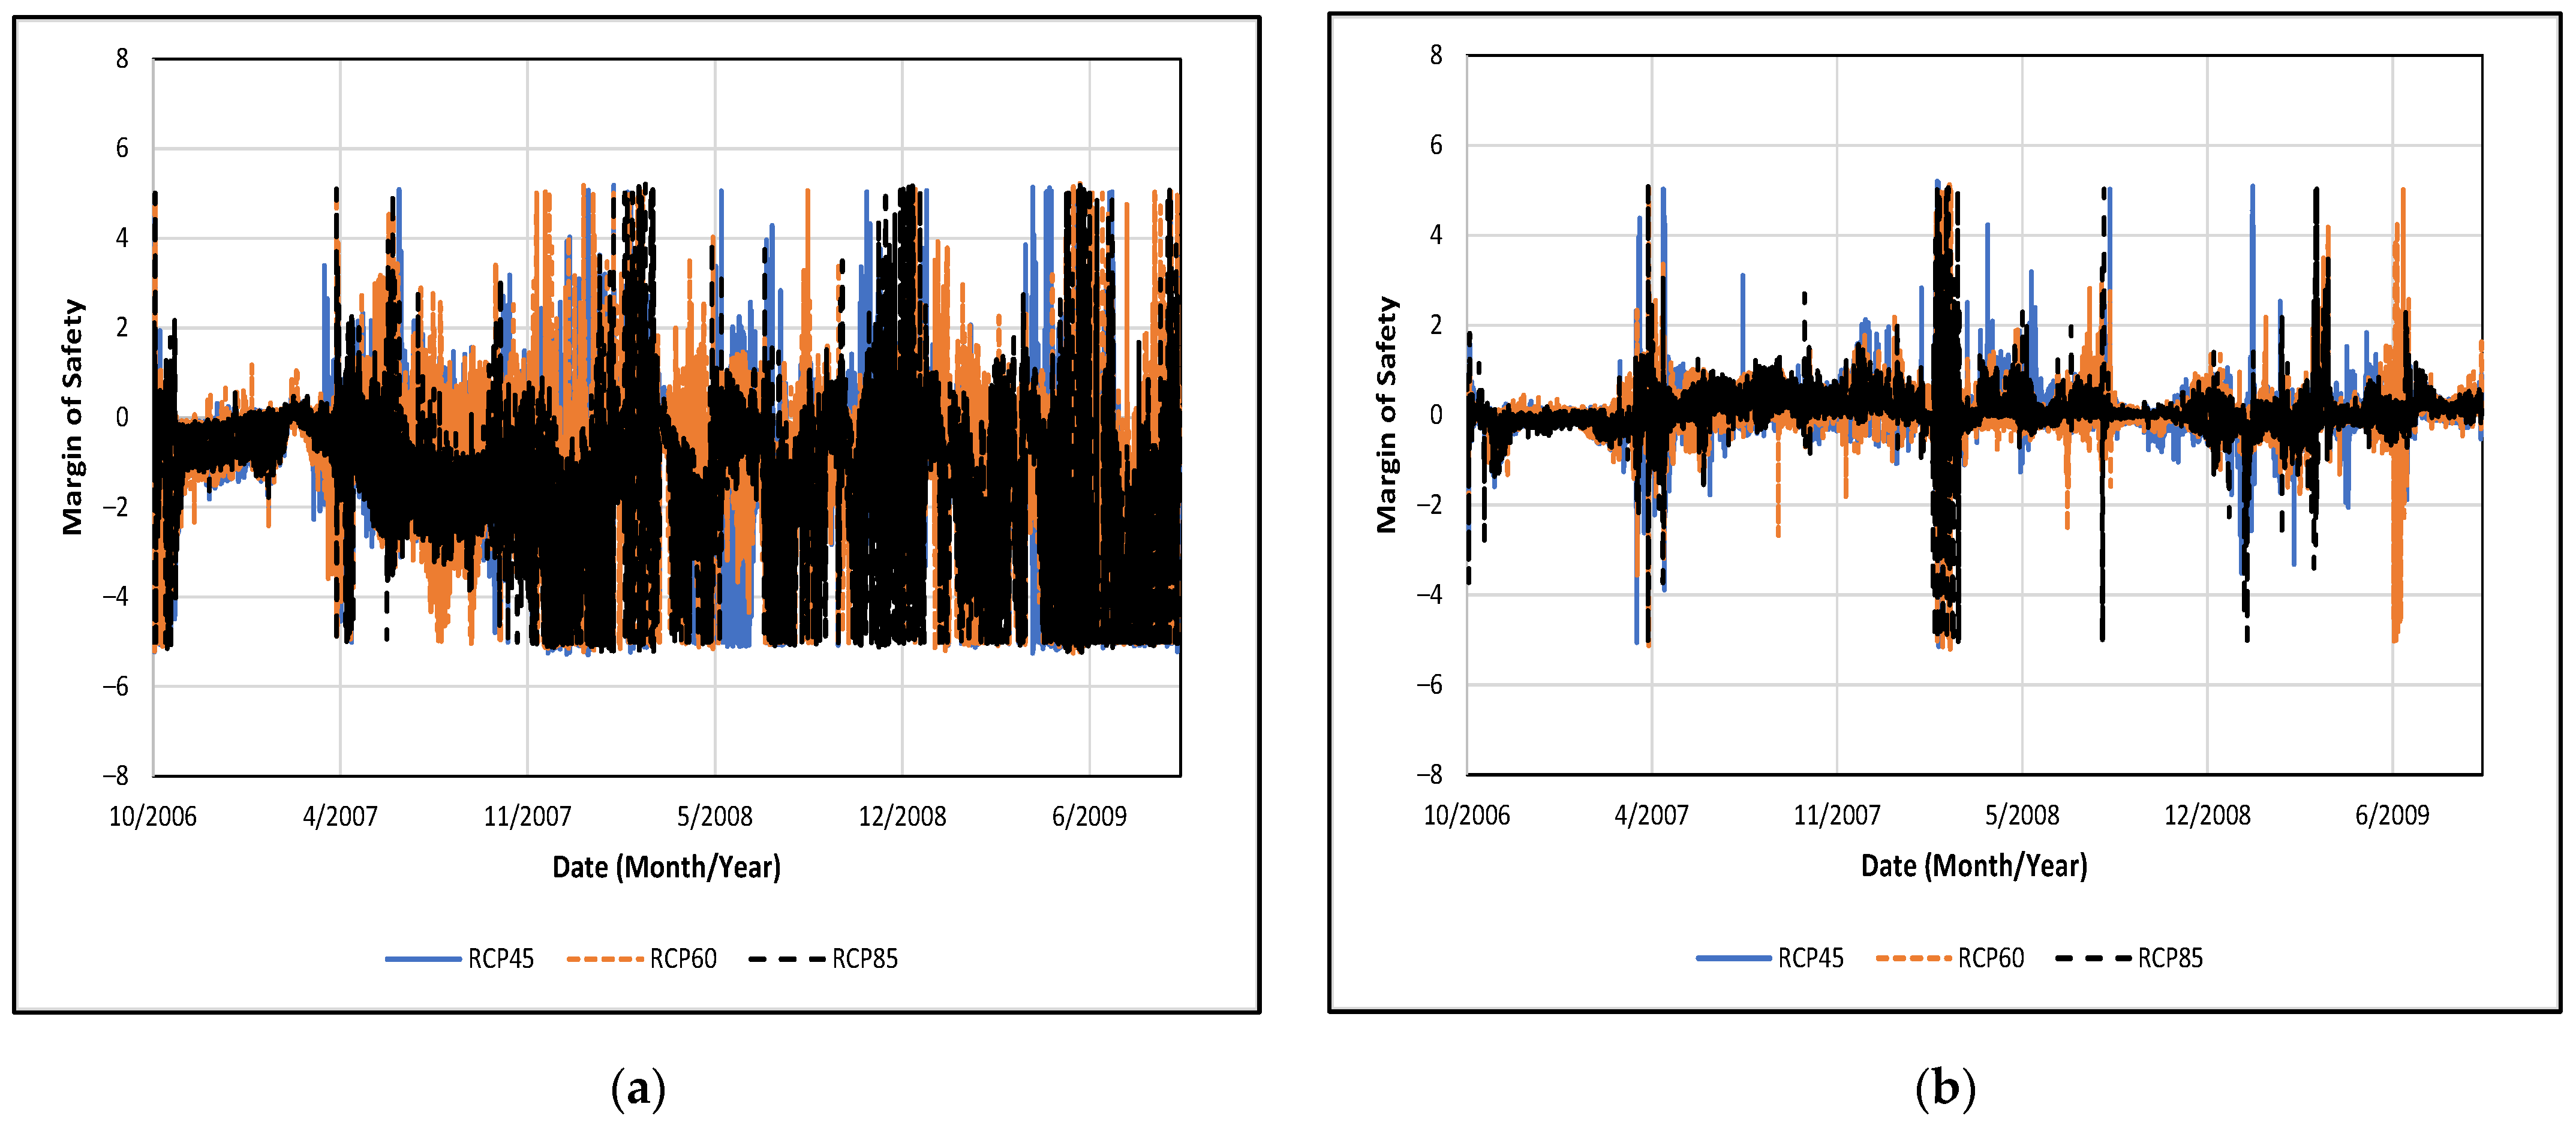
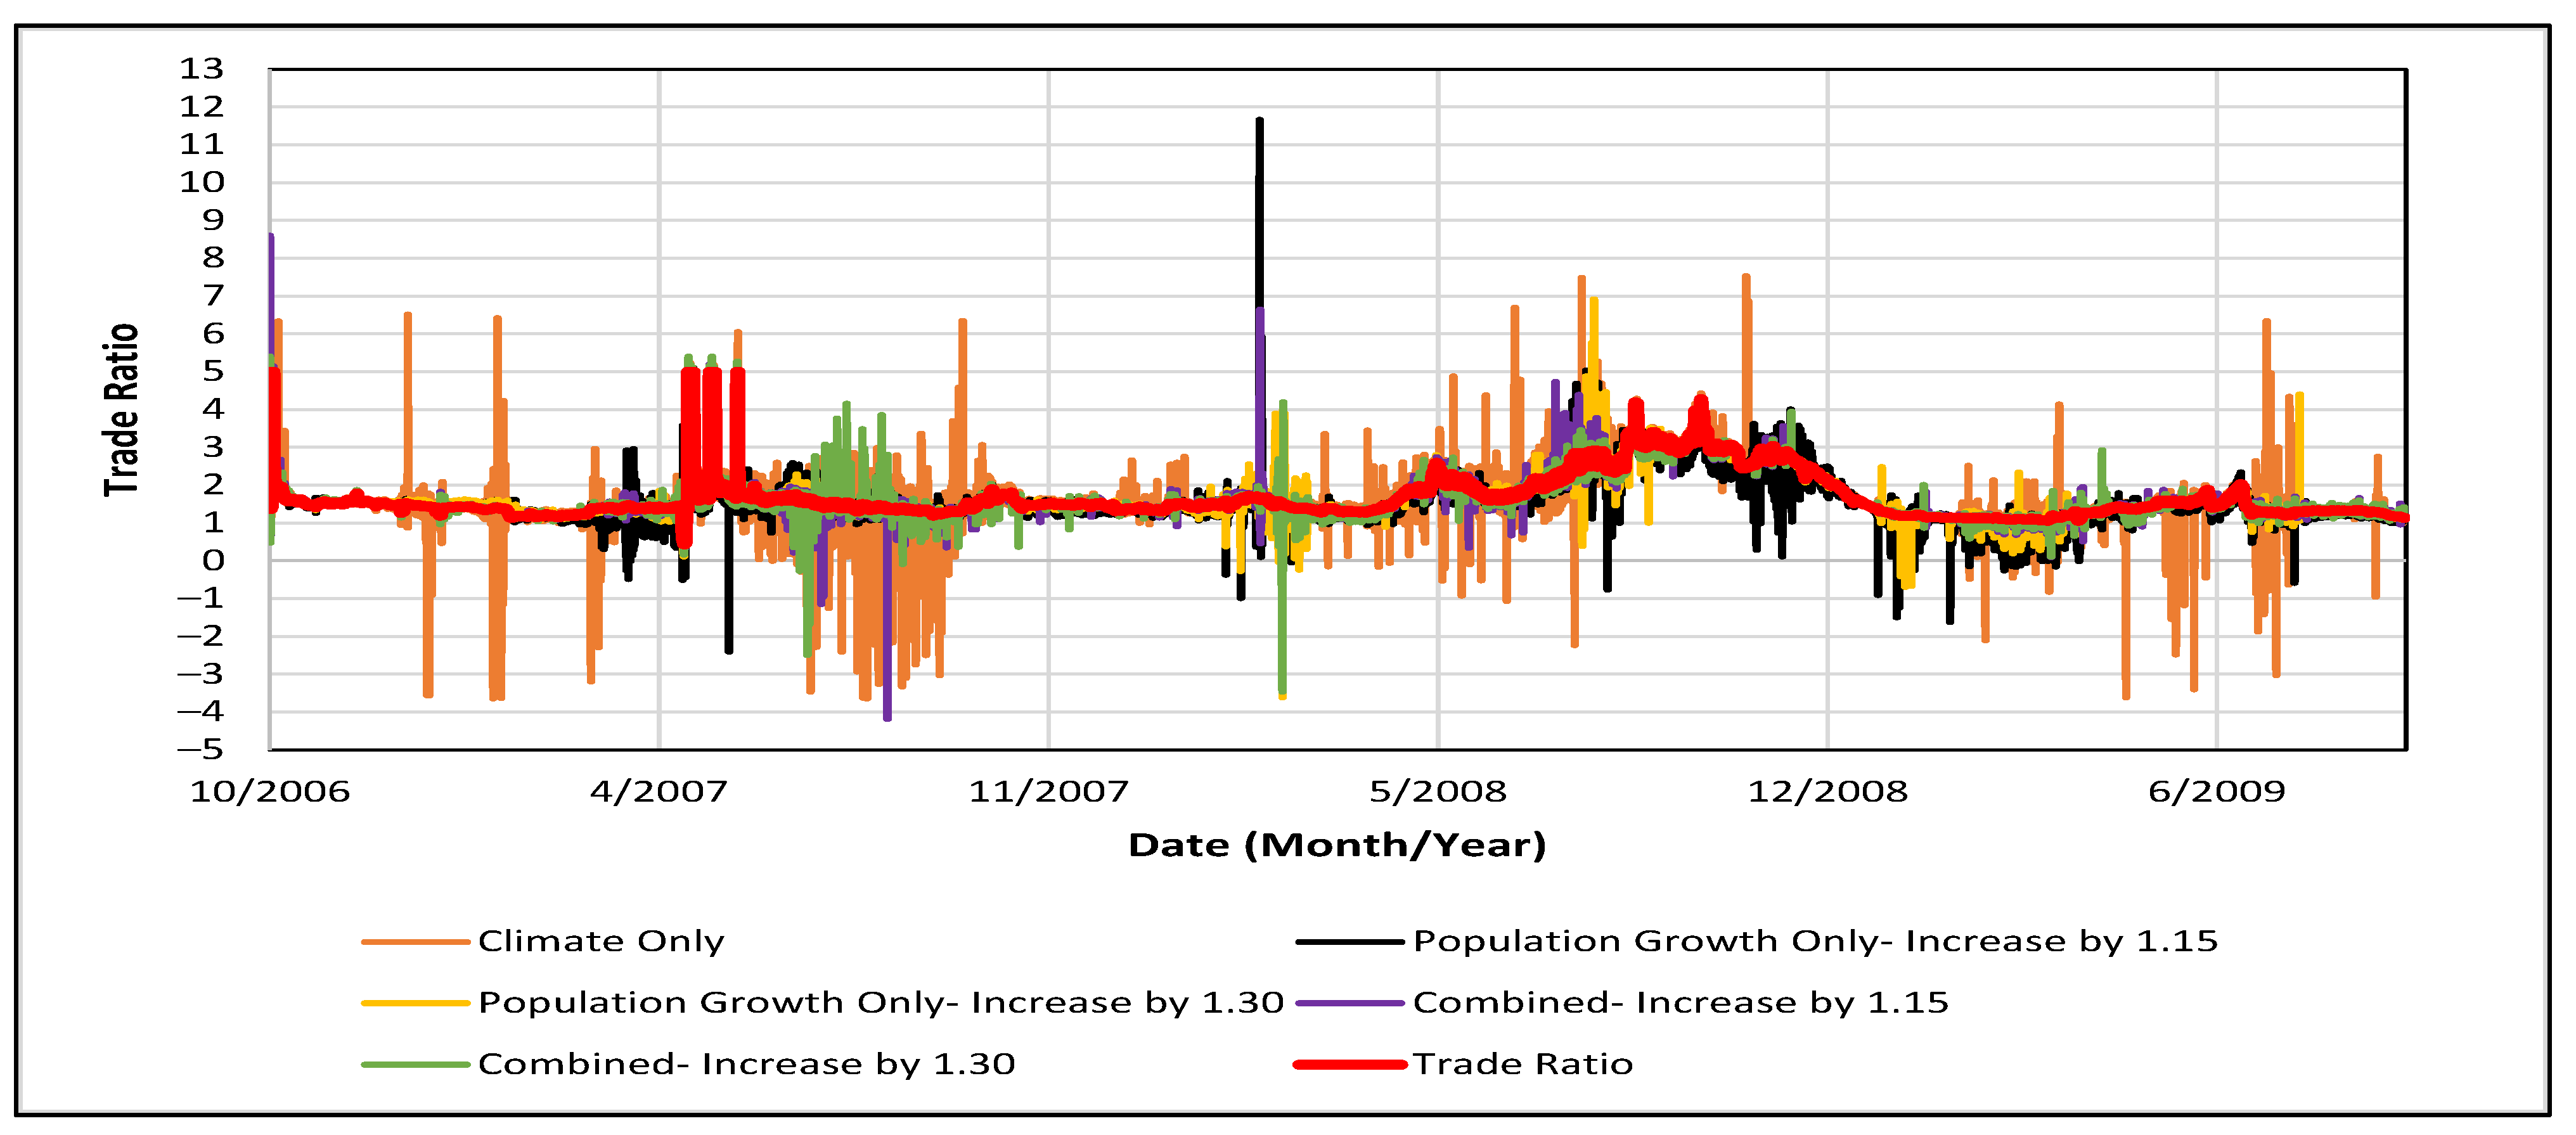
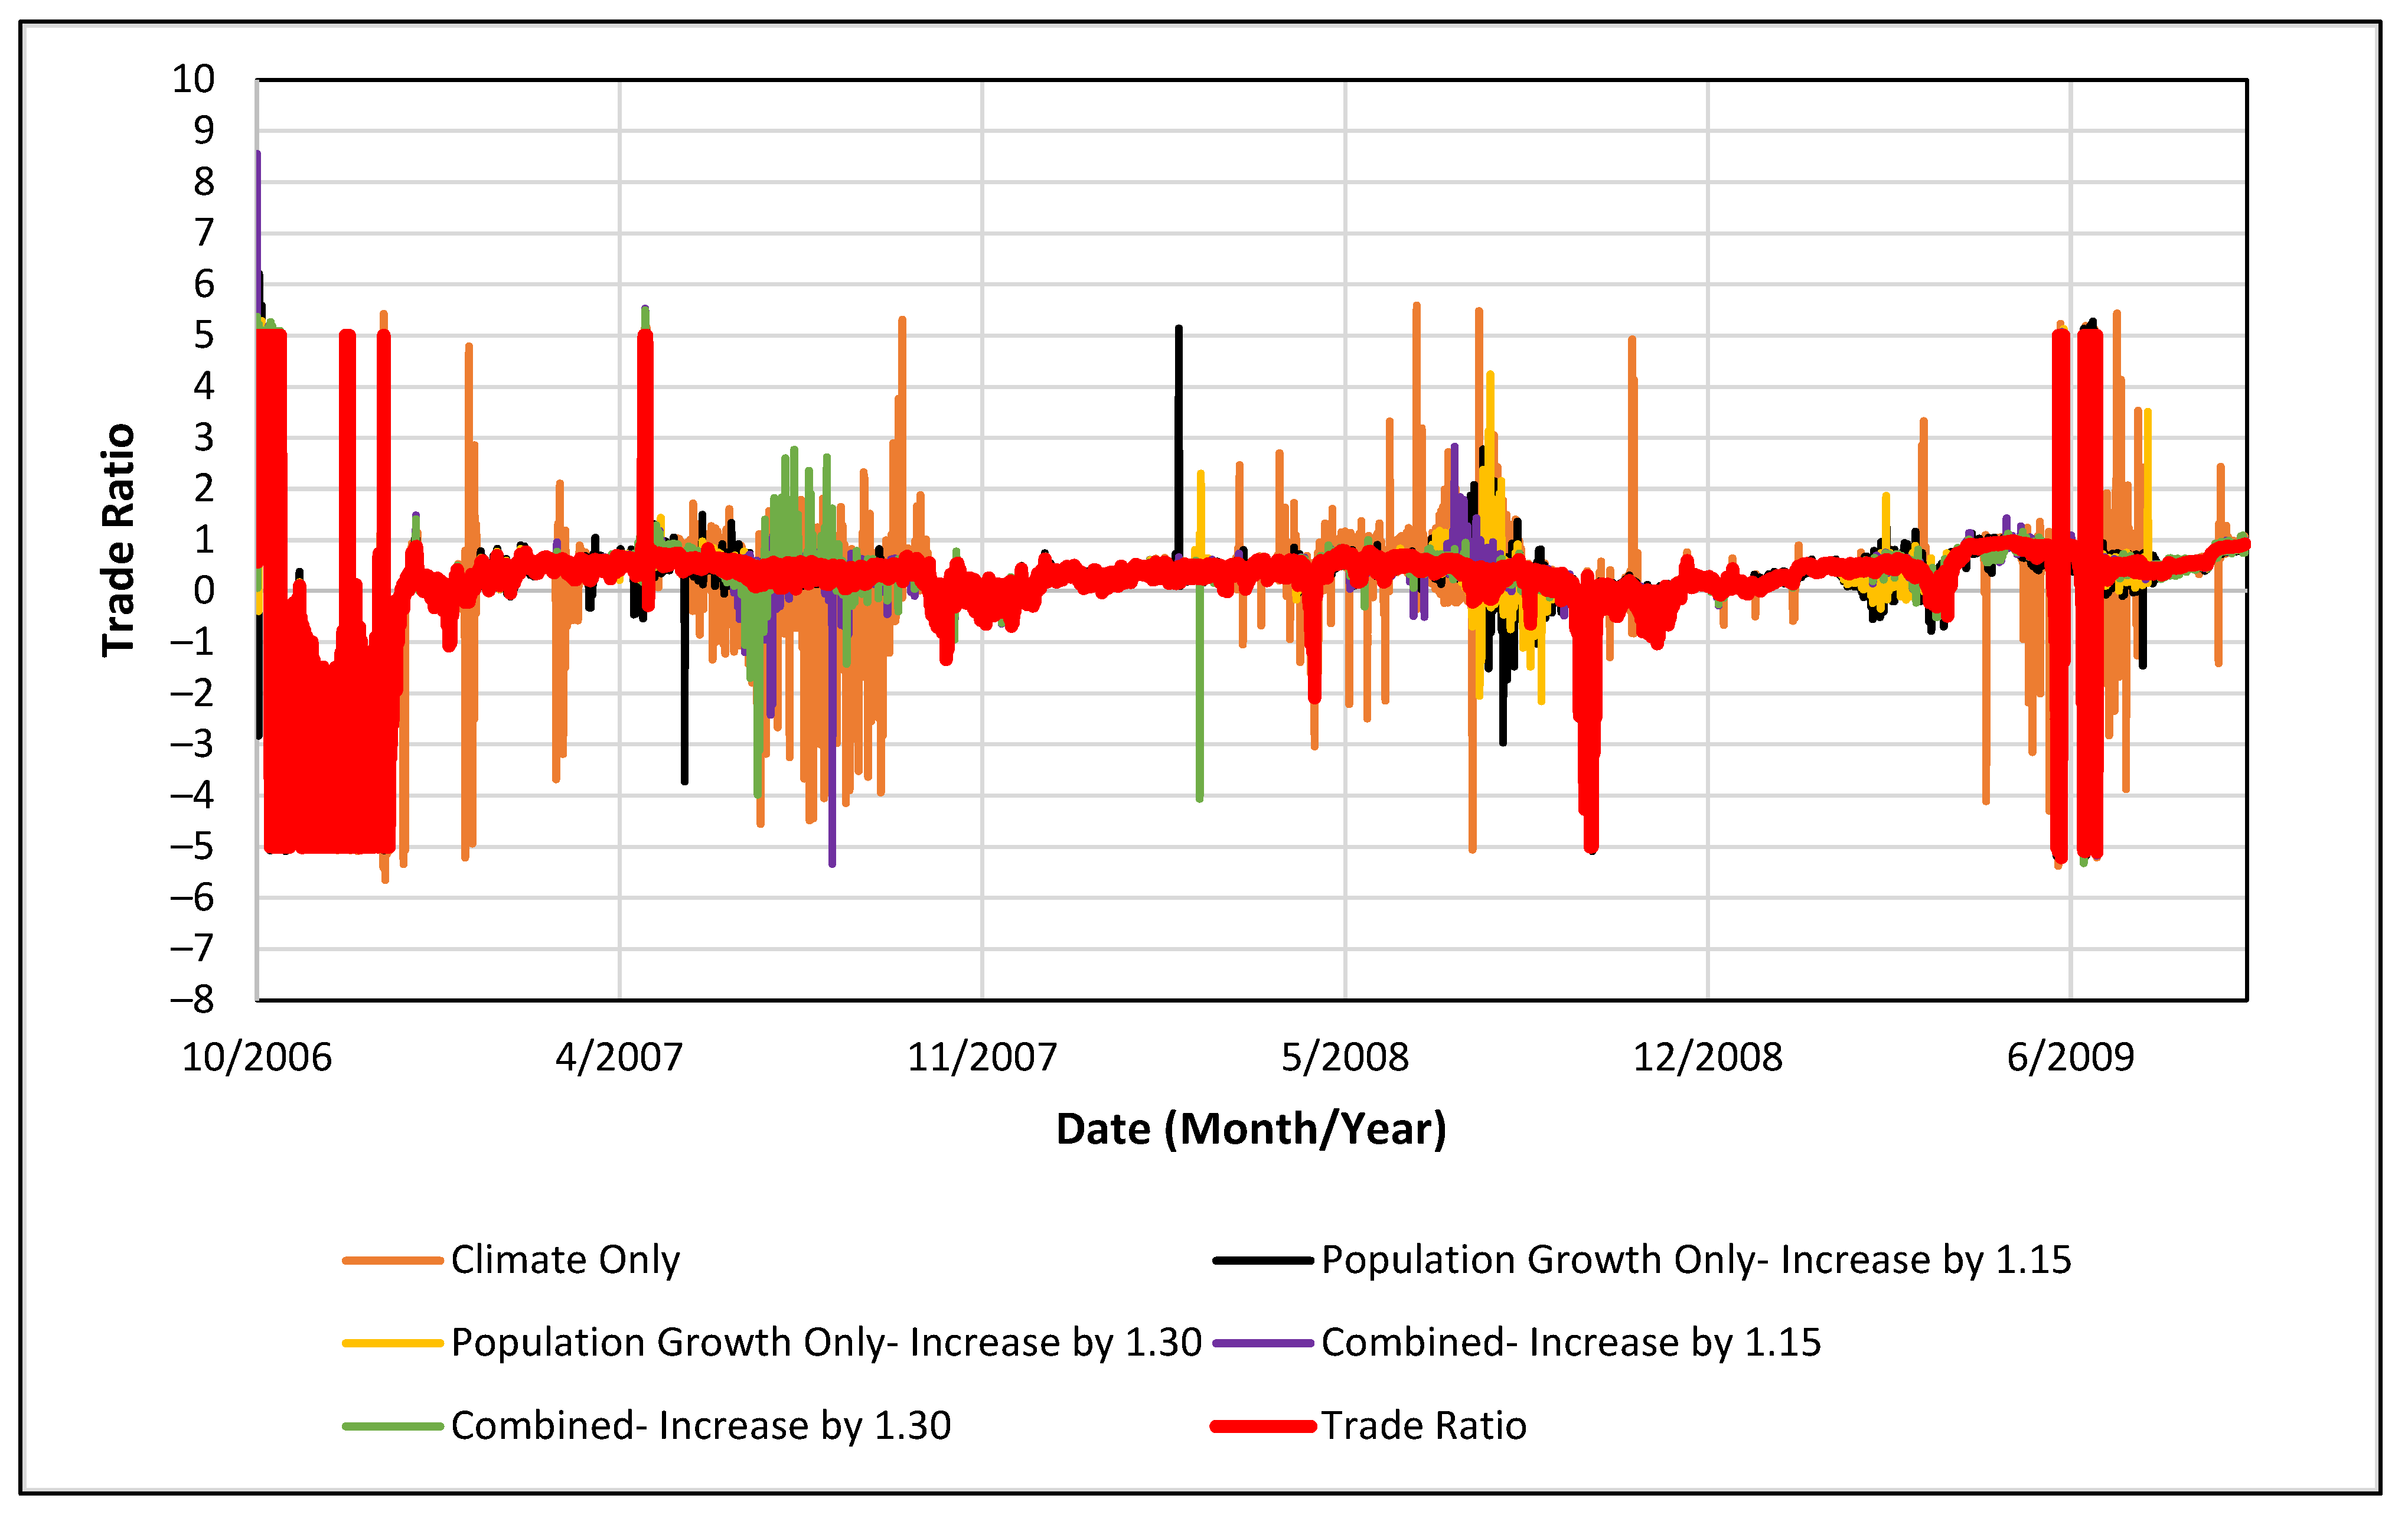
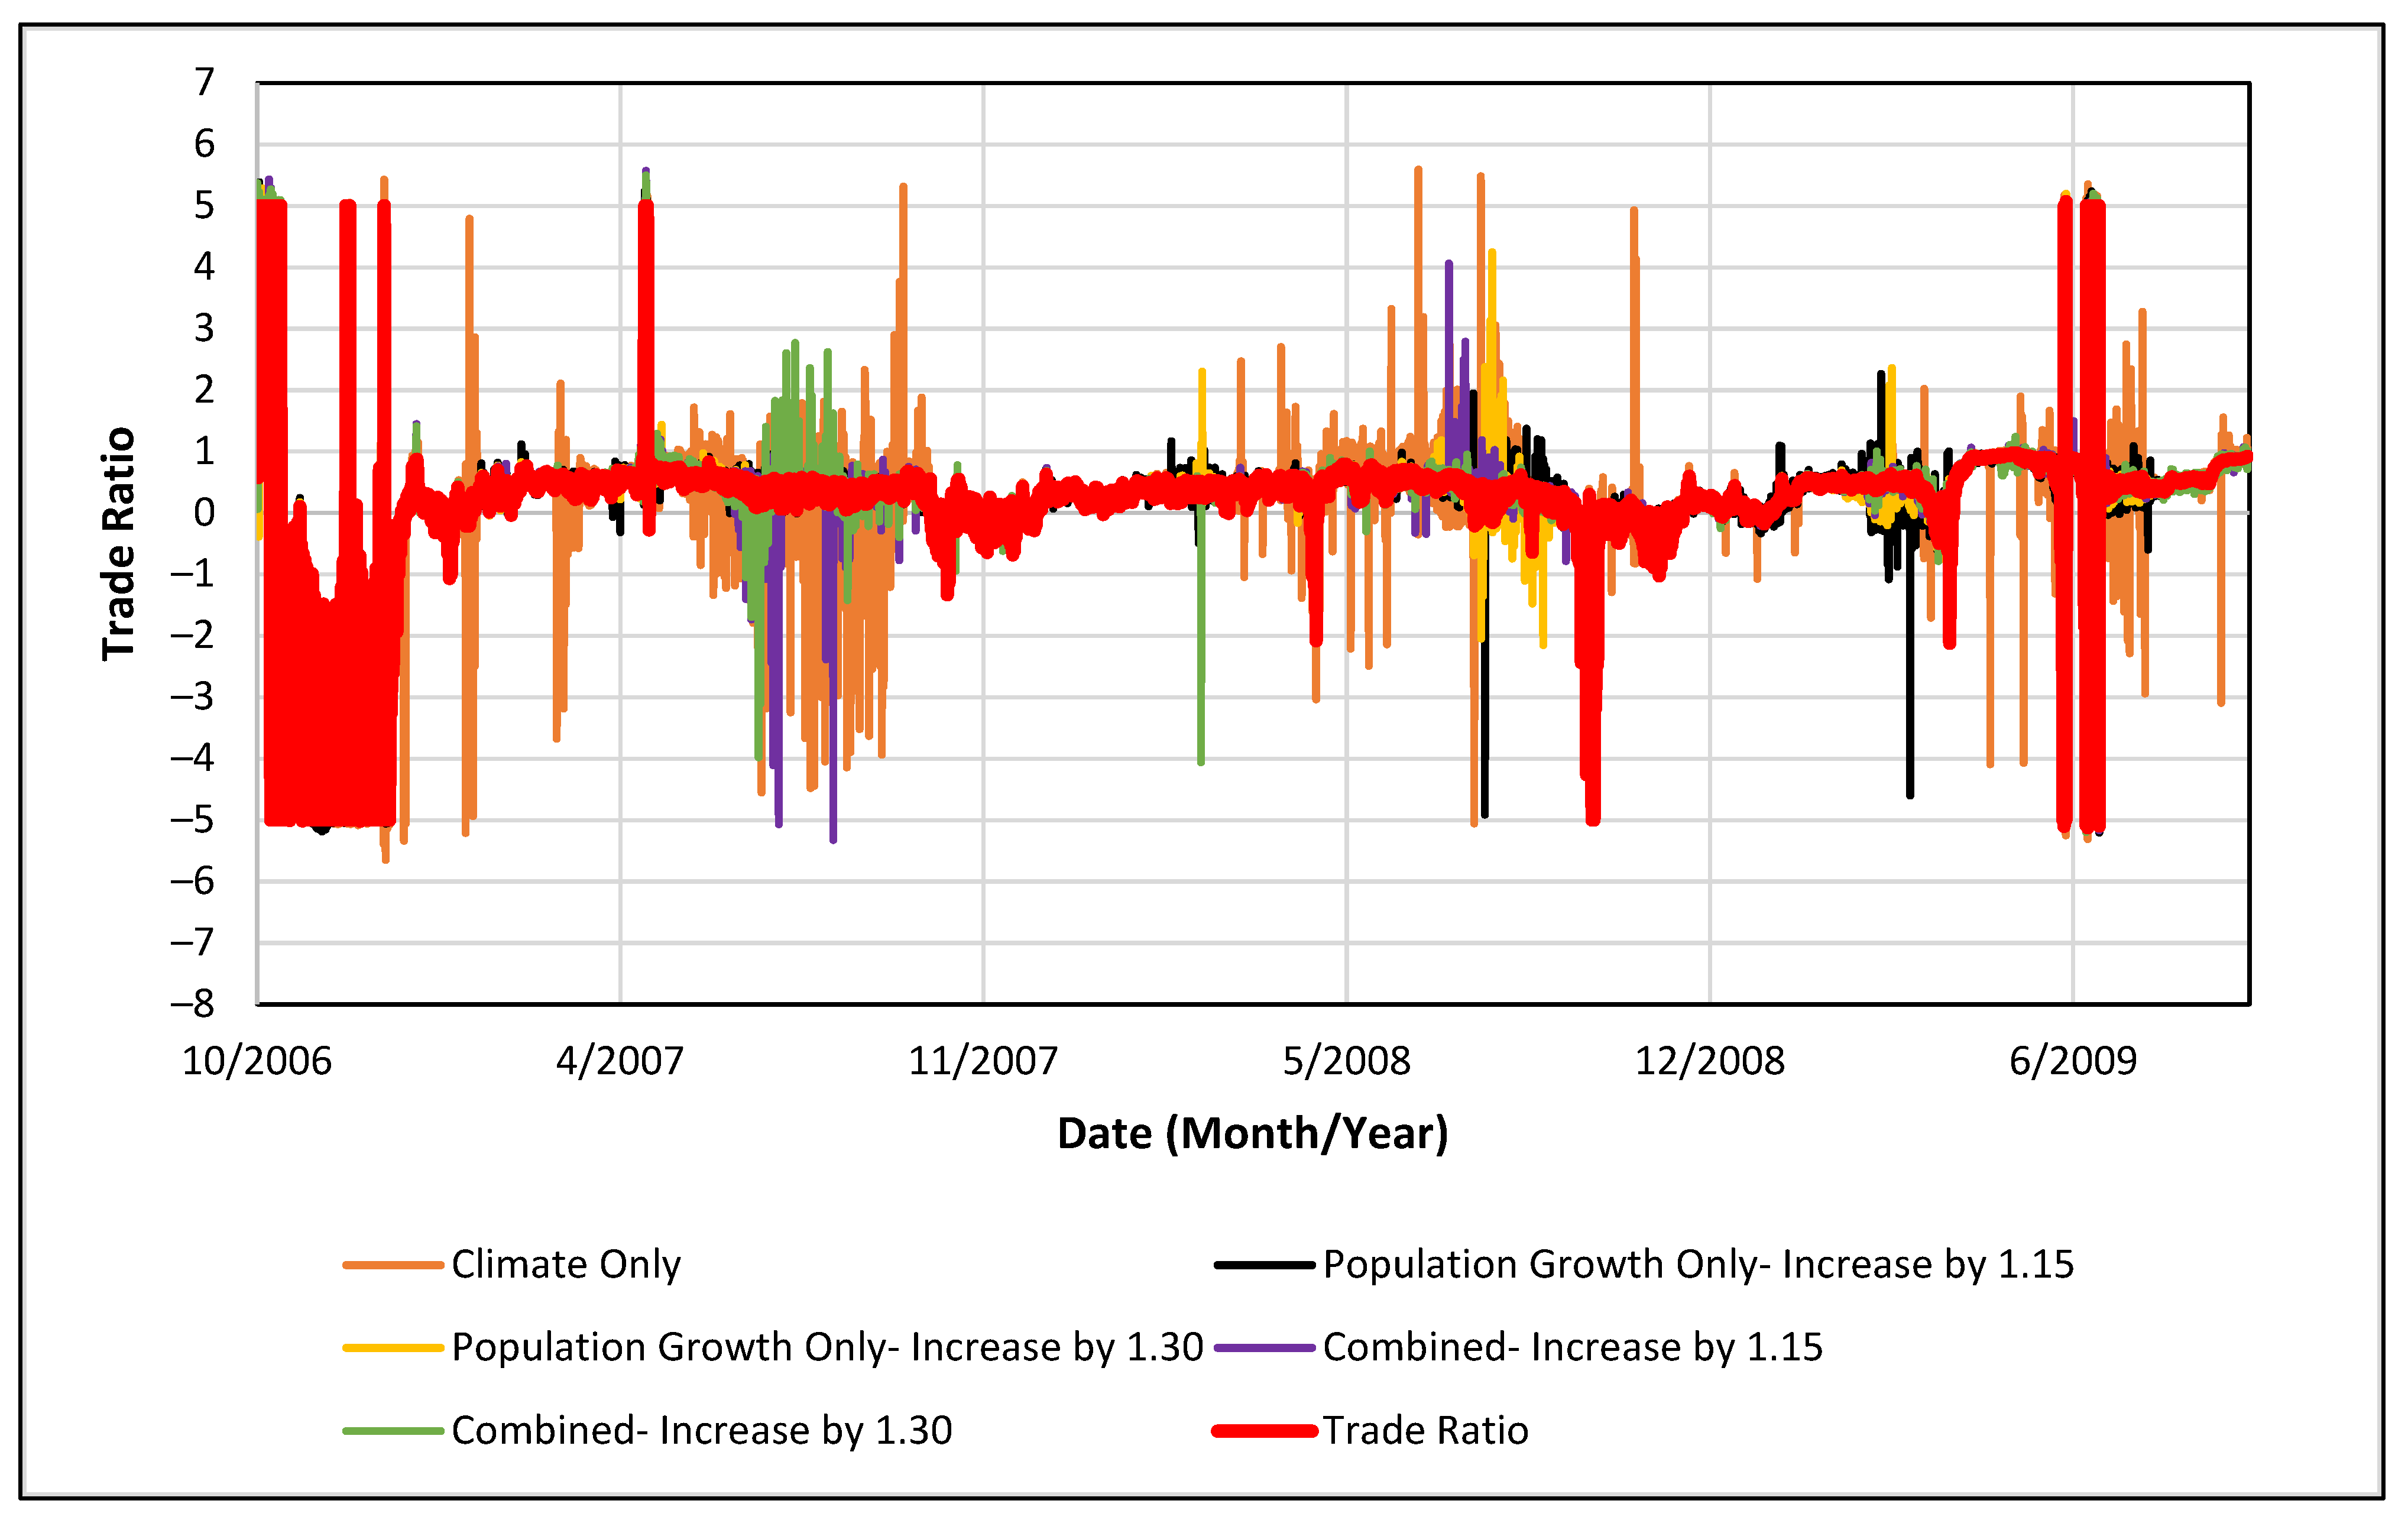
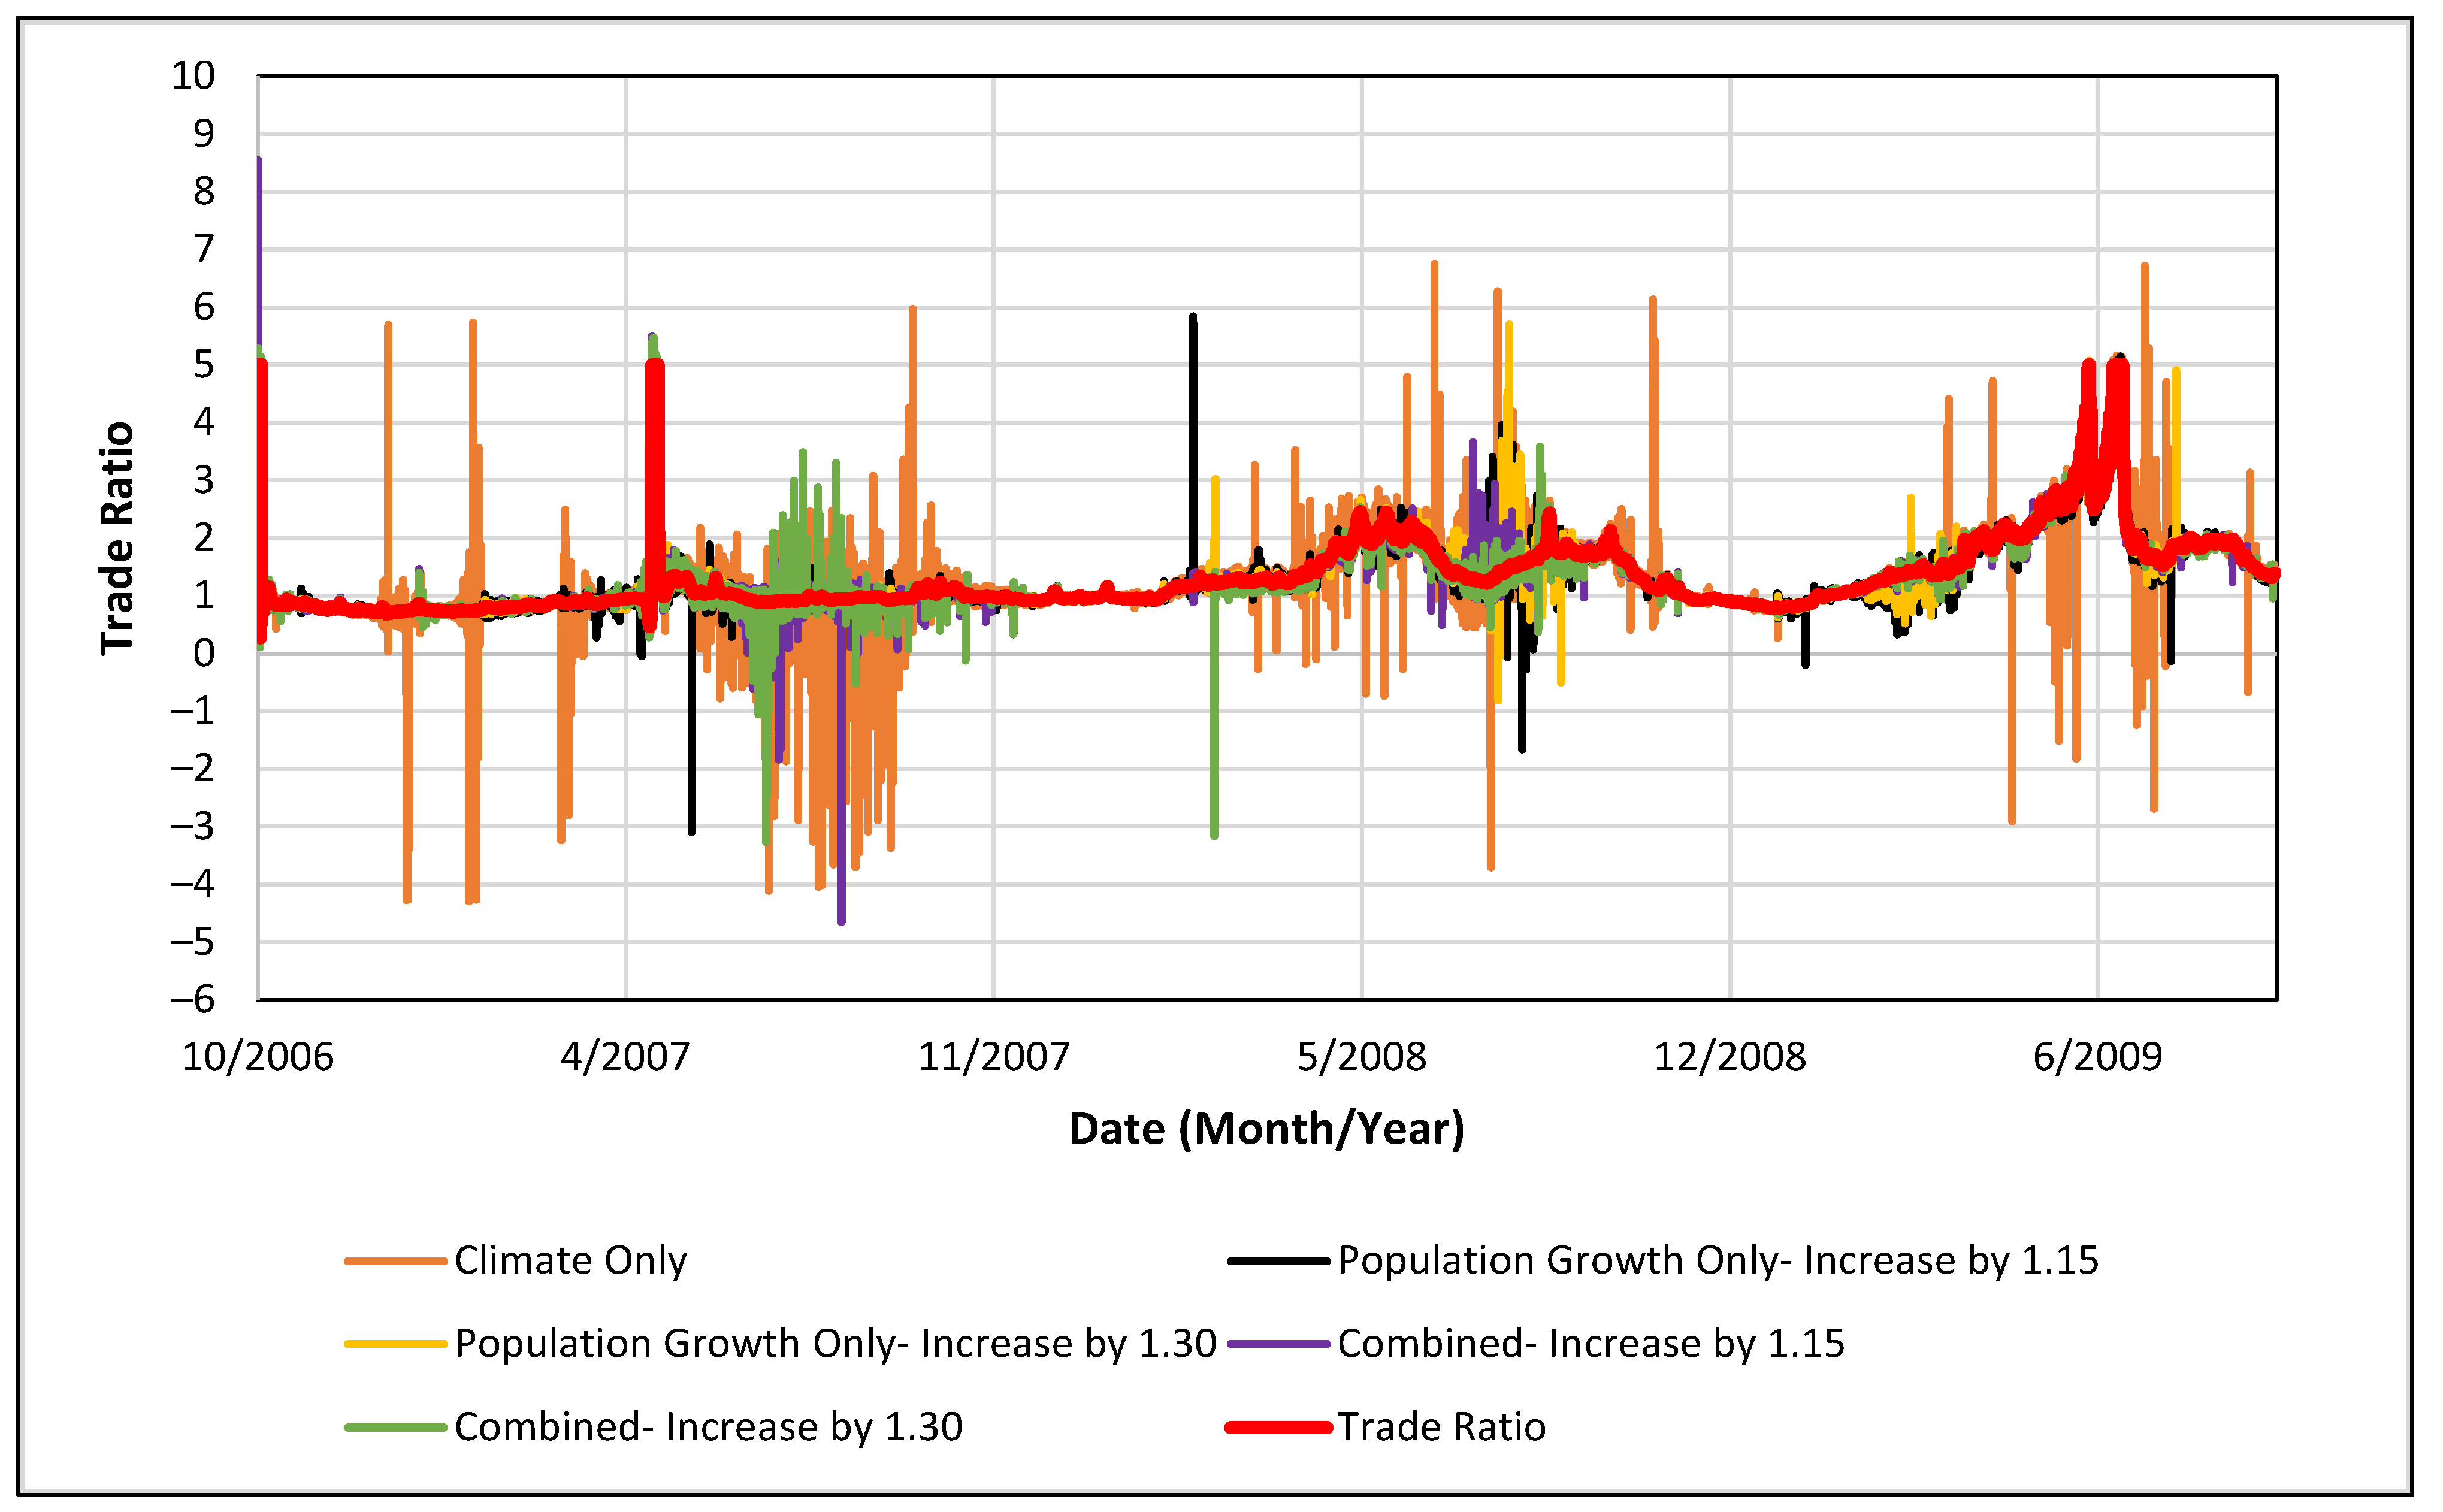
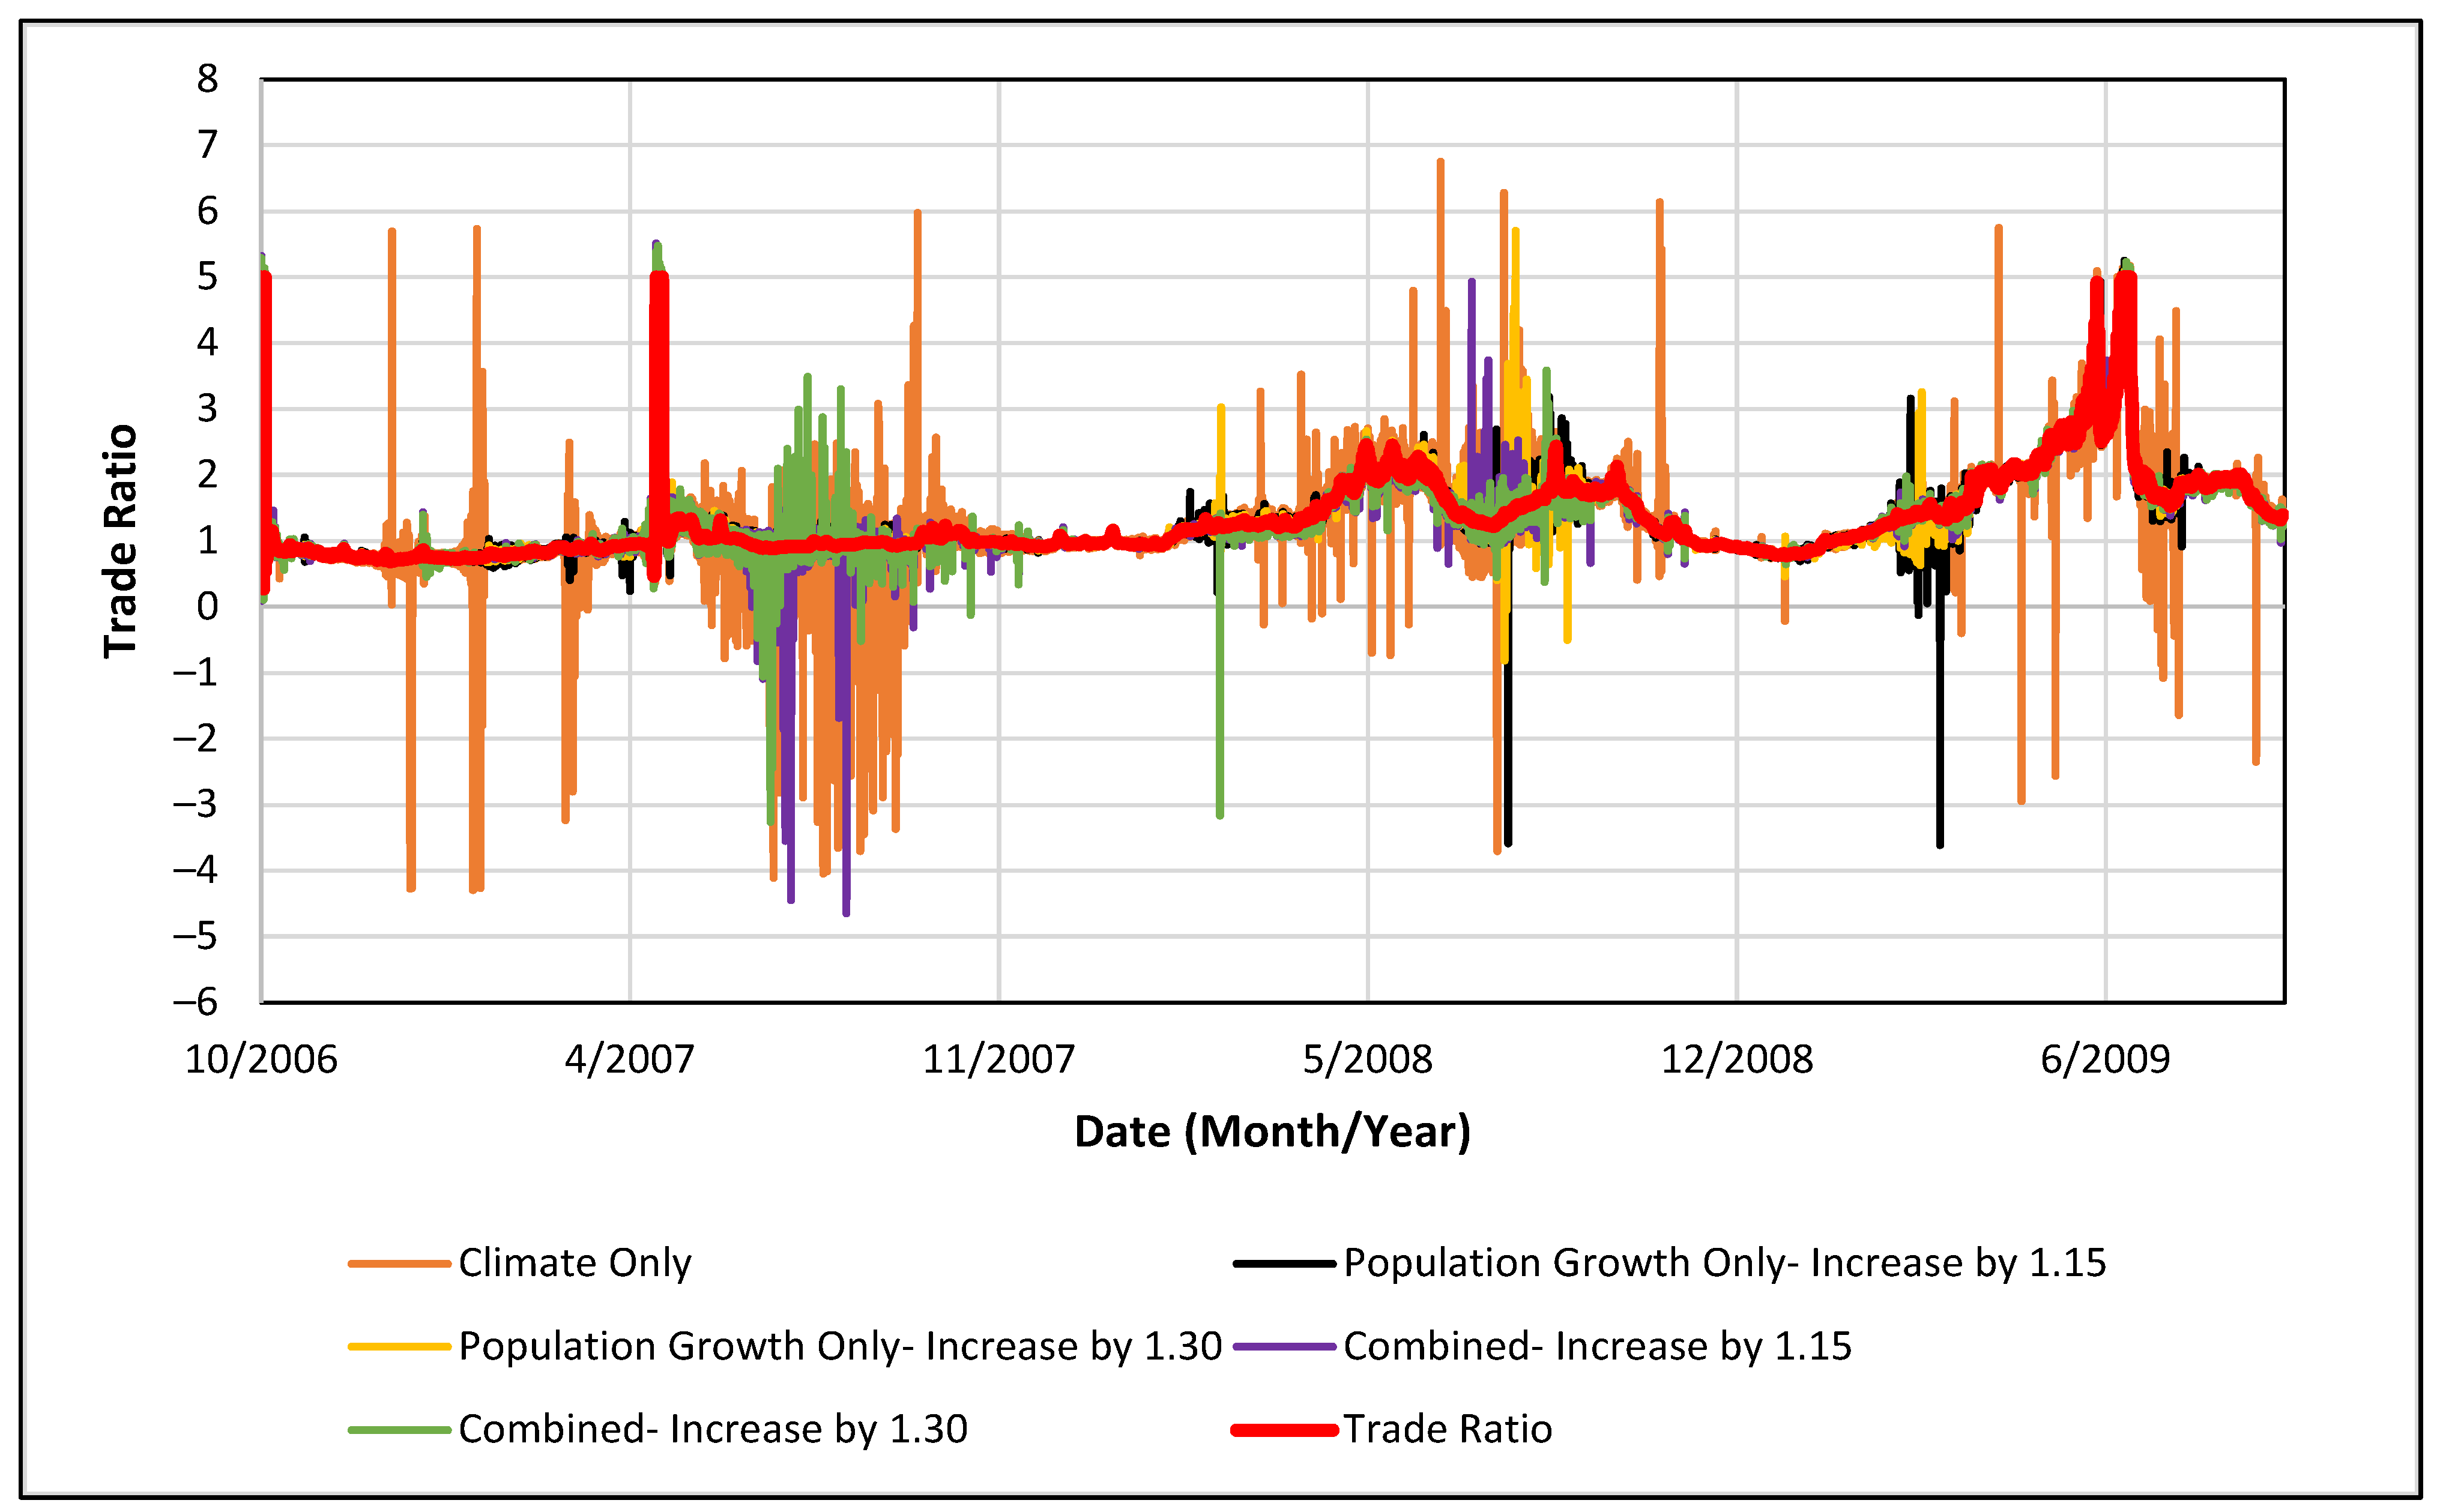
- Climate and Population Characteristics upon Composite Trade Ratios over the Jordan River system: The resulting composite trade ratios involving the delivery and downstream components with margins of safety implicate effects of climate and population/inflow patterns upon levels of removal credit achieved from a trade. For instance, margins of safety increasing or decreasing the composite trade ratios suggest improving or worsening levels, respectively, of removal and water quality improvement achieved by a trade under increasing water temperature and inflow quantity. Incorporating the margins of safety for addressing climatic and/or population/inflow changes over the Jordan River simulation appears to exhibit significant effects upon the resulting trade ratios. Such effects appear to be observed particularly over the April to November 2007 timeframe among all climate change projections for all WQT buyer constituents (Figure 6, Figure 7 and Figure 8 over WQT buyer TN for RCP 4.5, 6.0 and 8.5, respectively; Figure 9, Figure 10 and Figure 11 over WQT buyer TP for RCP 4.5, 6.0 and 8.5, consecutively; Figure 12, Figure 13 and Figure 14 over WQT buyer BOD for RCP 4.5, 6.0 and 8.5, correspondingly). For instance, with composite trade ratios ranging from 1 to 2 along this timeframe (4/2007 to 11/2007) for WQT buyer TN, incorporating margins of safety for climate characteristics without inflow adjustments yields resulting values ranging from to above 6 for RCP 4.5 (Figure 6), from to above 6 for RCP 6.0 (Figure 7) and from to above 6 for RCP 8.5 (Figure 8). Similar characteristics appear observed for WQT nutrients TP and BOD within this time period (4/2007 to 11/2007), with resulting values from below to nearly 6 with climatic and/or inflow adjustments for composite trade ratios oscillating around 1 among all climate projections. Meanwhile, climatic characteristics appear to exhibit greater impacts upon the resulting trade ratios than those for addressing population/inflow changes, with exceptions to extremes observed (e.g., Figure 14 for RCP 8.5 for WQT buyer BOD along 07/2008 to 08/2008). On the other hand, incorporating such margins of safety for climatic and/or population/inflow characteristics appears to exhibit relatively minor effects upon the composite trade ratios along 11/2007 to 06/2008, such as those for RCP 6.0 for WQT buyer TP (Figure 10) and BOD (Figure 13). Such characteristics seem to demonstrate the variable effects of climate change projections upon the resulting trade ratios for pollutant reduction credit, with such impacts appearing to exhibit temporal variability. Furthermore, the difference between the statistical and dynamic downscaled scenarios do not appear to exhibit significant effects on the outcome of water quality improvement and pollutant reduction credits. This assessment is based on the margins of safety on the distinct trade ratio components (e.g., Figure 2, Figure 3, Figure 4 and Figure 5) where the response of the dynamically-downscaled RCP 6.0 is between the statistically-downscaled RCP 4.5 and 8.5 models. Nevertheless, such characteristics observed appear rather specific to the Jordan River simulations, particularly given uniform inflow quality followed by uniform inflow adjustments, though climate and population characteristics are suggested to exhibit effects on nutrient loadings followed by the resulting nutrient concentrations, such as those on phosphorus [44]. Hence, effects of climatic and population characteristics upon the resulting trade ratios for pollutant reduction credit with levels of water quality improvement may appear more significant if such impacts are applied upon the inflow discharge itself.
- Climatic and population characteristics exhibit impacts on system water quantity and quality with futuristic projections implicating adverse water quality performance. For instance, such futuristic climatic and population projections often implicate increases upon nutrient loads for a system [23,24,25,26]. Increases in levels of nutrient loadings may further implicate adverse impacts upon the system water quality performance, such as decreasing DO under increasing BOD loads [28]. Such linkages among climate, population/inflow changes and the resulting trade ratios appear observed among the Jordan River simulations, with the margins of safety ranging from improving to exacerbating pollutant reduction credit for water quality performance (e.g., margins of safety for climatic characteristics only among all RCP projections from Figure 2b for WQT buyer TN). Meanwhile, such linkages appear particularly observed upon the equivalency factors for trading among distinct nutrients (e.g., buyer TN to seller TP as compared to buyer-to-seller TN, etc.), suggesting the impacts of climate and population characteristics upon the associations among such constituents (e.g., TN as functions of TP and BOD, TP as functions of TN and BOD, etc.). Hence, such characteristics suggest the need for incorporating climate and population impacts upon evaluating the levels of reduction credit achieved under a WQT program.
- WQT Framework over River Systems for Addressing Climate Change and Population Growth Characteristics: Furthermore, the characteristics observed over the Jordan River simulation suggest the need for incorporating climate and population/inflow impacts toward the calculation of trade ratios for assessing levels of reduction credit accomplished, which such linkages often appear neglected from previous WQT programs and guidance manuals. Such effects seem to exhibit significant temporal variability over the distinct RCP projections, inflow adjustments and the constituents subject to the trade, involving the composite trade ratios with such margins of safety over the 4/2007 to 11/2007 timeframe relative to 11/2007 to 06/2008 (e.g., Figure 13 for RCP 6.0 under WQT buyer BOD). Hence, the conceptual framework appears to emphasize the need for incorporating climatic and population impacts as temporally-variant margins of safety upon trade ratios with pollutant reduction and water quality improvement from a WQT program. At the same time, such characteristics suggest the capability of the framework toward potentially predicting such margins of safety for futuristic climate and growth. The framework thus provides opportunities for planning and implementing strategies (e.g., improvements on guidance manuals, public outreach, etc.) for any trading program.
5. Conclusions
- The framework suggests the need for addressing climatic and population growth characteristics on trade ratios involving the levels of pollutant reduction credit achieved from a trading program. The impacts of climatic and population characteristics separately followed by them combined on each trade ratio component (delivery, downstream and equivalency) appear to be observed over the study area among the distinct RCP projections and inflow adjustments applied, implicating such effects upon the levels of inflow pollutant reduction and water quality performance achieved over the removal/trading mechanisms employed. The framework clearly indicates the need for considering climate change and population growth impacts on the derivation of trade ratios, particularly under futuristic conditions for which such effects often suggest deteriorating water quality performance.
- The framework suggests the need for such uncertainty factors defined as margins of safety exhibit temporal variability for addressing climatic and population growth characteristics rather than as single values (e.g., [10,19,20]). Temporal variability on the margins of safety followed by the resulting trade ratios that consider climate and/or population impacts are observed, with such variations potentially exacerbated under futuristic conditions for which nonuniform inflow quantity and quality over distinct climate and land use projections are expected. The framework hence recommends trading guidance manuals address such temporal variability over the derivation of such uncertainty factors for addressing changes in climatic and population growth patterns along a system.
- The framework suggests the need for considering climatic and population growth characteristics on each trade ratio component (e.g., delivery on inflow discharge reduction, downstream on system water quality performance and equivalency on trading over distinct constituents as compared to over a single nutrient) separately before assessing such impacts on the effectiveness of any WQT program. Such variations of climatic and population characteristics appear to be observed over the Jordan River historical run, yielding relatively greater impacts upon water quality performance (e.g., downstream trade ratio component) as compared to levels of inflow pollutant discharge reduction (e.g., delivery ratio component) achieved under the removal/trading mechanisms employed. The framework provides opportunities for analyzing climatic and population impacts through assessing such effects by component, allowing a systematic yet comprehensive evaluation of the effectiveness of a WQT program toward improving the system performance.
Author Contributions
Funding
Institutional Review Board Statement
Informed Consent Statement
Data Availability Statement
Acknowledgments
Conflicts of Interest
References
- Bendor, T.K.; Branham, J.; Timmerman, D.; Madsen, B. Predicting the Existence and Prevalence of the US Water Quality Trading Markets. Water 2021, 13, 185. [Google Scholar] [CrossRef]
- Konishi, Y.; Coggins, J.S.; Wang, B. Water Quality Trading: Can We Get the Prices of Pollution Right? Water Resour. Res. 2015, 51, 3126–3144. [Google Scholar] [CrossRef]
- Ji, Z.-G. Hydrodynamics and Water Quality: Modeling Rivers, Lakes, and Estuaries; John Wiley & Sons, Inc.: Hoboken, NJ, USA, 2008; p. 676. [Google Scholar]
- Duan, J.G. Simulation of Flow and Mass Dispersion in Meandering Channels. J. Hydraul. Eng. 2004, 130, 964–976. [Google Scholar] [CrossRef]
- Chen, D.; Duan, J.G. Case Study: Two-Dimensional Model Simulation of Channel Migration Processes in West Jordan River, Utah. J. Hydraul. Eng. 2008, 134, 315–327. [Google Scholar] [CrossRef]
- Piasecki, M.; Katopodes, N.D. Identification of Stream Dispersion Coefficients by Adjoint Sensitivity Method. J. Hydraul. Eng. 1999, 125, 714–724. [Google Scholar] [CrossRef]
- Deng, Z.-Q.; Singh, V.P.; Bengtsson, L. Longitudinal Dispersion Coefficient in Straight Rivers. J. Hydraul. Eng. 2001, 127, 919–927. [Google Scholar] [CrossRef]
- Deng, Z.-Q.; Bengtsson, L.; Singh, V.P.; Adrian, D.D. Longitudinal Dispersion Coefficient in Single-Channel Streams. J. Hydraul. Eng. 2002, 128, 901–916. [Google Scholar] [CrossRef] [Green Version]
- Deng, Z.-Q.; Jung, H.-S. Scaling Dispersion Model for Pollutant Transport in Rivers. Environ. Model. Softw. 2009, 24, 627–631. [Google Scholar] [CrossRef]
- Guidance for Implementing Water Quality Trading in WPDES Permits; Guidance 3800–2013–04; Wisconsin Department of Natural Resources: Madison, WI, USA, 2013.
- Varanou, E.; Gkouvatsou, E.; Baltas, E.; Mimikou, M. Quantity and Quality Integrated Catchment Modeling under Climate Change with Use of Soil and Water Assessment Tool Model. J. Hydrol. Eng. 2002, 7, 228–244. [Google Scholar] [CrossRef]
- Johnson, T.E.; Butcher, J.B.; Parker, A.; Weaver, C.P. Investigating the Sensitivity of U.S. Streamflow and Water Quality to Climate Change: U.S. EPA Global Change Research Program’s 20 Watersheds Project. J. Water Resour. Plan. Manag. 2012, 138, 453–464. [Google Scholar] [CrossRef]
- Towler, E.; Rajagopalan, B.; Yates, D.; Rodriguez, A.; Summers, R.S. Integrated Approach to Simulate Stream Water Quality for Municipal Supply under a Changing Climate. J. Environ. Eng. 2013, 139, 1432–1440. [Google Scholar] [CrossRef] [Green Version]
- Woodbury, J.; Shoemaker, C.A. Stochastic Assessment of Long-Term Impacts of Phosphorus Management Options on Sus-Tainability With and Without Climate Change. J. Water Resour. Plan. Manag. 2013, 139, 512–519. [Google Scholar] [CrossRef]
- Ahn, J.M.; Lyu, S. Assessing Future River Environments in the Seomjin River Basin Due to Climate Change. J. Environ. Eng. 2017, 143, 04017005. [Google Scholar] [CrossRef]
- Whitehead, P.G.; Wilby, R.L.; Battarbee, R.W.; Kernan, M.; Wade, A. A Review of the Potential Impacts of Climate Change on Surface Water Quality. Hydrol. Sci. J. 2009, 54, 101–123. [Google Scholar] [CrossRef]
- Cox, T.J.; Turner, D.F.; Pelletier, G.J.; Navato, A. Stochastic Water Quality Modeling of an Impaired River Impacted by Climate Change. J. Environ. Eng. 2015, 141. [Google Scholar] [CrossRef]
- Li, Z.; Clark, R.M.; Buchberger, S.G.; Yang, Y.J. Evaluation of Climate Change Impact on Drinking Water Treatment Plant Operation. J. Environ. Eng. 2014, 140, A4014005. [Google Scholar] [CrossRef]
- Idaho Department of Environmental Quality. Water Quality Trading Guidance. Available online: https://www.deq.idaho.gov/media/60179211/water-Quality-Trading-Guidance-1016.Pdf.2016 (accessed on 1 May 2021).
- Water Quality Trading Guidance: A Guide for the Implementation of Water Quality Trading Alternatives to Achieve Watershed Protection and Regulatory Flexibility; Guidance WQ–GEN1–15; Minnesota Pollution Control Agency: Saint Paul, MN, USA, 2021.
- Afed Ullah, K.; Jiang, J.; Wang, P. Land Use Impacts on Surface Water Quality by Statistical Approaches. Glob. J. Environ. Sci. Manag. 2018, 4, 231–250. [Google Scholar]
- Pratt, B.; Chang, H. Effects of Land Cover, Topography, and Built Structure on Seasonal Water Quality at Multiple Spatial Scales. J. Hazard. Mater. 2012, 209-210, 48–58. [Google Scholar] [CrossRef] [PubMed]
- Liyanage, C.P.; Yamada, K. Impact of Population Growth on the Water Quality of Natural Water Bodies. Sustainability 2017, 9, 1405. [Google Scholar] [CrossRef] [Green Version]
- Lee, S.-W.; Hwang, S.-J.; Lee, S.-B.; Hwang, H.-S.; Sung, H.-C. Landscape Ecological Approach to the Relationships of Land Use Patterns in Watersheds to Water Quality Characteristics. Landsc. Urban Plan. 2009, 92, 80–89. [Google Scholar] [CrossRef]
- Johnson, T.E.; Butcher, J.; Deb, D.; Faizullabhoy, M.; Hummel, P.R.; Kittle, J.L.; McGinnis, S.; Mearns, L.O.; Nover, D.M.; Parker, A.G.; et al. Modeling Streamflow and Water Quality Sensitivity to Climate Change and Urban Development in 20 U.S. Watersheds. JAWRA J. Am. Water Resour. Assoc. 2015, 51, 1321–1341. [Google Scholar] [CrossRef]
- Wang, Y.; Choi, W.; Deal, B.M. Long-Term Impacts of Land-Use Change on Non-Point Source Pollutant Loads for the St. Louis Metropolitan Area, USA. Environ. Manag. 2005, 35, 194–205. [Google Scholar] [CrossRef] [PubMed]
- Praskievicz, S.; Chang, H. Impacts of Climate Change and Urban Development on Water Resources in the Tualatin River Basin, Oregon. Ann. Assoc. Am. Geogr. 2011, 101, 249–271. [Google Scholar] [CrossRef]
- Chang, H. Water Quality Impacts of Climate and Land Use Changes in Southeastern Pennsylvania. Prof. Geogr. 2004, 56, 240–257. [Google Scholar]
- Kaushal, S.S.; Groffman, P.M.; Band, L.E.; Shields, C.A.; Morgan, R.P.; Palmer, M.A.; Belt, K.T.; Swan, C.M.; Findlay, S.E.G.; Fisher, G.T. Interaction Between Urbanization and Climate Variability Amplifies Watershed Nitrate Export in Maryland. Environ. Sci. Technol. 2008, 42, 5872–5878. [Google Scholar] [CrossRef]
- Freni, G.; Mannina, G.; Viviani, G. Role of Modeling Uncertainty in the Estimation of Climate and Socioeconomic Impact on River Water Quality. J. Water Resour. Plan. Manag. 2012, 138, 479–490. [Google Scholar] [CrossRef]
- Shin, M.H.; Jang, J.R.; Jung, Y.; Park, Y.S.; Lim, K.J.; Choi, J.D. Effect of Straw Mulch on Runoff and NPS Pollution Reduction from Experimental Plots under a Climate Change Scenario in Korea. J. Irrig. Drain. Eng. 2015, 141, 04015005. [Google Scholar] [CrossRef]
- Giuffria, J.M.; Bosch, D.J.; Taylor, D.B.; Alamdari, N. Costs of Water Quality Goals under Climate Change in Urbanizing Watersheds: Difficult Run, Virginia. J. Water Resour. Plan. Manag. 2017, 143, 04017055. [Google Scholar] [CrossRef]
- Zhou, Q. A Review of Sustainable Urban Drainage Systems Considering the Climate Change and Urbanization Impacts. Water 2014, 6, 976–992. [Google Scholar] [CrossRef]
- Abatzoglou, J.T. Development of Gridded Surface Meteorological Data for Ecological Applications and Modelling. Int. J. Clim. 2013, 33, 121–131. [Google Scholar] [CrossRef]
- Abatzoglou, J.T.; Brown, T.J. A Comparison of Statistical Downscaling Methods Suited for Wildfire Applications. Int. J. Clim. 2011, 32, 772–780. [Google Scholar] [CrossRef]
- Forster, K.; Hanzer, F.; Winter, B.; Marke, T.; Strasser, U. An Open-Source Meteorological Observation Time Series Dis-Aggregation Tool (MELODIST v0.1.1). Geosci. Model. Dev. 2016, 9, 2315–2333. [Google Scholar] [CrossRef] [Green Version]
- Smith, K.; Strong, C.; Wang, S.-Y. Connectivity Between Historical Great Basin Precipitation and Pacific Ocean Variability: A CMIP5 Model Evaluation. J. Clim. 2015, 28, 6096–6112. [Google Scholar] [CrossRef]
- Leblanc, R.T.; Brown, R.D.; FitzGibbon, J.E. Modeling the Effects of Land Use Change on the Water Temperature in Unregulated Urban Streams. J. Environ. Manag. 1997, 49, 445–469. [Google Scholar] [CrossRef]
- Greene, W.H. Econometric Analysis, 7th ed.; Pearson Education: London, UK, 2011; p. 1240. [Google Scholar]
- Porter, R.J.; Wood, J. Exploring Endogeneity of Macroscopic Speed Parameters: Empirical Study During Low Volume Conditions in Construction Work Zones. Transp. Lett. 2013, 5, 27–37. [Google Scholar] [CrossRef]
- Wool, T.; Ambrose, R.; Martin, J.; Comer, A. WASP 8: The Next Generation in the 50-Year Evolution of USEPA’s Water Quality Model. Water 2020, 12, 1398. [Google Scholar] [CrossRef] [PubMed]
- Martin, J.L.; Ambrose, R.B.; Wool, T.A. WASP8 Macro Algae-Model. Theory and User’s Guide; Office of Research and development, U.S. Environmental Protection Agency: Washington, DC, USA, 2018. [Google Scholar]
- Su, J.-Y. Jordan River Modeling through the Water Quality Assessment Simulation Program. (WASP): Model. Report; Division of Water Quality, Utah Department of Environmental Quality: Salt Lake City, UT, USA, 2019. [Google Scholar]
- Nazari-Sharabian, M.; Taheriyoun, M.; Ahmad, S.; Karakouzian, M.; Ahmadi, A. Water Quality Modeling of Mahabad Dam Watershed–Reservoir System under Climate Change Conditions, Using SWAT and System Dynamics. Water 2019, 11, 394. [Google Scholar] [CrossRef] [Green Version]


| Case/Application | A | B | C | D | E | F |
|---|---|---|---|---|---|---|
| Number of Simulations Expected per Climate and Land Use Case | 1 | 3 | 3 | 6 | 4 | 4 |
| Removal Applied upon Point Sources? (Y = Yes; Blank = N/A) | Y | Y | Y | Y | ||
| Removal Applied upon Nonpoint Sources? (Y = Yes; Blank = N/A) | Y | Y | Y | |||
| Case Applied for WQT Framework for Distinct Trade Ratio Components (e.g., Delivery, Downstream, Equivalency)? (Y = Yes; Blank = N/A) | Y | Y | Y | Y | ||
| Derive Trade Ratio for Uncertainty due to Climate Change Characteristics? (Y = Yes; Blank = N/A) | Y | Y | Y | |||
| Derive Trade Ratio for Uncertainty due to Population Growth? (Y = Yes; Blank = N/A) | Y | Y | Y | |||
| Statistical Analyses for WQ Constituent against Climate Change and Population Growth? (Y = Yes; Blank = N/A) | Y | Y | Y | |||
| Statistical Analyses among Levels of Removal, WQ Performance, Climate Change and Population Growth? (Y = Yes; Blank = N/A) | Y | Y | Y | |||
| Relevant Cases to-be-compared against for WQT Trade Ratios (Blank = N/A) | B, C | A, C | A, B | A, C | ||
| Relevant Cases to-be-compared against for relationships upon nutrient removal levels (Blank = N/A) | E, F | A | A |
Publisher’s Note: MDPI stays neutral with regard to jurisdictional claims in published maps and institutional affiliations. |
© 2021 by the authors. Licensee MDPI, Basel, Switzerland. This article is an open access article distributed under the terms and conditions of the Creative Commons Attribution (CC BY) license (https://creativecommons.org/licenses/by/4.0/).
Share and Cite
Su, J.-Y.; Goel, R.; Burian, S.; Hinners, S.J.; Kochanski, A.; Strong, C.; Barber, M.E. Water Quality Trading Framework with Uncertainty for River Systems Due to Climate and Population Characteristics. Water 2021, 13, 1738. https://doi.org/10.3390/w13131738
Su J-Y, Goel R, Burian S, Hinners SJ, Kochanski A, Strong C, Barber ME. Water Quality Trading Framework with Uncertainty for River Systems Due to Climate and Population Characteristics. Water. 2021; 13(13):1738. https://doi.org/10.3390/w13131738
Chicago/Turabian StyleSu, Juhn-Yuan, Ramesh Goel, Steven Burian, Sarah J. Hinners, Adam Kochanski, Courtenay Strong, and Michael E. Barber. 2021. "Water Quality Trading Framework with Uncertainty for River Systems Due to Climate and Population Characteristics" Water 13, no. 13: 1738. https://doi.org/10.3390/w13131738
APA StyleSu, J.-Y., Goel, R., Burian, S., Hinners, S. J., Kochanski, A., Strong, C., & Barber, M. E. (2021). Water Quality Trading Framework with Uncertainty for River Systems Due to Climate and Population Characteristics. Water, 13(13), 1738. https://doi.org/10.3390/w13131738