Article

Experimental Study on Hydraulic Conductivity and Resistance in Silty Sediments

1
State Key Laboratory of Ocean Engineering, Collaborative Innovation Center for Advanced Ship and Deep-Sea Exploration, School of Naval Architecture, Ocean and Civil Engineering, Shanghai Jiao Tong University, Shanghai 200240, China
2
China Communications Construction Company, National Engineering Research Center Dredging Technology and Equipment CO., LTD., Shanghai 200082, China
*
Author to whom correspondence should be addressed.
Water 2021, 13(1), 75; https://doi.org/10.3390/w13010075
Submission received: 26 October 2020 / Revised: 25 December 2020 / Accepted: 26 December 2020 / Published: 31 December 2020
(This article belongs to the Section Hydraulics and Hydrodynamics)

Abstract

:
Hydraulic conductivity k as a function of void ratio e and particle diameter for silty sediment was experimentally investigated, and an empirical formula for the estimation of hydraulic conductivity was proposed. Seepage resistance for flow in silty sediment was deliberated. Based on the findings of the study, it was concluded that hydraulic conductivity k could be expressed as an exponential function of void ratio e and median particle diameter d50 {3.1 μm < d50 < 87 μm and 0.26 < e < 4}. It was further found that the formula of seepage resistance factor ( 𝜆 ), a form of friction factor, varies linearly with Reynolds number ( R e ) for silty sediments. A family of such λ - R e curves for various particle diameter d50 is presented.

1. Introduction

Utilization of dredged fine sediments has attracted wide attention in recent years. In China, the total quantity of dredged fine sediments was 395.5 million m3 in 2017, and that included 169 million m3 from various construction activities related to coastal reservoirs, ports and waterways, 10.3 million m3 from the maintenance of reservoirs, ports and waterways, 142.2 million m3 from land reclamation, and 74 million m3 from various environmental projects. Naturally, these dredged soils are mainly composed of clay, silt, mud, and a certain amount of silty sand/sandy particles. Grain size distribution shows a wide grading range. Soil characteristics are different from those of sandy granular materials, as dredged materials exhibit certain cohesive characteristics, low permeability, and weak bearing capacity. In the past, these dredged materials were difficult to use and were dumped in certain designated sites instead. However, with sandy material in short supply today, and river/beach sand mining viewed as being not environmentally friendly, engineers and developers have sought to utilize dredged materials as landfill materials instead of dumping them as waste [1]. Other uses include creation of certain fish and wildlife habitats [2,3]. Such use of dredged fine sediments (with appropriate engineering considerations and treatments) would be the modus operandi of our time and the time to come. For example, the Leqing port, a major satellite facility of the Wenzhou Port in the Zhejiang province of China, was recently hydraulically reclaimed using dredged clay slurry as landfill material. This clay slurry was dredged from the port basin and waterways at the coastal regions and hydraulically piped to the land reclamation area. The hydraulically filled area was over 7000 acres and up to 6.5 m in depth. Median particle diameter and initial water content of the dredged soil were 7.26 μm and 175% or higher by volume, respectively. Due to the low permeability and strong ability to bind water, the bearing capacity of the reclaimed land was still very low many weeks later [4].
Leachate from land filled with dredged material may have serious concerns in terms of environmental safety, stability of the reclaimed land, and the infrastructure built on said land. The leachate with hazardous pollutants might affect the quality of the groundwater [5,6,7]. Release of water through seepage or consolidation of slurry materials would lead to settlement and may induce slope failure and cofferdam breaches [8,9,10]. It has been reported that silty/muddy materials typically exhibit certain distinct physical characteristics very much different from those of noncohesive granular sediments. Grain size of silty/muddy sediment measures in microns, and grain size distribution typically covers several orders of magnitude and the specific surface area of the particle is large [11]. This fine soil exhibits strong cohesive and viscous characteristics. As a result, seepage flow through the tortuous passages of silty sediments is complex due to interactions between the fluid and fine particles [12].
There are many reported studies on seepage flow through sedimentary beds, but the details on seepage flow in silty sediments are still controversial [13]. The key parameter used to describe seepage flow is hydraulic conductivity. Equations (1)–(7) are some of the reported formulae used to calculate hydraulic conductivity k of sedimentary beds [14,15,16,17,18,19,20,21,22]:
k = A d 10 2
log k = log k 0 e 0 e C k
log k = A log e + B
k = C F 1 S 2 e 3 1 + e r w μ ρ m 2
k = ε 3 1 ε 2 r w μ d m 2 180
k = ε 3 5 1 ε 2 d 50 6 2
ln k = 7.617 + 3.486 ln e + 1.235 ln d 50
where e ,   e 0 , ε , and k 0 are void ratio and initial void ratio, porosity, and initial hydraulic conductivity of sedimentary beds; C F , S ,   ρ m , and   d m are shape coefficient, specific surface area, density, and size of grains that are x% (by weight) finer than the specified diameter of the sediment particle; r w is unit weight; μ is coefficient of dynamic viscosity of seepage flow; A , B , and C k are coefficients. Among the many factors that affect hydraulic conductivity of silty soil, particle diameter and void ratio are the two major factors. However, there is no consensus on how these factors influence hydraulic conductivity of fine silty sediments. Taylor [17] suggested that an empirical linear relationship exists between the logarithm of k and void ratio e, while Mesri and Olson [18] proposed that a linear relationship exists between log k and log e . Others believed that k is proportional to e n / 1 + e [19,20]. Some researchers indicated that hydraulic conductivity is affected by effective particle diameter d10 [23,24]. Chen et al. [25] found that hydraulic conductivity is strongly related to median diameter d50. Some researchers even doubt whether these equations are sufficiently accurate for a silty sediment [26,27].
In addition, seepage resistance in silty sediment still needs to be investigated. Seepage resistance through a porous medium is generally characterized by the friction factor λ and Reynolds number R e , where the parameters λ and R e represent the resistance to flow past the sediment particles and the flow regime, respectively. There are many studies on seepage resistance, but most are focused on packed beds. Ergun equation [28,29] is one of the representative equations that describes the seepage resistance–Reynolds number relation for fluid flow through packed beds, which can be written as:
λ = 1.75 + 150 1 ε R e
where ε is soil porosity. Macdonald et al. [30] and Moutsopoulos et al. [31] suggested that the gradation of silty sediment might also have important influence on flow resistance. In the case of dredged cohesive sediments, the soils usually exhibit certain rheological properties and behave as a viscous fluid [1]. The rheological behaviors of dense cohesive sediments are typically non-Newtonian and non-time-invariant. The rheological properties of cohesive sediments subject to shear loads are sensitive to both shear rate and time. The internal structures of bulk cohesive sediments with the same water content and sediment grain size may vary due to their different settlement histories [32,33]. Therefore, one would expect that resistance to seepage in silty sediments would be distinctly different from that in porous media composed of coarse grain materials. Thus, the reported seepage resistance models may not be applicable to silty sediments, and a new seepage resistance model needs to be developed.
The aim of this study is to investigate hydraulic conductivity and seepage resistance in a silty cohesive soil. For this purpose, extensive seepage tests were planned, designed, and the experiments carried out using a cylindrical permeameter for seven types of silty sediments. Grain size distribution, hydraulic conductivity, and Reynolds number were measured. The variation of hydraulic conductivity with void ratio for various silty sediments was examined and analyzed, and a formula for calculating seepage resistance in silty sediment beds was developed. The relationship between seepage resistance and particle Reynolds number was deliberated in detail.

2. Material and Methods

Thirty-five sets of seepage experiments were conducted at the coastal laboratory in Shanghai Jiao Tong University. The experimental setup and procedures are described herein.

2.1. Experimental Setup

A standard cylindrical permeameter (TST-55 type, Nanjing Nantu Instrument Equipment Co. LTD., Nanjing, China) was used for the seepage experiments, see Figure 1. The permeameter was 118 mm in outer diameter, and 155 mm high. The test sample inside the permeameter was 61.8 mm in diameter and 40 mm high (the shortest seepage path in the test sample L = 40 mm). Both the upper and lower porous stones were 61.8 mm in diameter and 10 mm high. The permeability coefficient of the porous stone was greater than 10−3 cm/s, which was much higher than that of the silty sediment samples.
A constant water head flow condition was set up in these experiments, see Figure 2. Two piezometers were installed at the inlet and outlet of the permeameter to measure the respective water head, and the water head difference Δ h between them. The outflow water was collected in a glass cylinder and weighed using an electronic balance (±0.01 g) to determine mass flowrate. Bulk seepage velocity was calculated accordingly, and hydraulic conductivity was calculated based on Darcy’s law.

2.2. Test Materials

Seven types of silty sediments were tested in this study. The sediments were dried in an oven at a temperature of 105 °C for 12 h. The dried sediments were broken up and sieved through a 1.0 mm mesh to remove impurities such as fibers, small stones, and shellfish. Then, an ultrasonic vibrator was used to break up the floc structure and to disperse the sediment particles in order to minimize the effect of flocculation on grain size analysis [34]. Grain size distribution for the sediment was evaluated using a TZC-4 particle diameter analyzer (Shanghai Tongfang Instrument Company, Shanghai, China), which is an automated sedimentation balance used for determining grain size distribution and median grain size of sediment particles. The measurement range of the analyzer was 1–60 μm, and the accuracy of the sedimentation balance was 0.1 mg. The measured grain size distributions of these soils are plotted in Figure 3.
Median grain size, specific gravity, uniformity coefficient, and standard deviation of grain size of all seven sediment types are tabulated in Table 1.
The uniformity coefficient σg in Table 1 is defined as [35]:
σ g = 1 2 ( d 84 d 50 + d 50 d 16 )
where d x is the size of grains that are x% (by weight) finer than the specified diameter.

2.3. Test Procedure

Before each test, the selected sediment was blended with certain predetermined amount of water using a mechanical mixer and remolded to uniform consistency. Void ratio was recorded. The test procedures are outlined as follows:
(1)
In order to reduce the sidewall effect, i.e., to prevent seepage water from flowing through the gap between the soil and inner wall, a thin layer of Vaseline was applied uniformly on the wall of the cutting ring.
(2)
The test sample (with known void ratio) was placed in the permeameter.
(3)
The permeameter was then sealed hermetically and tightly, and the flow inlet, outlet, and piezometer tubes were connected.
(4)
The inlet valve was turned on to let water flow into the permeameter at a steady rate. The bubbles inside the permeameter and piezometer tubes were purged carefully, and the temperature and viscosity of the water were recorded.
(5)
When the water flow rate was steady, a certain amount of outflow water was collected, and the corresponding time interval was recorded. The water levels of the piezometer tubes were also observed and recorded.
(6)
Each test was performed three times to minimize the measurement error.

3. Results

Thirty-five sets of experimental results were obtained. Particle diameter d50 was in the range of 7.26–70.32 μm (Table 1), and void ratio was in the range of 0.566–3.467 (Table 2).
Based on the measured flow rate and hydraulic head gradient across the test sample, hydraulic conductivity k (cm/s) was calculated. The variation of hydraulic conductivity with void ratio e was analyzed as described below.

3.1. Hydraulic Conductivity of Silty Sediments

Hydraulic conductivity k (cm/s) at various void ratio e for all tested sediment types is plotted in Figure 4.
It can be seen from Figure 4 that, for a given soil type, hydraulic conductivity k increases with void ratio. There exists an obviously positive linear relationship between log k   and log e , which can be represented by a simple linear function [15] as follow:
log k = a + b   ( log e )
where a and b are the intercept and slope of the fitted straight line. In several empirical models, the parameters a and b are determined as constant, and the logarithmic value of hydraulic conductivity is treated as a simple linear function of the logarithmic value of void ratio [36]. However, the experimental results in Figure 4 show that particle diameter may have certain important effects on hydraulic conductivity in silty sediments, and the parameters a and b of different soil types may be identified and distinguished based on the value of particle diameter d50. Figure 5 shows that a linear relationship exists between parameters a, b and particle diameter d50.
It is clear then that hydraulic conductivity of silty sediments is dependent on void ratio e and particle diameter d50. By performing linear regression analysis, a best fit relationship was obtained to correlate log k , log e , and log d 50 , as follow:
log k = 5.66   ( log e ) + 3.32   ( log d 50 ) 5.38   ( log e ) log d 50 0.02
and k (cm/s) may be expressed in an exponential form as follow:
k = 10 5.66 log e + 3.32 log d 50 5.38 log e log d 50 0.02
The coefficient of correlation R2 and standard deviation are 0.93 and 0.30, respectively.
Experimental data of Zhang et al. [1] and Chapui and Robert [21] are also used to verify equation (12), and the reported particle diameters d50 were in the range of 45–87 μm and 3.1–6.17 μm, and void ratios were in the range of 0.26–0.41 and 1–4, respectively.
In addition, two widely used equations are also included here for comparison. One is the Kozeny–Carman Equation (6), and the other is Equation (7) proposed by Chen et al. [25].
Figure 6 shows the measured and computed hydraulic conductivity using Equations (6), (7) and (12).
Figure 6 indicates that the predicted hydraulic conductivity of silty sediment using Equations (6) and (7) produces a large error. Generally, the computed values using Equations (6) and (7) are much smaller than the measured values except for several data points. Therefore, these two equations may be considered weakly applicable to estimating hydraulic conductivity of a silty sediment. It can be seen that the proposed Equation (12) provides a good estimate of k, and almost all the computed k values for these soils fit into the band between the lower bound of one third (y = x/3) and the upper bound of three (y = 3x) times the value. Therefore, one may conclude that Equation (12) is applicable to estimating hydraulic conductivity k in silty sediments with particle diameter, d50 (3.1 μm < d50 < 87 μm) and void ratio, e (0.26 < e < 4).

3.2. Seepage Resistance for Seepage Flow in Silty Sediments

The seepage flow in silty cohesive soils follows the path of a very complex capillary drainage conduit through the pore spaces of the soil matrix. For the simplicity of analysis, one may assume that the sediment particles are spherical and the seepage pathway is a bundle of tortuous capillaries with a uniform circular cross section and diameter. Generally, for the steady uniform flow in a uniform pipe, the total water head drop h f can be estimated by:
h f = λ L d v 0 2 2 g
where λ is Darcy–Weisbach friction factor, L is length of flow path, d is diameter of the pipe, v 0 is flow velocity, and g is the gravitational constant.
The total water head loss h f can be calculated by:
h f = Δ p ρ g
where Δ p (Pa) is total pressure difference between the inlet and outlet, and ρ is fluid density.
Presumably, for the flow in microscopic drainage conduits, the total pressure drop can be estimated using Equation (13). The microscopic drainage conduits in porous media are analogous to a group of circular capillaries parallel to the direction of flow [37]. These capillaries are tortuous and of complicated shape but may be viewed as tubes with a constant cross-sectional area, on average. The actual length of the flow path is L = L 0 τ , where L 0 is straight length or thickness of a test sample in the permeameter, and τ is tortuosity of the drainage conduits. According to Yu and Li [38], τ is a function of porosity, ε , which can be given by:
τ = 1 2 ( 1 + 1 2 1 ε + 1 ε 1 1 ε 1 2 + 1 4 1 1 ε )
d is defined as the equivalent drainage-conduit diameter. For a tube flow, the diameter d and hydraulic radius R h are related as d = 2 r = 4 R h , where r is the radius of the drainage conduit. According to Ergun [28], R h is defined by R h = ε / α with the specific area of solid, α = 6 1 ε / d s , where d s is the particle diameter. Thus, the conduit diameter d can be expressed as:
d = 2 ε d s 3 1 ε
The actual velocity of the fluid is given by v 0 = v / ε , where v is the average velocity. v is expressed as:
v = q t A = Δ m ρ A Δ t
where q t is the volume of outlet flow per unit time, A is the cross-sectional seepage area, and Δ m is the mass of the flow within a seepage time interval Δ t .
Finally, the total pressure drop may be rewritten as:
Δ p ρ g = h f = λ · 3 L 0 τ 1 ε 2 ε d s · v 2 2 g
and the friction factor is given as:
λ = 4 3 Δ p L 0 τ d s ρ v 2 ε 3 1 ε
The particle Reynolds number is introduced to describe the flow regime, and is defined as:
R e = ρ v 0 d s μ
where μ is the dynamic viscosity of water and d s is replaced by the median size d 50 .
Hence, λ and the corresponding R e during the seepage process can be calculated. Based on the experimental data obtained in this study, the variation of seepage friction factor or resistance and particle Reynolds number is listed in Figure 7. Detailed data is shown in Supplementary Materials.
It is clear from Figure 7 that for flow seepage in each type of silty sediment, the seepage resistance or friction factor is linear with Reynolds number. The larger the Reynolds number, the smaller the seepage resistance. In addition, the variation of the resistance against Reynolds number is distinct for a certain sediment type, regardless of its porosity (or water content), and the slopes of the λ versus R e curves vary with sediment type. For the type 1 sediment, where d50 is the smallest (7.26 µm), the λ - R e curve is the steepest. However, the slope of the λ versus R e curves decreases with the increase of median grain size. When grain size is larger than 60 µm (e.g., sediment type 6 and type 7), the logarithmic λ - R e line tends to assume a gentle slope of −1. It may be inferred that when grain size is larger than 60 µm, the formulae which are used to calculate hydraulic resistance in coarse-grained porous media may be also applicable.
According to Figure 7, one may deduce that the general relationship between λ and R e for seepage flow in silty sediments can be expressed in the following form:
λ 1 ε ε = f R e m ,   m < 1
where m is the slope of λ versus R e curve in the log-log plot. Here, m is related to particle diameter d 50 and uniformity coefficient σ g . The coefficient f may not be a constant and depends on d 50 and σ g   as well. Introducing the principle of dimensional analysis, the dimensionless particle diameter d * is introduced to replace the median particle diameter, which is commonly defined as [39]:
d * = d 50 g ρ s ρ / ρ ν 2 1 3
The values of m and f for the seven types of sediments are listed in Table 3 and Figure 8 and Figure 9. Only type 1–5 sediments as the corresponding m-values are less than −1.
It can be seen in Figure 8 and Figure 9 that both parameters m and f can be expressed as a function of d * / σ g , and can be respectively expressed as:
m = 16.03 ( d * σ g ) 2 3.22 d * σ g 1.58
And
f = 0.32 e 35.75 d * σ g
Finally, the relationship of λ with R e in fine silty sediments can be rewritten as:
λ = 0.32 ( ε 1 ε ) e 35.75 d * σ g R e 16.03 ( d * σ g ) 2 3.22 d * σ g 1.58

4. Discussions

Seepage resistance versus Reynolds number obtained in the present study (for silty sediments) and by other researchers [40,41,42,43,44,45,46,47,48] (for porous media mainly composed of coarse particles) are plotted together in Figure 10.
The results from the present experiments and other studies all show the same trend, i.e., the friction factor increases consistently with a decreasing Reynolds number, and the relationship of flow resistance and Reynolds number is linear in the log-log plot. It is also clear from Figure 10 that for flow through coarse sediment, the slope of λ - R e curve on the log-log plot is −1, so that λ as a function of R e is usually expressed as λ = A / R e . The value of the coefficient A could range from 150 to 200, and is known to be mainly influenced by particle shapes, grain sizes, porosities of the porous medium, and fluid properties [42]. Generally, A = 150 is accepted for flow which may be described by the power law, and A = 180 is commonly used in the case of a Newtonian fluid. Seepage flow in coarse sediments is mainly due to free-flowing fluid such that the flow resistance is strongly affected by an individual soil particle, and each type of coarse particle has a different “roughness”. In contrast to seepage flow through coarse sediments, seepage flow through silty sediments is affected by the surface roughness of the particles, and the effects of fluid viscosity for flow through very small interconnected pores. In some cases, the effect of viscosity dominates the behavior of the seepage flow. As the grain size is finer, the corresponding specific surface area is larger, and the effects of viscosity much greater. This enhances the ability of sediment particles to “bind” with water, which results in larger flow resistance in silty sediments. As described in Section 3.2, for flow in silty sediments, the slope of λ - R e curve is variable, and is dependent on the sediment properties, including grain size and uniformity coefficient. Generally, the slope of the λ - R e curve is smaller for the case of finer grain size. For the two types of sediments (type 6 and type 7), grain sizes are relatively large (60.01 and 70.32 μm, respectively), and the slopes of both λ - R e curves (log-log) are nearly −1. The relationships between λ and R e of these two sediment types agree well with the results obtained by Fancher and Lewis [41], and can be expressed as λ = A / R e . However, for the other sediments (types 1–5), the values of the slopes of λ - R e curves (log-log) are less than −1, and the λ - R e curves are steeper than those of the coarse-grain sediments. The sediment with the least grain size ( d 50 = 7.26   μ m ) had the steepest slope (−1.63).
In addition, the salinity of the dredged silty sediments may also play an important role on hydraulic conductivity and seepage resistance, as salinity may alter the chemical bonds, surface charge characteristics and rheological properties of the sediments. However, the effect of salinity may be complex and is not considered in the present study. Such issue needs further investigation.

5. Conclusions

In this study, hydraulic conductivity as well as seepage resistance in silty sediments have been investigated extensively. Thirty-five sets of seepage tests were conducted using seven types of silt sediment samples and at various void ratios. The variation of hydraulic conductivity as a function of void ratio was analyzed. The equation for estimating hydraulic conductivity was proposed and verified with data reported by others. The following conclusions are drawn from the findings of this study:
(1)
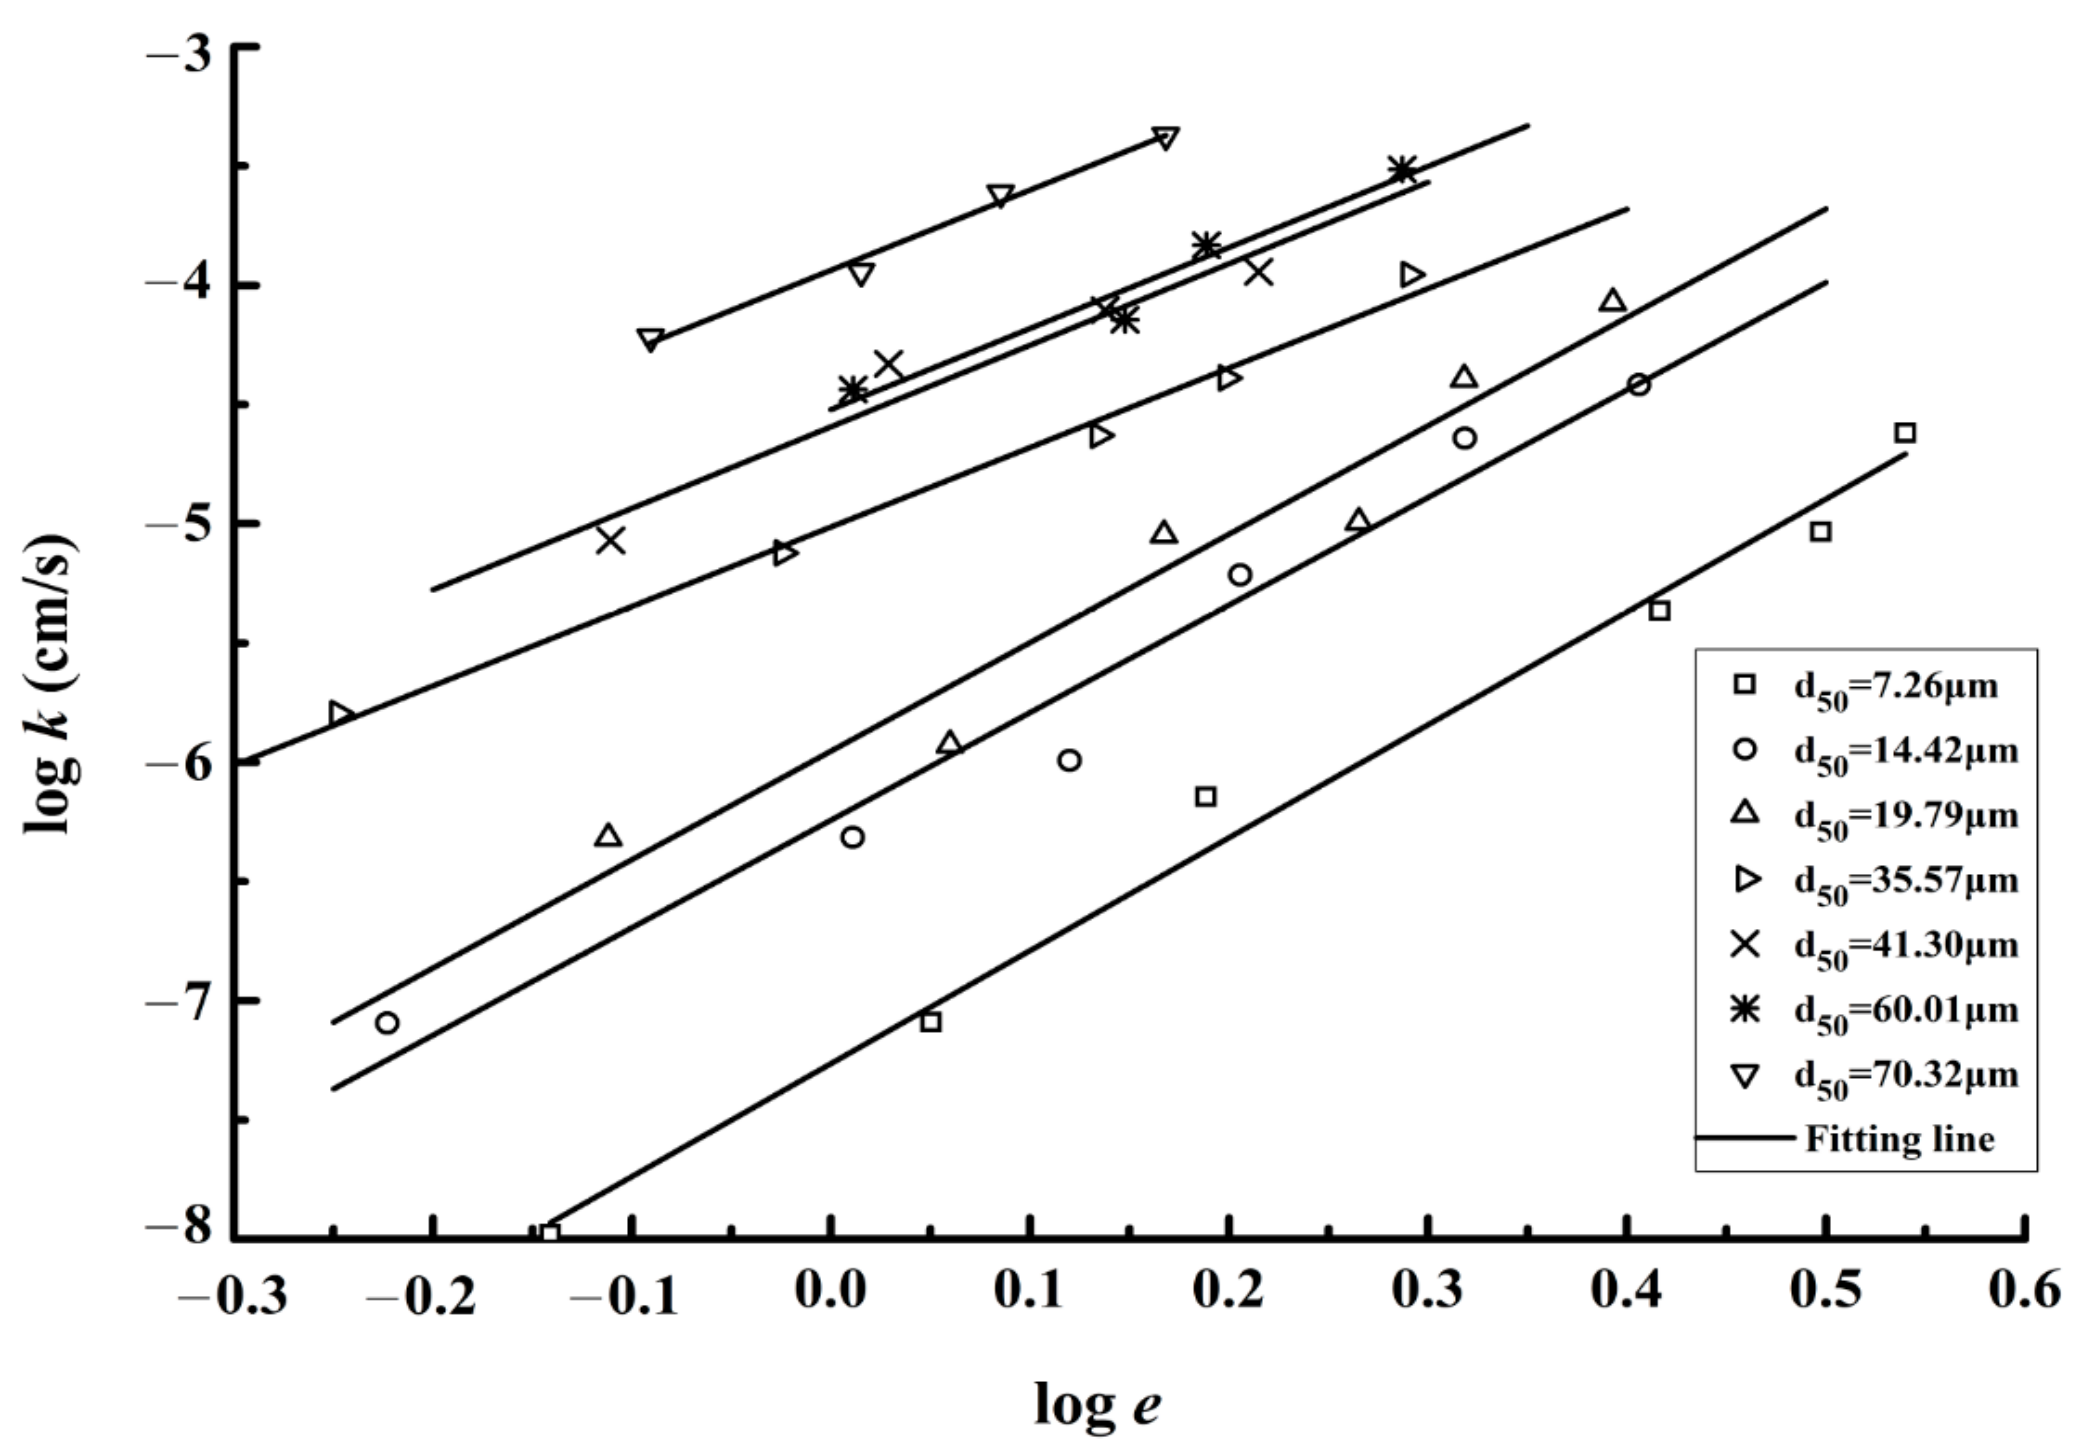
Hydraulic conductivity k is closely related to void ratio e and particle diameter d50 in silty sediments, and it was found that log k   is a linear function of log e .
(2)
An empirical equation for the estimation of hydraulic conductivity was proposed, and was found applicable for particle grain size, d50 (3.1 μm < d50 < 87 μm) and sediment void ratio e (0.26 < e < 4).
(3)
The friction resistance to seepage flow in silty sediments exhibits distinct characteristics similar to seepage flow in coarse-grained sediments. The slopes of λ versus R e curves for seepage in silty sediments are variable and the value of the slope (log-log plot) decreases with increasing grain size, while the slope remains constant (−1) for flow in coarse-grained sediments.
(4)
The formulae for calculating the seepage friction factor in coarse-grained sediments are not applicable for silty sediments. A formula for calculating λ in silty sediments has been proposed. The value of λ in silty sediments is larger than that in coarse-grained sediments for the same Reynolds number R e .

Supplementary Materials

The detailed data is available online at https://www.mdpi.com/2073-4441/13/1/75/s1.

Author Contributions

Conceptualization, data curation, formal analysis, investigation, validation, writing—Original draft (W.Z.); methodology, software, writing—Review and editing (M.Z.); data curation, resources, software (H.S.); supervision, funding acquisition (G.Y.). All authors have read and agreed to the published version of the manuscript.

Funding

This research was funded by The National Natural Science Foundation of China, grant number 51779137.

Institutional Review Board Statement

Not applicable.

Informed Consent Statement

Not applicable.

Data Availability Statement

Data is contained within the article or Supplementary Materials.

Acknowledgments

The authors gratefully acknowledge the financial support provided by the National Natural Science Foundation of China (grant number 51779137). The authors are thankful to the editors and anonymous reviewers for their valuable comments and suggestions to improve the quality of the paper.

Conflicts of Interest

The authors declare no conflicts of interests. The funders had no role in the design of the study; in the collection, analyses, or interpretation of data; in the writing of the manuscript, or in the decision to publish the results.

References

  1. Zhang, M.; Zhu, X.; Yu, G.; Yan, J.; Wang, X.; Chen, M.; Wang, W. Permeability of muddy clay and settlement simulation. Ocean Eng. 2015, 104, 521–529. [Google Scholar] [CrossRef]
  2. Wu, D.Q.; Guo, L. Research progress of recycling Singapore solid wastes for land reclamation. Res. Environ. Sci. 2018, 31, 1174–1181. [Google Scholar]
  3. Vikolainen, V.; Bressers, H.; Lulofs, K. A shift toward building with nature in the dredging and port development industries: Managerial implications for projects in or near natural 2000 areas. Environ. Manag. 2014, 54, 3–13. [Google Scholar] [CrossRef] [PubMed] [Green Version]
  4. Zhu, W.; Yan, J.; Yu, G. Vacuum preloading method for land reclamation using hydraulic filled slurry from the sea: A case study in coastal China. Ocean Eng. 2018, 152, 286–299. [Google Scholar] [CrossRef]
  5. Kaethigesu, T. Validity of Darcy’s Law for Low-Gradient Saturated flow through Bentonite and Sand Mixtures. Ph.D. Thesis, University of Manitoba, Winnipeg, MB, Canada, 1994. [Google Scholar]
  6. Sondergaard, M.; Jensen, J.P.; Jeppesen, E. Role of sediment and internal loading of phosphorus in shallow lakes. Hydrobiologia 2003, 506–509, 135–145. [Google Scholar] [CrossRef]
  7. Huang, X.; Liang, P.; Qian, Y. Excess sludge reduction induced by Tubifex tubifex in a recycled sludge reactor. J. Biotechnol. 2007, 127, 443–451. [Google Scholar] [CrossRef]
  8. Wang, L.; Yu, L.; Guo, Z. Seepage induced soil failure and its mitigation during suction caisson installation in silt. J. Offshore Mech. Arct. 2013, 136, 011103. [Google Scholar] [CrossRef]
  9. Steedman, R.S.; Sharp, M.K. Physical modelling analysis of the New Orleans levee breaches. Proc. Inst. Civil Eng. Geotech. Eng. 2011, 164, 353–372. [Google Scholar] [CrossRef]
  10. Olson, K.R.; Morton, L.W. The impacts of 2011 induced levee breaches on agricultural lands of Mississippi river valley. J. Soil Water Conserv. 2012, 67, 5–10. [Google Scholar] [CrossRef] [Green Version]
  11. Zhu, W.; Zhang, M.; Yu, G.; Petukhov, V.; Mymrin, V.; Gidarakos, E. Flow Resistance in Dredged Soil under a Vacuum Preloading System with Vertical Drainage Boards. J. Coastal Res. 2020, 36, 327–338. [Google Scholar] [CrossRef]
  12. Thiruvengadam, M.; Kumar, G.N.P.; Sivakumar, D.; Mohan, C. Non-dimensional equation of resistance coefficient with Reynolds number of porous media. Indian J. Sci. Technol. 2016, 9, 1–7. [Google Scholar] [CrossRef]
  13. Liu, H.; Li, L.; Birkholzer, J. Unsaturated properties for non-Darcian water flow in clay. J. Hydrol. 2012, 430–431, 173–178. [Google Scholar] [CrossRef] [Green Version]
  14. Chakraborty, D.; Chakraborty, A.; Santra, P.; Tomar, R.K.; Kalra, N. Prediction of hydraulic conductivity of soils from particle-size distribution. Curr. Sci. 2006, 90, 1526–1531. [Google Scholar]
  15. Roque, A.J.; Didier, G. Calculating hydraulic conductivity of fine-grained soils to leachates using linear expressions. Eng. Geol. 2006, 85, 147–157. [Google Scholar] [CrossRef]
  16. Chung, C.K.; Kim, J.H.; Kim, J.; Kim, T. Hydraulic conductivity variation of coarse-fine soil mixture upon mixing ratio. Adv. Civ. Eng. 2018, 2018, 6846584. [Google Scholar] [CrossRef] [Green Version]
  17. Taylor, D.W. Fundamentals of soil mechanics. Soil Sci. 1948, 66, 161. [Google Scholar] [CrossRef]
  18. Mesri, G.; Olson, R.E. Mechanisms controlling the permeability of clays. Clay. Clay Miner. 1971, 19, 151–158. [Google Scholar] [CrossRef]
  19. Samarasinghe, A.M.; Huang, Y.H.; Drnevich, V.P. Permeability and consolidation of normally consolidated soils. J. Geotech. Eng. Division 1982, 108, 835–850. [Google Scholar] [CrossRef]
  20. Ren, X.; Zhao, Y.; Deng, Q.; Li, D.; Wang, D. A relation of hydraulic conductivity–void ratio for soils based on Kozeny-Carman equation. Eng. Geol. 2016, 213, S0013795216302836. [Google Scholar] [CrossRef]
  21. Chapuis, R.P. Predicting the saturated hydraulic conductivity of soils: A review. Bull. Eng. Geol. Environ. 2012, 71, 401–434. [Google Scholar] [CrossRef]
  22. Ishaku, J.M.; Gadzama, E.W.; Kaigama, U. Evaluation of empirical formulae for the determination of hydraulic conductivity based on grain-size analysis. J. Geol. Min. Res. 2011, 3, 105–113. [Google Scholar]
  23. Beyer, W. Hydrogeologische untersuchungen bei der ablagerung von wasserschadstoffen. Z. Fuer Angew. Geol. 1966, 12, 599–606. (In German) [Google Scholar]
  24. Odong, J. Evaluation of empirical formula for determination of hydraulic conductivity based on grain size analysis. J. Am. Sci. 2007, 3, 54–60. [Google Scholar]
  25. Chen, C.Y.; Bullen, A.G.R.; Elnaggar, H.A. Permeability and Related Principles of Coal Refuse. Transp. Res. Rec. 1977, 640, 49–52. [Google Scholar]
  26. David, W.; Lii, C.; Asce, F. Goodbye, Hazen; Hello, KozenyCarman. J. Geotech. Geoenviron. Eng. 1962, 40, 260–261. [Google Scholar]
  27. Sanzeni, A.; Colleselli, F.; Grazioli, D. Specific surface and hydraulic conductivity of fine-grained soils. J. Geotech. Geoenviron. 2013, 139, 1828–1832. [Google Scholar] [CrossRef]
  28. Ergun, S. Fluid flow through packed columns. Chem. Eng. Prog. 1952, 48, 89–94. [Google Scholar]
  29. Liakopoulos, A.; Sofos, F.; Karakasidis, T.E. Friction factor in nanochannel flows. Microfluid. Nanofluid. 2016, 20, 20–24. [Google Scholar] [CrossRef]
  30. Macdonald, I.F.; El-Sayed, M.S.; Mow, K.; Dullien, F.A.L. Flow through Porous Media—the Ergun Equation Revisited. Ind. Eng. Chem. Fundam. 1979, 18, 199–208. [Google Scholar] [CrossRef]
  31. Moutsopoulos, K.N.; Papaspyros, I.N.E.; Tsihrintzis, V.A. Experimental investigation of inertial flow processes in porous media. J. Hydrol. 2009, 374, 242–254. [Google Scholar] [CrossRef]
  32. Yang, W.; Yu, G.; Tan, S.K.; Wang, H. Rheological properties of dense natural cohesive sediments subject to shear loadings. Int. J. Sediment Res. 2014, 29, 454–470. [Google Scholar] [CrossRef]
  33. Zhang, M.; Yu, G.; Rovere, A.L.; Ranzi, R. Erodibility of fluidized cohesive sediments in unidirectional open flows. Ocean Eng. 2017, 130, 523–530. [Google Scholar] [CrossRef]
  34. Zhang, M.; Yan, J.; Wang, X.; Chen, M.; Zhao, D.; Yu, G. Application of ultrasonic vibrator to sedimentation analysis m23sive sediment grain size. Water Resour. Hydropower Eng. 2014, 45, 100–103. (In Chinese) [Google Scholar]
  35. Yu, G.L.; Lim, S.Y. Modified manning formula for flow in alluvial channels with sand-beds. J. Hydraul. Res. 2003, 41, 597–608. [Google Scholar] [CrossRef]
  36. Dolinar, B. Predicting the hydraulic conductivity of saturated clays using plasticity–value correlations. Appl. Clay Sci. 2009, 45, 90–94. [Google Scholar] [CrossRef]
  37. Carman, P.C. Fluid flow through granular beds. Transp. Inst. Chem. Eng. 1997, 15, 32–48. [Google Scholar] [CrossRef]
  38. Yu, B.; Li, J. A geometry model for tortuosity of flow path in porous media. Chin. Phys. Lett. 2004, 21, 1569–1571. [Google Scholar]
  39. Zhang, M.; Yu, G. Critical conditions of incipient motion of cohesive sediments. Water Res. Res. 2017, 53, 7798–7815. [Google Scholar] [CrossRef]
  40. Dudgeon, C.R. An experimental study of the flow of water through coarse granular media. Houille Blanche 1966, 7, 785–801. [Google Scholar] [CrossRef] [Green Version]
  41. Fancher, G.H.; Lewis, J.A. Flow of simple fluids through porous materials. Ind. Eng. Chem. 1933, 25, 1139–1147. [Google Scholar] [CrossRef]
  42. Kemblowski, Z.; Michniewicz, M. A new look at the laminar flow of power law fluid through granular beds. Rheol. Acta 1979, 18, 730–739. [Google Scholar] [CrossRef]
  43. Sabiri, N.E.; Comiti, J. Experimental validation of a model allowing pressure gradient determination for non-Newtonian purely viscous fluid-flow through packed beds. Chem. Eng. Sci. 1997, 52, 3589–3592. [Google Scholar] [CrossRef]
  44. Yu, Y.H.; Wen, C.Y.; Bailie, R.C. Power-law fluids flow through multiparticle system. Can. J. Chem. Eng. 2010, 46, 149–154. [Google Scholar] [CrossRef]
  45. Kaur, N.; Singh, R.; Wanchoo, R.K. Flow of Newtonian and Non-Newtonian fluids through packed beds: An experimental study. Transp. Porous Med. 2011, 90, 655–671. [Google Scholar] [CrossRef]
  46. Rose, H.E. On the resistance coefficient–Reynolds number relationship for fluid flow through a bed of granular material. Proc. Inst. Mech. Eng. 1945, 153, 154–168. [Google Scholar] [CrossRef]
  47. Ortega, J.M. A porous media model for blood flow within reticulated foam. Chem. Eng. Sci. 2013, 99, 59–66. [Google Scholar] [CrossRef] [Green Version]
  48. Erdim, E.; Akgiray, O.; Demir, I. A revisit of pressure drop-flow rate correlations for packed beds of spheres. Powder Technol. 2015, 283, 488–504. [Google Scholar] [CrossRef]
Figure 1. TST-55 permeameter. The TST-55 permeameter consisted of a cutting ring, two porous stones, a lantern ring, a top cover, a bottom cover, two rubber rings, and secured with bolts and nuts.
Water 13 00075 g001
Figure 2. Schematic diagram of the experimental setup. The outflow water was collected in a glass cylinder and weighed using an electronic balance under the glass cylinder.
Water 13 00075 g002
Figure 3. Measured cumulative grain size distribution. The median grain sizes of sediment types 1–7 varied between 7.26 μm and 70.32 μm.
Water 13 00075 g003
Figure 4. Relationship of hydraulic conductivity k   as a function of void ratio e . The relationship between log k   and log e is linear.
Water 13 00075 g004
Figure 5. Relationship of parameters a, b and d50. Both a and b appear to vary linearly with d50.
Water 13 00075 g005
Figure 6. Computed (Equations (6), (7), and (12)) and measured hydraulic conductivity k for the data reported by Zhang et al. [1], Chapui and Robert [21], and the present study. It can be seen that Equation (12) performs better than Equations (6) and (7).
Water 13 00075 g006
Figure 7. Seepage friction factor, λ as a function of particle Reynolds number, Re. The λ versus Re curve is distinct for a certain sediment type.
Water 13 00075 g007
Figure 8. Distribution of m as a function of d * / σ g . The value of m increases with d * / σ g .
Water 13 00075 g008
Figure 9. Distribution of f against d * / σ g . The value of f increases with d * / σ g .
Water 13 00075 g009
Figure 10. A comparison of resistance factor based on the results obtained in the present study and those reported by other researchers. The values of λ in silty sediments are greater than those in coarse porous media at the same Reynolds number. The slope of λ - R e curve (log-log) for coarse sediments is −1, while it is variable for silty sediments.
Water 13 00075 g010
Table 1. Physical properties of the tested silty sediments.
PropertiesType 1Type 2Type 3Type 4Type 5Type 6Type 7
Specific gravity Gs2.732.722.702.712.692.652.63
Median grain size d 50 (μm)7.2614.4219.7935.5741.3060.0170.32
Uniformity coefficient σg2.913.172.933.973.904.204.76
Standard deviation of the grain size (μm)0.90.71.21.91.62.12.6
Table 2. Void ratio of the 35 test samples.
Soil TypesVoid Ratio e
Type 10.7231.1231.5442.6103.1443.467
Type 20.5991.0261.3181.6062.0832.548
Type 30.7731.1481.4701.8422.0812.471
Type 40.5660.9461.3631.5811.953/
Type 50.7751.0691.3741.641//
Type 61.0261.4051.5441.937//
Type 70.8121.0361.2171.474//
Table 3. The values of m and f for types 1–5 sediments.
Sediment Type d 50   ( μ m ) d * d * / σ g m f
Type 17.260.1870.064−1.60726.75
Type 214.420.3700.117−1.521123.22
Type 319.790.5050.172−1.490425.22
Type 435.570.9100.230−1.3631548.70
Type 541.301.0530.270−1.09615367
Publisher’s Note: MDPI stays neutral with regard to jurisdictional claims in published maps and institutional affiliations.

