Volume Estimation of Landslide Affected Soil Moisture Using TRIGRS: A Case Study of Longxi River Small Watershed in Wenchuan Earthquake Zone, China


Abstract
1. Introduction
2. Methods
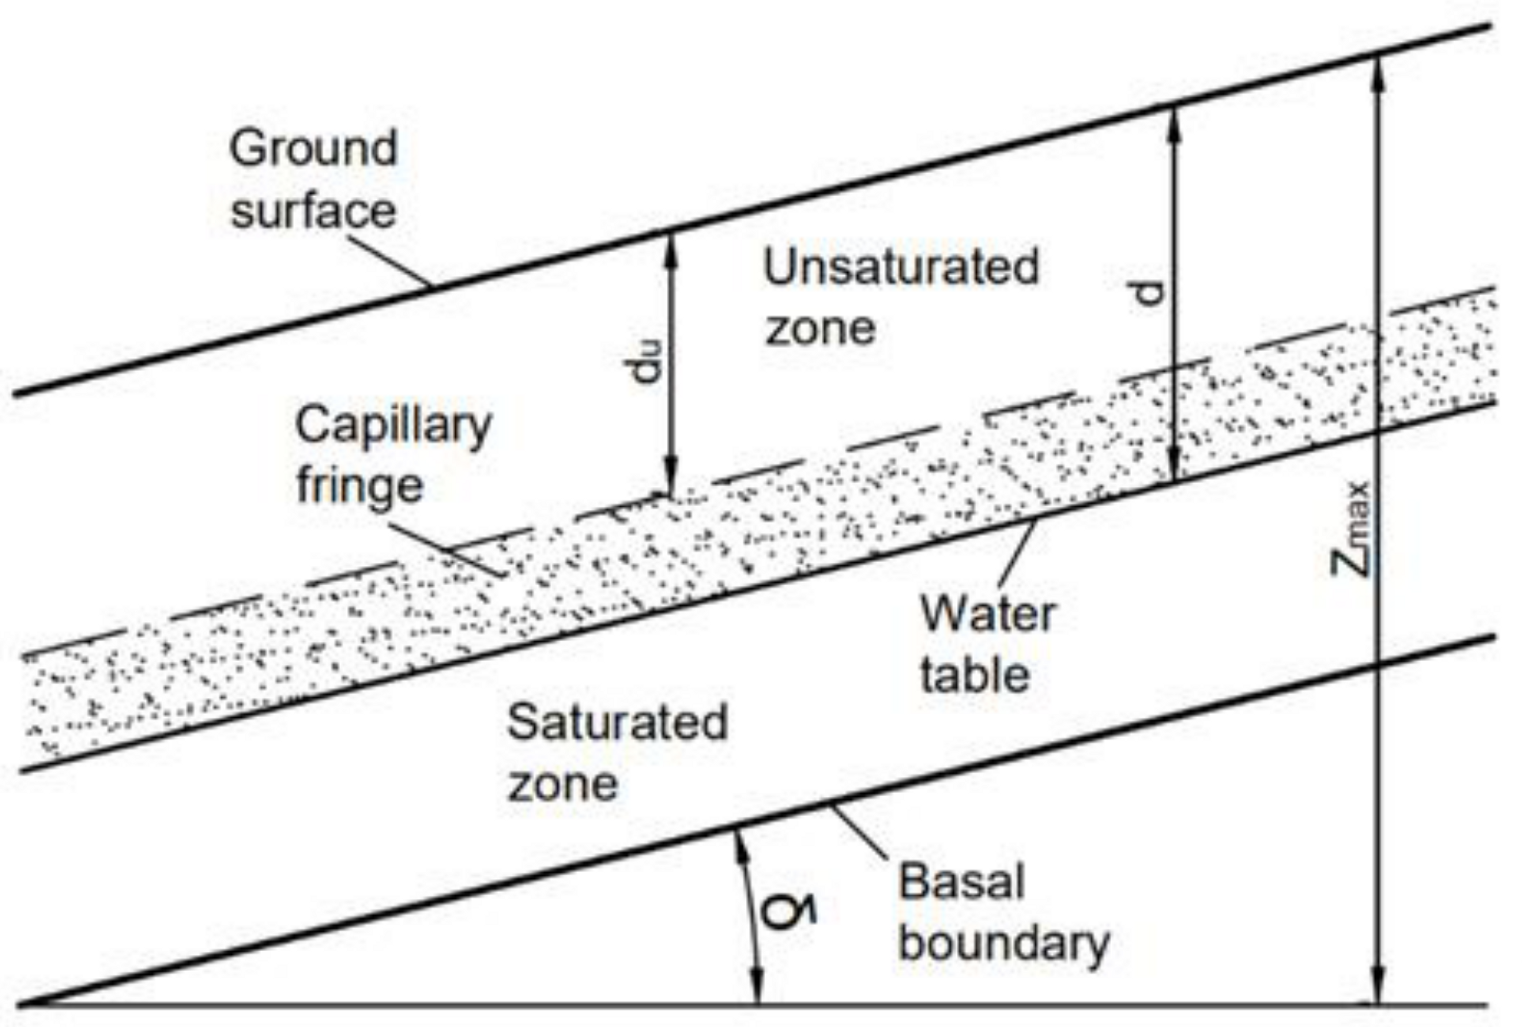
2.1. TRIGRS Model
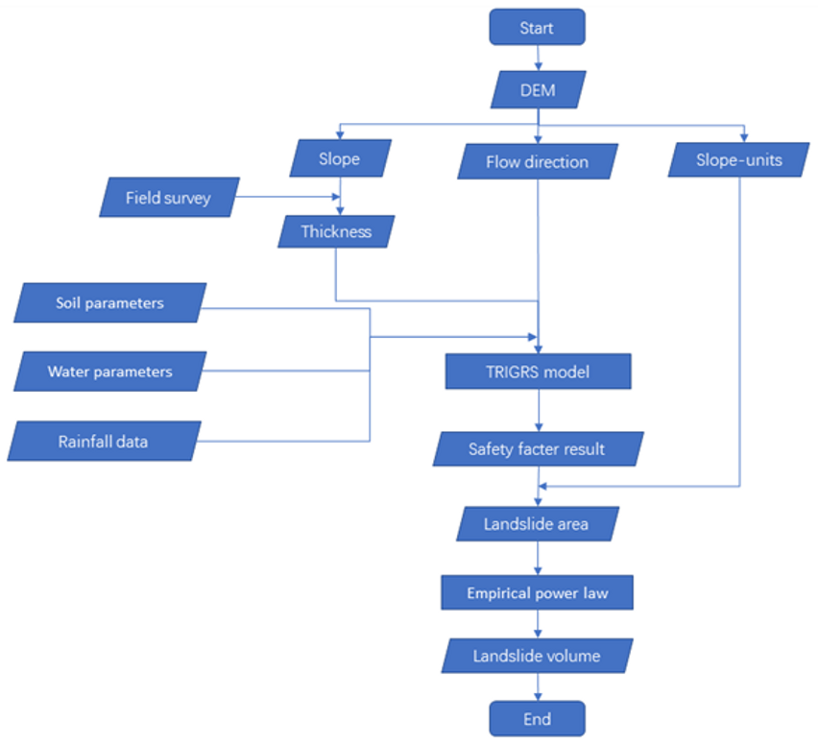
2.2. Calculation Method
3. Study Area and Data
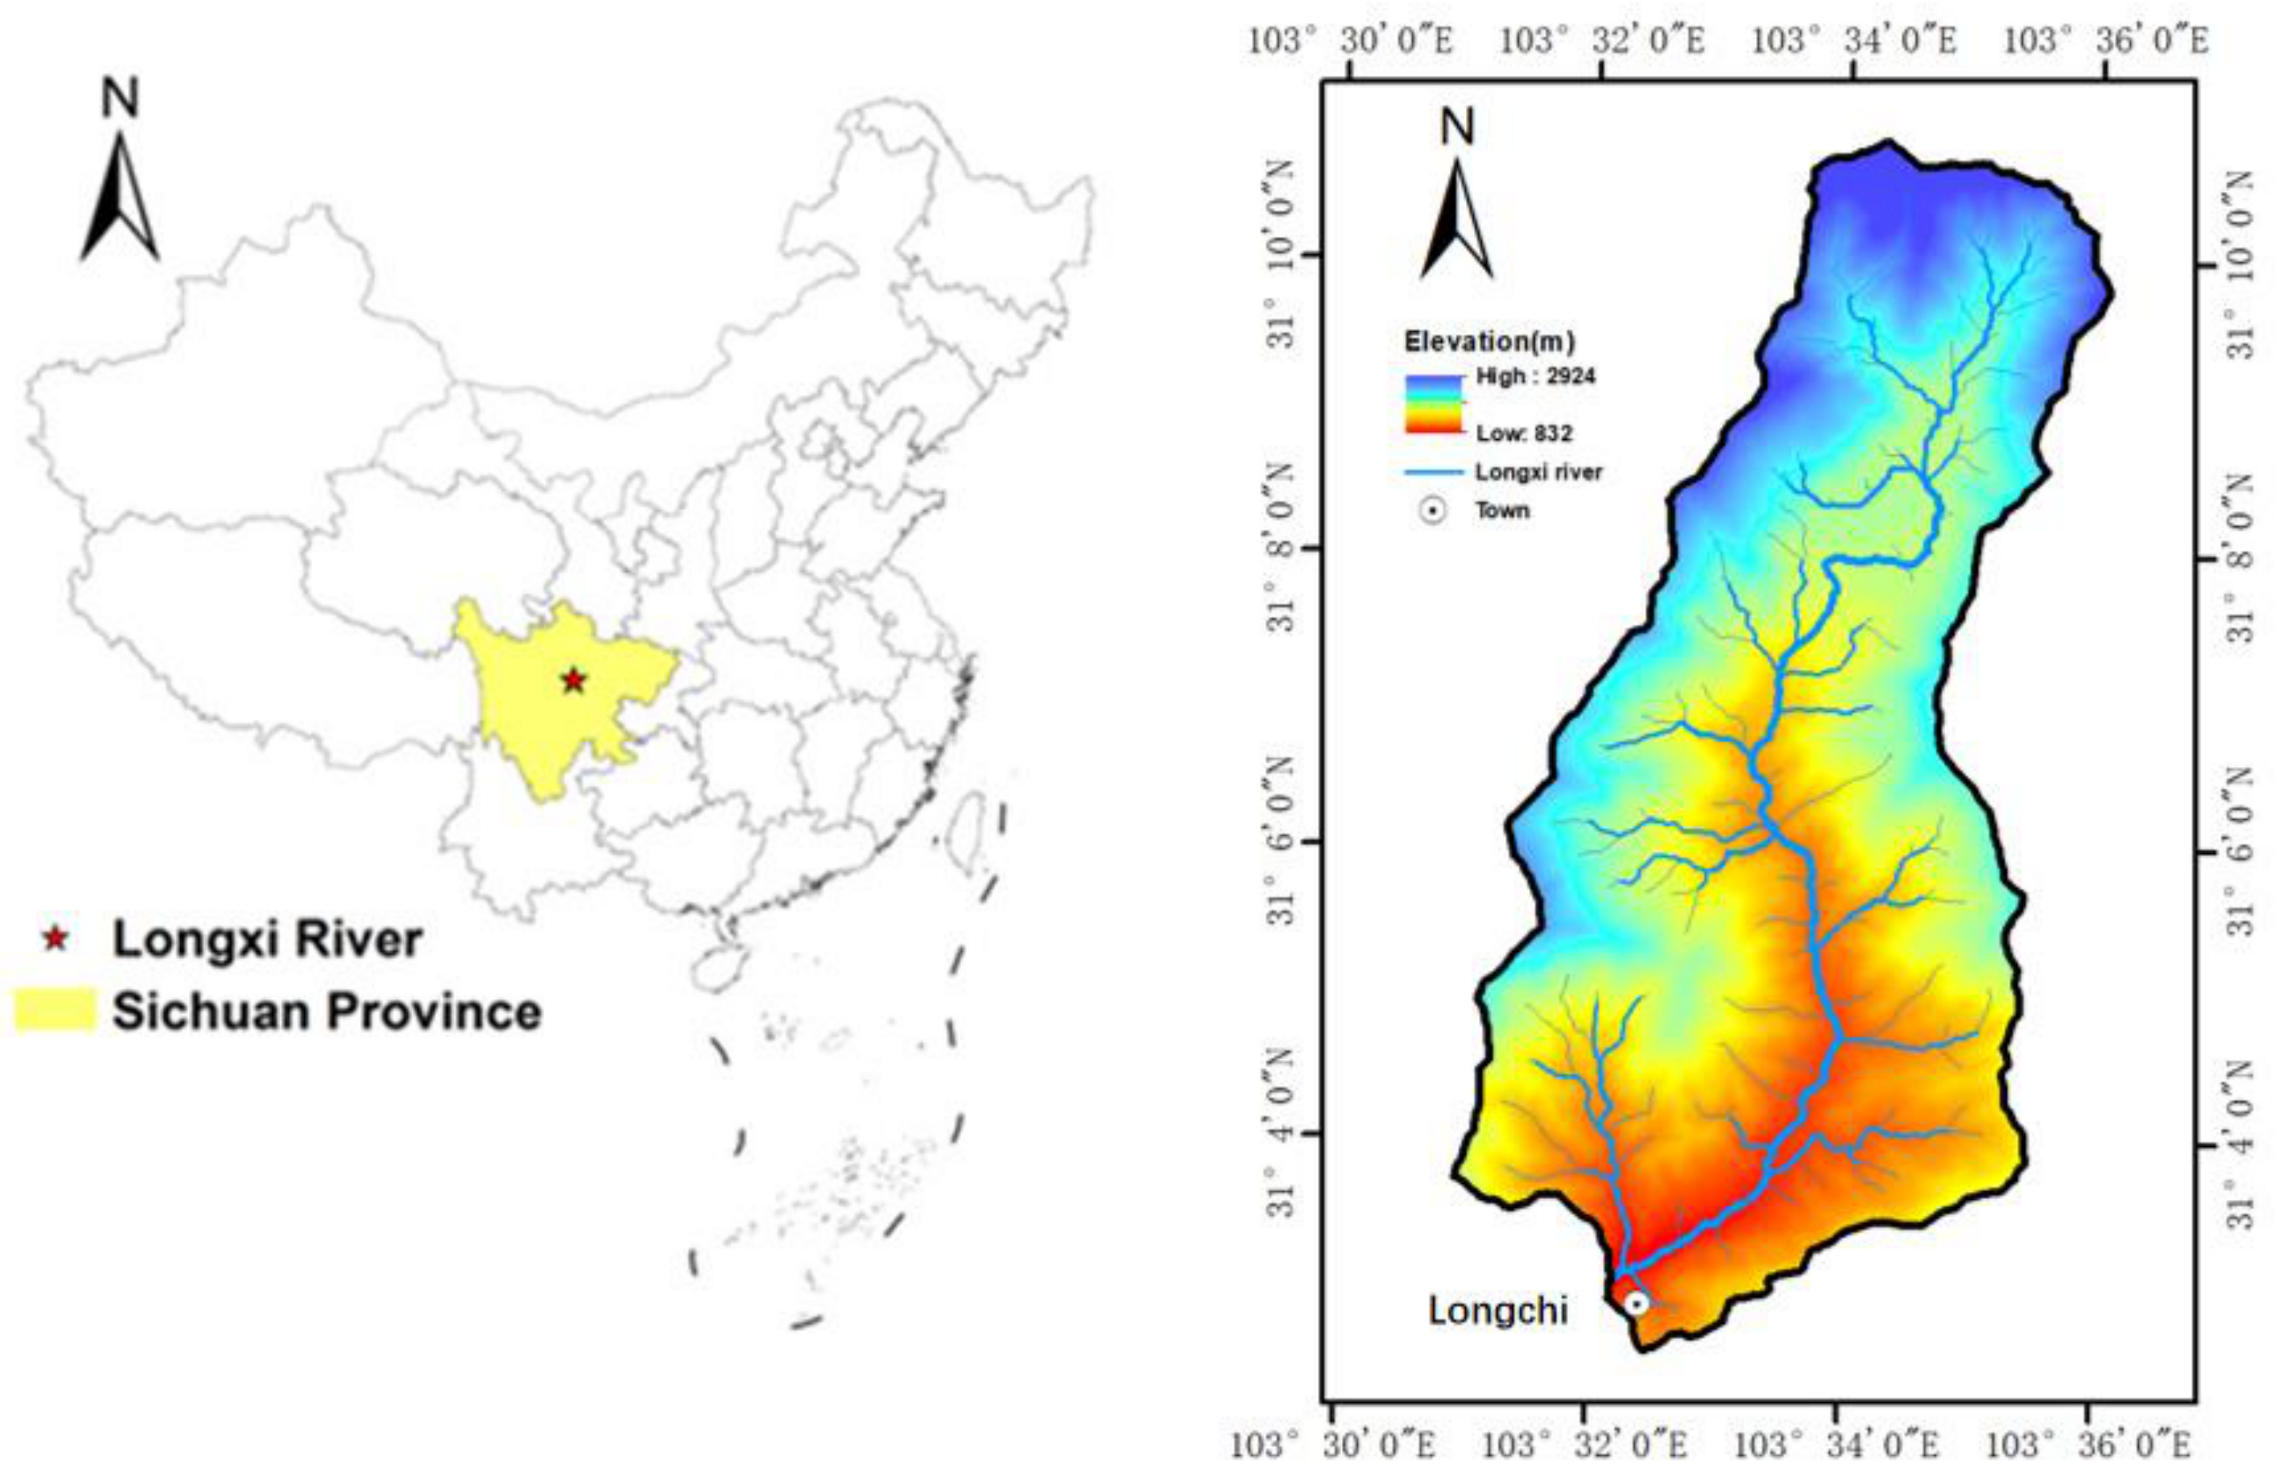
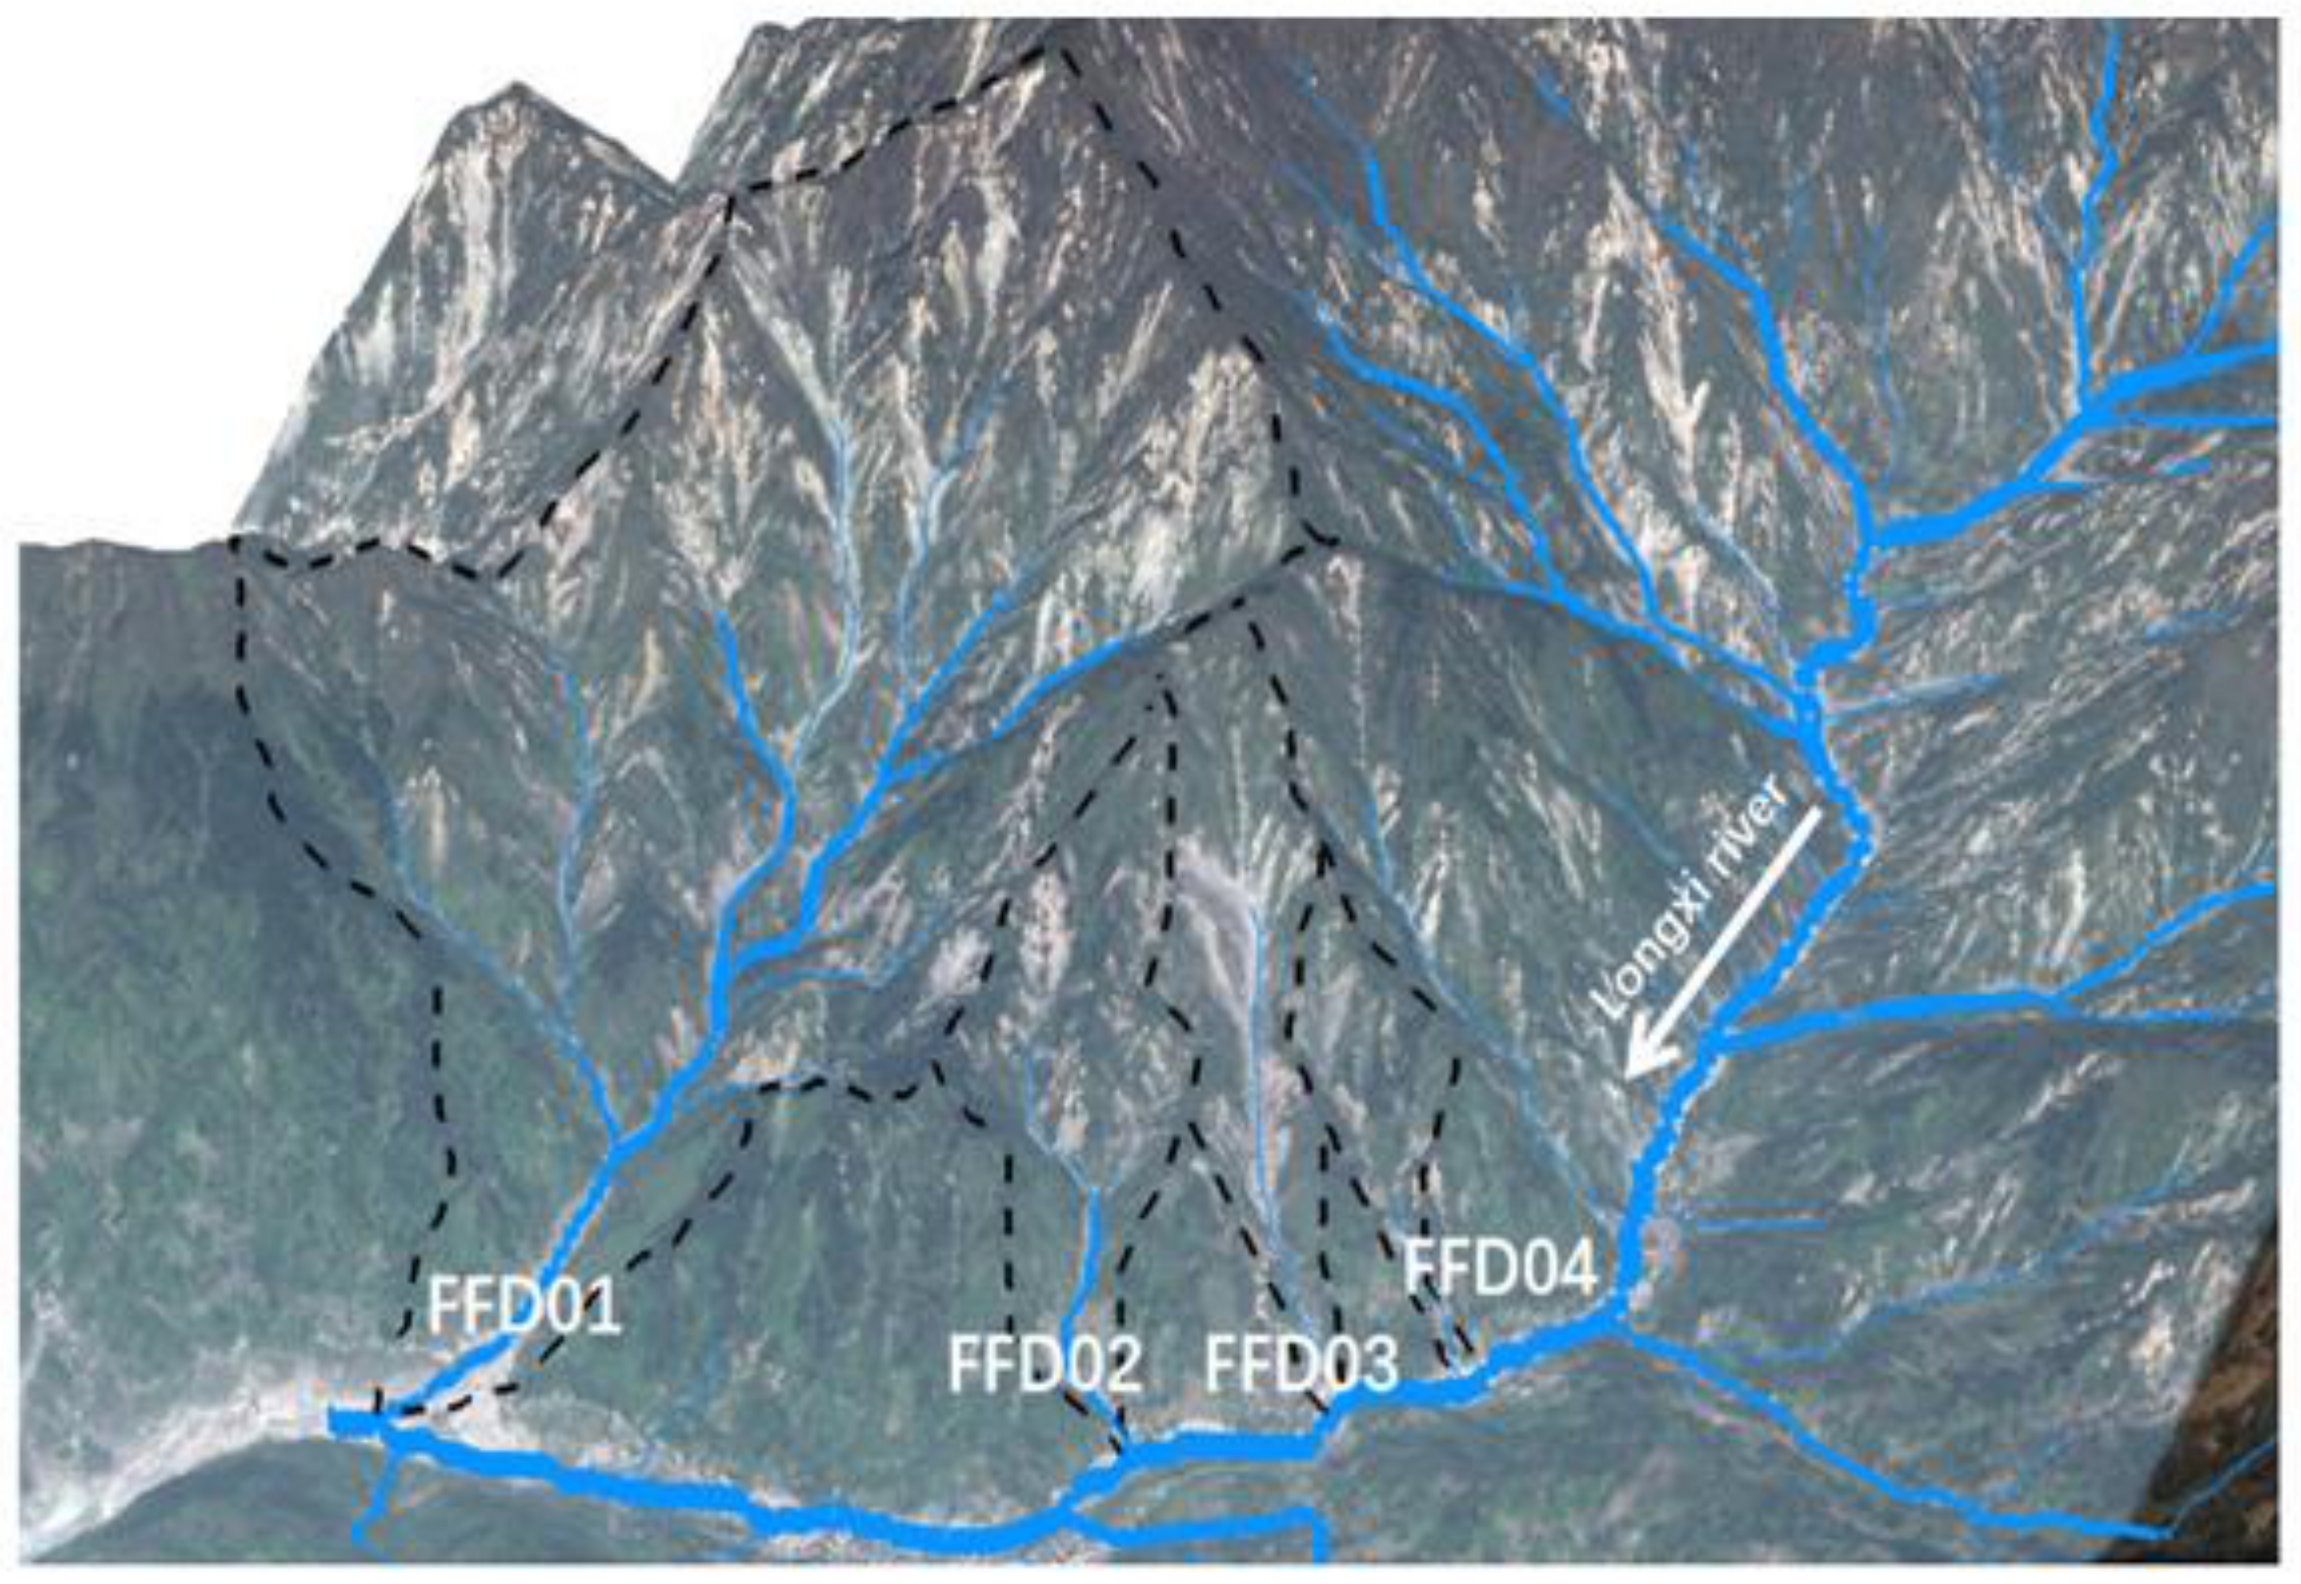
3.1. Study Area
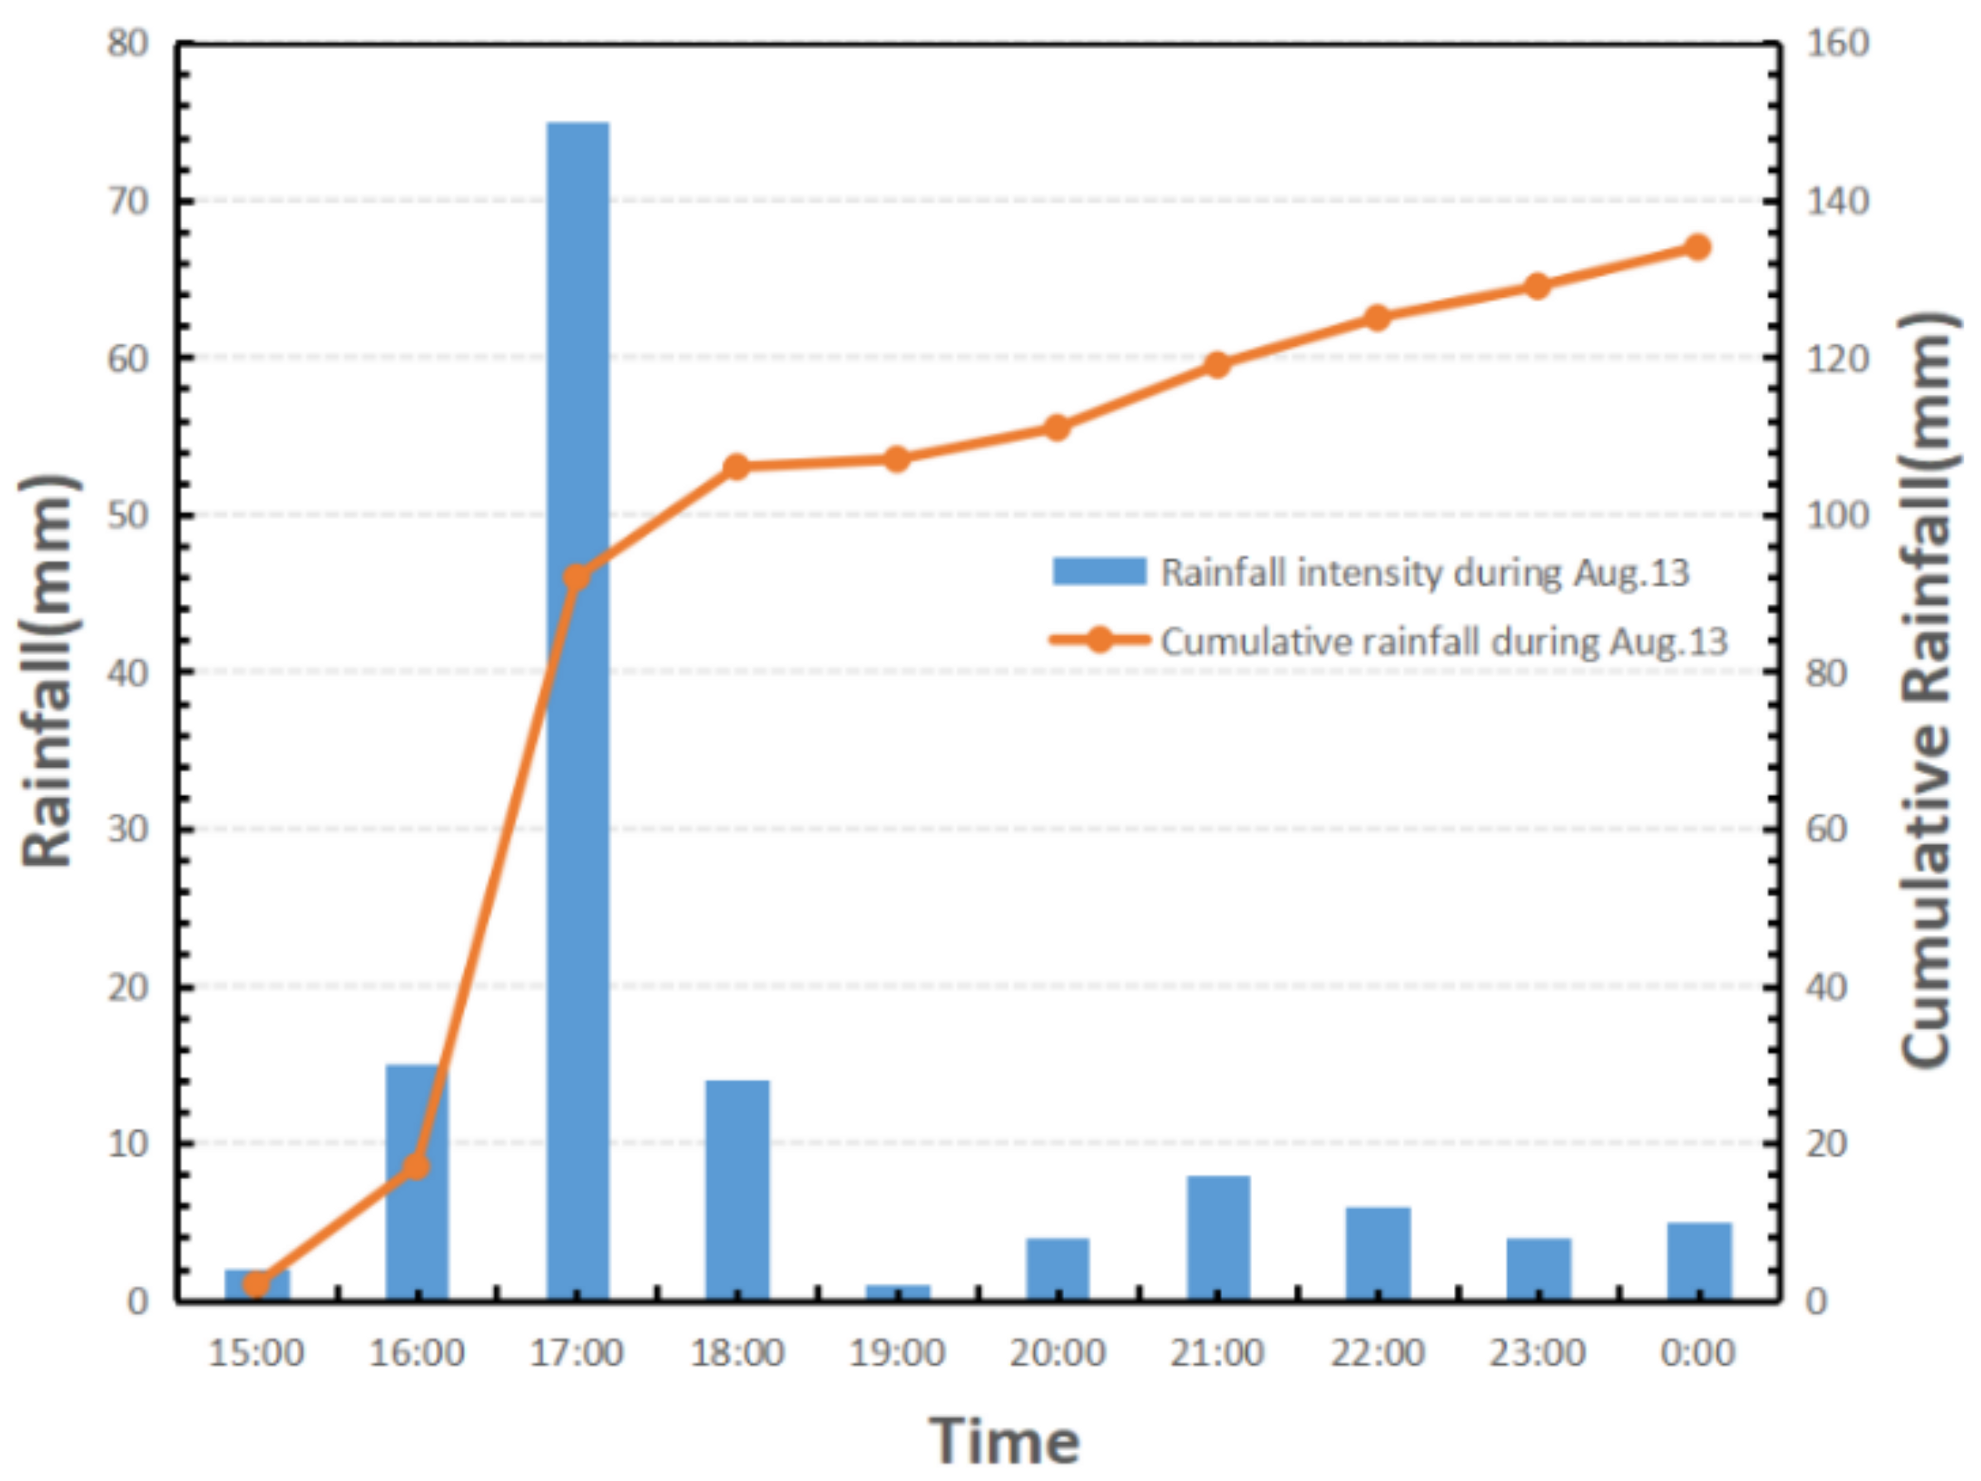
3.2. Rainfall Data
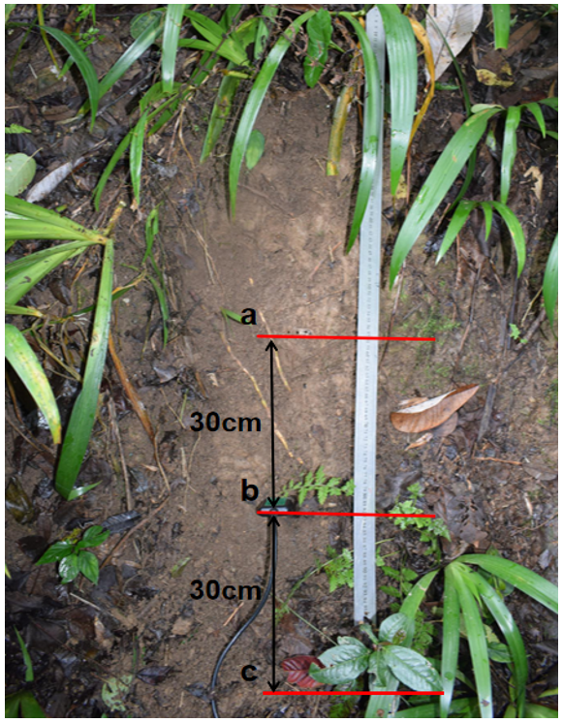
3.3. Field Survey
3.4. Soil Parameters
3.5. Hydraulic Parameters
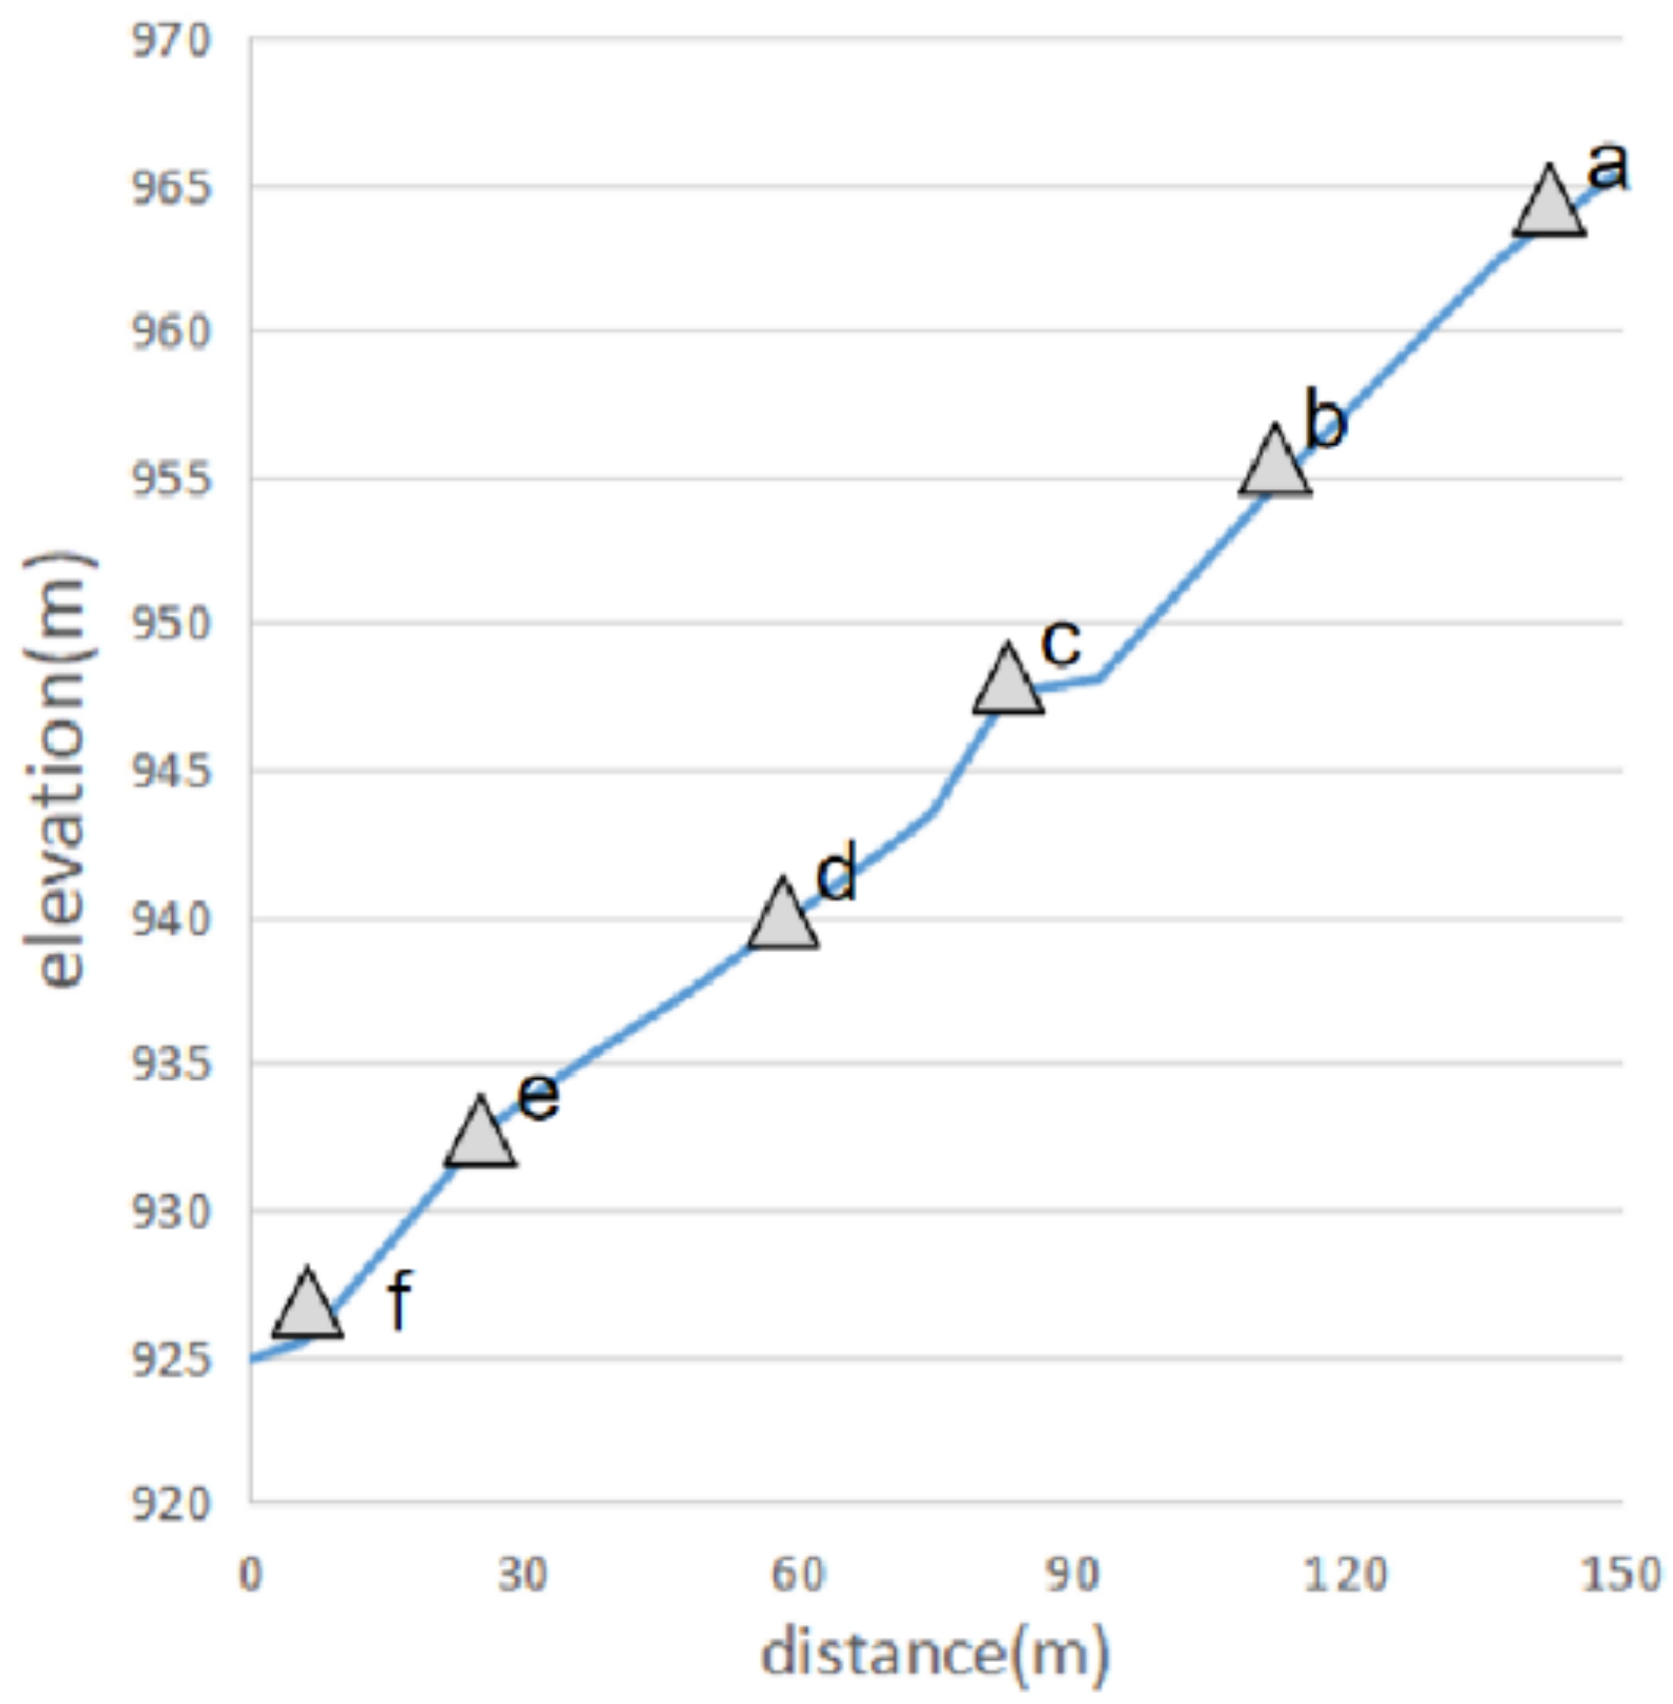
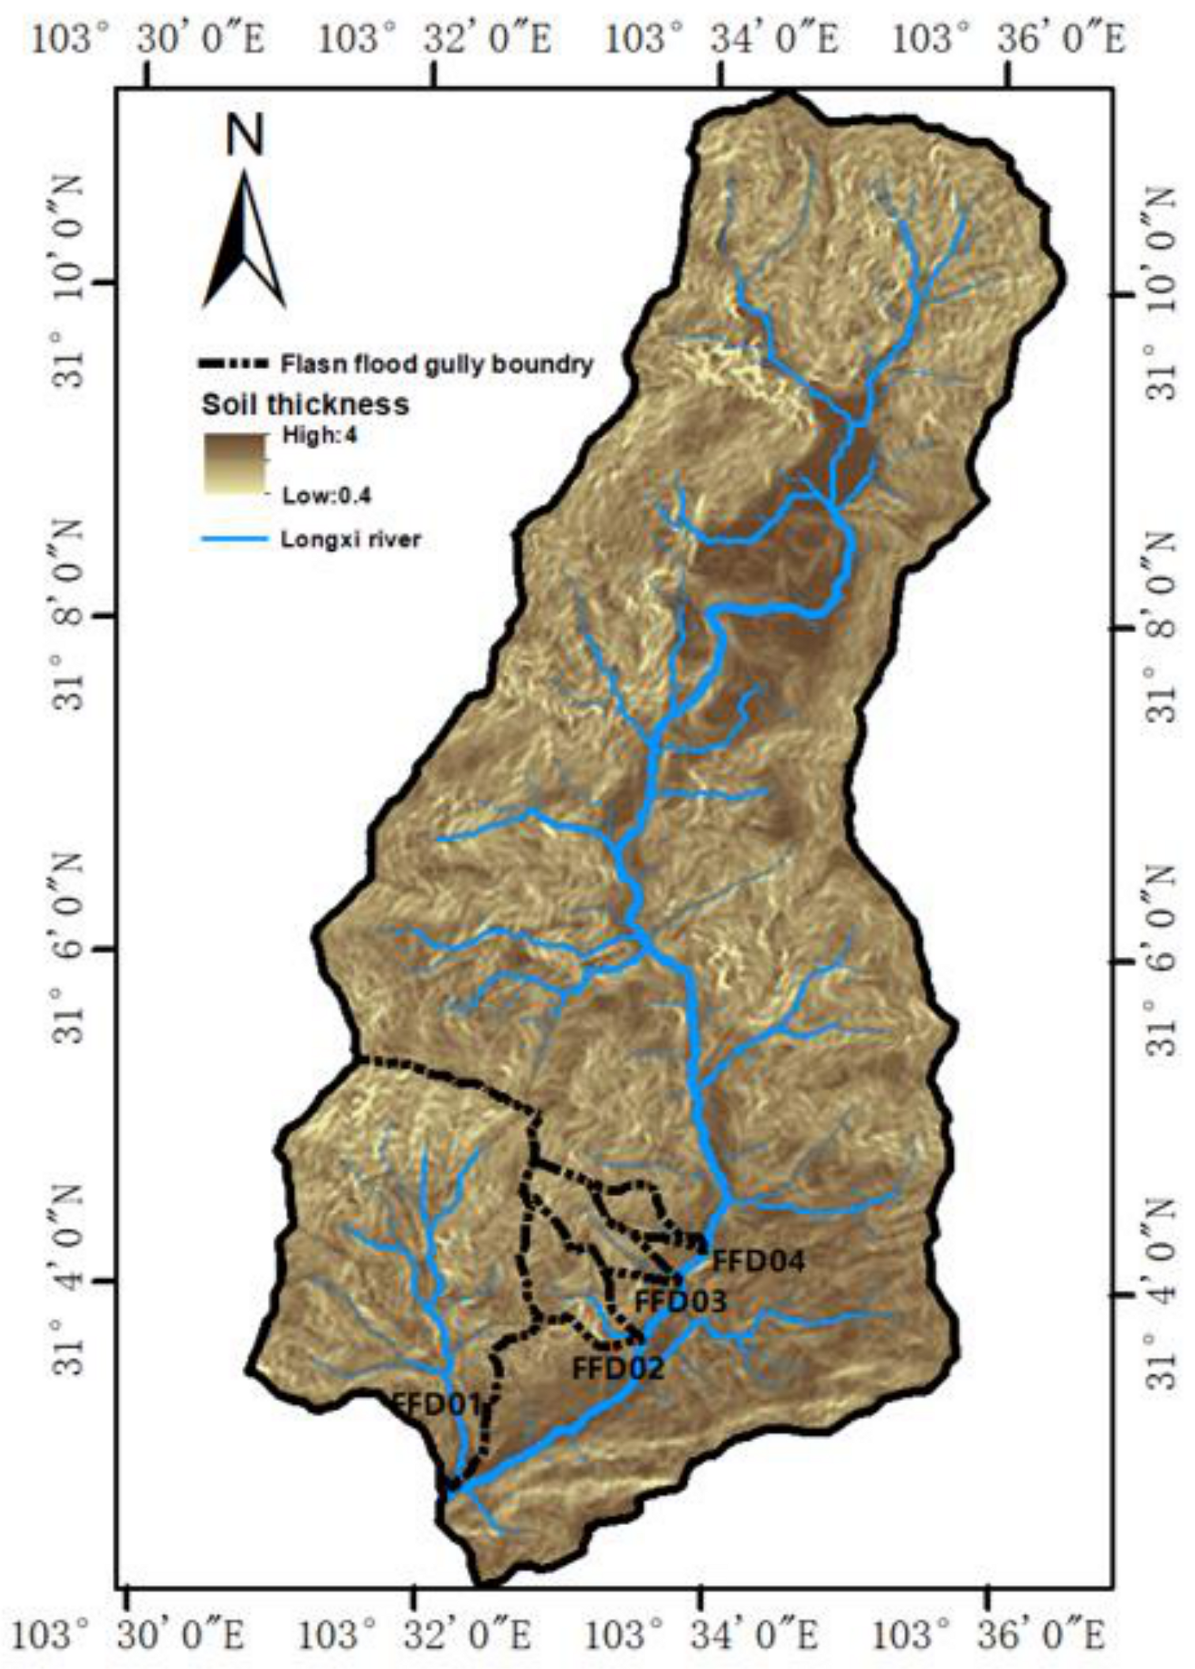
3.6. Soil Thickness
4. Results
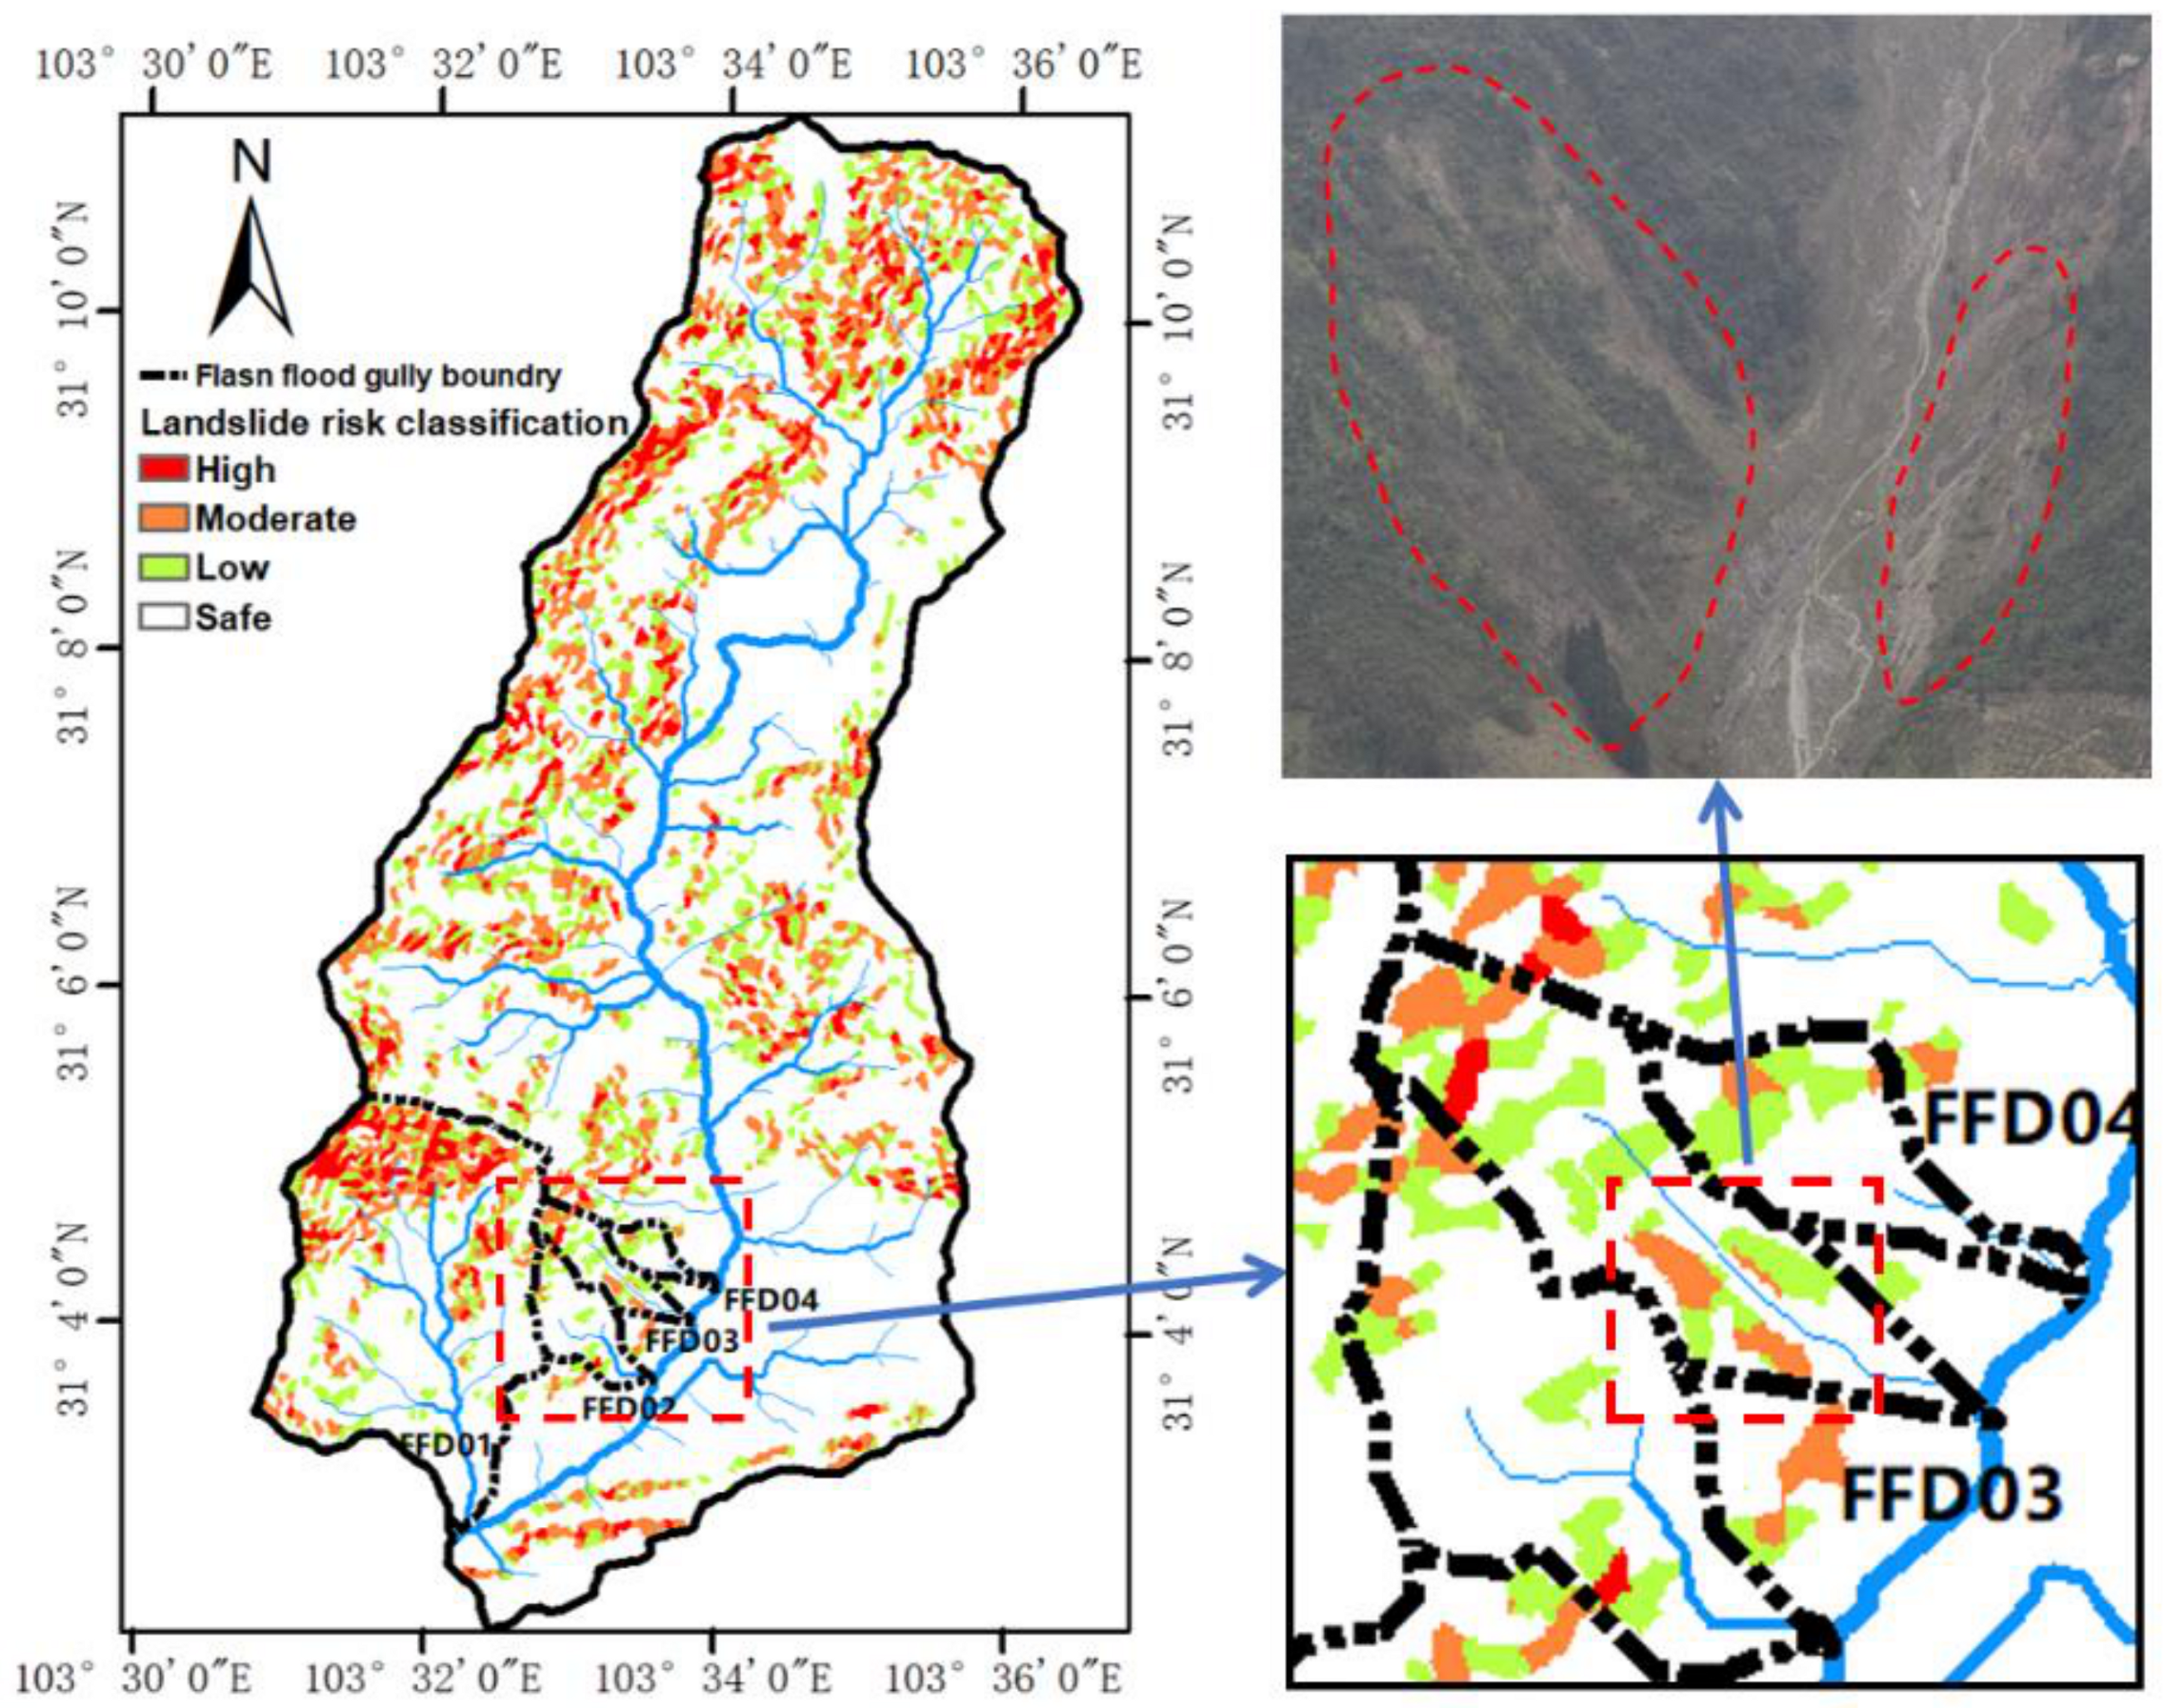
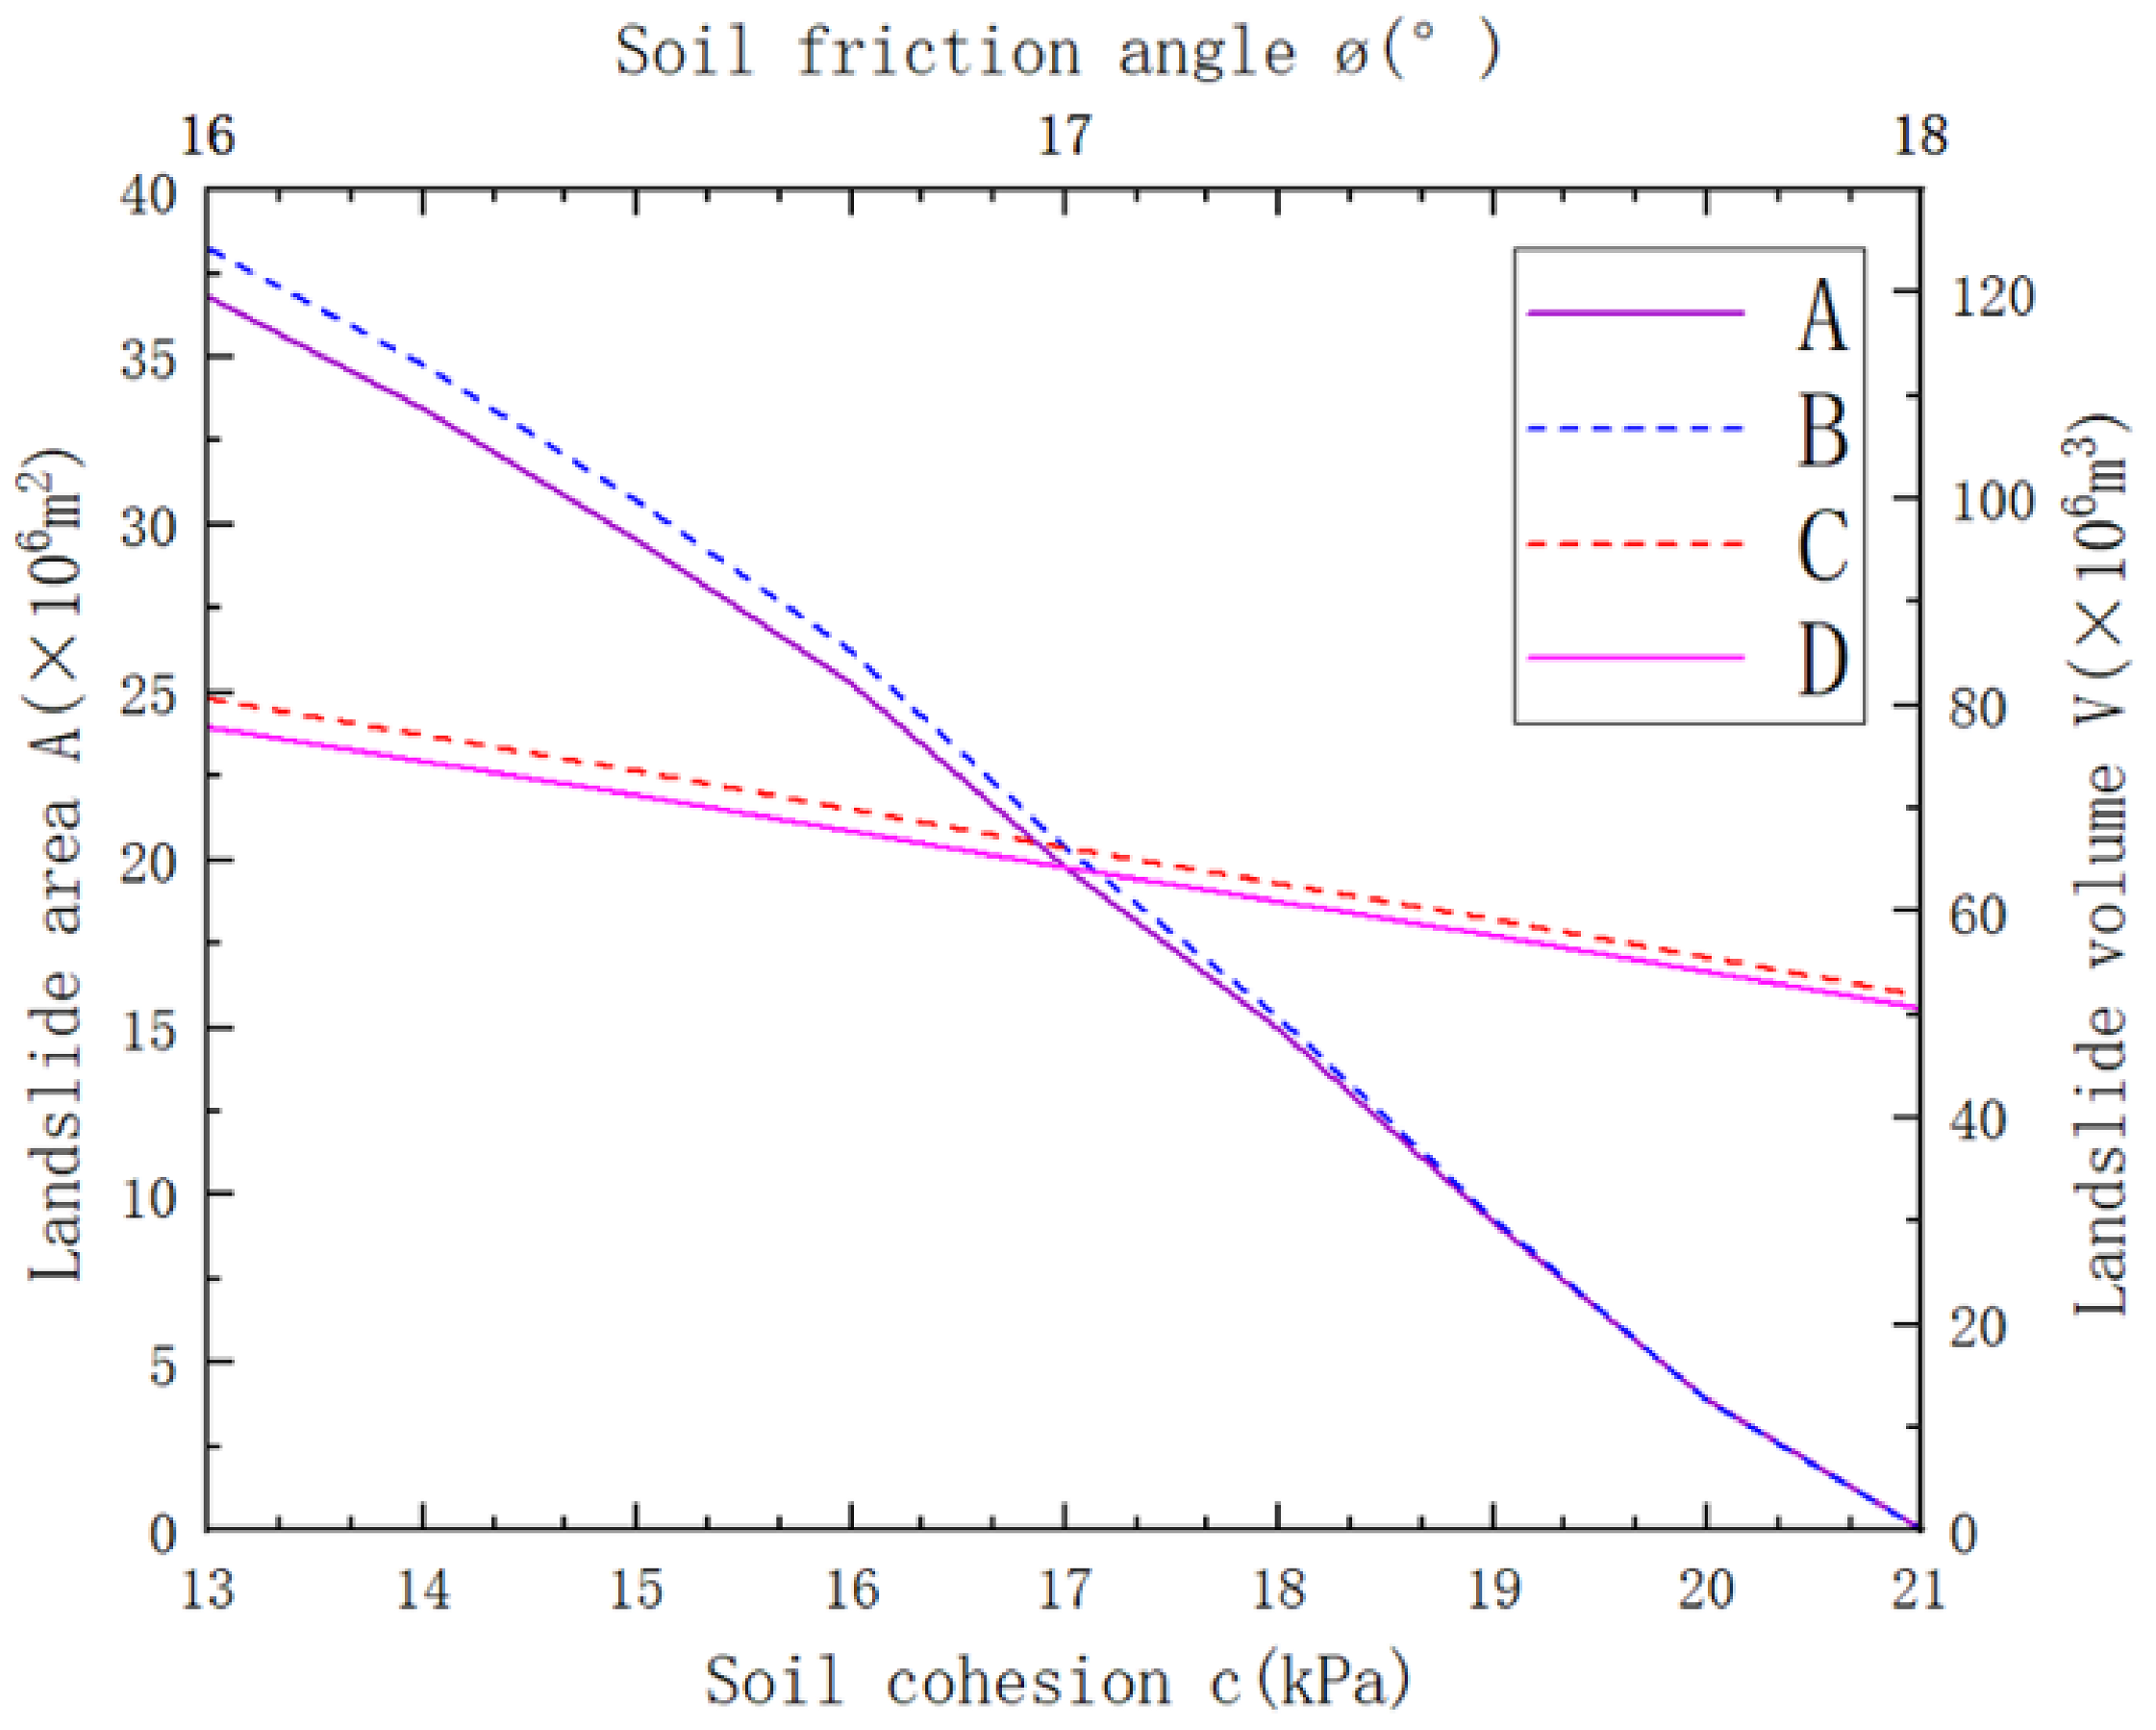
4.1. Estimated Area and Volume of Landslides
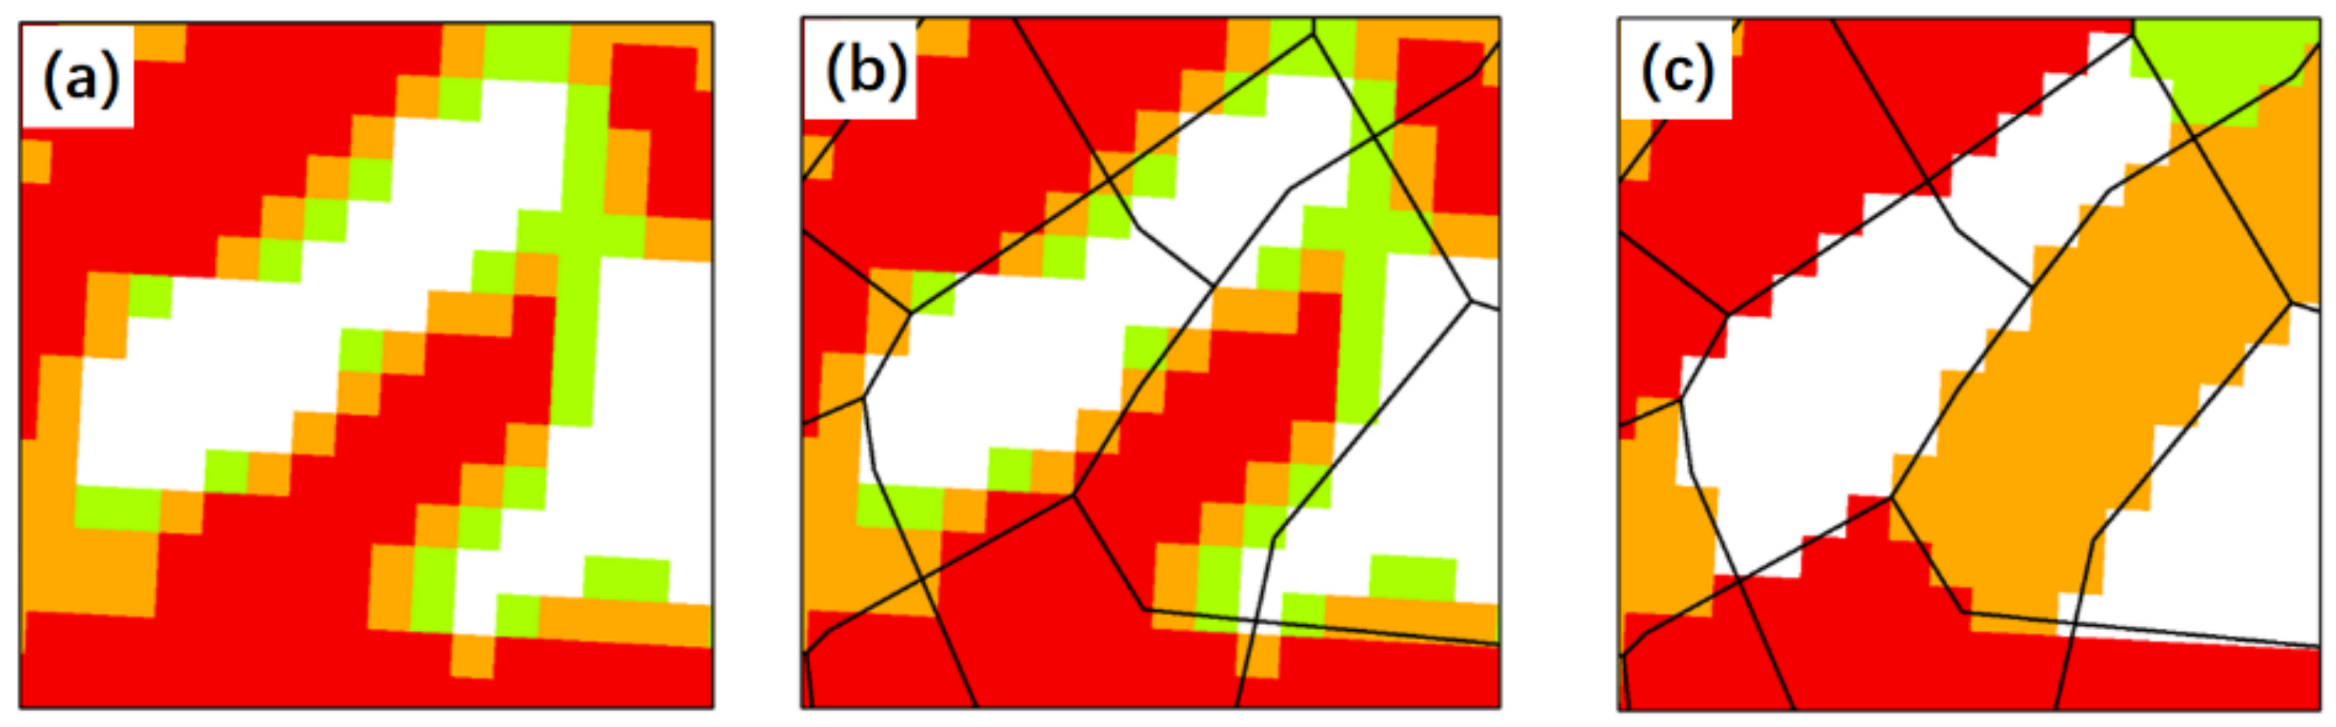
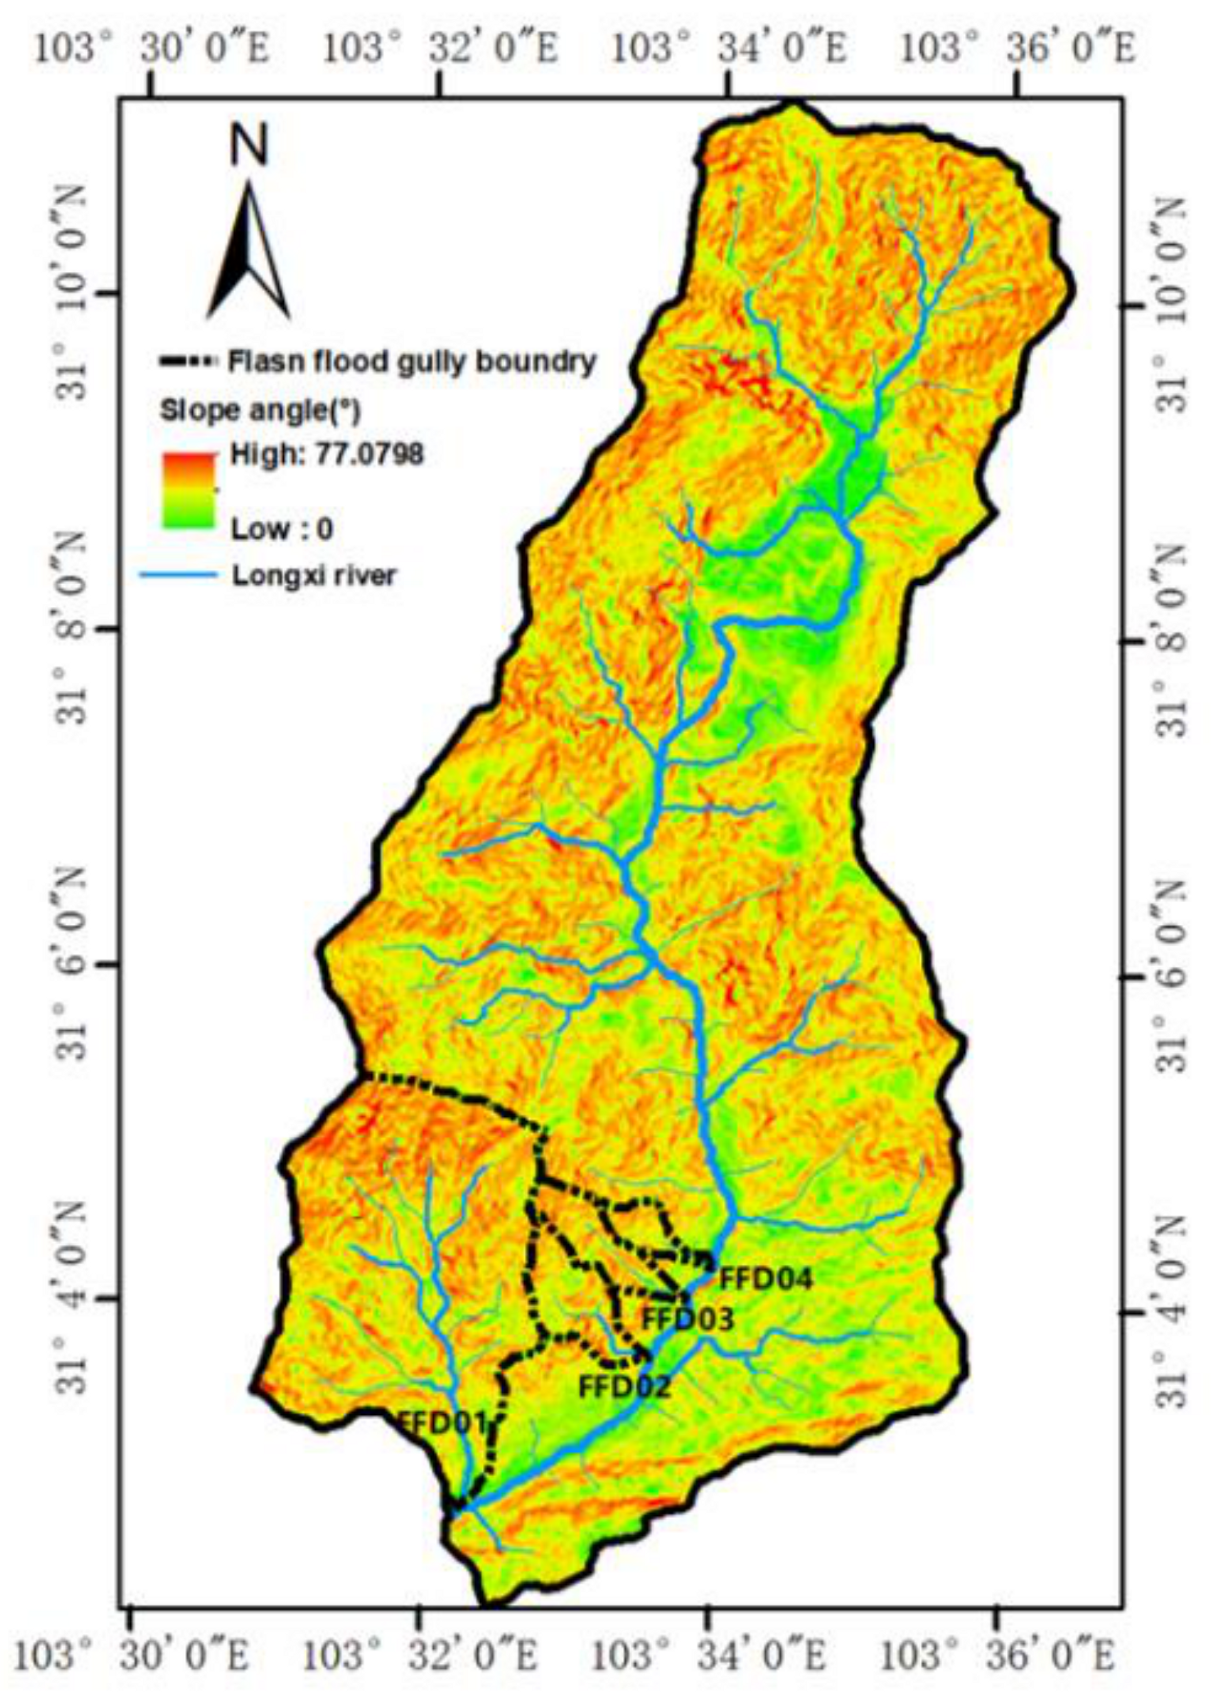
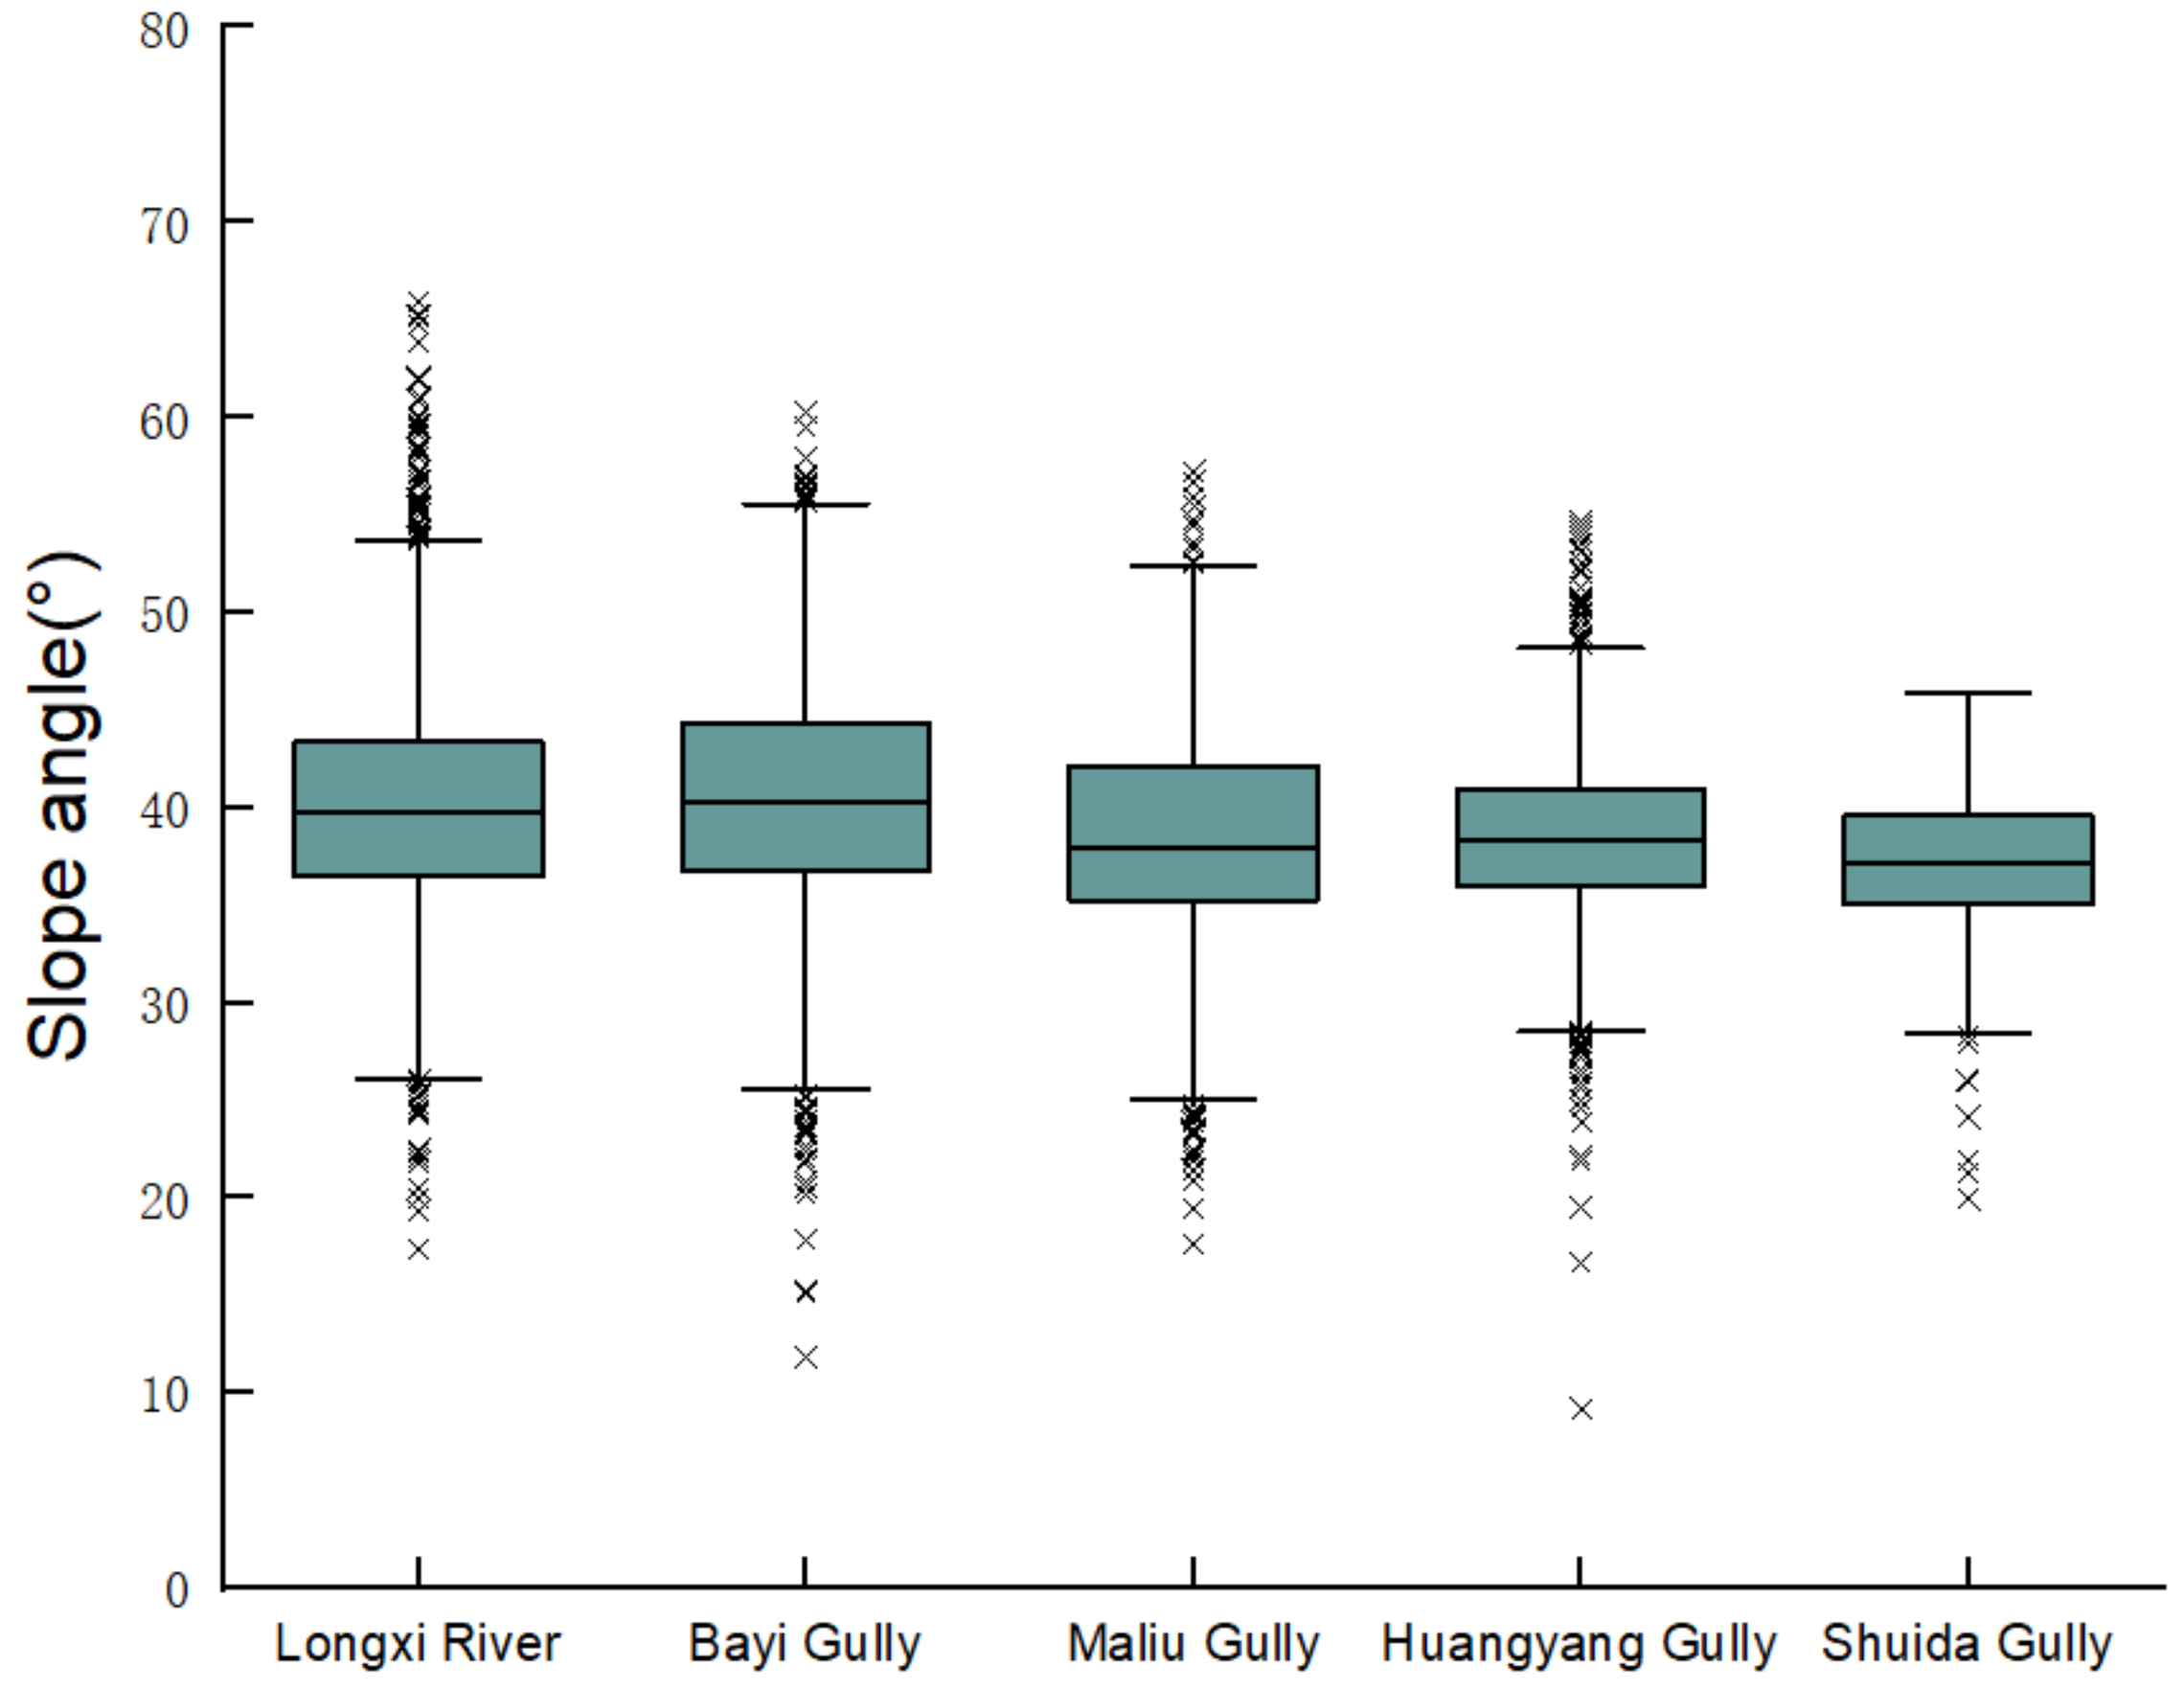
4.2. Slope Distribution
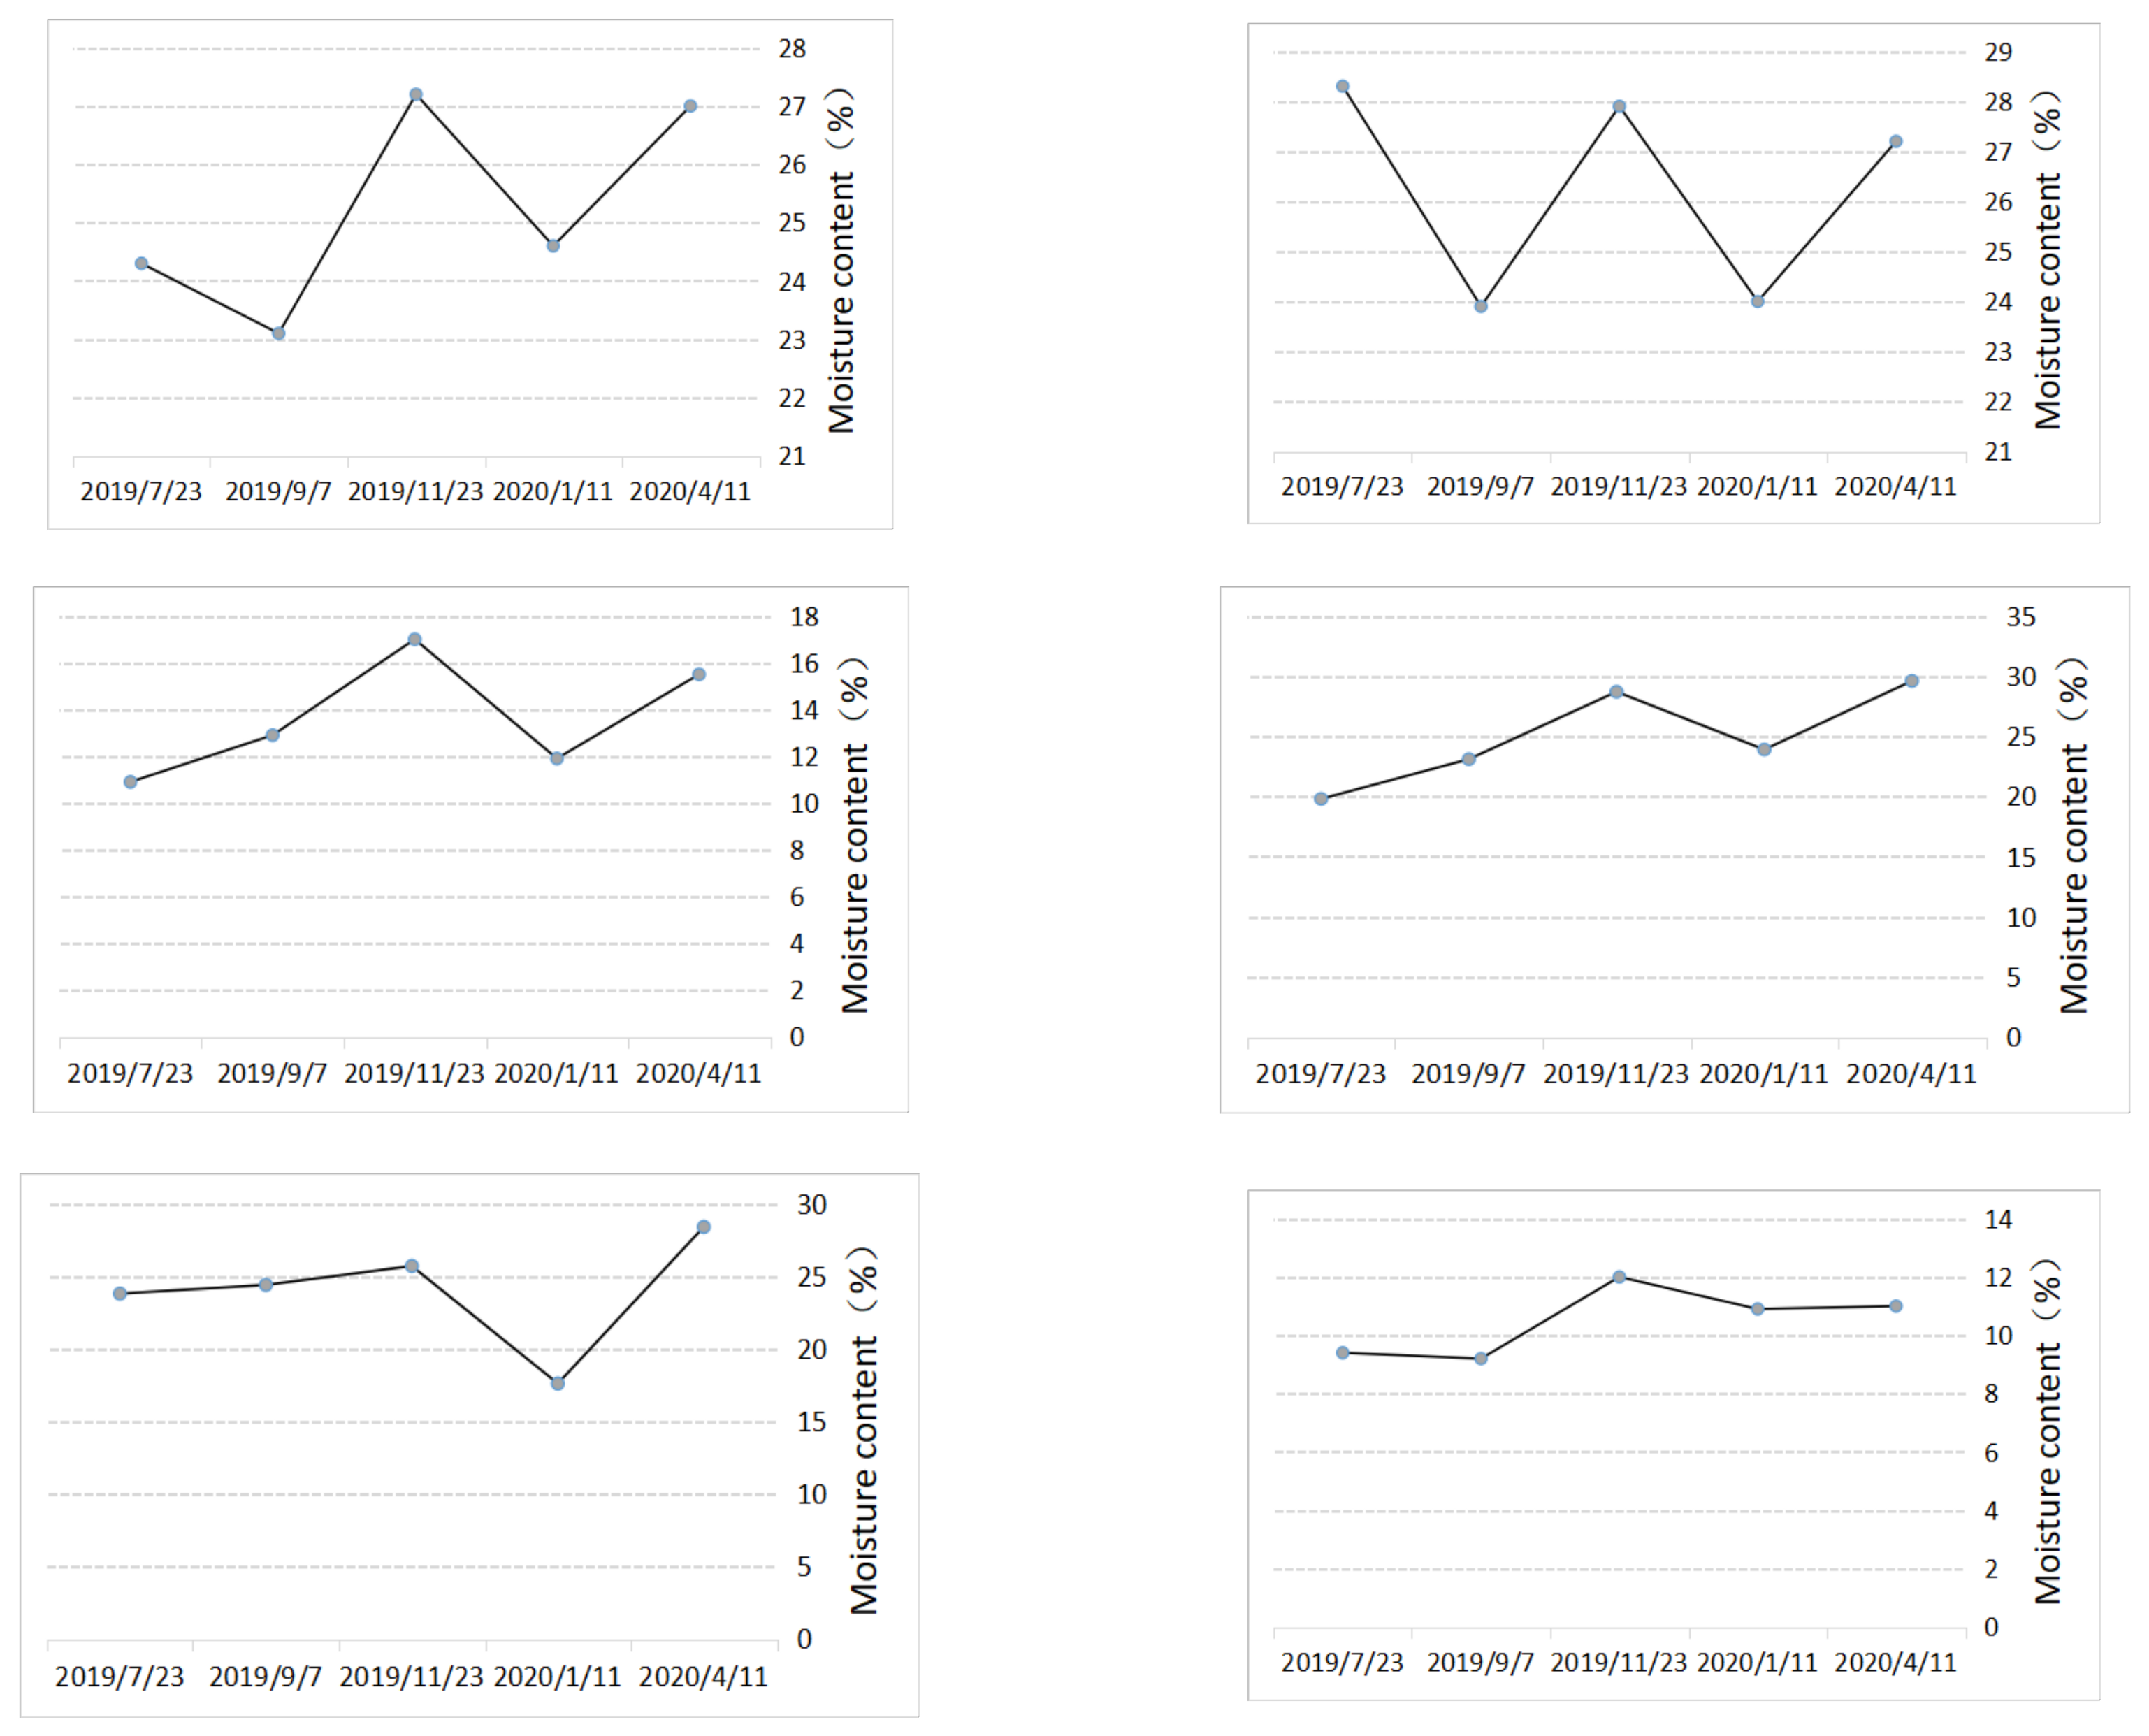
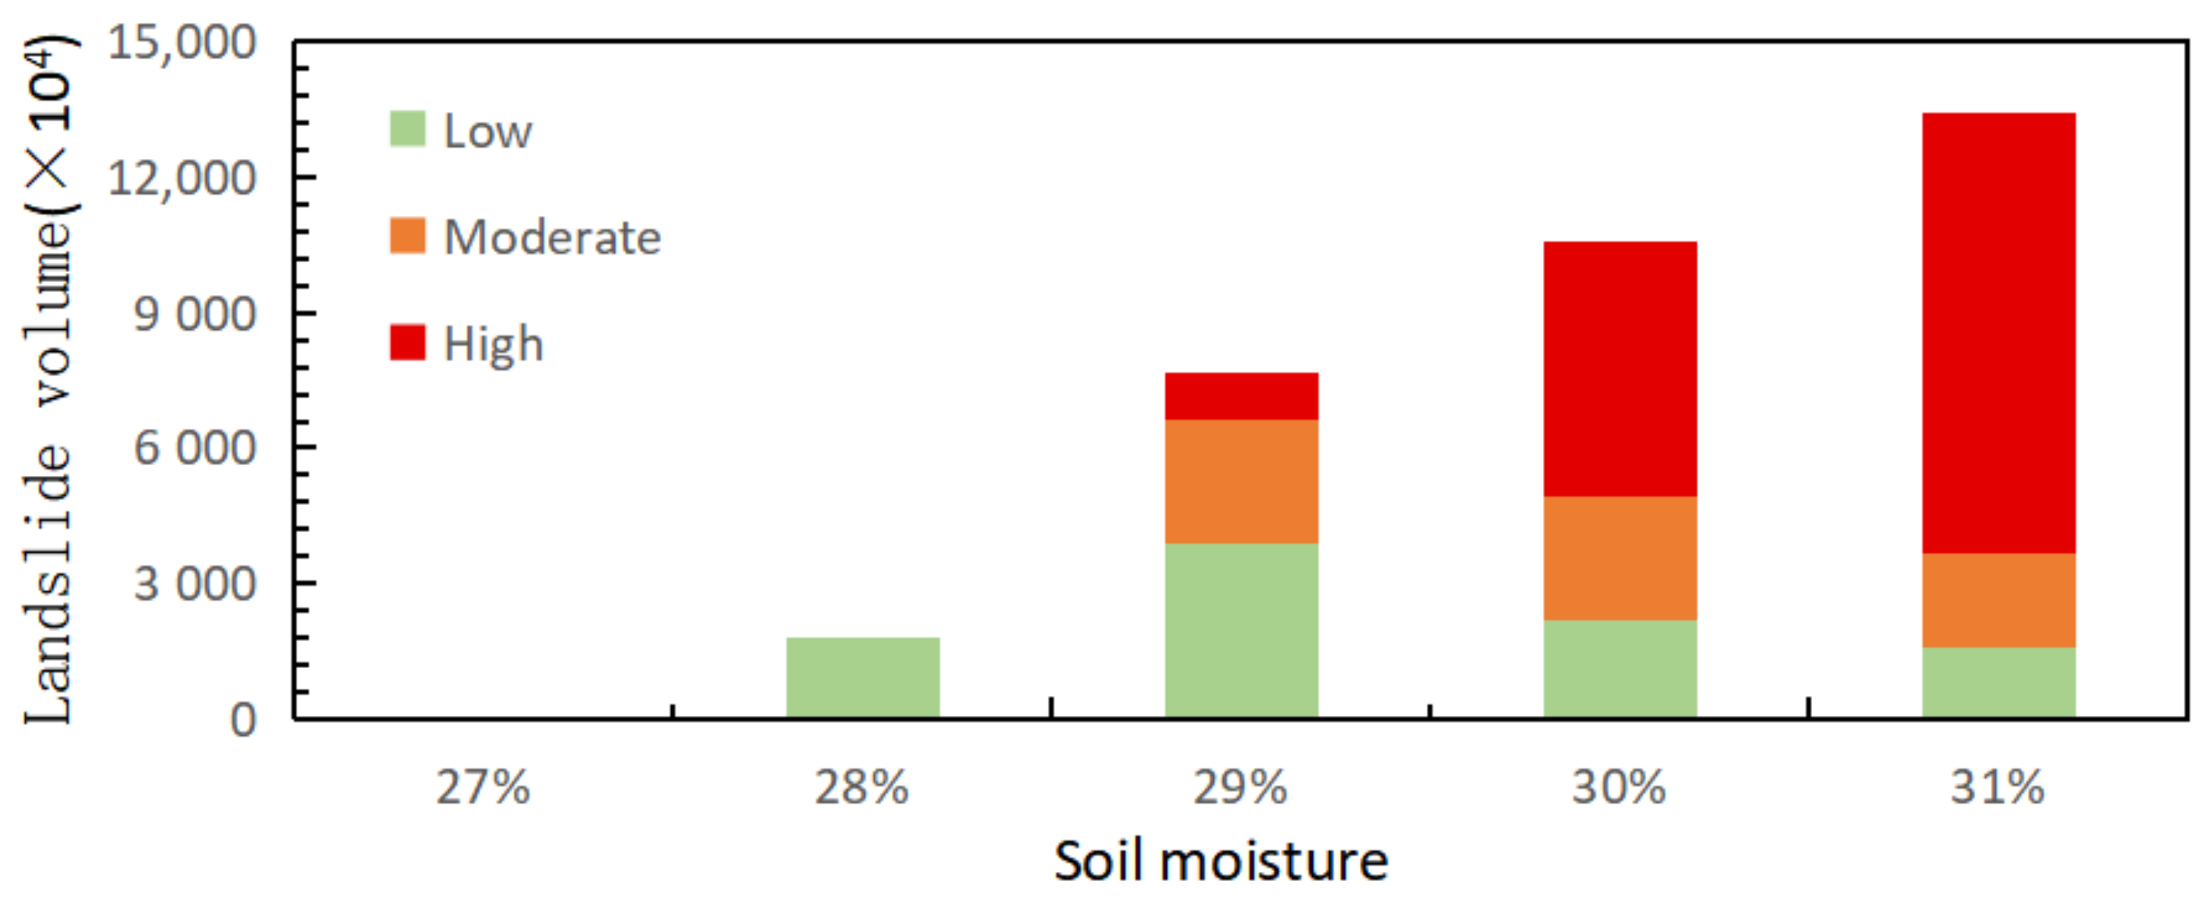
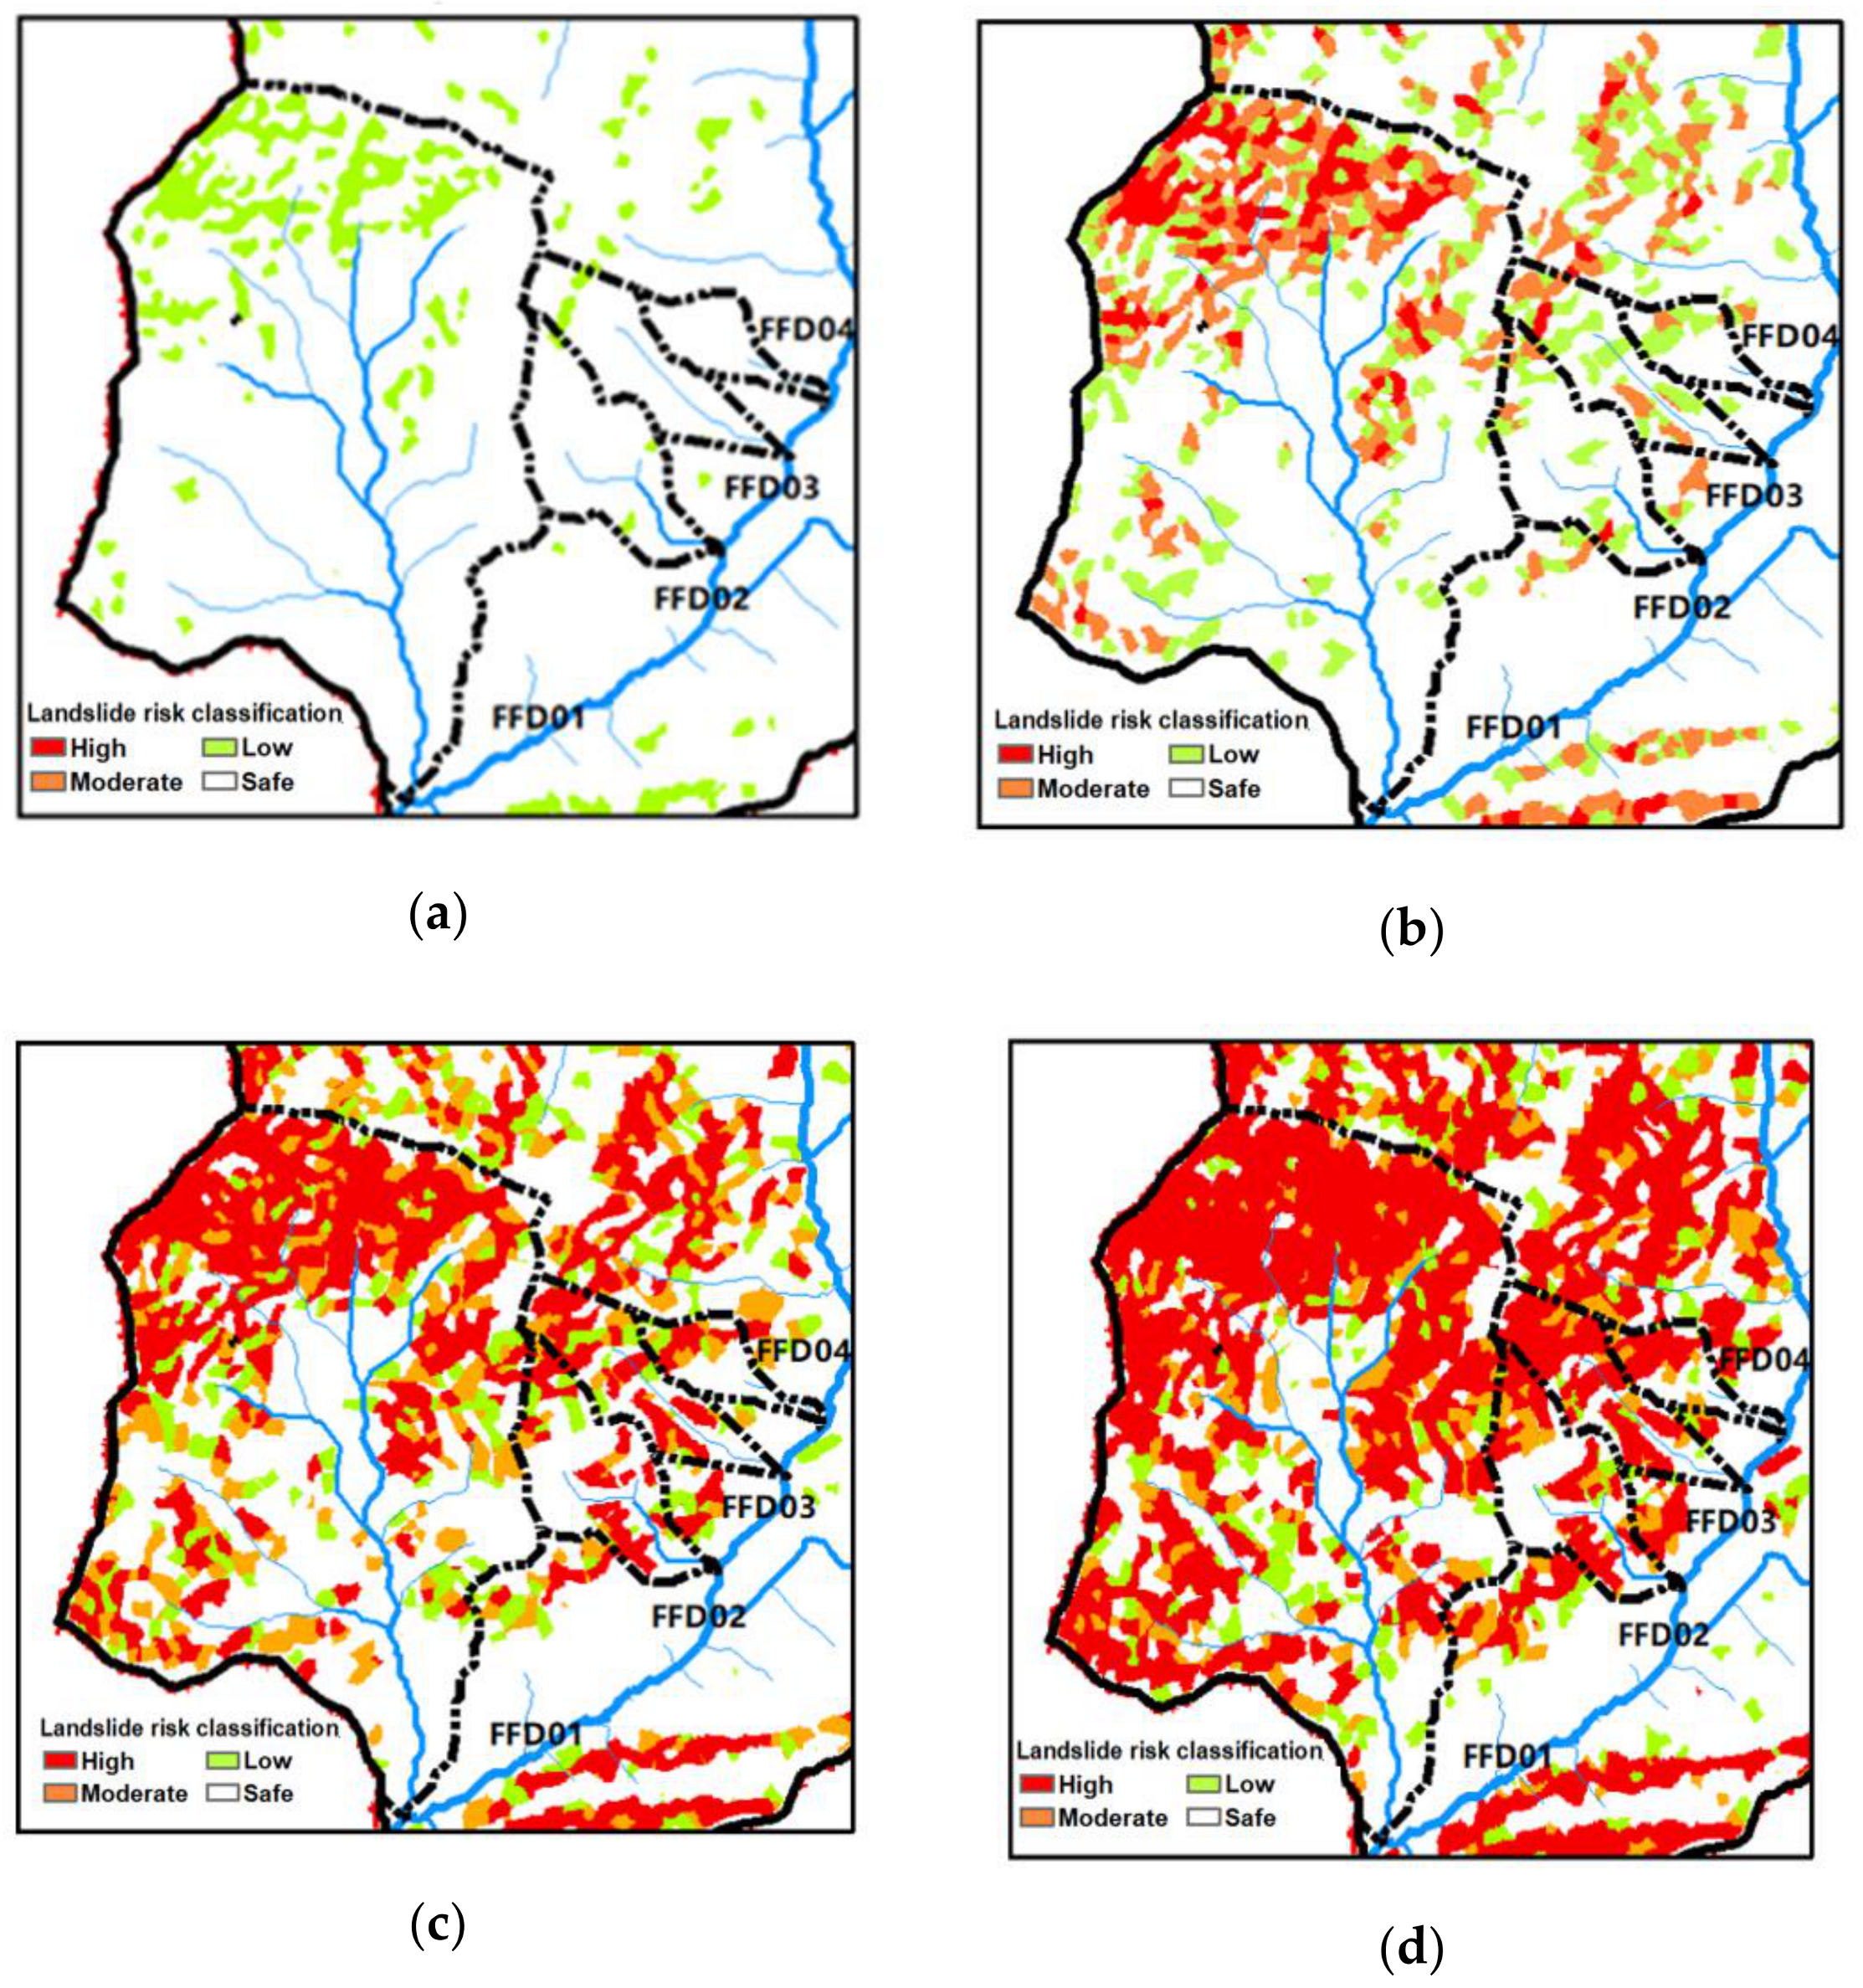
4.3. Variation Law of Soil Moisture
5. Discussion
6. Conclusions
Author Contributions
Funding
Informed Consent Statement
Data Availability Statement
Conflicts of Interest
References
- Duan, W.L.; He, B.; Nover, D.; Fan, J.L.; Yang, G.S.; Chen, W.; Meng, H.F.; Liu, C.M. Floods and associated socioeconomic damages in China over the last century. Nat. Hazards 2016, 82, 401–413. [Google Scholar] [CrossRef]
- Tu, H.W.; Wang, X.K.; Zhang, W.S.; Peng, H.; Ke, Q.; Chen, X.M. Flash Flood Early Warning Coupled with Hydrological Simulation and the Rising Rate of the Flood Stage in a Mountainous Small Watershed in Sichuan Province, China. Water 2020, 12, 255. [Google Scholar] [CrossRef]
- Chen, X.Z.; Cui, Y.F. The formation of the Wulipo landslide and the resulting debris flow in Dujiangyan City, China. J. Mt. Sci. 2017, 14, 1100–1112. [Google Scholar] [CrossRef]
- Wang, J.; Jin, Z.D.; Hilton, R.G.; Zhang, F.; Densmore, A.L.; Li, G.; West, A.J. Controls on fluvial evacuation of sediment from earthquake-triggered landslides. Geology 2015, 43, 115–118. [Google Scholar] [CrossRef]
- Parker, R.N.; Densmore, A.L.; Rosser, N.J.; de Michele, M.; Li, Y.; Huang, R.Q.; Whadcoat, S.; Petley, D.N. Mass wasting triggered by the 2008 Wenchuan earthquake is greater than orogenic growth. Nat. Geosci. 2011, 4, 449–452. [Google Scholar] [CrossRef]
- Tang, Y.X.; Zhang, Z.J.; Wang, C.; Zhang, H.; Wu, F.; Zhang, B.; Liu, M. The deformation analysis of Wenjiagou giant landslide by the distributed scatterer interferometry technique. Landslides 2018, 15, 347–357. [Google Scholar] [CrossRef]
- Zhou, J.W.; Cui, P.; Yang, X.G.; Su, Z.M.; Guo, X.J. Debris flows introduced in landslide deposits under rainfall conditions: The case of Wenjiagou gully. J. Mt. Sci. 2013, 10, 249–260. [Google Scholar] [CrossRef]
- Ran, Q.H.; Qian, Q.; Li, W.; Fu, X.D.; Yu, X.; Xu, Y.P. Impact of earthquake-induced-landslides on hydrologic response of a steep mountainous catchment: A case study of the Wenchuan earthquake zone. J. Zhejiang Univ. Sci. A 2015, 16, 131–142. [Google Scholar] [CrossRef]
- Dietrich, W.E.; Wilson, C.J.; Montgomery, D.R.; McKean, J. Analysis of erosion thresholds, channel networks, and landspace morphology using a digital terrain model. J. Geol. 1993, 101, 259–278. [Google Scholar] [CrossRef]
- Dietrich, W.E.; Reiss, R.; Hsu, M.L.; Montgomery, D.R. A process-based model for colluvial soil depth and shallow landsliding using digital elevation data. Hydrol. Process. 1995, 9, 383–400. [Google Scholar] [CrossRef]
- Montgomery, D.R.; Dietrich, W.E. A physically-based model for the topographic control on shallow landsliding. Water Resour. Res. 1994, 30, 1153–1171. [Google Scholar] [CrossRef]
- Baum, R.L.; Savage, W.Z.; Godt, J.W.J.O.-F.R. TRIGRS-A Fortran Program for Transient Rainfall Infiltration and Grid-Based Regional Slope-Stability Analysis; US Geological Survey Open-File Report; US Geological Survey: Reston, VA, USA, 2002.
- Baum, R.L.; Savage, W.Z.; Godt, J.W.J.O.-F.R. TRIGRS—A Fortran Program for Transient Rainfall Infiltration and Grid-Based Regional Slope-Stability Analysis, Version 2.0; US Geological Survey Open-File Report; US Geological Survey: Reston, VA, USA, 2008.
- Tang, Y.; Yin, K.-L.; Liu, L.; Zhang, L.; Fu, X.-L. Dynamic assessment of rainfall-induced shallow landslide hazard. J. Mt. Sci. 2017, 14, 1292–1302. [Google Scholar] [CrossRef]
- Marin, R.J.; Velasquez, M.F. Influence of hydraulic properties on physically modelling slope stability and the definition of rainfall thresholds for shallow landslides. Geomorphology 2020, 351, 14. [Google Scholar] [CrossRef]
- Chen, Y.-L.; Chen, D.-H.; Li, Z.-C.; Huang, J.-B. Preliminary studies on the dynamic prediction method of rainfall-triggered landslide. J. Mt. Sci. 2016, 13, 1735–1745. [Google Scholar] [CrossRef]
- Tang, C.X.; Tanyas, H.; van Westen, C.J.; Tang, C.; Fan, X.M.; Jetten, V.G. Analysing post-earthquake mass movement volume dynamics with multi-source DEMs. Eng. Geol. 2019, 248, 89–101. [Google Scholar] [CrossRef]
- Fan, J.R.; Zhang, X.Y.; Su, F.H.; Ge, Y.G.; Tarolli, P.; Yang, Z.Y.; Zeng, C.; Zeng, Z. Geometrical feature analysis and disaster assessment of the Xinmo landslide based on remote sensing data. J. Mt. Sci. 2017, 14, 1677–1688. [Google Scholar] [CrossRef]
- Chang, M.; Tang, C.; Ni, H.Y.; Qu, Y.P. Evolution process of sediment supply for debris flow occurrence in the Longchi area of Dujiangyan City after the Wenchuan earthquake. Landslides 2015, 12, 611–623. [Google Scholar] [CrossRef]
- Tang, C.; Zhu, J.; Chang, M.; Ding, J.; Qi, X. An empirical-statistical model for predicting debris-flow runout zones in the Wenchuan earthquake area. Quat. Int. 2012, 250, 63–73. [Google Scholar] [CrossRef]
- Chiu, Y.J.; Lee, H.Y.; Wang, T.L.; Yu, J.Y.; Lin, Y.T.; Yuan, Y.P. Modeling Sediment Yields and Stream Stability Due to Sediment-Related Disaster in Shihmen Reservoir Watershed in Taiwan. Water 2019, 11, 332. [Google Scholar] [CrossRef]
- Guzzetti, F.; Ardizzone, F.; Cardinali, M.; Rossi, M.; Valigi, D. Landslide volumes and landslide mobilization rates in Umbria, central Italy. Earth Planet. Sci. Lett. 2009, 279, 222–229. [Google Scholar] [CrossRef]
- Larsen, I.J.; Montgomery, D.R.; Korup, O. Landslide erosion controlled by hillslope material. Nat. Geosci. 2010, 3, 247–251. [Google Scholar] [CrossRef]
- Guzzetti, F.; Carrara, A.; Cardinali, M.; Reichenbach, P. Landslide hazard evaluation: A review of current techniques and their application in a multi-scale study, Central Italy. Geomorphology 1999, 31, 181–216. [Google Scholar] [CrossRef]
- Wang, K.; Zhang, S.J.; DelgadoTellez, R.; Wei, F.Q. A new slope unit extraction method for regional landslide analysis based on morphological image analysis. Bull. Eng. Geol. Environ. 2019, 78, 4139–4151. [Google Scholar] [CrossRef]
- Romstad, B.; Etzelmuller, B. Mean-curvature watersheds: A simple method for segmentation of a digital elevation model into terrain units. Geomorphology 2012, 139, 293–302. [Google Scholar] [CrossRef]
- Yan, G.; Liang, S.Y.; Zhao, H.L. An Approach to Improving Slope Unit Division Using GIS Technique. Sci. Geogr. Sin. 2017, 11, 1764–1770. [Google Scholar]
- Alvioli, M.; Marchesini, I.; Reichenbach, P.; Rossi, M.; Ardizzone, F.; Fiorucci, F.; Guzzetti, F. Automatic delineation of geomorphological slope units with r.slopeunits v1.0 and their optimization for landslide susceptibility modeling. Geosci. Model Dev. 2016, 9, 3975–3991. [Google Scholar] [CrossRef]
- Alvioli, M.; Guzzetti, F.; Rossi, M. Scaling properties of rainfall induced landslides predicted by a physically based model. Geomorphology 2014, 213, 38–47. [Google Scholar] [CrossRef]
- Wang, K.; Xu, H.; Zhang, S.J.; Wei, F.Q.; Xie, W.L. Identification and Extraction of Geomorphological Features of Landslides Using Slope Units for Landslide Analysis. ISPRS Int. Geo-Inf. 2020, 9, 274. [Google Scholar] [CrossRef]
- Alvioli, M.; Baum, R.L. Parallelization of the TRIGRS model for rainfall-induced landslides using the message passing interface. Environ. Model. Softw. 2016, 81, 122–135. [Google Scholar] [CrossRef]
- Srivastava, R.; Yeh, T.C.J. Analytical solutions for one-dimensional, transient infiltration toward the water-table in homogeneous and layered soils. Water Resour. Res. 1991, 27, 753–762. [Google Scholar] [CrossRef]
- Iverson, R.M. Landslide triggering by rain infiltration. Water Resour. Res. 2000, 36, 1897–1910. [Google Scholar] [CrossRef]
- Gardner, W.R. Some steady-state solutions of the unsaturated moisture flow equation with application to evaporation from a water table. Soil sci. 1958, 85, 228–232. [Google Scholar] [CrossRef]
- Cheng, S. Vulnerability Assessment for Post-Earthquake Coincident Debris Flows in Longxihe River Basin, Dujiangyan City. Ph.D. Thesis, Chengdu University of Technology, Chengdu, China, 2015. [Google Scholar]
- Wang, J.F.; Guo, L.F.; Du, C.X.; Zhu, X.X. Effect of Water Content and Dry Density on Shear Strength of Sandy Loam Soil. Pearl River 2019, 40, 19–22. [Google Scholar]
- Rawls, W.J.J.A. Estimating soil water properties. Trans. ASAE 1982, 25, 1316–1320. [Google Scholar] [CrossRef]
- Simunek, J.J.H.S. The HYDRUS 1D Software Package for Simulating the One-Dimensional Movement of Water, Heat, and Multiple Solutes in Variably Saturated Porous Media, version 3.0; HYDRUS Software Series 1; Department of Environmental Sciences, University of California Riverside: Riverside, CA, USA, 2005. [Google Scholar]
- Carsel, R.F.; Parrish, R.S. Developing joint probability-distributions of soil-water retention characteristics. Water Resour. Res. 1988, 24, 755–769. [Google Scholar] [CrossRef]
- Saulnier, G.M.; Beven, K.; Obled, C. Including spatially variable effective soil depths in TOPMODEL. J. Hydrol. 1997, 202, 158–172. [Google Scholar] [CrossRef]
- Park, D.W.; Nikhil, N.V.; Lee, S.R. Landslide and debris flow susceptibility zonation using TRIGRS for the 2011 Seoul landslide event. Nat. Hazards Earth Syst. Sci. 2013, 13, 2833–2849. [Google Scholar] [CrossRef]
- Li, G.; West, A.J.; Densmore, A.L.; Jin, Z.D.; Parker, R.N.; Hilton, R.G. Seismic mountain building: Landslides associated with the 2008 Wenchuan earthquake in the context of a generalized model for earthquake volume balance. Geochem. Geophys. Geosyst. 2014, 15, 833–844. [Google Scholar] [CrossRef]
- Marc, O.; Hovius, N. Amalgamation in landslide maps: Effects and automatic detection. Nat. Hazards Earth Syst. Sci. 2015, 15, 723–733. [Google Scholar] [CrossRef]
- Fan, R.L.; Zhang, L.M.; Shen, P. Evaluating volume of coseismic landslide clusters by flow direction-based partitioning. Eng. Geol. 2019, 260, 11. [Google Scholar] [CrossRef]


| Soil cohesion c (kPa) | 17.12 |
| Soil friction angle ø (°) | 17.01 |
| Soil unit weight (kN/m3) | 19.00 |
| Residual soil water content θs | 0.067 |
| Saturated soil water content θr | 0.45 |
| Parameter α in the soil water retention function | 0.02 |
| Saturated hydrological conductivity KS (m/s) | 1.25 × 10⁻⁶ |
| Background infiltration rate IZLT (m/s) | 1.25 × 10⁻⁸ |
| Rank | Rank of Index | Rank of Hazard |
|---|---|---|
| 1 | High | |
| 2 | Moderate | |
| 3 | Low | |
| 4 | Safe |
| Number | Gully Name | LAISI | LASU | LVDI | LVSU |
|---|---|---|---|---|---|
| FFD1 | Bayi | 2,278,300 | 2,680,000 | 8,589,400 | 8,782,030 |
| FFD2 | Maliu | 166,000 | 197,356 | 594,800 | 633,567 |
| FFD3 | Huangyang | 250,000 | 259,531 | 1,435,000 | 934,884 |
| FFD4 | Shuida | 72,800 | 81,250 | 212,100 | 261,470 |
Publisher’s Note: MDPI stays neutral with regard to jurisdictional claims in published maps and institutional affiliations. |
© 2020 by the authors. Licensee MDPI, Basel, Switzerland. This article is an open access article distributed under the terms and conditions of the Creative Commons Attribution (CC BY) license (http://creativecommons.org/licenses/by/4.0/).
Share and Cite
Sun, T.; Deng, Z.; Xu, Z.; Wang, X. Volume Estimation of Landslide Affected Soil Moisture Using TRIGRS: A Case Study of Longxi River Small Watershed in Wenchuan Earthquake Zone, China. Water 2021, 13, 71. https://doi.org/10.3390/w13010071
Sun T, Deng Z, Xu Z, Wang X. Volume Estimation of Landslide Affected Soil Moisture Using TRIGRS: A Case Study of Longxi River Small Watershed in Wenchuan Earthquake Zone, China. Water. 2021; 13(1):71. https://doi.org/10.3390/w13010071
Chicago/Turabian StyleSun, Tong, Zhiyuan Deng, Zexing Xu, and Xiekang Wang. 2021. "Volume Estimation of Landslide Affected Soil Moisture Using TRIGRS: A Case Study of Longxi River Small Watershed in Wenchuan Earthquake Zone, China" Water 13, no. 1: 71. https://doi.org/10.3390/w13010071
APA StyleSun, T., Deng, Z., Xu, Z., & Wang, X. (2021). Volume Estimation of Landslide Affected Soil Moisture Using TRIGRS: A Case Study of Longxi River Small Watershed in Wenchuan Earthquake Zone, China. Water, 13(1), 71. https://doi.org/10.3390/w13010071