Article

Climatic and Anthropogenic Impacts on Environmental Conditions and Phytoplankton Community in the Gulf of Trieste (Northern Adriatic Sea)

1
CNR—ISMAR Marine Science Institute, 34149 Trieste, Italy
2
National Institute of Oceanography and Applied Geophysics—OGS, 34010 Trieste, Italy
3
Regional Environmental Protection Agency, Friuli Venezia Giulia Region–ARPA-FVG, 33057 Palmanova, Italy
*
Author to whom correspondence should be addressed.
Water 2020, 12(9), 2652; https://doi.org/10.3390/w12092652
Submission received: 21 July 2020 / Revised: 10 September 2020 / Accepted: 20 September 2020 / Published: 22 September 2020

Abstract

:
During the last century, human activities have exerted an increasing pressure on coastal ecosystems, primarily inducing their eutrophication, with a more recent partial mitigation of this phenomenon where improvements of environmental management practices were adopted. However, a reanalysis of the pressures on coastal zones and surrounding drainage basins is needed because of the alterations induced nowadays by the climate changes. A comparative analysis of long-term oceanographic and environmental data series (1986–2018) was performed, in order to highlight the effects of anthropogenic and climatic disturbances on the phytoplankton community in the Gulf of Trieste (GoT). After the 1980s, the decline in phytoplankton abundance was matched to increasing periods of low runoff, an overall deficit of the precipitation and to a decrease in phosphate availability in the coastal waters (−0.003 µmol L−1 yr−1), even in the presence of large riverine inputs of nitrogen and silicates. This trend of oligotrophication was reversed in the 2010s by the beginning of a new and unexpected phase of climatic instability, which also caused changes of the composition and seasonal cycle of the phytoplankton community. Beyond the management of nutrient loads, it was shown that climatic drivers such as seawater warming, precipitation and wind regime affect both nutrient balance and phytoplankton community in this coastal zone.

1. Introduction

Phytoplankters play an essential role in global cycles of the main biogenic elements, as they are the most important primary producers in aquatic ecosystems. Their communities are in continual adjustment responding to the disturbances induced in marine systems by anthropogenic activities and climate changes [1,2,3,4,5,6]. Therefore, phytoplankton is recognized as an important indicator of environmental changes, in particular in the coastal zones, where the interactions between atmospheric, terrestrial and marine drivers are more dynamic [7,8,9,10,11]. However, the evolution of community structures, of phenological characteristics and of the productivity remain often uncertain because of the complex and unpredictable effects that environmental pressures can have in these marine systems [12,13].
In the last century, anthropogenic impact caused a growing eutrophication in coastal zones worldwide, with a consequent exponential rise in hypoxia since the 1960s [2,14]. Eutrophication may result from changes in the hydrological regimes, organic matter loadings and biological interactions, but the most frequent cause is an excessive nutrient loading from the drainage basins. Consequently, these marine ecosystems have been affected by the degradation of water quality, loss of habitats and natural resources, noxious and harmful algal blooms and by the alteration of community structures, with a frequent decrease in the secondary production and loss of benthic fauna [1,15]. In the developed countries, the delicate equilibrium of coastal ecosystems is further threatened by the increase in the number of point and diffuse sources of nutrients and organic matter along the coasts and in the surrounding drainage basins [2,4].
In Europe, an improvement of environmental management practices has been realized in the more recent decades, mitigating eutrophication problems in several watersheds [16,17] and marginal shelfs such as the northern Adriatic [18,19]. However, the structure of these marine ecosystems has often been definitively altered compared to their pre-eutrophic conditions. The largest fraction of nitrogen and phosphorus inputs in these areas still has an anthropogenic origin, with an overload of nitrogen mainly due to agriculture and atmospheric deposition and phosphorus mainly linked to urban and industrial wastewater loads [16,17,19,20,21].
Nowadays, the European coastal zones are also impacted by the modifications of the regional climatic conditions [7]. The increases in seawater temperature and the frequency of sea storms often alter their hydrodynamics, with effects that are dependent on the seasonality [11,22,23,24]. Climatic conditions can deeply change the freshwater balance in estuaries, coastal zones and continental shelves, because of their direct effect on the runoff in the surrounding drainage basins [7,25]. In this context, phytoplankton communities are important ecological indicators, as they respond to a variety of climatic changes acting on temporal scales from weeks to decades [10,26].
The Gulf of Trieste (GoT) is a good example of a midlatitude shallow continental shelf subjected to a complex interaction of environmental disturbances. It is affected by a pronounced climatic cycle and by a large anthropogenic pressure [23,27,28,29], which has caused eutrophic and dystrophic phenomena and ecosystem regime shifts [30,31]. Although these phenomena have been partially studied, the evolution of the phytoplankton community and the changes of environmental disturbances have not been fully analyzed on long-term scales, to date.
This study analyses the time series of phytoplankton data and of the most important environmental parameters, over a 32-year period, in order to identify the role and succession of the main climatic and anthropogenic drivers that could have substantially modulated the microalgae community in this coastal zone. Long-term oscillations and trends of the phytoplankton community, runoff, climatic conditions, nutrient loads and biogeochemical conditions in the GoT are analyzed in relation to the information available in the scientific literature. This synthesis is of basic importance to allow a long-term modeling of the primary productivity to identify the gaps of knowledge that still limit the understanding of this changing marine ecosystem and to infer scenarios for similar coastal zones worldwide.

2. Materials and Methods
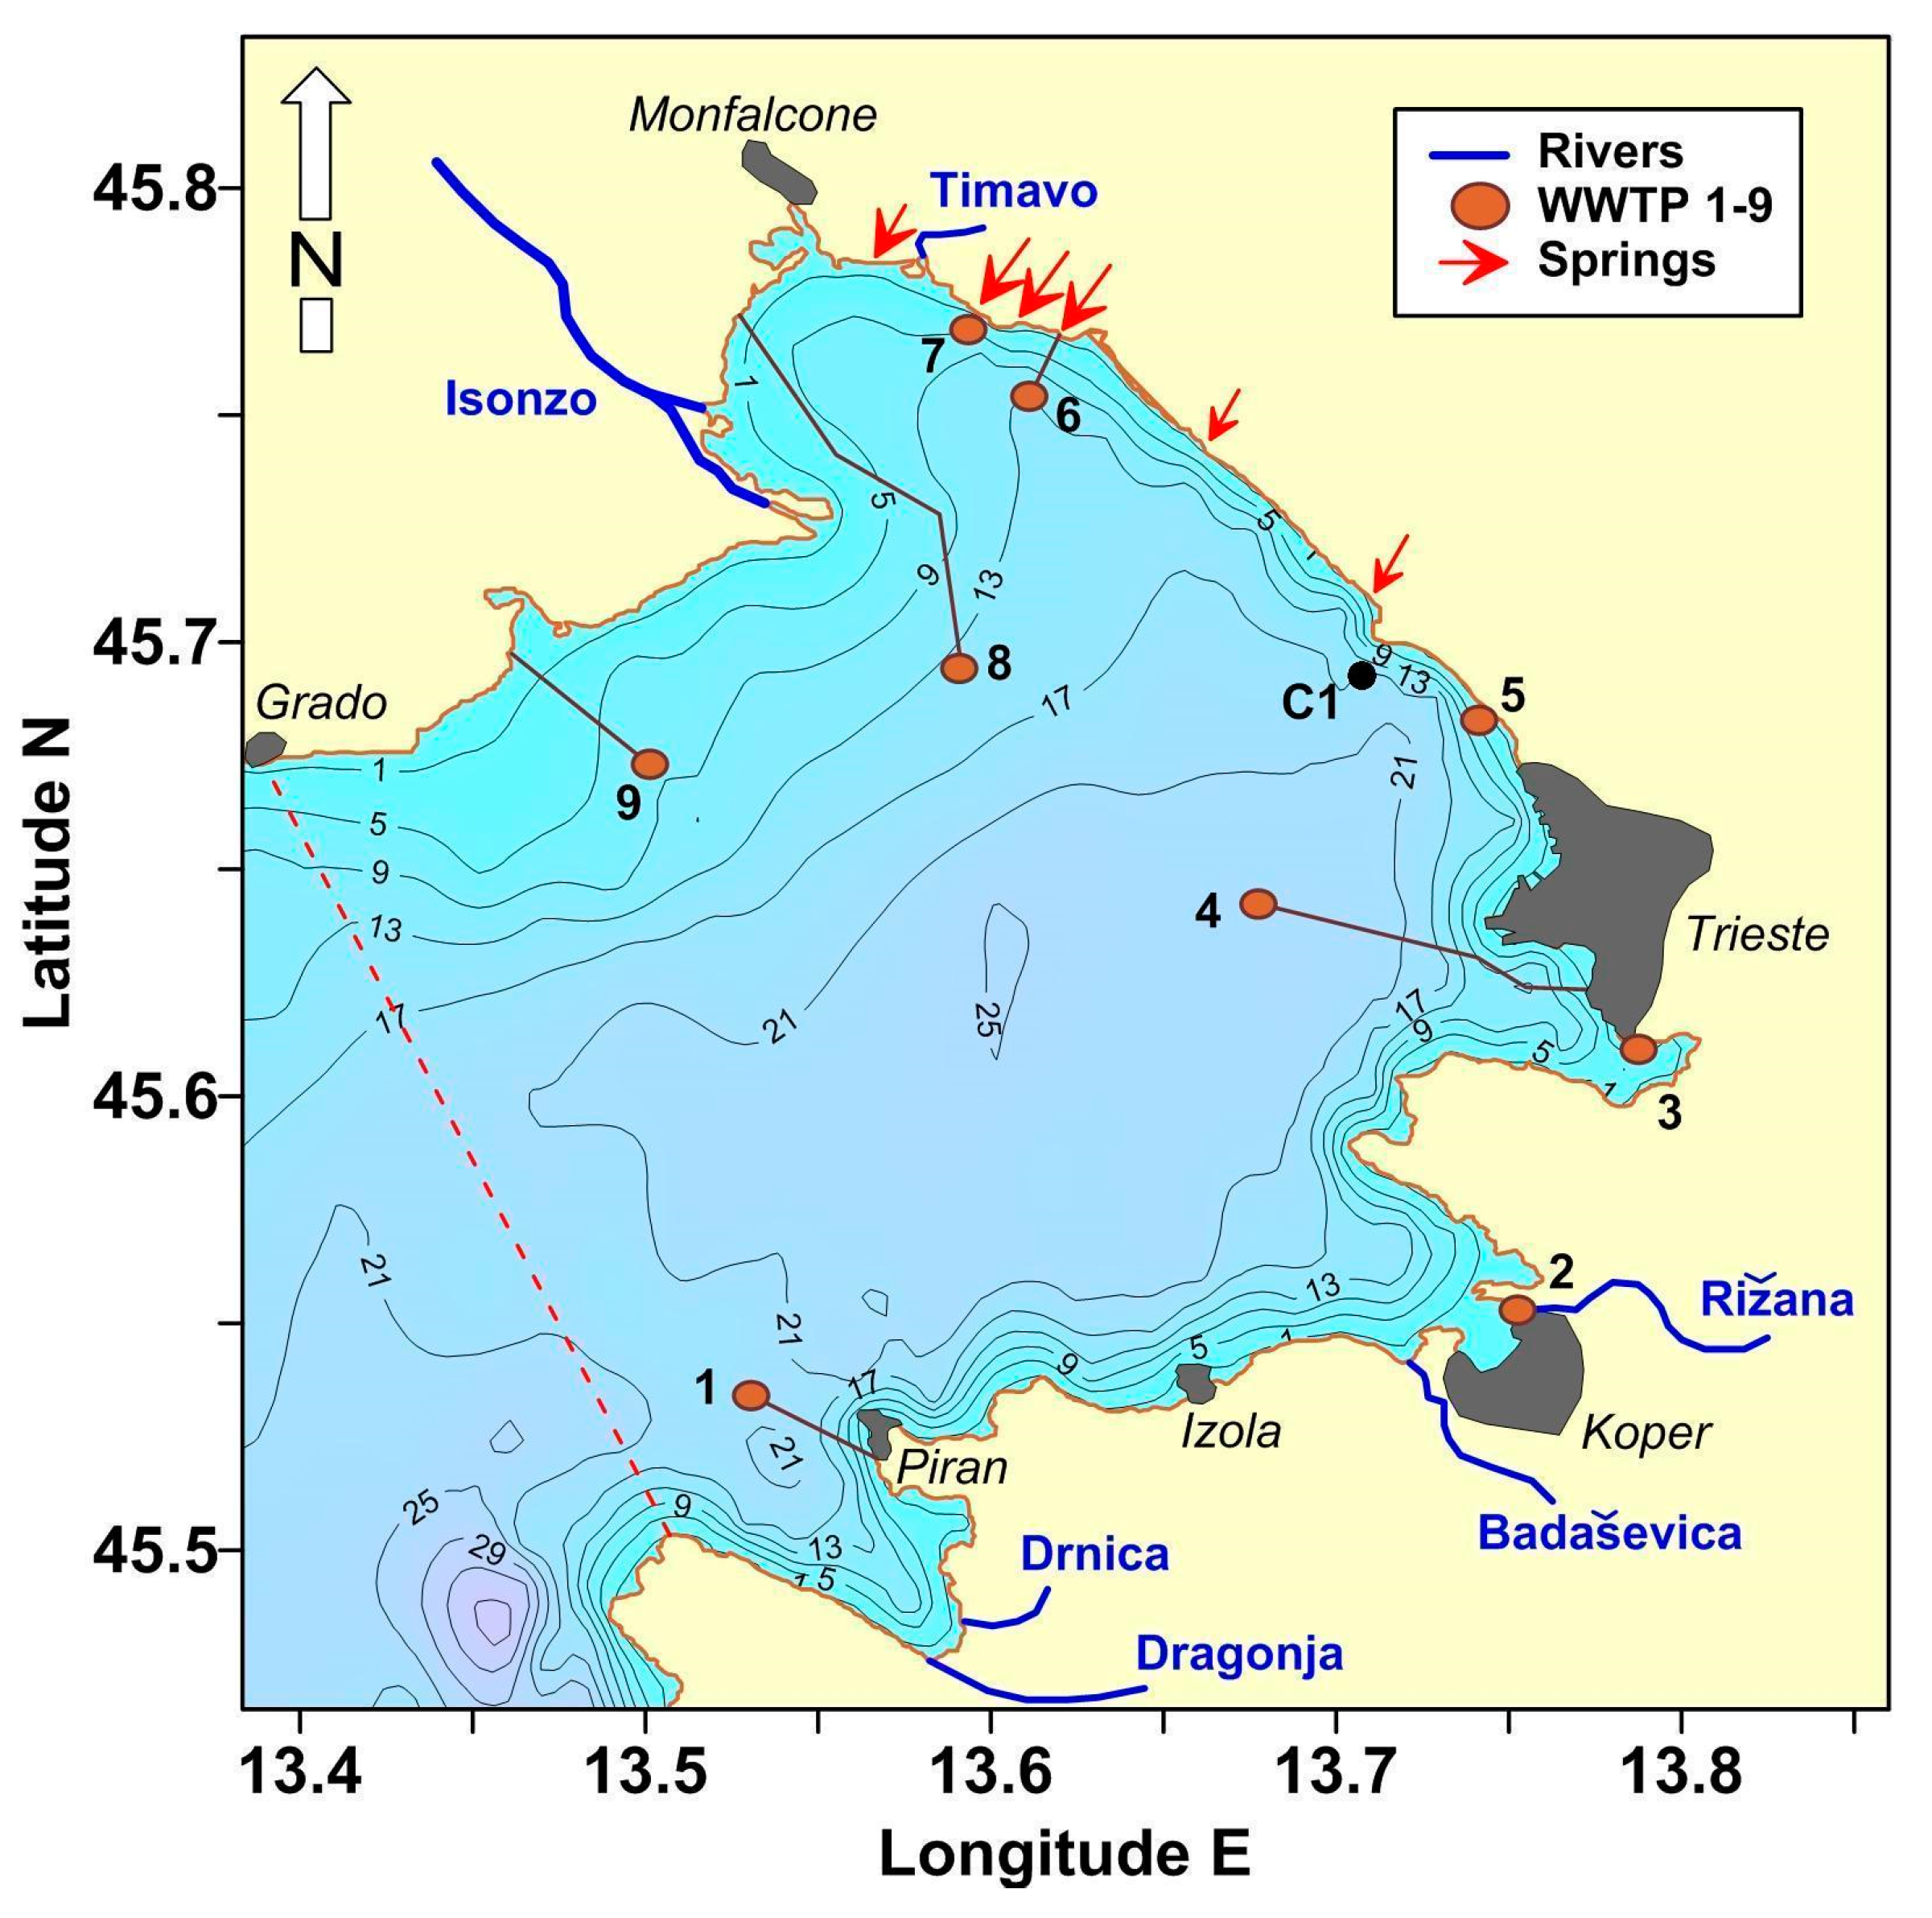
2.1. Study Site

The GoT is a shallow (≤25 m of depth), semienclosed continental shelf area that extends for 20 × 25 km in its inner area (Figure 1). This coastal zone exhibits extremely variable oceanographic properties and atmospheric conditions, as well as an anthropogenic pressure that originates from several urban and industrial settlements along the coast, including the major cities of Trieste and Koper.
Atmospheric processes, discharges of continental waters and exchange of seawater at the western open boundary cause large oscillations of the salinity (10–38.5) and temperature (4–29.2 °C) in the coastal waters [32]. Water column conditions seasonally change from a persistent stratification in summer to a complete mixing in winter, but events of strong climatic circulation of shelf waters can rapidly change them in all the seasons [33].
River discharge in the GoT collects the freshwater originated by the precipitation in a drainage basin of about 4250 km2 surrounding the gulf. The largest discharges are constituted by Isonzo and Timavo rivers (mean flows, respectively, of 82 and 27 m3 s−1, in 1998–2008). Along the southern Slovenian Coast, Rižana, Badaševica, Drnica and Dragonja rivers have smaller flows (0.25–4.0 m3 s−1) due to their smaller drainage basins [29]. Several submarine springs also contribute to the runoff in the gulf (mean flow 6 m3 s−1) draining a Karst area of about 750 km2 [34,35]. Another term of freshwater balance in the GoT is the direct precipitation at sea surface, although it was not constrained, to date.
River discharges [29,36,37,38], sewage discharges [28,39,40,41], atmospheric deposition [27] and benthic fluxes [42,43] modulate the balances of the nutrients and organic matter in the GoT, having a great effect on plankton communities. In particular, the important effect on the productivity of this coastal system that derives from the nutrients discharged by the Isonzo River was shown [26,36,37,38]. During the last three decades, the GoT has been repetitively affected by hypoxia and anoxia events [31], as well as by dinoflagellate blooms, mucilage phenomenon and jellyfish proliferation [30].

2.2. Coastal Water Monitoring

Hydrological and biogeochemical properties of the water column at the station C1 (45°41.4′ Latitude N; 13°42.0′ Longitude E), which is part of the Long-term Ecosystem Research network (http://www.lteritalia.it/), were measured monthly in 1986–2018 by means of CTD casts (Beckman RS 5-3; Ocean Seven models 401 and 316, Idronaut, Brugherio, Italy; 19plus SeaCAT Profiler, Sea-Bird, Bellevue, WA, USA) and Niskin bottle sampling at four depths (0, 5, 10 and 15 m).
Samples for the determination of the concentration (µmol L−1) of nutrients (nitrite, NO2; nitrate, NO3; ammonium, NH4+; phosphate, PO43−; silicate, Si(OH)4) were prefiltered with Whatman GF/F filters and stored at −20 °C. They were analyzed colorimetrically with an Alliance Integral Continuous Flow Analyzer from 1991 to 2001, a Bran+Luebbe Autoanalyzer 3 up to December 2013 and afterwards with a QuAAtro autoanalyzer (Seal Analytical, Southampton, UK) [44]. The concentration of dissolved inorganic nitrogen (DIN) was calculated as the sum of the concentrations of nitrite, nitrate and ammonium. The detection limits for DIN, phosphates and silicates were 0.02, 0.01 and 0.01 µmol L−1, respectively.
Chlorophyll a was determined by the spectrophotometric and spectrofluorometric methods, after filtration of seawater samples on Whatman GF/F filters and extraction from the particulate with 90% acetone [45]. Samples for the identification of phytoplankton and for the determination of their abundances were fixed with neutralized formaldehyde (1.6% final concentration) [46]. Cells were identified until to the specific diversity level, when it was possible, and counted according to Utermöhl method [47]. Cell counts were performed using an inverted light microscope IX71 (Olympus, Hamburg, Germany) and BMI3000B (Leica Microsystems, Wetzlar, Germany) equipped with phase contrast at 400X. A minimum of 200 cells were counted along one or two transects and, in addition, half of the sedimentation chamber was examined at 200X in order to identify the sporadic species. Phytoplankton specimens were identified to the lowest possible taxonomic level, and species names were checked for validity against AlgaeBase—World-wide electronic publication, National University of Ireland, Galway (URL: https://www.algaebase.org; accessed in September 2018).
The taxonomical structure of the community was reported as diatoms, dinoflagellates, coccolithophores and phytoflagellates, which include cells smaller than 10 µm identified at the class level belonging to chryso-, chloro- crypto-, dictyocho-, eugleno-, prasino-, prymnesiophytes and incertae sedis [26].

2.3. Acquisition and Processing of Environmental Data

Depth-integrated values of hydrological and chemical parameters at the station C1 were calculated applying the trapezoidal rule to the profiles obtained by experimental data. For all the parameters, the levels of the significance (α) and the long-term trends in data series were assessed, respectively, by the Mann–Kendall test (MK) and Sen’s slope estimate test (S), which are nonparametric tests suitable to analyze trends in data series not affected by repetitive seasonal oscillations [48]. The strength and direction of monotonic relationships among environmental and phytoplankton data series were also analyzed by means of Spearman’s Rank-Order Correlation analysis, performed over the period 1986–2018, at the significance levels of 0.05 and 0.01 (Table A5).
Daily mean freshwater discharge (FW; m3 s−1) of the Isonzo River in 1986–2018 was provided by the Environmental Agency of the Republic of Slovenia (ARSO; URL: https://www.arso.gov.si/; accessed in November 2019) at Solkan Station (52 m.a.m.s.l., 45.974 latitude N 13.645 longitude E). The number of days with extremely low (<10th percentile) and high (>90th percentile) river water flows were also computed by daily flow series [49].
Monthly mean precipitation (Precipitation; mm month−1), wind speed (WS; m s−1) and wind direction (u, eastward component; v, northward component; m s−1) in the GoT were obtained by area-averaged estimates of MERRA v2 models (M2TMNXFL, M2TMNXSLV), provided by the Giovanni online data system developed and maintained by the NASA GES DISC (URL: https://giovanni.gsfc.nasa.gov/giovanni/; accessed in November 2019). Multiannual periods of anomalous dryness and wetness in the precipitation series were identified by the computation of the Standardized Precipitation Index (SPI), calculated using a Gamma distribution on 12-month cumulative precipitation (SPI12) [25]. SPI is a normalized index that expresses the precipitation as a standardized departure from a probability distribution function, thus permitting the comparisons across space and time of dry (SPI < 0) and wet (SPI > 0) periods.
The concentration of the nutrients, total nitrogen (TN) and total phosphorus (TP) at the mouth of the Isonzo River (Pieris Station; 2 m.a.m.s.l., 45.801 latitude N, 13.431 longitude E) were provided by the Regional Environmental Protection Agency (ARPA-FVG) from 1998 to 2016. In order to make a comparison, earlier data collected at the same site during a CNR monitoring program in 1976–1977 were also considered [50].
Mean concentration of N- and P-nutrients in rainwater were obtained from the inventory of the scientific literature relevant to coastal sites in Northeastern Adriatic Sea (Appendix A; Table A2). Mean concentrations of N- and P-nutrients at the outfalls of Wastewater treatment plants (WWTP) were provided by the companies and institutions involved in their management (AcegasAps s.p.a, Trieste, Italy; Komunala Koper s.r.l., Koper, Slovenia; Okolje Piran s.r.l., Piran, Slovenia; ARPA-FVG, Palmanova, Italy; Table A3).
The annual integrated transport of nutrients, TN and TP (F; t yr−1), of the Isonzo River was estimated using the equation based on discharge weighted means of daily transports:
F = [∑Ci × Qi/∑Qi] × Qy × mA × 10−6
where Ci and Qi are nutrient concentration (mol m−3) and flow rate (m3 s−1) for each ith day of sampling, QY is the annual water load (m3 yr−1) and mA is the atomic mass of the considered biogenic element [51].
A time series of daily mean seawater temperature (TSW) in the subsurface layer (2 m in depth) in the harbor of Trieste was also considered [52], in order to assess long-term seawater warming in the period of interest.
Ancillary data and figures are shown in the Appendix A (Figure A1 and Figure A2, Table A1, Table A2, Table A3, Table A4 and Table A5).

3. Results

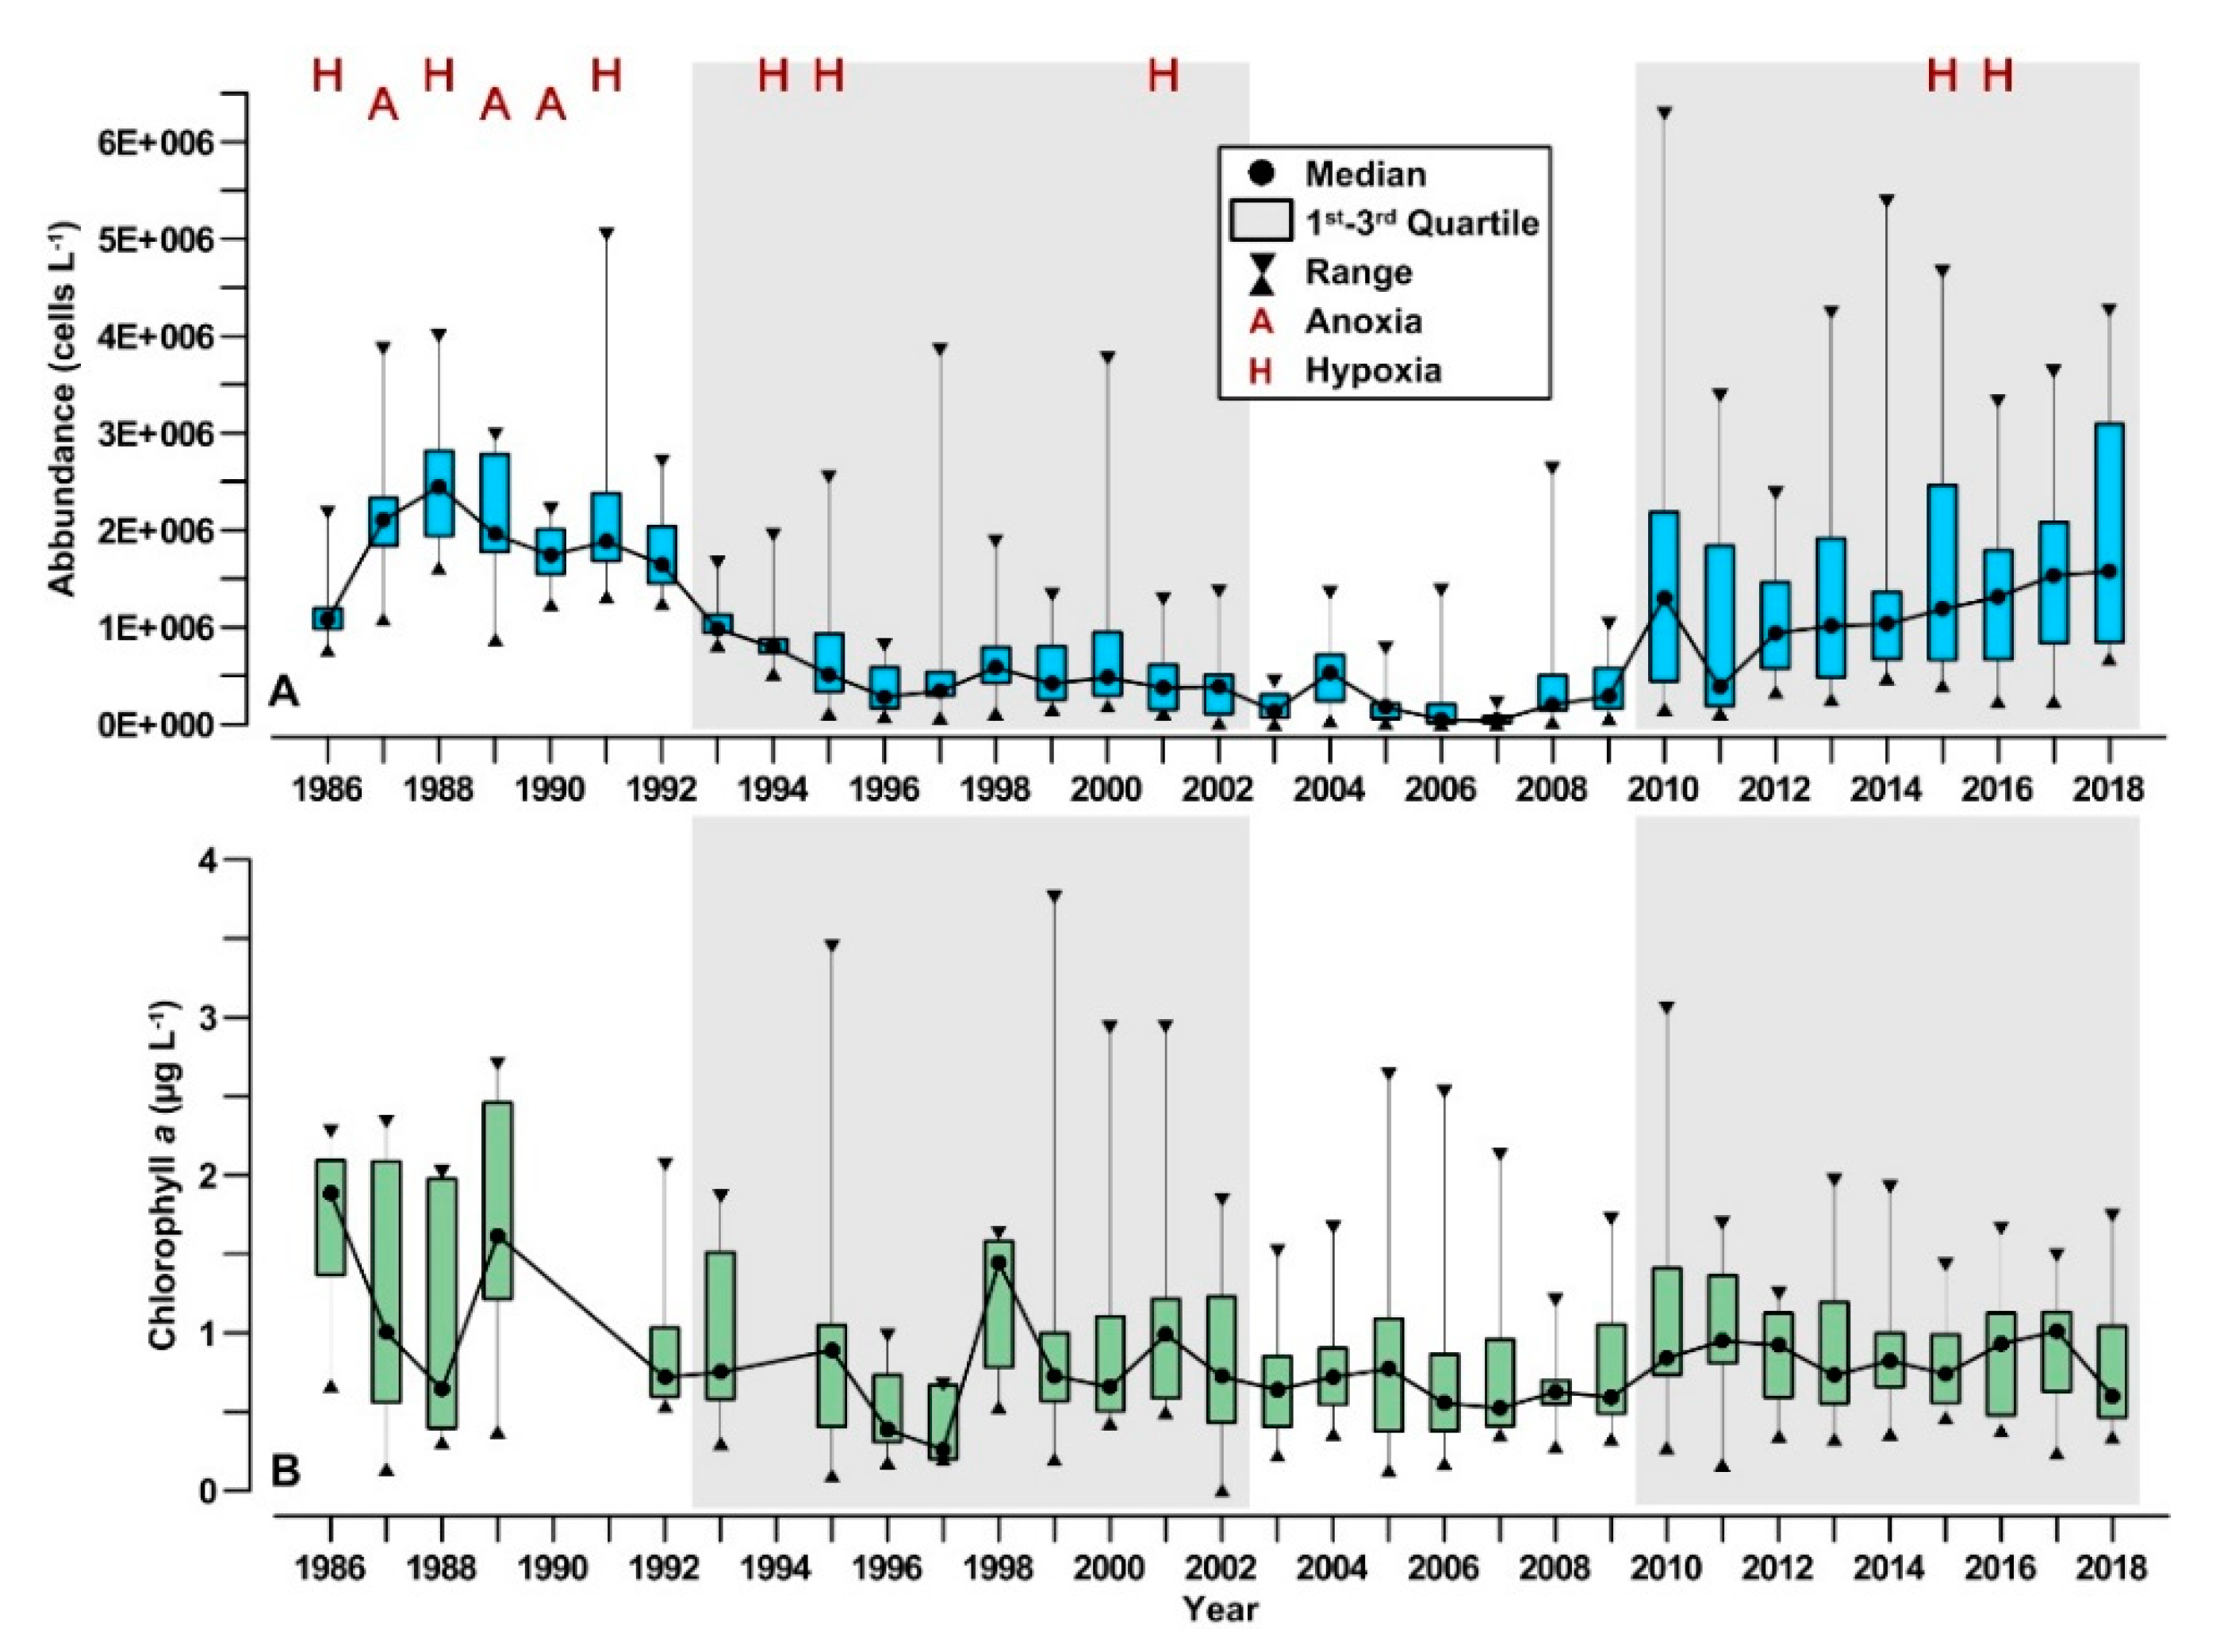
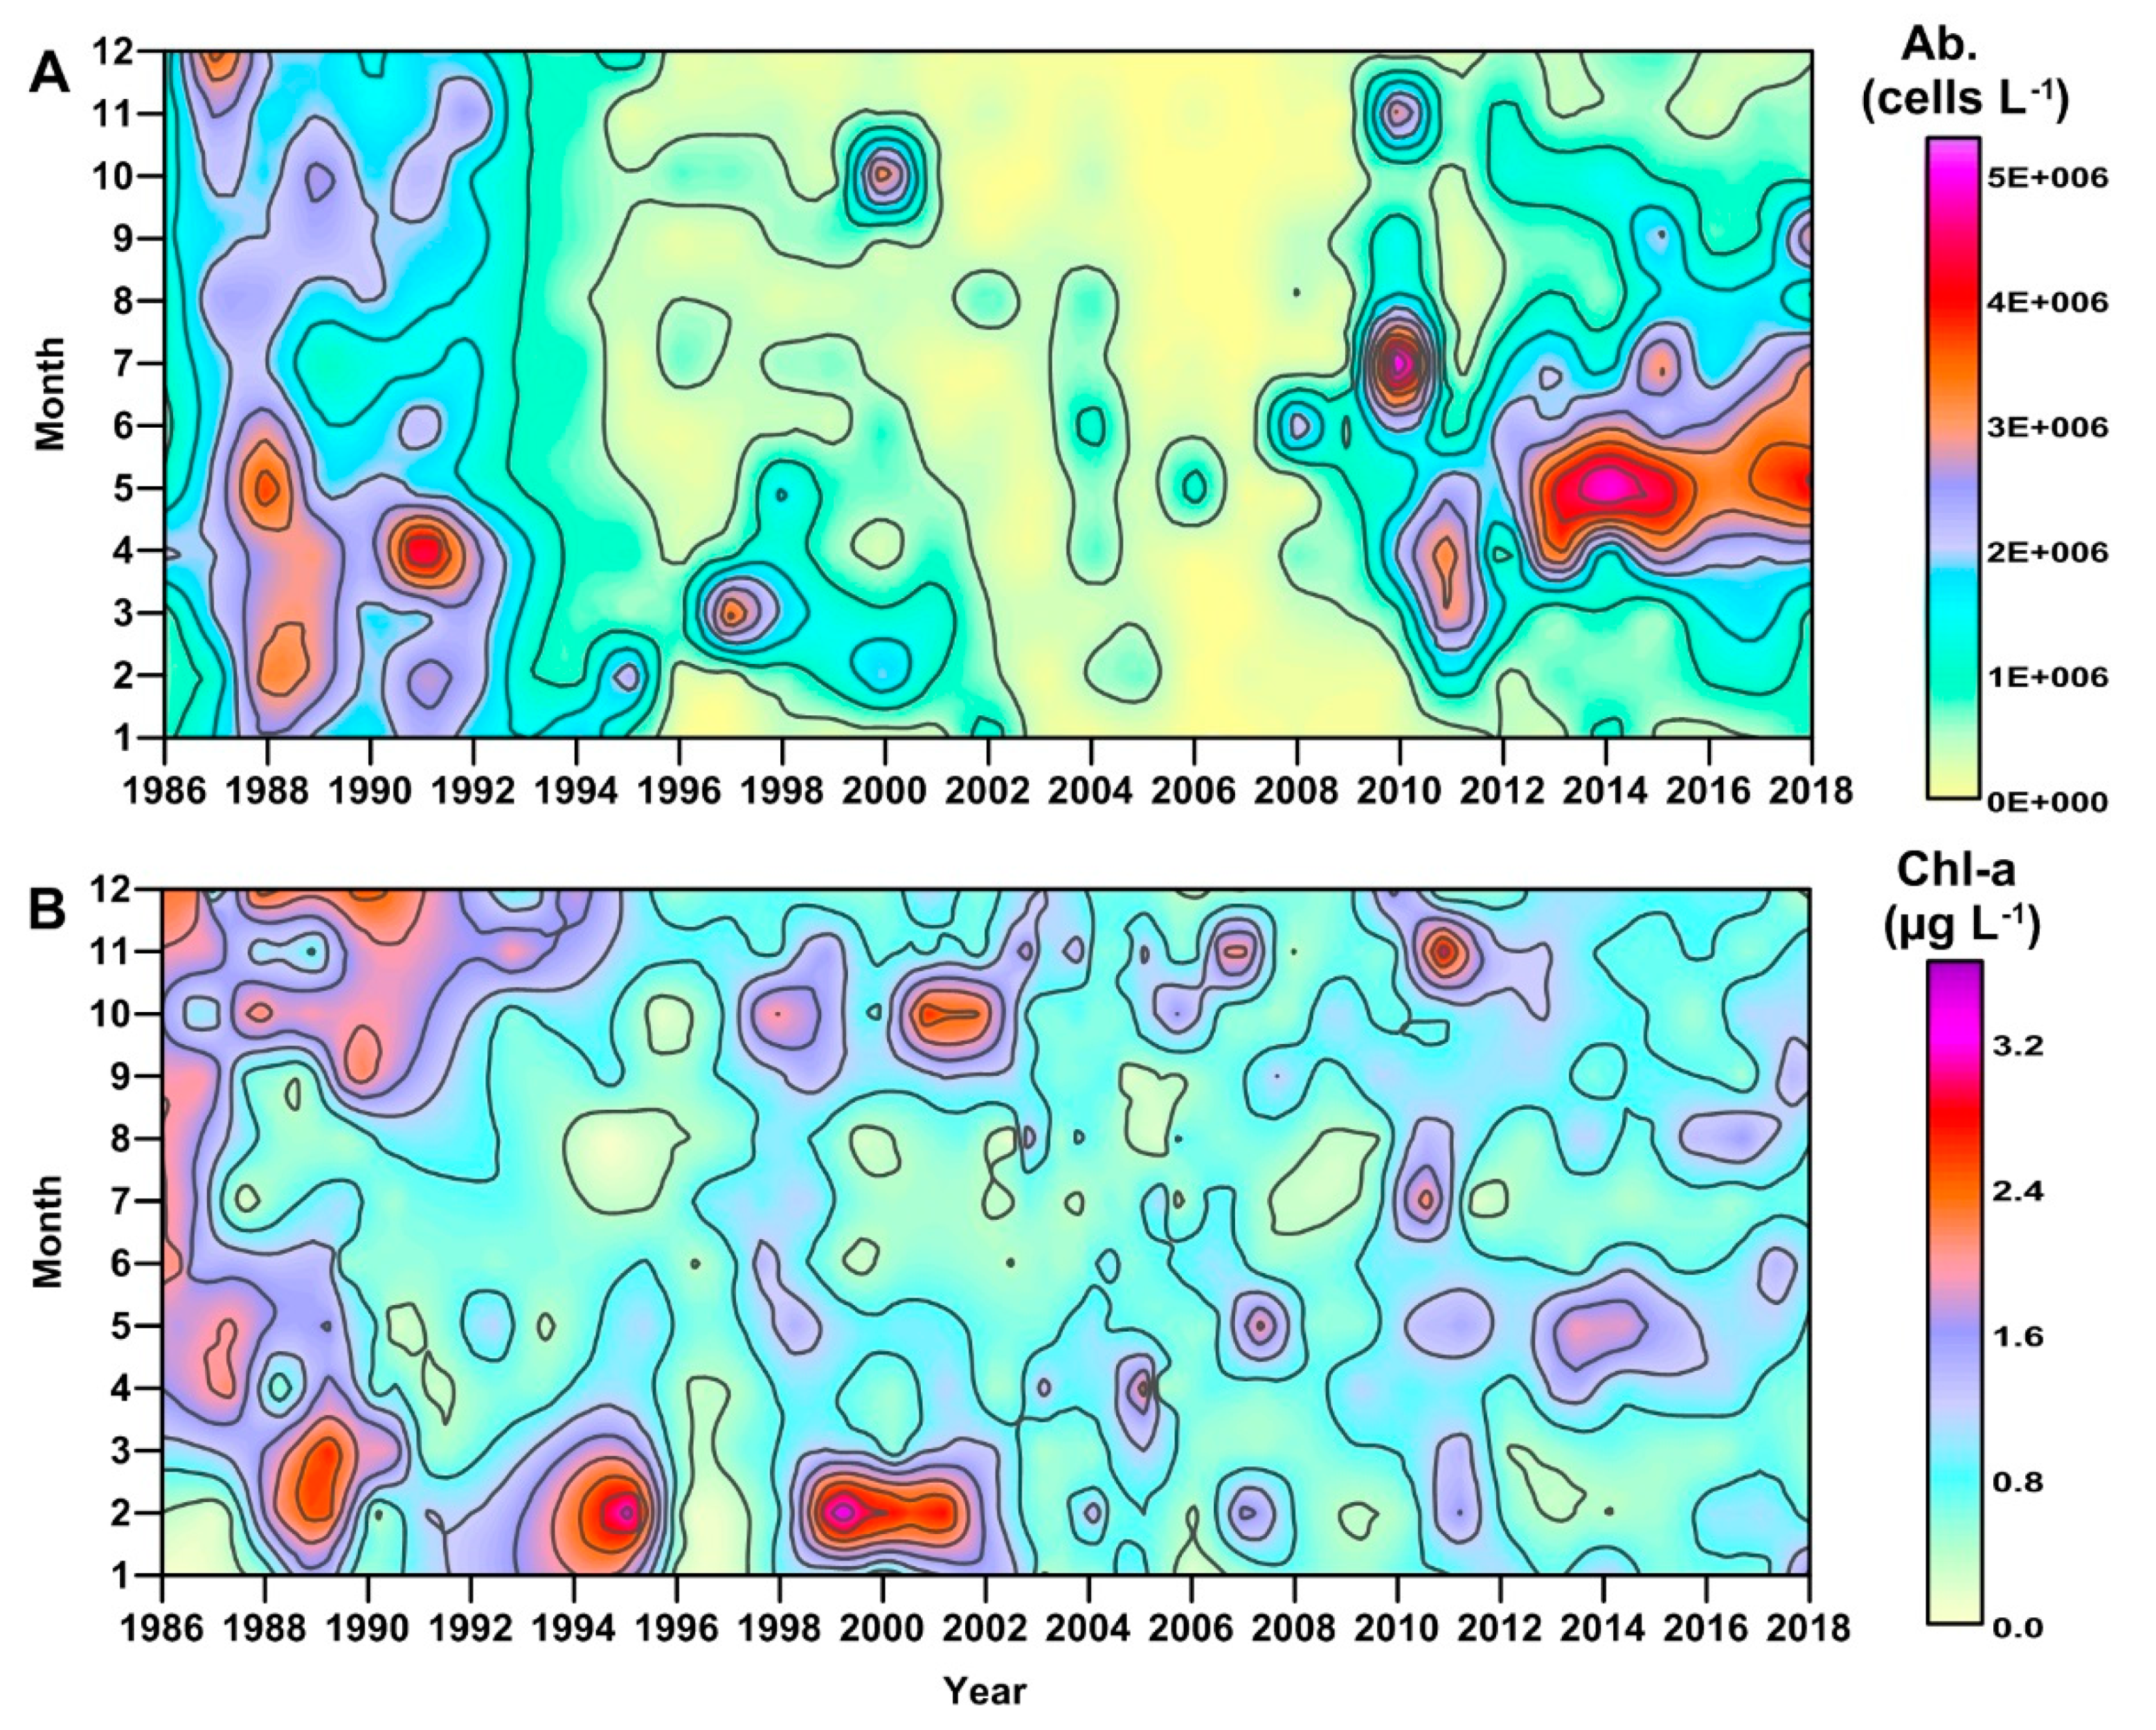
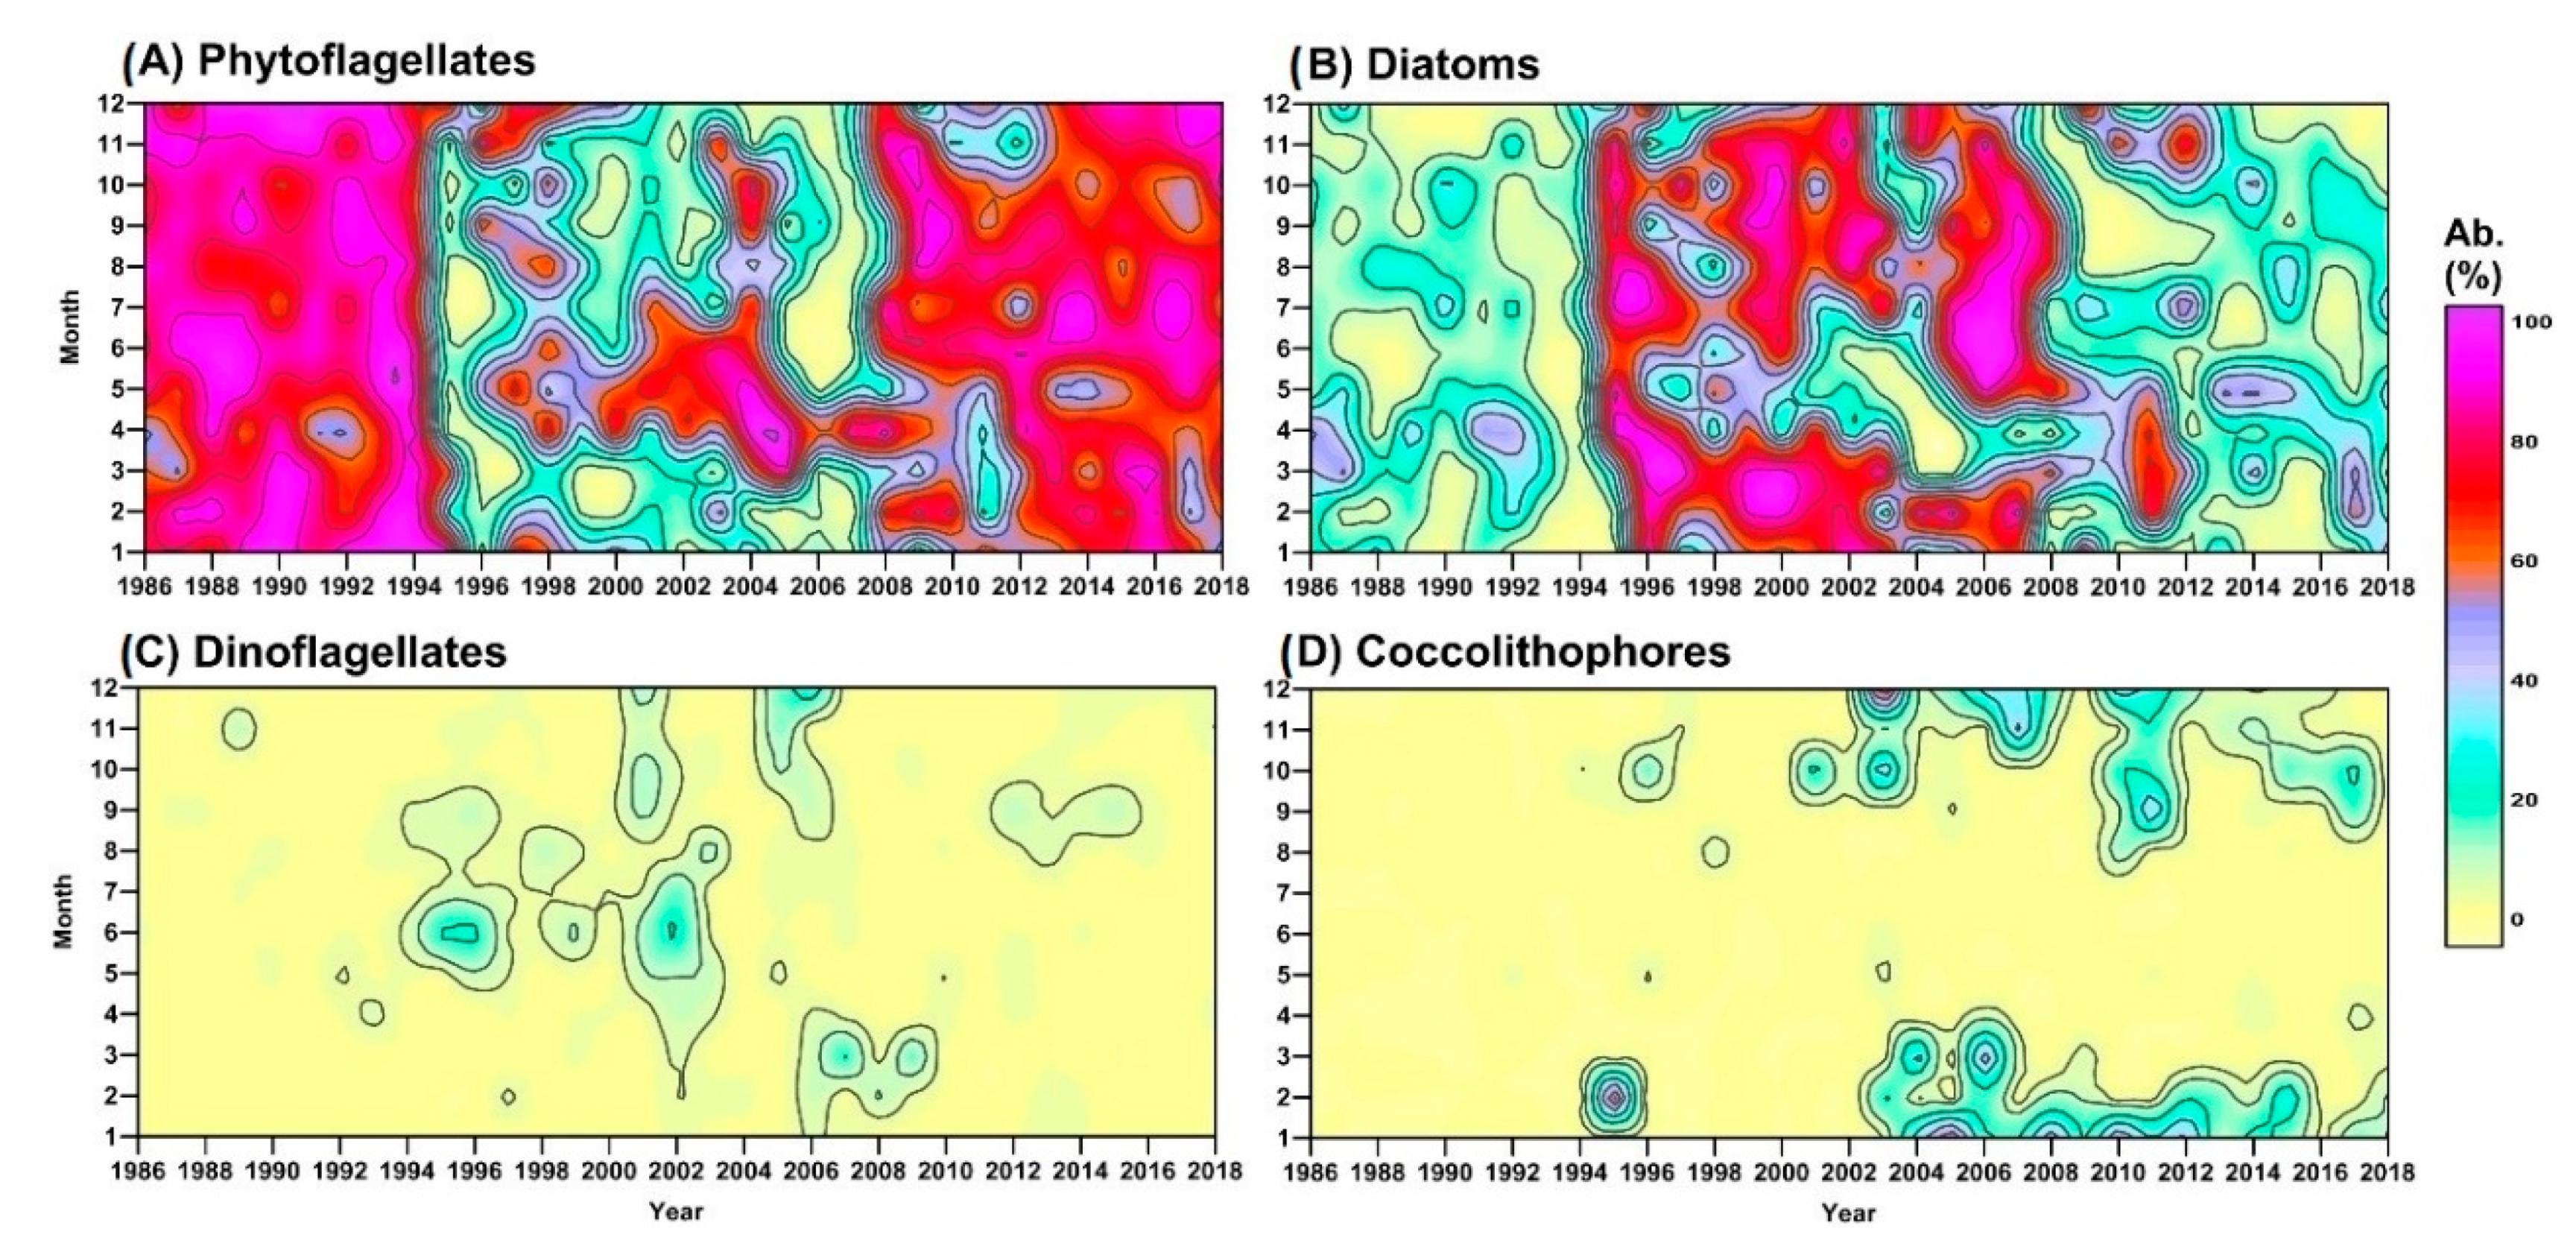
3.1. Long-Term Evolution of Phytoplankton Community

Phytoplankton abundance in the GoT showed significant changes during the last three decades (Figure 2A). From 1987 to 1992, it was high (medians from 1.6 × 10⁶ to 2.5 × 10⁶ cells L−1) due to the presence of large blooms prevalently in spring and eutrophic conditions in summer [53], which induced repetitive anoxia (1987, 1989 and 1990) and hypoxia (1986, 1988 and 1991) events [30,31]. From 1993 to 2002, the abundance decreased, and afterwards, the occurrence of all microalgae groups remained mostly low indicating the establishment of a posteutrophic phase, although hypoxia was still observed in 1994, 1995 and 2001. In the period from 2003 to 2009, it reached the lowest values (down to 0.04 × 10⁶ cells L−1), indicating the persistence of oligotrophic conditions. After 2010, the abundance increased again to values almost comparable to those of the first period (0.9 × 10⁶–1.6 × 10⁶ cells L−1), and it was characterized by the largest oscillations through the year, as shown by data distributions. In this last phase, coastal hypoxia occurred again in 2015 and 2016 [31].
The comparison between abundance and integrated values of chlorophyll a at the station C1 further highlighted the long-term evolution of phytoplankton community in the GoT. The earliest period, notwithstanding an incomplete cover of the data (Figure 2B), was clearly characterized by high values of chlorophyll a concentration (medians from 0.64 to 1.88 µg L−1). In the posteutrophic period, chlorophyll a strongly oscillated reaching particularly low values in 1996–1997 (0.37–0.51 µg L−1) and high values in 1998 (1.19 µg L−1). In the oligotrophic period, chlorophyll a showed a further slight decrease, with values mostly lower than 1.0 µg L−1. After 2010, it increased again, although without reaching the levels of the first period. Chlorophyll a concentration was significantly correlated to microalgae abundance (Table A5), but the oscillations were less pronounced in 1993–2018, suggesting that the phytoplankton community was more affected by changes in its composition than in the biomass.
The annual cycle of phytoplankton abundance also showed distinct patterns in the four periods previously mentioned (Figure 3A). The eutrophic phase was characterized by two main blooms occurring in February–May and October–December, alternated with a period of lower abundances in summer. This pattern was partially maintained during the posteutrophic phase, although the peaks of abundance in March and October were not as high as those observed in the early period. In the oligotrophic phase (2003–2009), only sporadic increases in phytoplankton abundance were observed, and the typical late winter—early spring and autumn—blooms did not occur. After 2010, the annual phytoplankton cycle changed again, and it became characterized by a very large bloom, mostly occurring in May (up to 5.4 × 10⁶ cells L−1), while the blooms almost disappeared in autumn.
The annual cycle of chlorophyll a (Figure 3B) showed frequent high concentrations in 1986–1992, in particular in winter/spring and autumn, whereas this pattern was only partially maintained in 1993–2002. The oligotrophic period was characterized by sporadic peaks of chlorophyll a, whereas the last period showed increases in its concentration particularly in late spring. However, the changes between the last two periods were less marked for chlorophyll a concentration than for the total cell abundance.
Phytoplankton functional groups showed pronounced changes of their relative abundance in the community, which indicated a long-term evolution of its structure. Phytoflagellates and diatoms showed complementary oscillations over the whole period (Figure 4A,B): phytoflagellates were the most abundant group of the community in the early eutrophic phase and in the last instable phase, often contributing more than 90% of the total abundance during the largest blooms. Diatoms were the dominant class of total phytoplankton during most of the posteutrophic and oligotrophic phases, notwithstanding the persistence of phytoflagellates in spring. Dinoflagellates were always rather scarce, but they were sometimes present in the posteutrophic and oligotrophic phases, reaching abundances up to 23% of the total in late spring and autumn (Figure 4C). Coccolithophores increased their abundance after the beginning of the oligotrophic phase from October to March (up to 76% of the total abundance), whereas in the other periods they were scarcely present (Figure 4D).

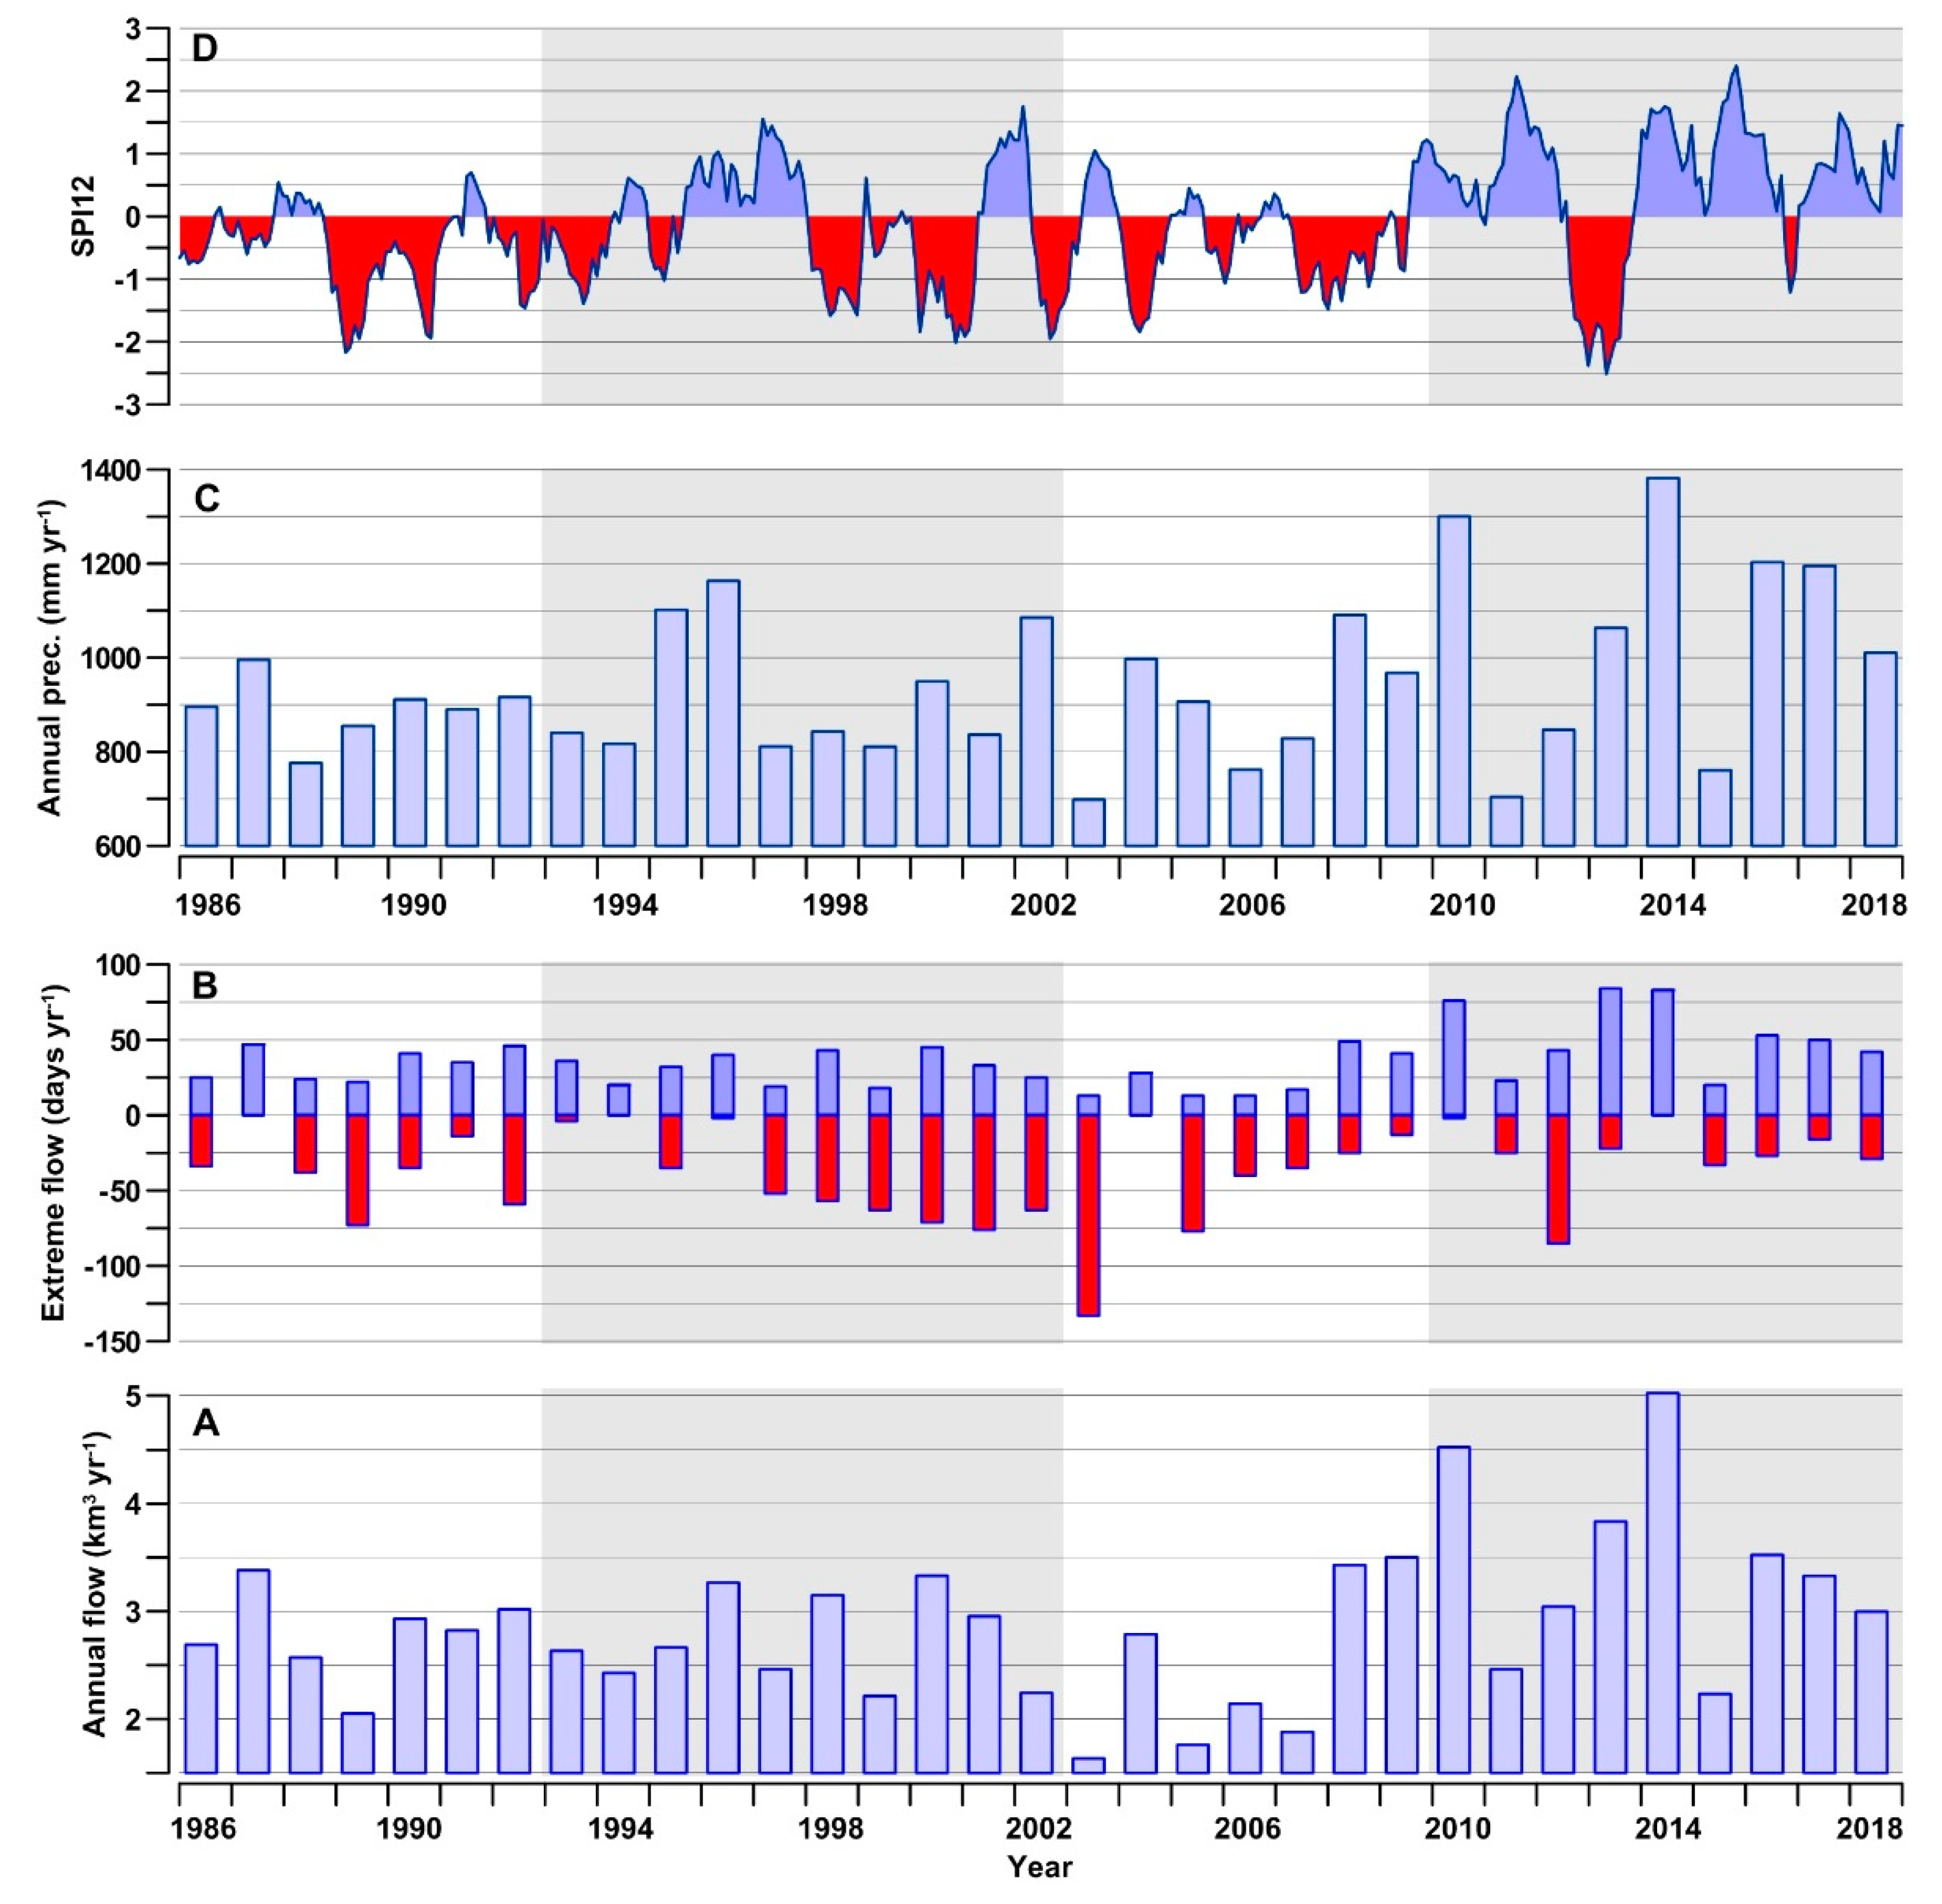
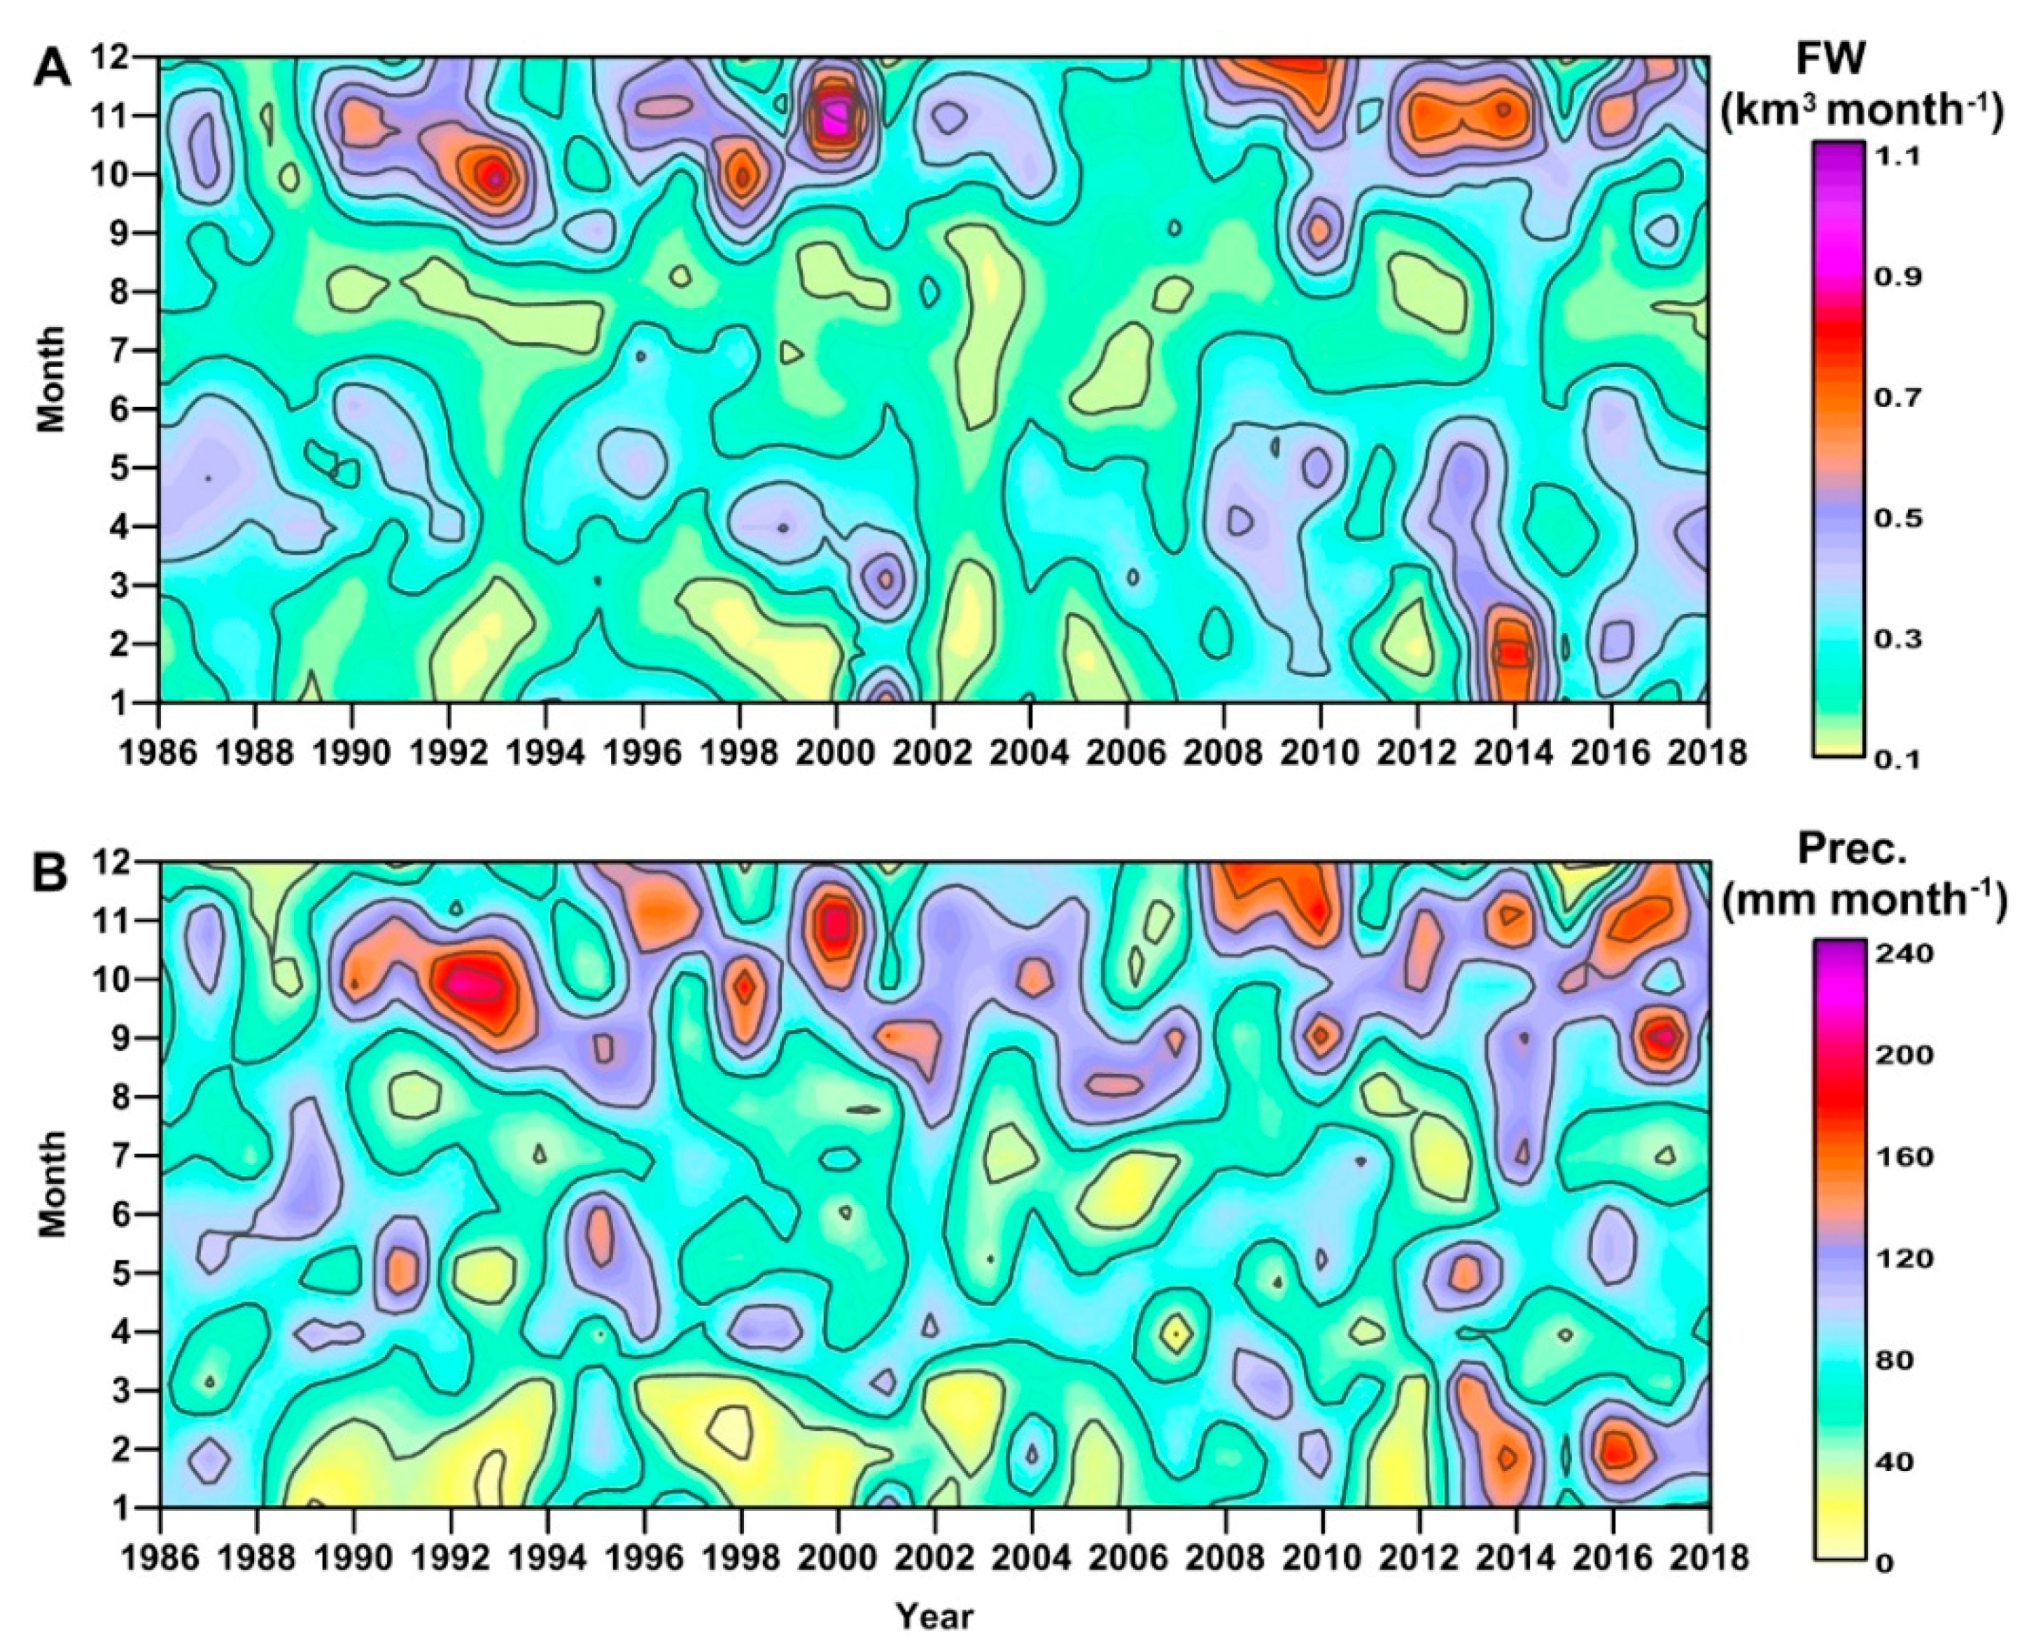
3.2. River Discharge and Precipitation in the GoT

In the GoT, freshwater inputs are mainly due to the rivers located along the coast (Figure 1). Although the regimes of these rivers might partially differ on a local scale, it was already shown that the Isonzo River can be considered as a proxy of the total river water discharge [29].
From 1986 to 2002, annual freshwater discharge of Isonzo River varied from 2.21 to 3.38 km3 yr−1. In this period, no significant multiannual trends were observed, although the years 1989, 1999 and 2002 were rather dry (Figure 5A). In 2003–2007, Isonzo River flow remained very low and reached the minimum of the time series in 2003 (1.63 km3 yr−1), similarly to all the other rivers in the northern Adriatic basin [17,51]. After 2008, a period of high instability of river regime began, with an increase in interannual oscillations from dry to wet years (2.23–5.02 km3 yr−1).
Extremely high flows were rare in 2003–2007 and frequent in 2008–2018, consistently with the differences in the annual freshwater discharges (Figure 5B). However, the most important changes in river regime were the frequency of extremely low flows, which progressively increased after 1992 up to reach the maximum of 133 days yr−1 in 2003. This trend indicated that Isonzo River was characterized in the posteutrophic and oligotrophic phases by persistent droughts alternated with infrequent peaks of discharge.
The precipitation is the most important forcing factor that regulates the regime of Isonzo River, through the contribution of snowmelt in spring and rainfall in spring and autumn [29]. The direct rainfall on the sea surface is another term of freshwater and nutrient balances in the GoT that was not constrained, to date. Monthly precipitation in the marine area of the GoT was significantly correlated to monthly river water discharge (Table A5), and the oscillations of annual precipitation were in phase with those of Isonzo River, with the lowest value in 2003 (698 mm yr−1), the highest value in 2014 (1382 mm yr−1) and the largest variability in 2010–2018 (Figure 5C). Considering a sea surface of 548 km2 for the GoT (Figure 1), it can be estimated that direct precipitation on the sea is not a negligible term of freshwater balance, as it corresponds to a freshwater input of 15–28% of that of Isonzo River.
SPI12 varied from extremely dry (−2.5) to extremely wet (2.4) conditions in 2012 and 2014, respectively (Figure 5D). The anomaly in the precipitation series was in phase with that of river flow (Figure 5B). Negative anomalies were observed in 1988–1994 and in 1998–2008. Considering the whole data series, the periods with a deficit of the precipitation had a duration from 1 to 28 months (mean of 9 ± 8 months). After 2009, a shift toward prevailing positive anomalies characterized the precipitation in this region. SPI12 values calculated with this precipitation series are consistent with the climatology of the northern Adriatic region, which indicated 12 events of extreme negative anomaly of precipitation (SPI12 < −2) with a mean duration of 20–30 months, in 1901–1999 [25]. However, the decrease in SPI12 expected here in the 20th century (≈−0.01 units yr−1) was not confirmed by the data in 2010–2018, which showed a shift of SPI12 toward positive values.
The annual cycles of river discharge also showed distinct characteristics in the four considered periods (Figure A1A). In 1986–2002, relatively high river discharges were observed in April–June and October–November, indicating the typical cycle of the runoff in mountainous drainage basins fed by snowmelt and rainfall in spring and by rainfall in autumn [29]. This seasonal cycle of the runoff became less pronounced and characterized by persistent low monthly flows in 2003–2007. In the last period, it became highly variable during most of the year, with significant increases in February (0.009 km3 month−1, α = 0.05) and March (0.008 km3 month−1, α = 0.05) and with frequent extreme discharges in November and December. The annual cycle of the precipitation showed a pattern similar to the river discharge, with particularly high values in autumn in 1993–2002 and 2008–2018 (Figure A1B, Table A5). Moreover, a significant increase in the precipitation was observed in February (6.61 mm month−1, α = 0.05) after 2003. The linear relationships between precipitation and Isonzo River flow were more significant in the wet seasons (i.e., spring, r2 = 0.61; autumn, r2 = 0.57) than in the dry seasons (i.e., winter, r2 = 0.47; summer, r2 = 0.37).
Phytoplankton (Figure 2) and runoff (Figure 5) series showed that the 2008 and 2009 were characterized by a rather large annual freshwater discharge, like in the last instable phase, and by a low phytoplankton abundance, like in the previous oligotrophic phase. This discrepancy might be due to the timing of the peaks of the runoff that, in these years, occurred in late autumn and winter (Figure A1A), when the inputs of freshwater and nutrients may not favor large phytoplankton blooms.

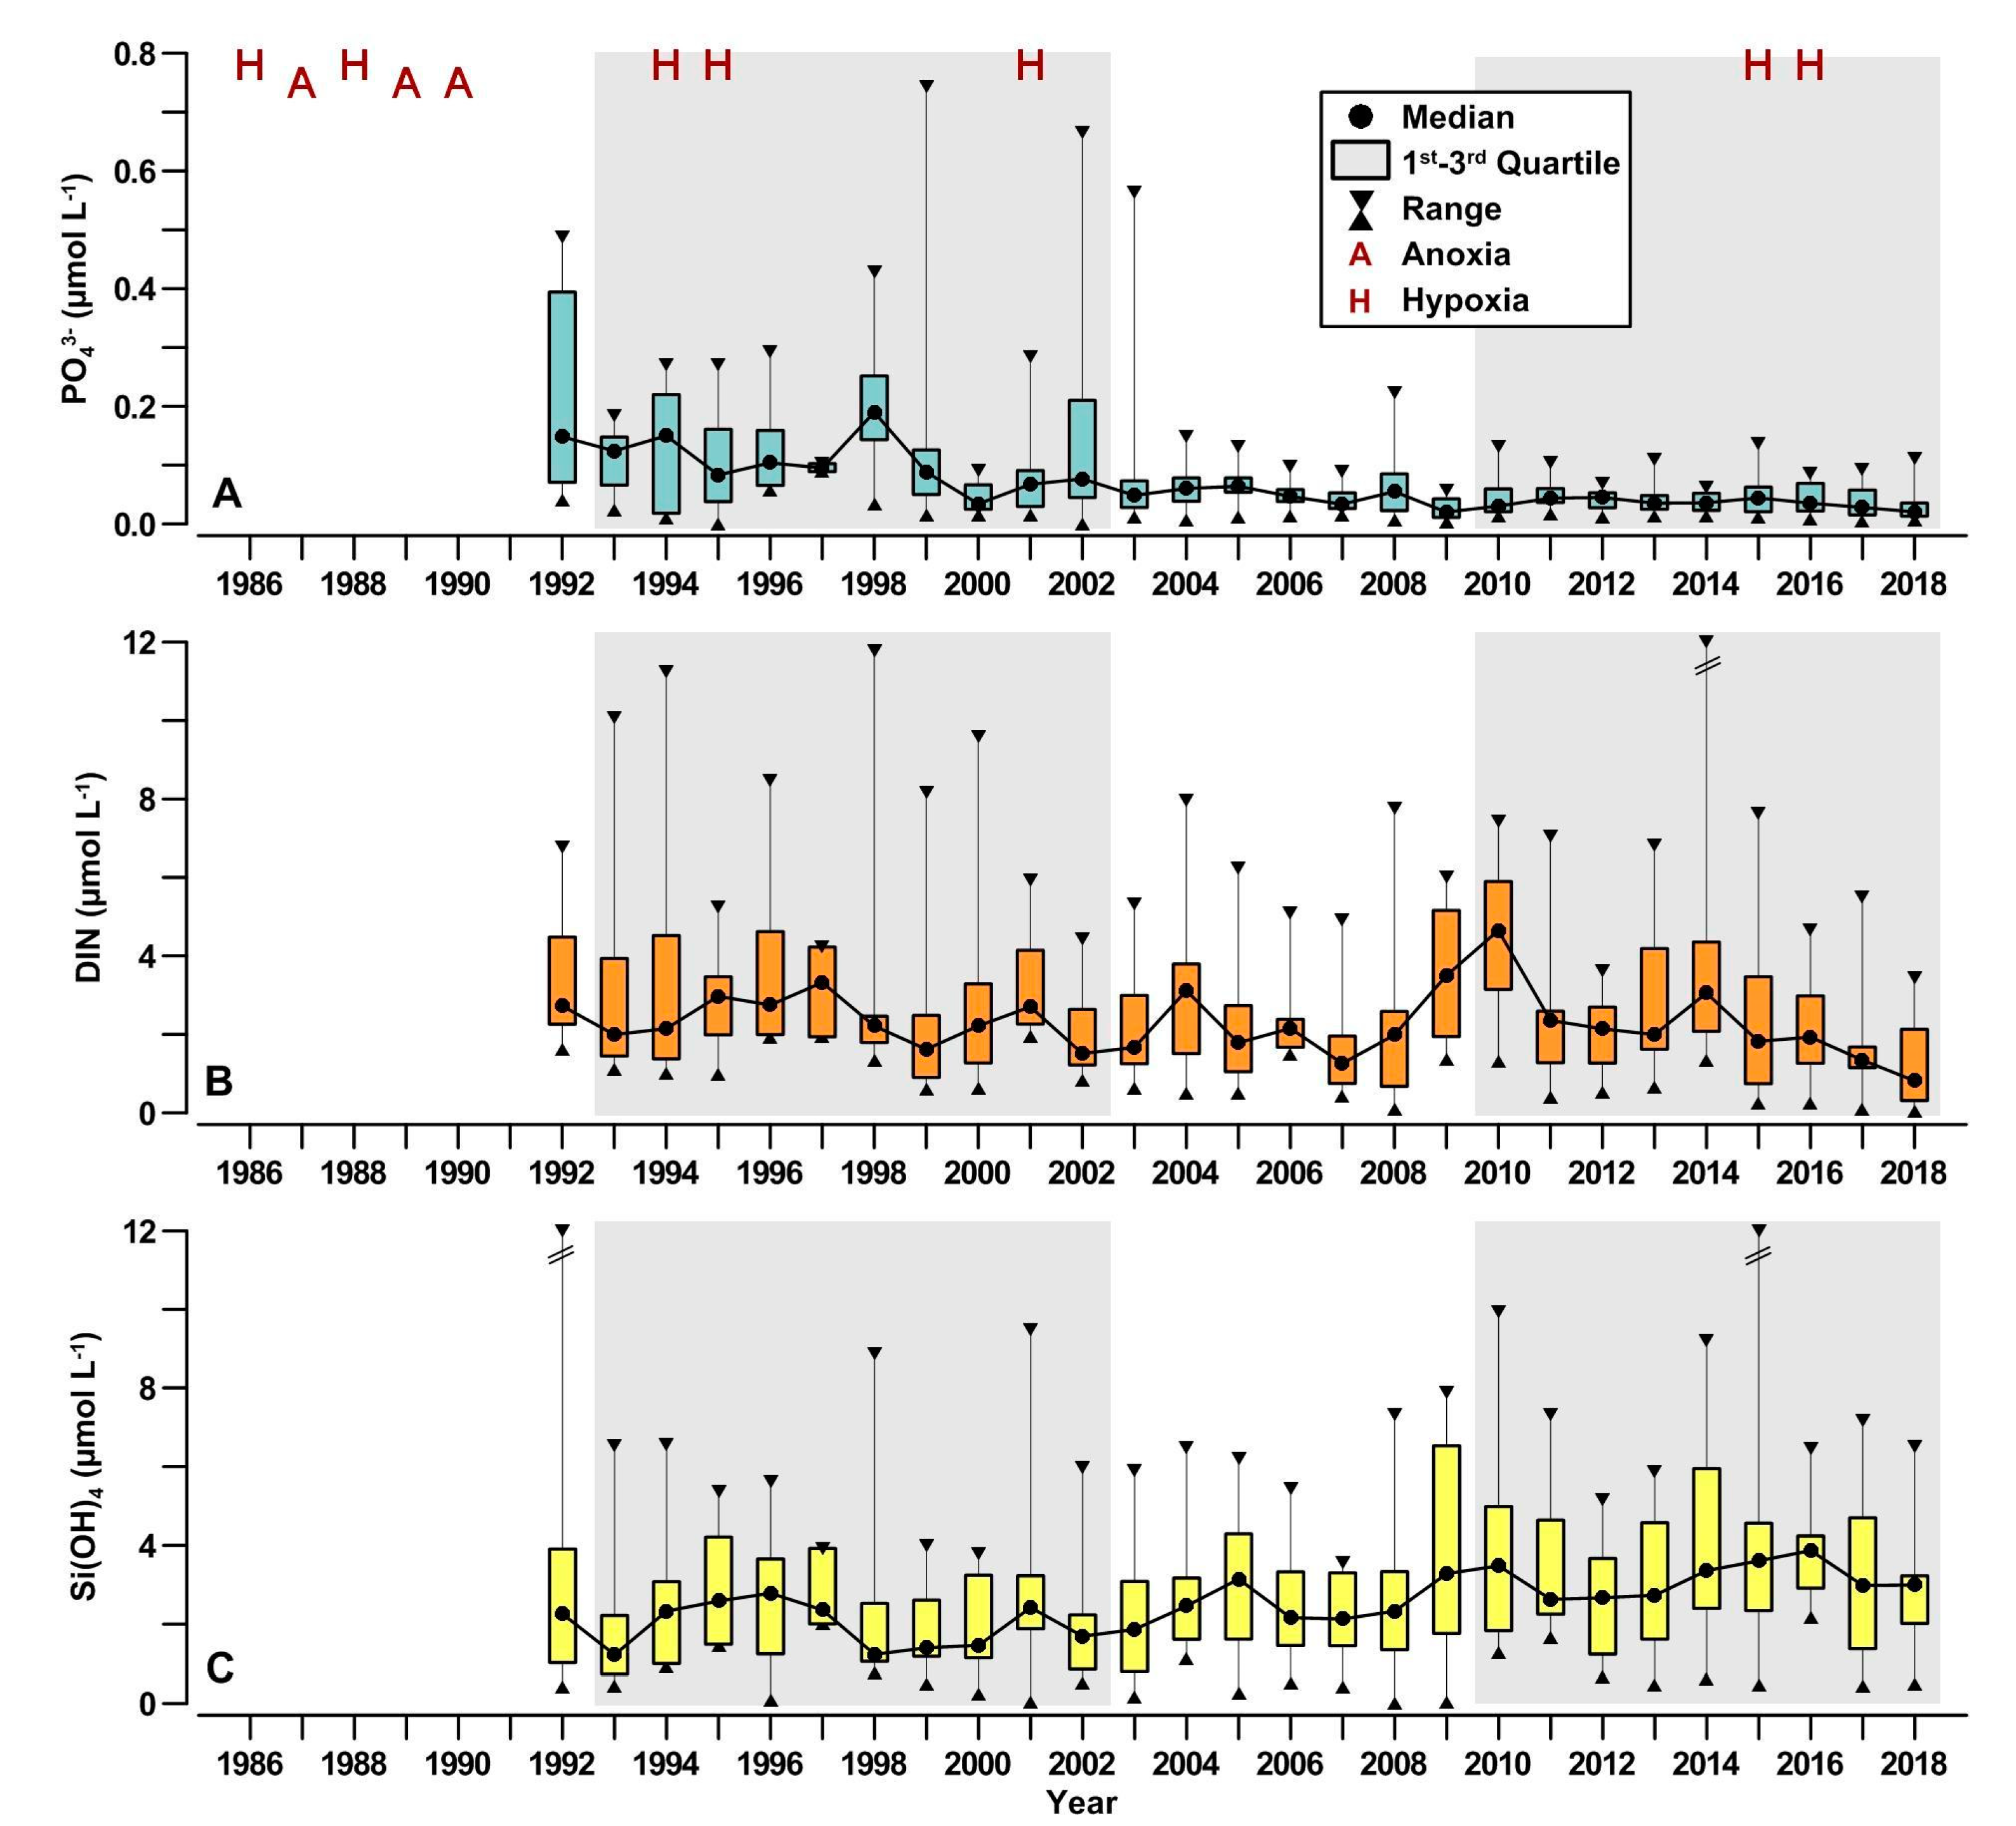
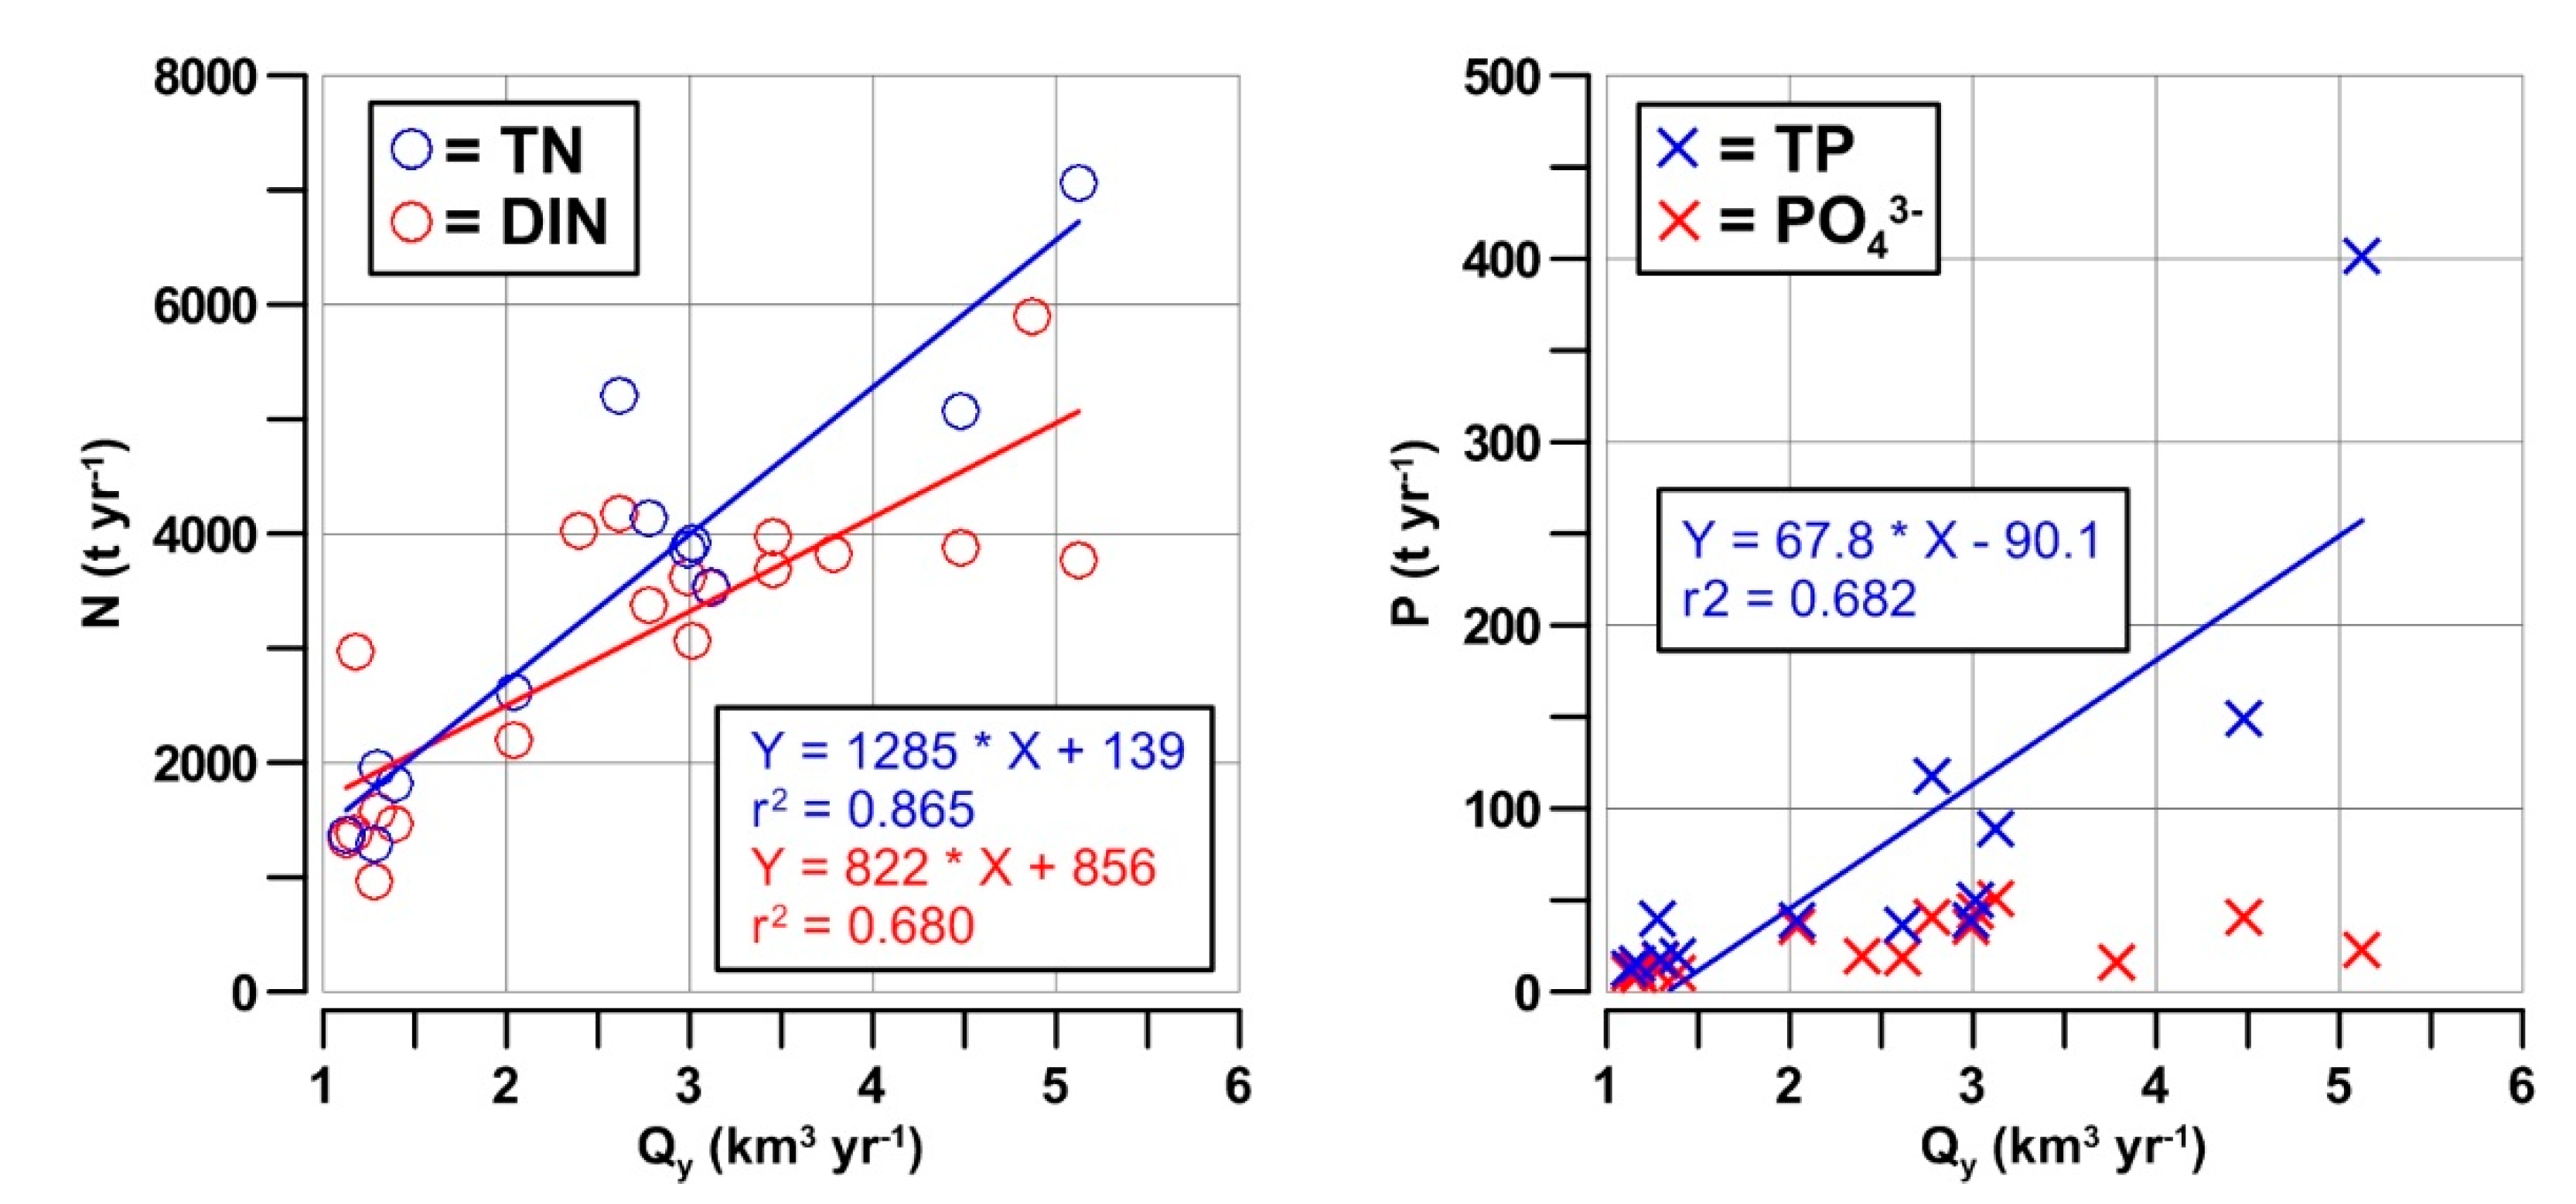
3.3. Nutrient Inputs in the GoT

Nutrient and organic matter concentrations in the waters at the mouth of the Isonzo River significantly changed during the period of interest (Figure 6, Table A1). The comparison with earlier data suggested the presence of a long-term increase in DIN since the end of the 1970s (≈56 to 88 µmol L−1) and a temporary high peak of values measured in 2002–2004. Data of TN were available only since 2002, but they showed a trend similar to that of DIN, with a strong decrease in the most recent years (162 to 95 µmol L−1; Figure 6A,C).
The behavior of phosphorus was opposite to that of nitrogen. The concentration of PO43− in the beginning of the 2000s (0.2 µmol L−1) was lower than that measured in 1970s (0.3 µmol L−1) and, afterwards, it increased again in the last decade (0.5 µmol L−1 in 2016; Figure 6B). A similar trend was observed for TP (Figure 6D). Isonzo River waters were characterized by a constant excess of nitrogen compared to phosphorus both in inorganic and total pools (Figure 6E,F), which reached the highest imbalance in 2002–2004. During the most recent years, the relative increase in phosphorus concentration partially mitigated N/P imbalance in river water until mean values of DIN/PO43− = 233 ± 76 and TN/TP = 126 ± 51 were reached.
Data of silicate concentration were available only in 1976–1977 (Table A1). They suggest that Si(OH)4 concentration is mostly lower than DIN concentration in river water (Si/DIN = 0.6–1.0), but it is in strong excess compared to PO43− (Si/PO43− = 100–138).
On the annual scale, TN transport by the Isonzo River was in the range of 1285–7063 t-N yr−1 and TP transport was 12–401 t-P yr−1, in 1996–2016 (Table 1). The transport of nitrogen was largely constituted by inorganic forms, mainly NO3, whereas that of phosphorus was more balanced between inorganic and organic pools. The transport of TN and DIN was rather well correlated to the quantity of water discharged by the river. For phosphorus, only TP showed significant increases with the flow, contrary to PO43− that had a discharge independent of the river regime (Figure A2).
Nutrient concentrations in rainwater in coastal sites of the NE Adriatic Sea can be only roughly estimated by the scientific literature (Table A2). After the 1970s, high mean concentrations of NO3 and NH4+ were found in rainwater, whereas TN content ranged from 66 to 185 µmol L−1 during a survey carried out in the GoT, in 1993 [27]. These values suggest that N-content in rainwater is similar to that of the river waters, whereas the concentrations of TP and PO43− might be even higher in rainwater than in river water (Figure 6). If mean concentrations of the nutrients in rainwater are applied to the total rainfall over sea surface of the GoT (Figure 1), it can be estimated that the precipitation supplies a non-negligible quantity of N and P in the GoT (Table 1).
In the GoT, several WWTP deliver urban and industrial wastewaters at the sea bottom, mainly through underwater pipelines up to 11 km in length (Figure 1). Nutrient data indicate that TN and DIN concentrations in the sewages are up to 10 times higher, and TP and PO43− up to 100 times higher compared to those in the Isonzo River waters (Figure 6). This is because the rather high contents of phosphorus, rainwater and sewage effluents have TN/TP and DIN/PO43− ratios lower than the river waters, thus constituting preferential inputs of this element in the GoT (Figure 6). In the period of interest, WWTP loads corresponded to about 490,000 Inhabitant Equivalent (IE), with an increase to about 559,000 IE during summer in consequence of the greatest tourist influx, in particular along the northern coast of the gulf (Table A3). Assuming a load of 12 g N d−1 and 2.5 g P d−1 per IE and a mean reduction of 40% after sewage treatment [16], the input of TN in the GoT might be 1290–1470 t-N yr−1 and that of TP might be 270–306 t-P yr−1, with the highest loads typically reached in summer (Table 1).
In the GoT, benthic fluxes are another important component of nutrient balance in the water column, in particular during summer, due to the large extension and shallowness of this continental shelf (Table A4). Benthic fluxes depend on sediment characteristics, water temperature and seasonal changes of oxygen levels [42]. The most important nutrients released in the water column from marine sediments are NH4+ (annual average of 0.8 ± 0.7 mmol N m−2 d−1) and Si(OH)4 (2.6 ± 2.3 mmol N m−2 d−1), both in oxic and anoxic conditions. NO3 flux is usually low, and it can be reversed toward the sediments in anoxic conditions (0.17 ± 0.73 mmol N m−2 d−1). The release of PO43− is about one order of magnitude lower than those of N-nutrients (0.03 ± 0.05 mmol P m−2 d−1) [54]. Applying these fluxes, which refer to a site in the center of the GoT, to its total area, annual inputs of 2718 t N yr−1 and 186 t P yr−1 would result for DIN and PO43−, respectively (Table 1).

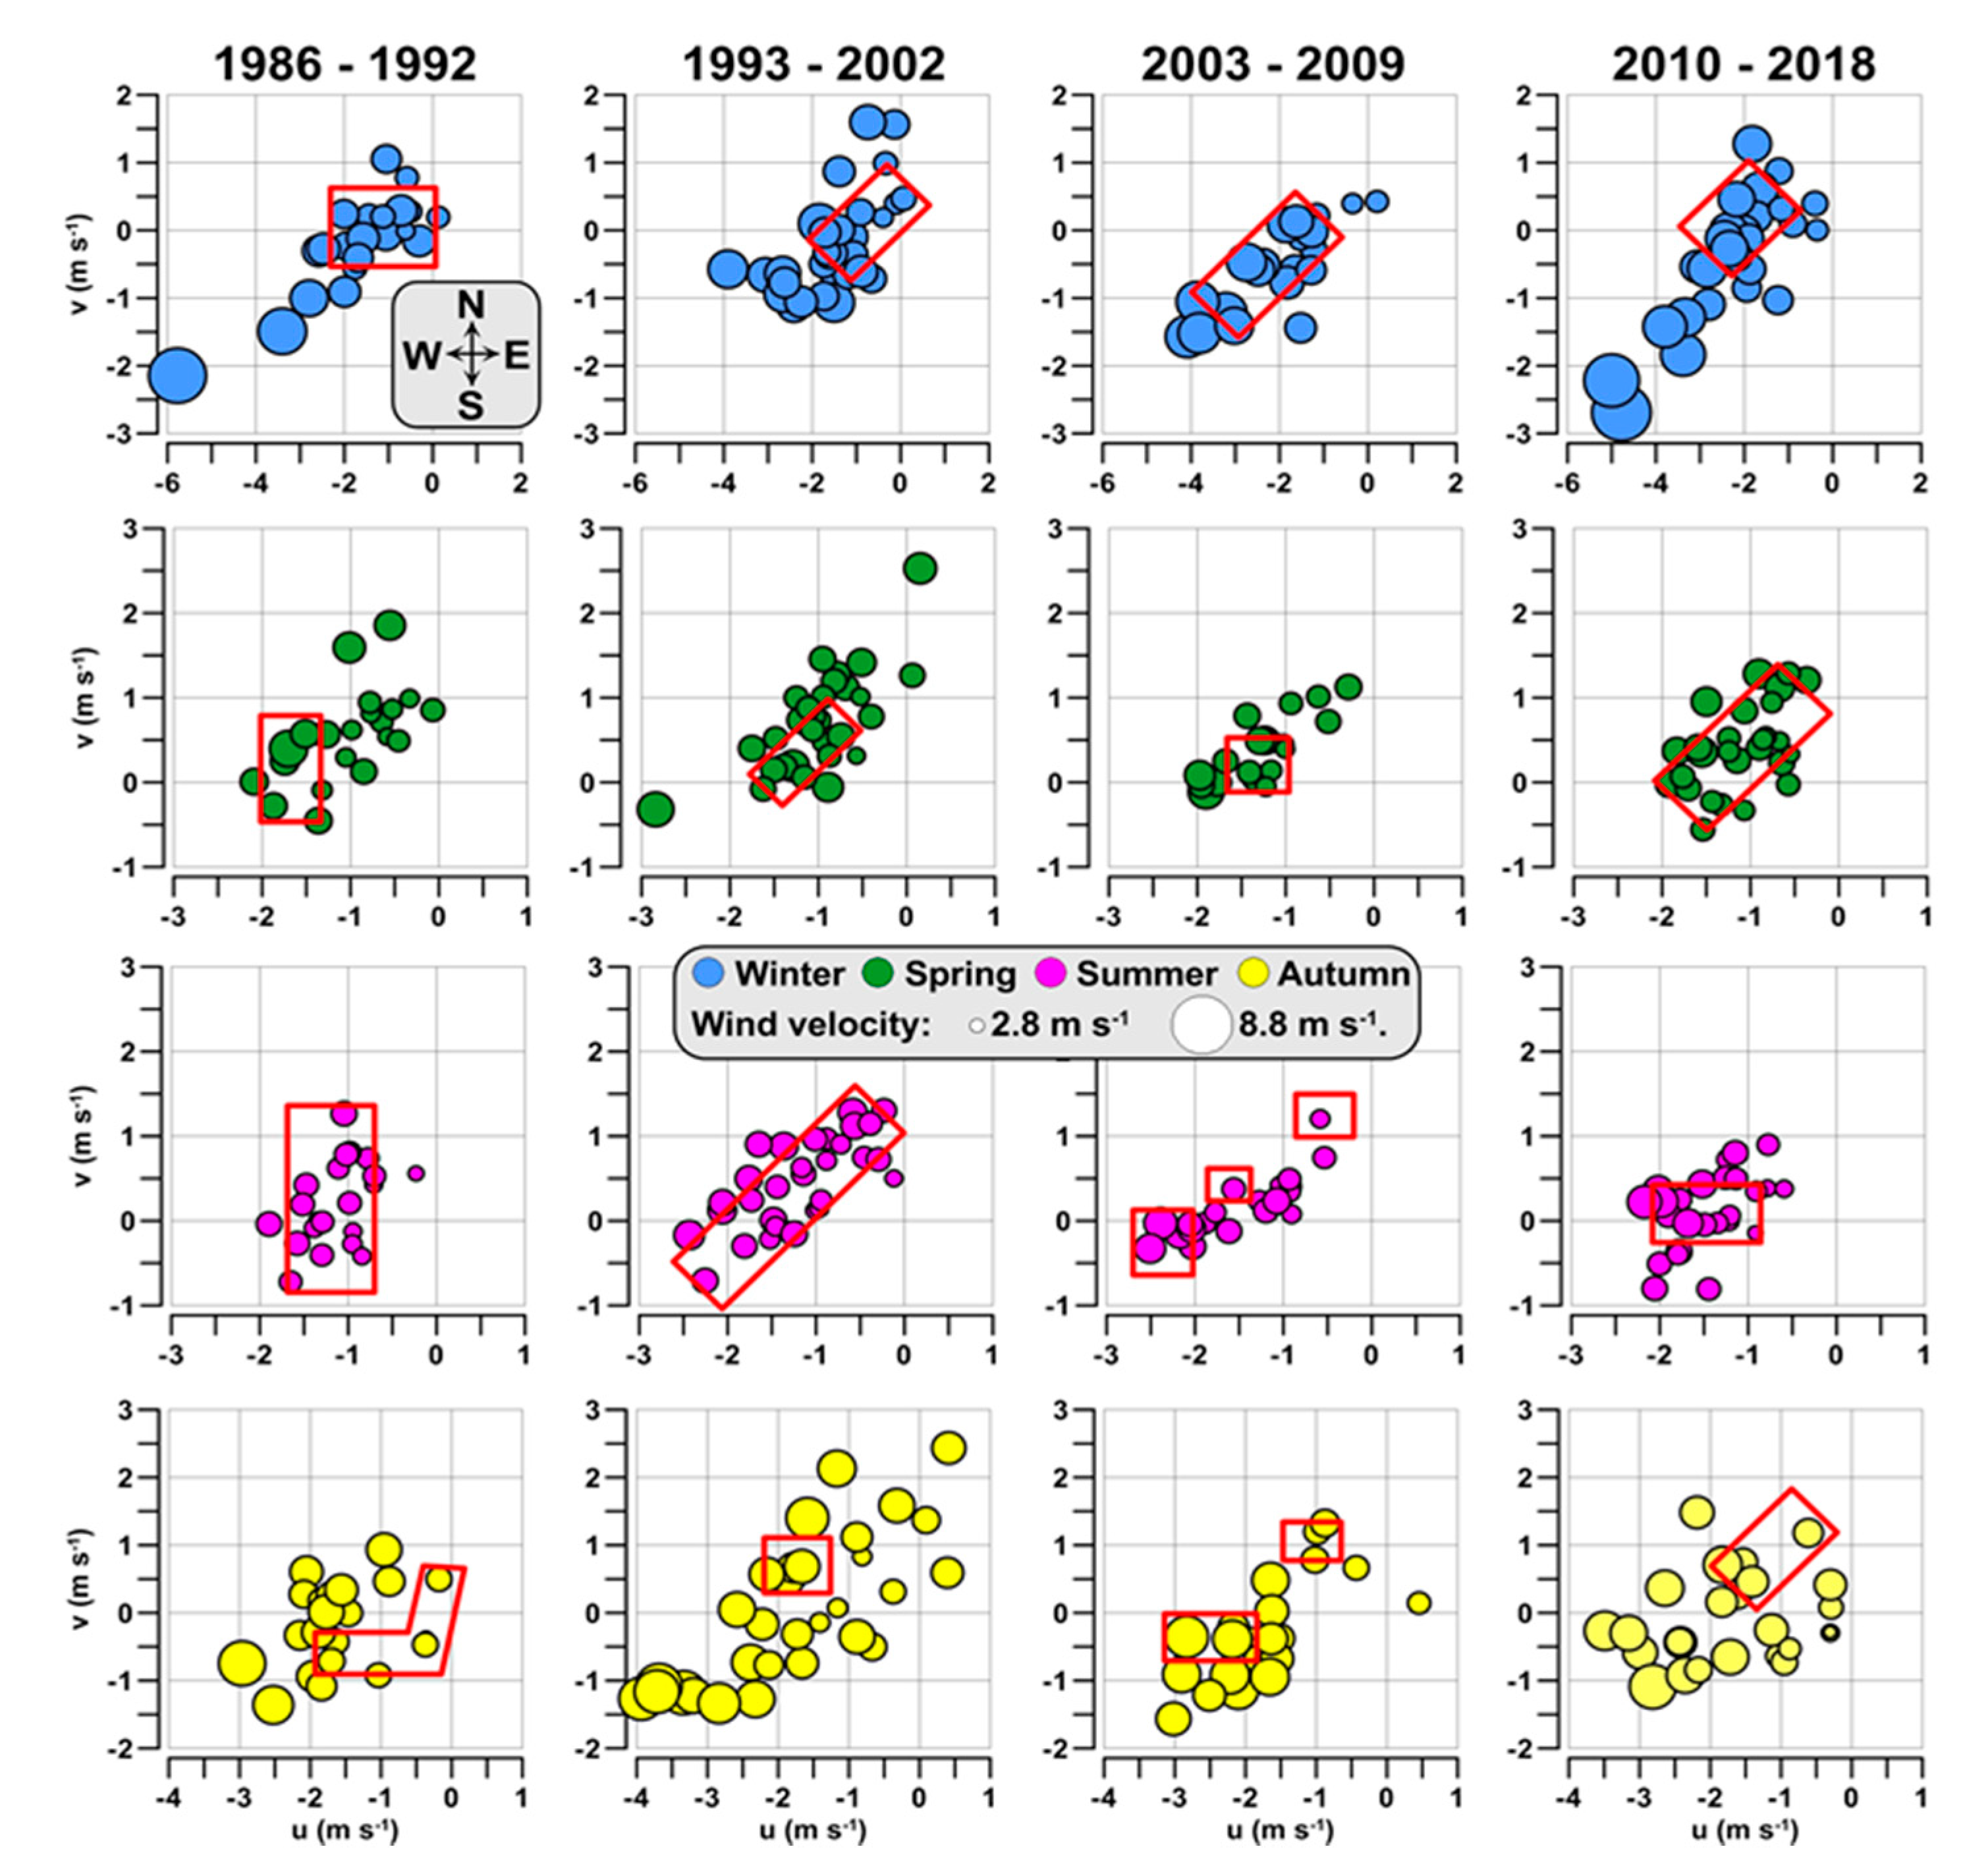
3.4. Hydrological Conditions and Climatic Circulation

In 1986–2015, the temperature of subsurface seawater in the GoT varied from 4.0 to 29.5 °C (Table 2), and it increased on an annual scale by 0.02 °C yr−1.
Seawater warming occurred in almost all the months, but it was more pronounced in January, July and December (0.04–0.05 °C yr−1). This rise in seawater temperature constituted the most recent phase of a long-term warming observed in 1946–2015 (1.3 ± 0.5 °C per century), which has become more pronounced since the early 1980s [52].
Wind regime strongly affects the stratification and the circulation of the waters in the coastal zones [33,55]. In the four considered periods, monthly mean speed and direction of the winds showed distinct seasonal characteristics in the GoT (Figure 7). In winter, the winds blowing from ENE (i.e., corresponding to negative u and v components) were stronger in 1986–1992 and 2010–2018 (WS up to 8.4 and 8.8 m s−1, respectively) than in 1993–2002 and 2003–2009 (WS up to 6.2 and 6.7 m s−1). The winds blowing from SSE (i.e., corresponding to negative u and positive v components) were of secondary importance in this season. Phytoplankton abundance was low in concomitance with the strongest ENE and SSE winds (Table A5), which were frequent in January and March, respectively. By contrast, the increase in the abundance was favored in the months with an inconstant wind direction (i.e., u ≈ 0 and v ≈ 0).
In spring, SSE winds were more persistent than ENE winds, but their intensity (up to 6.0 m s−1) was lower compared to the winter. In the period 1986–2009, high phytoplankton abundances were mostly coupled with winds blowing from E (u < 0, v ≈ 0) rather than blowing from S (u ≈ 0, v > 0). In 2010–2018, high phytoplankton abundances were irrespective of the intensity and direction of the wind, easily due to the highly variable environmental conditions observed in this phase. In summer, the wind had the weakest intensity (WS less than 5.5 m s−1) and variable directions. In this season, wind regime was scarcely related to phytoplankton abundance, which showed high values in concomitance with both ENE and SSE directions. Autumn was again a season characterized by rather strong winds (up to 7.1 m s−1). High phytoplankton abundances were not common in this season, but they were usually not favored by the wind blowing from a persistent direction, in particular ENE.

3.5. Nutrient Availability in the Coastal Waters

Long-term series of the concentrations of PO43−, DIN and Si(OH)4 at the station C1 indicated that the availability of the major nutrients has changed in these coastal waters during recent decades. Median concentration of PO43− showed a clear decrease over the whole period (slope = −0.003 µmol L−1 yr−1, α = 0.001), with an almost complete disappearance of the peaks of concentration higher than 0.1 µmol L−1 after 2004 (Figure 8A). The behavior of nitrogen was different: DIN concentration oscillated without significant long-term trends, reaching particular high values during the years characterized by a high annual runoff and rather low values during the driest period (Figure 8B). The concentration of Si(OH)4 showed less pronounced oscillations than DIN, although these nutrients were significantly correlated (Table A5). Annual median values of Si(OH)4 concentration increased by 0.07 µmol L−1 yr−1 (α = 0.001), after the early 1990s (Figure 8C).
These distinct trends of nutrient concentration caused marked shifts in the composition of the nutrient pool. DIN/PO43− and Si/PO43− ratios calculated on an annual scale increased by 1.4 and 3.7 yr−1, whereas Si/DIN ratio increased by 0.04 yr−1 in 1992–2018 (Table 3). On monthly scales, the highest increases in DIN/PO43− ratio were observed in late autumn and early winter (1.8–2.4 yr−1, α = 0.01–0.10). The increase in Si/PO43− ratio was high and significant during all the months of the year (2.9–4.9 yr−1, α = 0.001–0.05). The increase in Si(OH)4 with respect to DIN was less pronounced, but still significant from April to December (0.02–0.10 yr−1, α = 0.001–0.10).

4. Discussion

The analysis of phytoplankton and biogeochemical data series performed in this study indicates that environmental conditions in this coastal zone have significantly evolved in recent decades, because of the effects of climatic and anthropogenic disturbances. Moreover, it shows that the overall trend of oligotrophication observed after the middle of the 1990s in the GoT [26,38] and in the Northern Adriatic Sea [18,56] was interrupted in the last decade, with the beginning of a new phase of unstable climatic conditions, whose possible effects should be better investigated here and in other similar European coastal zones [7,17,22,25].

4.1. Freshwater Influence

Freshwater content in the GoT is primarily driven by the discharge of the continental waters through the rivers and, to a minor extent, through the aquifers located along the coast [29,35]. The coupling between these freshwater discharges and the direct precipitation in the marine area of the GoT indicates that the alterations of precipitation regime will be one of the most important natural forcing factors regulating the future freshwater balance and phytoplankton community in this coastal ecosystem (Table A5). From this point of view, updated projections of upcoming climate changes on subregional scales should be performed to assess current freshwater balances in the Northern Adriatic Sea [17].
For most of the earlier three phases considered in this study, river discharge was characterized by an increasing persistency of periods of extreme low flow, until 2003, and by low annual integrated freshwater discharges, in 2003–2007. These trends were also coupled with a prevalent anomalous dryness in the precipitation series (Figure 5). This decrease in the runoff was matched to a decrease in phytoplankton abundance and chlorophyll a concentration (Table A5), a shift from phytoflagellates to small diatoms such as Chaetoceros, genus able to grow at low nutrient concentration [26], as well as the disappearance of autumnal bloom. After 2003, an increase in coccolithophores was also observed mainly from October to March when diatoms are usually missing. However, this prolonged trend of oligotrophication, culminated with the dry phase of 2003–2007 [18,31] and confirmed by the projections of precipitation [25] and hydrological data series [32,38], was reversed in the 2010s. In this last phase, a highly variable annual river discharges and an increase in precipitation characterized freshwater balance in the GoT. Regardless of the reasons of these changes, this climatic inversion had an effect on the phytoplankton community, with a recovery of chlorophyll a concentration and of phytoflagellates as the predominant phytoplankton group (Figure 2 and Figure 4, Table A5).
The increase in freshwater discharges in the coastal zones causes a large instability of physical conditions perceived by the phytoplankton community, which include changes in the stratification of the water column, a reduced penetration of the sunlight, faster circulation of fresher water bodies and changes of seawater temperature and of the availability of the resources. These abiotic forcing factors cause the change of biotic conditions and of species–species interactions [6]. Despite the variety of the characteristics of estuarine and coastal systems worldwide, the increase in the runoff often favors the growth of phytoflagellates, contrary to the prevalence of diatoms in more stable estuarine conditions [5,8,10]. This feature causes the phytoplankton community structure to be connected to the precipitation regime in the drainage basin surrounding the coastal zones.
The seasonality of the runoff also changed during the last three decades (Figure A1). It showed a prevalence of a bimodal cycle of river discharge and precipitation in 1986–2002 (spring and autumn peaks) and in 2010–2018 (winter–spring and autumn peaks), contrary to a prevalent unimodal cycle due to only precipitation in 2003–2008 (early autumn peak). In all the phases, the highest and most variable freshwater discharges occurred during autumn. The classical blooming pattern of phytoplankton, characterized by a spring maximum mainly supported by diatoms and an autumn maximum mainly supported by phytoflagellates [26], was observed mostly in the earliest and last phases. However, phytoflagellates remained the most abundant functional group during spring also in 2003–2007 (Figure 4A), easily due to the availability of winter nutrients and to the persistence of a moderate freshwater load in this period of the year during the driest phase.

4.2. Climatic Effects

In the GoT, the warming of the upper seawater layer reached 1.3 ± 0.5 °C in 1946–2015 [52] and it penetrated until a 20 m depth in the central part of the gulf, at least since the late 1980s [31]. In the period of interest, seawater warming occurred in all the months, but it was particularly significant in December–January (0.04–0.05 °C yr−1). Seawater warming and the consequent stratification of the water column can have effects on the succession of phytoplankton species as important as nutrient loadings, in particular in temperate coastal zones [3,11,26,55]. In the GoT, late autumn–winter peaks of coccolithophores are favored by their quick response to a high nutrient availability, originated by the mixing, in the presence of an early seasonal stratification [57]. The data presented in this study suggest that the recent change of winter environmental conditions might have affected the growth of this functional group.
Wind regime also showed seasonal and long-term differences in the GoT, with potential effects on phytoplankton community (Figure 7). Strong winds in winter do not favor high phytoplankton abundances (Table A5). The GoT is mainly characterized by a cyclonic circulation, generated by the inflow of Adriatic waters at its southern part and by the outflow of gulf waters along the northern coast, although an anticyclonic gyre can form in its inner area in particular in coincidence with high freshwater discharges [33]. In winter, the cyclonic circulation is enhanced by strong ENE wind, which causes the flushing of nutrient-rich river plumes outside the gulf, the cooling of the seawater and the mixing of the water column [23]. These conditions do not favor the growth of phytoplankton biomass, which usually starts at the end of winter, when the stratification of the water column is established and when the light and temperature of seawater are more favorable [26,37]. Similarly, strong autumn winds with a persistent direction, in particular ENE, induce the disruption of the pycnoclines and the transition toward wintry conditions in the coastal marine environment, thus causing the decline in phytoplankton abundance. This suggests that a future increase in the frequency of extreme winds in winter and autumn might be a factor potentially limiting the productivity of the GoT [24], similarly to that observed in other coastal zones [55]. By contrast, coastal upwelling induced by the wind can favor phytoplankton growth in spring, as it permits the supply in the upper layer of the nutrients regenerated in the deeper layer. This mechanism is particularly favored by the winds blowing from E, which push seaward the surface gulf waters and cause the upwelling of the bottom waters along the coast [33]. In summer, the weakness and the variable directions of the winds limit their effects on phytoplankton growth, which depends mainly on the residence time of low-salinity nutrient-depleted upper waters in the gulf and on the persistence of density gradients [37].

4.3. Effects of Natural and Anthropogenic Nutrient Inputs

Nutrient balance and ratios in the GoT are affected by a multiplicity of contributions that should be regarded as a whole rather than as single processes. Among the several sources of the nutrients, only the discharges of river waters [29,37,58] and their effects on the coastal marine environment [26,31,38] have been constrained satisfactorily, to date.
The rivers in the GoT are still the main source of nitrogen and silicates, notwithstanding the scarcity of the data for this nutrient in freshwater (Table 1 and Table A1). The discharges of nitrogen and silicates depend on the interannual oscillations of the runoff, differently from PO43−, a feature that causes a temporary excess of these nutrients during the largest freshwater loads (Table A5). However, the highest imbalances of TN/TP and DIN/PO43− ratios in river water occur during dry periods (Figure 6), easily due to the alterations of nutrient cycling in the freshwater ecosystem in concomitance with the lowest flows [17]. This finding indicates that, during the periods of low runoff, the shortage of land-borne nutrients is coupled with an extreme imbalance of their composition, exerting a double effect on the phytoplankton community. These conditions seem to have favored diatoms for most of the year, restricting the favorable conditions for dinoflagellate and phytoflagellate blooms only to early spring, when species to species interactions and algal succession can promote these phytoplankton groups [6,26]. The growth of dinoflagellates, although never prevalent in the phytoplankton community, merits attention as this group includes harmful marine microalgae belonging to genera Alexandrium, Dinophysis and Prorocentrum that might compromise the human consumption of the mussels grown in aquafarms [26]. Their presence during the phase of oligotrophication of the GoT suggests that, similarly to other coastal zones, unbalanced N/P ratios in the continental nutrient pool might promote an increase in toxic algal blooms in this marine ecosystem [1]. Moreover, dinoflagellates are also significantly correlated with TSW (Table A5) and, therefore, their growth could be further favored by seawater warming.
Atmospheric inputs concur with nutrient cycling in Mediterranean-type coastal zones worldwide [20]. In the northern Adriatic region, nutrient concentration in rainwater is increased by the air pollution (Table A2), and heavy rainfall events can promote primary production, in particular in nutrient depleted upper waters during summer [27]. Nutrient deposition in the pelagic compartment is often combined with the mixing of the water column and the resuspension of the sediments during sea storms, because of the shallowness of this coastal shelf [23]. Considering the increase in heavy rainfall events observed in 2008–2018 (Figure 5), the importance of nutrient deposition in the GoT should be higher in the current phase compared to the past dry phase. Therefore, although atmospheric inputs are not the main driver of primary production in this coastal zone, their role should be better assessed, in particular considering that they are a preferential source of phosphorus compared to nitrogen for the phytoplankton community (Figure 6).
Sewage emissions are another important source of nutrients and organic matter, in particular for phosphorus (Table 1). The gradual upgrade of WWTPs from secondary to tertiary treatments is expected to reduce the weight of this component of nutrient balance with respect to the past, in the GoT [28,39,58] and in the Northern Adriatic Sea [19,21,59], having a potential impact on phytoplankton communities. Beyond the quantity of nutrients discharged, it should be also considered that the effects of WWTP loads on phytoplankters depend on the spreading and upwelling of the sewages that, in turn, are regulated by the circulation [28,39,40].
Nutrient exchange between sediments and the water column is another non-negligible term that seasonally affects the nutrient balance in the GoT (Table 1). The long-term warming of the seawater in the GoT (Table 2) is a climatic process that is expected to enhance nutrient regeneration in the bottom waters, in particular during late autumn and winter and especially for nutrients such as NH4+ and Si(OH)4 that exhibit a temperature dependent rate of regeneration [54]. At the same time, the long-term oxygenation of coastal waters could also have modified the current benthic fluxes of the nutrients compared to the eutrophic phase [31]. A longer persistence of oxic conditions in the deeper layer, compared to anoxic or reoxygenation events, favors the flux of NO3 from the sediment toward the water column with respect to the fluxes of NH4+ and PO43−, potentially concurring with phosphorus deficiency in the pelagic compartment [42].

4.4. Nutrient Availability in the Coastal Waters

Long-term changes of nutrient availability in the GoT are consistent with those observed in the Northern Adriatic Sea, which showed the decrease in PO43− concentration and the increase in DIN concentration in the offshore waters of the basin until the 2007 [18,21,56]. This trend was a direct consequence of the decrease in the runoff that, in the Northern Adriatic, is mainly supported by the rivers located along the western coast of the basin: Po, Adige and Brenta [51]. In the GoT, the almost complete disappearance of PO43− concentration higher than 0.1 µmol L−1 after 2004, even in the presence of temporary peaks of DIN and Si(OH)4 concentration in the fresher waters (Figure 8), indicated the establishment of almost permanent P-deficiency in this coastal marine environment. This condition seems to have continued also in 2010–2018, notwithstanding a partial recovery of total phosphorus discharges by Isonzo River (Figure 7). Therefore, the growth of siliceous and nonsiliceous phytoplankton species in this coastal system should be mainly regulated by the competition for inorganic and organic phosphorus, rather than by the availability of silicates.
It is known that phytoflagellates are favored by large inputs of the nutrients, due to their high carrying capacity and their capacity to utilize organic nitrogen for growth [6,8]. These environmental conditions have occurred in the GoT during the eutrophic phase, as demonstrated by the annual transport of river nutrients (Figure A2) and by the high frequency of hypoxia and anoxia events [30,31]. The advantages of diatoms in the oligotrophic period might originate mainly by the prevalence of weak water column stratifications and by the growth of small-sized species that have a great affinity for low nutrient concentrations (Table A5). Therefore, the shift from a diatom-dominated to a phytoflagellate-dominated period at the beginning of the 2010s should be analyzed mainly considering the instability of the environmental conditions in this phase.
Another interesting feature of nutrient trends in the GoT is the long-term increase in Si(OH)4 concentration (Figure 8C), which is similar to that recently observed in the western coastal waters of the Northern Adriatic Sea [56]. It is unlikely that substantial changes of the continental loads of this nutrient might have occurred in the past, as their release in river drainage basins is mostly a natural process caused by the weathering of rocks and sediment [17], and its supply by precipitation and sewage discharge is small [27,39]. Even considering an increase in the dissolution of biogenic silicon in the deeper water due to their warming, the absence of a clear decrease in Si(OH)4 concentration during the phase dominated by diatoms indicates again that this nutrient is in excess compared to phosphorus for the requirement of phytoplankton siliceous-species.
On a seasonal scale, late autumn and early winter have been the periods of the year most affected by environmental changes during the last decade. The warming of the surface waters in this period of the year (Table 2) suggested persistent mild meteorological conditions that, together with an increase in the precipitation and runoff, can favor a moderate stratification of the water column. These hydrological modifications were consistent with a larger availability of the nutrients and with the highest and most significant increases in DIN/PO43− ratios (Table 3). In the Northern Adriatic Sea, coccolithophore blooms occur mainly in winter, although they can also be detected in oligotrophic summer conditions with distinct species [57]. The environmental changes observed in the GoT since the 2010s could further favor winter blooming of this phytoplankton group in the future [6].

5. Conclusions

The analysis of multidecadal series of phytoplankton and environmental data and the available scientific literature indicated that the GoT was affected by a succession of climatic and anthropogenic disturbances, whose identification is of basic importance for the modeling of this marine ecosystem. Climatic drivers are primarily affecting freshwater balance, seawater warming, circulation and extreme events in the gulf, whereas the anthropogenic pressure regulates the evolution of nutrient contents in river waters, rainfall and sewages. Moreover, the dependence of benthic nutrient fluxes on the warming and oxygenation of gulf waters also causes this component of nutrient balance to be exposed to changes induced by the climate.
The multiplicity of the sources of phosphorus in this area, contrary to a main riverine origin of the nitrogen, indicates that the changes of atmospheric pollution and wastewater treatment practices are rapidly altering the availability of this limiting nutrient, with substantial consequences on the productivity in this coastal zone. Temporary changes of nutrient quantity and ratios, occurring during dry periods, can affect the succession between phytoflagellates and diatoms and the timing of the seasonal blooms.
Because of the evolution of climatic and anthropogenic disturbances, a progressive decline in phytoplankton abundance was observed in the GoT in 1986–2002. This trend was concomitant of persistent droughts, frequent deficits of the precipitation and a long-term decline in the availability of phosphorus in the coastal waters. This oligotrophication culminated in a period of low annual runoff in 2003–2008, which was combined with a scarce and unbalanced supply of land-borne nutrients. Afterwards, a new phase of unstable climatic conditions was established in the 2010s, which was not expected by past climatic and biogeochemical projections [7,25,38,51]. This new phase is partially similar to the eutrophic conditions observed in the 1986–2002 as it shows a recovery of cell abundance and the dominance of phytoflagellates over diatoms, although it is still characterized by a lower frequency of hypoxic events [31].
Taking into account the seasonal cycle of phytoplankters, two main processes were observed: (i) the shift from a classical bimodal phytoplankton cycle with two main blooms in spring and autumn to a prevalent unimodal cycle with a maximum in late spring, which is consistent with the changes of the runoff and nutrient loadings, and (ii) the effects on the phytoplankton community’s composition of current environmental changes, in particular in late autumn and early winter.
Overall, this study shows the importance of the changes of environmental conditions in shaping the long-term alternation among phytoplankton groups in this coastal zone, but more detailed investigations should be carried out, in order to assess the impacts of both natural and anthropogenic factors at an ecophysiology level.

Author Contributions

Conceptualization, S.C., M.G. and M.C. (Marina Cabrini); methodology, M.G. and M.C. (Marina Cabrini); data curation, S.C., M.G., M.C. (Marina Cabrini), M.K., C.D.V. and M.C. (Massimo Celio); investigation, M.K., C.D.V., M.C. (Massimo Celio); writing—review and editing, S.C., M.G., M.C. (Marina Cabrini), M.K., C.D.V., and M.C. (Massimo Celio); supervision, S.C. All authors have read and agreed to the published version of the manuscript.

Funding

This research received no external funding.

Acknowledgments

The data used in this study were collected thanks to the support of Friuli Venezia Giulia Region and of the following European cooperation projects between Italy and Slovenia: INTERREG II (Monitoraggio dell’Alto Adriatico Studio dello stato trofico e delle anomalie del Sistema Alto Adriatico), INTERREG IIIA (study of the trophic state and of the anomalies in the Northern Adriatic Sea system, AAFVG111006; EcoMADR—Integration Analysis of North Adriatic Marine Ecosystem, CAFVG111551) and INTERREG IIICBC Phare (OBAS, Biological Oceanography of the Northern Adriatic Sea, AAVEN111034). Daniela Fornasaro and Federica Cerino collaborated on phytoplankton analyses. This study was carried out in the framework of the DANUBIUS RI project (H2020—INFRA DEV 2). The authors wish to thank the reviewers for their useful suggestions and criticism.

Conflicts of Interest

The authors declare no conflict of interest.

Appendix A

Figure A1. (A) Annual cycles of Isonzo River discharge (km3 month−1) and (B) sea surface precipitation in the GoT (mm month−1).
Water 12 02652 g0a1
Table A1. Mean concentration of the nutrients (µmol L−1) and molar nutrient ratios at the mouth of the Isonzo River (Pieris Stations) shown in Figure 6.
YearNO3 µmol L−1NO2 µmol L−1NH4+ µmol L−1DIN µmol L−1PO43− µmol L−1Si(OH)4 µmol L−1TN µmol L−1TP µmol L−1DIN/PO43 mol/molTN/TP mol/mol
197657.580.351.0959.010.3636.20--217-
197752.380.231.3653.970.2940.51--243-
199873.340.654.5778.57------
199969.070.4120.2389.71------
200083.360.464.9088.72------
200181.980.461.1185.650.16--0.34983-
2002143.620.321.62146.860.29-161.800.40744404
2003178.780.392.08182.440.18-214.360.251394861
2004115.480.293.21120.050.29-131.900.39620340
200595.130.351.8896.230.41-121.370.70330173
200673.420.411.3976.680.30--0.39354-
200793.640.242.8696.740.31-127.350.42345274
200879.600.382.8682.840.45-104.950.54214240
200981.390.303.0384.720.32-98.280.31334272
201071.270.253.6975.210.26-82.960.81353202
201154.440.221.7852.330.31-87.460.61180168
201271.190.242.2477.840.44-82.610.70182131
201378.830.251.8580.760.46-94.601.7417665
201453.630.281.9455.670.24-91.031.6932662
201690.911.092.8394.820.53-92.810.75180130
Table A2. Mean and range of the values of nutrient concentration (µmol L−1) in the rainwater in coastal sites of the Northeastern Adriatic Sea. Notice that most of the estimates of DIN do not include NO2.
Site, StationYearsTN µmol L−1TP µmol L−1NO3 µmol L−1NH4+ µmol L−1DIN µmol L−1PO43− µmol L−1Si(OH)4 µmol L−1Reference
Gulf of Trieste1978–197941.7-21.020.441.6 *0.7-[60]
Rijeka, St. 11984–1991--38.0----[61]
Kvarner Bay, St. 21988–1991--38.0----[61]
Lovran, St. 31988–1991--41.0----[61]
Kvarner Bay, St. 41988–1991--34.0----[61]
Gulf of Trieste1993117 (66–185)3.8 (1.7–5.7)49.9 (11–77)23.3 (4.5–36)73.2 (16–113)3.0 (0.9–4.8)3.0 (1.1–6.0)[27]
Padez Basin,2006–2007--42.828.671.4--[62]
Kvarner Bay, St. 41996–2005--23.746.570.2--[63]
Pula, St. 181981–2006--92.162.1154.2--[64]
Pazin, St. 151981–2006--37.829.367.1--[64]
Zavizan, St. 311981–2006--31.431.462.8--[64]
Rijeka2001–2010--37.129.366.4--[65]
Komiza2001–2010--30.018.648.5--[65]
Rijeka, St.11990–1991--49.079.0128.0--[66]
Rijeka, St.21990–1991--77.0151.0228.0--[66]
* Included NO2 (0.2 µmol L−1 N).
Table A3. Collecting system capacity (IE: Inhabitant Equivalent) of the WWTPs in the GoT shown in Figure 1. Mean and range of the values of the concentrations (µmol L−1) of nitrogen and phosphorus at their outflows measured in periods included from 1996 to 2018.
WWTPIEFlow m3 s−1TN µmol L−1DIN µmol L−1TP µmol L−1PO43− µmol L−1TN/TP mol/molDIN/PO43− mol/mol
1 Piran33,0000.08678 (260–1960)-80 (16–219)-8.5-
2 Koper + Izola84,5000.17339 (228–1128)148 (71–668)43 (6–99)-7.8-
3 Trieste (Zaule)67,0000.27------
4 Trieste (Servola)220,0001.391299 (571–2284)828 (471–1024)52 (26–184)36 (17–52)2523
5 Trieste (Barcola)75000.09------
6 Sistiana35000.01------
7 Duino7500.001------
8 Staranzano + Monfalcone62,5000.2659 (71–1356)553 (75–1195)46 (1–143)-14-
9 Grado11,000–80,000 *0.181112 (271-3034)947 (166-2898)44 (1–151)-25-
TOTAL489,750–558,750 *4.01------
* Seasonal changes due to summer tourist influx.
Table A4. Mean benthic fluxes (mmol m−2 d−1) of regenerated nutrients from marine sediments to the water column in oxic and anoxic conditions in the GoT.
AreaYearsNH4+ mmol N m−2 d−1NO3 mmol N m−2 d−1PO43− mmol P m−2 d−1Si(OH)4 mmol Si m−2 d−1Reference
Central GoT1995–19960.8 ± 07 + 0.17 ± 0.73 +0.03 ± 0.05 +2.6 ± 2.3 +[54]
Central GoT19960.94 ° (0.73 *)−0.08 °0.03° (0.07 *)-[42]
Southern GoT1996-−0.14 °--[42]
Southern GoTMar. 19960.28 ° (1.14 *)-0.01 ° (0.06 *)-[67]
Southern GoTSep. 19960.52 ° (2.28 *)-0.01 ° (0.06 *)-[67]
+ Annual mean, ° oxic conditions, * anoxic conditions.
Figure A2. Relationships and ordinary least square regressions between annual freshwater discharge (km3 yr−1) and annual nitrogen and phosphorus discharges (tons yr−1) of the Isonzo River in 1998–2016.
Water 12 02652 g0a2
Table A5. Spearman’s Rank-Order Correlation analysis of monthly series of phytoplankton and environmental parameters in the GoT, in 1986–2018. Blue coefficients indicate a significance level α < 0.05, red coefficient indicate a significance level α < 0.01.
ParameterIsonzo FlowPrecipitationWind VelocityTSWTotal AbundanceChlorophyll aPhyto-Flagellates Diatoms Dino-Flagellates Cocco-Lithophores DINPO43−Si(OH)4
Isonzo flow
(km3 month−1)
1.0000.6550.306−0.1070.1120.1660.156−0.0130.0860.2030.3760.0010.213
Precipitation
(mm month−1)
0.6551.0000.2220.179−0.0460.0660.001−0.0560.0820.1450.2140.0540.184
Wind velocity
(m s−1)
0.3060.2221.000−0.521−0.192−0.021−0.176−0.150−0.3000.1350.2700.0630.160
TSW
(C)
−0.1070.179−0.5211.000−0.023−0.0630.0250.0400.2870.015−0.265−0.009−0.052
Total abundance
(cell L−1)
0.112−0.046−0.192−0.0231.0000.3770.8680.5520.490−0.007−0.142−0.139−0.145
Chlorophyll a
(µg L−1)
0.1660.066−0.021−0.0630.3771.0000.2500.3390.2260.0930.053−0.0340.028
Phytoflagellates
(cell L−1)
0.156−0.001−0.1760.0250.8680.2501.0000.1850.4740.013−0.075−0.1100.075
Diatoms
(cell L−1)
−0.013−0.056−0.1500.0400.5520.3390.1851.0000.312−0.009−0.230−0.124−0.375
Dinoflagellates
(cell L−1)
0.0860.082−0.3000.2870.4900.2260.4740.3121.0000.193−0.145−0.097−0.043
Coccolithophores
(cell L−1)
0.2030.1450.1350.015−0.0070.0930.013−0.0090.1931.0000.066−0.1110.276
DIN
(µmol L−1)
0.3760.2140.270−0.265−0.1420.053−0.075−0.230−0.1450.0661.0000.3280.516
PO43−
(µmol L−1)
0.0010.0540.063−0.009−0.139−0.034−0.110−0.124−0.097−0.1110.3281.0000.132
Si(OH)4
(µmol L−1)
0.2130.1840.160−0.052−0.1450.0280.075−0.375−0.0430.2760.5160.1321.000

References

  1. Rabalais, N.N.; Turner, R.E.; Dıaz, R.J.; Justic, D. Global change and eutrophication of coastal waters. ICES J. Mar. Sci. 2009, 66, 1528–1537. [Google Scholar] [CrossRef]
  2. Howarth, R.; Chan, F.; Comley, D.J.; Garnier, J.; Doney, S.C.; Marino, R.; Nillen, G. Coupled biogeochemical cycles: Eutrophication and hypoxia in temperate estuaries and coastal marine ecosystems. Front. Ecol. Environ. 2011, 9, 18–26. [Google Scholar] [CrossRef] [Green Version]
  3. Hall, N.S.; Paerl, H.W.; Peierls, B.L.; Whipple, A.C.; Rossignol, K.L. Effects of climatic variability on phytoplankton community structure and bloom development in the eutrophic, microtidal, New River Estuary, North Carolina, USA. Estuar. Coast. Shelf Sci. 2013, 117, 70–82. [Google Scholar] [CrossRef]
  4. Peñuelas, J.; Poulter, B.; Sardans, J.; Ciais, P.; van der Velde, M.; Bopp, L.; Boucher, O.; Godderis, Y.; Hinsinger, P.; Llusia, J.; et al. Human-induced nitrogen–phosphorus imbalances alter natural and managed ecosystems across the globe. Nat. Commun. 2013. [Google Scholar] [CrossRef] [Green Version]
  5. Matos, J.B.; de Oliveira, S.M.O.; Pereira, L.C.C.; da Costa, R.M. Structure and temporal variation of the phytoplankton of a macrotidal beach from the Amazon coastal zone. An. Acad. Bras. Ciênc 2016, 88, 1325–1339. [Google Scholar] [CrossRef] [Green Version]
  6. Mutshinda, C.M.; Finkel, Z.V.; Widdicombe, C.E.; Irwin, A.J. Bayesian inference to partition determinants of community dynamics from observational time series. Community Ecol. 2019, 20, 238–251. [Google Scholar] [CrossRef]
  7. Kovats, R.S.; Valentini, R.; Bouwer, L.M.; Georgopoulou, E.; Jacob, D.; Martin, E.; Rounsevell, M.; Soussana, J.-F. Europe. Contribution of Working Group II to the Fifth Assessment Report of IPCC. In Climate Change 2014: Impacts, Adaptation, and Vulnerability. Part B: Regional Aspects; Cambridge University Press: Cambridge, UK; New York, NY, USA, 2014; pp. 1267–1326. ISBN 978-1-107-05816-3. [Google Scholar]
  8. Chowdhury, M.; Hardikar, R.; Kesavan, H.C.; Thomas, J.; Mitra, A.; Rokade, M.A.; Naidu, V.S.; Sukumaran, S. Nutrient stoichiometry and freshwater flow in shaping of phytoplankton population in a tropical monsoonal estuary (Kundalika Estuary). Estuar. Coast. Shelf Sci. 2017, 198, 73–91. [Google Scholar] [CrossRef]
  9. Basu, S.; Mackey, K.R.M. Phytoplankton as Key Mediators of the Biological Carbon Pump: Their Responses to a Changing Climate. Sustainability 2018, 10, 869. [Google Scholar] [CrossRef] [Green Version]
  10. Dursun, F.; Tas, S. Variations in abundance and diversity of phytoplankton in the surface waters of the Golden Horn Estuary (Sea of Marmara). J. Mar. Biol. Assoc. UK 2019, 99, 279–290. [Google Scholar] [CrossRef]
  11. Trombetta, T.; Vidussi, F.; Mas, S.; Parin, D.; Simier, M.; Mostajir, B. Water temperature drives phytoplankton blooms in coastal waters. PLoS ONE 2019, 14, e0214933. [Google Scholar] [CrossRef] [Green Version]
  12. Fehling, J.; Davidson, K.; Bolch, C.J.S.; Brand, T.D.; Narayanaswamy, B.E. The Relationship between Phytoplankton Distribution and Water Column Characteristics in North West European Shelf Sea Waters. PLoS ONE 2012, 7, e34098. [Google Scholar] [CrossRef] [PubMed] [Green Version]
  13. Malone, T.; Azzaro, M.; Bode, A.; Brown, E.; Duce, R.; Kamykowski, D.; Ho Kang, S.; Kedong, Y.; Thorndyke, M.; Wang, J.; et al. Chapter 6: Primary Production, Cycling of Nutrients, Surface Layer and Plankton. In Assessment of Major Ecosystem Services from the Marine Environment (Other than Provisioning Services); United Nations, Ed.; Cambridge University Press: Cambridge, UK, 2017. [Google Scholar] [CrossRef]
  14. Vaquer-Sunyer, R.; Duarte, C.M. Thresholds of hypoxia for marine biodiversity. Proc. Natl. Acad. Sci. USA 2008, 105, 15452–15457. [Google Scholar] [CrossRef] [PubMed] [Green Version]
  15. Diaz, R.J.; Rosenberg, R. Spreading dead zones and consequences for marine ecosystems. Science 2008, 321, 926–929. [Google Scholar] [CrossRef]
  16. Grizzetti, B.; Bouraoui, F. Assessment of Nitrogen and Phosphorus Environmental Pressure at European Scale; EUR 22526 EN; European Commission, DG Joint Research Centre, Institute for Environment and Sustainability, Publications Office of the European Union: Luxembourg, 2006; p. 66. ISBN 92-79-03739-0. [Google Scholar]
  17. Cozzi, S.; Ibáñez, C.; Lazar, L.; Raimbault, P.; Giani, M. Flow Regime and Nutrient Loading Trends from the largest South European Watersheds: Implications for the productivity of Mediterranean and Black Sea’s coastal areas. Water 2019, 11, 1. [Google Scholar] [CrossRef] [Green Version]
  18. Giani, M.; Djakovac, T.; Degobbis, D.; Cozzi, S.; Solidoro, C.; Fonda Umani, S. Recent changes in the marine ecosystems of the northern Adriatic Sea. Estuar. Coast. Shelf Sci. 2012, 115, 1–13. [Google Scholar] [CrossRef]
  19. Volf, G.; Atanasova, N.; Skerjanec, M.; Ozanic, N. Hybrid modeling approach for the northern Adriatic watershed management. Sci. Total Environ. 2018, 635353–635363. [Google Scholar] [CrossRef]
  20. Ochoa-Hueso, R.; Allen, E.B.; Branquinho, C.; Cruz, C.; Dias, T.; Fenn, M.E.; Manrique, E.M.; Pérez-Corona, E.; Sheppard, L.J.; Stock, W.D. Nitrogen deposition effects on Mediterranean-type ecosystems: An ecological assessment. Environ. Pollut. 2011, 159, 2265–2279. [Google Scholar] [CrossRef]
  21. Viaroli, P.; Soana, E.; Pecora, S.; Laini, A.; Naldi, M.; Fano, E.A.; Nizzoli, D. Space and time variations of watershed N and P budgets and their relationships with reactive N and P loadings in a heavily impacted river basin (Po river, Northern Italy). Sci. Total Environ. 2018, 639, 1574–1587. [Google Scholar] [CrossRef]
  22. Goberville, E.; Beaugrand, G.; Sautour, B.; Tréguer, P.; SOMLIT Team. Climate-driven changes in coastal marine systems of western Europe. Mar. Ecol. Prog. Ser. 2010, 408, 129–147. [Google Scholar] [CrossRef]
  23. Lipizer, M.; De Vittor, C.; Falconi, C.; Comici, C.; Tamberlich, F.; Giani, M. Effects of intense meteorological and biological forcing factors on biogeochemical properties of coastal waters (Gulf of Trieste, Northern Adriatic Sea). Estuar. Coast. Shelf Sci. 2012, 115, 40–50. [Google Scholar] [CrossRef]
  24. Manna, V.; Fabbro, C.; Cerino, F.; Bazzaro, M.; Del Negro, P.; Celussi, M. Effect of an extreme cold event on the metabolism of planktonic microbes in the northernmost basin of the Mediterranean Sea. Estuar. Coast. Shelf Sci. 2019, 225, 106252. [Google Scholar] [CrossRef]
  25. Lloyd-Hughes, B.; Saunder, M.A. A drought climatology for Europe. Int. J. Clim. 2002, 22, 1571–1592. [Google Scholar] [CrossRef]
  26. Cabrini, M.; Fornasaro, D.; Cossarini, G.; Lipizer, M.; Virgilio, D. Phytoplankton temporal changes in a coastal northern Adriatic site during the last 25 years. Estuar. Coast. Shelf Sci. 2012, 115, 113–124. [Google Scholar] [CrossRef]
  27. Malej, A.; Mozetič, P.; Malačič, V.; Turk, V. Response of summer phytoplankton to episodic meteorological events (Gulf of Trieste, Adriatic Sea). PSZN Marine Ecol. 1997, 18, 273–288. [Google Scholar] [CrossRef]
  28. Scroccaro, I.; Ostoich, M.; Umgiesser, G.; De Pascalis, F.; Colugnati, L.; Mattassi, G.; Vazzoler, M.; Cuomo, M. Submarine wastewater discharges: Dispersion modelling in the Northern Adriatic Sea. Environ. Sci. Pollut. Res. 2010, 17, 844–855. [Google Scholar] [CrossRef]
  29. Cozzi, S.; Falconi, C.; Comici, C.; Čermelj, B.; Kovac, N.; Turk, V.; Giani, M. Recent evolution of river discharges in the Gulf of Trieste and their potential response to climate changes and anthropogenic pressure. Estuar. Coast. Shelf Sci. 2012, 115, 14–24. [Google Scholar] [CrossRef]
  30. Turk, V.; Mozetič, P.; Malej, A. Overview of eutrophication-related events and other irregular episodes in Slovenian sea (gulf of Trieste, Adriatic Sea). Ann. Ser. Hits. Nat. 2007, 17, 11–23. [Google Scholar]
  31. Kralj, M.; Lipizer, M.; Čermelj, B.; Celio, M.; Fabbro, C.; Brunetti, F.; Francé, J.; Mozetič, P.; Giani, M. Hypoxia and dissolved oxygen trends in the northeastern Adriatic Sea (Gulf of Trieste). Deep Sea Res. Part 2 Top. Stud. Oceanogr. 2019, 164, 74–88. [Google Scholar] [CrossRef]
  32. Malačič, V.; Celio, M.; Cermelj, B.; Bussani, A.; Comici, C. Interannual evolution of seasonal thermohaline properties in the Gulf of Trieste (northern Adriatic) 1991–2003. J. Geophys. Res. 2006, 111, C08009. [Google Scholar] [CrossRef]
  33. Malačič, V.; Petelin, B. Climatic circulation in the Gulf of Trieste (northern Adriatic). J. Geophys. Res. 2009, 114, C07002. [Google Scholar] [CrossRef]
  34. Furlani, S.; Ninfo, A.; Zavagno, E.; Paganini, P.; Zini, L.; Biolchi, S.; Antonioli, F.; Coren, F.; Cucchi, F. Submerged notches in Istria and the Gulf of Trieste: Results from the Geoswim project. Quat. Int. 2014, 332, 37–47. [Google Scholar] [CrossRef]
  35. Zini, L.; Calligaris, C.; Zavagno, E. Classical Karst hydrodynamics: A shared aquifer within Italy and Slovenia. In Evolving Water Resources Systems: Understanding, Predicting and Managing Water–Society Interactions; Proceedings of ICWRS2014; IAHS Publication 364: Bologna, Italy, 2014; pp. 499–504. [Google Scholar]
  36. Malej, A.; Mozetič, P.; Malačič, V.; Terzić, S.; Ahel, M. Phytoplankton responses to freshwater inputs in a small semi-enclosed gulf (Gulf of Trieste, Adriatic Sea). Mar. Ecol. Progr. Ser. 1995, 120, 111–121. [Google Scholar] [CrossRef]
  37. Cantoni, C.; Cozzi, S.; Pecchiar, I.; Cabrini, M.; Mozetič, P.; Catalano, G.; Fonda Umani, S. Short-term variability of primary production and inorganic nitrogen uptake related to the environmental conditions in a shallow coastal area (Gulf of Trieste, N Adriatic Sea). Oceanol. Acta 2003, 26, 565–575. [Google Scholar] [CrossRef] [Green Version]
  38. Mozetič, P.; Francé, J.; Kogovsek, T.; Talaber, I.; Malej, A. Plankton trends and community changes in a coastal sea (northern Adriatic): Bottom-up vs. top-down control in relation to environmental drivers. Estuar. Coast. Shelf Sci. 2012, 115, 138–148. [Google Scholar] [CrossRef]
  39. Cozzi, S.; Reisenhofer, E.; Di Monte, L.; Cantoni, C.; Adami, G. Effect of environmental forcing on the fate of nutrients, dissolved organic matter and heavy metals released by a coastal wastewater pipeline. Chem. Ecol. 2008, 24, 87–107. [Google Scholar] [CrossRef]
  40. Mozetič, P.; Malačič, V.; Turk, V. A case study of sewage discharge in the shallow coastal area of the Northern Adriatic Sea (Gulf of Trieste). Mar. Ecol. 2008, 29, 483–494. [Google Scholar] [CrossRef]
  41. Cozzi, S.; Mistaro, A.; Sparnocchia, S.; Colugnati, L.; Bajt, O.; Toniatti, L. Anthropogenic loads and biogeochemical role of urea in the Gulf of Trieste. Sci. Total Environ. 2014, 493, 271–281. [Google Scholar] [CrossRef]
  42. Faganeli, J.; Ogrinc, N. Oxic–anoxic transition of benthic fluxes from the coastal marine environment (Gulf of Trieste, northern Adriatic Sea). Mar. Freshw. Res. 2009, 60, 700–711. [Google Scholar] [CrossRef]
  43. Testa, J.M.; Faganeli, J.; Giani, M.; Brush, M.J.; De Vittor, C.; Boynton, W.R.; Covelli, S.; Kemp, W.M.; Kovač, N.; Woodland, R. Advances in Our Understanding of Pelagic-Benthic Coupling. In Evolution and Comparative Analysis of Coastal Ecosystems; Malone, T., Malej, A., Faganeli, J., Eds.; AGU Wiley: Hoboken, NJ, USA. (In Press)
  44. Hansen, H.P.; Koroleff, F. Determination of nutrients. In Methods of Seawater Analysis; Grasshoff, K., Kremling, K., Ehrhardt, M., Eds.; Wiley-VCH Verlag GmbH: Weinheim, Germany, 1999; pp. 159–228. [Google Scholar] [CrossRef]
  45. Lorenzen, C.; Jeffrey, J. Determination of chlorophyll in sea water. UNESCO Tech. Pap. Mar. Sci. 1980, 35, 1–20. [Google Scholar]
  46. Throndsen, J. Preservation and storage. In Phytoplankton Manual; Sournia, A., Ed.; UNESCO: Paris, France, 2010; pp. 69–74. [Google Scholar]
  47. Zingone, A.; Totti, C.; Sarno, D.; Cabrini, M.; Caroppo, C.; Giacobbe, M.G.; Luglio, A.; Nuccio, C.; Socal, G. Fitoplancton: Metodiche di analisi quali-quantitativa. In Metodologie di Studio del Plancton Marino. Manuali e Linee Guida 56/2010; Socal, G., Buttino, I., Cabrini, M., Mangoni, O., Penna, A., Totti, C., Eds.; ISPRA SIBM: Roma, Italy, 2010; pp. 213–237. [Google Scholar]
  48. Chen, Z.; Grasby, S.E. Impact of decadal and century-scale oscillations on hydroclimate trend analyses. J. Hydrol. 2009, 365, 122–133. [Google Scholar] [CrossRef]
  49. Zhang, X.; Alexander, L.; Hegerl, G.C.; Jones, P.; Tank, A.K.; Peterson, T.C.; Trewin, B.; Zwiers, F.W. Indices for monitoring changes in extremes based on daily temperature and precipitation data. WIREs Clim. Chang. 2011, 2, 851–870. [Google Scholar] [CrossRef]
  50. Bregant, D.; Catalano, G. Chemical and Physical Conditions at Isonzo River Mouth (June 1976–December 1977); CNR-Istituto Talassografico of Trieste: Trieste, Italy, 1978; Volume 545, p. 12. [Google Scholar]
  51. Cozzi, S.; Giani, M. River water and nutrient discharges in the Northern Adriatic Sea: Current importance and long term changes. Cont. Shelf Res. 2011, 31, 1881–1893. [Google Scholar] [CrossRef]
  52. Raicich, F.; Colucci, R.R. A near-surface sea temperature time series from Trieste, northern Adriatic Sea (1899–2015). Earth Syst. Sci. Data 2019, 11, 761–768. [Google Scholar] [CrossRef] [Green Version]
  53. Fonda Umani, S.; Beran, A.; Parlato, S.; Virgilio, D.; Zollet, T.; De Olazabal, A.; Lazzarini, B.; Cabrini, M. Noctiluca scintillans MACARTNEY in the Northern Adriatic Sea: Long–term dynamics, relationships with temperature and eutrophication, and role in the food web. J. Plankton Res. 2004, 26, 545–561. [Google Scholar] [CrossRef] [Green Version]
  54. Bertuzzi, A.; Faganelj, J.; Welker, C.; Brambati, A. Benthic fluxes of dissolved inorganic carbon, nutrients and oxygen in the Gulf of Trieste (Northern Adriatic). Water Air Soil Pollut. 1997, 99, 305–314. [Google Scholar] [CrossRef]
  55. Goffart, A.; Hecq, J.-H.; Legendre, L. Drivers of the winter-spring phytoplankton bloom in a pristine NW Mediterranean site, the Bay of Calvi (Corsica): A long-term study (1979–2011). Prog. Oceanogr. 2015, 137, 121–139. [Google Scholar] [CrossRef]
  56. Grilli, F.; Accoroni, S.; Acri, F.; Bernardi Aubry, F.; Bergami, C.; Cabrini, M.; Campanelli, A.; Giani, M.; Guicciardi, S.; Marini, M.; et al. Seasonal and interannual trends of oceanographic parameters over 40 years in the northern Adriatic Sea in relation to nutrient loadings from EMODnet Chemistry data portal. Water 2020, 12, 2280. [Google Scholar] [CrossRef]
  57. Cerino, F.; Malinverno, E.; Fornasaro, D.; Kralj, M.; Cabrini, M. Coccolithophore diversity and dynamics at a coastal site in the Gulf of Trieste (northern Adriatic Sea). Estuar. Coast. Shelf Sci. 2017, 196, 331–345. [Google Scholar] [CrossRef]
  58. Olivotti, R.; Faganeli, J.; Malej, A. Impact of “organic” pollutants on coastal waters, Gulf of Trieste. Water Sci. Technol. 1986, 18, 57–68. [Google Scholar] [CrossRef]
  59. Volf, G.; Atanasova, N.; Kompare, B.; Ožanić, N. Modeling nutrient loads to the northern Adriatic. J. Hydrol. 2013, 504182–504193. [Google Scholar] [CrossRef]
  60. Faganeli, J.; Tusnik, P. Carbon, nitrogen and phosphorus nutrients in the eastern part of the Gulf of Trieste (Northern Adriatic). Acta Adriat. 1983, 24, 25–41. [Google Scholar] [CrossRef]
  61. Alebić-Juretić, A. Precipitation chemistry within Kvarner Bay area, Northern Adriatic (Croatia), 1984-1991. Water Air Soil Pollut. 1994, 78, 343–357. [Google Scholar] [CrossRef]
  62. Rusjan, S.; Vidmar, A. The role of seasonal and hydrological conditions in regulating dissolved inorganic nitrogen budgets in a forested catchment in SW Slovenia. Sci. Total Environ. 2017, 575, 1109–1118. [Google Scholar] [CrossRef] [PubMed]
  63. Alebić-Juretić, A. Airborne ammonia and ammonium within the Northern Adriatic area, Croatia. Environ. Pollut. 2008, 154, 439–447. [Google Scholar] [CrossRef]
  64. Špoler Čanić, K.; Vidič, S.; Bencetić Klaić, Z. Precipitation chemistry in Croatia during the period 1981-2006. J. Environ. Monit. 2009, 11, 839–851. [Google Scholar] [CrossRef]
  65. Ðjuričić, V.; Kosanović, C.; Škevin-Sović, J. Atmospheric contribution to eutrophication of the Adriatic Sea. WIT Trans. Ecol. Environ. 2012, 157, 377–386. [Google Scholar] [CrossRef] [Green Version]
  66. Alebić-Juretić, A.; Šojat, V. Chemical composition of rainwater collected at two sampling sites in the city of Rijeka. Arh. Hig. Rada Toksikol. 1998, 49, 245–250. [Google Scholar]
  67. Ogrinc, N.; Faganeli, J. Phosphorus regeneration and burial in near-shore marine sediments (the Gulf of Trieste, northern Adriatic Sea). Estuar. Coast. Shelf Sci. 2006, 67, 579–588. [Google Scholar] [CrossRef]
Figure 1. Station C1, rivers (blue lines), main sites where coastal and submarine springs are located (red arrows) and points of discharge of the wastewaters (WWTP) operating during the period of interest in the Gulf of Trieste. Dashed red line indicates the limit of the considered Region of Interest.
Water 12 02652 g001
Figure 2. Annual medians, quartiles and ranges of depth-integrated data of (A) phytoplankton abundance (cells L−1) and (B) chlorophyll a concentration (µg L−1) at the station C1, in 1986–2018. The largest events of hypoxia and anoxia observed in the Gulf of Trieste (GoT) are also shown. Alternated white–gray areas indicate the major phases characterizing the evolution of phytoplankton community: eutrophic (1986–1992), posteutrophic (1993–2002), oligotrophic (2003–2009) and unstable (2010–2018) phase.
Water 12 02652 g002
Figure 3. Depth-integrated values of monthly phytoplankton abundance ((A); cells L−1) and chlorophyll a concentration ((B); µg L−1) at the station C1, in 1986–2018.
Water 12 02652 g003
Figure 4. Contribution (%) to total cell abundance of the four most important phytoplankton groups ((A), Phytoflagellates; (B), Diatoms; (C), Dinoflagellates; (D), Coccolithophores) in 1986–2018.
Water 12 02652 g004
Figure 5. (A) Annual flow (km3 yr−1) of Isonzo River in 1986–2018. (B) Number of days with extremely low (red; <10th percentile) and high (blue; >90th percentile) river flow. (C) Annual precipitation at sea surface in the GoT (mm yr−1). (D) Standard Precipitation Index calculated over 12-month periods (SPI12) by monthly precipitation data (−3 = extremely dry, 3 = extremely wet). Gray and white areas indicate the major phases of phytoplankton dynamics shown in Section 3.1.
Water 12 02652 g005
Figure 6. Mean concentrations (µmol L−1) of dissolved inorganic nitrogen (A), phosphate (B), total nitrogen (C) and total phosphorus (D) and ratios (mol/mol) of DIN/PO43− (E) and TN/TP (F) in Isonzo River water (FW), in comparison to typical ranges of nutrient concentration in rainwater (R) and in the wastewaters (W) discharged in the GoT (data are shown in the Table A1, Table A2 and Table A3).
Water 12 02652 g006
Figure 7. Monthly mean velocity of the wind at sea surface in the GoT (bubble size; m s−1) in comparison to eastward wind component (u; m s−1) and northward wind component (v; m s−1), in 1986–2018. Red squares indicate the months with a higher phytoplankton abundance (Figure 3A). In the first plot, cardinal points indicate that winds blowing from NE have u < 0 and v < 0, winds blowing from SE have u < 0 and v > 0.
Water 12 02652 g007
Figure 8. Time series of depth-integrated concentrations (µmol L−1) of PO43− (A), DIN (B) and Si(OH)4 (C) at the station C1 (median, quartiles and range) in comparison to the largest hypoxia (H) and anoxia (A) events recorded in the GoT. Gray and white areas indicate the major phases of phytoplankton dynamics shown in the Section 3.1.
Water 12 02652 g008
Table 1. Estimates of freshwater loads (km3 yr−1) and TN and TP inputs in the GoT (t yr−1) due to Isonzo River (1998–2016), precipitation, sewage discharges (WWTP) and benthic fluxes of regenerated nitrogen and phosphorus from marine sediments to the water column.
SourceFlow (km3 yr−1)TN (t-N yr−1)TP (t-P yr−1)
Isonzo River1.63–5.021285–706312–401
Precipitation0.38–0.76626–123945–89
WWTP0.131290–1470270–306
Benthic fluxes-2718°186°
° Dissolved inorganic nitrogen and phosphorus.
Table 2. Range of variation of subsurface seawater temperature (TSW; °C) and trends of monthly (annual) mean values at Trieste in 1986–2015. The significance of temperature trends (α) and their slope (°C yr−1) are calculated with MK and S tests, respectively.
MonthTSW Range (°C)Slope (°C yr−1)α
January6.1–12.30.050.05
Febreary4.0–11.50.02>0.10
March6.3–13.90.01>0.10
April7.9–18.10.02>0.10
May10.8–25.40.02>0.10
June14.0–27.60.00>0.10
July18.1–29.50.040.01
August18.8–28.30.00>0.10
September18.3–26.20.01>0.10
October13.9–22.50.00>0.10
November11.4–18.80.03>0.10
December7.2–16.00.040.10
Annual values4.0–29.50.020.05
Table 3. Monthly (annual) trends (yr−1) of the ratios of depth-integrated nutrient concentrations (µmol L−1) at the station C1 in 1992–2018, calculated with MK and S tests.
MonthDIN/PO43− Si/PO43− Si/DIN
Slope (yr−1)αSlope (yr−1)αSlope (yr−1)α
January2.10.053.40.0010.01>0.10
February2.40.102.90.010.02>0.10
March2.4>0.103.50.050.02>0.10
April0.7>0.104.40.010.100.001
May1.50.103.90.010.040.10
June0.4>0.104.90.0010.100.001
July1.30.104.30.050.110.05
August1.70.103.80.010.090.05
September0.2>0.102.90.050.090.001
October0.7>0.103.30.050.060.05
November1.80.014.00.0010.050.01
December2.10.013.30.0010.020.05
Annual value1.40.0013.70.0010.040.001

