Article

Soil Management Effects on Soil Water Erosion and Runoff in Central Syria—A Comparative Evaluation of General Linear Model and Random Forest Regression

1
Institution of Land Utilization, Technology and Regional Planning, University of Debrecen, Böszörményi út 138, 4032 Debrecen, Hungary
2
Department of Soil Science, Faculty of Agriculture, Al-Bath University, Homs, Syria
3
Institute of Horticulture, University of Debrecen, Böszörményi út 138, 4032 Debrecen, Hungary
4
Hungarian Academy of Sciences, Plant Protection Institute, Herman Ottó út 15, 1022 Budapest, Hungary
5
Department of Geography and GIS, Faculty of Arts, Alexandria University, Alexandria 25435, Egypt
6
Department of Soil and water Science, Faculty of Agriculture, Tishreen University, Latakia, Syria
7
Environmental Quality, Atmospheric Science and Climate Change Research Group, Ton Duc Thang University, Ho Chi Minh 700000, Vietnam
8
Faculty of Environment and Labour Safety, Ton Duc Thang University, Ho Chi Minh 700000, Vietnam
9
Institute of Research and Development, Duy Tan University, Danang 550000, Vietnam
10
Faculty of Environmental and Chemical Engineering, Duy Tan University, Danang 550000, Vietnam
11
Department of Physical Geography and Geoinformatics, Faculty of Science and Technology, University of Debrecen, 4032 Debrecen, Hungary
*
Author to whom correspondence should be addressed.
Water 2020, 12(9), 2529; https://doi.org/10.3390/w12092529
Submission received: 10 August 2020 / Revised: 3 September 2020 / Accepted: 8 September 2020 / Published: 10 September 2020

Abstract

:
The Mediterranean part of Syria is affected by soil water erosion due to poor land management. Within this context, the main aim of this research was to track soil erosion and runoff after each rainy storm between September 2013 and April 2014 (rainy season), on two slopes with different gradients (4.7%; 10.3%), under three soil cover types (SCTs): bare soil (BS), metal sieve cover (MC), and strip cropping (SC), in Central Syria. Two statistical multivariate models, the general linear model (GLM), and the random forest regression (RFR) were applied to reveal the importance of SCTs. Our results reveal that higher erosion rate, as well as runoff, were recorded in BS followed by MC, and SC. Accordingly, soil cover had a significant effect (p < 0.001) on soil erosion, and no significant difference was detected between MC and SC. Different combinations of slopes and soil cover had no effect on erosion, at least in this experiment. RFR performed better than GLM in predictions. GLM’s median of mean absolute error was 21% worse than RFR. Nonetheless, 25 repetitions of 2-fold cross-validation ensured the highest available prediction accuracy for RFR. In conclusion, we revealed that runoff, rain intensity and soil cover were the most important factors in erosion.

1. Introduction

In the last few decades, land degradation has posed major concerns all over the world [1,2]. Over 60% of the world’s land is subjected to different types of land degradation, and more than 3.2 billion people suffer from it [3,4,5]. The main issues are desertification and salinization [6,7], fertility reduction [8,9] and soil erosion [10], soil acidification [11,12], and pollution [13]. In addition, due to changing environments, stenocious species disappear and biodiversity decreases [14,15,16]. Thus, maintenance of soil physicochemical properties is a key factor for a healthy soil, which directly or indirectly leads to achievement of the Sustainable Development Goals (UN-SDGs), namely Goals 2, 3, 6, 7, 12–15 [17,18,19]
Soil erosion is a serious degradation hazard that threaten agricultural production and sustainability of natural ecosystems all over the world [20]. More than 12 million ha/year of fertile soil were excluded from agricultural production due to this degradation form [21]. Furthermore, due to the runoff and sediment transportation, soil loss is accompanied by accumulation eutrophication and water pollution, nutrition leaching and crop yield depression [22]. Accordingly, soil erosion is a great challenge for sustainability in agroecosystems worldwide, such as Europe [22,23,24,25], Africa [26,27], Asia [28], and Australia [29].
Soil erosion by water can be induced by rainfall, slope, and may also be caused by melting snow, and irrigation. Rainfall erosivity depends on the duration, intensity, frequency of rainy storm [30]. Also, the slopes have an effect on soil erosion; in particular, the most important feature is the steepness, but the length, shape and aspect are also affecting the amount and velocity of runoff; nevertheless, erosion can occur on gentle slopes, usually as areal sheet erosion [31,32,33,34]. Furthermore, there are influencing factors having a role in regulating the amount of runoff such as soil properties (i.e., texture, organic matter content, aggregates stability, soil compaction and sealing) [35,36]; and agricultural activities (tillage practices) [35,36,37], as well as land cover/management [38,39].
Different approaches that are available determine the rate of erosion from experimental plots (EP), based on field or laboratory measurements, to erosion models using initiating and influencing factors as model parameters. The EP methods (i.e., levelling, volumetric, deluometric, deflametric, climatological, pluviological, and monolithic methods) were suggested by Zachar [40] as an ideal solution to directly measure soil erosion in a controlled environment (i.e., slope characteristics, soil conditions, and land cover). The most important issue of erosion studies is whether the findings can be extrapolated to other areas, due to the limited size of the EPs.
Over time, dozens of equations and mathematical models were developed for different purposes such as assessing soil erosion, quantifying soil erosion, drawing soil erosion hazard maps, and evaluating the effectiveness of erosion control measures. Since the first equation for predicting soil erosion was introduced by Zingg [41], considerable improvements had been achieved in modeling soil erosion. Scientifically, soil erosion models can be divided into three groups: empirical models (i.e., Universal Soil Loss Equation (RUSLE) [42]); physical models (i.e., Water Erosion Prediction Project model (WEPP) [43]); and hybrid/conceptual models (i.e., the Large-Scale Catchment Model (LASCAM) [44]). Regardless of the model type, the main goal was to simplify soil erosion processed to an acceptable level of accuracy in order to represent real-world scenarios.
Model validation is a serious part of the erosion analysis which has an extensive literature [45,46,47], even when the results are based on field experiments, the reliability of the conclusions should be investigated [48]. Statistical analysis can reveal the general relationships, but the main question is: how do the data represent the area and the phenomenon itself? Regression analysis provides a reliable measure with goodness-of-fit indices (e.g., R2 and residual errors), but these are calculated from the dataset itself, and not from independent data. However, splitting the dataset into two parts may be misleading: a random selection can provide different datasets from the aspect of representativity, i.e., the train and test data can be selected to be appropriately different and similar, providing a randomly accurate or inaccurate outcome. A reliable method can split the datasets into several subsets, using one part to train the statistical models, and the other for testing. Moreover, we can repeat this procedure; thus, based on several random selections and repetitions can provide a basis to judge the models with higher reliability: medians, quartiles, means, standard deviations (SD) can be calculated from even hundreds of models runs. Accordingly, the accuracy, and the representativeness of the input data will be reflected in the range of model indices.
Syria is one of the Mediterranean countries being affected by both water erosion, and wind erosion, as in other countries in the Middle East and North Africa (MENA) region. Generally, wind erosion mainly dominates in the eastern and central part of Syria [49], while the western and northern parts as well as mountains are more subjected to soil erosion by water [50,51,52]. In the central part of Syria, especially in Mysiafe region (Hamah Governorate (Syria)), where successive and heavy rainstorms occur frequently, soil erosion had become a recurrent threat for sustainability of land resources. Besides, agricultural areas in this region are remarkably affected by soil erosion, which hinders the ecosystem and can cause catastrophic damage to agricultural production.
Although several erosion related studies have been prepared using experimental plots (i.e., Kbibo and Nasafi [53], Kbibo et al. [54]), data reliability had not been evaluated. Within this context, the main aim of this study was to investigate the impact of using different soil conservation techniques on water soil erosion and runoff. We quantified the role of the slope steepness and had the following hypotheses: (i) involving more driving factors into the modelling results in more accurate models; (ii) a non-parametric model can perform better due to lesser limiting prerequisites; and (iii) cross-validation with optimized models provides better information about the model accuracy.

2. Materials and Methods
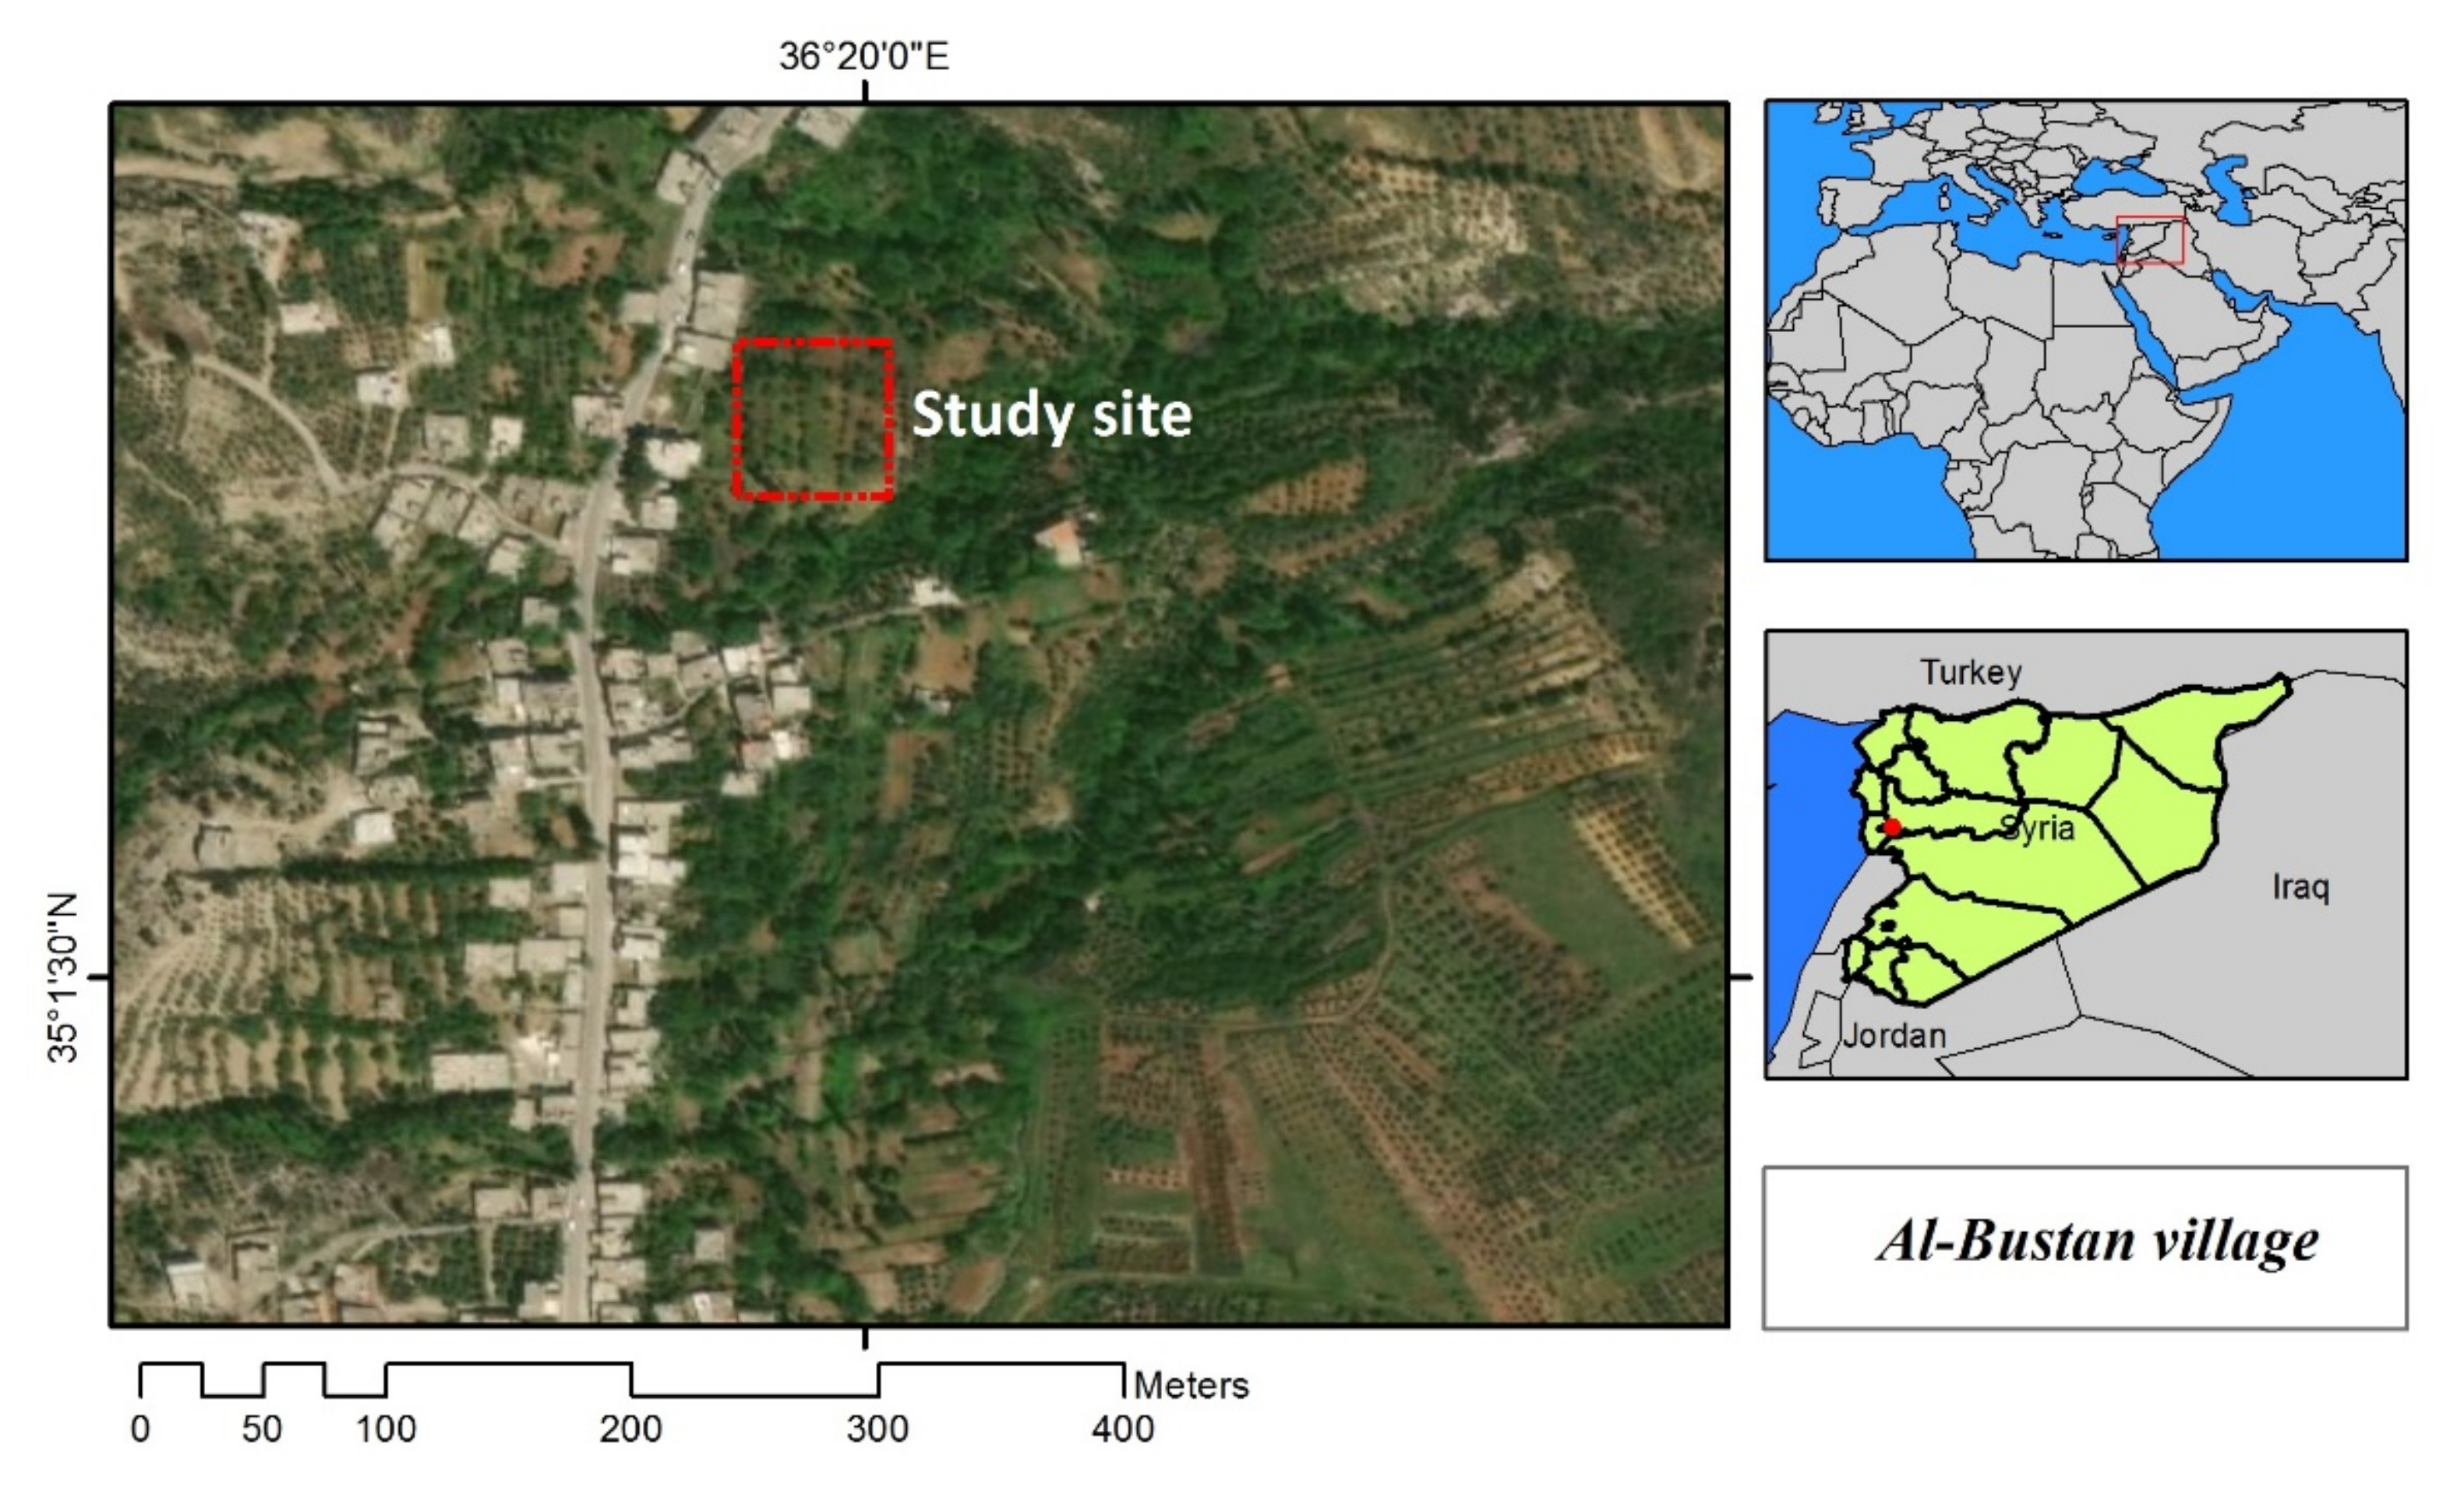
2.1. Study Area

The study area is located in Al-Bustan village (36.329 E, 35.016 N) in Hamah Governorate (Syria) (Figure 1), NE Syria, and it is about 720 m above sea level. Generally, soils in this area are described as clayey soils (sand 9.8%; silt 21.9%; clay 68.3%), slight alkaline (pH = 8.1), non-saline (electrical conductivity (EC)= 0.15 dS/m), have moderate organic matter content (OM% = 1.9%), and high in calcium carbonate content (41.3%). Physical characteristics, such as bulk density (1.3 g/cm3), practical density (2.62 g/cm3), and porosity (49.61%) indicated a compacting soil condition. The study area is dominated by dolomitic rocks alternating with limestone, dating back to the middle and upper Jurassic, and has a maximum thickness of about 700 m. The climate of this region is characterized by hot summers and cold and rainy winters, with an average precipitation of 1890 mm. Olives cultivations dominate the land use, with smaller patches of Pinus forests as natural vegetation.

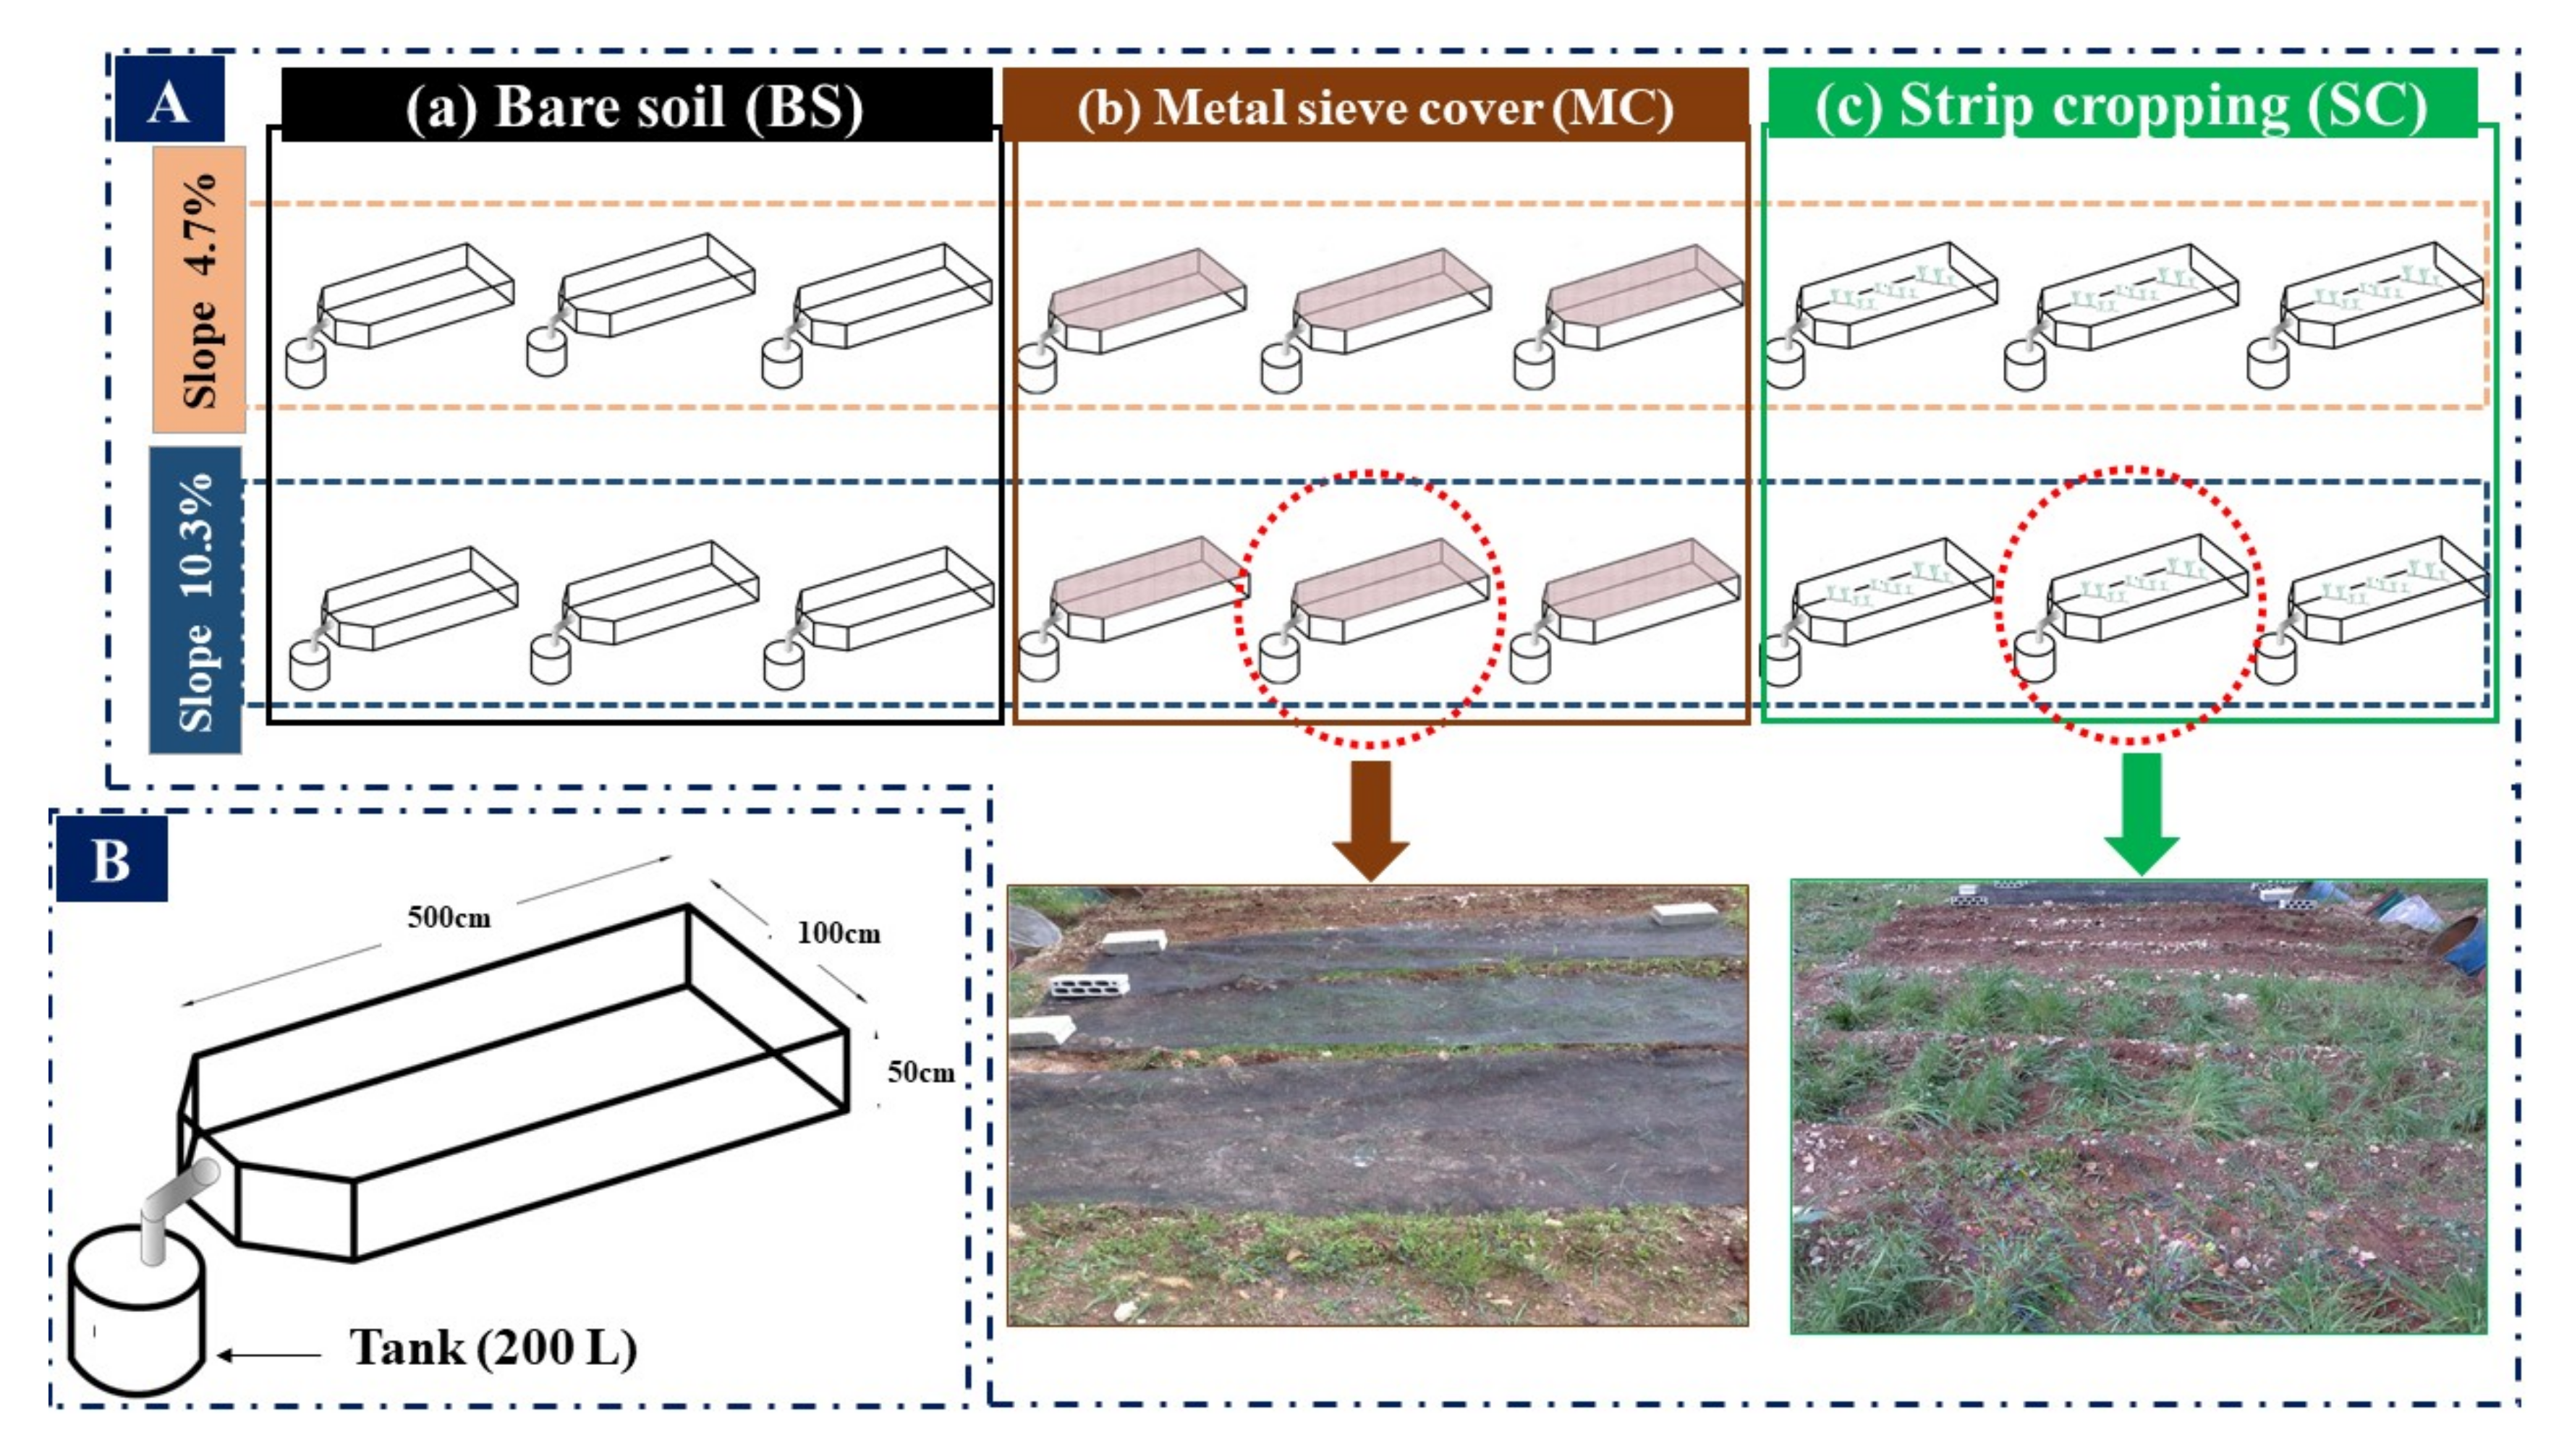
2.2. Experimental Design and Sampling

Two locations with different slopes angles (4.7% and 10.3% at the first and second location, respectively) were selected to run the experiment. For each slope, nine experimental plots (5 m × 1 m; Figure 2) were set up within each slope and were divided as follows: (i) three plots as a control without cultivation (bare soil, BS) to be directly exposed to rain drops (Figure 2a); (ii) three plots were covered with metal sieve (MC) at a height of 20 cm in order to reduce the direct impact of rain drops on the soil aggregates (MC, Figure 2b); and (iii) three plots were planted with annual crop in alternating strips (SC) perpendicular to the slope and far from each other 30 cm, in order to mitigate the effect of rain drops, and reduce the impact of surface runoff (SC, Figure 2c). The total experimental plots were 18 plots (2 slopes × 3 land cover × 3 replications). The plots designed were similar to Wischmeier type [55], but in smaller size.
During the monitoring period, which started from September 2013 and ended in March 2014, 10 rainy storms were recorded; before each rain events soil moisture content was measured. Rainfall amount in 30 min (i30) was collected from the rain gauge beside each plot as well as runoff and soil erosion. Sediment trap (tank, 200 L) contents (i.e., soil and water) were mixed for five minutes, then three samples each one 2-L (L) were collected; these samples were mixed together, then a representative sample of 3 L were collected. After that the tank was discharged, and samples were moved to the laboratory at Al-Bath University. In the laboratory, samples were placed in containers for sedimentation then soil was separated from the water and dried in an oven at 105 °C for 24 h. Later on, soil samples were weighed on a balance to calculate the amount of eroded soil from each event.

2.3. Statistical Analysis

Statistical evaluation was begun with checking the assumption of normal distribution of the variables. We applied the Shapiro–Wilk test and found that variables were not of normal distribution. Accordingly, we applied robust methods with bootstrapping and trimming to overcome the violated assumptions.
Robust 2-way factorial analysis of variance (ANOVA) was applied for the analysis of factor variables, soil cover and slope type. Beside the hypothesis testing, interaction was also studied. Modified M-estimator and 5000 bootstrap samples were applied. Post hoc testing was performed with the Games–Howell test, which is insensitive for the inhomogeneity of variances [56].
To reveal the importance of soil management and the uncertainties of the outcomes, we applied two statistical models: the general linear model (GLM) and random forest regression (RFR). For both models, the response variable was the erosion (g/m2), while the predictors were the runoff (L/m2), soil moisture (%), rain intensity (mm/30 min), slope steepness (%), and the management. Categorical variables were involved as dummy variables.
The GLM has several assumptions: the dependent variable is normally distributed, the predictors combine additively on the response, residuals of the model have to follow the normal distribution, the model has to have homoscedasticity (i.e., residuals have been constant in the range of prediction), data should be independent and predictor variables’ correlation should be smaller than 0.8 (i.e., to avoid multicollinearity) [56,57]. The GLM final outcome is merely dependent on such limitations. The Shapiro–Wilk test confirmed the normality of the residuals.
RFR is a non-parametric tree ensemble procedure with several applications to data analysis due to its prediction performance [58]. The random forest technique uses bagging and decision trees. We applied 500 decision trees, and the bagging ensured 500 model realizations with random selection of the data with replacement. The involved variables were the same as in case of GLM, but RFR does not apply all of them at the same time: for one decision tree, the algorithm uses the square root of the total number of variables. In our case, there were 6 variables used in one model, considering the categorical variables separate as single dummy ones.
We also determined the variable importance. In the case of GLM, we calculated the effect size (partial η2p). η2p is a standardized measure of the magnitude of the contribution of a variable in the explained variance [56]. RFR, with omitting variables during the calculations, exploits the advantage of lesser variables. Omitted variables cause change in the explained variance, and as there are several hundred models (in our case 500), we can determine the consequence of including or omitting the variables. The final outcome is a rank expressed as mean decrease accuracy (IncMSE%, a measure of sum of squares as a prediction error; the larger the value the larger the importance of a given variable) and mean decrease Gini (IncNodeGini, the impurity of the splits of the decision trees) [59]. RFR provides a measure of variable importance but a current limitation is that no systematic method exists to estimate the shared variances of the variables [60]. As Strobl et al. [61] pointed out the unreliability of default RF models’ importance values, we applied the importance permutation [62].
As a verification of the models, we applied k-fold repeated cross validation (RCV) with 2 splits and 25 repetitions; i.e., altogether 50 models were run with splitting the dataset to a train and a set group (which meant two models: at first the first group was designated as train and second as the test set; secondly the second group was used as the train set and the first as the test), then it was repeated 25 times. The accuracies were plotted in a box and whiskers plot and this made it possible to compare the models’ efficiency using the R2, mean absolute error (MAE) and root mean square error (RMSE) values. In this case, R2 was not the traditional one referring to the response and predictor variables, but, as a pseudo-R2, it was the square of the correlation between the observed and modelled values [63]. This approach made it possible to fine tune the RFR model: we used the RMSE’s smallest value to select the optimal model with the number of variables at the nodes of decision trees. We evaluated the RFR and GLM model predictions with the Bland and Altman [64] plot (visualizing the differences of observed and modelled data against their averages) and Wilcoxon paired test. Statistical analyses were conducted in R 3.6.2 [65] by using the packages shown in Table 1.

3. Results

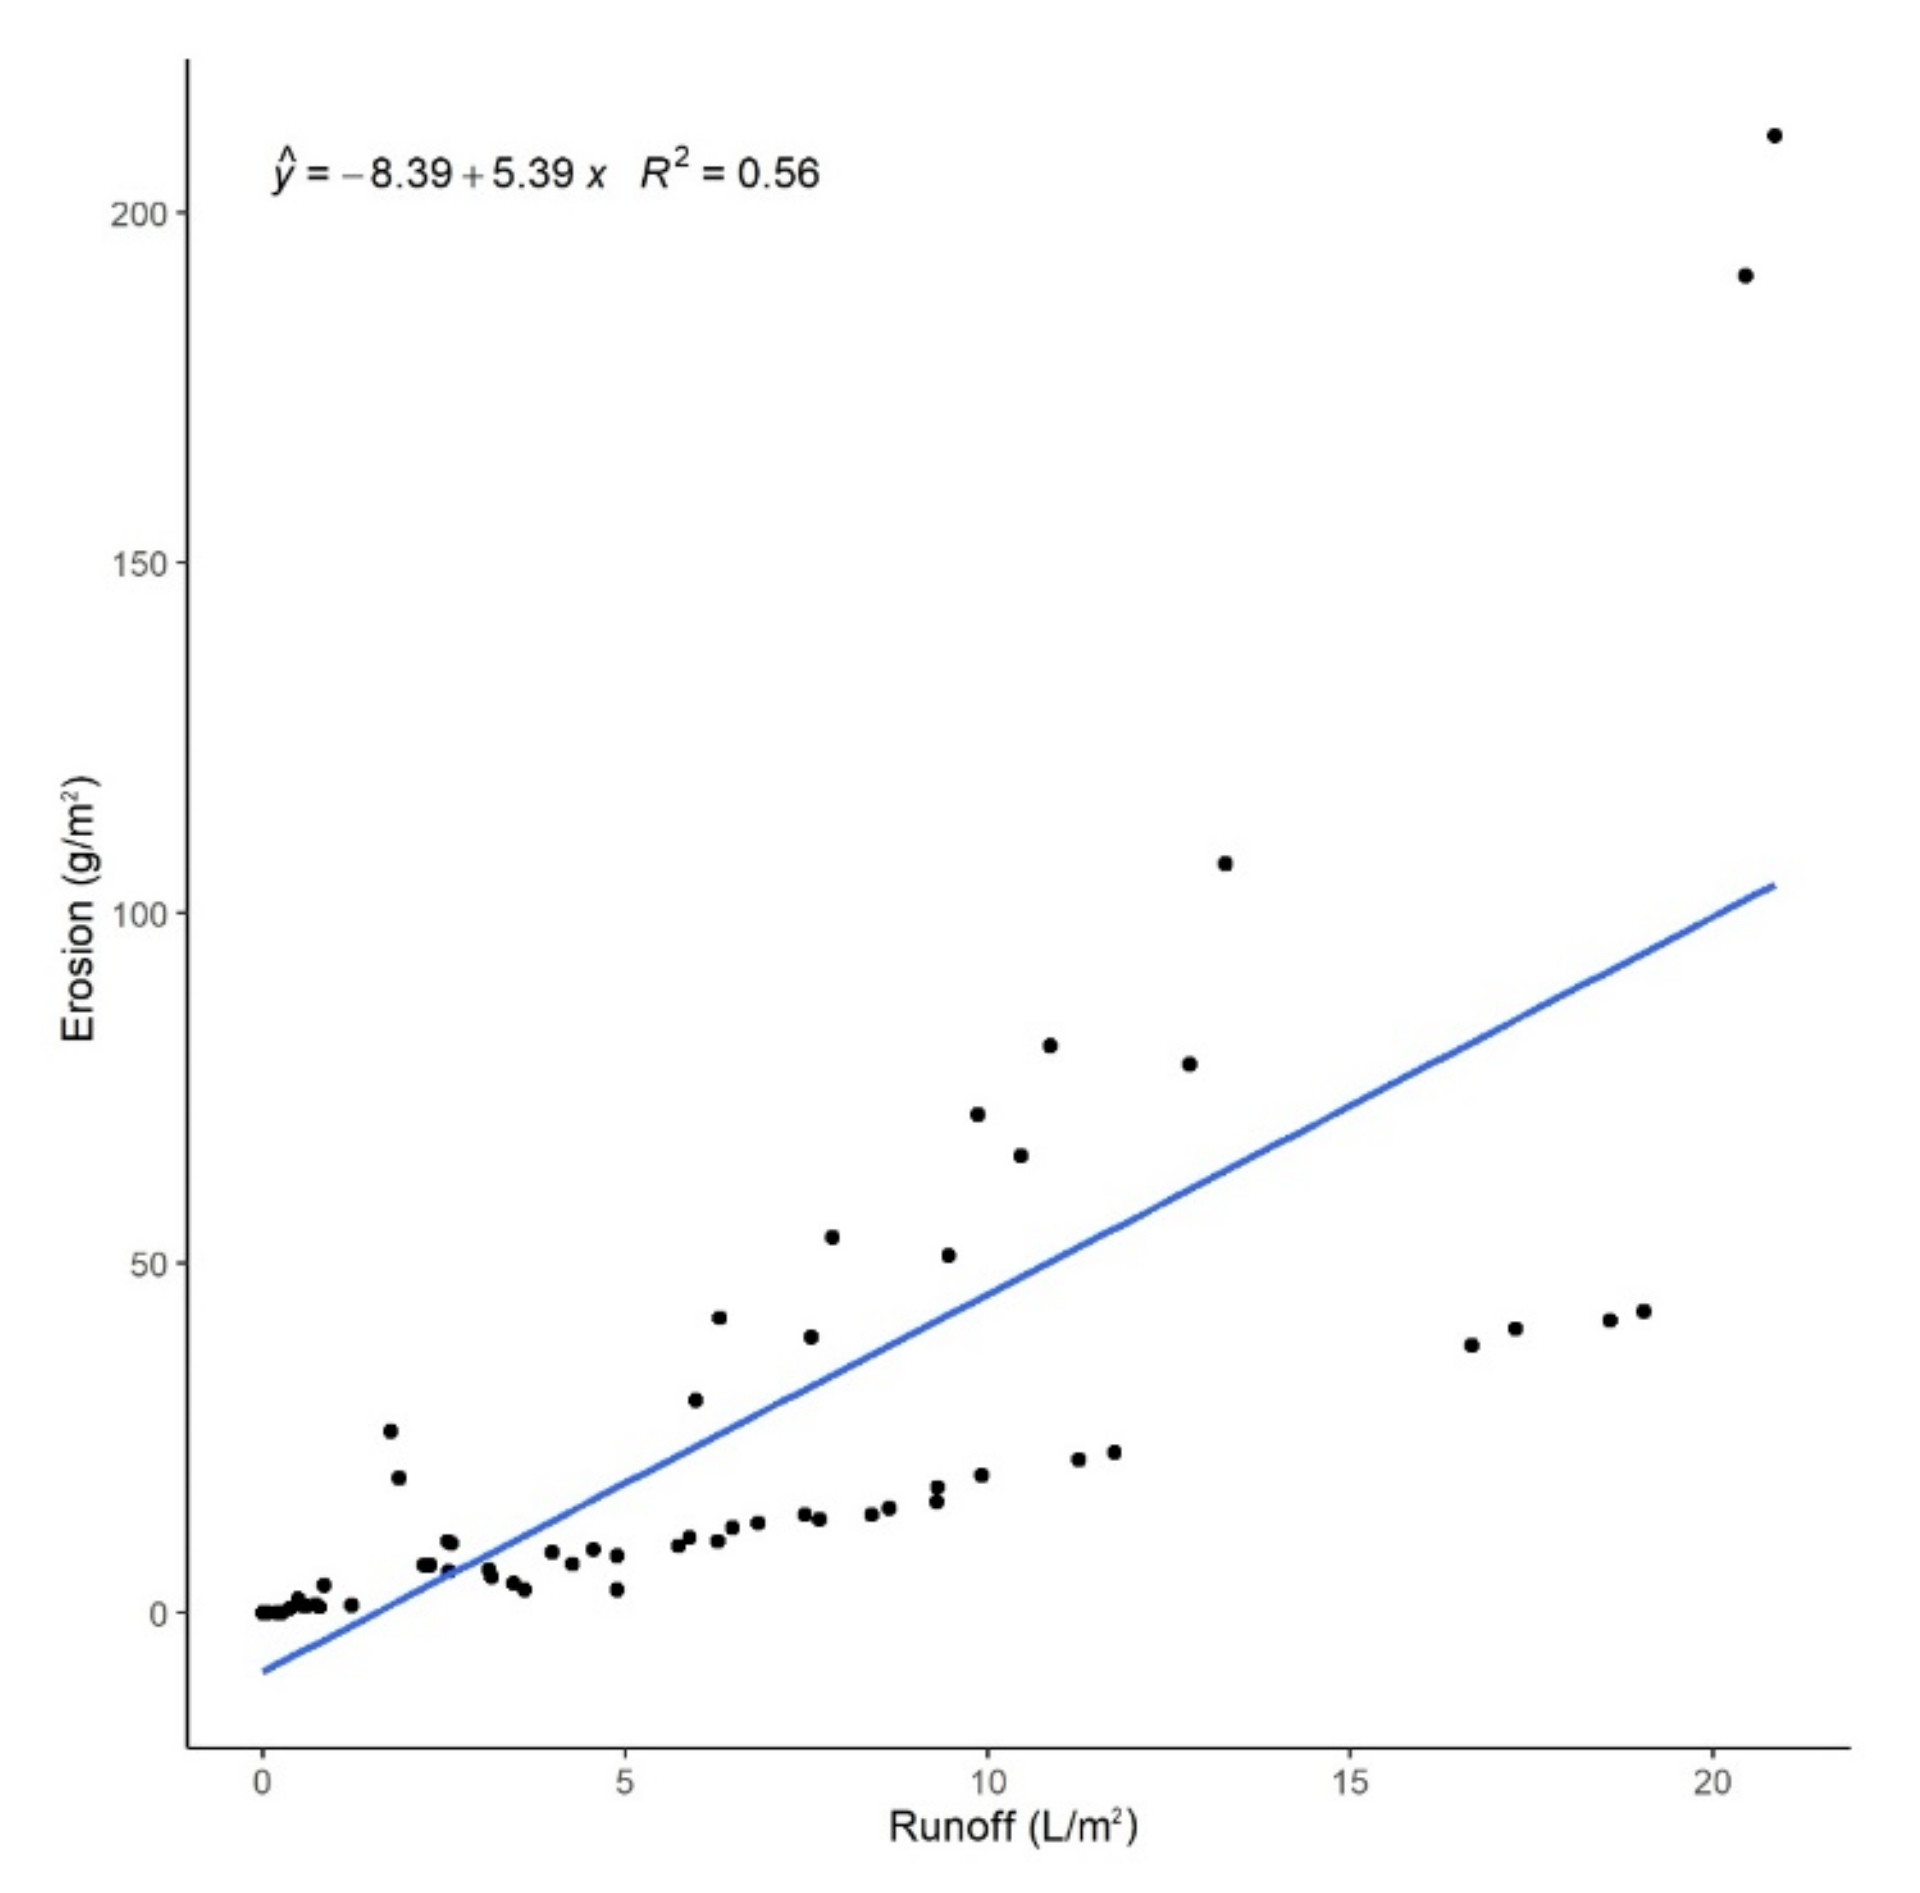
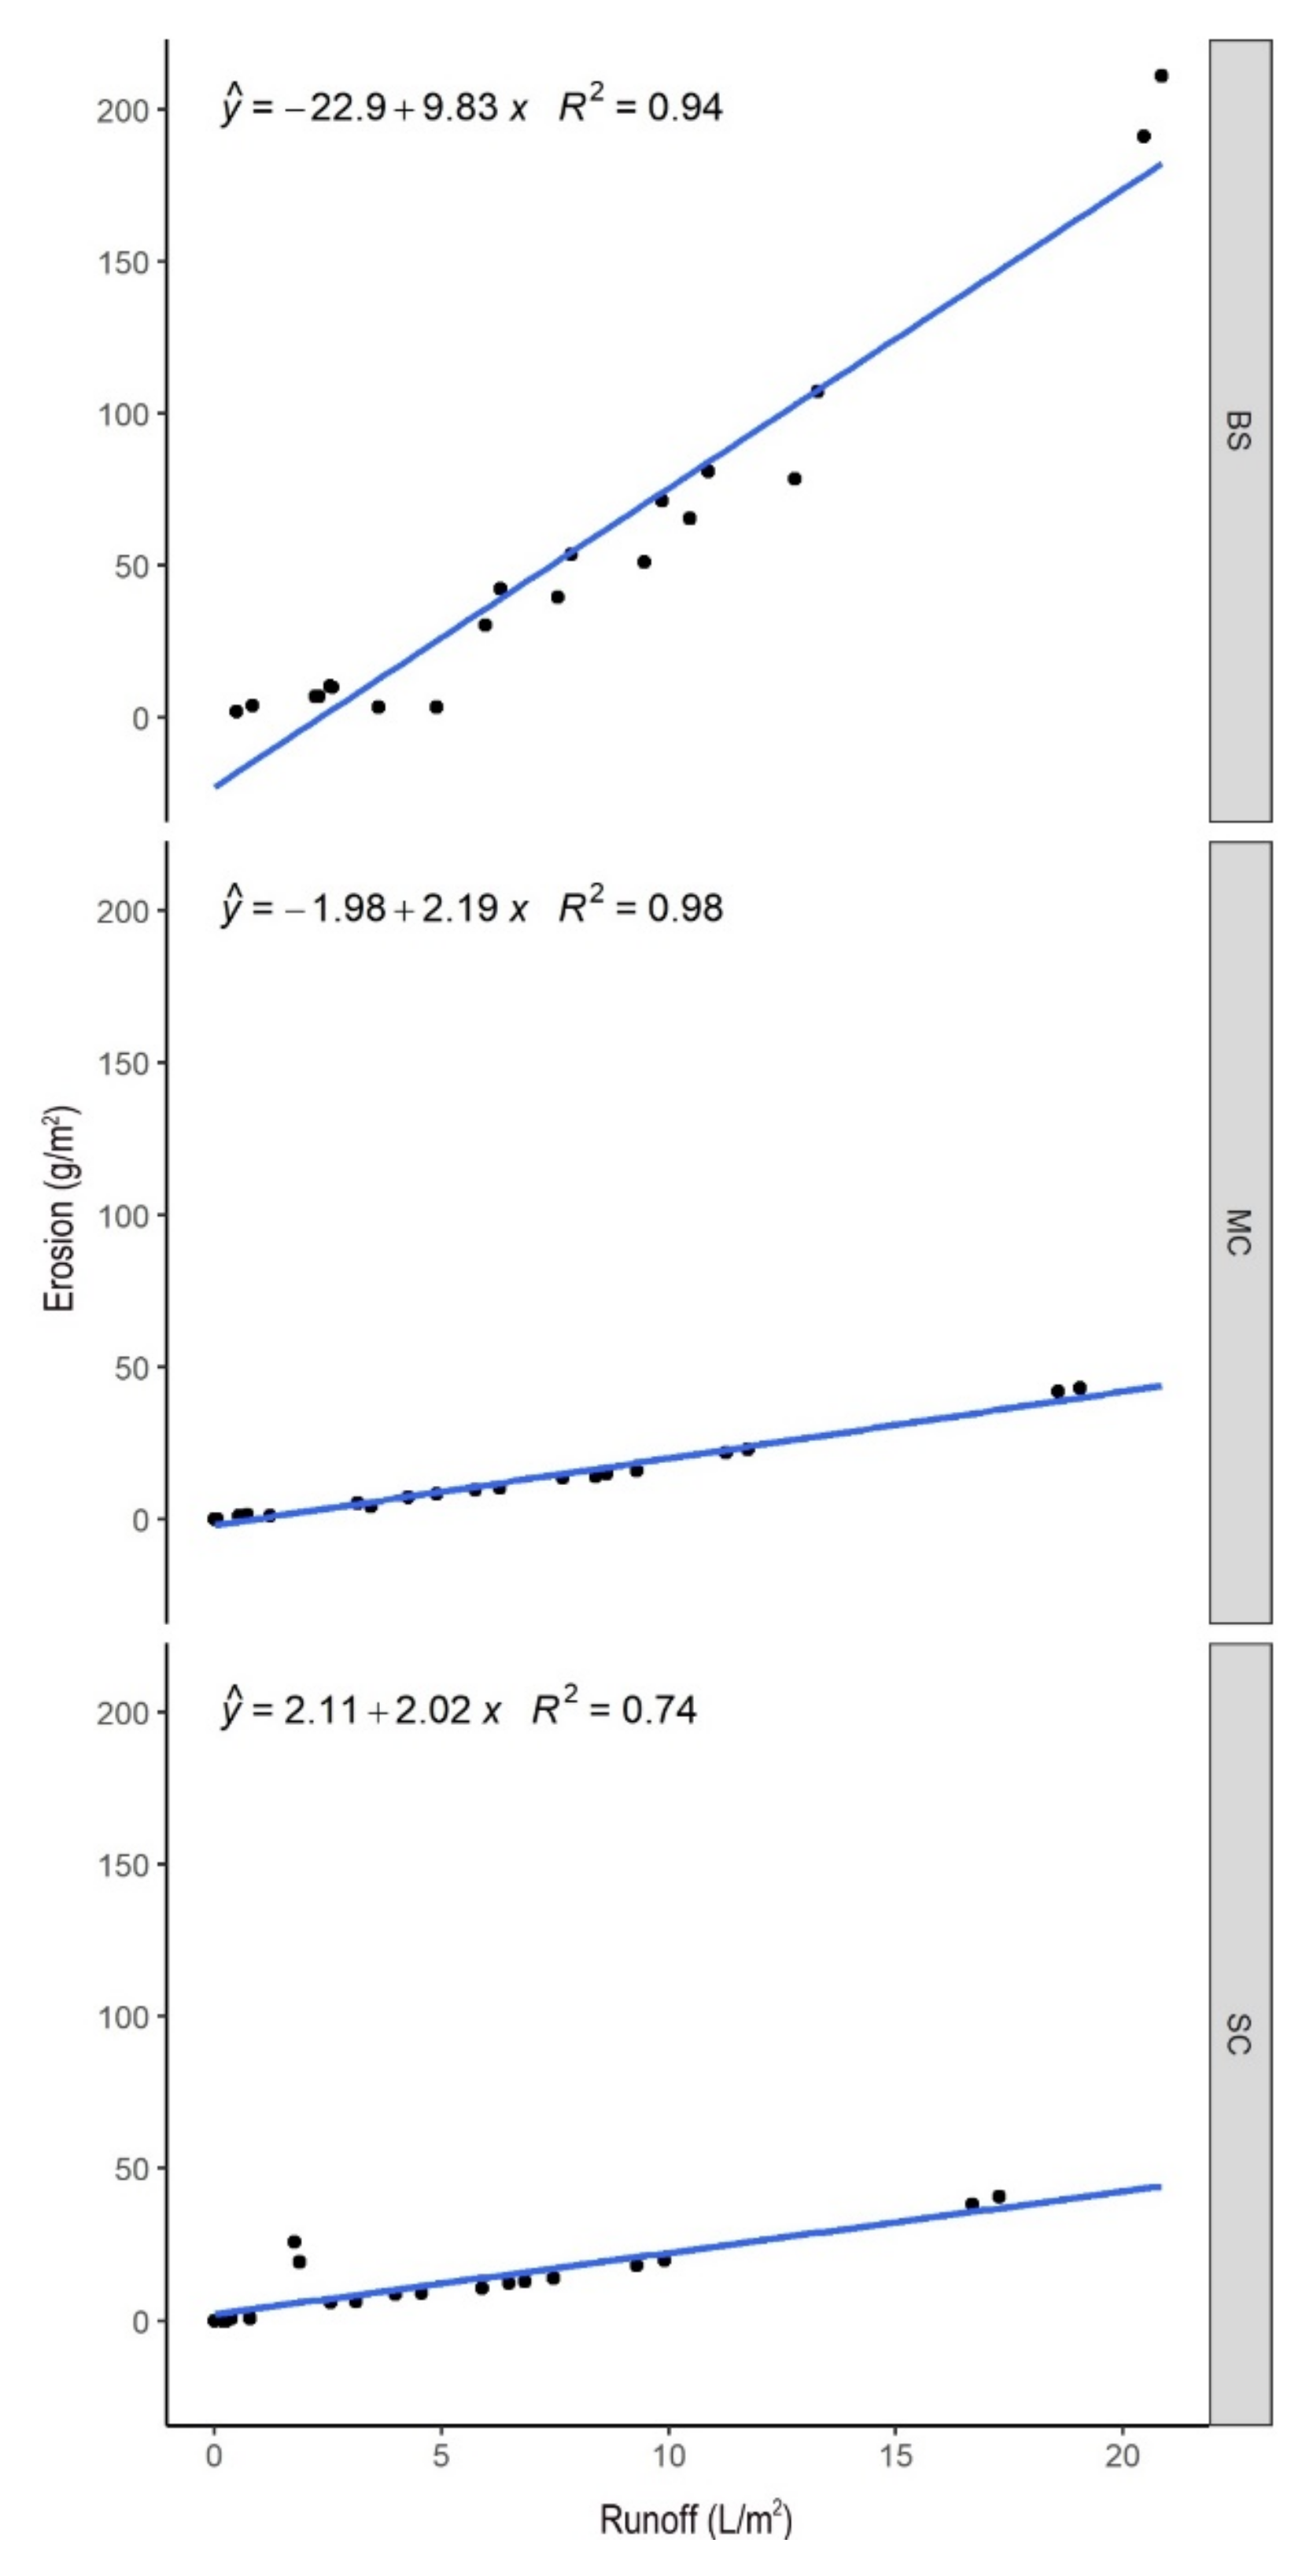
3.1. Relationship of Soil Erosion with the Influencing Factors

Soil erosion rates varied by the soil cover with significant effect (df = 2, F = 8.503, p < 0.001). In particular, erosion values at BS plots were significantly higher than at MC and SC plots as reflected by the p-values (Table 2). Furthermore, non-significant difference has been detected between erosion measured at MC and SC plots. Moreover, BS error values had the largest variance whereas MC and SC plots mean erosion values and standard errors were low (Figure 3). Considering the inclination, the difference between soil erosion in slopes characterized by 4.7% and 10.3% of steepness was not significant (mean difference = 21, df = 1, F = 0.197, p = 0.659).
Our results showed that, when runoff rates were lower than 5 L/m2, there was no distinct effect of soil cover (Figure 4). On the other hand, when runoff rate exceeded 5 L/m2, the influence of soil cover type is noteworthy. For instance, in BS plots an average increase by 0.2 L/m2 of runoff accelerated erosion by 1.97 g/m2, and by 0.44 and 0.40 g/m2 for MC and SC, respectively. Thus, if there was any soil cover, the erosion did not increase relevantly, compared to BS plots. The relationship was strong between the erosion and the runoff in each soil cover type (Figure 5). Notably, soil moisture did not show any significant correlation with the erosion (r = 0.03, p = 0.507); while rainfall intensity was in a strong relation with the runoff (r = 0.95, p < 0.001). Although the regressions performed with the separated data explained at least 74% of variance, the aim was to find a solution involving all data without creating subsets, but in this case the R2 was only 0.54 (p < 0.001). In spite of the significant model, the residuals were large, and the standard error of the estimate was 26.5 L/m2.

3.2. Multivariate Statistical Modelling

The single GLM model provided a result with an adjusted R2 of 0.66 (Table 3). Partial η² indicated the importance of runoff (0.599) and the soil cover (0.132). All the other variables had insignificant (p > 0.05) effect, and minimal effect size (equal and smaller than 0.016, having less contribution in the model than 2%). Omitting all insignificant variables, the new model had an R2 of 0.678 (Table 4). This model revealed that runoff rate had double the importance than soil cover. However, we excluded the rain intensity from the model due to the high level of correlation (r = 0.95; p < 0.001).
The single RFR model explained 75.9% of variance, and the variable importance indicated the runoff rate and the soil cover as the most important variables. Considering the %IncMSE, the importance values indicated the same as the second GLM model involving only the runoff and soil cover (Table 4): runoff had larger importance value than the soil cover. As RF models are not sensitive to multicollinearity, in this model we included the rain intensity, too. However, despite the strong correlation of the rain intensity with the runoff, its importance was the two-third of the runoff. Soil cover types had a relevant effect, according to the IncMSE%. Nonetheless, soil moisture (sm) and slope angle had negligible effect (Figure 6).
In the next step we applied the RCV with 50 models: the results showed that the models had large variance if we use random subsets from the whole dataset. R2 values’ medians of the GLM and RFR models were almost similar (for GLM it was 0.66, and for RFR 0.70), and the GLM’s minimum R2 was 0.53, while it was lower in case of RFR, 0.4 (Figure 7). This would suggest using the GLM, but considering the range of predicted values, it was obvious that RFR performed better than GLM. In fact, the lower quartile was the same (0.62) for both models, but the upper quartile and the maximum was different (0.70 and 0.75 for the GLM, and 0.85 and 0.90 for the RFR). Moreover, both the MAE and the RMSE indicated lower residuals for the RFR model: RFR’s median was 15% lower for RMSE and 32% for MAE than of GLM. Furthermore, in the case of RFR, largest RMSE was lower than the median of the GLM. The better performance of RFR was confirmed by the predicted values, too. Bland–Altman diagrams pointed to the main characteristics of the predictions, i.e., RFR’s prediction error’s standard deviation was 37.2 (indicated with 2 × SD in Figure 8), while in case of GLM it was 108.2 (Figure 9).

4. Discussion

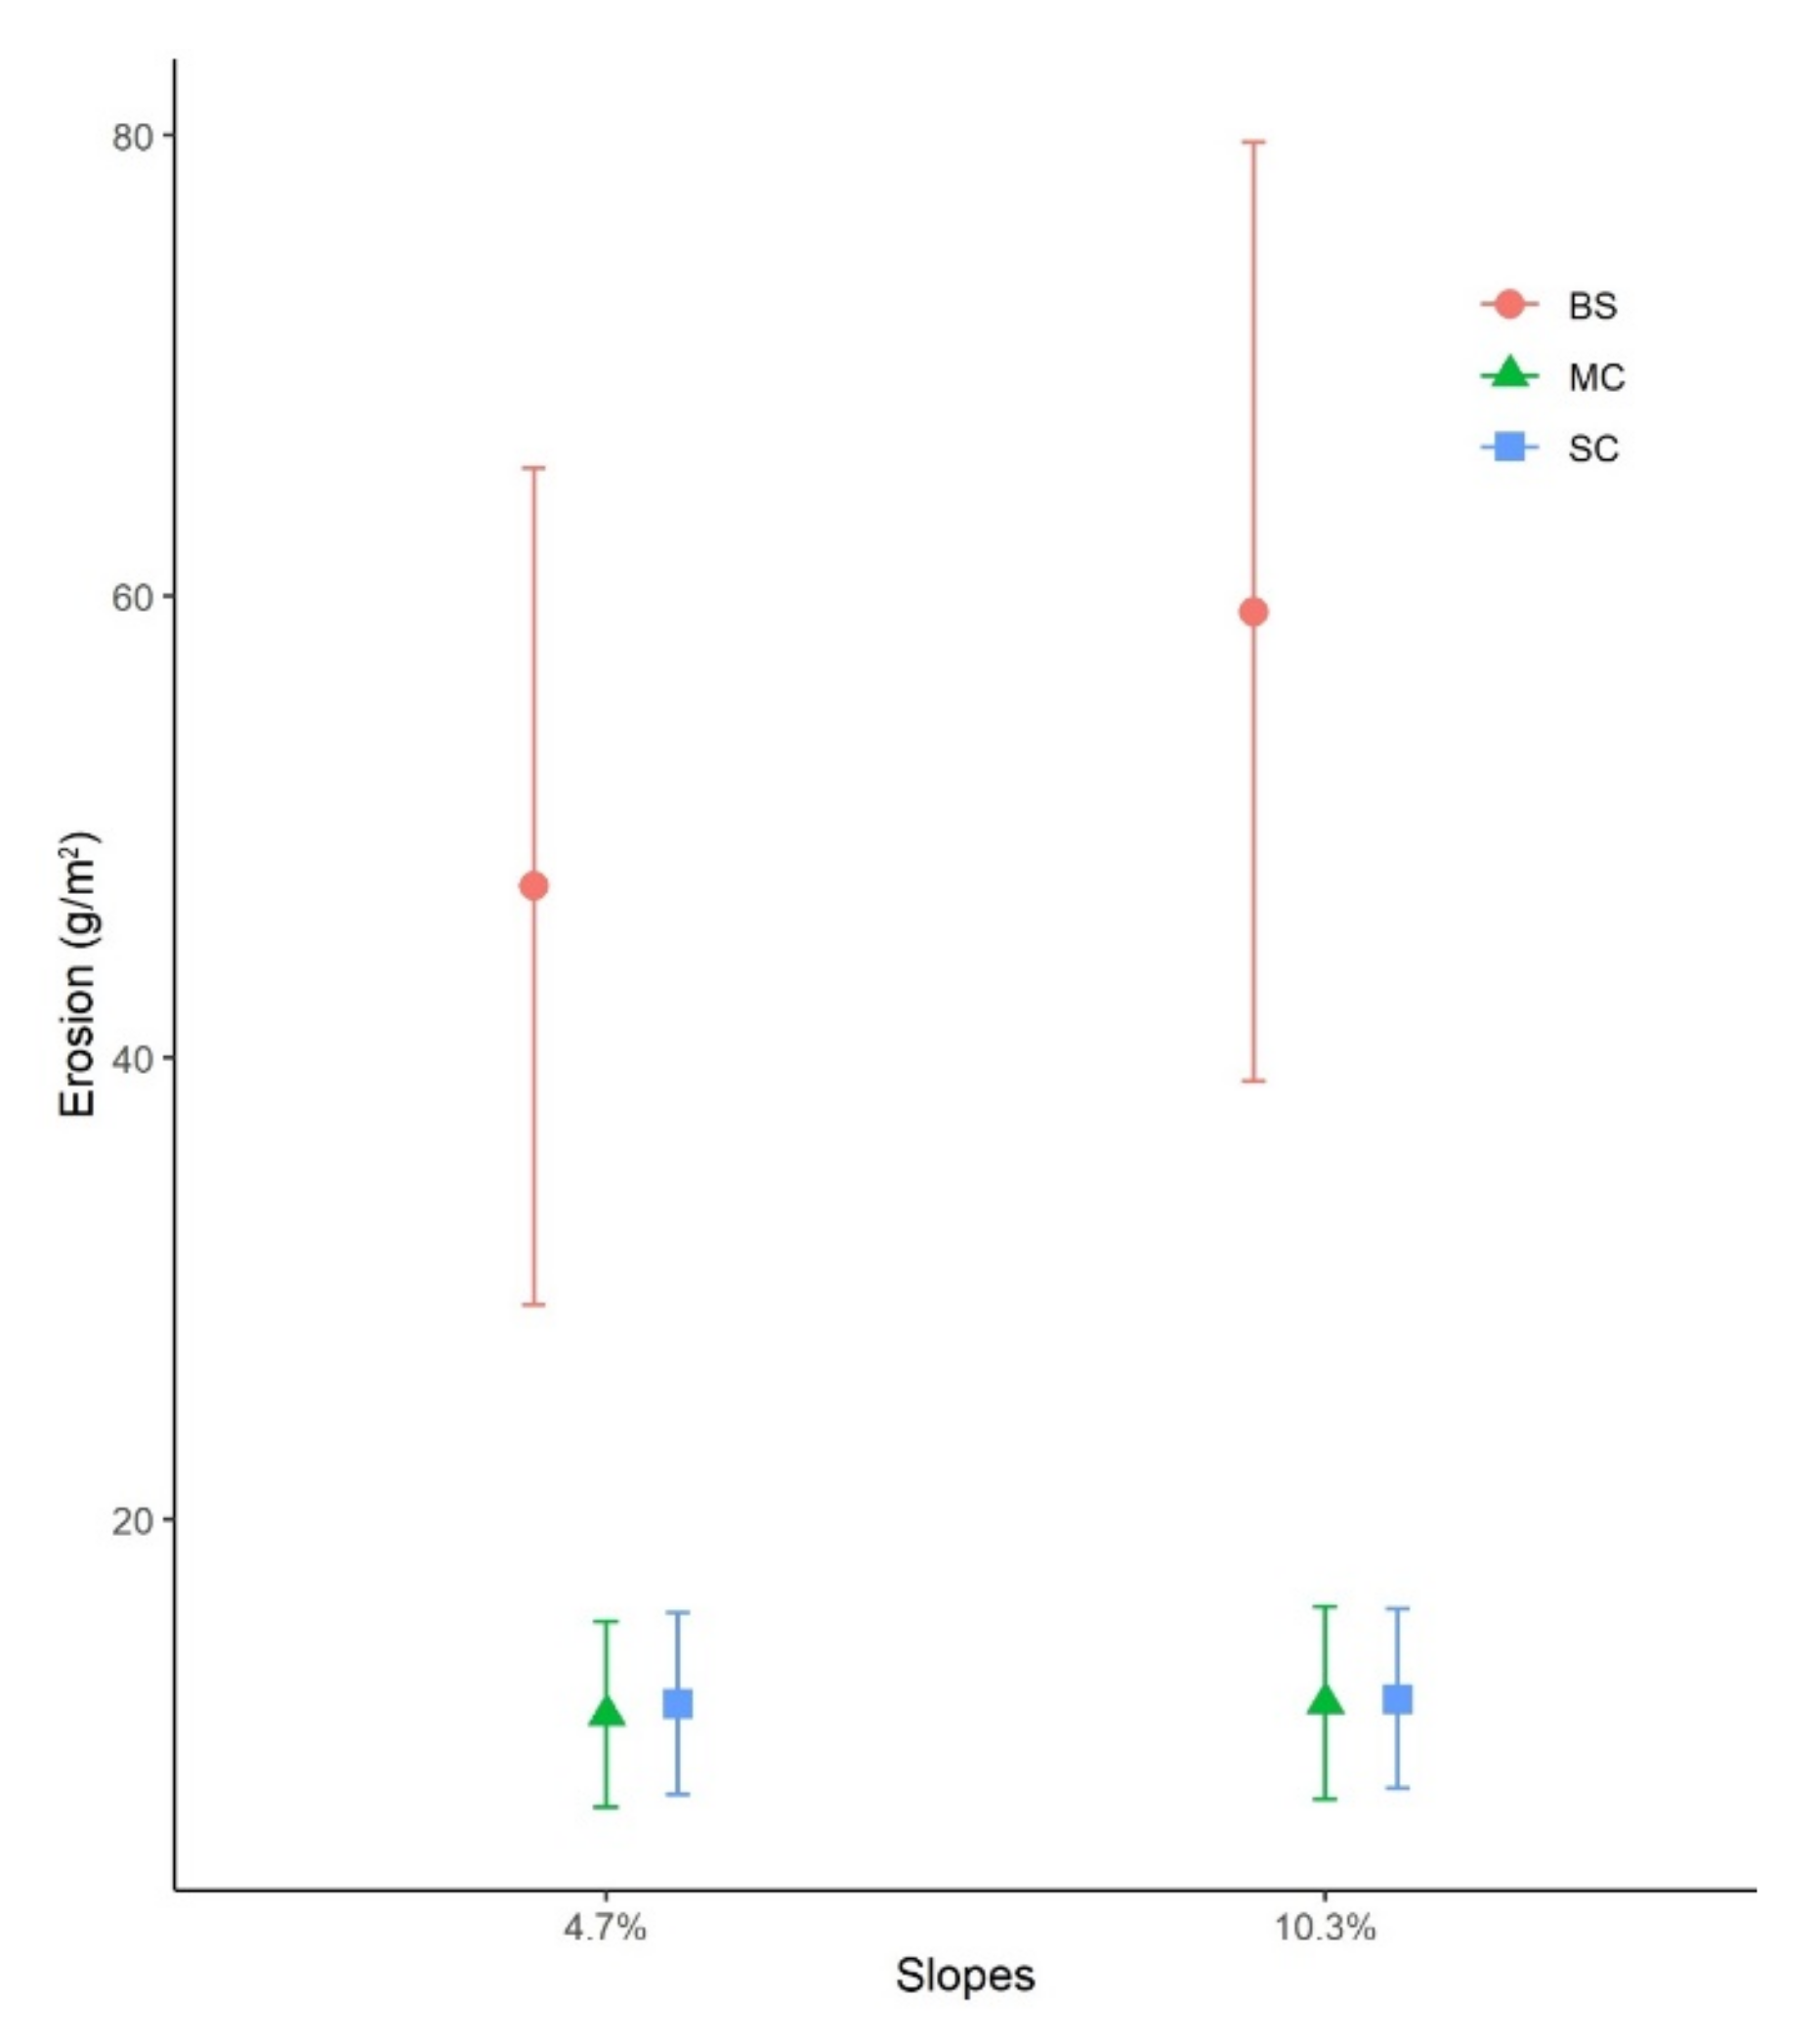
4.1. Influence of Soil Cover and Management on Soil Erosion and Runoff

Soil erosion is one of the major threats to sustainable agricultural systems in the Mediterranean part of Syria (i.e., coastal region and mountains). In this research, soil erosion and runoff were recorded after each rainy storm in two slopes with different steepness (4.7%, and 10.3%) under three different treatments (BS; MC, SC). Despite the existing large variation of natural rainfall intensity, our results indicated that higher erosion rate as well as runoff were recorded in BS followed by MC, then SC.
In the study area, erosion and runoff varied by the soil cover. BS plots were the most affected by soil erosion phenomena; which could be explained by the fact that in the rainy seasons between October and February the soil remains bare. Unprotected soil is directly impacted by raindrop forces which deteriorated aggregate stability, leaving soil pores quickly blocked by fine particles (silt, clay), causing soil sealing and crusting, lessening soil infiltration and raising the susceptibility to soil erosion [73,74,75,76,77]. By contrast, land cover in both MS and SC minimize the direct impact of rainy storms, subsequently, less soil erosion and runoff were noticed. These results coincided with other studies conducted in different parts of the Mediterranean basin [78,79,80,81,82,83]. However, no statistical difference has been detected between MC and SC plots in terms of soil erosion.
Precipitation characteristics (i.e., duration, length, intensity) directly impact runoff and subsequently soil erosion [82]; where a positive correlation between activated runoff and soil erosion, especially in the semi-arid region [74]. Our results revealed a positive significant correlation between soil erosion and runoff under different land cover (Figure 4), where highly observed rainfall intensity produced higher runoff whether in BS or other plots. Increasing rainfall erosivity accelerates soil sealing and crusting, minimizing infiltration capacity, and enhancing runoff generation and mechanics of soil erosion [84,85,86] recorded a high correlation between soil erosion and runoff (R2 = 0.90) in the western Mediterranean basin (eastern Spain). Moreover, Hortonian runoff was observed in the studied plots especially in BS plots, when rainfall intensity was high (31 mm/30 min) and greater than soil infiltration capacity leading to high runoff and erosion rate. We can highlight that the first two rainy storms of the year (i.e., 3 October 2013; 11 November 2013) induced the second highest observed surface runoff and soil erosion rate in both slopes. Furthermore, these storm events occurred after long dry periods from May to September with high intensity (>16 mm/30 min) resulting in high erosion rates. Notably, more than 40% of total soil erosion were recorded in the first three events (i.e., 10 March 2013; 11 November 2013; 12 November 2013). Several authors stressed the drastic impact of early rainstorms after drought periods in the Mediterranean region on land degradation [87,88,89], while others conclude that few rainy storms were responsible for the larger proportion of soil erosion [90,91].
Many other factors such as low soil organic matter, high content of fine particles (i.e., clay, silt), and high bulk density (1.3 g/cm3) provided favorable conditions for runoff initiation and erosion acceleration, which could be observed not only in Syria but in all the Mediterranean region [92,93,94]. Similarly, Cerdà et al. [75] pointed out that high soil bulk density is a key factor for the fast ponding and runoff initiation in the dry Mediterranean soils.

4.2. Impact of Different Soil Management Techniques on Soil Erosion and Runoff

In addition to high-intensity in short-duration rainfalls, shallow soil, slope gradient and mismanagement of cultivated lands are common and crucial factors of erosion in the whole Mediterranean region; thus, conservation management practices are important tools and planning. Under the Mediterranean part of Syria, SC could be an effective tool for minimizing both overland flow (i.e., runoff) and soil loss. Unlike other soil conservation techniques, SC technology is inexpensive and effective in minimizing the erosion rate. However, herbaceous plant cover may compete with the main crop due to water and nutrient uptake, which may cause a negative impact on crop production [95,96] keeping farmers away from using it. As the MS technique can hardly be applied in large areas, we used it in this research to provide an overview of the impact of soil mulching on soil water erosion; assuming MS will have the same behavior of mulching materials. Our results highlighted that soil mulching significantly reduced total soil erosion by 76.6% and 80% in the gentle slope (4.7%) and steeper slope (10.3%), respectively. Thus, soil mulching by straw (barley; wheat) or other organic wastes from the agricultural production could be a proper solution for combating soil erosion [97]. A growing body of literature has demonstrated the importance of proper soil management/mulching for minimizing soil erosion by water [98,99,100,101,102,103,104,105]. Rahma et al. [106] illustrated that soil mulching is an effective way of conserving water and soil in the Loess Plateau (China) because of reduction of surface runoff as well as protecting soil aggregates from the direct impact of raindrops. Similarly, Keesstra et al. [93] demonstrated that runoff can be reduced from 65.6% to 50.7% by using straw mulching in citrus orchards. However, Lucas-Borja et al. [107] found that soil mulching had no effect on runoff, while it reduced soil erosion in forest fires-affected landscapes (Spain). Nevertheless, MC, SC techniques could serve as soil conservation practice providing a promising tool to be used under Syrian agroecosystem.

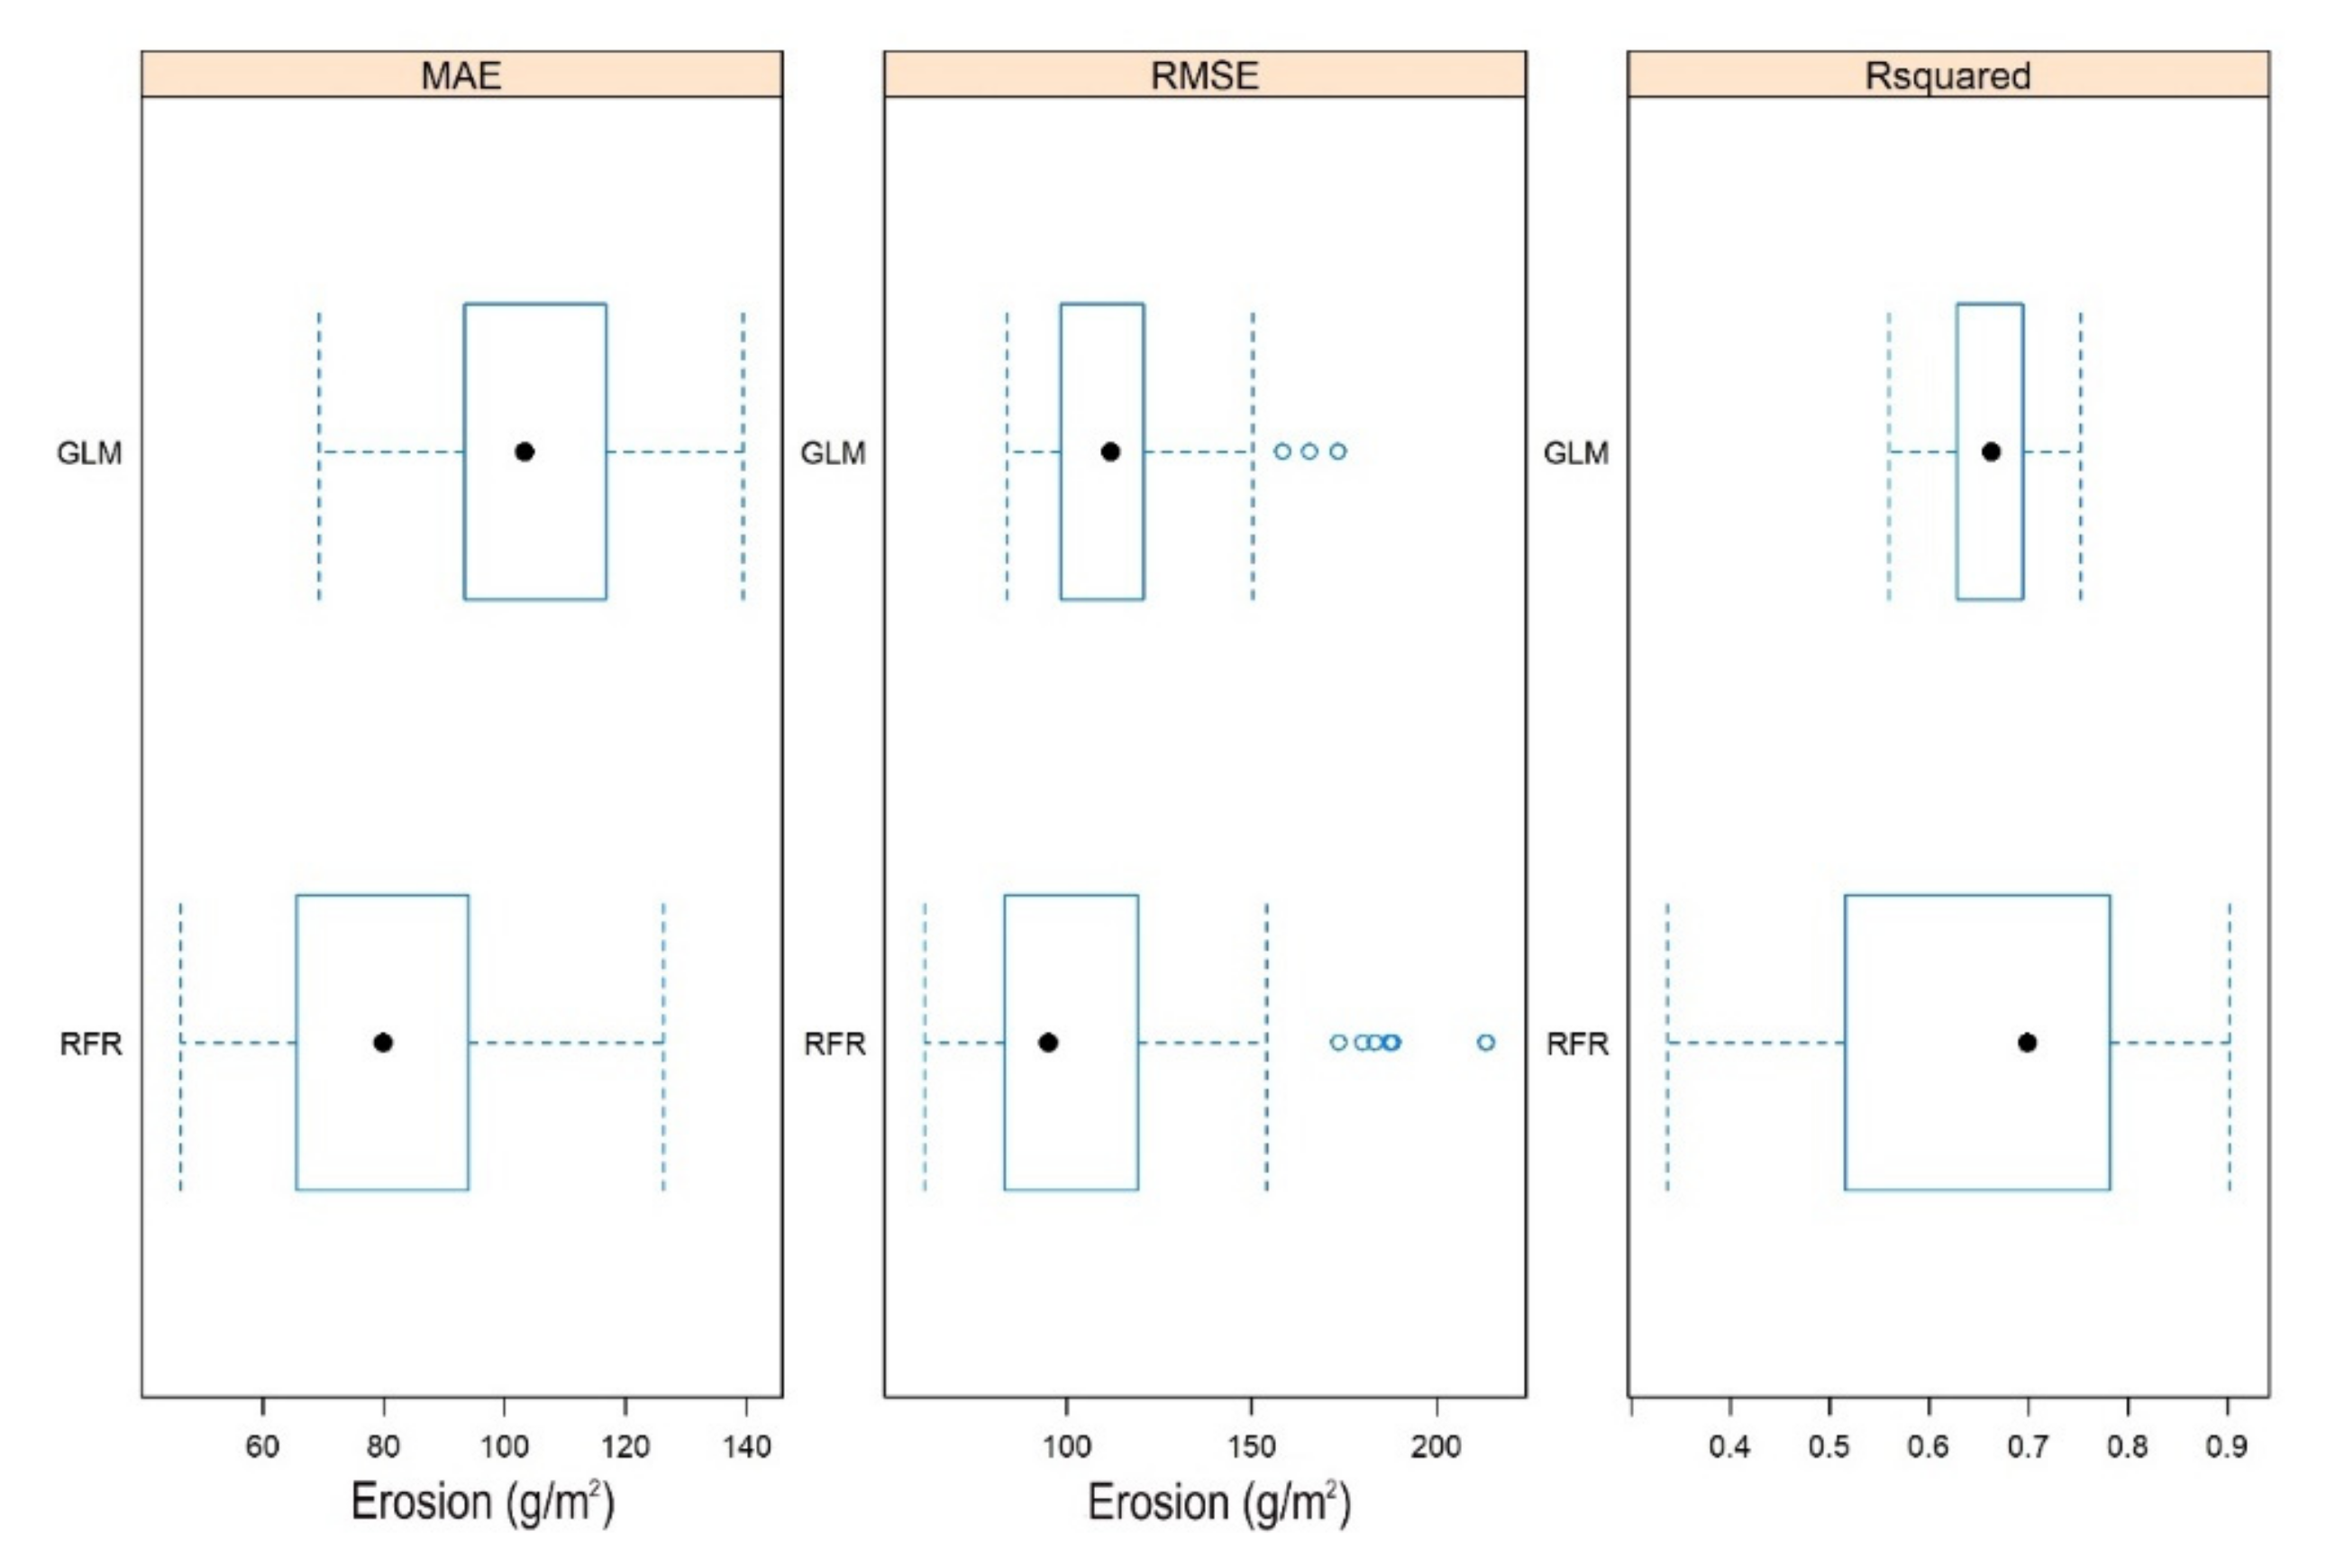
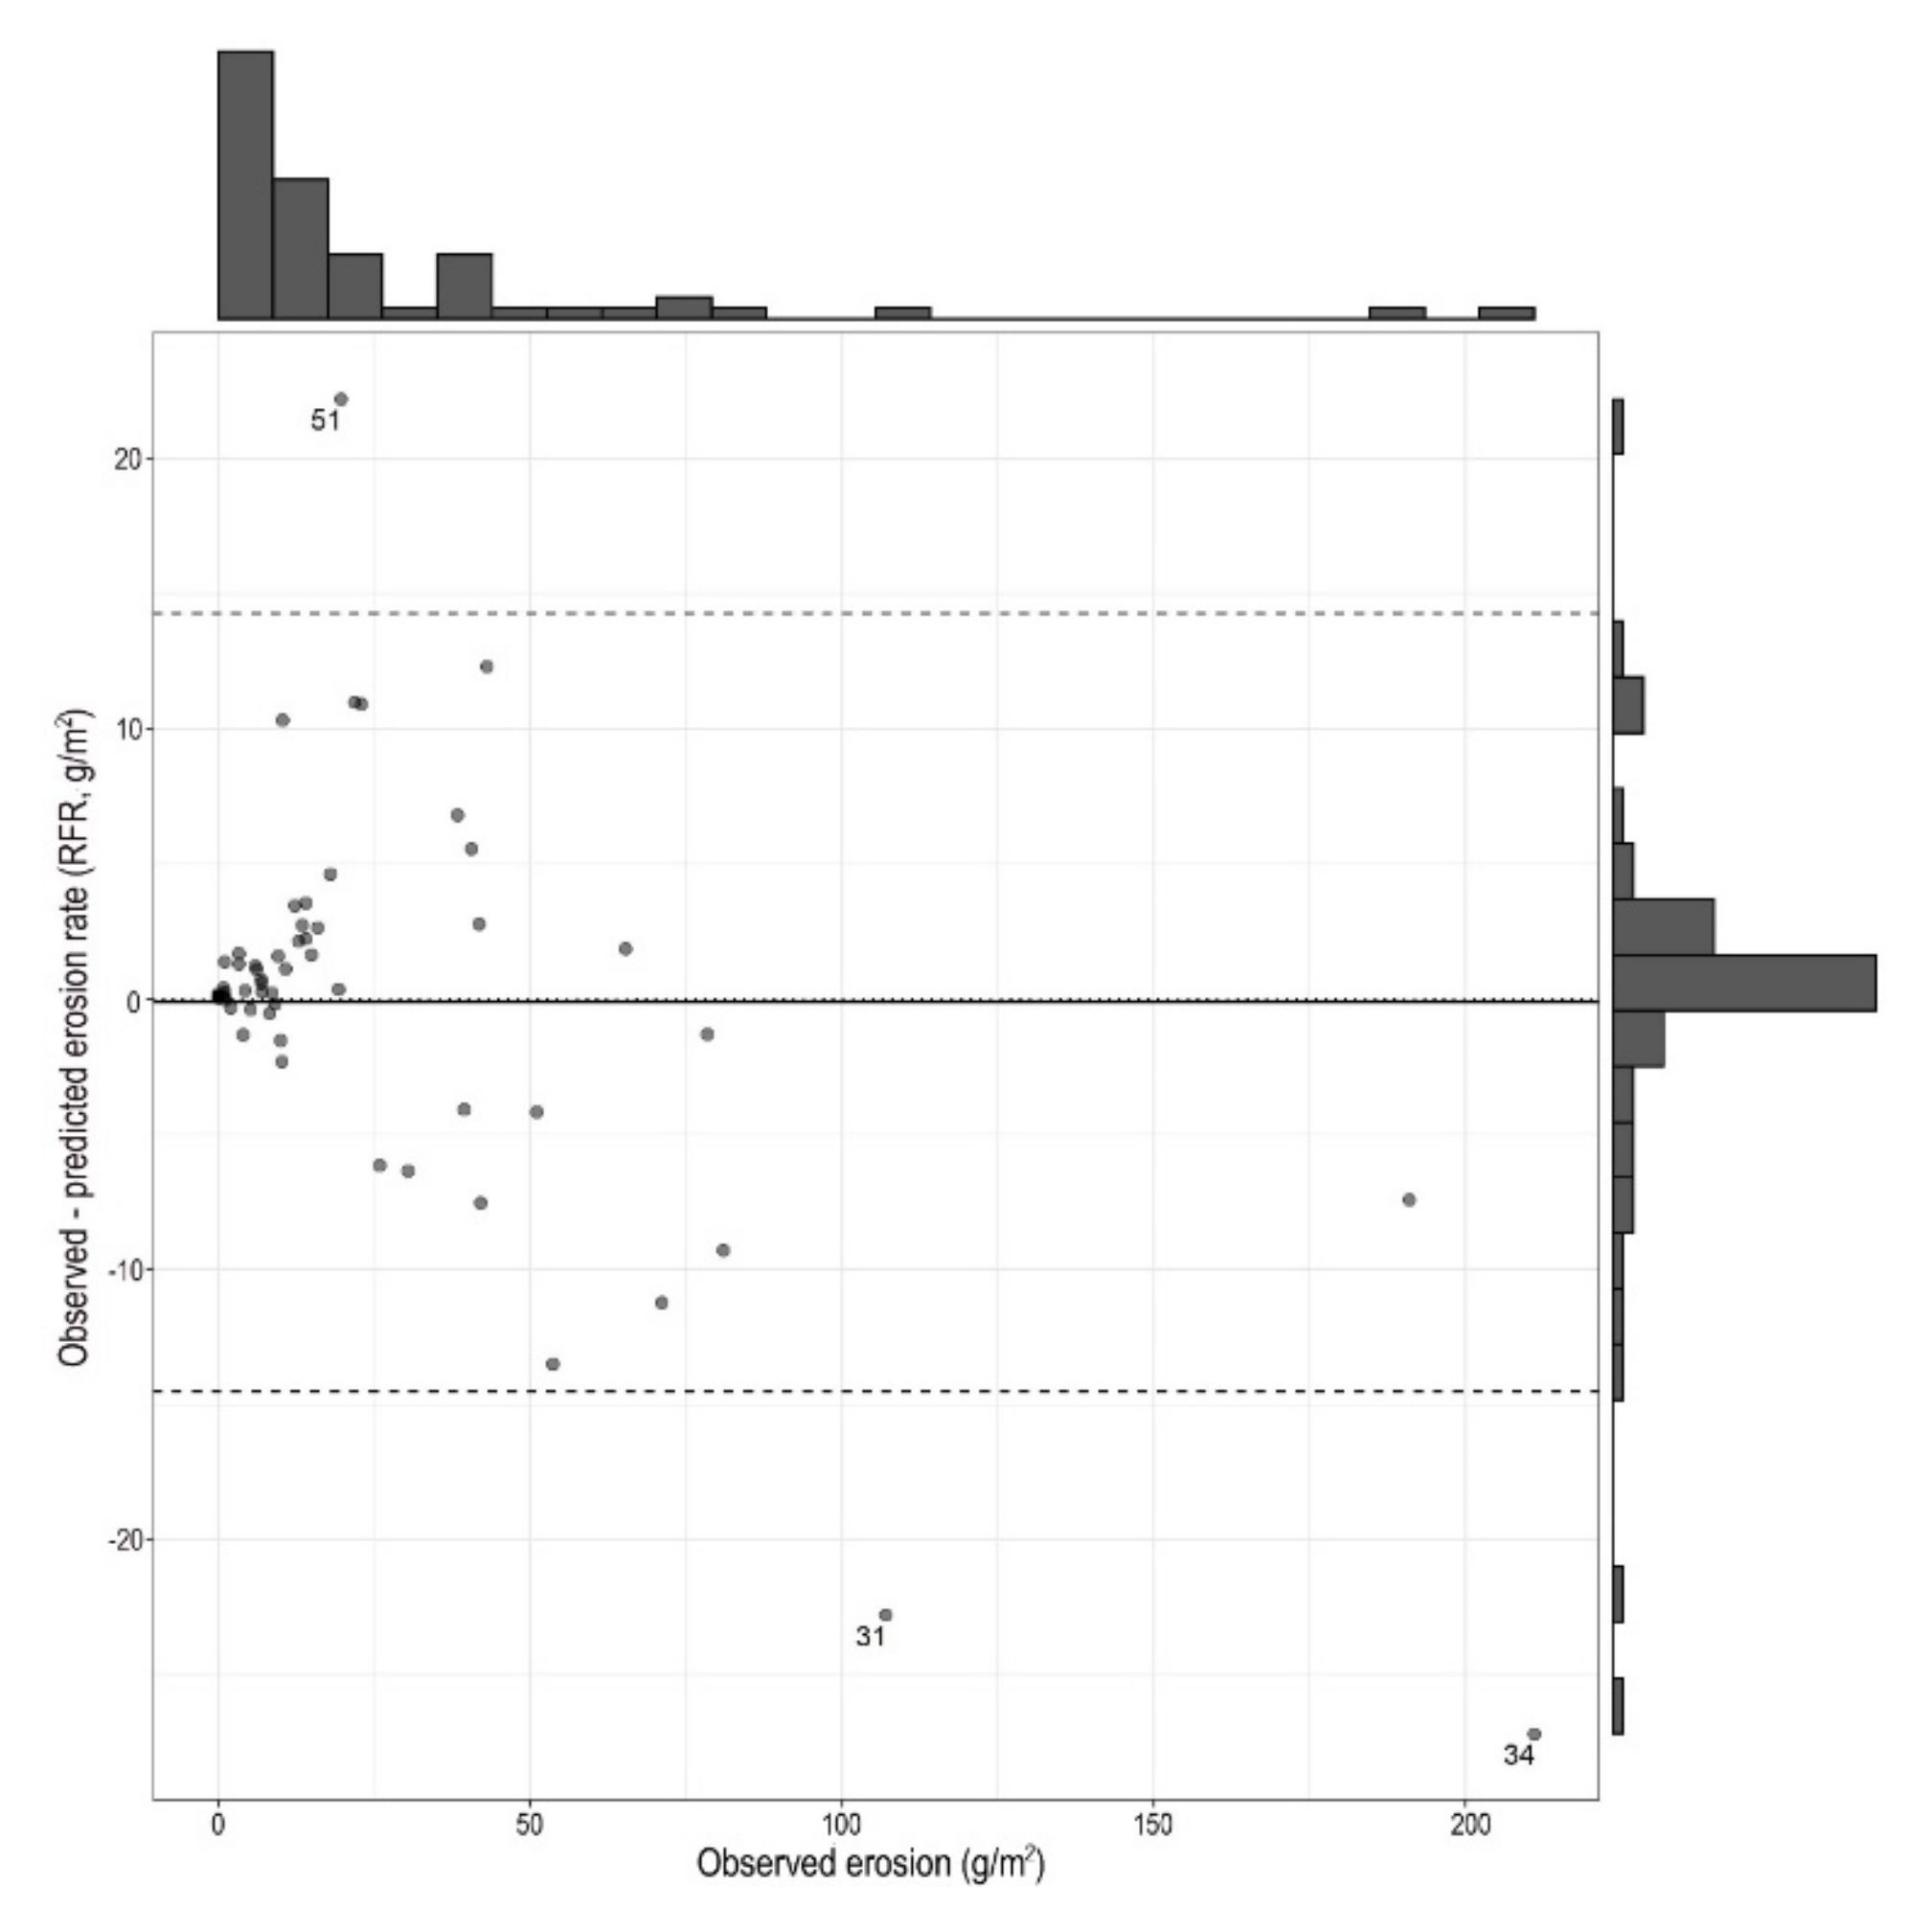
4.3. Performance of General Linear Model (GLM) and Random Forest Regression (RFR) in the Study Area

Application of our proposed GLM and RFR models indicates that RFR is more accurate and reliable in predicting soil erosion under 50 runs. Remarkably, when runoff exceeded 5 L/m2, erosion rate was highly influenced by the soil cover types; for example an increase by 0.2 L/m2 of runoff (above 5 L/m2) resulting in an increase by 1.97 g/plot of soil erosion in bar soil plots (BS), 0.44 g/m2 and 0.40 g/m2 erosion in the case of MC and SC, respectively.
Linear regression analysis is the most popular technique to quantify the results, but our analysis calls attention to the uncertainty of using only one model: the R2 of the single GLM model (Table 3) was 0.7, but the 50 repetition of the RCV showed that it varies between 0.53 and 0.75, depending on the input data. Important to note that the two R2 is not the same: in Table 3 and Table 4 it is an adjusted R2 which was corrected with number of predictors, and in RCV we report the square of the correlation of the modelled and observed values (pseudo R2); i.e., the latest is more reliable measure as the models are applied on independent data. Nevertheless, both R2 are appropriate to show the model fit.
RFR never provides the same outcome (unless the randomizations are fixed e.g., in R software) as the algorithm works with hundreds of bootstrapped samples and each randomization results in a new model. We revealed that R2 alone is not meaningful enough because RFR’s R2-values were worse than GLM’s but both MAE and RMSE indicated lower errors: minimum was better with 38% for RFR than GLM for both error metrics. Model performance was better with the fine-tuned RFR model, which is visually presented in the Bland-Altman plots (Figure 8 and Figure 9). In case of GLM (Figure 9), we labelled the cases when exceeded the RFR model’s 2 × SD range, which indicated that RFR’s predicted values were more accurate (in that case prediction error was larger than 2 × SD only in 3 cases). However, the observed and modelled values were not statistically different between the RFR and GLM predicted values according to the Wilcoxon paired test (W = 954, z-score = 0.287, pMC = 0.77). This is the case when hypothesis testing is biased by the large variance of one group of the factor: GLM’s variance was too large and completely overlapped with the small variance of RFR’s interquartile range; in case of RFR 50% of the differences related to the reference had fallen between −8.43 and 5.35, while the same range was between −74.61 and 57.45 for GLM (Figure 10).

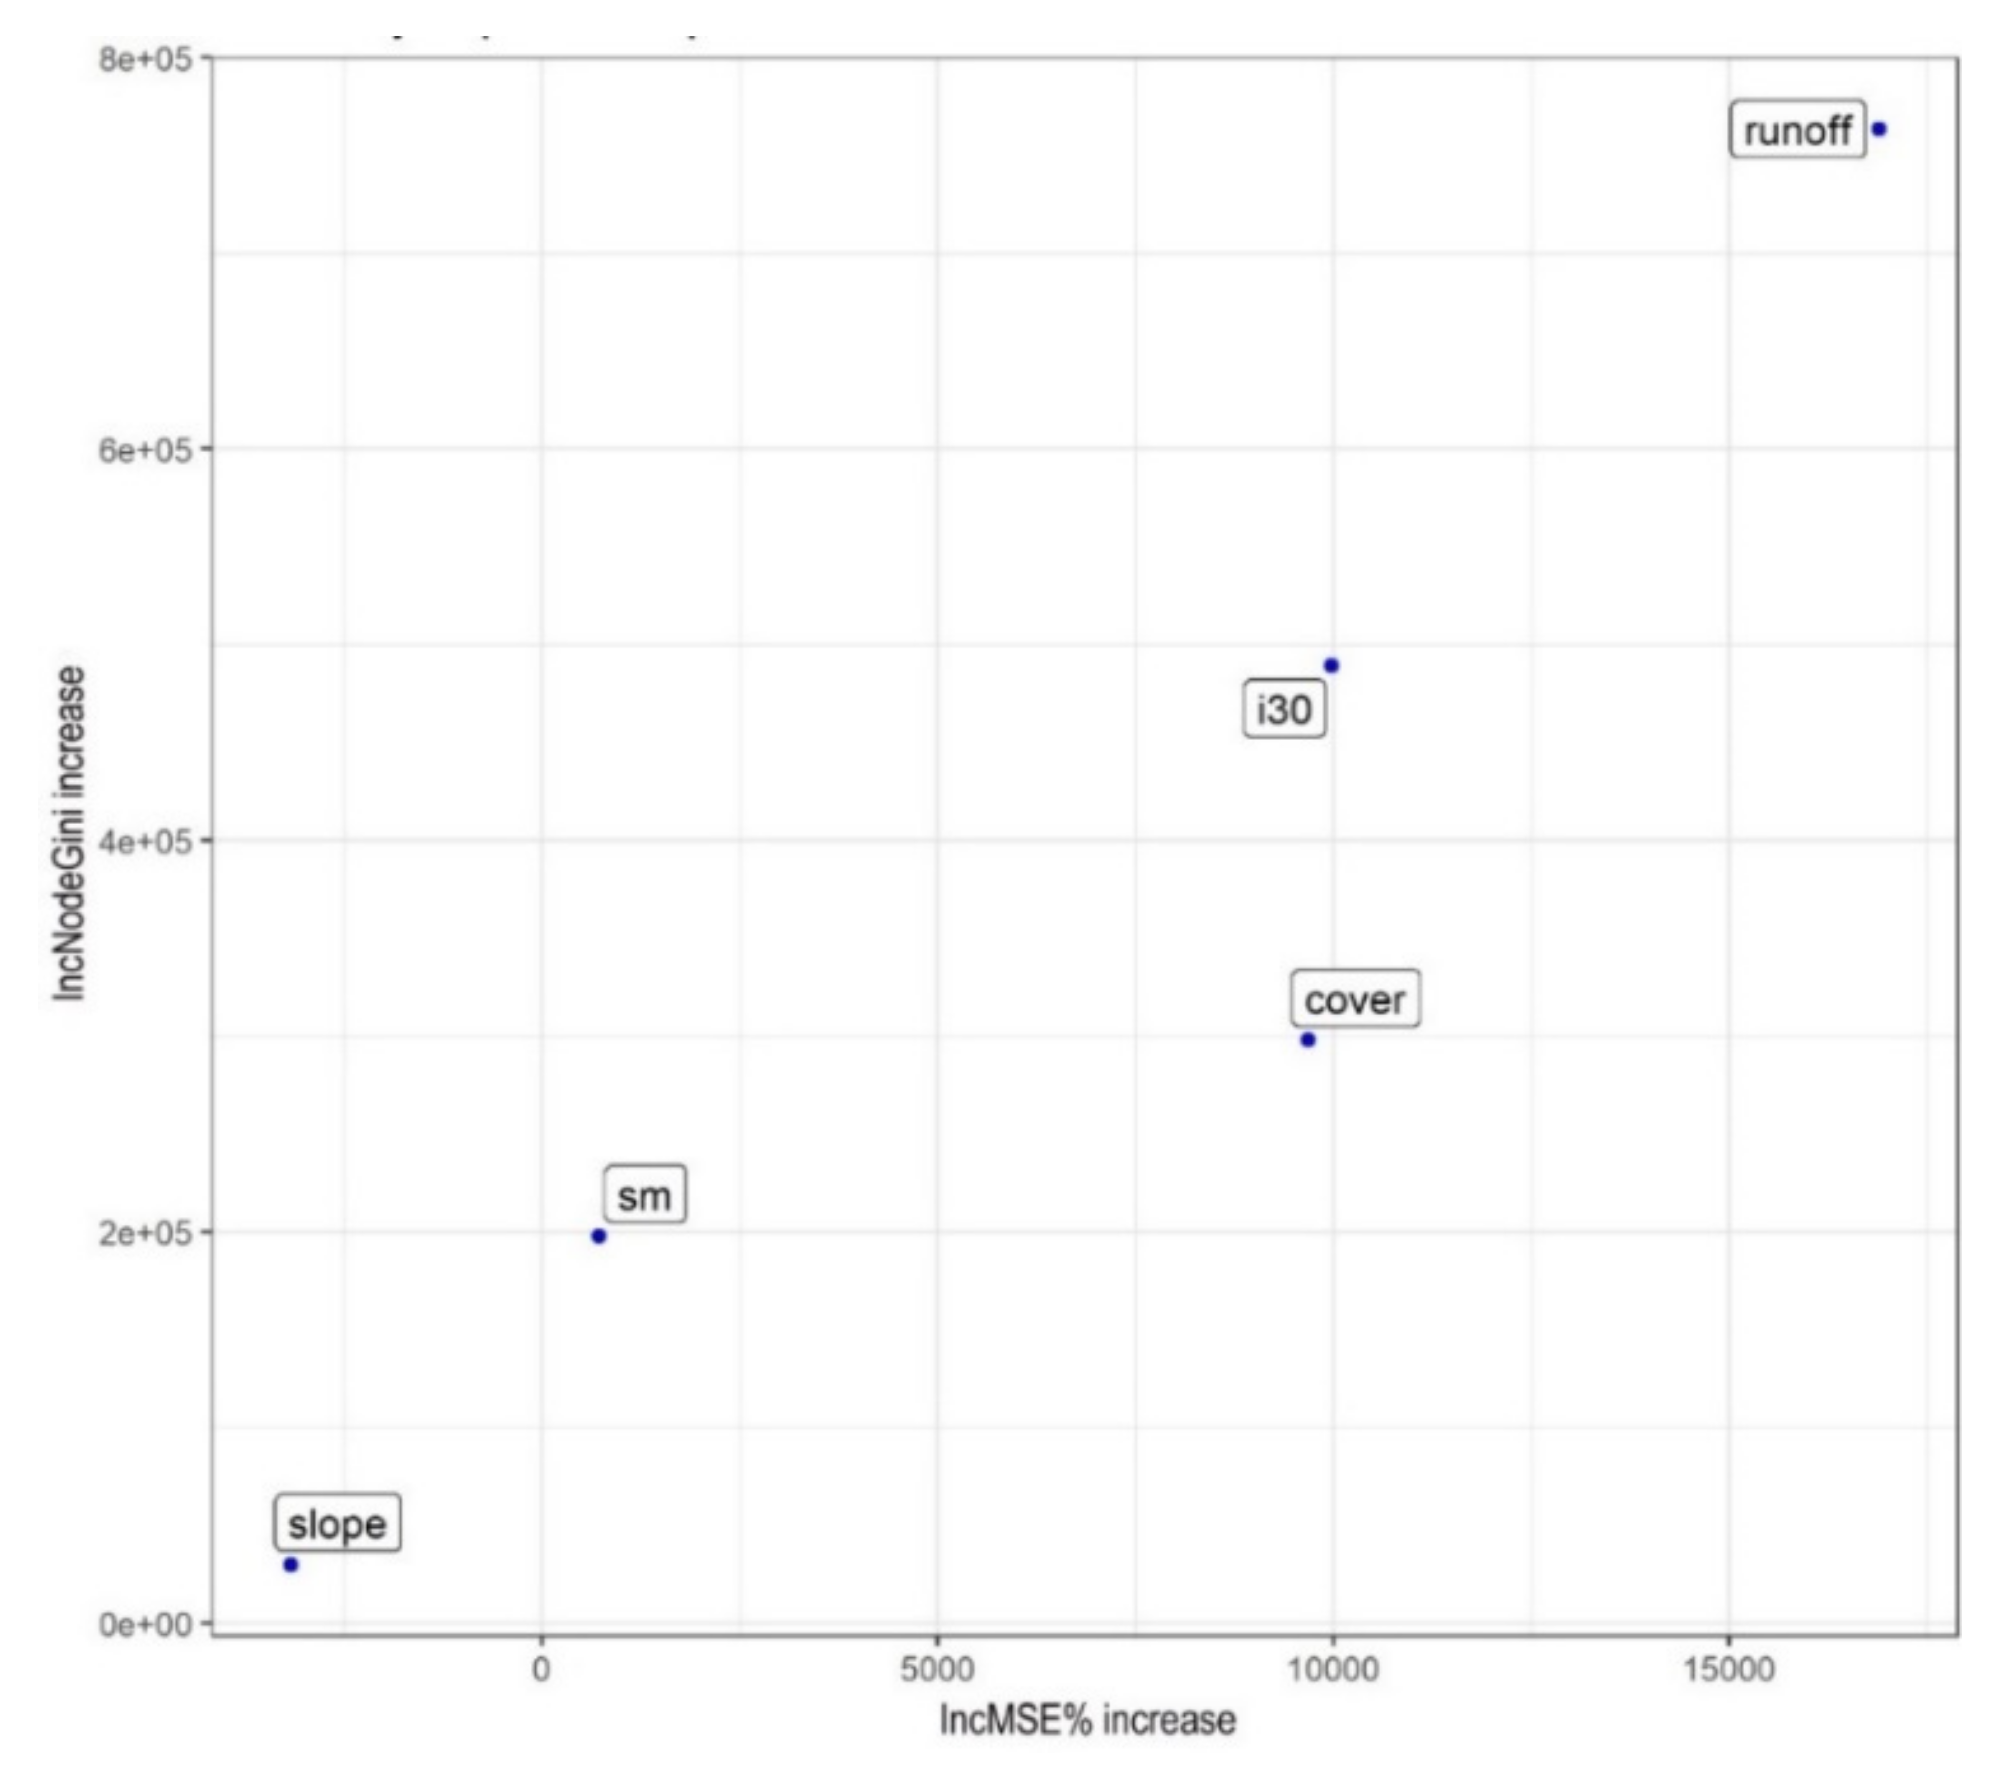
4.4. Importance of Different Variables in Soil Erosion

Importance of the involved predictors of erosion were similar in both models: runoff was the most important and the rain intensity (i30) was the next variable. Although i30 was in high correlation (r = 0.95, p < 0.001) with the runoff, the importance of runoff was higher in the RFR model (due to avoid multicollinearity we omitted i30 from the GLM). Soil cover was also important, but, in this research, soil moisture and the slope type (i.e., 4.7% or 10.3%) was not relevant. The relevance of soil moisture and slope angle were reported in several studies [108,109,110], but slopes were usually steeper (larger than 10°) and the difference was also ~10° among the different slope types. Moreover, smaller importance can be attributed to the local characteristics: other influencing factors, such as i30 and runoff in the combination of three types of soil cover proved to be more important than the slopes. We repeated the RFR model without the runoff variable to filter out its large effect, but the rank and the magnitude remained the same for the other variables, and the relevance of slope and soil moisture did not increase.
This work highlighted the importance of both the plot experiments and the statistical evaluation. Plots are the primary sources of collecting erosion information and the statistics are the tools when we are able to extract the biasing factors. Application of cross-validation in erosion literature is limited. de Graffenried and Shepherd [111] applied Classification and Regression Tree (CART) modelling with 10-fold cross-validation to test visible infrared spectroscopy in the assessment erosion risk, but usually we find more examples when this technique had been applied in gully erosion mapping [112,113]. Rotigliano et al. [114] also applied a repeated random method to assess the reliability of their classification results in debris flow sensitivity. However, all of these examples dealt with classification and not with regression issues. Our results pointed on the importance of assessing the reliability of experimental results, because the statistical tests and models can have several realizations depending on the input (i.e., training) dataset. If we explore the possible outcomes, at least regarding the experiments, we can provide better models with their uncertainty, too.

5. Conclusions

We conducted a plot experiment on a Mediterranean area using three soil cover types on two different slopes. We aimed to reveal the most important predictors of the soil erosion with the most reliable statistical models. We revealed that runoff, rain intensity and the soil cover were the most important factors of erosion, but simple bivariate regression models were not efficient when all soil cover types were involved. GLM and RFR multivariate models were more efficient and helped to determine the importance of influencing factors. Cross-validated models showed the uncertainty of the outcomes. Hyperparameter tuning of the RFR model ensured finding the least RMSE; accordingly, pseudo R2-values indicated that GLM performed better but based on RMSE and MAE the erosion rate prediction was more successful with the RFR, and errors were about two-thirds those of GLM’s results. Ranking of the variable importance was similar with both models, but the rank itself contradicted the current experiences: slope steepness and soil moisture had only limited effect on the erosion, which can be explained by local characteristics of the plots. This result also call attention to model evaluations, each study site is different, and when soil conservation experts plan the possible steps of mitigating the erosion, the local processes also should be considered.

Author Contributions

Conceptualization, S.M., A.A.-E. and S.S.; Data curation and collection, A.A.-E., and M.D.; Project administration, I.J.H. and S.S.; Resources, I.J.H.; Supervision, S.S.; Visualization, Q.B.P., N.T.T.L., A.A.-E. and I.J.H.; Writing—original draft, S.M., Q.B.P., K.A., S.S.; Writing—review and editing, S.M., I.J.H., S.S. All authors have read and agreed to the published version of the manuscript.

Funding

This research received no external funding.

Acknowledgments

This paper is part of a research project of the first author (Safwan Mohammed) funded by the Tempus Public Foundation (Hungary) within the framework of the Stipendium Hungaricum Scholarship Programme. The research was supported by the Thematic Excellence Programme of the Ministry for Innovation and Technology in Hungary (ED_18-1-2019-0028) projects. Authors would like to thank Al-Bath University (Syria), Aleppo University (Syria), and Debrecen University (Hungary) for their unlimited support.

Conflicts of Interest

The authors declare no conflict of interest.

References

  1. Tarolli, P.; Sofia, G. Human topographic signatures and derived geomorphic processes across landscapes. Geomorphology 2016, 255, 140–161. [Google Scholar] [CrossRef] [Green Version]
  2. Prosdocimi, M.; Jordán, A.; Tarolli, P.; Keesstra, S.D.; Novara, A.; Cerdà, A. The immediate effectiveness of barley straw mulch in reducing soil erodibility and surface runoff generation in Mediterranean vineyards. Sci. Total Environ. 2016, 547, 323–330. [Google Scholar] [CrossRef] [Green Version]
  3. Van Leeuwen, C.C.; Cammeraat, E.L.; De Vente, J.; Boix-Fayos, C. The evolution of soil conservation policies targeting land abandonment and soil erosion in Spain: A review. Land Use Policy 2019, 83, 174–186. [Google Scholar] [CrossRef]
  4. Chalise, D.; Kumar, L.; Kristiansen, P. Land Degradation by Soil Erosion in Nepal: A Review. Soil Syst. 2019, 3, 12. [Google Scholar] [CrossRef] [Green Version]
  5. Kertész, Á.; Křeček, J. Landscape degradation in the world and in Hungary. Hung. Geogr. Bull. 2019, 68, 201–221. [Google Scholar] [CrossRef] [Green Version]
  6. Vengosh, A. Salinization and Saline Environments. Treatise Geochem. 2003, 9, 1–35. [Google Scholar] [CrossRef]
  7. Jabbar, M.; Chen, X. Land degradation due to salinization in arid and semi-arid regions with the aid of geo-information techniques. Geo-Spat. Inf. Sci. 2008, 11, 112–120. [Google Scholar] [CrossRef]
  8. Novara, A.; Pisciotta, A.; Minacapilli, M.; Maltese, A.; Capodici, F.; Cerdà, A.; Gristina, L. The impact of soil erosion on soil fertility and vine vigor. A multidisciplinary approach based on field, laboratory and remote sensing approaches. Sci. Total Environ. 2018, 622, 474–480. [Google Scholar] [CrossRef] [Green Version]
  9. Yadav, S.K.; Soni, R. Integrated Soil Fertility Management. In Soil Fertility Management for Sustainable Development; Panpatte, D., Jhala, Y., Eds.; Springer: Singapore, 2019. [Google Scholar]
  10. Devatha, C.; Deshpande, V.; Renukaprasad, M. Estimation of Soil loss Using USLE Model for Kulhan Watershed, Chattisgarh- A Case Study. Aquat. Procedia 2015, 4, 1429–1436. [Google Scholar] [CrossRef]
  11. Goulding, K.W.T. Soil acidification and the importance of liming agricultural soils with particular reference to the United Kingdom. Soil Use Manag. 2016, 32, 390–399. [Google Scholar] [CrossRef]
  12. Rice, K.C.; Herman, J.S. Acidification of Earth: An assessment across mechanisms and scales. Appl. Geochem. 2012, 27, 1–14. [Google Scholar] [CrossRef]
  13. Vareda, J.P.; Valente, A.J.; Durães, L. Assessment of heavy metal pollution from anthropogenic activities and remediation strategies: A review. J. Environ. Manag. 2019, 246, 101–118. [Google Scholar] [CrossRef] [PubMed]
  14. Kazemi, H.; Klug, H.; Kamkar, B. New services and roles of biodiversity in modern agroecosystems: A review. Ecol. Indic. 2018, 93, 1126–1135. [Google Scholar] [CrossRef]
  15. Geisen, S.; Wall, D.H.; Van Der Putten, W.H. Challenges and Opportunities for Soil Biodiversity in the Anthropocene. Curr. Biol. 2019, 29, R1036–R1044. [Google Scholar] [CrossRef] [PubMed]
  16. Deák, B.; Valkó, O.; Nagy, D.D.; Török, P.; Torma, A.; Lőrinczi, G.; Kelemen, A.; Nagy, A.; Bede, Á.; Mizser, S.; et al. Habitat islands outside nature reserves—Threatened biodiversity hotspots of grassland specialist plant and arthropod species. Biol. Conserv. 2020, 241, 108254. [Google Scholar] [CrossRef]
  17. Keesstra, S.D.; Bouma, J.; Wallinga, J.; Tittonell, P.; Smith, P.; Cerdà, A.; Montanarella, L.; Quinton, J.N.; Pachepsky, Y.; Van Der Putten, W.H.; et al. The significance of soils and soil science towards realization of the United Nations Sustainable Development Goals. Soil 2016, 2, 111–128. [Google Scholar] [CrossRef] [Green Version]
  18. Keesstra, S.D.; Mol, G.; De Leeuw, J.; Okx, J.; Molenaar, A.C.; De Cleen, M.; Visser, S. Soil-Related Sustainable Development Goals: Four Concepts to Make Land Degradation Neutrality and Restoration Work. Land 2018, 7, 133. [Google Scholar] [CrossRef] [Green Version]
  19. Visser, S.; Keesstra, S.D.; Maas, G.; De Cleen, M.; Molenaar, A.C. Soil as a Basis to Create Enabling Conditions for Transitions Towards Sustainable Land Management as a Key to Achieve the SDGs by 2030. Sustainability 2019, 11, 6792. [Google Scholar] [CrossRef] [Green Version]
  20. Chalise, D.; Kumar, L.; Spalevic, V.; Skataric, G. Estimation of Sediment Yield and Maximum Outflow Using the IntErO Model in the Sarada River Basin of Nepal. Water 2019, 11, 952. [Google Scholar] [CrossRef] [Green Version]
  21. Blake, W.H.; Rabinovich, A.; Wynants, M.; Kelly, C.; Nasseri, M.; Ngondya, I.; Patrick, A.; Mtei, K.M.; Munishi, L.; Boeckx, P.; et al. Soil erosion in East Africa: An interdisciplinary approach to realising pastoral land management change. Environ. Res. Lett. 2018, 13, 124014. [Google Scholar] [CrossRef] [Green Version]
  22. Cerdan, O.; Govers, G.; Le Bissonnais, Y.; Van Oost, K.; Poesen, J.; Saby, N.; Gobin, A.; Vacca, A.; Quinton, J.N.; Auerswald, K.; et al. Rates and spatial variations of soil erosion in Europe: A study based on erosion plot data. Geomorphology 2010, 122, 167–177. [Google Scholar] [CrossRef]
  23. Panagos, P.; Borrelli, P.; Poesen, J.; Ballabio, C.; Lugato, E.; Meusburger, K.; Montanarella, L.; Alewell, C. The new assessment of soil loss by water erosion in Europe. Environ. Sci. Policy 2015, 54, 438–447. [Google Scholar] [CrossRef]
  24. Madarasz, B.; Jakab, G.; Tóth, A. Facing to real sustainability—Conservation agriculturalpractices around the world. Environ. Sci. Pollut. Res. 2017, 25, 975–976. [Google Scholar] [CrossRef] [PubMed] [Green Version]
  25. Rodrigo-Comino, J.; Neumann, M.; Remke, A.A.; Ries, J.B. Assessing environmental changes in abandoned German vineyards. Understanding key issues for restoration management plans. Hung. Geogr. Bull. 2018, 67, 319–332. [Google Scholar] [CrossRef] [Green Version]
  26. Le Roux, J.J.; Newby, T.S.; Sumner, P.D. Monitoring soil erosion in South Africa at a regional scale: Review and recommendations. S. Afr. J. Sci. 2007, 103, 329–335. [Google Scholar]
  27. Seutloali, K.E.; Dube, T.; Mutanga, O. Assessing and mapping the severity of soil erosion using the 30-m Landsat multispectral satellite data in the former South African homelands of Transkei. Phys. Chem. Earth Parts A/B/C 2017, 100, 296–304. [Google Scholar] [CrossRef]
  28. Sidle, R.C.; Ziegler, A.D.; Negishi, J.N.; Nik, A.R.; Siew, R.; Turkelboom, F. Erosion processes in steep terrain—Truths, myths, and uncertainties related to forest management in Southeast Asia. For. Ecol. Manag. 2006, 224, 199–225. [Google Scholar] [CrossRef]
  29. Teng, H.; Viscarra-Rossel, R.; Shi, Z.; Behrens, T.; Chappell, A.; Bui, E.N. Assimilating satellite imagery and visible–near infrared spectroscopy to model and map soil loss by water erosion in Australia. Environ. Model. Softw. 2016, 77, 156–167. [Google Scholar] [CrossRef]
  30. Nearing, M.A.; Xie, Y.; Liu, B.; Ye, Y. Natural and anthropogenic rates of soil erosion. Int. Soil Water Conserv. Res. 2017, 5, 77–84. [Google Scholar] [CrossRef]
  31. Jakab, G.; Nemeth, T.; Csepinszky, B.; Madarász, B.; Szalai, Z.; Kertész, Á. The influence of short-term soil sealing and crusting on hydrology and erosion at balaton uplands, Hungary. Carpathian J. Earth Environ. Sci. 2013, 8, 147–155. [Google Scholar]
  32. Centeri, C.; Jakab, G.I.; Barta, K.; Farsang, A.; Szabó, S.; Szalai, Z.; Bíró, Z. Dependence of soil erodibility factor on the measurements of soil particle size distribution. In Talajpusztulás Térben és Időben; MTA CSKF FI: Budapest, Hungary, 2014; pp. 47–53. [Google Scholar]
  33. Chen, H.; Zhang, X.; Abla, M.; Lu, D.; Yan, R.; Ren, Q.; Ren, Z.; Yang, Y.; Zhao, W.; Lin, P.; et al. Effects of vegetation and rainfall types on surface runoff and soil erosion on steep slopes on the Loess Plateau, China. Catena 2018, 170, 141–149. [Google Scholar] [CrossRef]
  34. Liu, Y.; Xin, Y.; Xie, Y.; Wang, W. Effects of slope and rainfall intensity on runoff and soil erosion from furrow diking under simulated rainfall. Catena 2019, 177, 92–100. [Google Scholar] [CrossRef]
  35. Prosdocimi, M.; Cerdà, A.; Tarolli, P. Soil water erosion on Mediterranean vineyards: A review. Catena 2016, 141, 1–21. [Google Scholar] [CrossRef]
  36. Corti, G.; Cavallo, E.; Cocco, S.; Biddoccu, M.; Brecciaroli, G.; Agnelli, A. Evaluation of Erosion Intensity and Some of Its Consequences in Vineyards from Two Hilly Environments under a Mediterranean Type of Climate, Italy. In Soil Erosion Issues in Agriculture; InTech: Rijeka, Croatia, 2011; pp. 113–160. [Google Scholar]
  37. Bhatt, R.; Khera, K.L. Effect of tillage and mode of straw mulch application on soil erosion in the submontaneous tract of Punjab, India. Soil Tillage Res. 2006, 88, 107–115. [Google Scholar] [CrossRef]
  38. Nouwakpo, S.; Weltz, M.A.; Green, C.H.; Arslan, A. Combining 3D data and traditional soil erosion assessment techniques to study the effect of a vegetation cover gradient on hillslope runoff and soil erosion in a semi-arid catchment. Catena 2018, 170, 129–140. [Google Scholar] [CrossRef]
  39. Zhou, P.; Luukkanen, O.; Tokola, T.; Nieminen, J. Effect of vegetation cover on soil erosion in a mountainous watershed. Catena 2008, 75, 319–325. [Google Scholar] [CrossRef]
  40. Zachar, D. Soil Erosion; Cowan, M., Ed.; Elsevier Scientific Pub. Co.: New York, NY, USA, 1982. [Google Scholar]
  41. Zingg, A.W. Degree and length of land slope as it affects soil loss in run-off. Agric. Eng. 1940, 21, 59–64. [Google Scholar]
  42. Renard, K.G.; Foster, G.R.; Weesies, G.A.; McCool, D.K.; Yoder, D.C. Predicting Soil Erosion by Water: A Guide to Conservation Planning with the Revised Universal Soil Loss Equation (RUSLE); Agriculture Handbook No. 703; USDA-ARS: Washington, DC, USA, 1997.
  43. Nearing, M.A.; Foster, G.R.; Lane, L.J.; Finkner, S.C. A Process-Based Soil Erosion Model for USDA-Water Erosion Prediction Project Technology. Trans. ASAE 1989, 32, 1587–1593. [Google Scholar] [CrossRef]
  44. Viney, N.R.; Sivapalan, M. A conceptual model of sediment transport: Application to the Avon River Basin in Western Australia. Hydrol. Process. 1999, 13, 727–743. [Google Scholar] [CrossRef]
  45. Centeri, C.; Barta, K.; Jakab, G.; Szalai, Z.; Bíró, Z. Comparison of EUROSEM, WEPP, and MEDRUSH model calculations with measured runoff and soil-loss data from rainfall simulations in Hungary. J. Plant Nutr. Soil Sci. 2009, 172, 789–797. [Google Scholar] [CrossRef]
  46. Schürz, C.; Mehdi, B.; Kiesel, J.; Schulz, K.; Herrnegger, M. A systematic assessment of uncertainties in large scale soil loss estimation from different representations of USLE input factors—A case study for Kenya and Uganda. Hydrol. Earth Syst. Sci. Discuss. 2019. in review. [Google Scholar] [CrossRef] [Green Version]
  47. Kinnell, P. Event soil loss, runoff and the Universal Soil Loss Equation family of models: A review. J. Hydrol. 2010, 385, 384–397. [Google Scholar] [CrossRef]
  48. Batista, P.V.; Davies, J.; Silva, M.L.; Quinton, J.N. On the evaluation of soil erosion models: Are we doing enough? Earth Sci. Rev. 2019, 197. [Google Scholar] [CrossRef]
  49. Masri, Z.; Van Donk, S.; Bruggeman, A.; Turkelboom, F. Post-harvest summer tillage to control wind erosion in the Khanasser Valley, Syria. Aeolian Res. 2015, 17, 219–229. [Google Scholar] [CrossRef]
  50. Mohammed, S.; Kbibo, I.; Alshihabi, O.; Mahfoud, E. Studying rainfall changes and water erosion of soil by using the WEPP model in Lattakia, Syria. J. Agric. Sci. 2016, 61, 375–386. [Google Scholar] [CrossRef]
  51. Safwan, M.; Alaa, K.; Omran, A.; Quoc, B.P.; Nguyen, T.T.L.; Van, N.T.; Duong, T.A.; Endre, H.; Mohammed, S.; Khallouf, A.; et al. Predicting soil erosion hazard in Lattakia Governorate (W Syria). Int. J. Sediment Res. 2020. [Google Scholar] [CrossRef]
  52. Mohammed, S.; Alsafadi, K.; Talukdar, S.; Kiwan, S.; Hennawi, S.; Alshiehabi, O.; Sharaf, M.; Harsanyie, E. Estimation of soil erosion risk in southern part of Syria by using RUSLE integrating geo informatics approach. Remote Sens. Appl. Soc. Environ. 2020, 20, 100375. [Google Scholar] [CrossRef]
  53. Kbibo, I.; Nasafi, I. Water erosion and impacts on the coastal area in the Syrian Arab Republic. Tishreen Univ. J. Stud. Sci. Res. 1997, 18, 59–76. (In Arabic) [Google Scholar]
  54. Kbibo, I.; Ibrahim, J.; Bou-Issa, A. Studying the Effect of Soil Erosion for Eight Different Systems with Different Slopes in the Coastal Area under Forests, Burned Forest and Planted Soil System. Tishreen Univ. J. Res. Sci. Stud. Biol. Sci. Ser. 2017, 39, 25–38. (In Arabic) [Google Scholar]
  55. Wischmeier, W.H.; Smith, D.D. Predicting Rainfall Erosion Losses: A Guide to Conservation Planning (No. 537); Science and Education Administration, U S Department of Agriculture: Washington, DC, USA, 1978. [Google Scholar]
  56. Field, A. Discovering Statistics Using IBM SPSS Statistics; SAGE Publications Inc.: London, UK, 2013. [Google Scholar]
  57. Lucà, F.; Buttafuoco, G.; Terranova, O. GIS and Soil. In Comprehensive Geographic Information Systems; Huang, B., Ed.; Elsevier: Oxford, UK, 2018; Volume 2, pp. 37–50. ISBN 9780128046609. [Google Scholar] [CrossRef]
  58. Breiman, L. Random forests. Mach. Learn. 2001, 45, 5–32. [Google Scholar] [CrossRef] [Green Version]
  59. Echeverry-Galvis, M.A.; Peterson, J.K.; Sulo-Caceres, R. The Social Nestwork: Tree Structure Determines Nest Placement in Kenyan Weaverbird Colonies. PLoS ONE 2014, 9, e88761. [Google Scholar] [CrossRef] [PubMed]
  60. Ishwaran, H.; Lu, M. Standard errors and confidence intervals for variable importance in random forest regression, classification, and survival. Stat. Med. 2018, 38, 558–582. [Google Scholar] [CrossRef] [PubMed]
  61. Strobl, C.; Boulesteix, A.-L.; Zeileis, A.; Hothorn, T. Bias in random forest variable importance measures: Illustrations, sources and a solution. BMC Bioinform. 2007, 8, 25. [Google Scholar] [CrossRef] [PubMed] [Green Version]
  62. Liaw, A.; Wiener, M. Classification and regression by randomforest. R News 2002, 2, 18–22. [Google Scholar]
  63. Kuhn, M.; Johnson, K. Applied Predictive Modeling; Springer: New York, NY, USA, 2013; Volume 26. [Google Scholar]
  64. Bland, J.M.; Altman, D.G. Measuring agreement in method comparison studies. Stat. Methods Med. Res. 1999, 8, 135–160. [Google Scholar] [CrossRef]
  65. Pinheiro, J.; Bates, D.; DebRoy, S.; Sarkar, D.; R Core Team. nlme: Linear and Nonlinear Mixed Effects Models; R Package Version 3.1-140. 2019. Available online: https://cran.r-project.org/web/packages/nlme/index.html (accessed on 9 May 2020).
  66. Makowski; Lüdecke. Compute and Interpret Indices of Effect Size. CRAN. 2019. Available online: https://github.com/easystats/effectsize (accessed on 5 May 2020).
  67. Therneau, T.; Atkinson, B.; Ripley, B. Rpart: Recursive Partitioning and Regression Trees, R package version 4.1-13; R Foundation for Statistical Computing: Vienna, Austria, 2018. [Google Scholar]
  68. Mair, P.; Wilcox, R. Robust statistical methods in R using the WRS2 package. Behav. Res. Methods 2019, 52, 464–488. [Google Scholar] [CrossRef]
  69. Kuhn, N.J.; Greenwood, P.; Fister, W. Use of Field Experiments in Soil Erosion Research. In Developments in Earth Surface Processes; Elsevier B.V.: Amsterdam, The Netherlands, 2014; Volume 18, pp. 175–200. [Google Scholar] [CrossRef]
  70. Paluszynska, A.; Biecek, P.; Jiang, Y. Random Forest Explainer: Explaining and Visualizing Random Forests in Terms of Variable Importance; Version 0.10. 0. R Package. 2019. Available online: https://CRAN.R-project.org/package=randomForestExplainer (accessed on 9 May 2020).
  71. Wickham, H. ggplot2: Elegant Graphics for Data Analysis; Springer: New York, NY, USA, 2016. [Google Scholar]
  72. Auguie, B.; Antonov, A. gridExtra: Miscellaneous Functions for “Grid” Graphics; R Package Version, 2. 2017. Available online: http://CRAN.R-project.org/package=gridExtra (accessed on 9 May 2020).
  73. Kosmas, C.; Danalatos, N.; Cammeraat, E.L.H.; Chabart, M.; Diamantopoulos, J.; Farand, R.; Gutiérrez, L.; Jacob, A.; Marques, H.; Martínez-Fernández, J.; et al. The effect of land use on runoff and soil erosion rates under Mediterranean conditions. Catena 1997, 29, 45–59. [Google Scholar] [CrossRef]
  74. Mohammad, A.G.; Mohammad, A.A. The impact of vegetative cover type on runoff and soil erosion under different land uses. Catena 2010, 81, 97–103. [Google Scholar] [CrossRef]
  75. Cerdà, A.; Morera, A.G.; Bodi, M.B. Soil and water losses from new citrus orchards growing on sloped soils in the western Mediterranean basin. Earth Surf. Process. Landf. 2009, 34, 1822–1830. [Google Scholar] [CrossRef]
  76. Badorreck, A.; Gerke, H.H.; Hüttl, R.F. Morphology of physical soil crusts and infiltration patterns in an artificial catchment. Soil Tillage Res. 2013, 129, 1–8. [Google Scholar] [CrossRef]
  77. Lu, J.; Zheng, F.; Li, G.; Bian, F.; An, J. The effects of raindrop impact and runoff detachment on hillslope soil erosion and soil aggregate loss in the Mollisol region of Northeast China. Soil Tillage Res. 2016, 161, 79–85. [Google Scholar] [CrossRef]
  78. Lin, Q.; Xu, Q.; Wu, F.; Li, T. Effects of wheat in regulating runoff and sediment on different slope gradients and under different rainfall intensities. Catena 2019, 183, 104196. [Google Scholar] [CrossRef]
  79. Koulouri, M.; Giourga, C. Land abandonment and slope gradient as key factors of soil erosion in Mediterranean terraced lands. Catena 2007, 69, 274–281. [Google Scholar] [CrossRef]
  80. Martínez-Casasnovas, J.A.; Sánchez-Bosch, I. Impact assessment of changes in land use/conservation practices on soil erosion in the Penedès–Anoia vineyard region (NE Spain). Soil Tillage Res. 2000, 57, 101–106. [Google Scholar] [CrossRef]
  81. Bajocco, S.; De Angelis, A.; Perini, L.; Ferrara, A.; Salvati, L. The Impact of Land Use/Land Cover Changes on Land Degradation Dynamics: A Mediterranean Case Study. Environ. Manag. 2012, 49, 980–989. [Google Scholar] [CrossRef] [PubMed]
  82. Garcia-Ruiz, J.M.; Nadal-Romero, E.; Lana-Renault, N.; Beguería, S. Erosion in Mediterranean landscapes: Changes and future challenges. Geomorphology 2013, 198, 20–36. [Google Scholar] [CrossRef] [Green Version]
  83. Lucà, F.; Conforti, M.; Robustelli, G. Comparison of GIS-based gullying susceptibility mapping using bivariate and multivariate statistics: Northern Calabria, South Italy. Geomorphology 2011, 134, 297–308. [Google Scholar] [CrossRef]
  84. Zabaleta, A.; Meaurio, M.; Ruiz, E.; Antiguedad, I. Simulation Climate Change Impact on Runoff and Sediment Yield in a Small Watershed in the Basque Country, Northern Spain. J. Environ. Qual. 2014, 43, 235–245. [Google Scholar] [CrossRef]
  85. Nearing, M.A.; Pruski, F.F.; O’neal, M.R. Expected climate change impacts on soil erosion rates: A review. J. Soil Water Conserv. 2004, 59, 43–50. [Google Scholar]
  86. Li, Z.; Fang, H. Impacts of climate change on water erosion: A review. Earth-Sci. Rev. 2016, 163, 94–117. [Google Scholar] [CrossRef]
  87. Karydas, C.; Bouarour, O.; Zdruli, P. Mapping Spatio-Temporal Soil Erosion Patterns in the Candelaro River Basin, Italy, Using the G2 Model with Sentinel-2 Imagery. Geosciences 2020, 10, 89. [Google Scholar] [CrossRef] [Green Version]
  88. Preiti, G.; Romeo, M.; Bacchi, M.; Monti, M. Soil loss measure from Mediterranean arable cropping systems: Effects of rotation and tillage system on C-factor. Soil Tillage Res. 2017, 170, 85–93. [Google Scholar] [CrossRef]
  89. Van der Knijff, J.M.; Jones, R.J.A.; Montanarella, L. Soil Erosion Risk Assessment in Europe; EUR 19044 EN; Office for Official Publications of the European Communities: Luxembourg, 2000; p. 34. [Google Scholar]
  90. Peña-Angulo, D.; Nadal-Romero, E.; Gonzalez-Hidalgo, J.C.; Albaladejo, J.; Andreu, V.; Bagarello, V.; Barhi, H.; Batalla, R.J.; Bernal, S.; Bienes, R.; et al. Spatial variability of the relationships of runoff and sediment yield with weather types throughout the Mediterranean basin. J. Hydrol. 2019, 571, 390–405. [Google Scholar] [CrossRef] [Green Version]
  91. González-Hidalgo, J.C.; Peña-Monné, J.L.; De Luis, M. A review of daily soil erosion in Western Mediterranean areas. Catena 2007, 71, 193–199. [Google Scholar] [CrossRef]
  92. Cerdà, A.; Jurgensen, M.F. The influence of ants on soil and water losses from an orange orchard in eastern Spain. J. Appl. Èntomol. 2008, 132, 306–314. [Google Scholar] [CrossRef]
  93. Keesstra, S.D.; Pereira, P.; Novara, A.; Brevik, E.C.; Azorin-Molina, C.; Parras-Alcántara, L.; Jordán, A.; Cerdà, A. Effects of soil management techniques on soil water erosion in apricot orchards. Sci. Total Environ. 2016, 551, 357–366. [Google Scholar] [CrossRef] [Green Version]
  94. Yakupoğlu, T.; Rodrigo-Comino, J.; Cerdà, A. Potential Benefits of Polymers in Soil Erosion Control for Agronomical Plans: A Laboratory Experiment. Agronomy 2019, 9, 276. [Google Scholar] [CrossRef] [Green Version]
  95. Lorenzo, M.N.; Taboada, J.J.; Lorenzo, J.F.; Ramos, A.M. Influence of climate on grape production and wine quality in the Rías Baixas, north-western Spain. Reg. Environ. Chang. 2012, 13, 887–896. [Google Scholar] [CrossRef]
  96. Rodrigo-Comino, J.; Senciales, J.; Ramos, M.; Martínez-Casasnovas, J.A.; Lasanta, T.; Brevik, E.; Ries, J.B.; Sinoga, J.R. Understanding soil erosion processes in Mediterranean sloping vineyards (Montes de Málaga, Spain). Geoderma 2017, 296, 47–59. [Google Scholar] [CrossRef] [Green Version]
  97. Cerdà, A.; González-Pelayo, Ó.; Giménez-Morera, A.; Jordán, A.; Pereira, P.; Novara, A.; Brevik, E.C.; Prosdocimi, M.; Mahmoodabadi, M.; Keesstra, S.D.; et al. Use of barley straw residues to avoid high erosion and runoff rates on persimmon plantations in Eastern Spain under low frequency–high magnitude simulated rainfall events. Soil Res. 2016, 54, 154. [Google Scholar] [CrossRef]
  98. Lal, R. Soil erosion on Alfisols in western Nigeria: II. Effects of mulch rates. Geoderma 1976, 6, 377–387. [Google Scholar] [CrossRef]
  99. Bautista, S.; Bellot, J.; Vallejo, V.R. Mulching treatment for postfire soil conservation in a semiarid ecosystem. Arid. Soil Res. Rehabil. 1996, 10, 235–242. [Google Scholar] [CrossRef]
  100. Faucette, L.B.; Risse, L.M.; Nearing, M.A.; Gaskin, J.W.; West, L.T. Runoff, erosion, and nutrient losses from compost and mulch blankets under simulated rainfall. J. Soil Water Conserv. 2004, 59, 154–160. [Google Scholar]
  101. Adekalu, K.O.; Olorunfemi, I.; Osunbitan, J. Grass mulching effect on infiltration, surface runoff and soil loss of three agricultural soils in Nigeria. Bioresour. Technol. 2007, 98, 912–917. [Google Scholar] [CrossRef] [PubMed]
  102. Jin, K.; Cornelis, W.M.; Schiettecatte, W.; Lu, J.; Yao, Y.; Wu, H.; Gabriels, D.; De Neve, S.; Cai, D.; Jin, J.; et al. Effects of different management practices on the soil–water balance and crop yield for improved dryland farming in the Chinese Loess Plateau. Soil Tillage Res. 2007, 96, 131–144. [Google Scholar] [CrossRef] [Green Version]
  103. Jin, K.; Cornelis, W.M.; Gabriels, D.; Schiettecatte, W.; De Neve, S.; Lu, J.; Buysse, T.; Wu, H.; Cai, D.; Jin, J.; et al. Soil management effects on runoff and soil loss from field rainfall simulation. Catena 2008, 75, 191–199. [Google Scholar] [CrossRef]
  104. Smets, T.; Poesen, J.; Knapen, A. Spatial scale effects on the effectiveness of organic mulches in reducing soil erosion by water. Earth-Sci. Rev. 2008, 89, 1–12. [Google Scholar] [CrossRef]
  105. Abrantes, J.R.; Prats, S.A.; Keizer, J.J.; De Lima, J.L.M.P. Effectiveness of the application of rice straw mulching strips in reducing runoff and soil loss: Laboratory soil flume experiments under simulated rainfall. Soil Tillage Res. 2018, 180, 238–249. [Google Scholar] [CrossRef]
  106. Rahma, A.E.; Warrington, D.N.; Lei, T. Efficiency of wheat straw mulching in reducing soil and water losses from three typical soils of the Loess Plateau, China. Int. Soil Water Conserv. Res. 2019, 7, 335–345. [Google Scholar] [CrossRef]
  107. Lucas-Borja, M.E.; González-Romero, J.; Álvarez, P.A.P.; Sagra, J.; Gómez, M.; Moya, D.; Cerdà, A.; Heras, J.D.L. The impact of straw mulching and salvage logging on post-fire runoff and soil erosion generation under Mediterranean climate conditions. Sci. Total Environ. 2019, 654, 441–451. [Google Scholar] [CrossRef]
  108. Fu, S.; Liu, B.; Liu, H.; Xu, L. The effect of slope on interrill erosion at short slopes. Catena 2011, 84, 29–34. [Google Scholar] [CrossRef]
  109. Pijl, A.; Reuter, L.E.; Quarella, E.; Vogel, T.A.; Tarolli, P. GIS-based soil erosion modelling under various steep-slope vineyard practices. Catena 2020, 193, 104604. [Google Scholar] [CrossRef]
  110. Montenegro, A.A.D.A.; Souza, T.E.M.D.S.; De Souza, E.R.; Montenegro, S.M.G.L. Temporal dynamics of soil moisture and rainfall erosivity in a tropical volcanic archipelago. J. Hydrol. 2018, 563, 737–749. [Google Scholar] [CrossRef]
  111. Degraffenried, J.B.; Shepherd, K.D. Rapid Erosion Modeling in a Western Kenya Watershed using Visible Near Infrared Reflectance, Classification Tree Analysis and 137Cesium. Geoderma 2009, 154, 93–100. [Google Scholar] [CrossRef] [Green Version]
  112. Garosi, Y.; Sheklabadi, M.; Conoscenti, C.; Pourghasemi, H.R.; Van Oost, K. Assessing the performance of GIS-based machine learning models with different accuracy measures for determining susceptibility to gully erosion. Sci. Total Environ. 2019, 664, 1117–1132. [Google Scholar] [CrossRef]
  113. Amiri, M.; Pourghasemi, H.R.; Ghanbarian, G.; Afzali, S.F. Assessment of the importance of gully erosion effective factors using Boruta algorithm and its spatial modeling and mapping using three machine learning algorithms. Geoderma 2019, 340, 55–69. [Google Scholar] [CrossRef]
  114. Rotigliano, E.; Martinello, C.; Agnesi, V.; Conoscenti, C. Evaluation of debris flow susceptibility in El Salvador (CA): A comparison between Multivariate Adaptive Regression Splines (MARS) and Binary Logistic Regression (BLR). Hung. Geogr. Bull. 2018, 67, 361–373. [Google Scholar] [CrossRef] [Green Version]
Figure 1. Location of the study area (Mysiafe region, Central Syria).
Water 12 02529 g001
Figure 2. (A) Field experimental design in two different slope inclination (4.7%, 10.3%), (a) nine plots of bare soil (BS), (b) nine plots of metal sieve cover (MC), and (c) nine plots of strip cropping (SC). (B) sketch of experimental plot (500 cm × 100 cm × 50 cm).
Water 12 02529 g002
Figure 3. Mean of erosion rate in slopes characterized by different soil cover and slope steepness (mean ± standard error). Bare soil (BS), metal sieve cover (MC), and strip cropping (SC).
Water 12 02529 g003
Figure 4. A scatter plot indicating the relationship between erosion (g/m2) rate and runoff (L/m2).
Water 12 02529 g004
Figure 5. Relationship between erosion rate (g/m2) and runoff (L/m2) by soil cover types (BS: bare soil, MC: metal sieve cover, and SC: strip cropping).
Water 12 02529 g005
Figure 6. Evaluation metrics of random forest regression (RFR ((sm: soil moisture, slope: slope type, cover: soil cover, i30: rainfall amount in 30 min).
Water 12 02529 g006
Figure 7. Range of the 50 models applied with the 2-fold cross-validation repeated 25 times (•: median; box: interquartile range; dashed line: 1.5 times interquartile range; ◦: outlier; MAE: mean absolute error, and RMSE: root mean square error; GLM: general linear model, RFR: random forest regression).
Water 12 02529 g007
Figure 8. Bland–Altman diagram of the random forest regression (RFR) model predicted with repeated cross validation (RCV) approach based on 50 models (...: zero difference; –: mean, - - -: 2 × standard deviation, labelled cases: difference was larger than 2 × standard deviation (SD)).
Water 12 02529 g008
Figure 9. Bland–Altman diagram of the general linear model (GLM) prediction with cross validation (RCV) approach based on 50 repetitions (...: zero difference; –: mean, - - -: 2 × standard deviation, labelled cases: difference was larger than 2 × SD of the RFR model, i.e., 14).
Water 12 02529 g009
Figure 10. Differences of observed and modelled erosion by random forest regression (RFR) and general linear model (GLM).
Water 12 02529 g010
Table 1. Statistical packages used for R (V. 3.6.2) analyses.
PurposePackageReference
Effect sizeseffect sizes[66]
RFRrpart[67]
robust ANOVAWRS2[68]
k-fold cross validation modelcaret packages[69]
Accuracy metrics of RFRrandomForest, and randomForestExplainer[62,70]
Visualizationsggplot2, gridExtra[71,72]
Table 2. Effect of soil cover on soil erosion rate (g/m2) based on the Games–Howell post hoc test (BS: bare soil, MC: metal sieve cover, and SC: strip cropping; bold: p < 0.05).
Soil CoverGames–Howell Post Hoc TestBSMCSC
BSMean difference208206.29
p-value0.0160.017
MCMean difference −1.61
p-value 0.996
Table 3. Summary results of the general linear model (GLM) involving all measured influencing factors.
GLMSSdfFpη2p
Model0.000717.3312<0.0010.700
Soil cover109,52023.94560.0250.132
Slope type11,56510.83330.3660.016
Soil moisture86310.06220.8040.001
Runoff0.000177.5176<0.0010.599
Soil cover × slope type11,03220.39740.6740.015
Residuals721,70452
Total0.00059
Table 4. Summary results of the general linear model (GLM) of the significant variables.
GLMSSdfFpη2p
Model0.000342.4< 0.0010.694
Soil cover319,569212.2<0.0010.303
Runoff0.000183.7< 0.0010.599
Residuals73,501556
Total0.00059

