Abstract
Olive groves on the Mediterranean Basin are usually managed by continuous tillage and low organic matter inputs, leading to several soil degradation processes. Groundcovers (GCs) have come out as an alternative soil management strategy to improve soil’s fertility, soil’s organic matter quantity, and the sustainability of agro-ecosystems. Nevertheless, farmers are still unwilling to implement GCs or reduce tilling frequency while there are still some uncertainties and lack of global analyses. The purpose of this study was to perform an assessment of the effects of using GC on the soil parameters microbiological biomass, crop yield, and olive oil quality. A field trial was performed on a gypsiferous soil in central Spain with three different GCs: permanent GC of Brachypodium distachyon (BRA); permanent GC of spontaneous vegetation (SVE), and annual GC of Vicia ervilia (BIT) to be compared with conventional tillage (TIL). After three years, numbers of nematodes, fungi, and bacteria were higher on plant roots regardless of GC composition. BRA was the treatment with the biggest impact on soil and yield parameters. BRA increased soil organic carbon 1.03 Mg ha−1 yr−1 at 0–10 cm depth but reduced significantly olive yield because of nitrogen competition. The BIT treatment improved soil organic carbon stocks and soil structure, and did not reduce olive yield significantly regarding TIL. The BIT treatment was considered the best soil management strategy in semiarid conditions.
1. Introduction
Although indigenous to the Mediterranean region, olive (Olea europaea L.) cultivation is one of the most important agricultural industries worldwide. Olive groves cover more than 10 million ha in the world and olive production is about 22 million tonnes [1]. Spain is first in harvested area and production with 2.58 million ha and 9.8 million tonnes, respectively. The main outcome of olive farming is virgin olive oil (VOO), a vegetable fat with valuable nutritional and health characteristics [2] which plays an essential role in the traditional Mediterranean diet. Thus, olive groves and their farming management are of significant importance to socio-economic and agro-ecosystem variables in several regions of the world.
Agriculture is recognized as a major source of environmental impacts [3,4], soil degradation being one of them [5]. The Food and Agriculture Organization of the United Nations (FAO) defined soil degradation as a change in the soil health status resulting in the diminished capacity of a soil to provide goods and services for its beneficiaries [6].
Soil organic carbon (SOC) plays key roles in preserving soil fertility, maintaining soil ecosystem services, and protecting soils from degradation. The SOC content is related to physical, chemical, and biological soil properties [7,8]. Its relationships with soil biodiversity, nutrient cycling, chemical fertility [9,10], and soil hydrological properties such as porosity, water holding capacity, and water infiltration are well known [11]. More specifically, SOC is a critical factor for soil structure because it is one of the main binding agents of soil particles [12,13]. Deterioration of soil structure makes soils more erodible and prone to soil erosion [14].
Soil erosion is a natural process that can be triggered by unsustainable management practices such as bare soils on hilly slopes [15]. Erosion causes physical, chemical, and biological soil degradation because it includes the loss of soil particles, SOC, and nutrients [16]. Eroded soils experience a shift to a progressive increase of erodibility, creating a negative feedback loop.
Before the Green Revolution, the relationship between agriculture and livestock was tight, and organic manure was available and applied systematically, as it was the unique source of nutrient input. Moreover, weeding was limited to animal-powered tillage with limited soil structure effects [17]. Nowadays, in many Mediterranean woody crops, such as olive groves, organic inputs are restricted to pruning rests and soil management consists of several tillage operations to maintain bare soil over the year. Thus, the balance between organic inputs and outputs has been broken and shifted to SOC mineralization, leading to low SOC stocks [18]. Additionally, Mediterranean woody crops are often planted on slopes and high intensity rainfall events are frequent [19,20,21]. The previously mentioned negative feedback loop of SOC loss and erosion is, therefore, reinforced by hilly terrain, bare soil, and high-intensity rainfall. All these factors take place jointly in many Mediterranean olive groves. Therefore, inadequate agricultural practices, which have been described before, are promoting soil degradation processes and leading to reduced fertility and environmental sustainability of agriculture.
Groundcovers (GCs) are widely accepted as a soil management strategy to revert the soil degradation processes in Mediterranean olive groves [22]. When a GC grows, there is an immediate effect of soil aggregate protection by plant cover interception of raindrops. Moreover, the plants may act as barriers, increasing infiltration rates and reducing sediment delivery runoff and nutrient loss [23,24,25]. In addition, since there are minimal to no tillage operations and GC residues work as organic matter input, SOC increases and soil structure improves [26]. Another beneficial effect of GC deals with incorporating soil–plant–microbe interactions into the agri-ecosystem, which can enhance the biomass and biodiversity of microbial populations and therefore biological activities involved in nutrient cycling, crop production, and soil health [27,28,29].
Nevertheless, GC management in a semiarid environment is challenging, and as Gomez [25] pointed out, GC efficiency is site-specific. Currently, this practice is time, economic, resource, and knowledge demanding, and that fact, together with the water scarcity of Mediterranean agri-systems, makes farmers refuse GC [30]. There is a need to improve the scientific knowledge about using different types of GC in different conditions in order to face water scarcity and yield issues while supporting sustainable agriculture.
In the last decade, many works have been published using GC in olive groves in Mediterranean agri-ecosystems, but few have assessed the use of alternative soil management strategies on soil’s physical, chemical, and biological properties and on olive and VOO production and quality. To deal with these concerns we selected three GCs (two permanent and an annually seeded legume GC) as alternative soil management strategies to conventional tillage in a semiarid gypsiferous area of central Spain. We hypothesized that the GC would increase SOC by increasing organic inputs, thereby improving soil structure and hydrologic parameters without affecting olive yields and quality, and promoting sustainable management. Thus, the aim of this paper was to develop a complete assessment of the influences of three GCs on soil, water, microbiological, nutrition, and yield parameters in a semiarid Mediterranean olive grove in central Spain in comparison to conventional tillage.
2. Materials and Methods
2.1. Study Area
The experimental olive grove (Olea europaea L.) where this study was performed is located in central Spain, in southern Madrid (UTM 30N, ETRS89: X = 455,654, Y = 4,435,959). The cultivar was Cornicabra, the most important one in the center of Spain [31], spacing 7 × 6 m2, and planted in 2004. The elevation is c.a. 540 m a.s.l., and the slope ranges from 9 to 12%. The soil was developed over gypsum marls in the Tagus River basin. A soil pit was excavated in 2017 and samples were taken from genetic horizons (Table 1). Due to the high gypsum content, it was not feasible to separate silt from clay, and consequently, texture data were classified as sand, coarse silt, and fine silt together with clay. At the field, soil texture was classified as loam in A and B horizons. Soil pH was basic with 100% base saturation, moderate to high electrical conductivity (EC) and very low soil organic carbon content. Roots were frequent from 0 to 80 cm depth. The soil was classified as Gypsic Haploxerepts [32] or as Cambisol Gypsiric (Aric, Ochric) [33]. The climate is classified as Mediterranean semi-arid, with a mean annual temperature of 13.6 °C, accumulated annual precipitation of 380 mm, and a reference evapo-transpiration (ET0 Penman-Monteith) of 1112 mm.

Table 1.
Main soil characteristics from a pit excavated in 2017. EC: electrical conductivity; Hor: genetic horizon; CEC: cation exchange capacity.
2.2. Experimental Design
The whole area was tilled yearly with a chisel plow at 0.17 m depth following the traditional soil management in the area, before the trial started, in November 2014. The treatments were performed in 6 m-wide inter-rows according to the following characteristics: (1) conventional tillage (hereafter TIL) consisted of one pass in autumn and another in spring with a chisel at 0.15 m deep, to control weeds; (2) the legume bitter vetch (Vicia ervilia Willd., hereafter BIT) waws seeded yearly at a dose of 70 kg ha−1; (3) permanent groundcover spontaneous vegetation (hereafter SVE) was dominated by two species of Brassicaceae (Diplotaxis erucoides L. and Descurainia sophia L.); and (4) purple false brome (Brachypodium distachyon L. P. Beauv., hereafter BRA), a permanent grass cover was seeded only the first year (seed dose of 25 kg ha−1). The trial design was 4 blocks, each one with the 4 treatments in 4 consecutive inter-rows in plots of 42 × 24 m2 (Figure 1). All treatments were mechanically mowed once in the spring. Permanent groundcovers were mowed again in autumn, at the same time that the TIL treatment was tilled and the BIT treatment was tilled and seeded. Plant debris was left on the surface as mulch.
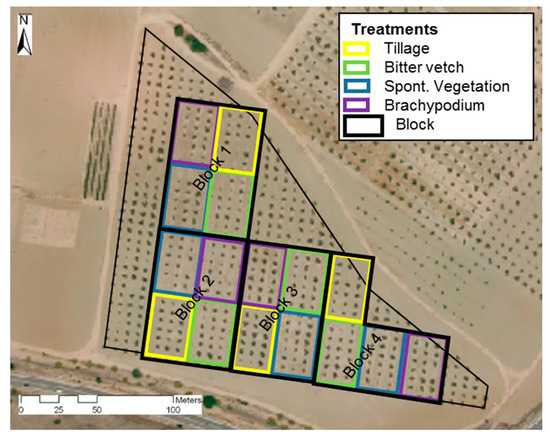
Figure 1.
Experimental design.
Over the years of the field trial, the accumulated annual precipitation was highly variable among years (Table 2) with very dry conditions in 2015 and 2017. Annual average temperatures were between 14 and 15.5 °C and ET0 was above 1000 mm. Additional climatic data are shown in Tables S1–S3 as Supplementary Materials.

Table 2.
Climate data. T: annual temperature; R: accumulated annual rainfall; ET0: accumulated annual evapotranspiration.
2.3. Soil Sampling and Soil Variables
Three composite samples per treatment and block were taken in the inter-rows at two depths: 0–5 and 5–10 cm. A part of the samples was sieved at 2 mm, to analyze soil organic carbon (SOC) by wet oxidation method [34]. SOC stock was obtained as follows:
where Stock is the stock of C (Mg ha−1); conc. is the concentration of C (%); BD is the bulk density (Mg m−3); and d is the thickness (m).
Stock = conc. × BD × d × 102
Plant and stone cover (%) were measured once in spring during the soil sample campaign, using quadrats 25 × 25 cm2. The resulting plant and stone cover was the average of coverage judged by six trained observers.
Three sub-samples composed by 30 air-dried macroaggregates (size 4 to 4.75 mm Ø) were used to perform the counting number of drop test (CND; [35]) for each treatment and depth. This method gives information about macroaggregate stability, mimicking the impact of raindrops on the macroaggregates [36].
Soil porosity was estimated using three undisturbed topsoil samples per block and treatment, which were randomly collected using core stainless cylinders (100 cm3 and 5 cm high) at 0–10 cm depth. The first 2.5 cm depth layer was excluded to avoid excess of variance produced by litter, leaves and roots. The core samples were saturated with water by capillarity in a sandbox to determine pF between 0 and 2.0 (0.1 to 10 kPa respectively) by successive weight measurements. Water retention between 2 and 4.2 pF (10 to 1500 kPa respectively) was determined using a progressive drying process with pressure plate extractors [37]. Finally, the samples were completely dried in oven (24 h at 105 °C) corresponding to pF 7 (106 kPa). The weight of these dried samples also allowed the determination of soil bulk density [38].
Pore size and water retention capacity relationship were established as follows: macropores (>60 μm) corresponded to matric potentials between pF 0 to 1.8; mesopores (60 to 10 μm) to pF values between 1.8 and 2.54; and micropores (<10 μm) to pF > 2.54. Pores smaller than 0.2 μm diameter corresponded to matric potentials higher than pF 4.2. These sizes of macro, meso, and micropores are consistent with the current literature, e.g., [39,40]. Available water capacity (AWC) was determined by the difference between water volumes at pF 2.54 and 4.2; and non-available water as the volume of water between pF 4.2 and 7.
A small single ring (Ø = 12 cm) was employed to assess steady state infiltration [41]; four repetitions per treatment were done. Soil volumetric water content (θ) was measured in the inter-rows in two blocks per treatment. Each point had two EC-5® soil moisture sensors (Decagon Devices Inc.) at 15 and 30 cm depth plugged into a data logger, which recorded θ data each 15 min over the crop season.
Soil penetration resistance (PR) was assessed employing a hand penetrometer 06.01 (Eijelkamp). Data were collected at three random points per block and treatment in summer, the soil being dry. The PR readings were made at the following soil depths: 2.5, 5, 10, 15, 20, 25, 30, 35, 40, and 45 cm.
2.4. Soil and Plant Microbiological Biomass
From each treatment and each block (16 plots), composite samples of soil and/or plant (roots and aerial parts) were taken in spring and processed independently for microbiological analyses. Soil sampling was performed at 0–10 cm depth. Plant sampling consisted of the random collection of at least 10 plants from each plot, which were bagged together and kept without contact between the aerial parts and their roots. For comparative purposes, samples of either soil and/or plants from each block were systematically processed at the same time.
Microbiological analyses from each soil sample were performed from 100 g mixed with sterile water during 48 h to extract the nematodes by the Baermann funnel technique [42]. Population sizes of nematodes were estimated by direct counting of individuals with a stereoscope. Microbiological analyses from each plant sample were performed after cutting the roots from the aerial parts under aseptic conditions. Then, 3 g of roots were mixed with 30 mL of phosphate buffered saline (PBS) buffer (pH 7.4; 137 mM NaCl, 10 mM Na2HPO4, 2.7 mM KCl, 1.9 mM KH2PO4) and shaken at 200 rpm during 30 min to isolate epiphytic fungi and bacteria by the serial ten-fold dilution technique and plating from 1 mL aliquots onto the general media potato dextrose agar (PDA) with streptomycin 0.5% and nutrient agar (NA) for fungi and bacteria, respectively. The remaining PBS was sieved and used to count the epiphytic nematodes. Population sizes of fungi and bacteria were estimated by plate counts after incubation at 25 °C during 72 h for fungi and 48 h for bacteria. Aerial parts to estimate epiphytic and endophytic fungi and bacteria were processed as mentioned, except for a previous surface sterilization with ethanol 70° for 2 min, washing with sterile distilled water, and crushing into 30 mL of PBS before continuing with the serial ten-fold dilutions to estimate endophytic fungi and bacteria.
2.5. Nutrition, Water Stress, Yield, and Oil Quality
In mid-July, 100 mature leaves from shoots from the current growth season were randomly sampled in three trees of each block, providing a total of 16 samples. The macro and micronutrients were analyzed in an external laboratory.
Water stress was measured as the stem water potential (SWP) at midday using a Scholander pressure chamber (PMS Instrument Company). Three shoots per treatment and block of the current year’s growth were covered at least 1 h before measurement in order to equilibrate with branch xylem water potential. Four measures were performed in the crop season: at the beginning of the water stress period (late May), in the middle (mid-July), at the end of the stress period (mid-September), and finally, without water stress (mid-October).
Twenty olive fruits per block were picked up at five moments of the crop season (mid-July, mid-August, mid-September, mid-October, and at the harvest moment). These fruits were individually weighed to obtain fresh fruit weight.
Two olive trees per treatment and block were manually harvested on late November. The yield per tree was determined. Fruits from the two olive trees per treatment and block were mixed, and one subsample of 5 kg per block and treatment was carried to the laboratory. Maturity index was determined according to Beltrán et at. [43] based on skin and pulp fruit colors. A sample of 20 fruits was oven-dried at 70 °C until constant weight, obtaining fruit water content. Olive oil content on dry matter was determined by nuclear magnetic resonance method [44]. Virgin olive oils were extracted within 24 h after harvest using the Abencor system (MC2 Ingenierías y Sistemas) [45].
On February of 2018, a pruning was done following the same pattern for the olive trees, to obtain an estimation of vegetative growing. The pruning of two trees per treatment and block was individually weighted in the field.
Regulated physical-chemical and sensory parameters were determined in each Virgin Olive Oil (VOO). Free acidity; peroxide value; and UV spectrophotometric indices (K232, K270) were determined following the analytical methods described in the European Commission Regulation 2568/91 and later amendments [46]. Sensory analysis was performed by the “Panel de Catadores de Aceite de Oliva Virgen de la Comunidd de Madrid” according to the method described in the European Commission Regulation (EC) 640/2008 [47].
The following parameters were also determined in the oils: total phenols [48] expressed as mg of caffeic acid equivalents per kg of oil; carotenoid and chlorophyll pigments [49] expressed as mg of lutein and pheophytin per kg, respectively; and chromatic coordinates by the software CINTRAL (GBC Scientific Equipment, Breaeside, Victoria, Australia) according to the CIEL (Color Space defined by the Internacional Commision of Illumination) a* b* method [50].
2.6. Statistical Analyses
Several statistical procedures including analysis of variance (ANOVA), correlation, and multivariate analyses were performed at different stages using SPSS 19 [51] for all variables and years of the study. Different ANOVA mean comparisons tests were performed using the Tukey test at p < 0.05 level. After the initial assessment, the results mostly refer to the 2016/2017 crop season which was considered the most representative.
3. Results
3.1. Soil Properties
The slope and stone cover in the inter-rows were similar among the four treatments (Supplementary Materials, Table S4) with around 10.5% of slope and 5.5% of stone cover. In spring of 2017, plant cover was significantly higher under BRA treatment (52%) regarding TIL (4%), with a scarce coverage in BIT and SVE treatments (around 25%). The third year after starting the soil treatments, bulk density was lower under the legume treatment regarding the permanent groundcovers (Table 3). No differences in infiltration rates were found, although a higher rate was measured under TIL treatment (Supplementary Materials, Table S4).

Table 3.
Measured field parameters in 2017 for the different treatments. TIL: conventional tillage; BIT: bitter vetch; SVE: spontaneous vegetation and BRA: Brachypodium distachyon.
The SOC stock at 0–5 cm depth was significantly higher in BRA than in TIL treatment (7.0 and 4.8 Mg ha−1, respectively); the other treatments, SVE and BIT, showed intermediate values (5.5 and 6.7 Mg ha−1, respectively), as can be seen in Figure 2. No significant differences were found at 5–10 cm depth, with a similar SOC content in the four treatments (ranged between 5.0 and 5.9 Mg ha−1). At 0–10 cm depth BRA soils had 30% more SOC content than soils of TIL treatment (12.9 and 9.8 Mg ha−1, respectively), but there were not significantly different at p-value < 0.05.
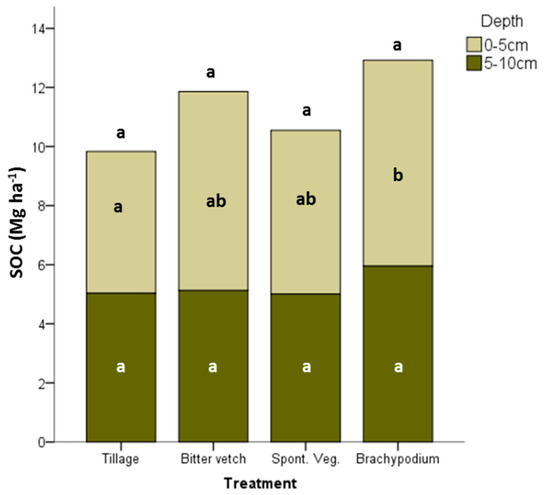
Figure 2.
Soil organic carbon stock at 0–5 and 5–10 cm depths in the different treatments. Different letters mean significant differences between treatments at p < 0.05 according to Tukey test (N = 12). Different letters above the bars mean differences between treatments for the SOC content at 0–10 cm depth at p < 0.05 according to Tukey test (N = 12).
Considering that the SOC content in the 0–5 cm depth in the starting year (2014) was 4.81 Mg ha−1, the increase of SOC at this depth after 3 years was 0.73 Mg ha−1 for SVE, 1.93 Mg ha−1 for BIT, and 2.15 Mg ha−1 for BRA regarding TIL, which remained stable along the studied years. Figure 3 shows how SOC stocks have evolved at 0–5 cm over the years regarding conventional tillage. The BRA treatment was the only soil management strategy with a constant increase of SOC stocks at 0–5 cm depth, while SVE and BIT showed some erratic growth. After 3 years the SOC stock rate increased at 0–10 cm depth regarding the starting moment; this SOC stock was 1.03, 0.40, and 0.36 Mg ha−1 year−1 in BRA, BIT, and SVE treatments, respectively.
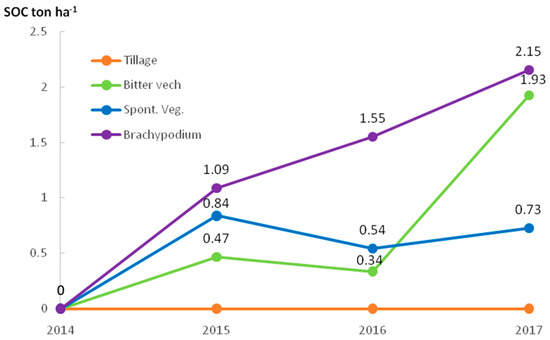
Figure 3.
Mean soil organic carbon increase regarding tillage at 0–5 cm depth in the studied years in the different treatments.
In the topsoil (0–5 cm depth) soil aggregates were more stable under BRA treatment, followed by the other two groundcovers, and the lowest values were those found for TIL treatment (Figure 4). The BRA aggregates were two-fold more resistant than TIL aggregates. These significant differences did not appear at 5–10 cm depth, although TIL scored lower CND values.
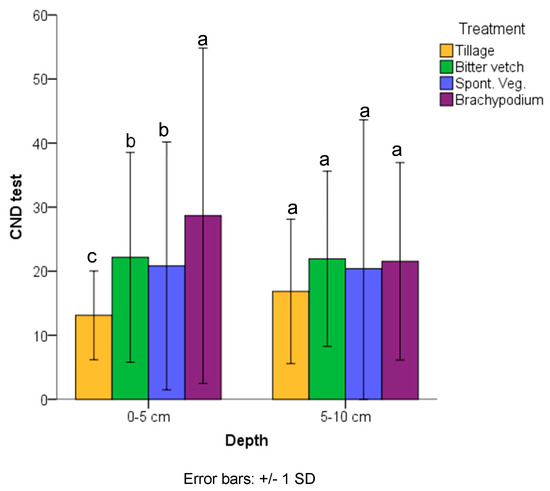
Figure 4.
Counting number drop (CND) test at 0–5 and 5–10 cm depths in the different treatments in 2017. Different letters mean significant differences between treatments at p < 0.05 according to Tukey test (N = 120).
The penetration resistance in the first 2.5 cm of the soil was significantly lower under the annual groundcover than in the permanent groundcovers (Figure 5), with TIL in an intermediate position. In the deeper layers no significant differences appeared. During the penetration resistance field test it was not possible to dig beyond 25 cm depth due to the presence of a strongly hardened gypsum layer.
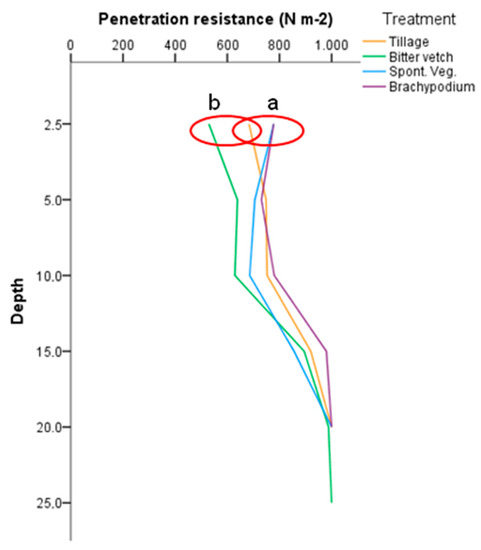
Figure 5.
Penetration resistance from 2.5 to 25 cm depth for the different treatments. Statistical differences between treatments at p < 0.05 according to Tukey test (N = 12) were marked with a red ring and different letters.
There were significant differences in total porosity and macroporosity between BIT (15.1% for total macroporosity, 53.9% for total porosity) and BRA treatment (10.3% for macroporosity, 49.6% for total porosity) (Figure 6). BRA treatment reached the highest value of AWC (7.5%), whilst TIL and BIT treatments had the lowest (6.2% of AWC), with no statistical significance.
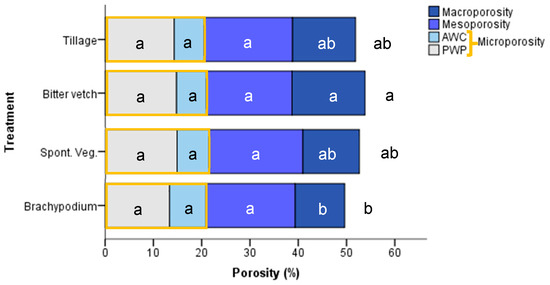
Figure 6.
Porosity fractions in the different treatments. Different letters mean significant differences between treatments at p < 0.05 according to Tukey test (N = 12) in the different porosity fractions. DOY: Day of the year.
Regarding soil moisture, as can be seen in Figure 7, there were no relevant differences over the crop season at 15 cm depth between treatments, except under SVE that seemed to uptake water during summer. The situation changed at 30 cm depth (Figure 8) with BRA treatment storing more water across the whole year, with scarce differences between the other two groundcovers and TIL treatment.
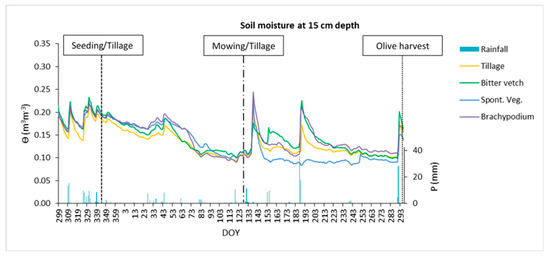
Figure 7.
Daily water volumetric content at 15 cm depth during the crop season 2016/2017 for the four treatments and rainfall depth. DOY: day of the year.
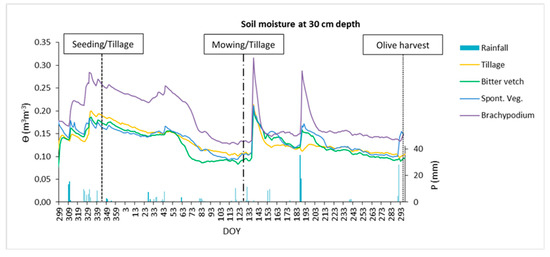
Figure 8.
Daily water volumetric content at 30 cm depth during the crop season 2016/2017 for the four treatments and rainfall depth. DOY: day of the year.
3.2. Soil and Plant Microbiological Biomass
Population sizes of nematodes were slightly higher in groundcovers BIT and BRA than in the rest of the treatments in both soil and plant roots, and comparatively about one order of magnitude higher on plant roots than in soil in all conditions (Table 4). However, due to the high variability of the data, no statistically significant differences among the four treatments were found.

Table 4.
Population sizes of nematodes, fungi, and bacteria in soil and/or plants (roots and aerial parts) for the different treatments.
Population sizes of fungi in plants were at least one order of magnitude higher on plant roots with respect to the aerial parts of the plants, where differences of about one order of magnitude could be observed between epiphytic and endophytic fungi, population sizes for endophytic fungi being lower (Table 4). On plant roots, BRA groundcover was the treatment with the highest population sizes of epiphytic fungi, followed by BIT. In the aerial parts of the plants there were much more epiphytic fungi in the permanent groundcovers than in BIT or in the plants that appeared in TIL treatment. On the other hand, there was a higher number of endophytic fungi in BIT and SVE treatments than in TIL or BRA. There were no statistically significant differences among treatments, except for population sizes of epiphytic fungi on plant roots.
Population sizes of epiphytic bacteria in plants were about the same order of magnitude on plant roots and the surface of the aerial parts of the plants, with differences concerning the population sizes of endophytic bacteria, which were about two orders of magnitude lower (Table 4). On plant roots, there were more epiphytic bacteria in SVE and BIT treatments, with the lowest numbers in TIL and BRA. In the aerial part of the plants there were far more epiphytic bacteria in the permanent groundcovers than in BIT or in the plants that appeared in TIL treatment. On the other hand, higher population sizes of endophytic bacteria in BRA were observed, with an intermediate position of SVE and BIT. However, there were no statistically significant differences among the four treatments.
3.3. Nutrition, Water Stress, Yield, and Oil Quality
After three years, all nutrients in the leaf were within the limits of sufficiency (Table 5), except nitrogen in the olive trees of BRA treatment, which was slightly under this limit, marked in 1.50% [52]. There were significant differences in foliar N, with higher concentration under legume treatment regarding the other treatments. There were not statistically significant differences in the other nutrient contents.

Table 5.
Leaf nutrient average content and standard deviation for the different treatments in 2017.
Olive trees from all treatments suffered high water stress (SWP < −2.5 MPa) at two periods during the crop season, at late July (DOY: 206) and mid-October (DOY: 283) before the autumn rains that in 2017 arrived at end-October. There were no statistically significant differences between treatments at any date, although as can be seen in Figure 9, olive trees under BRA treatment kept the lowest water stress. The higher water stress (lower SWP value) in the whole season was reached in October by the olive trees of SVE (3.5 MPa), followed by TIL (3.4 MPa), BIT (3.1 MPa), and BRA treatments (3.0 MPa).
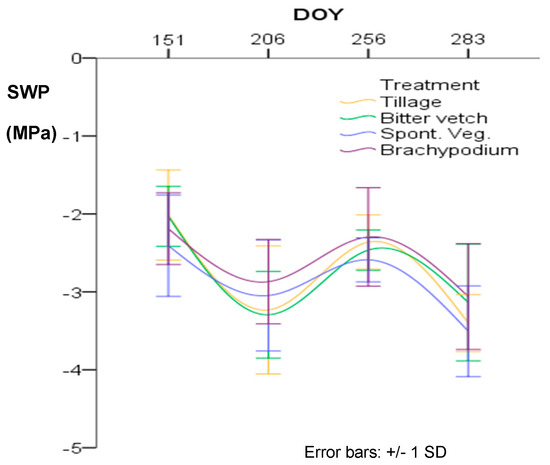
Figure 9.
Steam water potential (SWP) in four moments of the crop season for the different treatments. DOY: day of the year. No statistically significant differences were found between treatments at p < 0.05 according to Tukey’s test (N = 12).
Olive fruit weight under the different treatments was only statistically significant different at the end of the season, at the harvest moment (Figure 10). Heavier olive fruits were measured under the permanent groundcovers (2.8 g fruit−1) regarding TIL (2.5 g fruit−1). As can be seen in Table 6, olive fruits were picked up with the same maturity index, around 3 (more than the half of the surface was turning purple). In 2017, yield tree was three-fold higher in olive trees of TIL treatment (10.2 kg ha−1) than in BRA treatment (3.3 kg ha−1), with an intermediate yield of BIT and SVE treatments (8.9 and 5.4 kg ha−1, respectively). The water and oil contents in dry matter were similar among the different treatments, and thus the oil content in fresh matter was not statistically different. Pruning weight was 40% higher in olive trees under TIL treatment (8.0 kg tree−1) regarding olive trees under SVE treatment (5.2 kg tree−1), with the other groundcovers in an intermediate position.
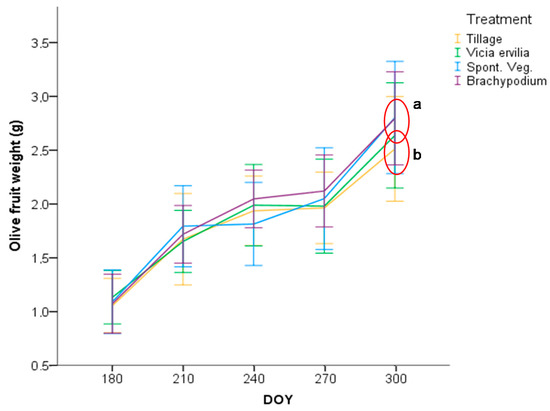
Figure 10.
Olive fruit weight evolution across the crop season 2016/2017 for the four treatments. Statistically significant differences between treatments at p < 0.05 according to Tukey’s test (N = 40) were marked with a red ring and different letters.

Table 6.
Maturity index, yield, humidity, and oil accumulation for the different treatments and years.
All the VOOs obtained were classified as extra virgin olive oils according to the regulation in [53], without significant differences among the four treatments (Supplementary Materials, Table S5). In relation to the sensory parameters, all of the oils had a medium consistency, with clear, bitter, and pungent notes, as is characteristic of Cornicabra oils. VOO of BIT treatment had the lowest scores in bitterness and pungency (4.0 and 4.3, respectively), whilst SVE and BRA VOOs had the highest (4.75 and 4.85 on average for bitter and pungent), with no significant differences (Supplementary Materials, Table S5).
Total phenol content in the VOOs was statistically different under the different treatments (Table 7). VOOs from BIT had the lowest phenol content (783 mg kg−1), compared to SVE and BRA treatments (898 and 935 mg kg−1, respectively). The carotenoid and chlorophyll contents were the highest under BIT treatment, and thus, so was total pigment content—although no statistically significant differences were found. Regarding color, luminosity (L) and a* parameters were similar between all the treatments. VOOs from BIT treatment were more yellowish than those from BRA (lower b* value).

Table 7.
Olive oil parameters for the different treatments in 2017.
4. Discussion
Generally, the scientific literature shows successful experiments with groundcovers in woody crops [54,55,56] with high plant cover and increasing organic inputs. However, sometimes Mediterranean farmers have to deal with low fertile eroded soils under challenging climatic conditions. In this work, we show the results of a field trial in an olive orchard in a low-quality gypsic soil under semiarid conditions where farmers are far from adopting alternative soil management strategies [30,57,58]. For that purpose, we analyzed soil and yield parameters across three cropping seasons.
Gypsic soils are subjected to several issues and vegetation growth development limitations, especially in arid and semiarid ecosystems [59]. In this regard, plant cover percentage in spring, after three years, was relatively low [30] and only BRA had more than 50%; SVE and BIT had around 25%. Nevertheless, it was enough to promote changes in soil properties, as other researchers found [24,60].
The BRA treatment showed higher SOC stock at 0–10 cm depth, but the biggest increase that was statistically significant was at 0–5 cm. At this depth, the increase of SOC stocks was constant and reached 2.15 Mg ha−1 in BRA above TIL. The annual SOC gain rate was around 1 Mg ha−1 at 0–10, which is consistent with many trials performed with permanent GC [60,61,62,63,64]. The increase in SOC is related to the improvement of many soil properties [8,65,66,67]. The BRA treatment improved soil structure by a significant increase in aggregate stability, making soil less erodible [68]. Moreover, García-Díaz et al. [24] demonstrated that groundcovers even with poor implementation can reduce runoff and nutrient loss.
Both permanent groundcovers appeared to undergo a soil compaction process because of their statistically significantly increased bulk density and penetration resistance at the topsoil. That is particularly concerning in BRA, where macroporosity decreased significantly and infiltration rates showed lower values than the other treatments (not statistically significant). Although in previous works, García-Díaz et al. [60] pointed out the relatively higher importance of pore connection than pore volume, the decrease on infiltration rates should be further analyzed after more years of BRA groundcover to check the significance of this decrease.
The SVE and BIT treatments had intermediate values of SOC stocks without differing significantly from conventional tillage. However, both GCs increased macro aggregate stability regarding tillage, making them less prone to soil erosion [14,58,69]. The BIT treatment showed similar values of SOC stock at 0–5 cm to BRA without soil compaction. Conversely, BIT had the lowest bulk density and highest macroporosity. Since BIT was ploughed once a year before seeding, it was highly efficient at sequestrating carbon with the additional benefit of avoiding soil compaction.
There were no significant differences among treatments regarding soil moisture, water stress, and population sizes of microorganisms. Soil improvements of BRA led to score the lowest water stress and highest soil moisture content, particularly at 30 cm. On the other hand, SVE showed the highest values of water stress, and soil moisture was lower than in the other treatments because of water uptake of weed sprout after the cut in May.
Concerning soil and plant microbiological biomass, a positive correlation found in this work was that population sizes of nematodes, fungi, and bacteria extracted and/or isolated from the surfaces of plant roots were either equal or higher by at least one order of magnitude than those obtained from soil and/or the aerial parts of the plants in all the four treatments for the three groups of microorganisms, indicating increments in microbiological biomass triggered by the presence of plant roots, as described in McDaniel et al. and Finney et al. [28,70]. It should be noted that results of population sizes of epiphytic microorganisms on plant roots were equally estimated per gram in all the four treatments, but in the field, the overall contribution of plant roots per plot was not the same between GC and TIL, since the number of plants growing per plot was higher in GC than in TIL, where only some plants could be found. In that sense, the presence of plant roots in GC would allow for reductions in the numbers of microbial forms of latency due to their contribution to improvement of aeration and water retention in soil and production of exudates that can promote efficiency and growth of microorganisms [28,29,71]. However, effects of GC on the generated microbiological biomass were reported with variable results. Thus, total microbial biomass was unaffected by GC, although it was found to be more biologically active, and authors suggested that GC duration might not have been enough to stimulate an increase in total biomass [71]. Similarly, a limited or non-significant effect caused by GC on microorganisms was also observed [72,73], although, alternatively, microbial biomass was increased by GC [28,74]. Moreover, in this work, no tendency was perceived in a particular GC to generate higher microbiological biomass in terms of populations of nematodes, fungi, and bacteria in comparison to the rest of GC treatments, meaning that GC composition was not significant at this respect, similarly to Finney et al. [28], and probably suggesting the convenience of extending the field trial to allow for an adequate establishment of microbiological populations in the different GC treatments, without discarding the possibility of some other influencing factors that could be stronger determinants.
In 2017 the olive yield in BRA was exceptionally low compared with tillage. The 2017 spring was exceptionally hot and dry (Supplementary Materials Tables S1–S3), which can produce a decisive water stress for olive production [75,76,77,78] particularly on gypsiferous soils [79,80,81]. Nonetheless, water stress, soil moisture data, and AWC do not sustain the idea of water uptake as a limiting factor. We found the lowest N leaf content in BRA in 2017, and that could be a limiting factor, particularly under drought conditions [52]. Water and nutrient uptake of a certain year could have critical impacts on next year’s crop in woody olive groves [82]. There were not differences among treatments regarding water stress and water volumetric content, but the N leaf content in 2016 and 2017 (Supplementary Materials, Table S6) BRA was the lowest. In the context of water stress for all treatments, a small difference in a critical nutrient, such as N, was decisive for current and next crop season. This argument is supported by BIT performance, which had similar water stress and soil moisture values but higher N leaf content than BRA, and that promoted a similar olive yield to TIL in the last year (Supplementary Materials, Figure S1). Other authors found a similar reduction in olive yield due to water stress [83] on young trees managed with groundcovers regarding tilling management [84], while Corleto and Cazzato [85] observed a reduction in fruit yield under soil management with perennial species but not with annual legume species regarding conventional tillage, which is similar to the results of this study. At harvest time, heavy fruits were measured under BRA and SVE treatments due to the low yield crop, as has been observed by other authors [86].
More years of comparative field trial are necessary to extract conclusions about the influence of groundcover on VOO quality. In this work, VOO´s quality was similar between treatments and all the oils belonged to the highest extra virgin category according to Regulation 1348/2013 [53]. Permanent groundcovers tended to increase bitterness and pungency parameters due to the increase in total phenol content provoked by water [77] or nutrient stress [86].
Total phenol content in the VOOs was affected by the treatment (Table 7). This influence is driven by the nitrogen leaf content, as the VOOs from BIT treatment had the lowest phenol content and the higher N leaf level, compared to the lower total phenol content in SVE and BRA treatments which had the lower N leaf content. The N leaf content had a direct relationship with total phenol level, which decreased in response to higher doses of N [86,87]. The carotenoid and chlorophyll contents were the highest under BIT treatment, probably due to the higher N leaf content, and thus, total pigment content (although not statistically significant) differences were found.
Overall, BRA promoted the biggest soil and olive yield changes regarding the control treatment. Permanent GC of grass species such as BRA is not recommended in rainfed and non-fertilized farming conditions because of N competition. This research demonstrated that in woody crops in semiarid conditions, farmers must be aware not only of reducing water competition by killing weeds, but also of nutrient leaf content.
One of the main reasons for using spontaneous vegetation for groundcovers is because it has the cheapest implementation costs, it promotes biodiversity [88,89,90,91], and after several seasons with many cuts, the groundcovers tend to be composed of small perennial weeds with reduced water and nutrient uptake. However, in this work we have pointed out that in poor soils in semiarid climate, weed management of SVE could be challenging because its poor development and reduced organic inputs have several consequences. First, the reduced plant cover could be triggering erosion processes. Second, soils tend to evolve slowly and its practice could be discarded by farmers before positive outcomes [40]. Third, it obligates farmers to be more aware and better trained than other soil management strategies [92], because arable weeds are successful colonizing disturbed sites [93].
The BIT treatment was tilled, seeded, and mowed every season; hence, it was the most time and money-demanding treatment. However, BIT improved soil parameters and N leaf content with a similar olive yield to TIL. Gómez et al. [55] stated, “This potential risk of a yield decrease remains a major obstacle for expanding the use of temporary cover crops in Mediterranean tree crops particularly under rainfed conditions.” Thus, in such conditions, BIT can encourage farmers to adopt GC and change the current soil management paradigm.
5. Conclusions
The joint occurrences of several factors have led to soil degradation and unsustainable soil management in semiarid woody crops in the Mediterranean Basin. Multiyear field trials with soil and yield parameters are needed to assess alternative strategies to improve soil fertility and yields. Three years were enough to obtain significant differences between GC and TIL in certain soil and yield parameters. The GC had higher microbiological biomass on plant roots per plot, improved soil quality, and improved SOC stocks; and BRA had the biggest impact on soil but reduced yield with a remarkable decrease at the third crop season. Contrary to expectations, this decrease was related to N availability (competition by GC) and not to water competition. In this regard, BIT improved SOC stocks and aggregate stability with a similar yield to TIL. Consequently, in semiarid olive groves, legume GCs such as BIT are considered the best strategy to protect and improve soil quality while maintaining olive yield and VOO quality. In this regard, this research team encourages policy makers and technicians to support farmers to adopt GC and protect the environmental and cultural heritage of woody crops in the Mediterranean Basin.
Supplementary Materials
The following are available online at https://www.mdpi.com/2073-4441/12/8/2230/s1, Figure S1 Olive fruit production percentage variation regarding season average for the olive trees studied seasons and the four treatments, Table S1: Average monthly temperature (Celsius degrees) from 2013 to 2018 in the studied area, Table S2. Monthly rainfall (mm) from 2013 to 2018 in the studied area, Table S3. Spring (March, April and May) average temperature (Celsius degrees) and accumulated rainfall (mm) from each crop season, Table S4. Measured field parameters in 2017 for the different treatments, Table S5. Regulated olive oil parameters for the different treatments in 2017, Table S6. Leaf nitrogen content for the different treatments and years. Average ± standard deviation.
Author Contributions
Conceptualization, B.S. and A.G.-D.; data curation, B.S. and A.G.-D.; formal analysis, B.S., B.Á., O.A., M.Á.P. and A.G.-D.; funding acquisition, R.B.; investigation, B.S., M.J.M., R.B. and A.G.-D.; methodology, B.S., B.Á., M.Á.P., M.J.M. and A.G.-D.; project administration, R.B.; resources, O.A.; writing—original draft, B.S.; writing—review and editing, B.S., B.Á., M.Á.P., M.J.M., R.B. and A.G.-D. All authors have read and agreed to the published version of the manuscript.
Funding
This research was funded by regional and national funding projects AGRISOST-CM (S2013/ABI-2717); FP12-CVO; ACCION Project, GO-LEÑOSOST.
Acknowledgments
We thank the staff of the La Chimenea experimental farm in Aranjuez for their help; we are also grateful to Alfredo Cuevas for his collaboration.
Conflicts of Interest
All the authors declare no conflict of interest.
References
- FAOSTAT. Food and Agriculture Organization of the United Nations-FAOSTAT Database; FAOSTAT: Rome, Italy, 2020. [Google Scholar]
- Aparicio, R.; Harwood, J. Handbook of Olive Oil. Analysis and Properties, 2nd ed.; Springer: Boston, MA, USA, 2013; p. 772. [Google Scholar]
- Makowski, D.; Nesme, T.; Papy, F.; Doré, T. Global agronomy, a new field of research. A review. Agron. Sustain. Dev. 2014, 34, 293–307. [Google Scholar] [CrossRef]
- Wu, H.; Wang, S.; Gao, L.; Zhang, L.; Yuan, Z.; Fan, T.; Wei, K.; Huang, L. Nutrient-derived environmental impacts in Chinese agriculture during 1978–2015. J. Environ. Manag. 2018, 217, 762–774. [Google Scholar] [CrossRef] [PubMed]
- Jones, R.J.A.; Montanarella, L. Land Degradation in Central and Eastern Europe. European Soil Bureau Research Report No.10, EUR 20688 EN; Office for Official Publications of the European Communities: Luxembourg, 2003; p. 324. [Google Scholar]
- FAO. Food and Agriculture Organization of the United Nations. 2017. Available online: http://www.fao.org/news/archive/news-by-date/2017/en/ (accessed on 3 May 2020).
- Balesdent, J.; Chenu, C.; Balabane, M. Relationship of soil organic matter dynamics to physical protection and tillage. Soil Tillage Res. 2000, 53, 215–230. [Google Scholar] [CrossRef]
- Virto, I.; Imaz, M.J.; Fernandez-Ugalde, O.; Urrutia, I.; Enrique, A.; Bescansa, P. Soil quality evaluation following the implementation of permanent cover crops in semi-arid vineyards. Organic matter, physical and biological soil properties. Span. J. Agric. Res. 2012, 10, 1121–1132. [Google Scholar] [CrossRef]
- Reeves, D. The role of soil organic matter in maintaining soil quality in continuous cropping systems. Soil Tillage Res. 1997, 43, 131–167. [Google Scholar] [CrossRef]
- Salomé, C.; Coll, P.; Lardo, E.; Metay, A.; Villenave, C.; Marsden, C.; Blanchart, E.; Hinsinger, P.; Le Cadre, E. The soil quality concept as a framework to assess management practices in vulnerable agroecosystems: A case study in Mediterranean vineyards. Ecol. Ind. 2016, 61, 456–465. [Google Scholar] [CrossRef]
- Kay, B. Soil structure and organic carbon: A review. In Soil Processes and the Carbon Cycle; CRC Press: Boca Raton, FL, USA, 2018; pp. 169–197. [Google Scholar]
- Tisdall, J.M.; Oades, J. Organic matter and water-stable aggregates in soils. J. Soil Sci. 1982, 33, 141–163. [Google Scholar] [CrossRef]
- Kleber, M.; Sollins, P.; Sutton, R. A conceptual model of organo-mineral interactions in soils: Self-assembly of organic molecular fragments into zonal structures on mineral surfaces. Biogeochemistry 2007, 85, 9–24. [Google Scholar] [CrossRef]
- Six, J.; Bossuyt, H.; Degryze, S.; Denef, K. A history of research on the link between (micro) aggregates, soil biota, and soil organic matter dynamics. Soil Tillage Res. 2004, 79, 7–31. [Google Scholar] [CrossRef]
- Francia, M.J.R.; Duran-Zuazo, V.H.; Martinez, R.A. Environmental impact from mountainous olive orchards under different soil-management systems (SE Spain). Sci. Total Environ. 2006, 358, 46–60. [Google Scholar] [CrossRef]
- Bienes, R.; Ruiz, M.; Marques, M.J. Pérdida de suelo, fósforo y materia orgánica por erosión hídrica en parcelas revegetadas con matorral autóctono bajo clima semiárido [Loss of soil, phosphorous and organic matter by hydric erosion in revegetated plots with authoctonous shrubs under semiarid climate]. Rev. Ciênc. Agrár. 2010, 33, 58–69. [Google Scholar]
- Aguilera, E.; Guzmán, G.I.; de Molina, M.G.; Soto, D.; Infante-Amate, J. From animals to machines. The impact of mechanization on the carbon footprint of traction in Spanish agriculture: 1900–2014. J. Clean. Prod. 2019, 221, 295–305. [Google Scholar] [CrossRef]
- Ballabio, C.; Panagos, P.; Monatanarella, L. Mapping topsoil physical properties at European scale using the LUCAS database. Geoderma 2016, 261, 110–123. [Google Scholar] [CrossRef]
- Nadal-Romero, E.; González-Hidalgo, J.C.; Cortesi, N.; Desir, G.; Gómez, J.A.; Lasanta, T.; Lucía, A.; Marín, C.; Martínez-Murillo, J.F.; Pacheco, E.; et al. Relationship of runoff, erosion and sediment yield to weather types in the Iberian Peninsula. Geomorphology 2015, 228, 372–381. [Google Scholar] [CrossRef]
- Rodrigo, C.J.; Senciales, J.; Ramos, M.a.; Martínez-Casasnovas, J.A.; Lasanta, T.; Brevik, E.C.; Ries, J.B.; Sinoga, J.R. Understanding soil erosion processes in Mediterranean sloping vineyards (Montes de Málaga, Spain). Geoderma 2017, 296, 47–59. [Google Scholar] [CrossRef]
- Tarolli, P.; Sofia, G.; Calligaro, S.; Prosdocimi, M.; Preti, F.; Dalla, F.G. Vineyards in terraced landscapes: New opportunities from lidar data. Land Degrad. Dev. 2015, 26, 92–102. [Google Scholar] [CrossRef]
- Keesstra, S.; Pereira, P.; Novara, A.; Brevik, E.C.; Azorin-Molina, C.; Parras-Alcantara, L.; Jordan, A.; Cerdà, A. Effects of soil management techniques on soil water erosion in apricot orchards. Sci. Total Environ. 2016, 551, 357–366. [Google Scholar] [CrossRef]
- Marchamalo, M.; Hooke, J.M.; Sandercock, P.J. Flow and sediment connectivity in semi-arid landscapes in SE Spain: Patterns and controls. Land Degrad. Dev. 2016, 27, 1032–1044. [Google Scholar] [CrossRef]
- García-Díaz, A.; Bienes, R.; Sastre, B.; Novara, A.; Gristina, L.; Cerdà, A. Nitrogen losses in vineyards under different types of soil groundcover. A field runoff simulator approach in central Spain. Agric. Ecosyst. Environ. 2017, 236, 256–267. [Google Scholar] [CrossRef]
- Gómez, J.A.; Campos, M.; Guzmán, G.; Castillo-Llanque, F.; Vanwalleghem, T.; Lora, Á.; Giráldez, J.V. Soil erosion control, plant diversity, and arthropod communities under heterogeneous cover crops in an olive orchard. Environ. Sci. Pollut. Res. 2018, 25, 977–989. [Google Scholar] [CrossRef]
- García-Orenes, F.; Guerrero, C.; Mataix-Solera, J.; Navarro-Pedreño, J.; Gómez, I.; Mataix-Beneyto, J. Factors controlling the aggregate stability and bulk density in two different degraded soils amended with biosolids. Soil Tillage Res. 2005, 82, 65–76. [Google Scholar] [CrossRef]
- Castellano-Hinojosa, A.; Strauss, S.L. Impact of cover crops on the soil microbiome of tree crops. Microorganisms 2020, 8, 328. [Google Scholar] [CrossRef] [PubMed]
- Finney, D.; Buyer, J.; Kaye, J. Living cover crops have immediate impacts on soil microbial community structure and function. J. Soil Water Conserv. 2017, 72, 361–373. [Google Scholar] [CrossRef]
- Sharma, P.; Singh, A.; Kahlon, C.S.; Brar, A.S.; Grover, K.K.; Dia, M.; Steiner, R.L. The role of cover crops towards sustainable soil health and agriculture—A review paper. Am. J. Plant Sci. 2018, 9, 1935–1951. [Google Scholar] [CrossRef]
- Sastre, B.; Barbero-Sierra, C.; Bienes, R.; Marques, M.J.; García-Díaz, A. Soil loss in an olive grove in Central Spain under cover crops and tillage treatments, and farmer perceptions. J. Soils Sediments 2017, 17, 873–888. [Google Scholar] [CrossRef]
- Rallo, L.; Barranco, D.; Caballero, J.M.; del Río, C.; Martín, A.; Tous, J.; Trujillo, I. Variedades de Olivo en España [Olive Tree Cultivars in Spain]; Junta de Andalucía, MAPA y Ediciones Mundi-Prensa: Madrid, Spain, 2005. [Google Scholar]
- United States Department of Agriculture Natural Resources Conservation Service. Soil Survey Staff. In Keys to Soil Taxonomy, 12th ed.; United States Department of Agriculture Natural Resources Conservation Service: Washington, DC, USA, 2014; p. 372. [Google Scholar]
- IUSS Working Group WRB. World Reference Base for Soil Resources 2014. International soil classification system for naming soils and creating legends for soil maps. In World Soil Resources Reports No. 106; FAO: Rome, Italy, 2014. [Google Scholar]
- Walkley, A.; Black, I.A. An examination of Degtjareff method for determining soil organic matter and a proposed modification of the chromic acid titration method. Soil Sci. 1934, 37, 29–38. [Google Scholar] [CrossRef]
- Imeson, A.C.; Vis, M. Assessing soil aggregate stability by water-drop impact and ultrasonic dispersion. Geoderma 1984, 34, 185–200. [Google Scholar] [CrossRef]
- Cerdà, A. Soil aggregate stability under different Mediterranean vegetation types. Catena 1998, 32, 73–86. [Google Scholar] [CrossRef]
- Richards, L.A. A pressure-membrane extraction apparatus for soil solution. Soil Sci. 1941, 51, 377–386. [Google Scholar] [CrossRef]
- Blake, G.R.; Hartge, K.H. Bulk Density. In Methods of Soil Analysis, Part I. Physical and Mineralogical Methods: Agronomy Monograph No. 9, 2nd ed.; Klute, A., Ed.; SSSA: Madison, WI, USA, 1986; pp. 363–375. [Google Scholar]
- Taboada, M.; Barbosa, O.; Rodríguez, M.; Cosentino, D. Mechanisms of aggregation in a silty loam under different simulated management regimes. Geoderma 2004, 123, 233–244. [Google Scholar] [CrossRef]
- Bienes, R.; Marques, M.J.; Sastre, B.; García-Díaz, A.; Ruiz-Colmenero, M. Eleven years after shrub revegetation in semiarid eroded soils. Influence in soil properties. Geoderma 2016, 273, 106–114. [Google Scholar] [CrossRef]
- USDA. Soil Quality Test Kit Guide; Soil Quality Institute, National Resources Conservation Service, US Department of Agriculture: Lincoln, NE, USA; Washington, DC, USA, 2001; p. 82.
- EPPO. PM 7/119 (1) Nematode extraction. EPPO Bull. 2013, 43, 471–495. [Google Scholar] [CrossRef]
- Beltrán, G.; Uceda, M.; Hermoso, M.; Frías, L. Maduración. In El Cultivo Del Olivo, 6th ed.; Barranco, D., Fernández-Escobar, R., Rallo, L., Eds.; Ediciones Mundi-Prensa y Junta de Andalucía: Madrid, Spain, 2008; pp. 163–187. [Google Scholar]
- del Río, C.; Romero, A.M. Whole, unmilled olives can be used to determine their Oil content by Nuclear Magnetic Resonance. HortTechnology 1999, 9, 675–680. [Google Scholar] [CrossRef]
- Martínez, S.J.M.; Muñoz, A.E.; Alba, M.J.; Lanzón, R.A. Informe sobre utilización del analizador de rendimientos “Abencor”. Grasas Aceites 1975, 26, 379–385. [Google Scholar]
- Regulation, H. Commission Regulation (EEC) No 2568/91 of July 1991 on the Characteristics of Olive and Olive Pomace Oils and their Analytical Methods. Off. J. Eur. Communities L 1991, 248, 1–82. [Google Scholar]
- European Commission. Commission Regulation (EC) 640/2008 of 4 July 2008 Amending Regulation (EEC) 2568/91 on the characteristics of olive oil and olive-residue oil and on the relevant methods of analysis. Eur. Communities Off. J. 2008, 178, 11–16. [Google Scholar]
- Vázquez, R.A.; Janer, d.V.C.; Janer, d.V.M.L. Determinación de polifenoles totales del Aceite de Oliva. Grasas Aceites 1973, 24, 350–357. [Google Scholar]
- Minguez-Mosquera, M.I.; Rejano-Navarro, L.; Gandul-Rojas, B.; Sanchez-Gomez, A.H.; Garrido-Fernandez, J. Color-Pigment Correlation in Virgin Olive Oil. J. Am. Oil Chem. Soc. 1991, 68, 332–336. [Google Scholar] [CrossRef]
- Standard UNE (Normalization Spanish Association) 72031:1983. Colorimetric Quantities: 1983. Available online: https://www.aenor.com/normas-y-libros/buscador-de-normas/une?c=N0006977 (accessed on 1 February 2016).
- IBM Corp. IBM SPSS Statistics for Windows, version 19.0; IBM Corp: Armonk, NY, USA, 2010. [Google Scholar]
- Fernández-Escobar, R. Fertilización. In El Cultivo Del Olivo, 6th ed.; Barranco, D., Fernández-Escobar, R., Rallo, L., Eds.; Junta de Andalucía, Consejería de Agricultura y Pesca & Ediciones Mundi-Prensa: Madrid, Spain, 2008; pp. 297–336. [Google Scholar]
- Regulation (EU) 1348/2013. Commission Implementing Regulation (EU) 1348/2013 of 16 December 2013 Amending Regulation (EEC) 2568/91 on the Characteristics of Olive Oil and Olive-Residue Oil and on the Relevant Methods of Analysis. Eur. Communities Off. J. 2013, 338, 192–213. [Google Scholar]
- Prosdocimi, M.; Cerdà, A.; Tarolli, P. Soil water erosion on Mediterranean vineyards: A review. Catena 2016, 141, 1–21. [Google Scholar] [CrossRef]
- Gómez, J.A. Sustainability through use of cover crops in Mediterranean tree crops such as olives and vines: Current knowledge and challenges. Hugarian Geogr. Bull. 2017, 66, 13–28. [Google Scholar] [CrossRef]
- Gómez, J.A.; Infante-Amate, J.; González, d.M.M.; Vanwalleghem, T.; Taguas, E.V.; Lorite, I. Olive cultivation, its impact on soil erosion and its progression into yield impacts in Southern Spain in the past as a key to a future of increasing climate uncertainty. Agriculture 2014, 4, 170–198. [Google Scholar] [CrossRef]
- Marques, M.J.; Bienes, R.; Cuadrado, J.; Ruiz-Colmenero, M.; Barbero-Sierra, C.; Velasco, A. Analysing perceptions attitudes and responses of winegrowers about sustainable land management in central Spain. Land Degrad. Dev. 2015, 26, 458–467. [Google Scholar] [CrossRef]
- Ruiz-Colmenero, M.; Bienes, R.; Eldridge, D.J.; Marques, M.J. Vegetation cover reduces erosion and enhances soil organic carbon in a vineyard in the central Spain. Catena 2013, 104, 153–160. [Google Scholar] [CrossRef]
- Van Alphen, J.; Rios, R.F. Gypsiferous Soils, Notes on Their Characteristics and Management; ILRI: Wageningen, The Netherlands, 1971. [Google Scholar]
- García-Díaz, A.; Marqués, M.J.; Sastre, B.; Bienes, R. Labile and stable soil organic carbon and physical improvements using groundcovers in vineyards from central Spain. Sci. Total Environ. 2018, 621, 387–397. [Google Scholar] [CrossRef] [PubMed]
- Gómez, J.A.; Guzmán, G.; Giráldez, J.V.; Fereres, E. The influence of cover crops and tillage on water and sediment yield, and on nutrient, and organic matter losses in an olive orchard on a sandy loam soil. Soil Tillage Res. 2009, 106, 137–144. [Google Scholar] [CrossRef]
- Peregrina, F.; Larrieta, C.; Ibanez, S.; Garcia-Escudero, E. Labile Organic Matter, Aggregates, and Stratification Ratios in a Semiarid Vineyard with Cover Crops. Soil Sci. Soc. Am. J. 2010, 74, 2120–2130. [Google Scholar] [CrossRef]
- Peregrina, F.; Perez-Alvarez, E.P.; Garcia-Escudero, E. The short term influence of aboveground biomass cover crops on C sequestration and beta-glucosidase in a vineyard ground under semiarid conditions. Span. J. Agric. Res. 2014, 12, 1000–1007. [Google Scholar] [CrossRef]
- Sastre, B.; Marques, M.J.; García-Díaz, A.; Bienes, R. Three Years of Management with Cover Crops Protecting Sloping Olive Groves Soils, Carbon and Water Effects on Gypsiferous Soil. Catena 2018, 171, 115–124. [Google Scholar] [CrossRef]
- Lagomarsino, A.; Moscatelli, M.; Di Tizio, A.; Mancinelli, R.; Grego, S.; Marinari, S. Soil biochemical indicators as a tool to assess the short-term impact of agricultural management on changes in organic C in a Mediterranean environment. Ecol. Ind. 2009, 9, 518–527. [Google Scholar] [CrossRef]
- Lampurlanés, J.; Cantero-Martínez, C. Hydraulic conductivity, residue cover and soil surface roughness under different tillage systems in semiarid conditions. Soil Tillage Res. 2006, 85, 13–26. [Google Scholar] [CrossRef]
- Palese, A.M.; Vignozzi, N.; Celano, G.; Agnelli, A.E.; Pagliai, M.; Xiloyannis, C. Influence of soil management on soil physical characteristics and water storage in a mature rainfed olive orchard. Soil Tillage Res. 2014, 144, 96–109. [Google Scholar] [CrossRef]
- Le Bissonnais, Y.; Blavet, D.; De Noni, G.; Laurent, J.; Asseline, J.; Chenu, C. Erodibility of Mediterranean vineyard soils: Relevant aggregate stability methods and significant soil variables. Eur. J. Soil Sci. 2007, 58, 188–195. [Google Scholar] [CrossRef]
- Gómez, J.A.; Sobrinho, T.A.; Giráldez, J.V.; Fereres, E. Soil management effects on runoff, erosion and soil properties in an olive grove of Southern Spain. Soil Tillage Res. 2009, 102, 5–13. [Google Scholar] [CrossRef]
- McDaniel, M.; Tiemann, L.; Grandy, A. Does agricultural crop diversity enhance soil microbial biomass and organic matter dynamics? A meta-analysis. Ecol. Appl. 2014, 24, 560–570. [Google Scholar] [CrossRef]
- Strickland, M.S.; Thomason, W.E.; Avera, B.; Franklin, J.; Minick, K.; Yamada, S.; Badgley, B.D. Short-term effects of cover crops on soil microbial characteristics and biogeochemical processes across actively managed farms. Agrosyst. Geosci. Environ. 2019, 2, 180064. [Google Scholar] [CrossRef]
- Nakamoto, T.; Komatsuzaki, M.; Hirata, T.; Araki, H. Effects of tillage and winter cover cropping on microbial substrate-induced respiration and soil aggregation in two Japanese fields. Soil Sci. Plant Nutr. 2012, 58, 70–82. [Google Scholar] [CrossRef]
- Liebig, M.A.; Hendrickson, J.R.; Archer, D.W.; Schmer, M.A.; Nichols, K.A.; Tanaka, D.L. Short-term soil responses to late-seeded cover crops in a semi-arid environment. Agron. J. 2015, 107, 2011–2019. [Google Scholar] [CrossRef]
- Schmidt, R.; Gravuer, K.; Bossange, A.V.; Mitchell, J.; Scow, K. Long-term use of cover crops and no-till shift soil microbial community life strategies in agricultural soil. PLoS ONE 2018, 13, e0192953. [Google Scholar] [CrossRef]
- Lavee, S. Biología y fisiología del olivo. In Enciclopedia Mundial Del Olivo; COI, Ed.; Conceil Oléicole International: Madrid, Spain, 1996; pp. 59–106. [Google Scholar]
- Therios, I.N. Climate and soil conditions. In Olives. Crop Production Science in Horticulture. Series No 18; CAB International: Wallingford, UK, 2009; pp. 51–80. [Google Scholar]
- Fernández, J. Understanding olive adaptation to abiotic stresses as a tool to increase crop performance. Environ. Exp. Bot. 2014, 103, 158–179. [Google Scholar] [CrossRef]
- Rallo, L.; Cuevas, J. Fructificación y producción. In El Cultivo Del Olivo, 6th ed.; Barranco, D., Fernández-Escobar, R., Rallo, L., Eds.; Ediciones Mundi-Prensa-Junta de Andalucía Madrid: Madrid, Spain, 2008; Volume 6, pp. 127–162. [Google Scholar]
- Hernando, F.V.; Sánchez, C.M.; Contreras, J. Influencia de los niveles de yeso y de humedad en la fertilidad de un suelo yesoso. An. Edafol. Agrobiol. 1963, 22, 322–337. [Google Scholar]
- Hernando, V.; Sanchez, C.M.; Contreras, J. Study of the mineral nutrition of maize on soils rich in gypsum. Zolfo Agric. Palermo 1965, 1964, 398–411. [Google Scholar]
- Doorenbos, J.; Pruitt, W.O. Guidelines for Predicting Crop Water Requirements; Irrigation and Drainage Paper; FAO: Rome, Italy, 1975; Volume 24, p. 179. [Google Scholar]
- Barranco, D. Variedades y patrones. In El Cultivo Del Olivo, 6th ed.; Barranco, D., Fernández-Escobar, R., Rallo, L., Eds.; Ediciones Mundi-Prensa y Junta de Andalucía: Madrid, Spain, 2008; p. 846. [Google Scholar]
- Moriana, A.; Orgaz, F.; Pastor, M.; Fereres, E. Yield responses of a mature olive orchard to water deficits. J. Am. Soc. Hort. Sci. 2003, 128, 425–431. [Google Scholar] [CrossRef]
- Caruso, G.; Gucci, R.; Sifola, M.I. Soil Management Affects Yield Components of Young Olive Trees under Deficit Irrigation. Acta Hortic. 2011, 924, 219–223. [Google Scholar] [CrossRef]
- Corleto, A.; Cazzato, E. Effects of different soil management practices on production, quality and soil physico-chemical characteristics of an olive grove in Southern Italy. Acta Hortic. 2008, 767, 319–328. [Google Scholar] [CrossRef]
- Rallo, L.; Diez, C.M.; Morales-Sillero, A.; Miho, H.; Priego-Capote, F.; Rallo, P. Quality of olives: A focus on agricultural preharvest factors. Sci. Hortic. 2018, 233, 491–509. [Google Scholar] [CrossRef]
- Dag, A.; Erel, R.; Kerem, Z.; Ben-Gal, A.; Stern, N.; Bustan, A.; Zipori, I.; Yermiyahu, U. Effect of nitrogen availability on olive oil quality. Viii Int. Olive Symp. 2018, 1199, 465–469. [Google Scholar] [CrossRef]
- Guzmán, G.; Cabezas, J.M.; Sánchez-Cuesta, R.; Lora, Á.; Bauer, T.; Strauss, P.; Winter, S.; Zaller, J.; Gómez, J. A field evaluation of the impact of temporary cover crops on soil properties and vegetation communities in southern Spain vineyards. Agric. Ecosyst. Environ. 2019, 272, 135–145. [Google Scholar] [CrossRef]
- Hall, R.M.; Penke, N.; Kriechbaum, M.; Kratschmer, S.; Jung, V.; Chollet, S.; Guernion, M.; Nicolai, A.; Burel, F.; Fertil, A. Vegetation management intensity and landscape diversity alter plant species richness, functional traits and community composition across European vineyards. Agric. Syst. 2020, 177, 102706. [Google Scholar] [CrossRef]
- Kratschmer, S.; Pachinger, B.; Schwantzer, M.; Paredes, D.; Guzmán, G.; Goméz, J.A.; Entrenas, J.A.; Guernion, M.; Burel, F.; Nicolai, A. Response of wild bee diversity, abundance, and functional traits to vineyard inter-row management intensity and landscape diversity across Europe. Ecol. Evol. 2019, 9, 4103–4115. [Google Scholar] [CrossRef]
- Winter, S.; Bauer, T.; Strauss, P.; Kratschmer, S.; Paredes, D.; Popescu, D.; Landa, B.; Guzmán, G.; Gómez, J.A.; Guernion, M. Effects of vegetation management intensity on biodiversity and ecosystem services in vineyards: A meta-analysis. J. Appl. Ecol. 2018, 55, 2484–2495. [Google Scholar] [CrossRef] [PubMed]
- Cano, E.; Cano-Ortiz, A.; Musarella, C.; Fuentes, J.P.; Ighbareyeh, J.; Gea, F.L.; del Río, S. Mitigating climate change through bioclimatic applications and cultivation techniques in agriculture (Andalusia, Spain). In Sustainable Agriculture, Forest and Environmental Management; Jhariya, M., Banerjee, A., Meena, R., Yadav, D., Eds.; Springer: Singapore, 2019; pp. 31–69. [Google Scholar]
- Mohler, C.L.; Liebman, M.; Staver, C.P. Weed life history: Identifying vulnerabilities. In Ecological Management of Agricultural Weeds; Staver, C.P., Mohler, C.L., Liebman, M., Eds.; Cambridge University Press: Cambridge, UK, 2001; pp. 40–98. [Google Scholar]
© 2020 by the authors. Licensee MDPI, Basel, Switzerland. This article is an open access article distributed under the terms and conditions of the Creative Commons Attribution (CC BY) license (http://creativecommons.org/licenses/by/4.0/).