Article

Evaluation of the Hydraulic Performance of a Rear-Parapet Vertical Breakwater under Regular Waves through Hydraulic Experiments

1
International Hybrid Hydraulic Research Center, Rural Research Institute, Korea Rural Community Corporation, Gyeonggi-do 15634, Korea
2
Coastal Development and Ocean Energy Research Center, Korea Institute of Ocean Science & Technology, Busan 49111, Korea
*
Author to whom correspondence should be addressed.
Water 2020, 12(9), 2428; https://doi.org/10.3390/w12092428
Submission received: 15 June 2020 / Revised: 25 August 2020 / Accepted: 26 August 2020 / Published: 29 August 2020
(This article belongs to the Special Issue Wave-structure Interaction Processes in Coastal Engineering)

Abstract

:
Climate change has resulted in increased intensity and frequency of typhoons and storm surges. Accordingly, attention has been paid to securing the breakwater’s stability to protect the safety of the port. Herein, hydraulic model experiments were conducted to evaluate the hydraulic performance of a vertical breakwater having a rear parapet. For comparison, cases in which the parapet was placed on the seaside, the harborside, and at the center of the breakwater were considered. Regular waves were used for convenient performance analysis. Five wave gauges and nine pressure transducers were installed to secure physical data for hydraulic performance evaluation. Results showed that a rear parapet can reduce the maximum wave force acting on the breakwater. Even though impulsive pressure was generated, it did not affect the stability of the breakwater owing to the phase difference between the maximum wave pressures acting on the caisson and parapet. By decreasing the maximum wave force, the required self-weight that satisfies the safety factor of 1.2 was reduced by up to 82.7%; the maximum bearing pressure was reduced by up to 47.6% compared with that of the parapet located on the seaside. Thus, the rear parapet was found to be more suitable for actual applications.

1. Introduction

Because of the increases in sea temperature and level due to global warming, typhoon intensities and storm surge heights have increased in recent years [1,2,3]. Harbor cities and facilities are more vulnerable to such events, making it necessary to establish countermeasures for harbors, including hinterland cities. In particular, the Republic of Korea is surrounded by sea on three sides, and the harbor is responsible for more than 99% of the import and export freight of the country. If a typhoon causes damage to the harbor structure, additional damage may occur in the form of the disruption of logistic activities as well as the recovery cost of the harbor structure. Recently, the reinforced harbor structure was once again damaged by high waves because a large typhoon exceeded wave height of the design [4,5,6]. To ensure the safety of the harbor from such environmental changes, it is necessary to maintain the stability of the main breakwater installed at the harbor mouth to prevent waves propagating from the open sea to the harbor. Various studies have been conducted to respond effectively to wave overtopping by increasing the design wave height [7,8,9,10] and utilizing the wave energy corresponding to wave overtopping [11].
Increasing the design wave height increases the wave force acting on the breakwater and leads to an increase in self-weight because the safety factor required by the design code must be satisfied. Hence, the design stage must involve comprehensive consideration, since self-weight is directly related to the bearing capacity of the rubble mound and the safety of the caisson bottom slab.
Recently, two methods have been applied to reinforce the breakwater in Korea. One is covering the front of the caisson with wave-dissipating blocks to reduce the maximum wave force acting the breakwater [12,13], and the other involves installing an additional caisson at the front or rear of the existing caisson to improve the stability directly [6,14]. The former is not difficult to apply in situ, but the existing and additional caissons must be integrated in the latter method, which has been a major concern for design engineers. Both abovementioned reinforcing methods require enormous budgets comparable to that of a new construction, so the reduction of the related costs is an important concern. Therefore, reinforcement cost reduction was among the focuses of this study.
In a breakwater, a concrete cap is installed on the top of the caisson to ensure the necessary weight for breakwater stability, and it is common to utilize a parapet to block overtopped waves effectively without increasing the self-weight. In general, the parapet is placed on the seaside of the concrete cap. In addition, it is somewhat advantageous in terms of the bearing capacity of the rubble mound to shift the center of gravity of the concrete cap from the center of the breakwater to the seaside, which has been the practice in the harbor design industry. However, this approach increases the maximum wave force acting on the breakwater, since the maximum wave force acting on the parapet and the maximum wave force acting on the lower part of the parapet occur simultaneously, which is disadvantageous in terms of stability. When the parapet is placed on the harborside, a phase difference is induced between the maximum wave pressures acting on the front of the breakwater and the parapet, which is helpful in terms of the stability of the breakwater and the bearing capacity of the rubble mound. In Japan, this method has been utilized to reduce the breakwater construction cost by reducing the maximum wave force acting on the breakwater [15,16]. Although Yamamoto et al. [15] suggested that the discharge of the wave overtopping could be increased and that the impulsive wave pressure could be made to act on the parapet, it is worth considering placing the parapet on the harborside owing to its low construction cost. When the parapet is designed as a wave-return wall, such as a flare or a bullnose type, it can effectively counter the increased overtopping discharge [17,18,19,20] and could control the impulsive wave pressure. The wave-return wall is expected to be utilized in reinforcing designs, such as those in which the parapet height of the breakwater is increased by increasing the design wave height, and it is also anticipated to bring about changes in perception regarding parapet positions.
In this study, to evaluate the hydraulic performance and stability of a vertical breakwater with a rear parapet, a hydraulic model experiment was conducted in a two-dimensional wave channel of Korea Institute of Ocean Science and Technology (KIOST). For three models with different installation positions, the water depth, wave height, and period were changed to act as a regular wave, and the wave pressure was measured at nine positions to investigate the features of hydraulic pressure, such as its magnitude and phase difference, and to analyze the wave force acting on the breakwater. Five wave probes were installed to measure the height of the surface elevations. From the measurement results, the major design variable—specifically, the maximum wave pressure, maximum wave force, maximum wave runup, and bearing pressure—were determined, and the required self-weights were calculated using these quantities to compare and analyze the changes in these weights with changes in the parapet position.

2. Experimental Setup and Analytical Methods

2.1. Wave Channel

The regular wave tests were conducted in a 2D wave channel with 50 m length, 1.2 m width, and 1.6 m height, at KIOST in Busan, Republic of Korea, as shown in Figure 1. The wave channel depth varies as the bottom slope ranges from 10 to 20 m on the left side but is constant at 1.25 m when the slope ranges from 20 to 50 m [21]. A piston-type wavemaker (Vazquez y Torres Ingenieria SL, Leganés, Spain) is installed at the left side of the wave channel [22]. The maximum stroke of the wave paddle is 1.2 m, the possible wave period range is 1.0–7.5 s for a wave height of 20 cm, and the possible maximum wave height is 55 cm in the wave period range of 1.7–3 s. The wavemaker can generate regular waves (i.e., linear and nonlinear waves), irregular waves (i.e., Bretschneider-Mitsuyasu, JONSWAP, TMA spectrum), and solitary waves by a wave generation software, AwaSys 7 [23,24]. AwaSys 7 can also reduce the re-reflection of the waves at the wavemaker via an active reflection compensator [24,25]. Passive wave absorbers were installed to reduce the wave energy at both ends in the wave channel.

2.2. Installation of Breakwater Models and Wave Gauges

A model structure made of acrylic plates was installed 31 m from the wave paddle, and five wave gauges (i.e., E01–E05) were installed as shown in Figure 1. E01–E03 were used to calculate the reflection coefficient by using a method of separating the incident and reflected waves [26,27]. E04 and E05 were fixed in front of the caisson and parapet, respectively, to measure the water surface elevation. However, E05 was not installed when the parapet was located at the front.

2.3. Breakwater Models with Pressure Gauges

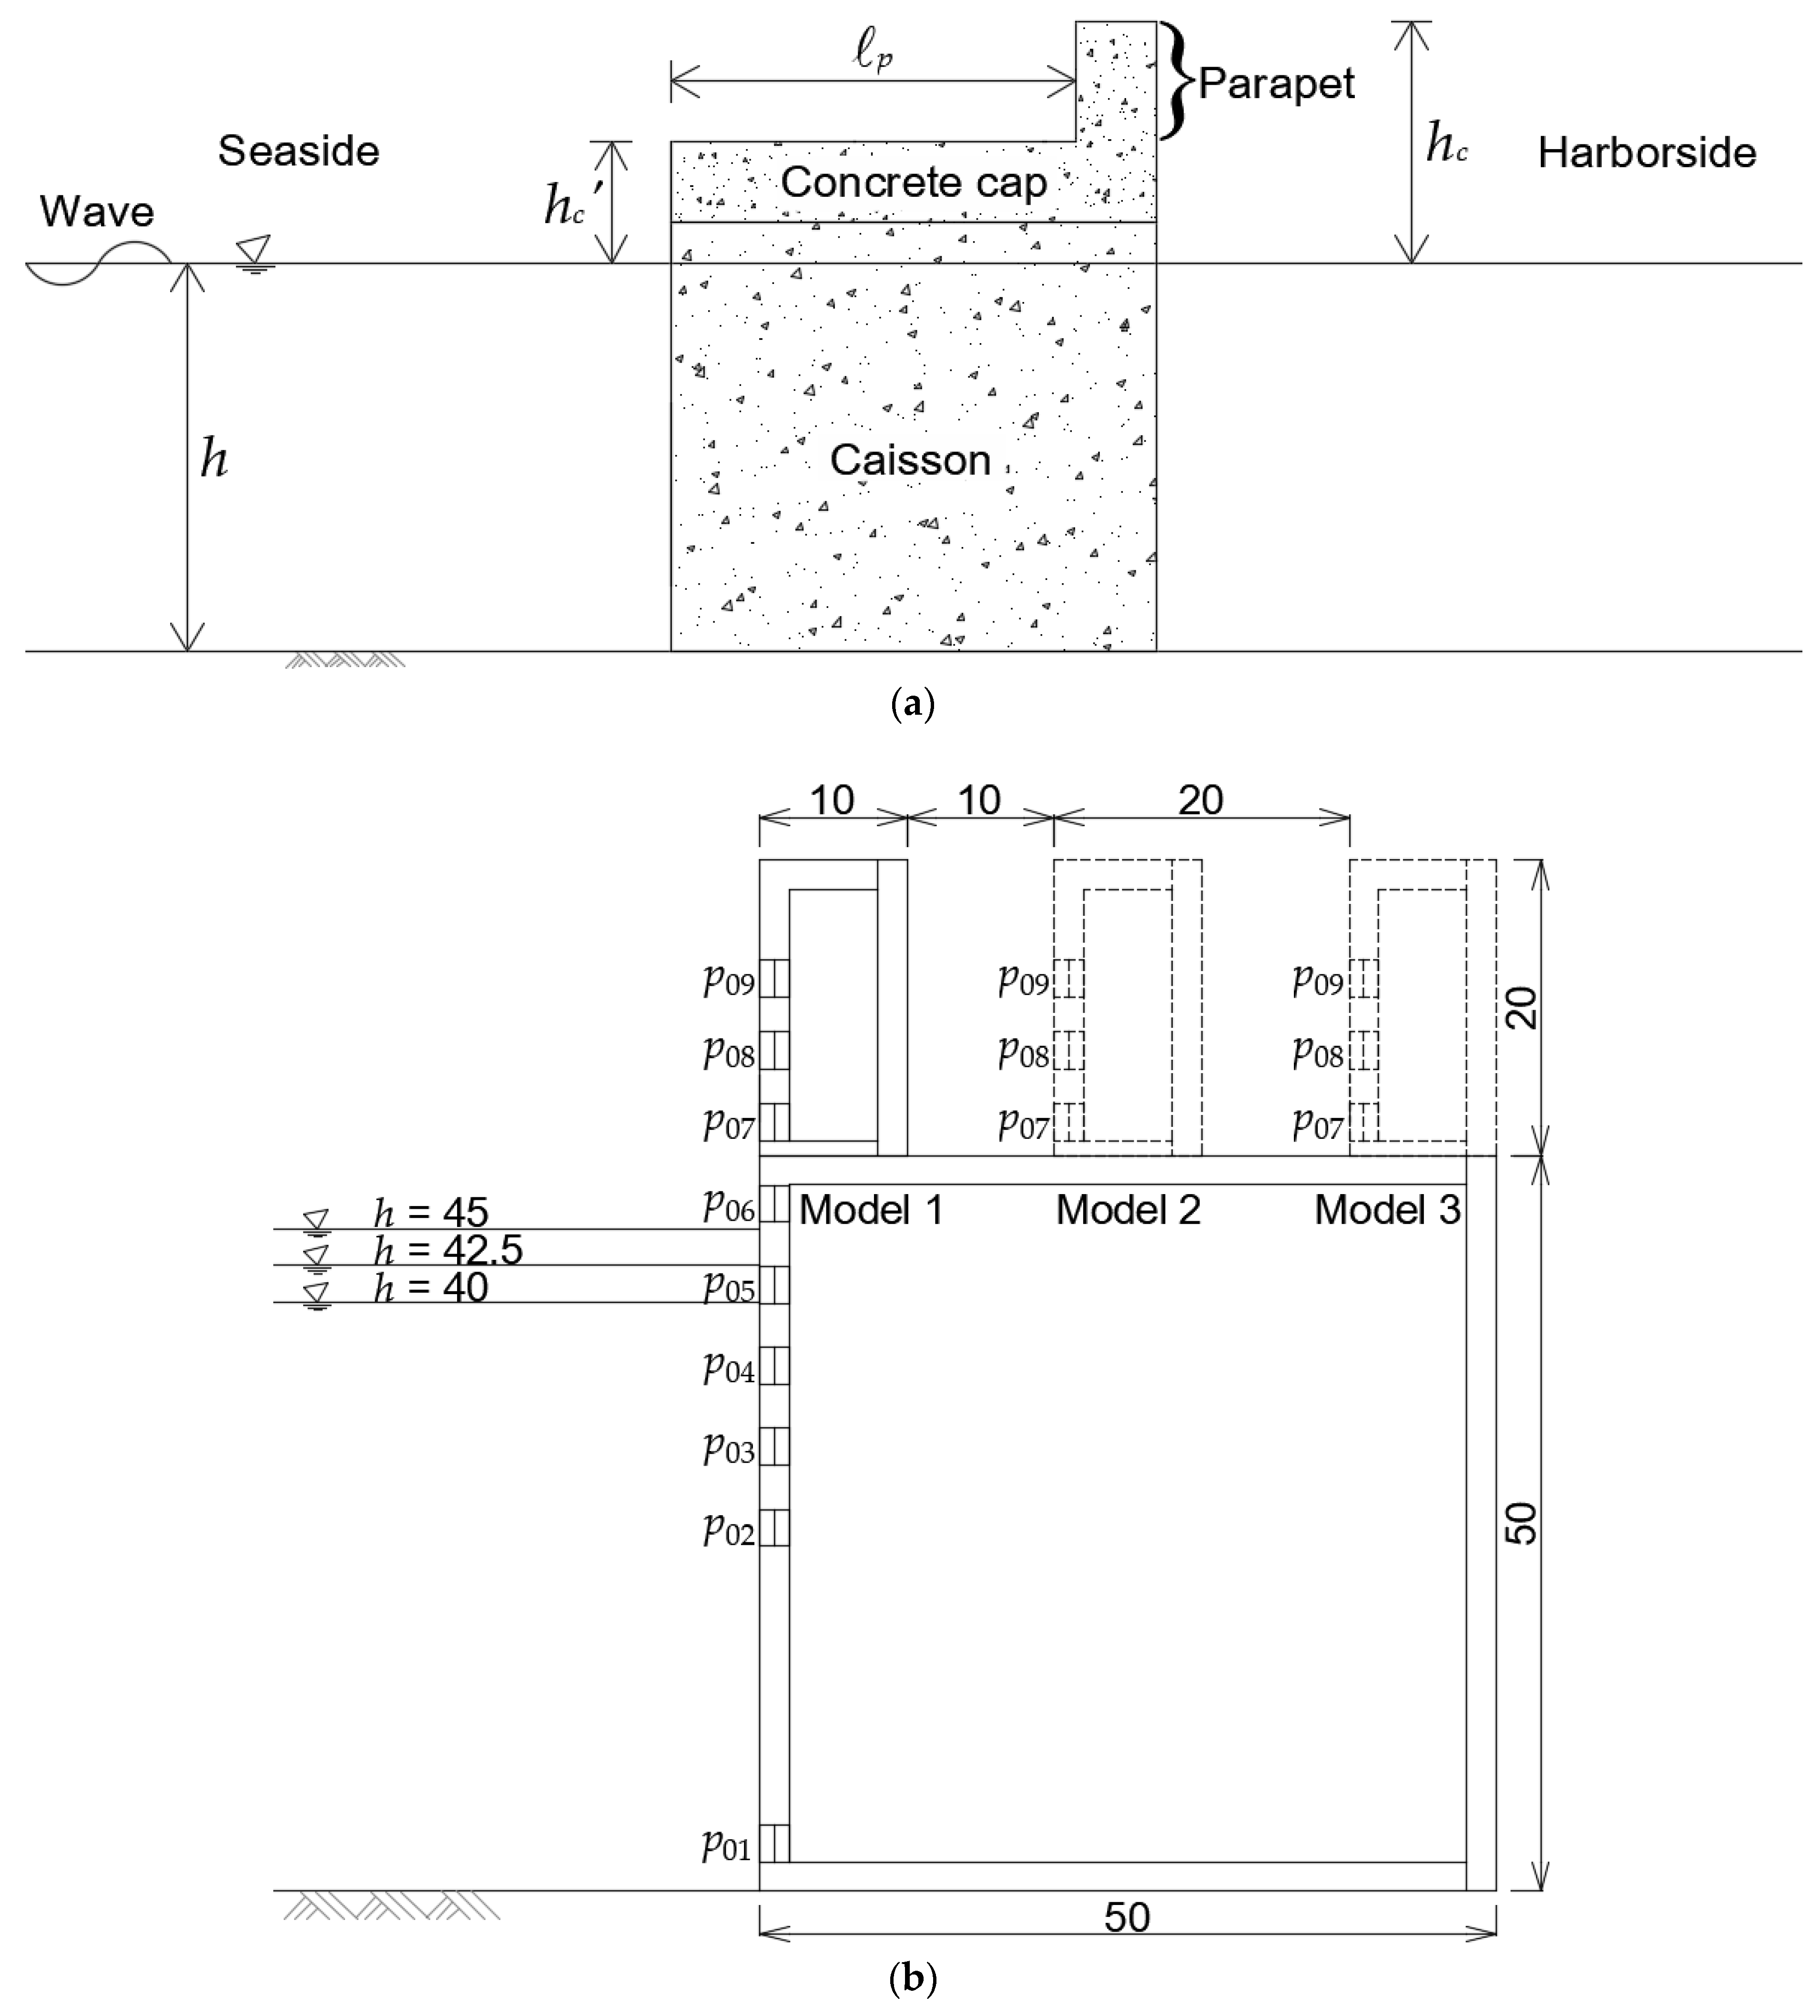
Figure 2a shows a diagram of the experimental model structure with the definitions of the relevant quantities. For the convenience of analysis, no rubble mound was employed, and three different cases were considered to examine the phase difference effect of the wave pressure with respect to the parapet position ( p = 0, 20, and 40 cm). Here, p is the parapet position from the front of the caisson to the front of the parapet; the still water depth h is 40, 42.5, and 45 cm; h c is the onshore freeboard including the parapet height; and h c is the offshore freeboard excluding the parapet height. Figure 2b shows the detailed dimensions of the model structures (i.e., Models 1, 2, and 3) with pressure gauges by applying the scale ratio of 1/40 of the Froude similarity. The parapets of Models 1, 2, and 3 were placed on the seaside, at the center of the breakwater, and on the harborside ( p = 0, 20, and 40 cm), respectively. The parapet of Model 3 was defined as a rear-parapet vertical breakwater in this study. The parapet was designed to be as high as possible to avoid wave overtopping. Nine pressure gauges (p01p09) were buried in the front of the model structure to ensure a level surface between the pressure gauges and the vertical wall. p01p06 were installed in front of the caisson including the concrete cap without the parapet, and p07p09 were installed in front of the parapet. The measuring positions of pressure gauges p01p09 were, sequentially, 3.25, 24.7, 30.2, 35.7, 41.2, 46.7, 52.25, 57.1, and 61.95 cm from the bottom. The pressure gauge was equipped with a disk-type pressure transducer with a diameter of 10 mm (SSK Company, Tokyo, Japan; Model: P310) [22]. The data sampling rate was set to 600 Hz to measure the wave pressure and water surface elevation.

2.4. Test Waves

Fifteen regular waves were selected by varying the wave height H, wave period T, and water depth h with respect to the parapet positions, as listed in Table 1. The wave period ranged from 1.21 to 2.02 s, and the wave height ranged from 9.87 to 15.29 cm. The test waves were estimated without the model structures at the desired locations. In the experiments with the model structures, the wave generation time was set to 60 s in each case. The measured data were used to analyze the wave forces acting on the caisson and parapet before the re-reflected waves reached the model structure. Five waves per test condition were used to analyze the hydraulic characteristics after the measured data reached a stable state.

2.5. Wave Force Calculation

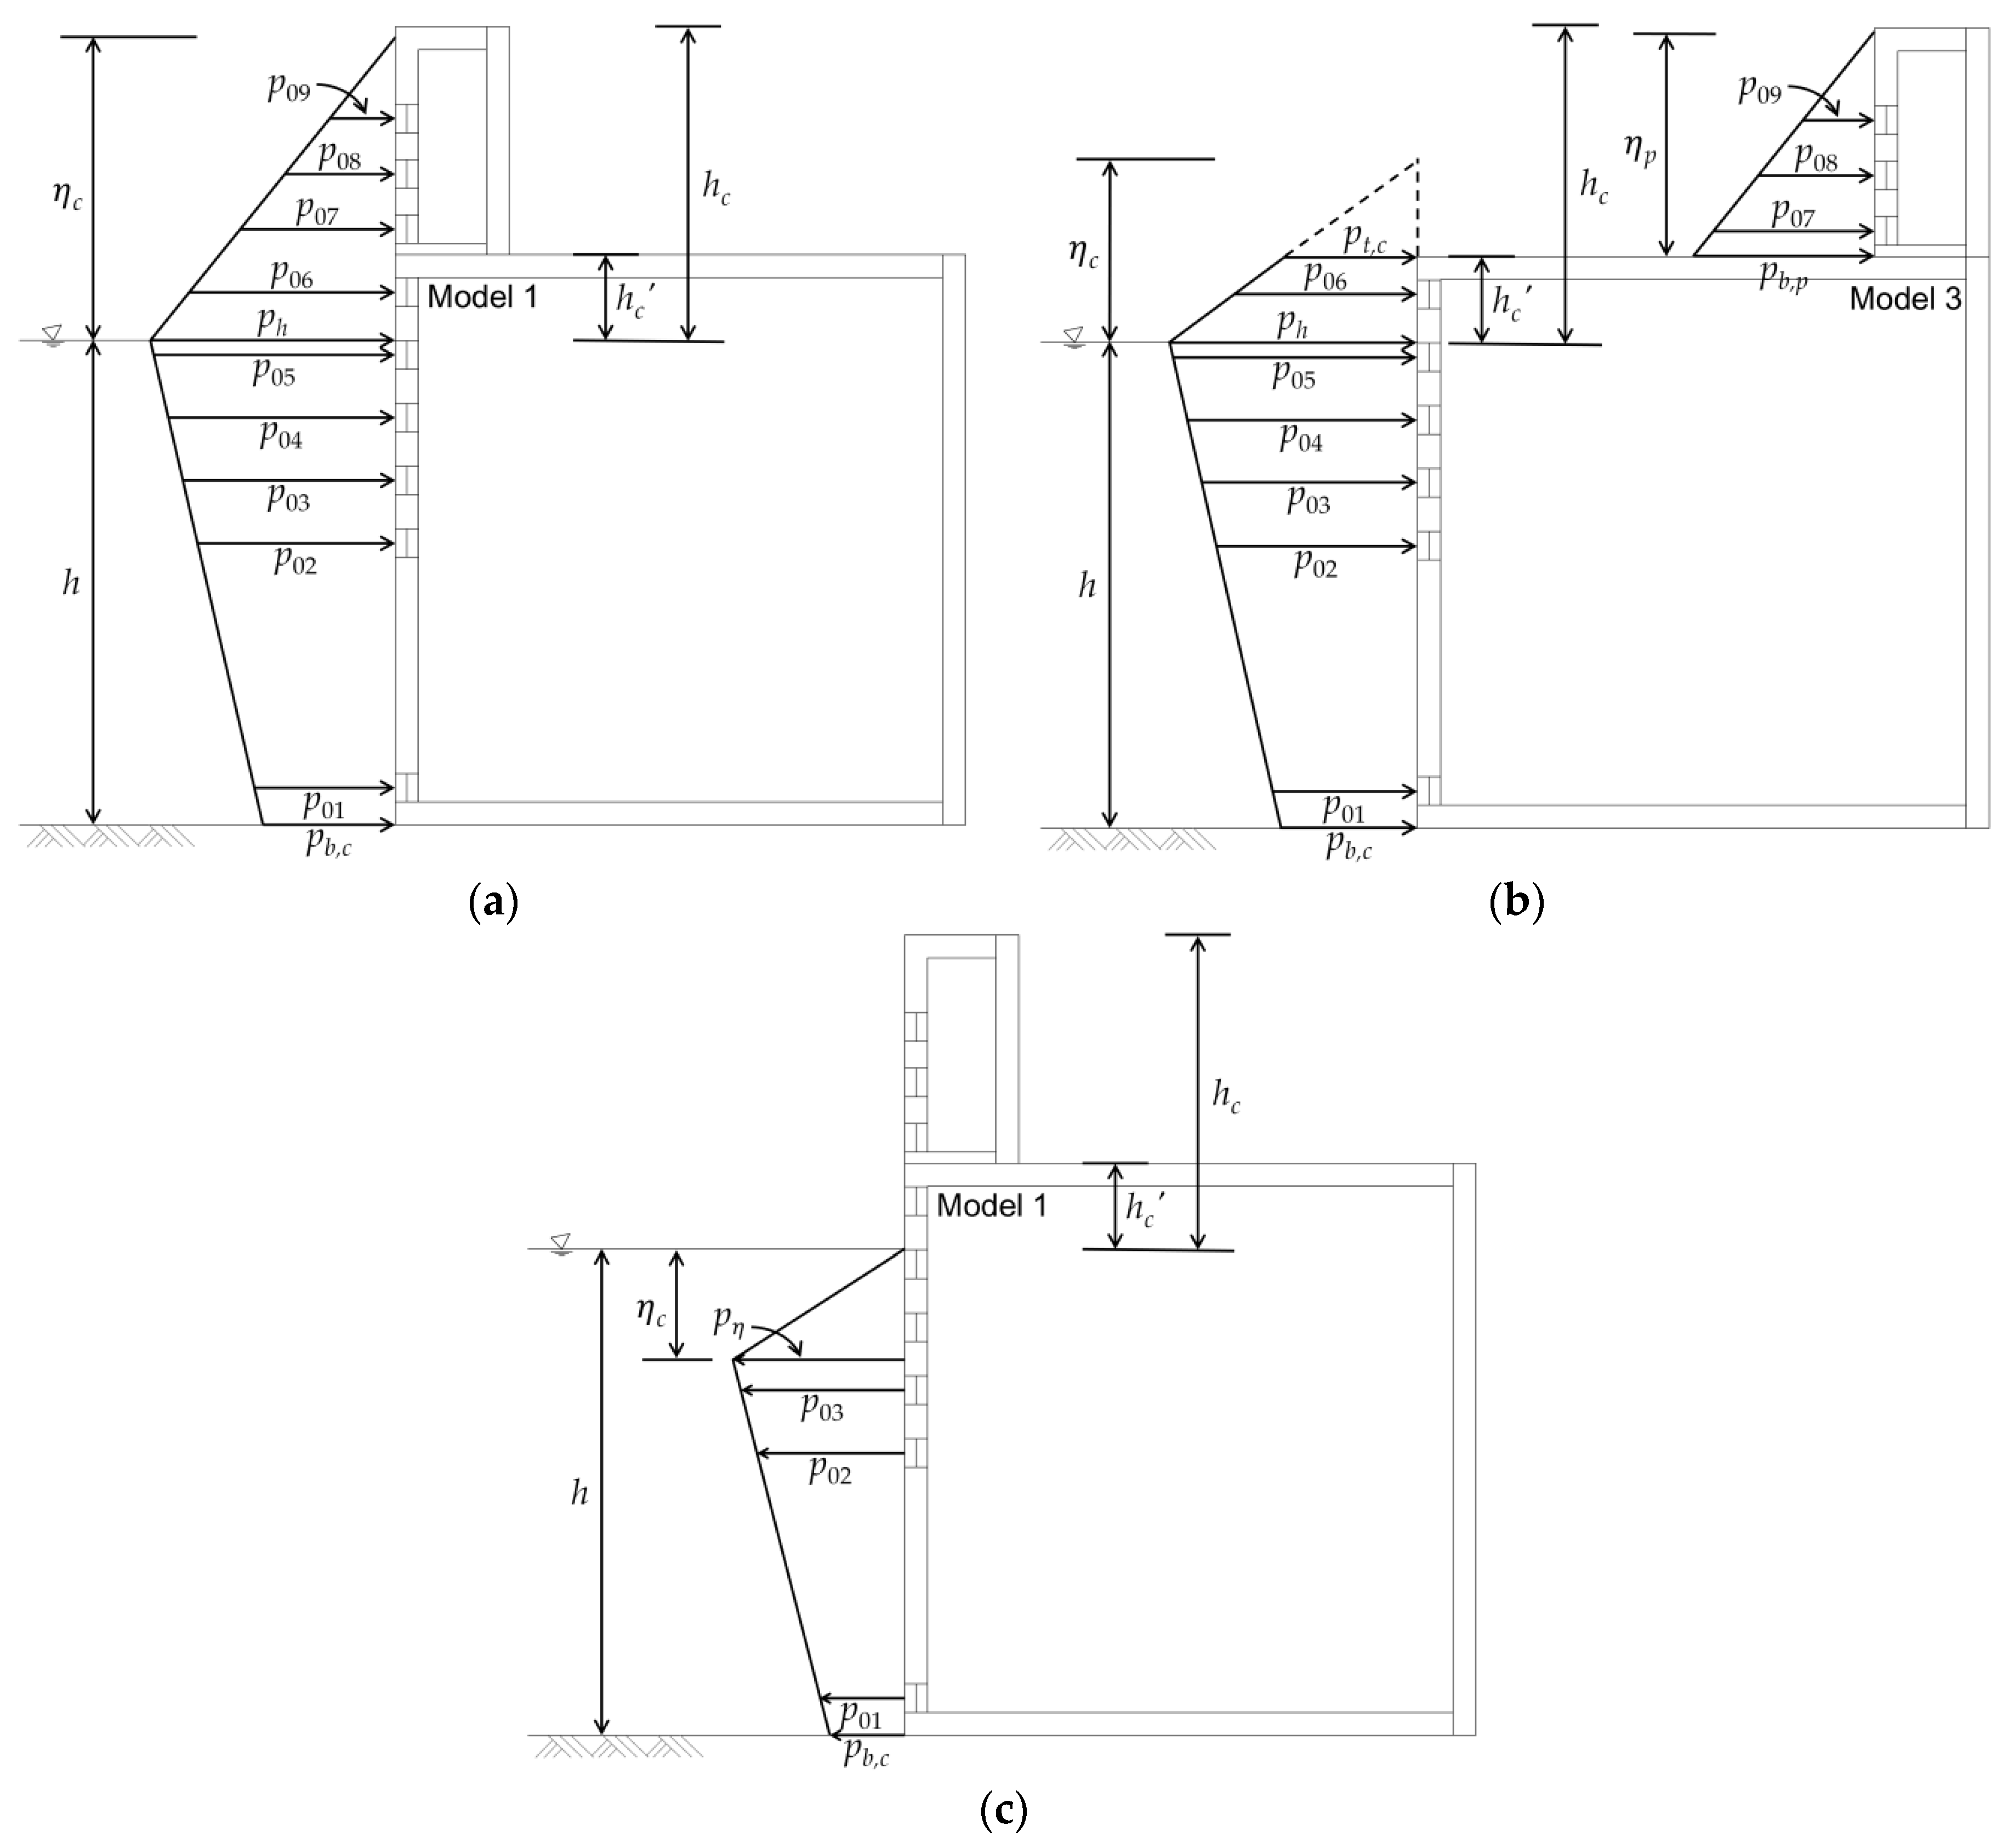
The wave force acting on the breakwater can be determined by integrating the wave pressure. In this study, the horizontal wave force acting on the breakwater was evaluated by integrating the wave pressure distribution using the measured pressure data (p01p09) and the wave runups on the fronts of the breakwater and parapet. Figure 3 shows the pressure distribution applied for the wave force calculations. p h is the wave pressure at the still water level and was determined by linearly extrapolating the two measured wave pressures below the still water level when η c > 0. For example, p04 and p05 were used for the water depths of 42.5 and 45 cm, and p03 and p04 were used for the water depth of 40 cm. p b , c is the wave pressure at the bottom of the caisson and was calculated by linearly extrapolating p01 and p02 for all the test cases. p b , p is the wave pressure at the bottom of the parapet and was evaluated by linearly extrapolating one (p07) or two (p07 and p08) of the measured wave pressures depending on η p . p t , c is the wave pressure at the top of the caisson and was calculated by linearly interpolating p06 and the zero-wave pressure, as shown in Figure 3b, when η c > h c . p η is the wave pressure at the water surface elevation when η c < 0. p η was obtained by linearly extrapolating two measured wave pressures (p01 and p02 or p02 and p03), depending on η c . As shown in Figure 3c, if the water surface is located below p04, the wave pressure data of p04 and p05 cannot be recorded. Thus, the wave pressure linearly decreases from the water surface to the still water level. In accordance with the water surface elevations of the caisson and parapet, the wave force is calculated by integrating the measured and calculated wave pressures acting on the vertical breakwater.

2.6. Required Self-Weight Calculation

The required self-weight of the breakwater can be calculated using the stability formula for sliding and overturning with respect to the parapet position under large wave conditions and water depths (H = 15.10 cm, T = 2.01 s, h = 45.0 cm; H = 15.10 cm, T = 2.02 s, h = 42.5 cm; H = 15.29 cm, T = 2.02 s, h = 40.0 cm). The center of gravity of the caisson, including the concrete cap, was assumed to be located at the center of the breakwater when the stability was evaluated. The stability formulae for sliding and overturning are defined in Equations (1) and (2), respectively [28]:
S F , s = μ ( W e U ) F
S F , o = W e t w M U M F
where S F , s (=1.2) is the safety factor for sliding, S F , o (=1.2) is the safety factor for overturning, μ (=0.6) is the friction coefficient between the concrete caisson and the rubble mound, W e   ( = W B ) is the required self-weight of the breakwater excluding the buoyancy B , U is the uplift force acting on the bottom of the caisson, t w is the horizontal distance from the heel of the caisson to the action point of the self-weight and the buoyancy, F is the average total wave force calculated in the previous section, M U is the moment of the uplift force at the heel of the caisson, and M F is the moment of the average total wave force acting on the breakwater at the heel of the caisson. According to the wave pressure formula established by Goda [28], the uplift pressure p u acting at the front beneath the caisson is identical to the wave pressure p b , c acting at the lowest position in front of the caisson if there is no rubble mound beneath the caisson and the water depth is constant. Therefore, the uplift force U was calculated by assuming that the uplift pressure exhibits a triangular distribution and that the uplift pressure acting on the harborside is zero. The moment of the horizontal wave force M F was calculated using the wave force and its action point for each measurement point, as shown in Figure 3.

2.7. Bearing Pressure Calculation

Generally, the stability of the rubble mound of a breakwater is assessed using the Bishop method. In addition, the maximum bearing pressure generated in the rubble mound is designed not to exceed the allowable bearing capacity in Korea. Therefore, the effects of the rear parapet on the bearing pressure were investigated in this study. The maximum bearing pressure in the rubble mound ground occurs at the edge of the breakwater base, which can be calculated as [28]
p h = 2 ( W e U ) 3 t e   for   t e 1 3 W B
p h = 2 ( W e U ) W B ( 2 3 t e W B )   for   t e > 1 3 W B
p t = 2 ( W e U ) W B ( 3 t e W B 1 )   for   t e > 1 3 W B
where
t e = W e t w M U M F W e U
In the above equations, p h is the bearing pressure acting on the heel of the caisson bottom, p t is the bearing pressure acting on the toe of the caisson bottom, W B is the width of the caisson, and t e is the eccentricity of the ground reaction force (= W e U ) from the heel beneath the caisson toward its toe. The bearing pressure (Equation (3)) exhibits a triangular distribution at the bottom of the caisson and becomes zero at 3 t e far from the heel of the caisson ( p t = 0 ). The bearing pressures (Equations (4) and (5)) were derived by assuming a trapezoidal distribution.

3. Experimental Results and Discussions

3.1. Runup, Reflection, and Pressure

Figure 4 shows the free surface profiles of Model 3 at a specific time when the wave height is 15.10 cm, wave period is 2.01 s, and water depth is 45.0 cm. η c,max is the maximum height of the wave runup from the still water level in front of the caisson, and η p,max is the maximum height of the wave runup from the top of the caisson in front of the parapet. When the incident wave is overtopped to the offshore freeboard of the caisson, η c,max is reached at 28.11 s. The overtopped water moves along the upper surface of the concrete cap and then reaches the parapet. Thereafter, η p,max is reached at 28.54 s. In this case, a time difference of 0.43 s corresponding to 21.5% of the wave period occurs between the times at which η c,max and η p,max are reached. In addition, the overtopped water almost does not reach the parapet when the height of the wave runup is the maximum in front of the caisson, and the runup height in front of the caisson decreases when the height of the wave runup is the maximum in front of the parapet.
The reflection of the incident wave consists of reflections from the fronts of the caisson and the parapet. In these experiments, both cases can be assumed to be fully reflection, but energy consumption occurs significantly while the wave overtopped the offshore freeboard moves on the upper surface of the concrete cap, and it hits the parapet, and then it returns to the sea. Figure 4 demonstrates these phenomena that cause energy dissipation, i.e., a wave breaking similar to a surging breaker at 28.11 s, a wave splashing at 28.39 and 28.54 s, and a water falling with air bubbles at 28.87–29.21 s.
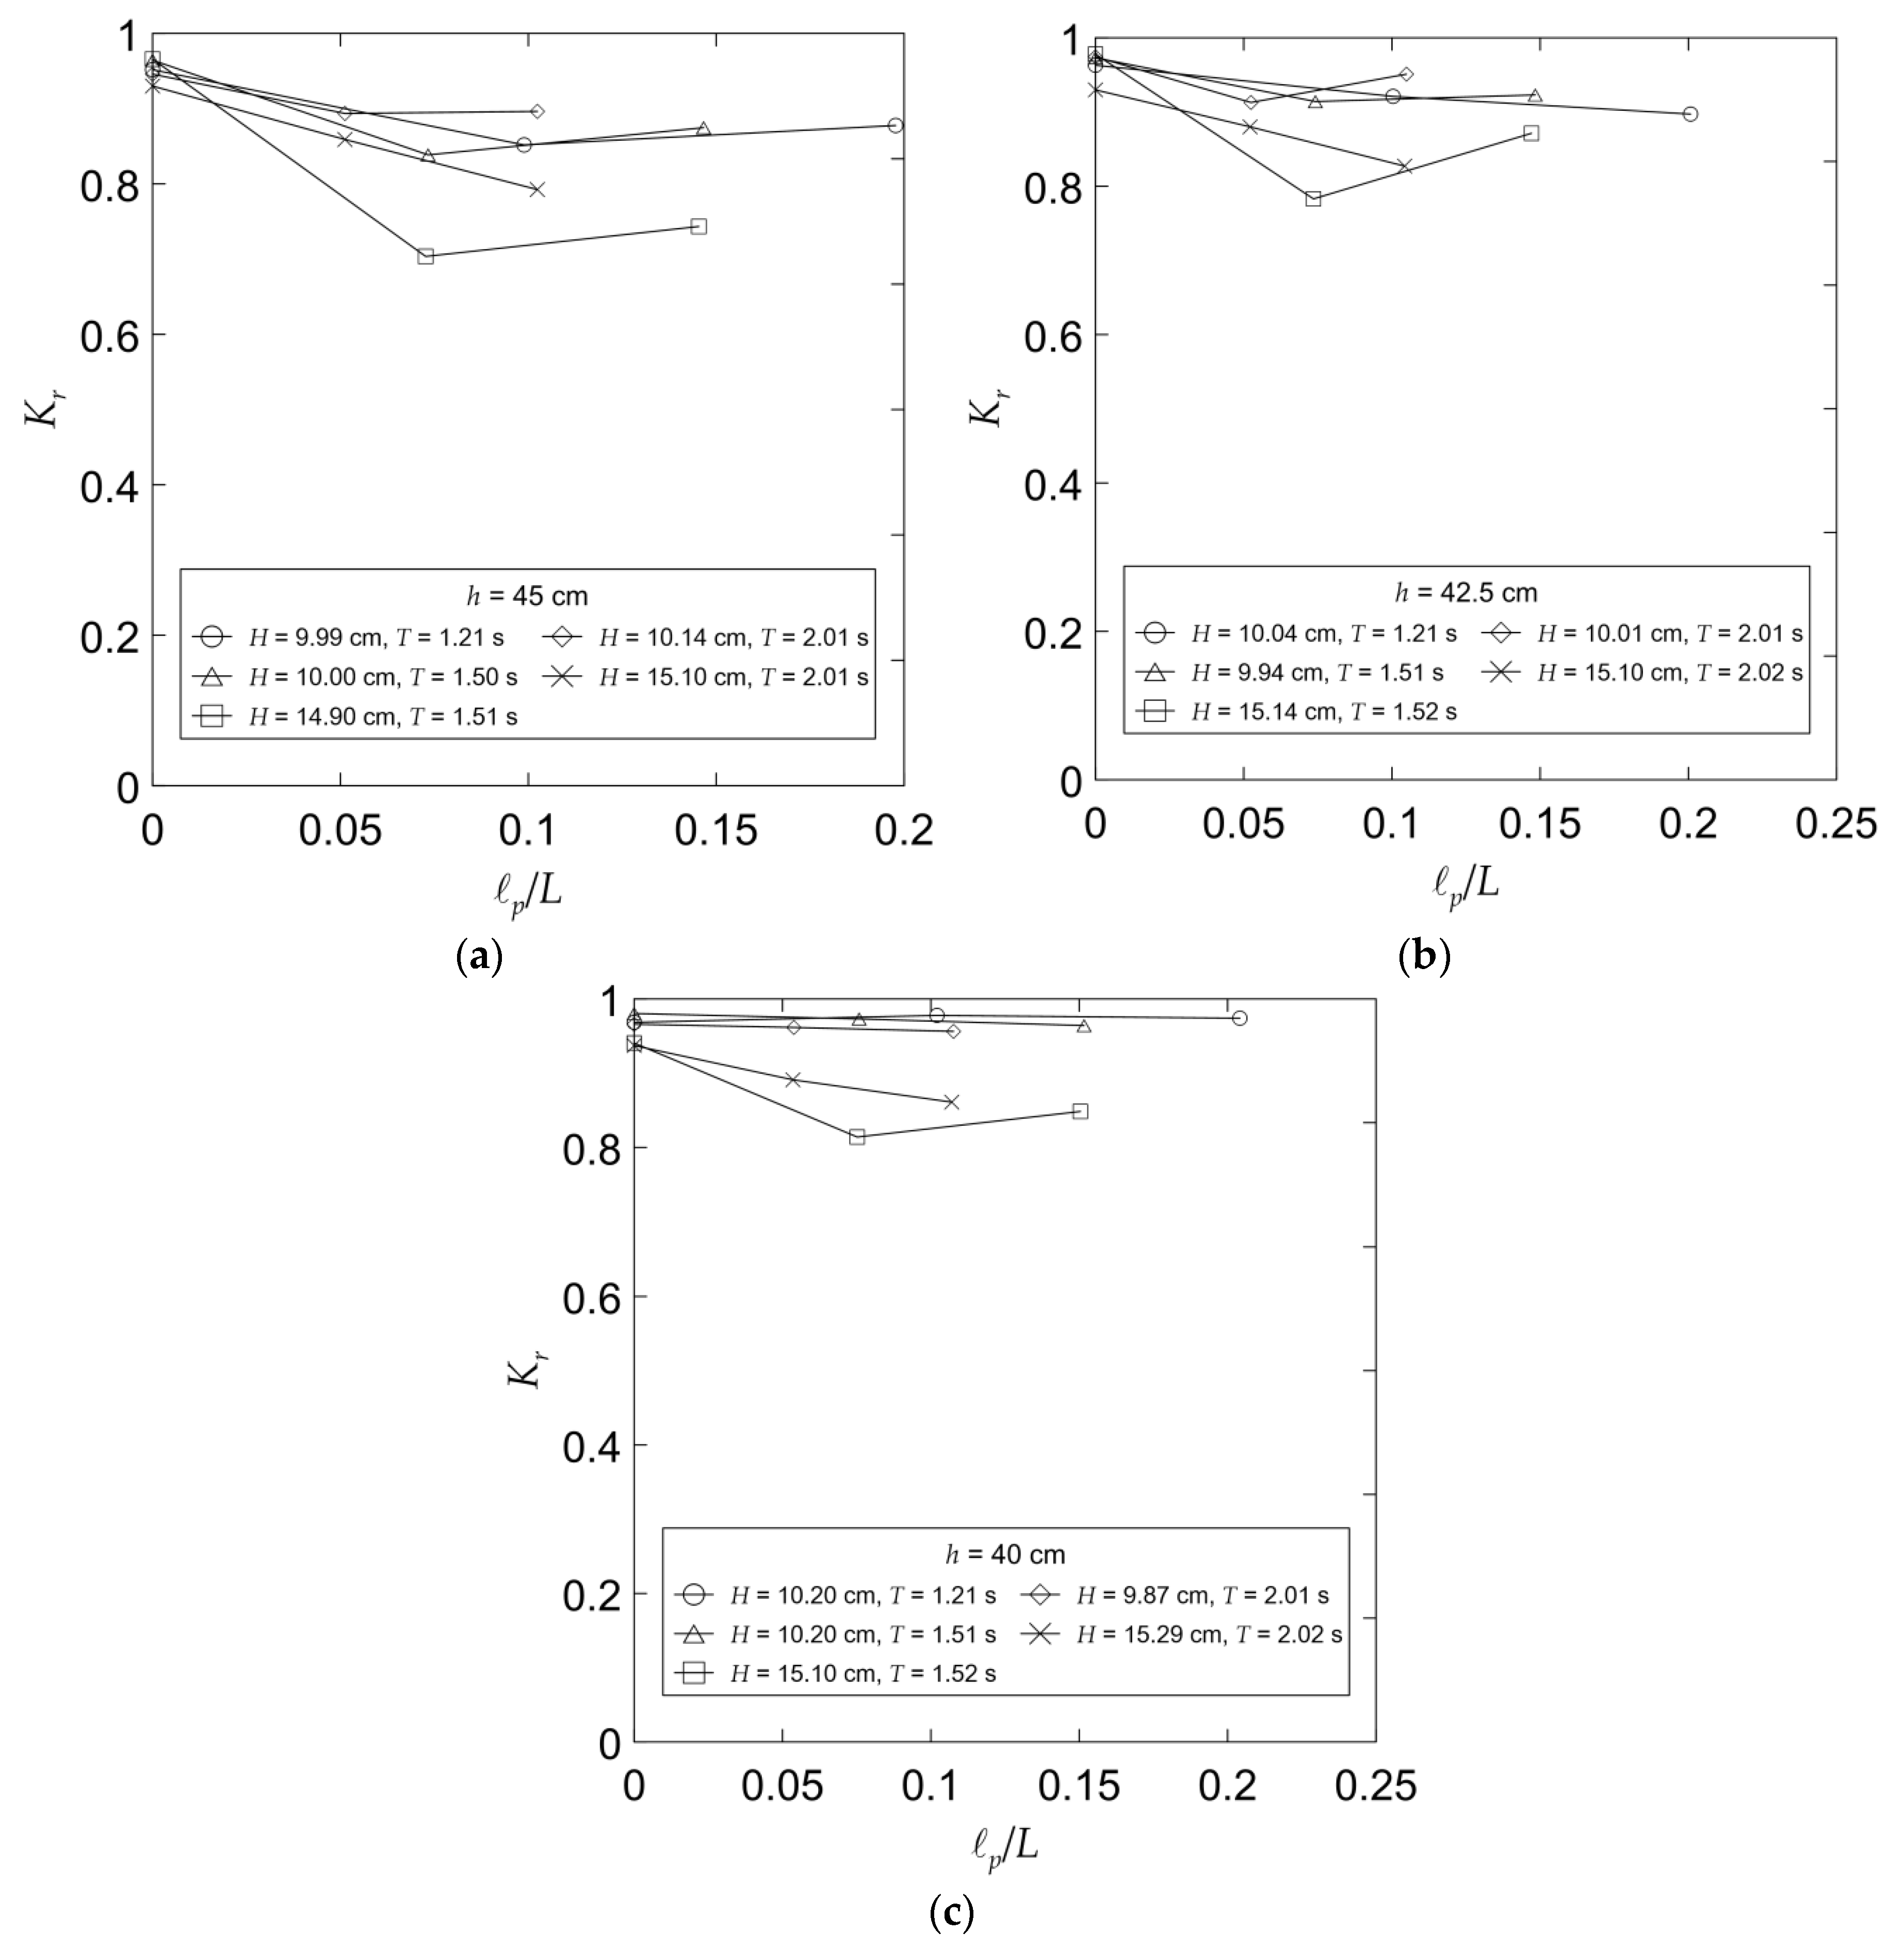
Figure 5 shows the reflection coefficients K r for three breakwater models. Those were obtained by separating the reflected and incident waves from the surface fluctuation data measured by the wave gauges E01–03 installed about 15 times the water depth away from the breakwater model [26,27]. Although there is a limitation that the separation technique of the incident and reflected waves is based on linear theory, it is sufficient for comparison purposes. The reflection coefficients indicate that the abovementioned energy dissipation effect, regarding Figure 4, was reflected. If the wave is severe, the reflection coefficient decreases, and it reaches a maximum reduction of 27% compared with that in the conventional case ( p / L = 0 ). The decrease of the reflection coefficient is important because it helps reduce the maximum wave force acting on the breakwater.
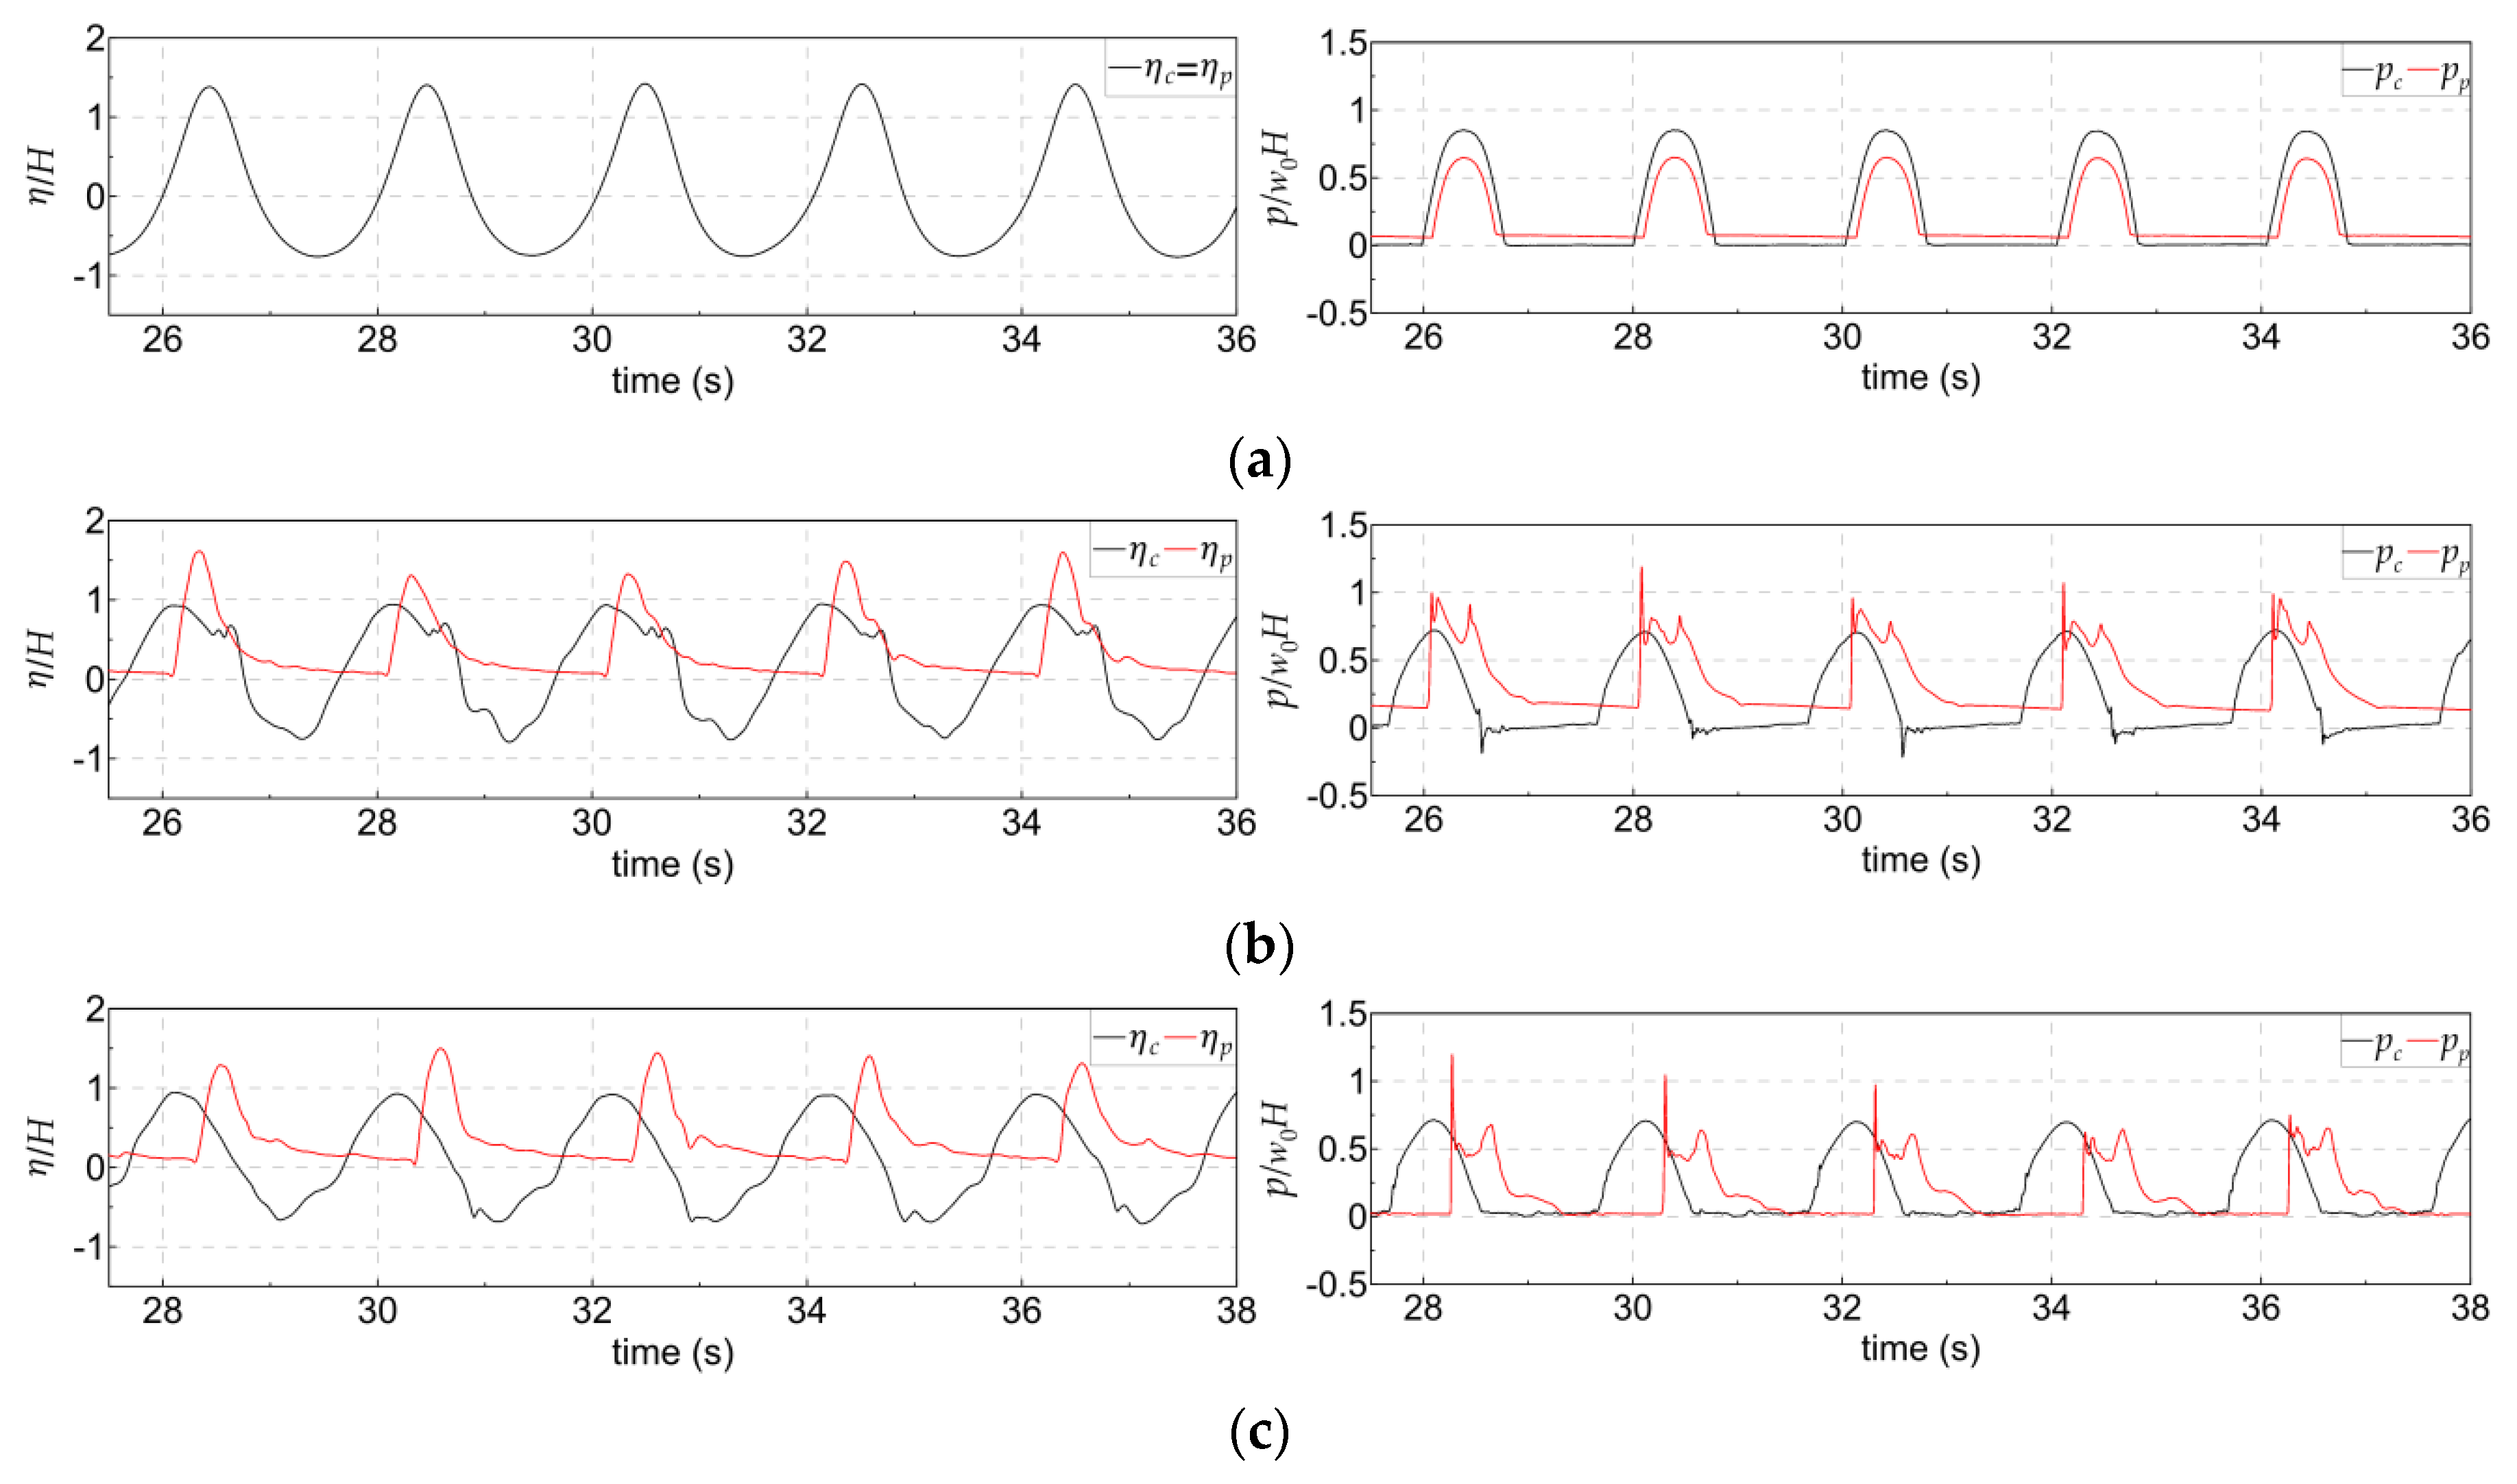
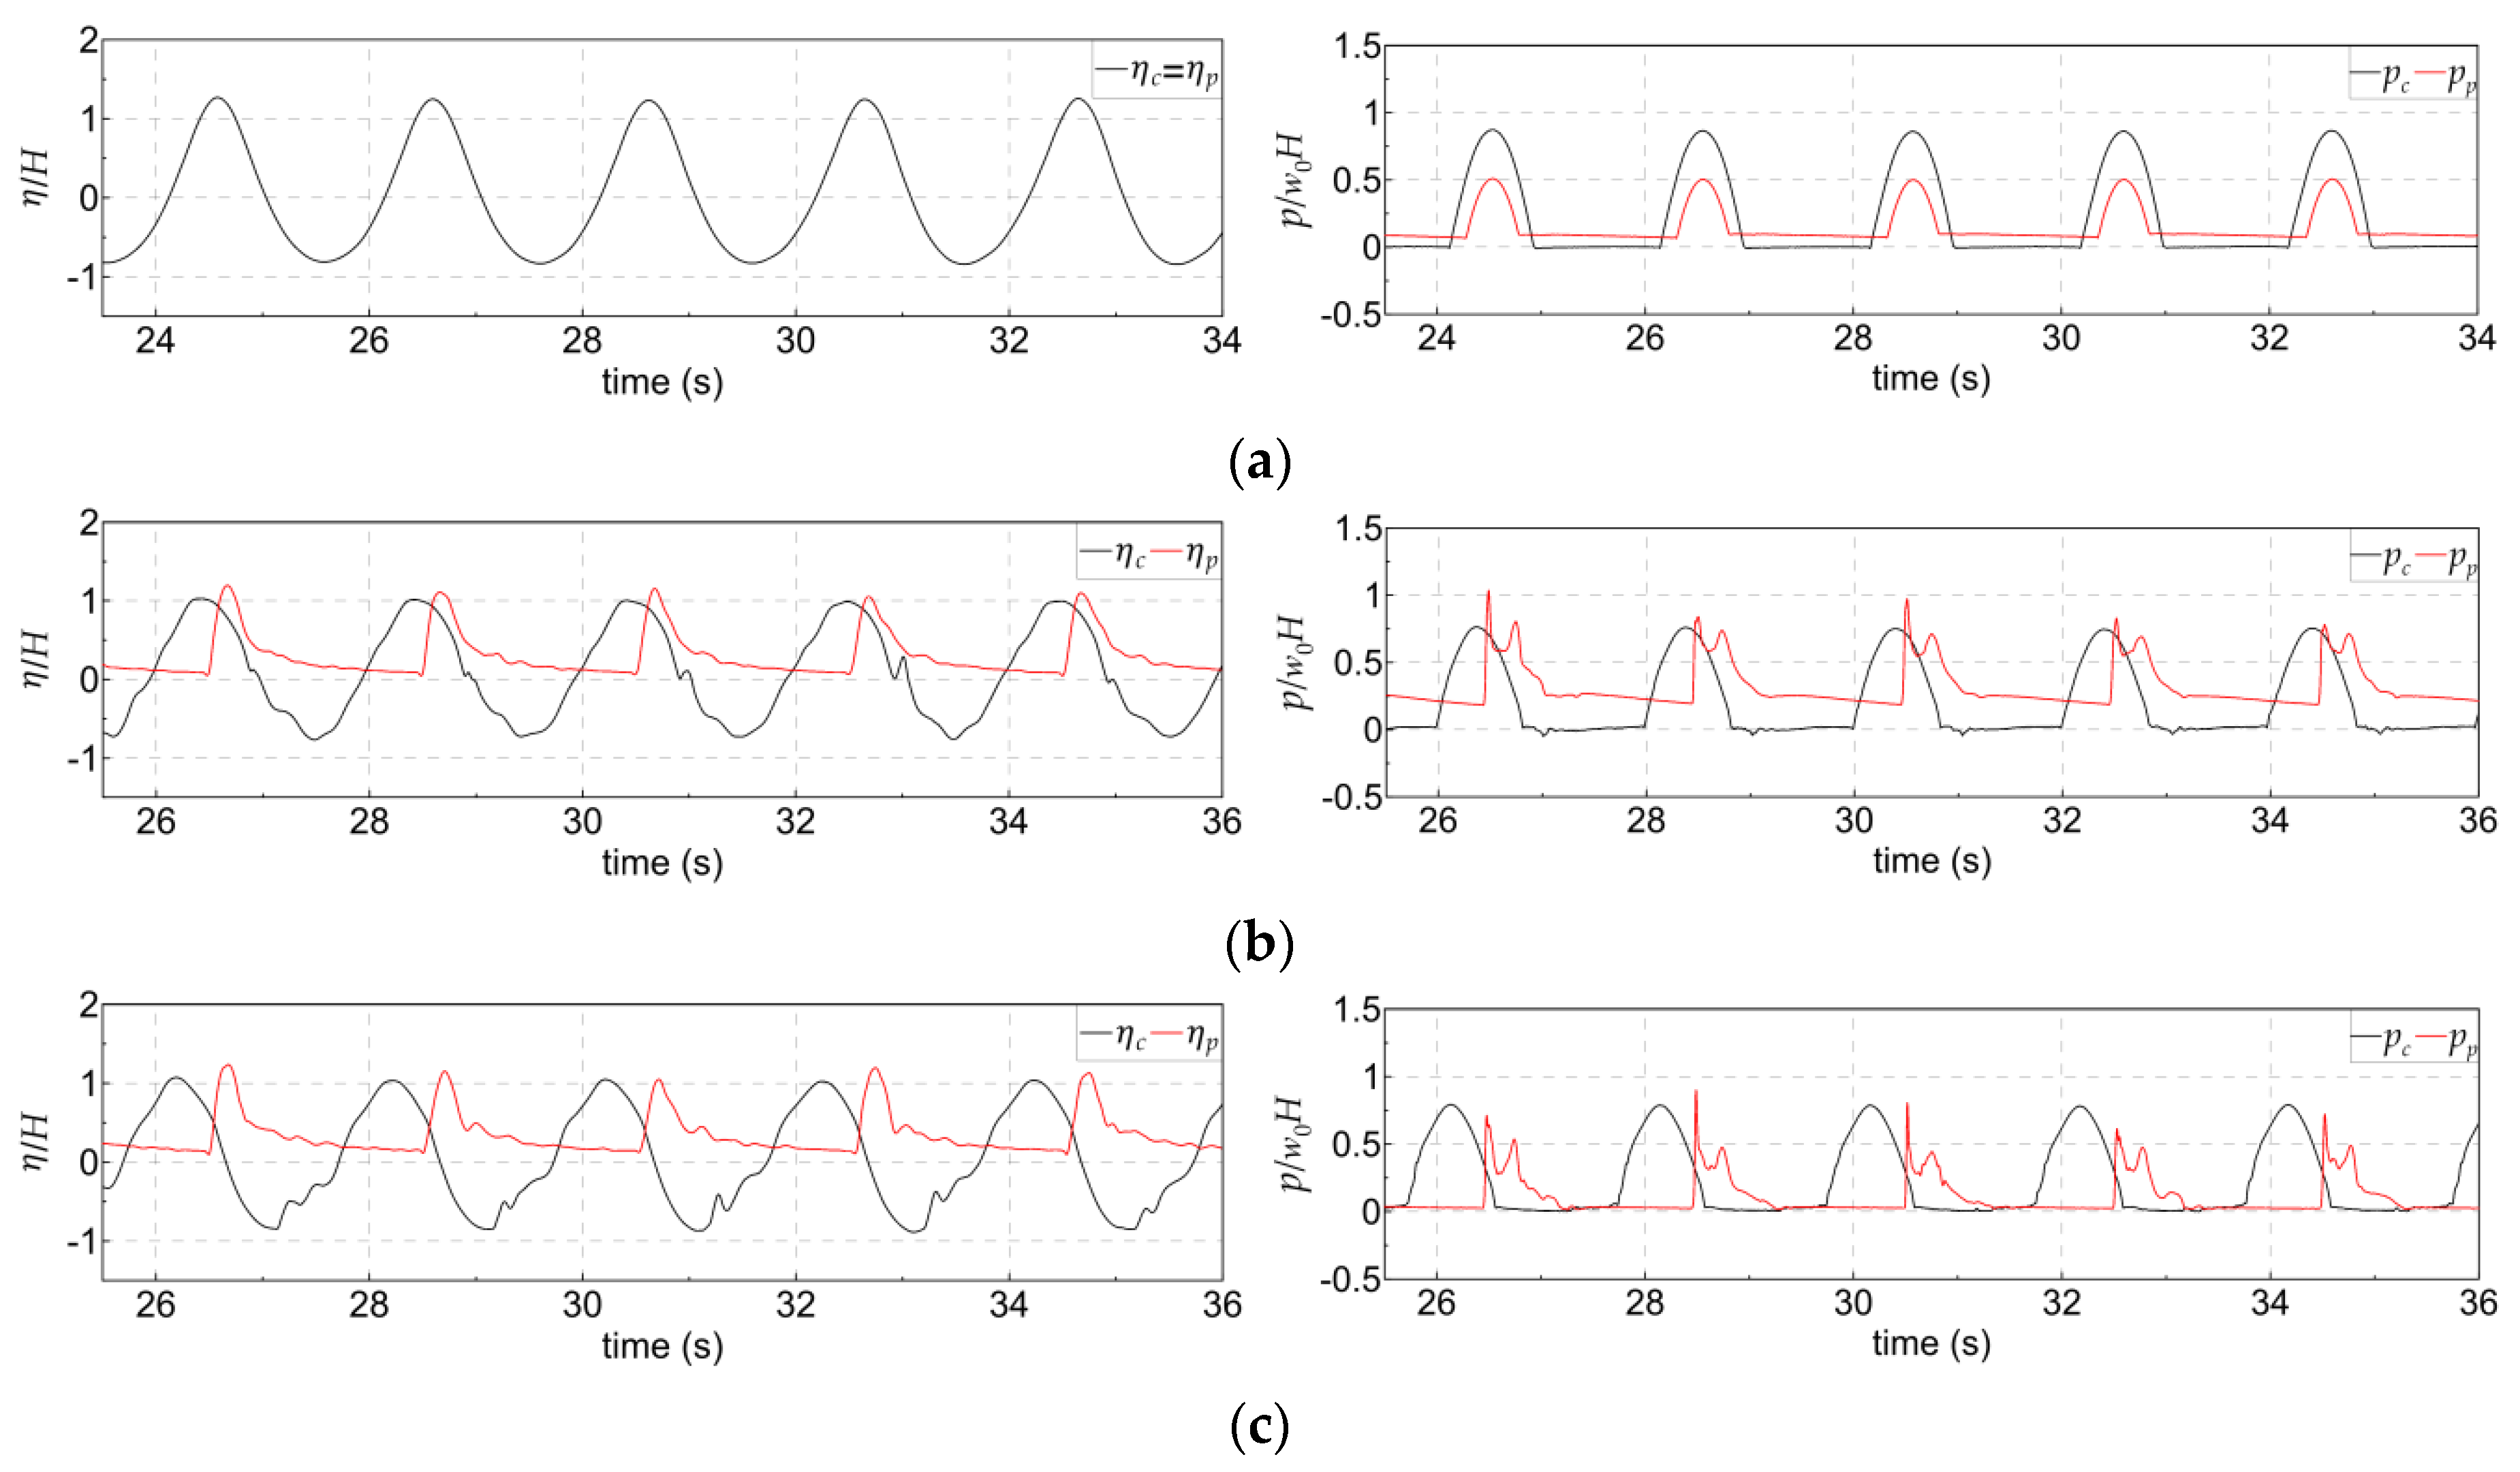
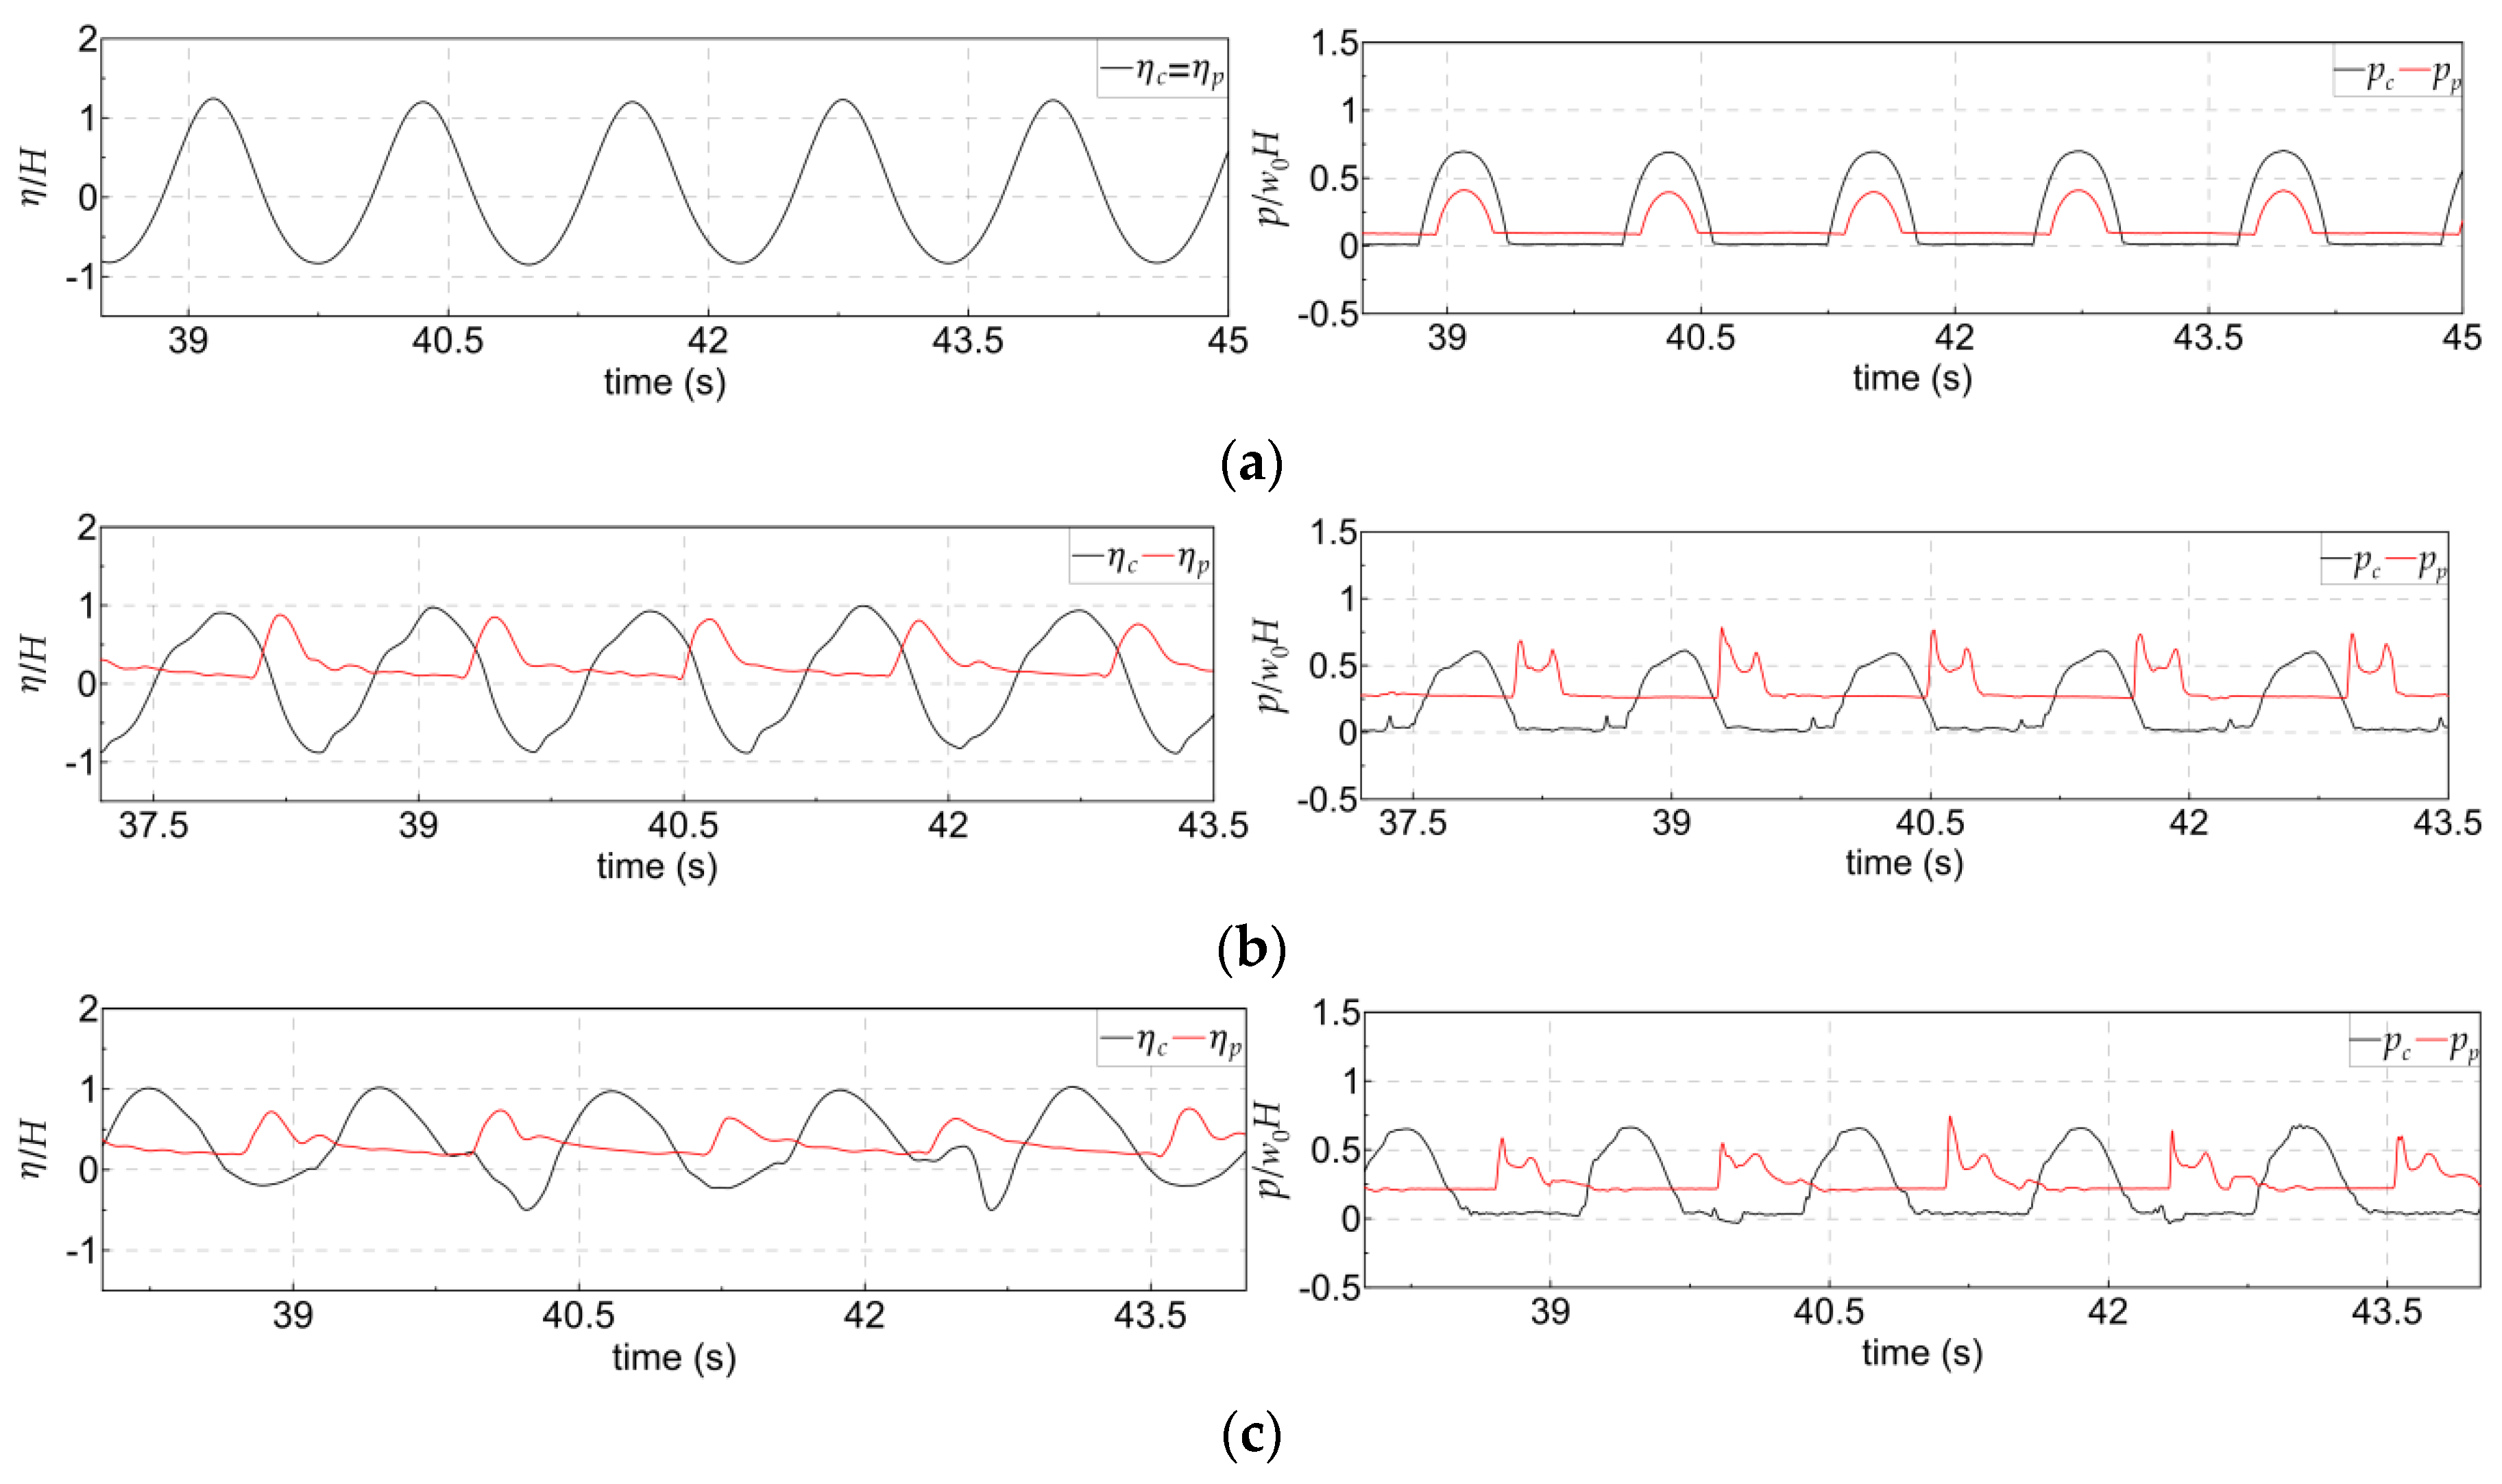
Figure 6, Figure 7 and Figure 8 show the time series of the wave pressure at the top measurement point in front of the caisson (pc = p06) and at the bottom measurement point in front of the parapet (pp = p07), as well as the water surface elevations in front of the caisson ( η c = E04) and parapet ( η p = E05). The wave pressure is nondimensionalized by the wave pressure for the incident wave height tested. w 0 is the specific weight of water. As the parapet position moves to the harborside, the phase difference between the maximum wave pressures acting in front of the caisson and parapet increases, whereas the maximum wave pressure acting in front of the caisson decreases. There the maximum wave pressure increases of decreases depending on the parapet position, wave period, and wave height. Comparison of Figure 6 and Figure 7, which present different wave heights in the same wave period, shows that the travel time of the overtopped water toward the parapet is related to the wave height as well as the wave period. Specifically, as shown in Figure 6c and Figure 7c, the average travel times for the first peak of the maximum wave pressure are different, i.e., 0.18 and 0.35 s, respectively, since the overtopping velocity depends on the relative offshore freeboard h c / H . In addition, the travel times for the maximum water surface elevation and maximum wave pressure are different, as demonstrated by these figures. For example, as shown in Figure 6c, the average travel times for the maximum water surface elevation and maximum wave pressure are 0.40 and 0.18 s, respectively. Thus, the wave pressure acting on the bottom in front of the parapet is not the maximum due to the double-peak pressure when the water surface elevation is the maximum. In general, the pressure caused by the overtopped water has two peaks [29,30]. Figure 6 and Figure 7 show the typical pressure fluctuations. At the moment when the overtopped water hits the parapet, an impact pressure occurs, followed by pressure fluctuation as the water rises and then descends on the parapet shown in Figure 4.
In general, a standing wave is induced in front of the vertical breakwater under non-wave overtopping conditions. However, an impulsive wave pressure may be induced because of the overtopped water when the parapet is on the harborside. This impulsive wave pressure was first studied by Lundgren [31], who defined three types of impulsive wave pressures: ventilated, hammer, and compression shocks. Thereafter, Takahashi et al. [32] categorized the impulsive wave pressures into Wagner (ventilated and hammer shocks) and Bagnold (compression shock) types. The Wagner type typically has a momentary single peak and acts on a specific part of the breakwater. On the other hand, the Bagnold type not only exhibits vibrations after the single peak occurs, but also exhibits a peak for the other parts of the breakwater at almost same the time. Based on the characteristics of the impulsive wave pressure, the experimental results of this study indicate a Wagner-type impulsive wave pressure. If the rear-parapet is considered in the design stage, the stability of the parapet needs to be ensured by considering the change in the thickness of the parapet or by placing the rebar at a position at which the impulsive wave pressure acts on the parapet. The subsequent paragraph provides a quantitative analysis of the wave pressure.
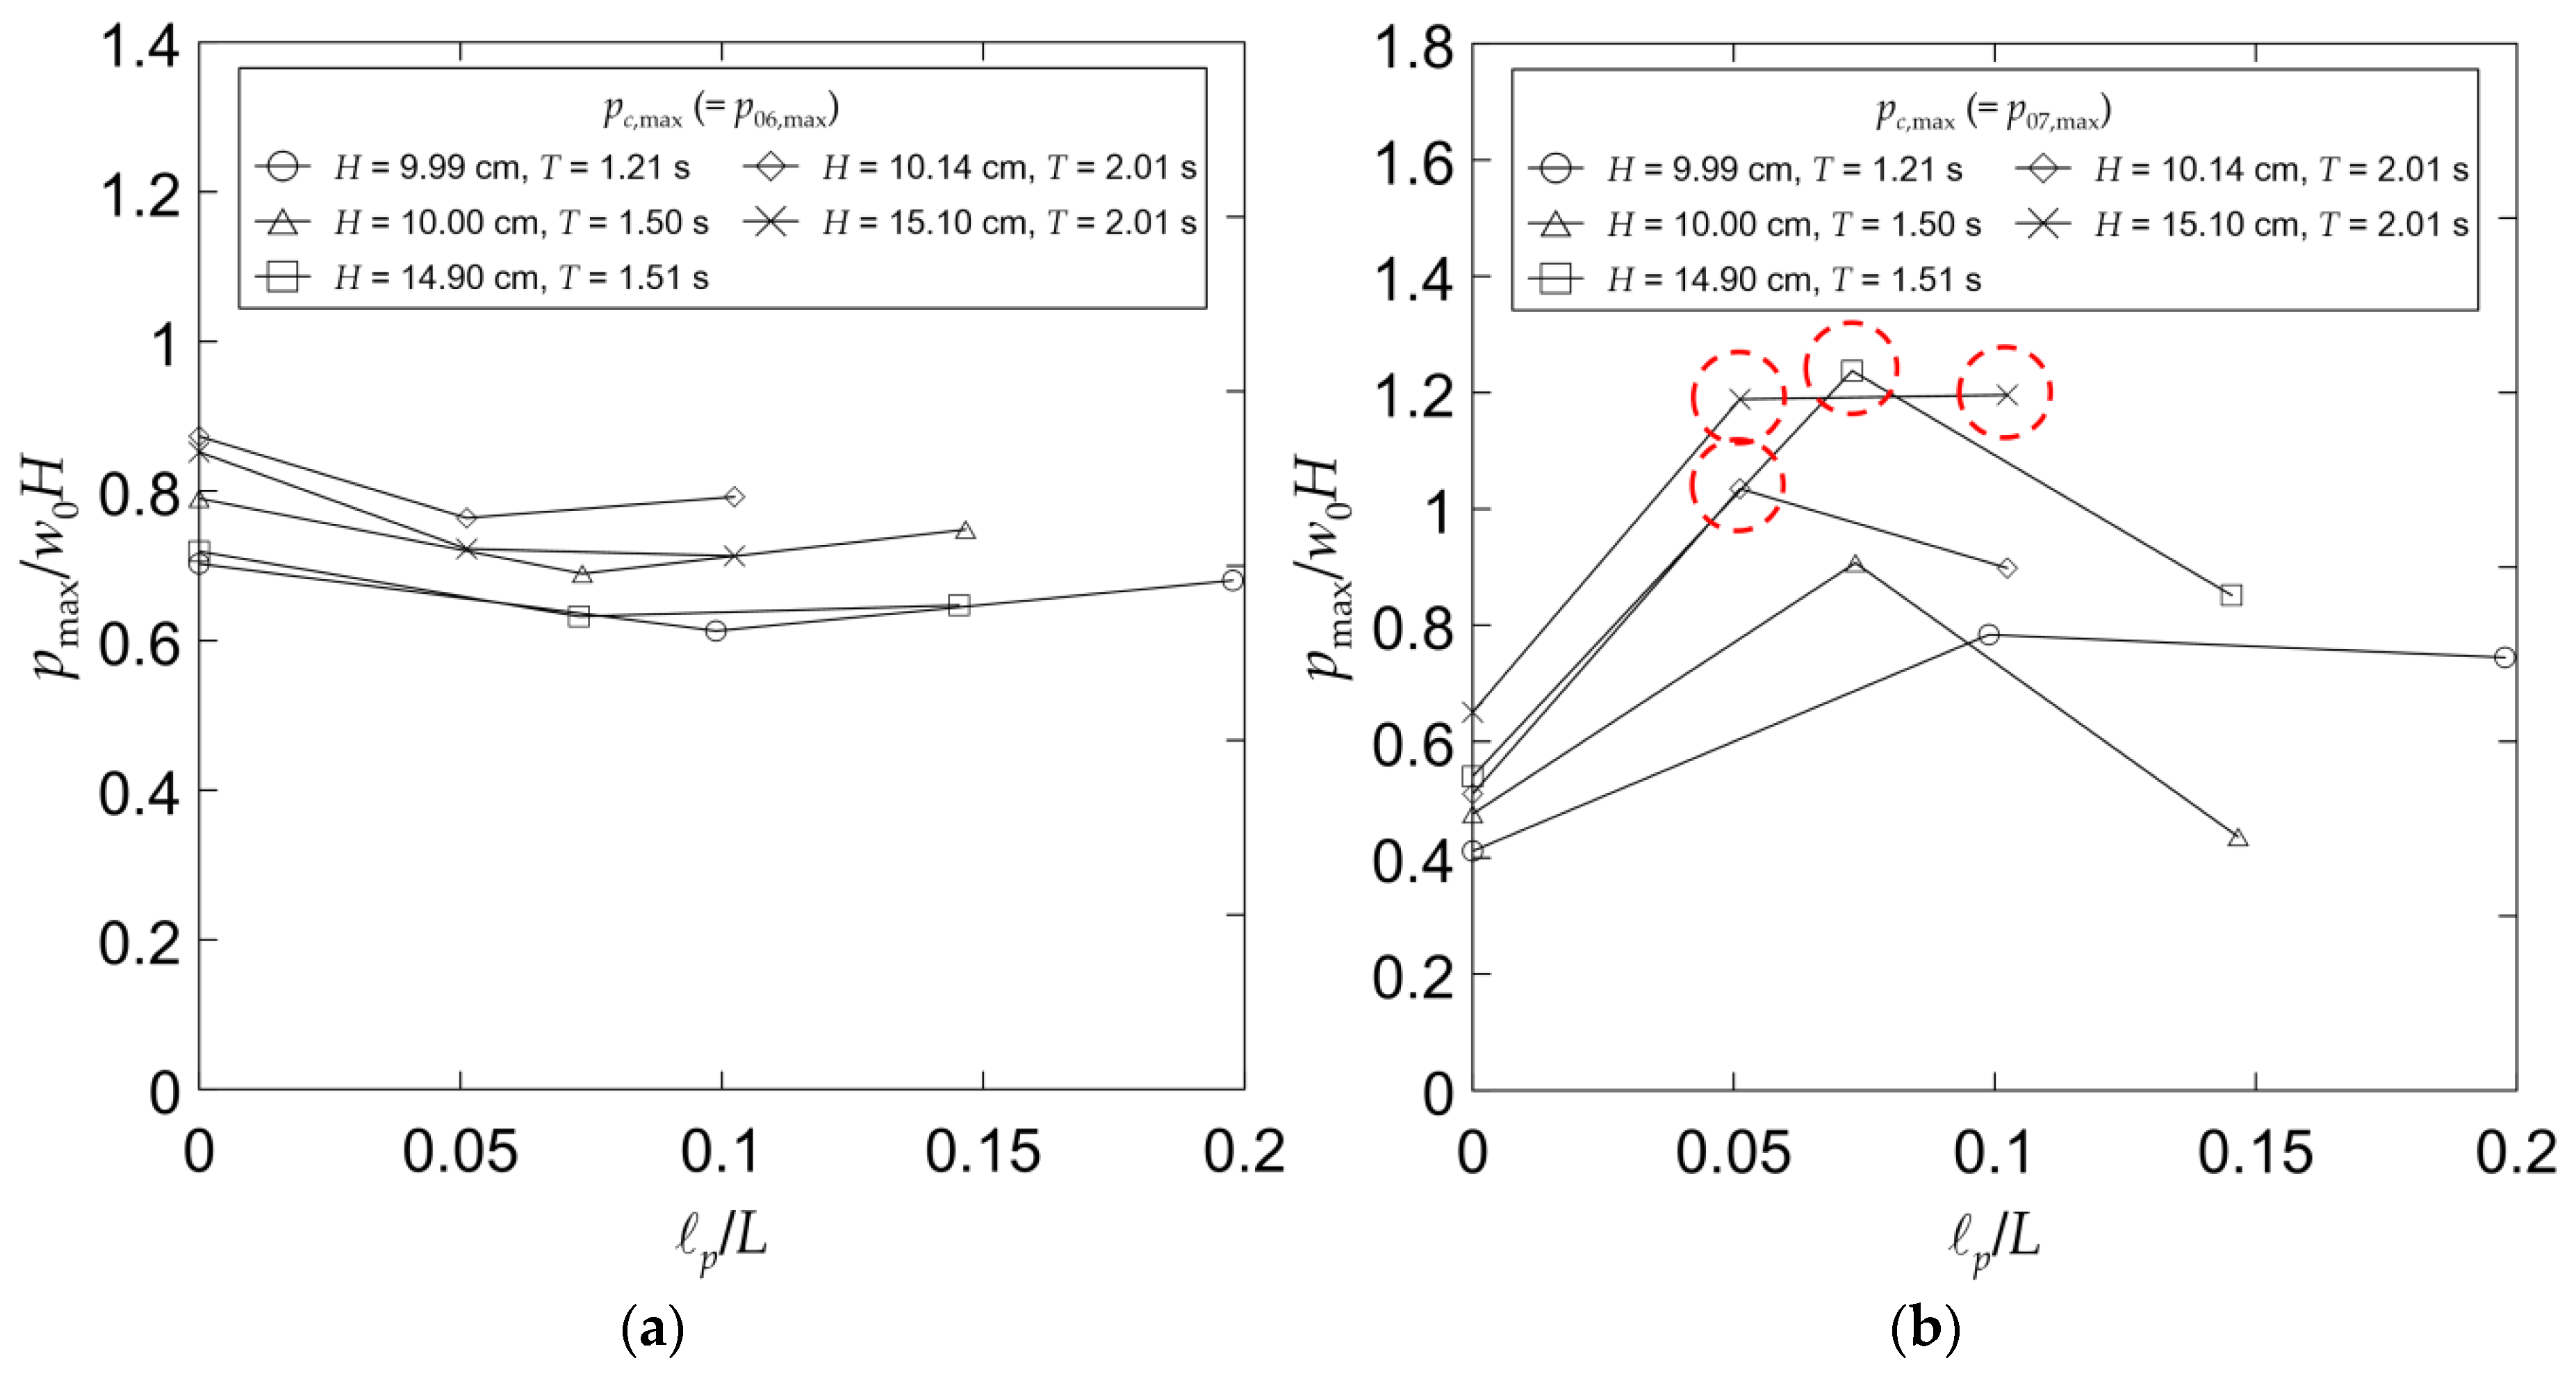
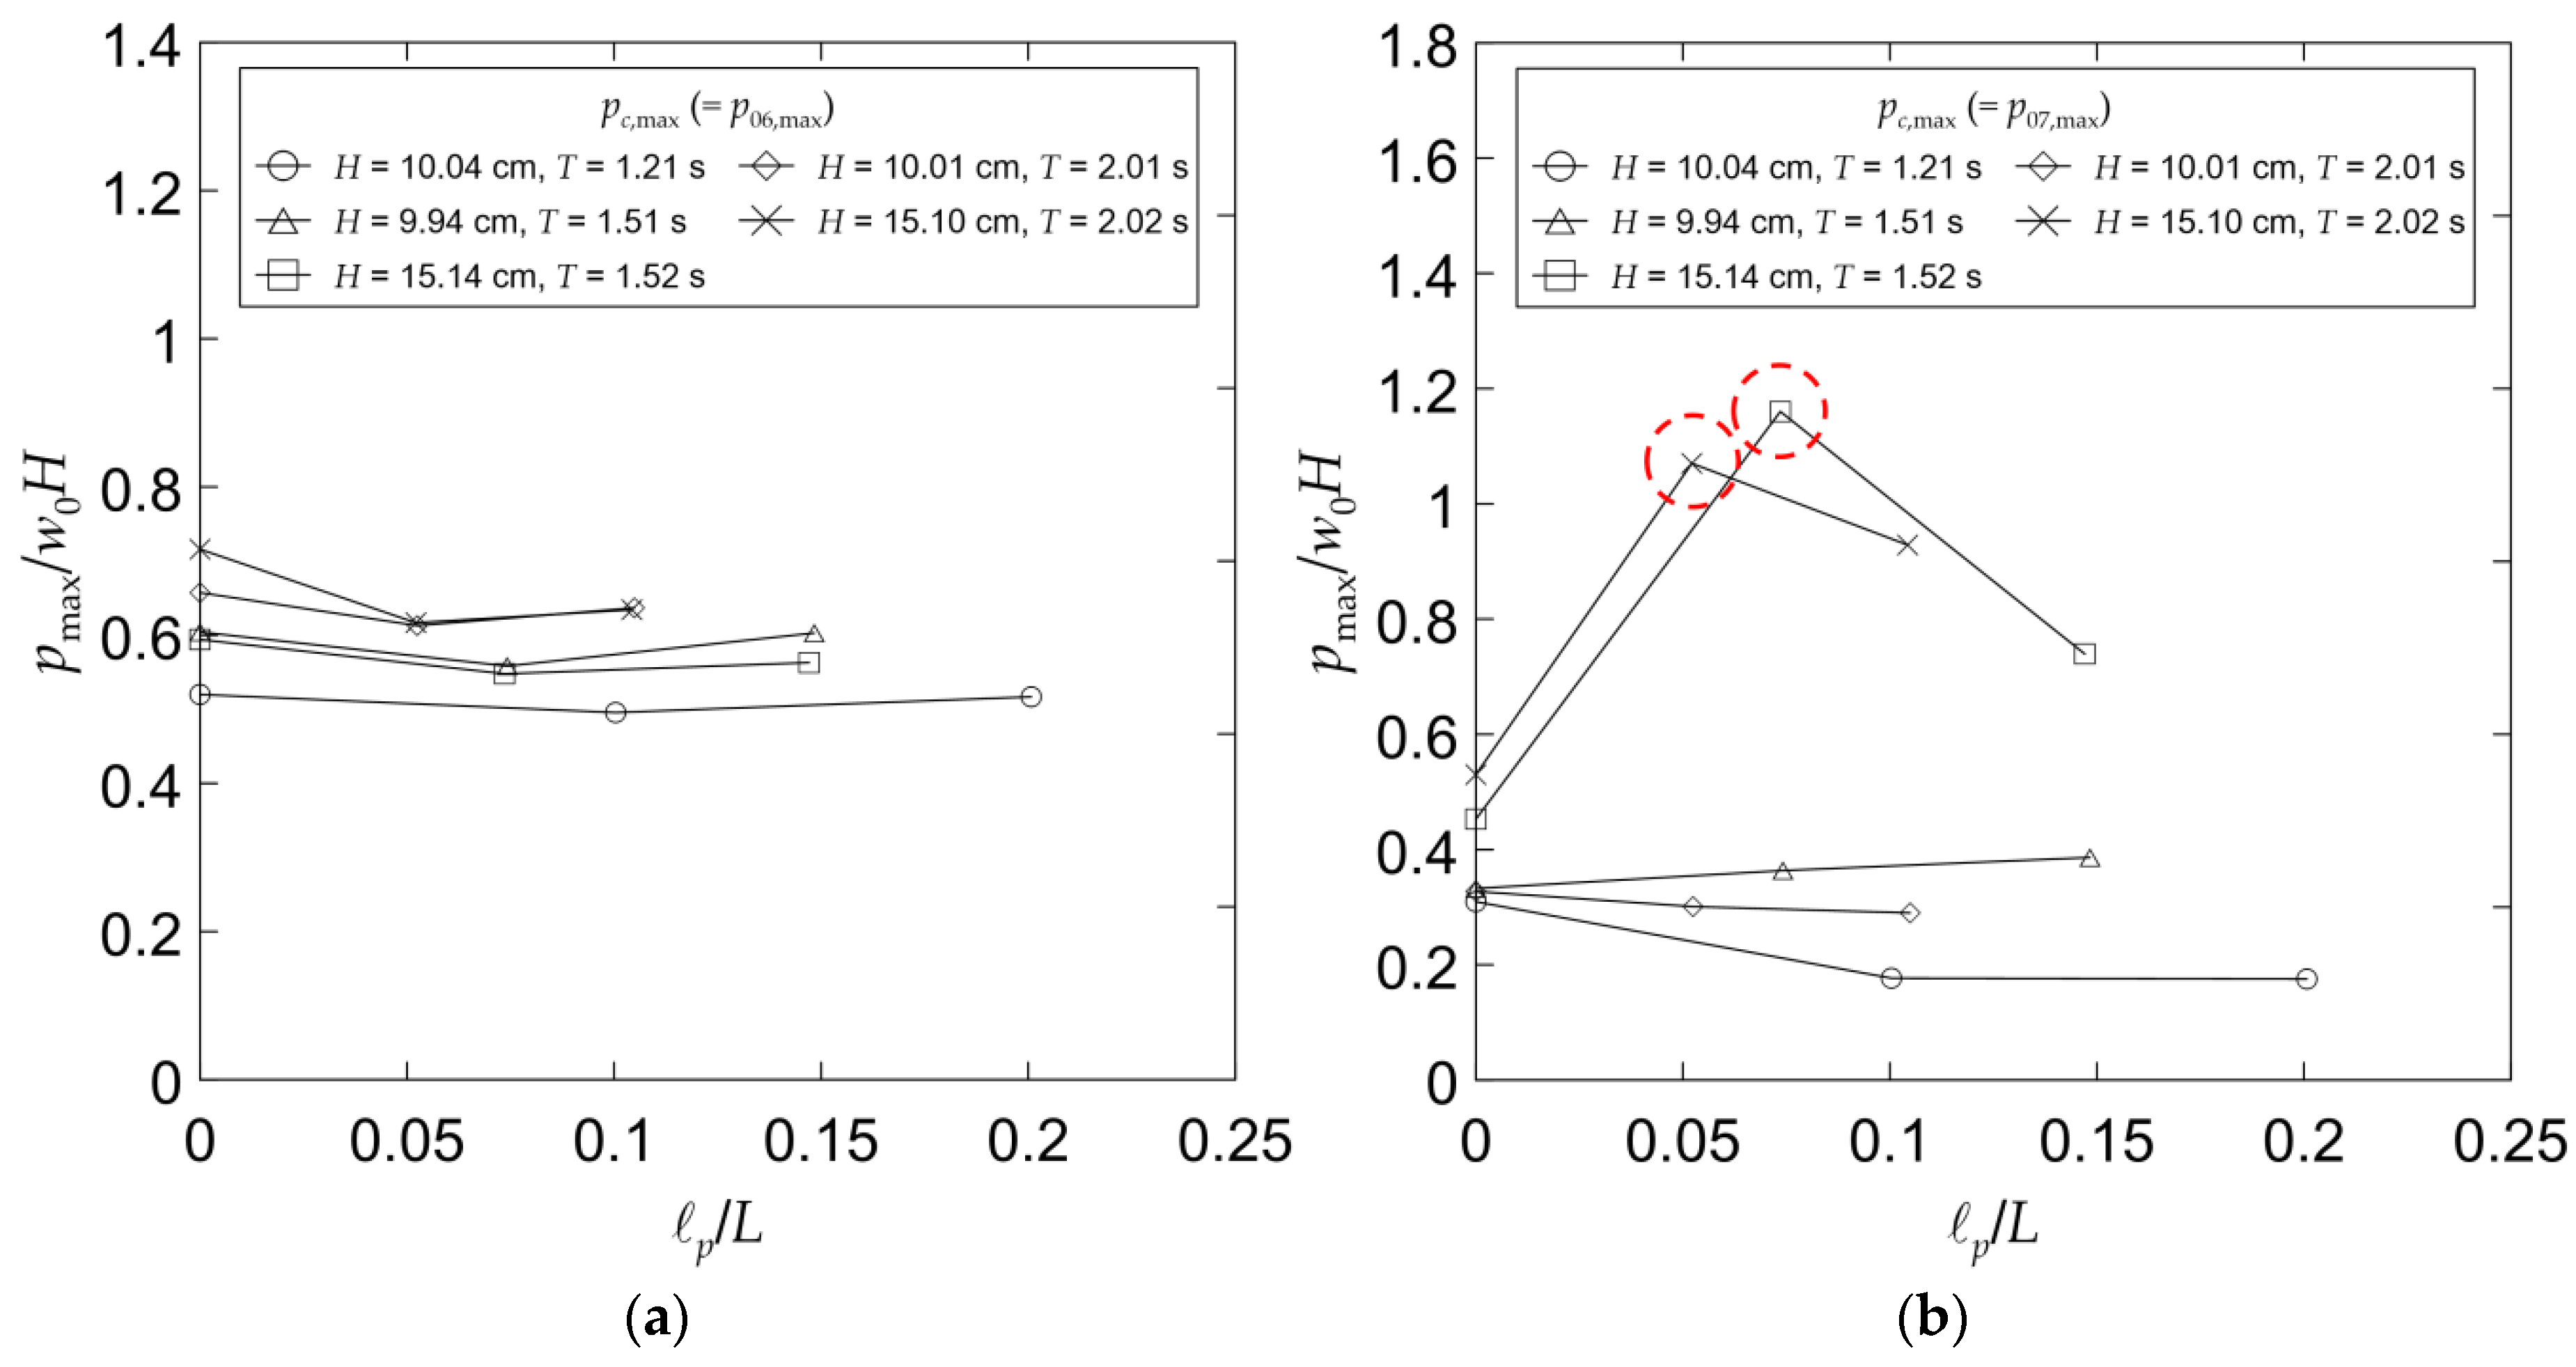
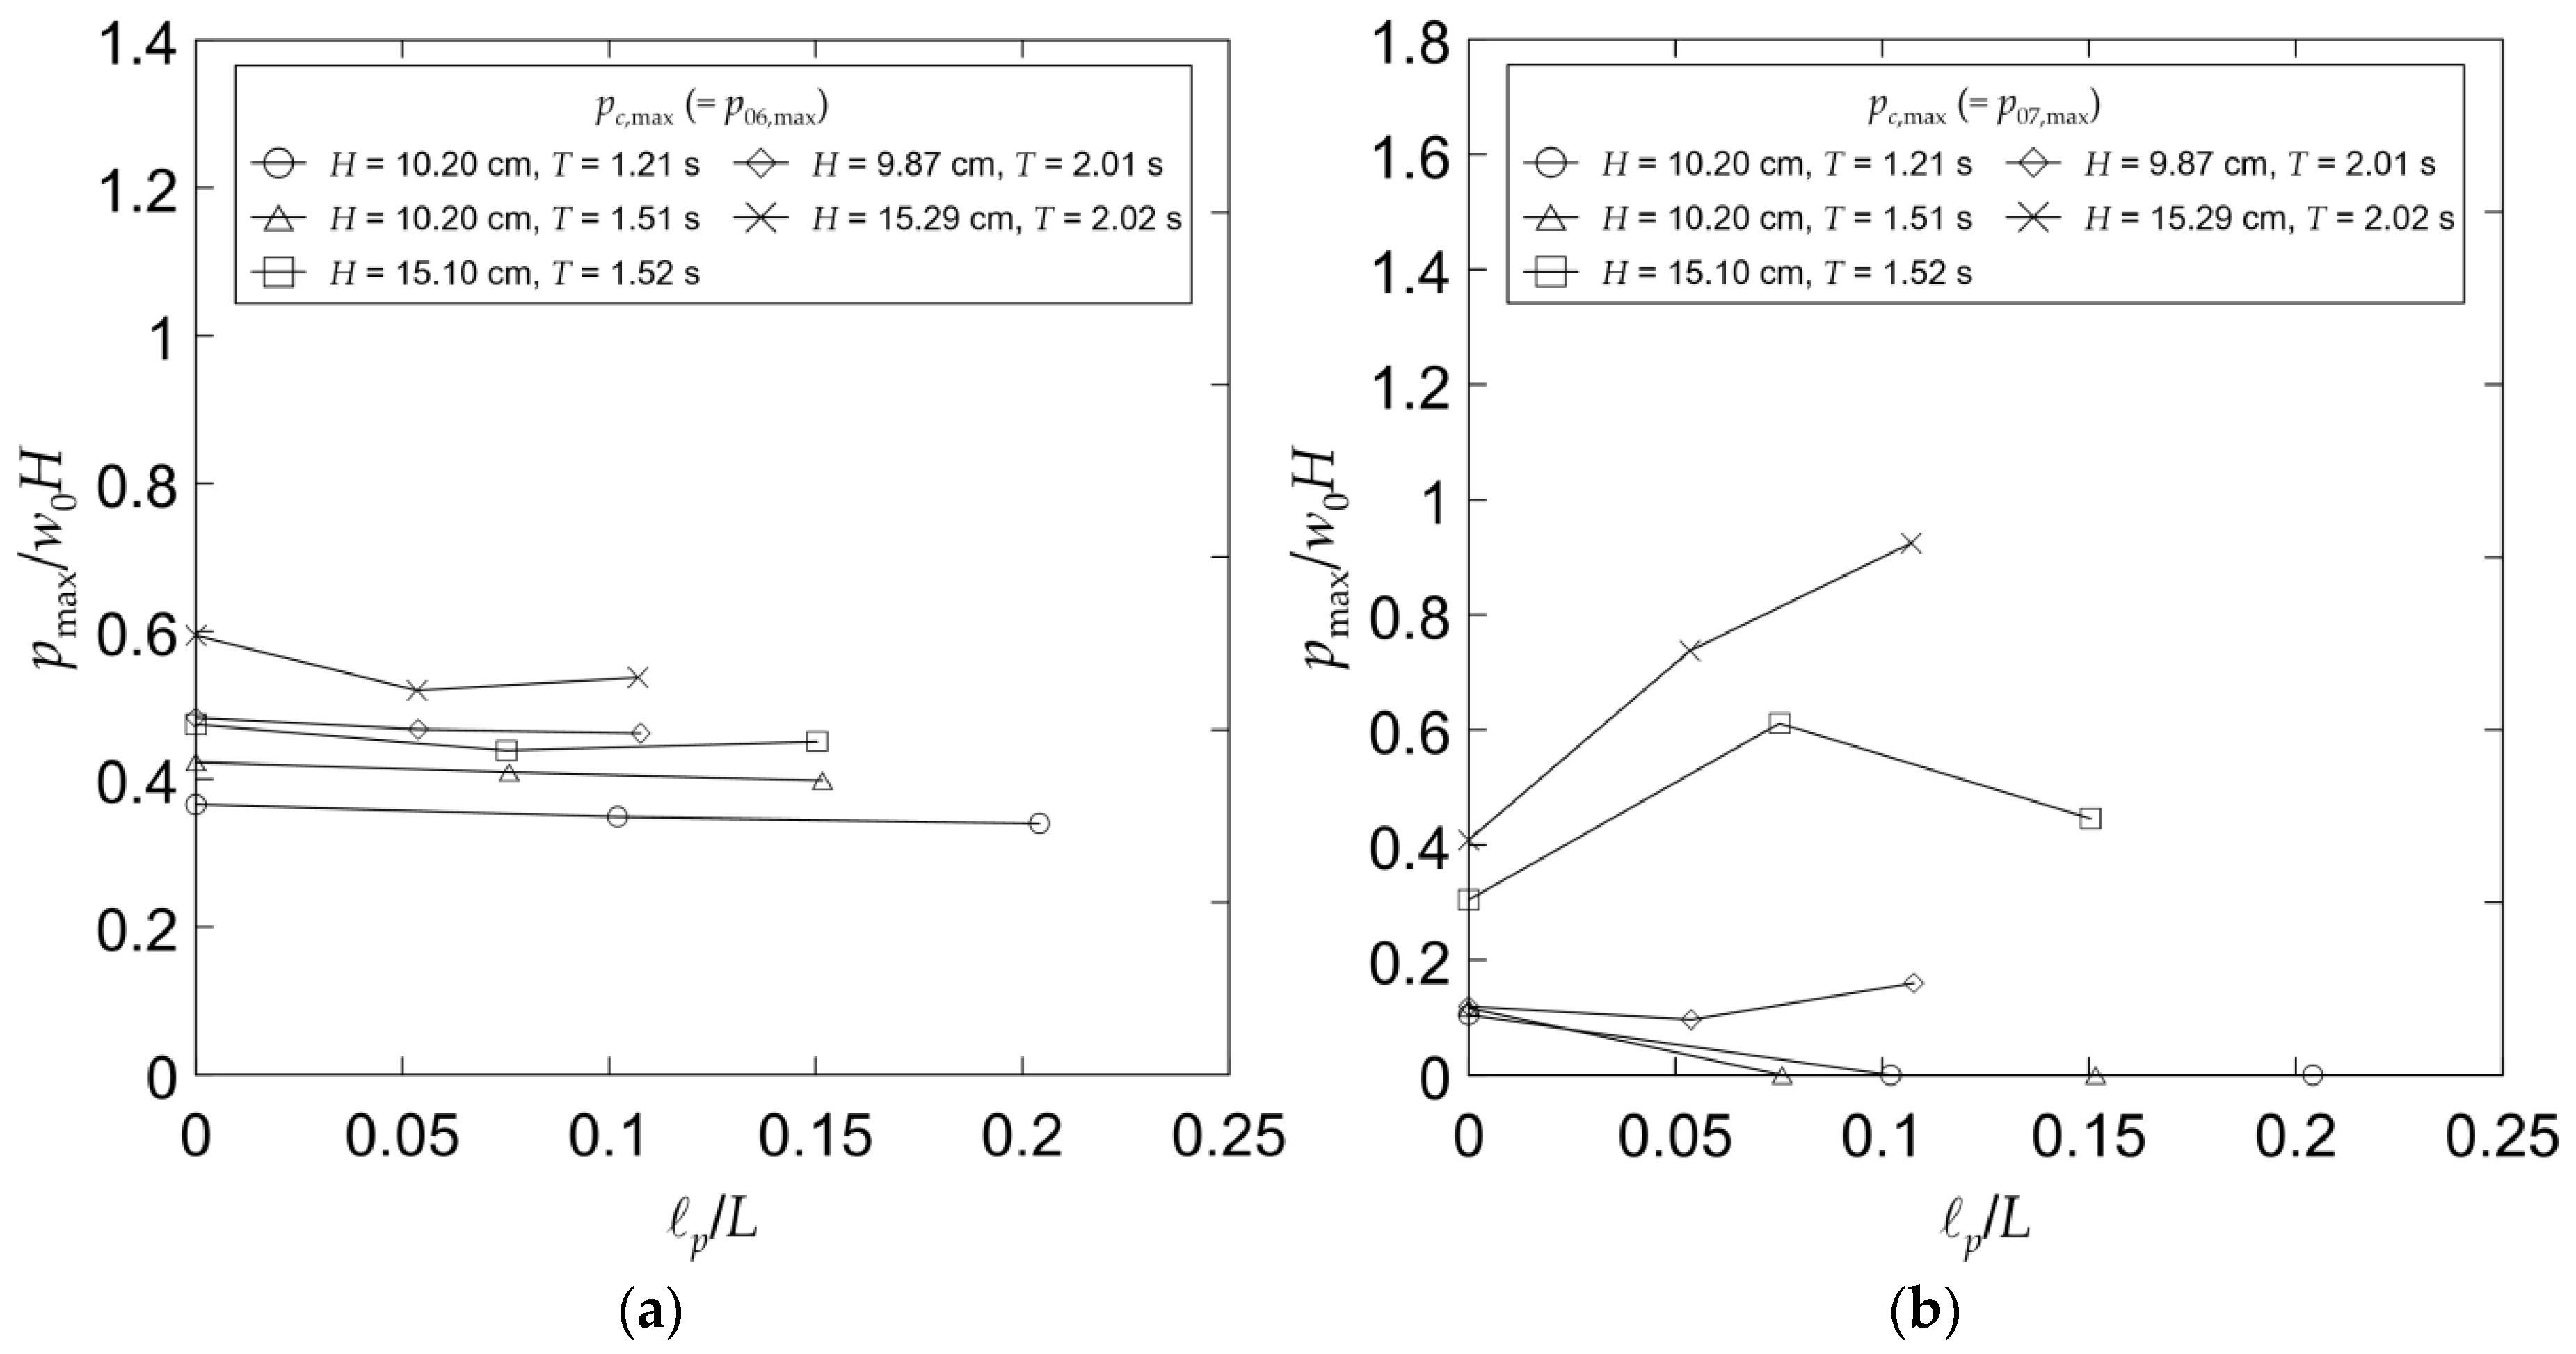
To examine the experimental results from the perspective of the characteristics of the rear-parapet structure, the maximum wave pressures at the top of the offshore freeboard (pc,max = p06,max) and at the bottom of the parapet (pp,max = p07,max) were compared with those in Figure 9, Figure 10 and Figure 11. The x-axis represents the relative parapet position p / L nondimensionalized by the wavelength L of the incident wave.
As shown in Figure 9, Figure 10 and Figure 11a, pc,max decreases as the water depth decreases, which is due to the fact that the installation position of the pressure gauge is fixed near the top of the offshore freeboard. That is, it can be said that these figures depict the common result that the hydraulic pressure acting above the still water level decreases linearly. When the parapet is moved to the harborside, pc,max decreases compared to when the parapet is located on the seaside. In other words, pc,max for the parapet placed on the harborside (Model 3) or at the center of the breakwater (Model 2) is reduced by up to approximately 16% compared to the case in which the parapet is placed on the seaside (Model 1, p / L = 0 ). When the parapet is moved from the seaside to the harborside, a phase difference is induced as the water particle reflected from the parapet placed on the seaside in the same phase moves to the upper part of the caisson and is reflected from the parapet placed on the harborside or at the center. In this process, as shown in Figure 4, energy dissipation occurs because of turbulence, such as in the case of a perforated caisson with a wave chamber and perforated wall [33,34]. A significant portion of the wave energy is also dissipated by wave breaking, splashing, and water falling with air bubbles. In addition, the higher the crest, the greater the energy consumption, and the shorter the period, the greater the energy consumption, under the same depth conditions.
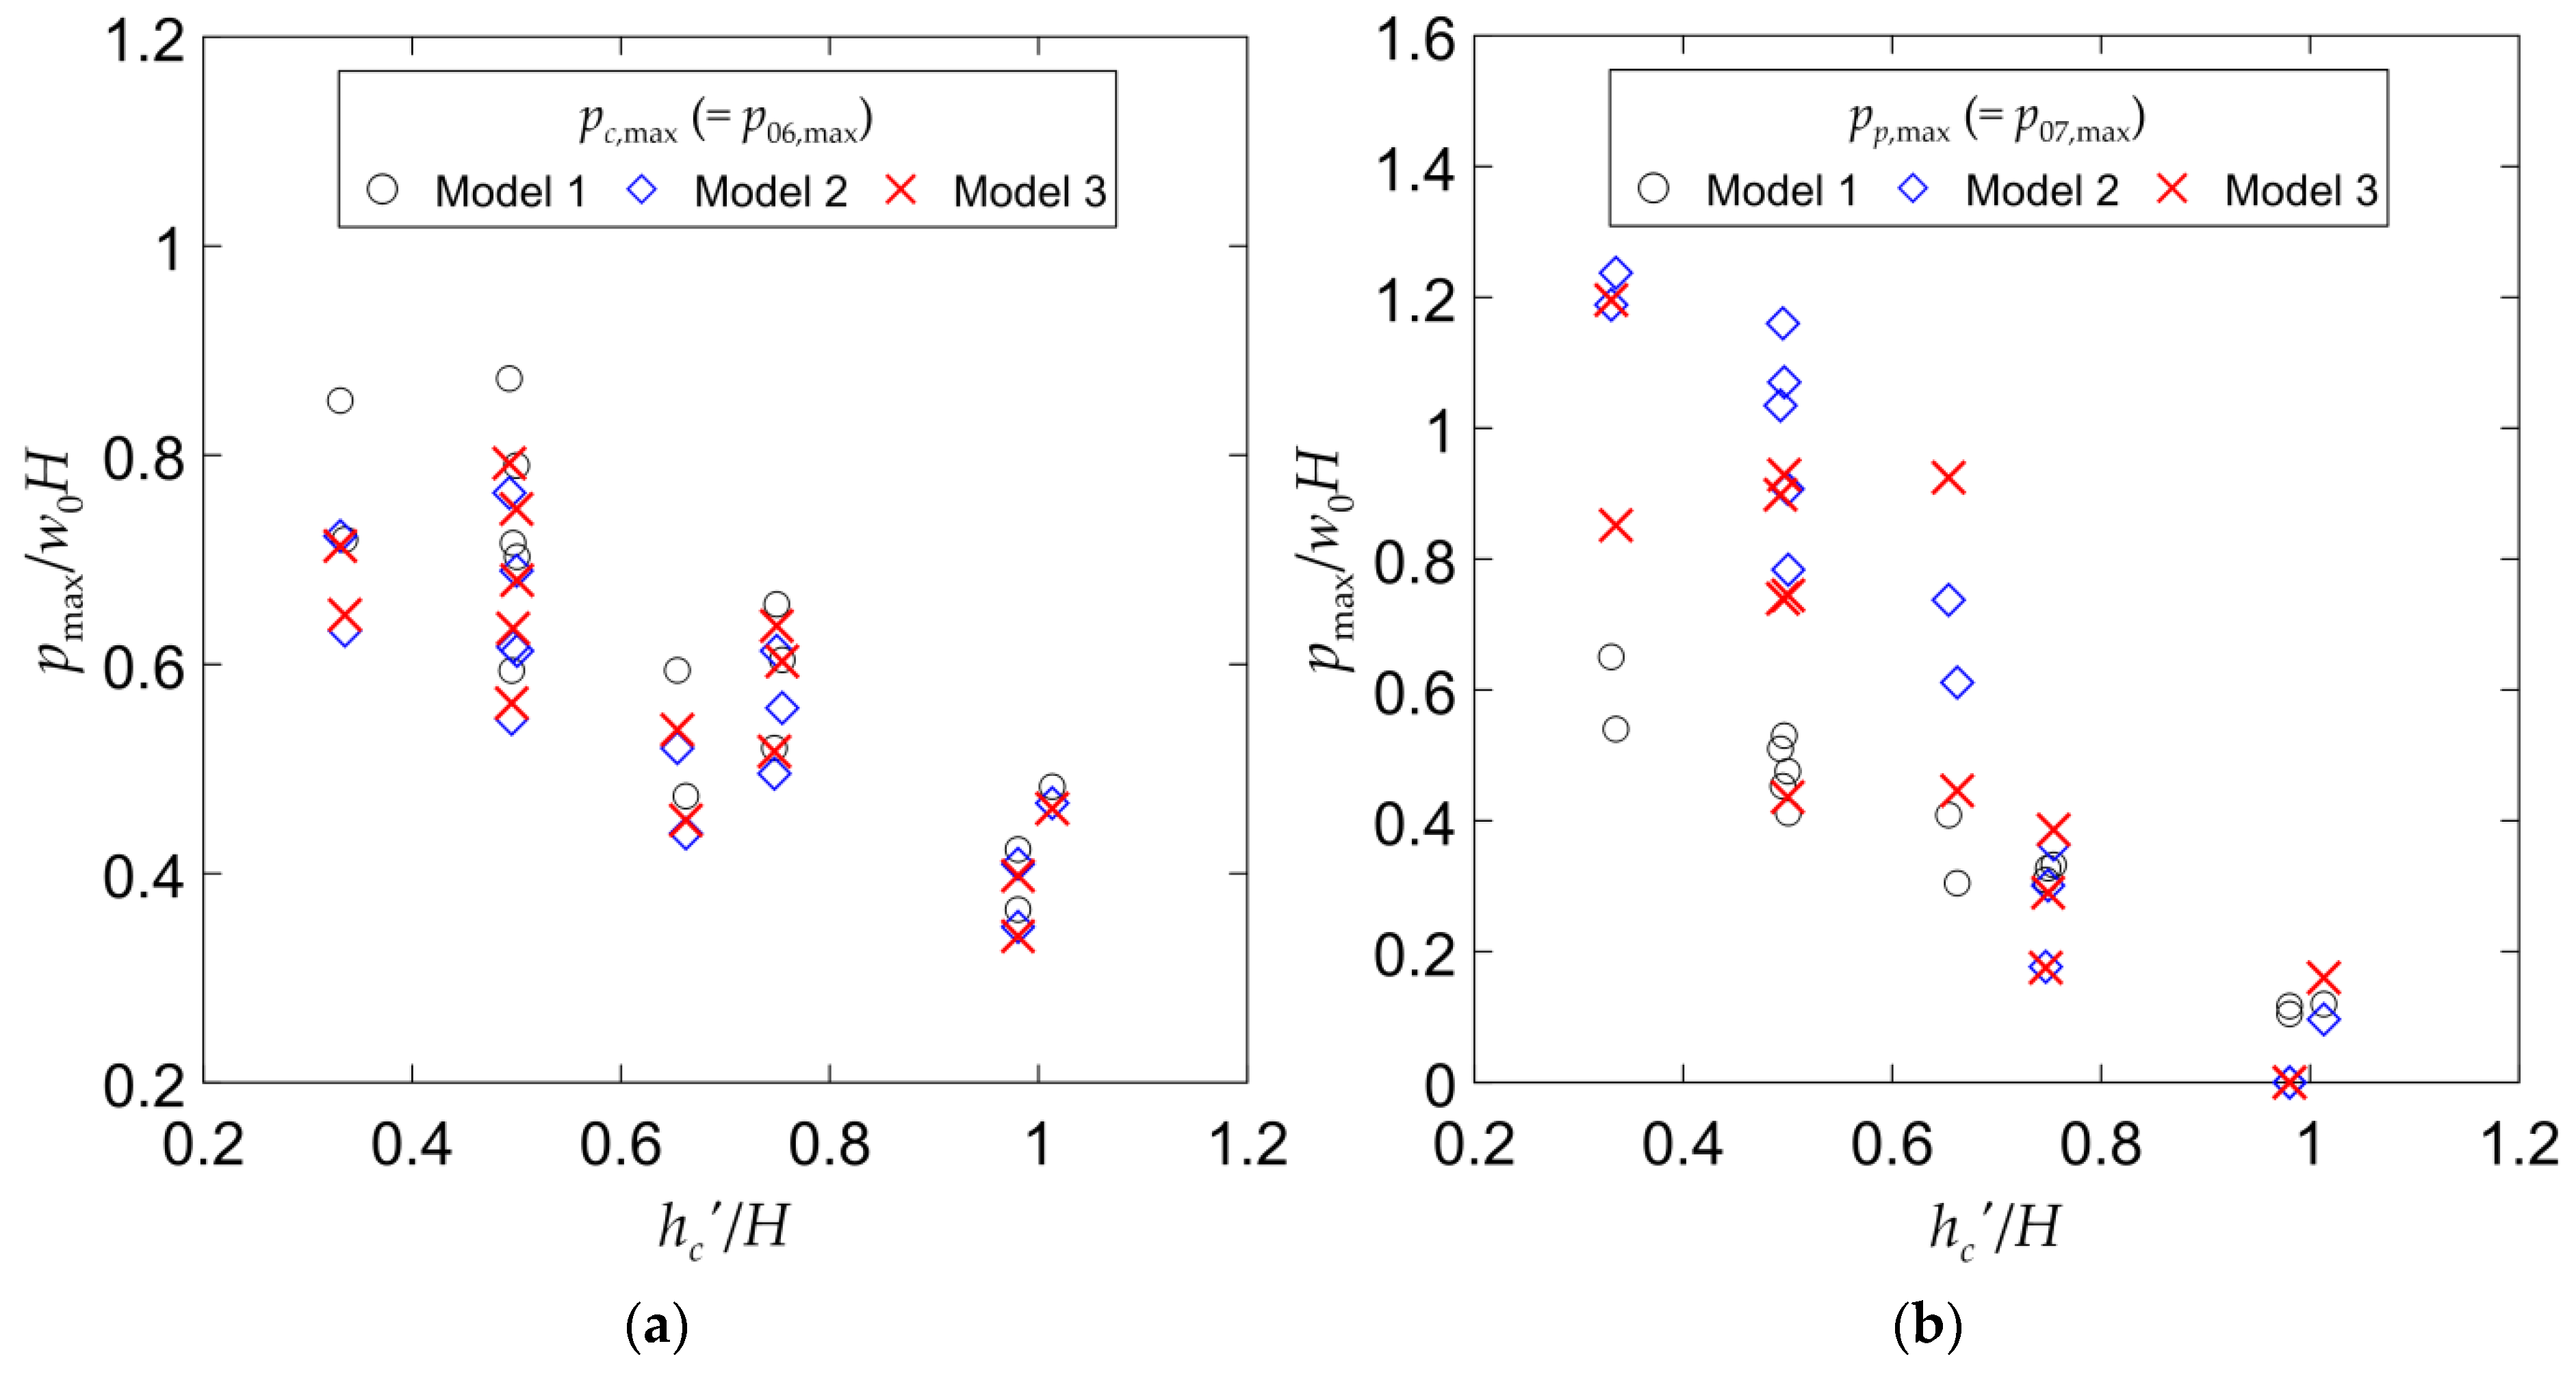
Figure 9, Figure 10 and Figure 11b demonstrate that the nondimensionalized pp,max is sometimes greater than 1.0, particularly when the depth is 45 cm. pp,max being greater than 1.0 indicates the generation of impulsive pressure [15,32,35,36], which should be avoided or seriously considered in the design stage. Further, the lower the offshore freeboard height h c , that is, the greater the wave overtopping, the greater the wave pressure. The regions with pp,max > 1.0 (indicated by dashed circles in Figure 9b, Figure 10b and Figure 11b) correspond to the case in which the offshore freeboard height h c is less than 0.5 times the incident wave height (H). In addition, when the parapet is located at the center of the breakwater ( p / L = 0.05–0.1), it exhibits a greater wave pressure than when it is located on the harborside ( p / L > 0.1 ). It may be understood that this characteristic is due to the difference in the speed at which the overtopped water hits the parapet. In other words, if the movement of the water mass is assumed to be a long wave propagating in the shallow water, the wave celerity is proportional to the square root of the average depth. Hence, the wave celerity is slower when the average depth is lower than that in the center. It is presumed that the wave pressure eventually became relatively small accordingly. Although these results are limited in that they were obtained based on regular waves, the occurrence of impulsive pressure can be avoided if the offshore freeboard is higher than the design wave by 0.5 times or more. Further, positioning the parapet as much as possible on the harborside helps increase the breakwater stability.
Figure 12 shows the above result as a relative offshore freeboard, h c / H . From the figure, it can be seen that pc,max and pp,max decrease linearly as the relative offshore freeboard h c / H increases. This is in accordance with our expectation as it is unlikely that the incident wave overtops the concrete cap due to the increase in the relative offshore freeboard. In Figure 9b, Figure 10b and Figure 11b, the impulsive wave pressure is mentioned, and it has been discussed that it occurs when the relative offshore freeboard is less than 0.5. Figure 12b clearly supports this discussion. That is, when the relative offshore freeboard is 0.3 to 0.5, the dimensionless pp,max is greater than 1.0. In this figure, the above results are observed for relatively long-period waves under the same relative offshore freeboard condition. This means that a wave with moderate steepness can generate higher pressure than a wave with greater steepness under the same wave height condition. This was particularly noticeable in the rear parapets in Models 2 and 3.

3.2. Wave Force

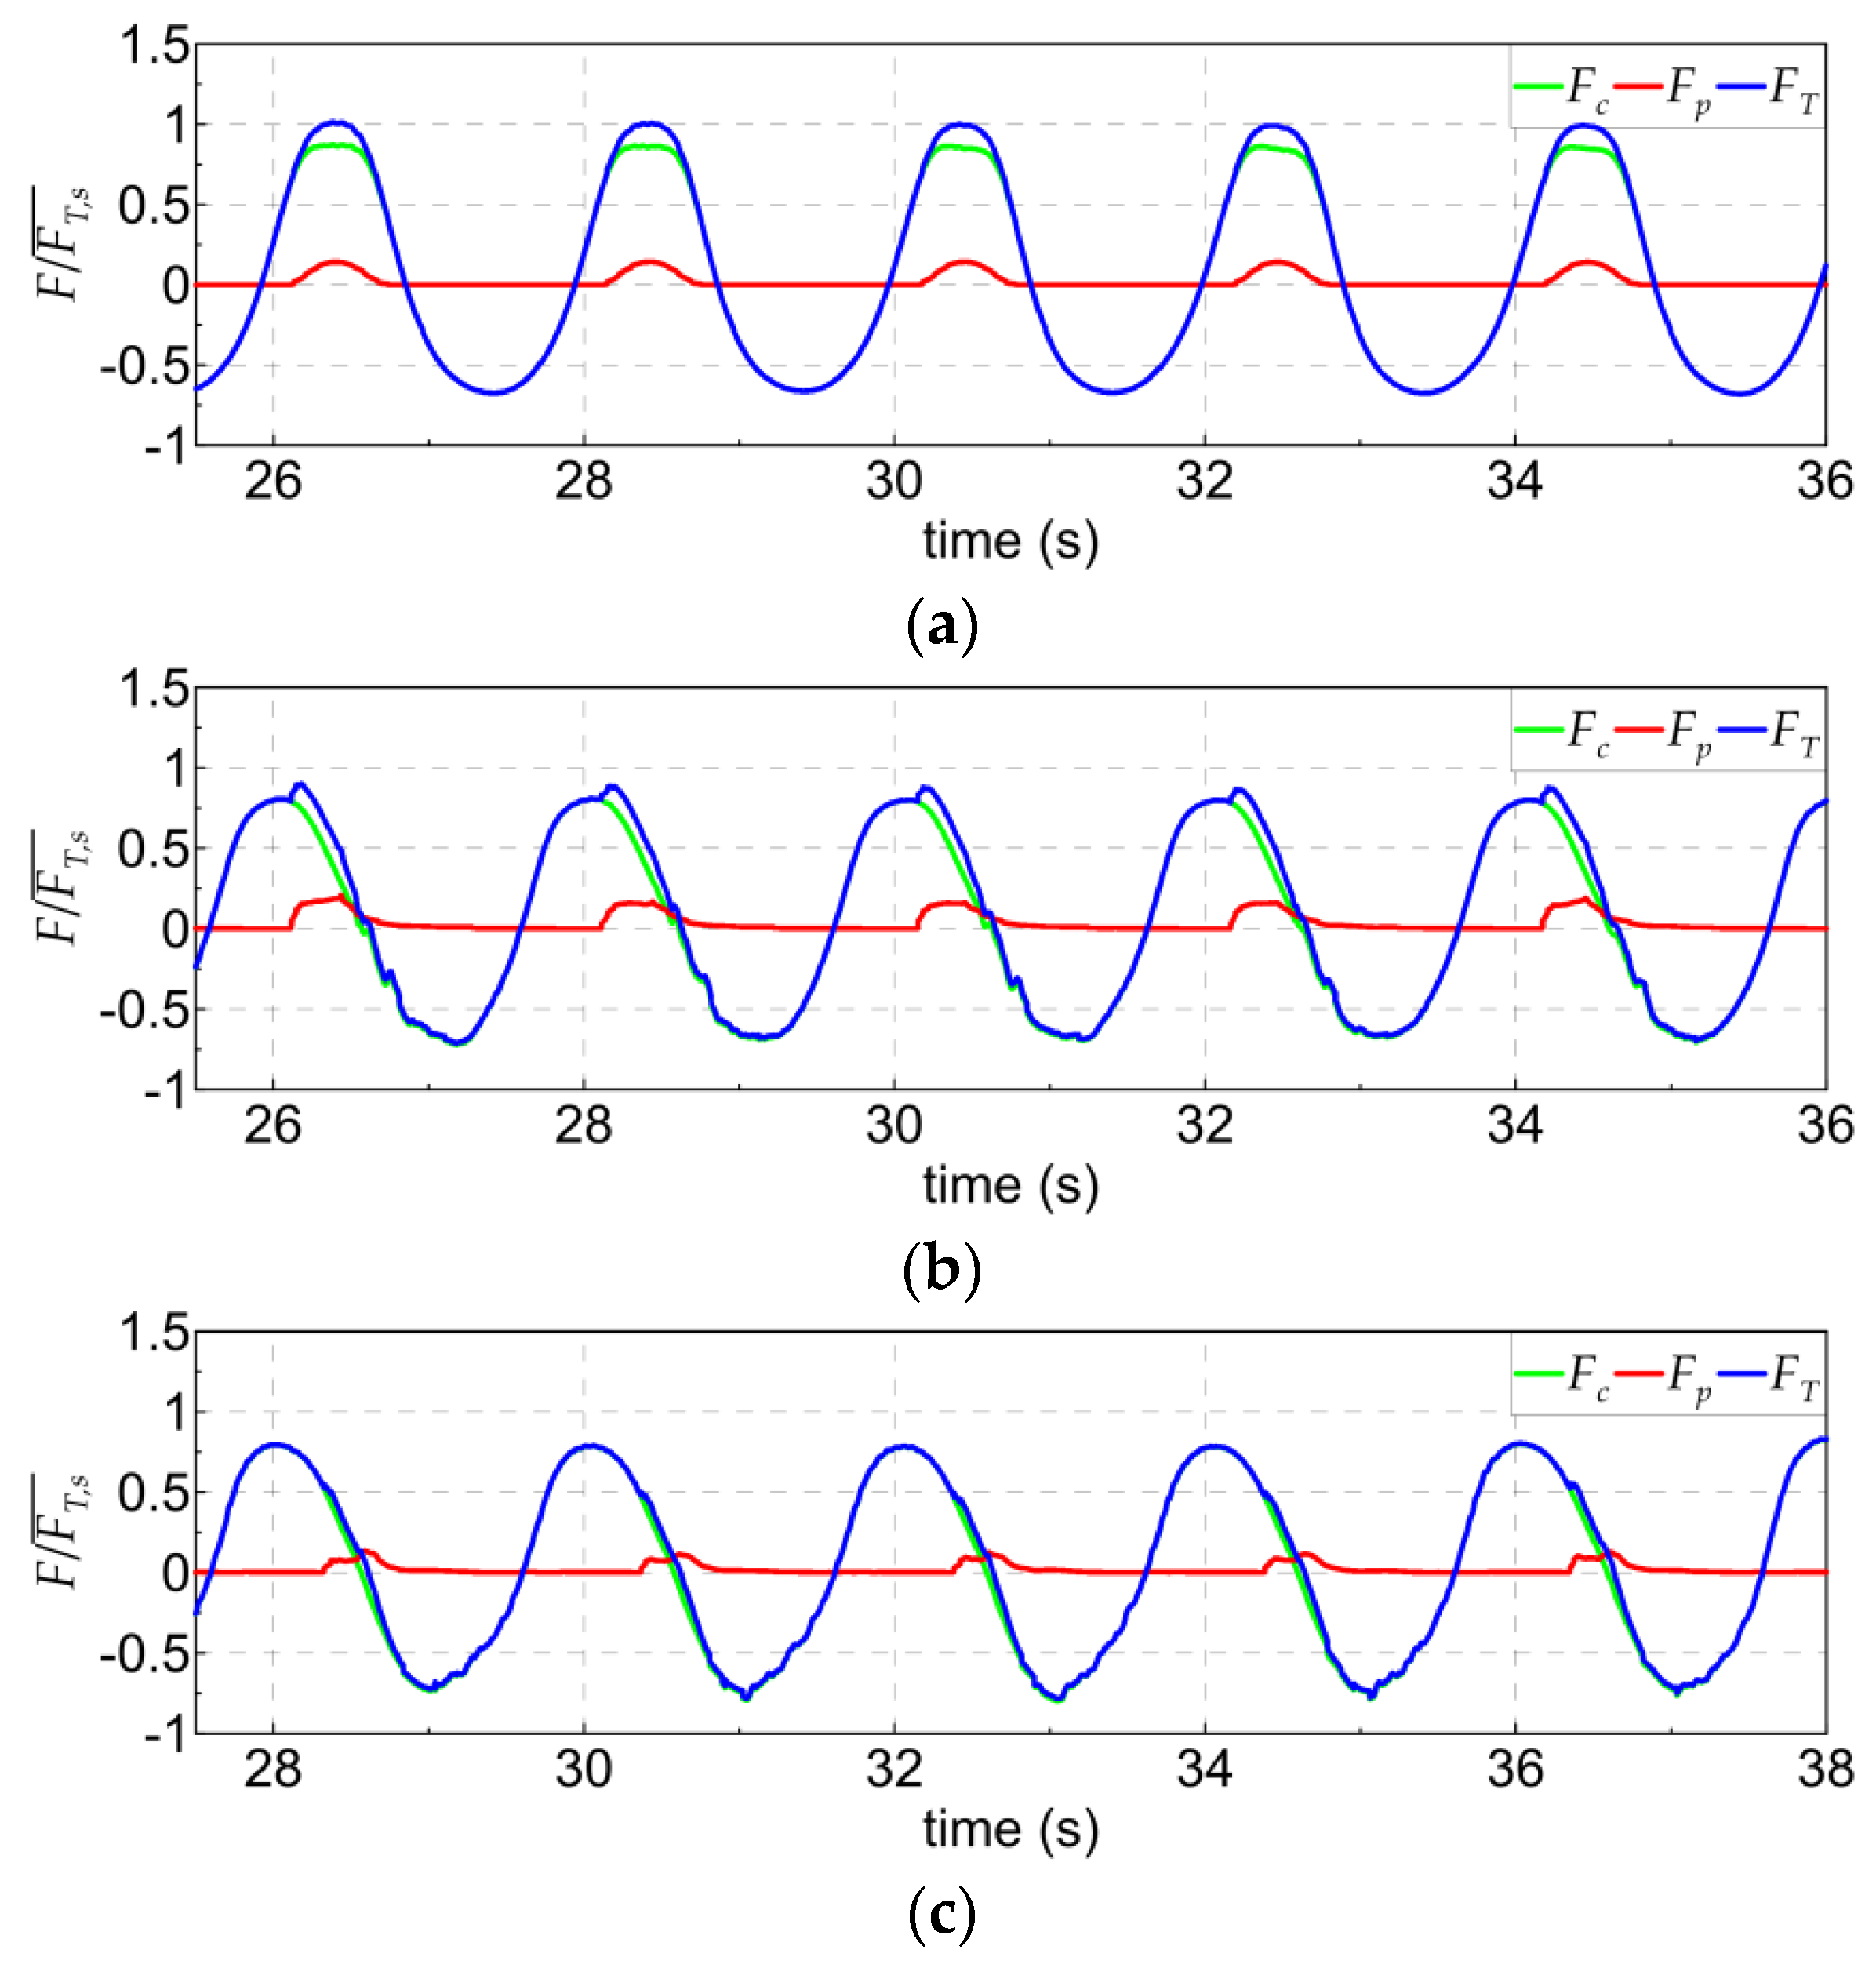
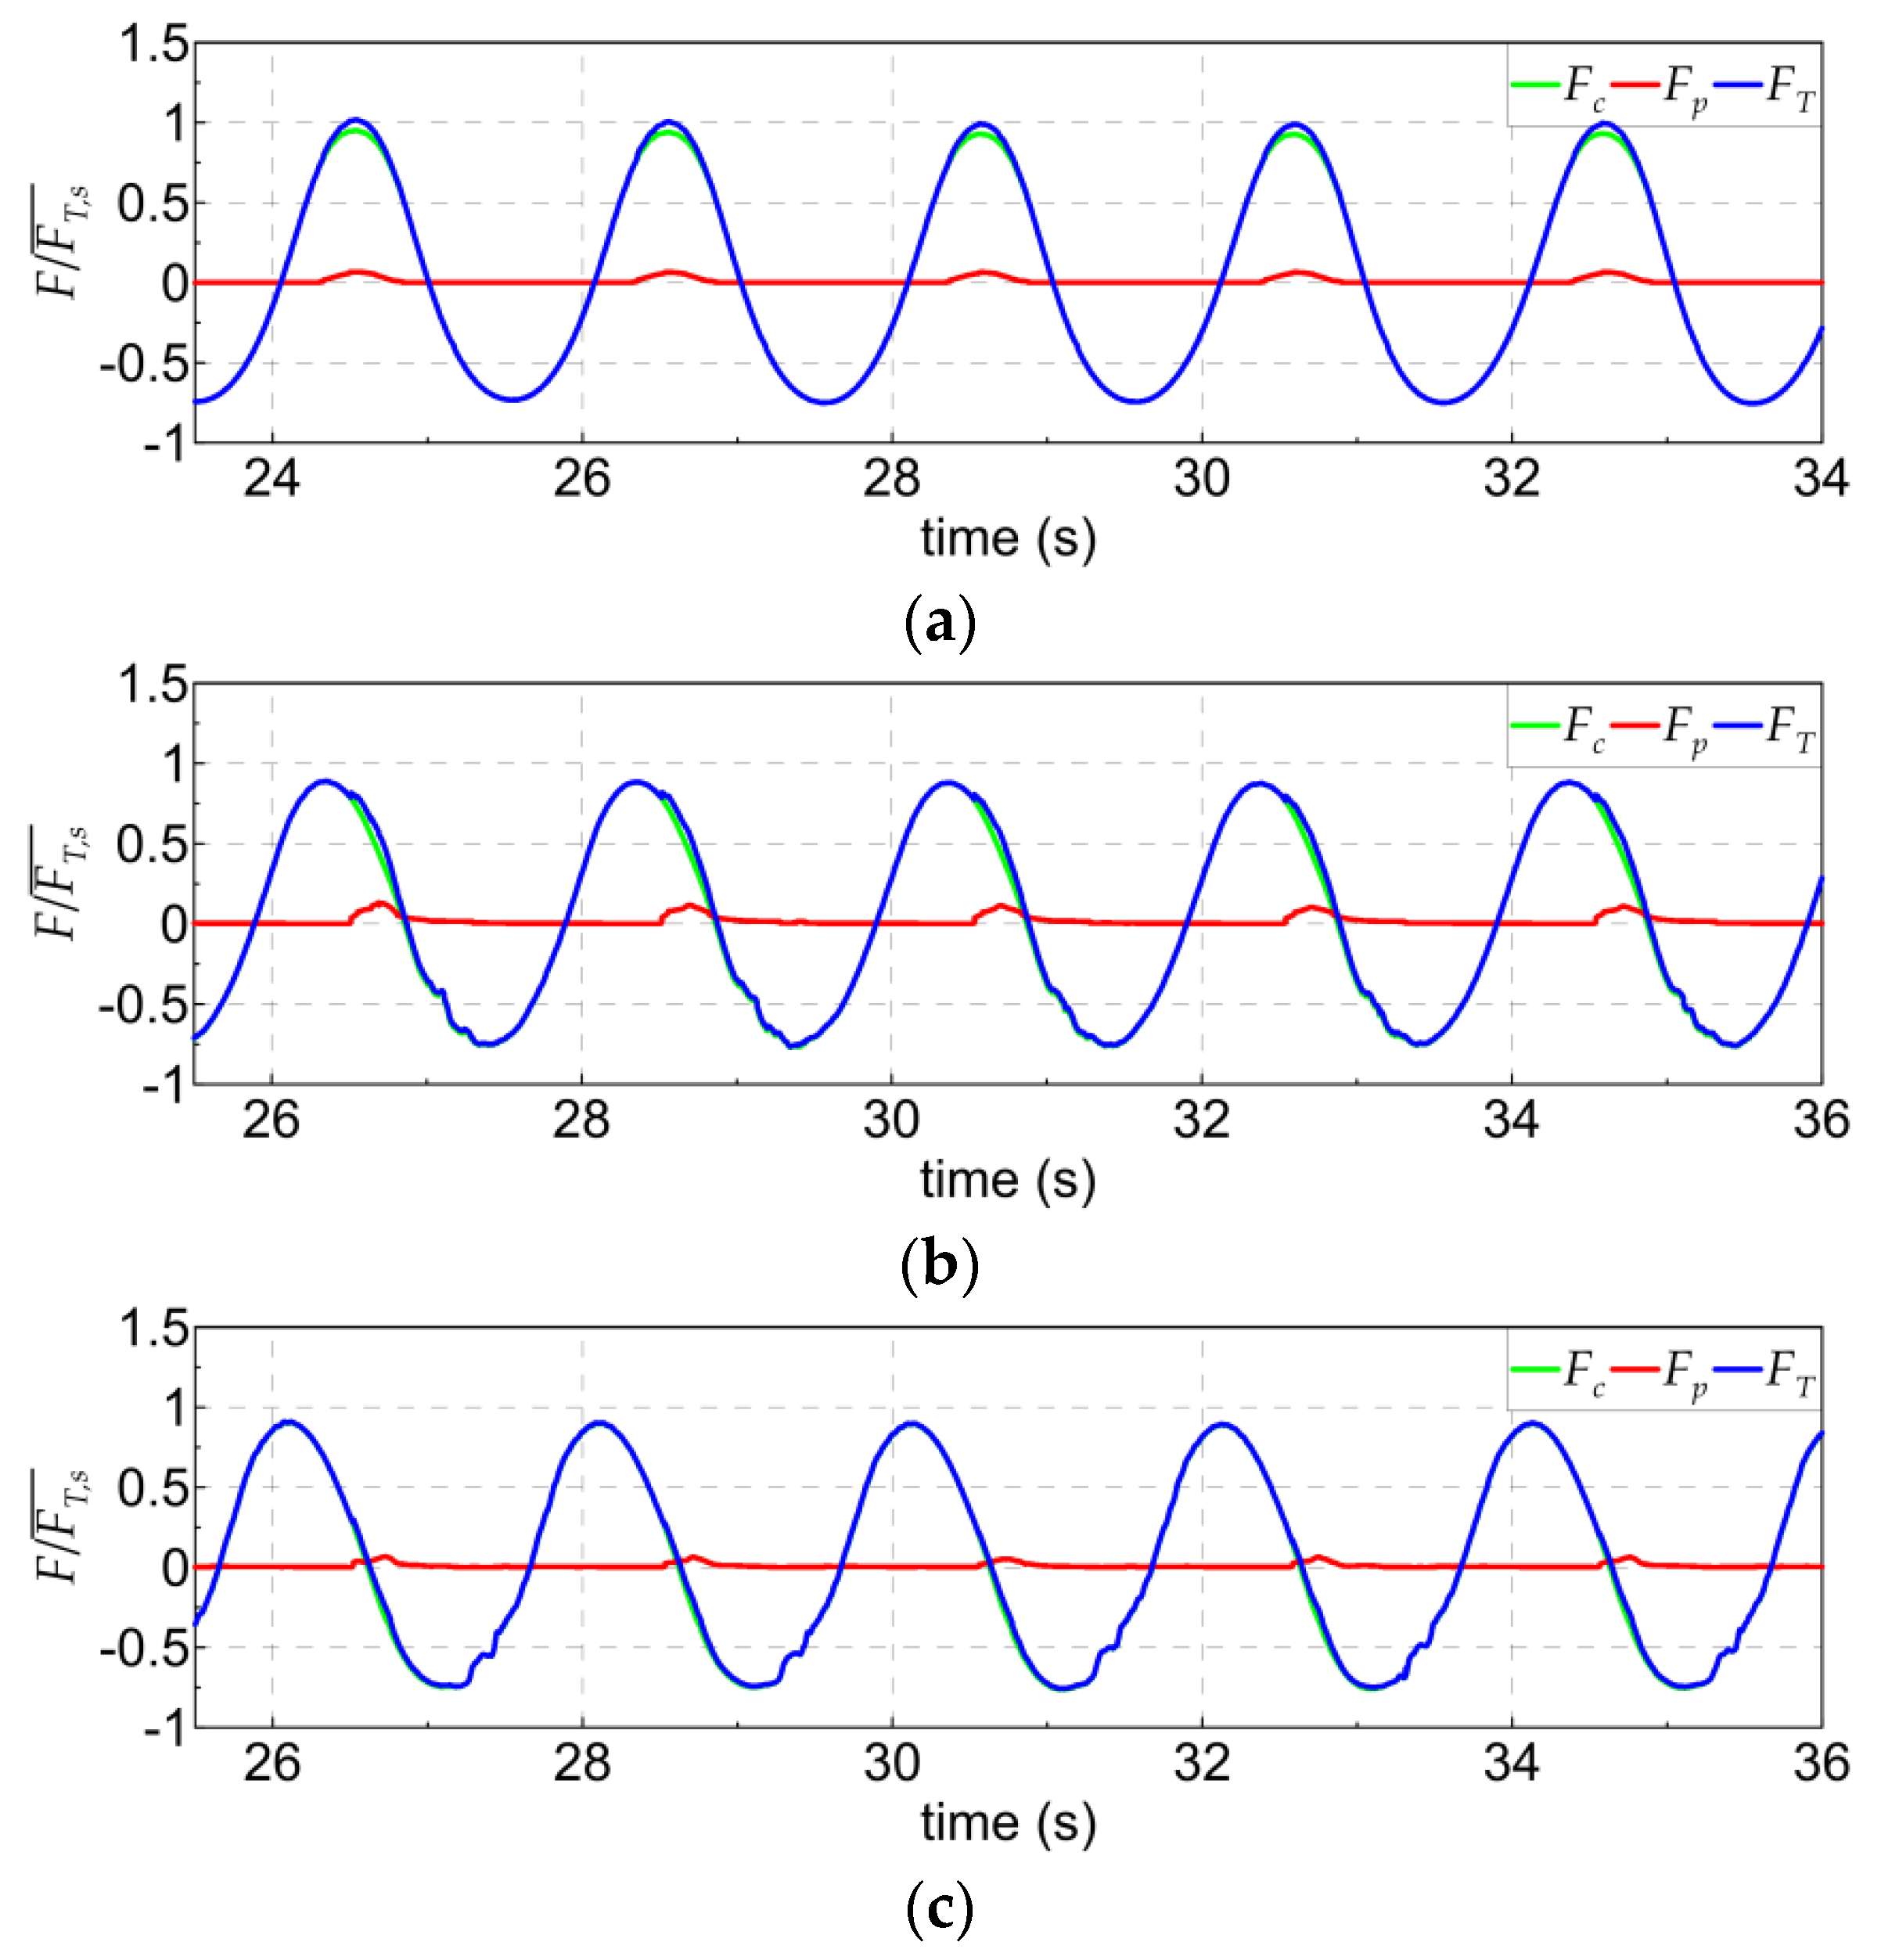
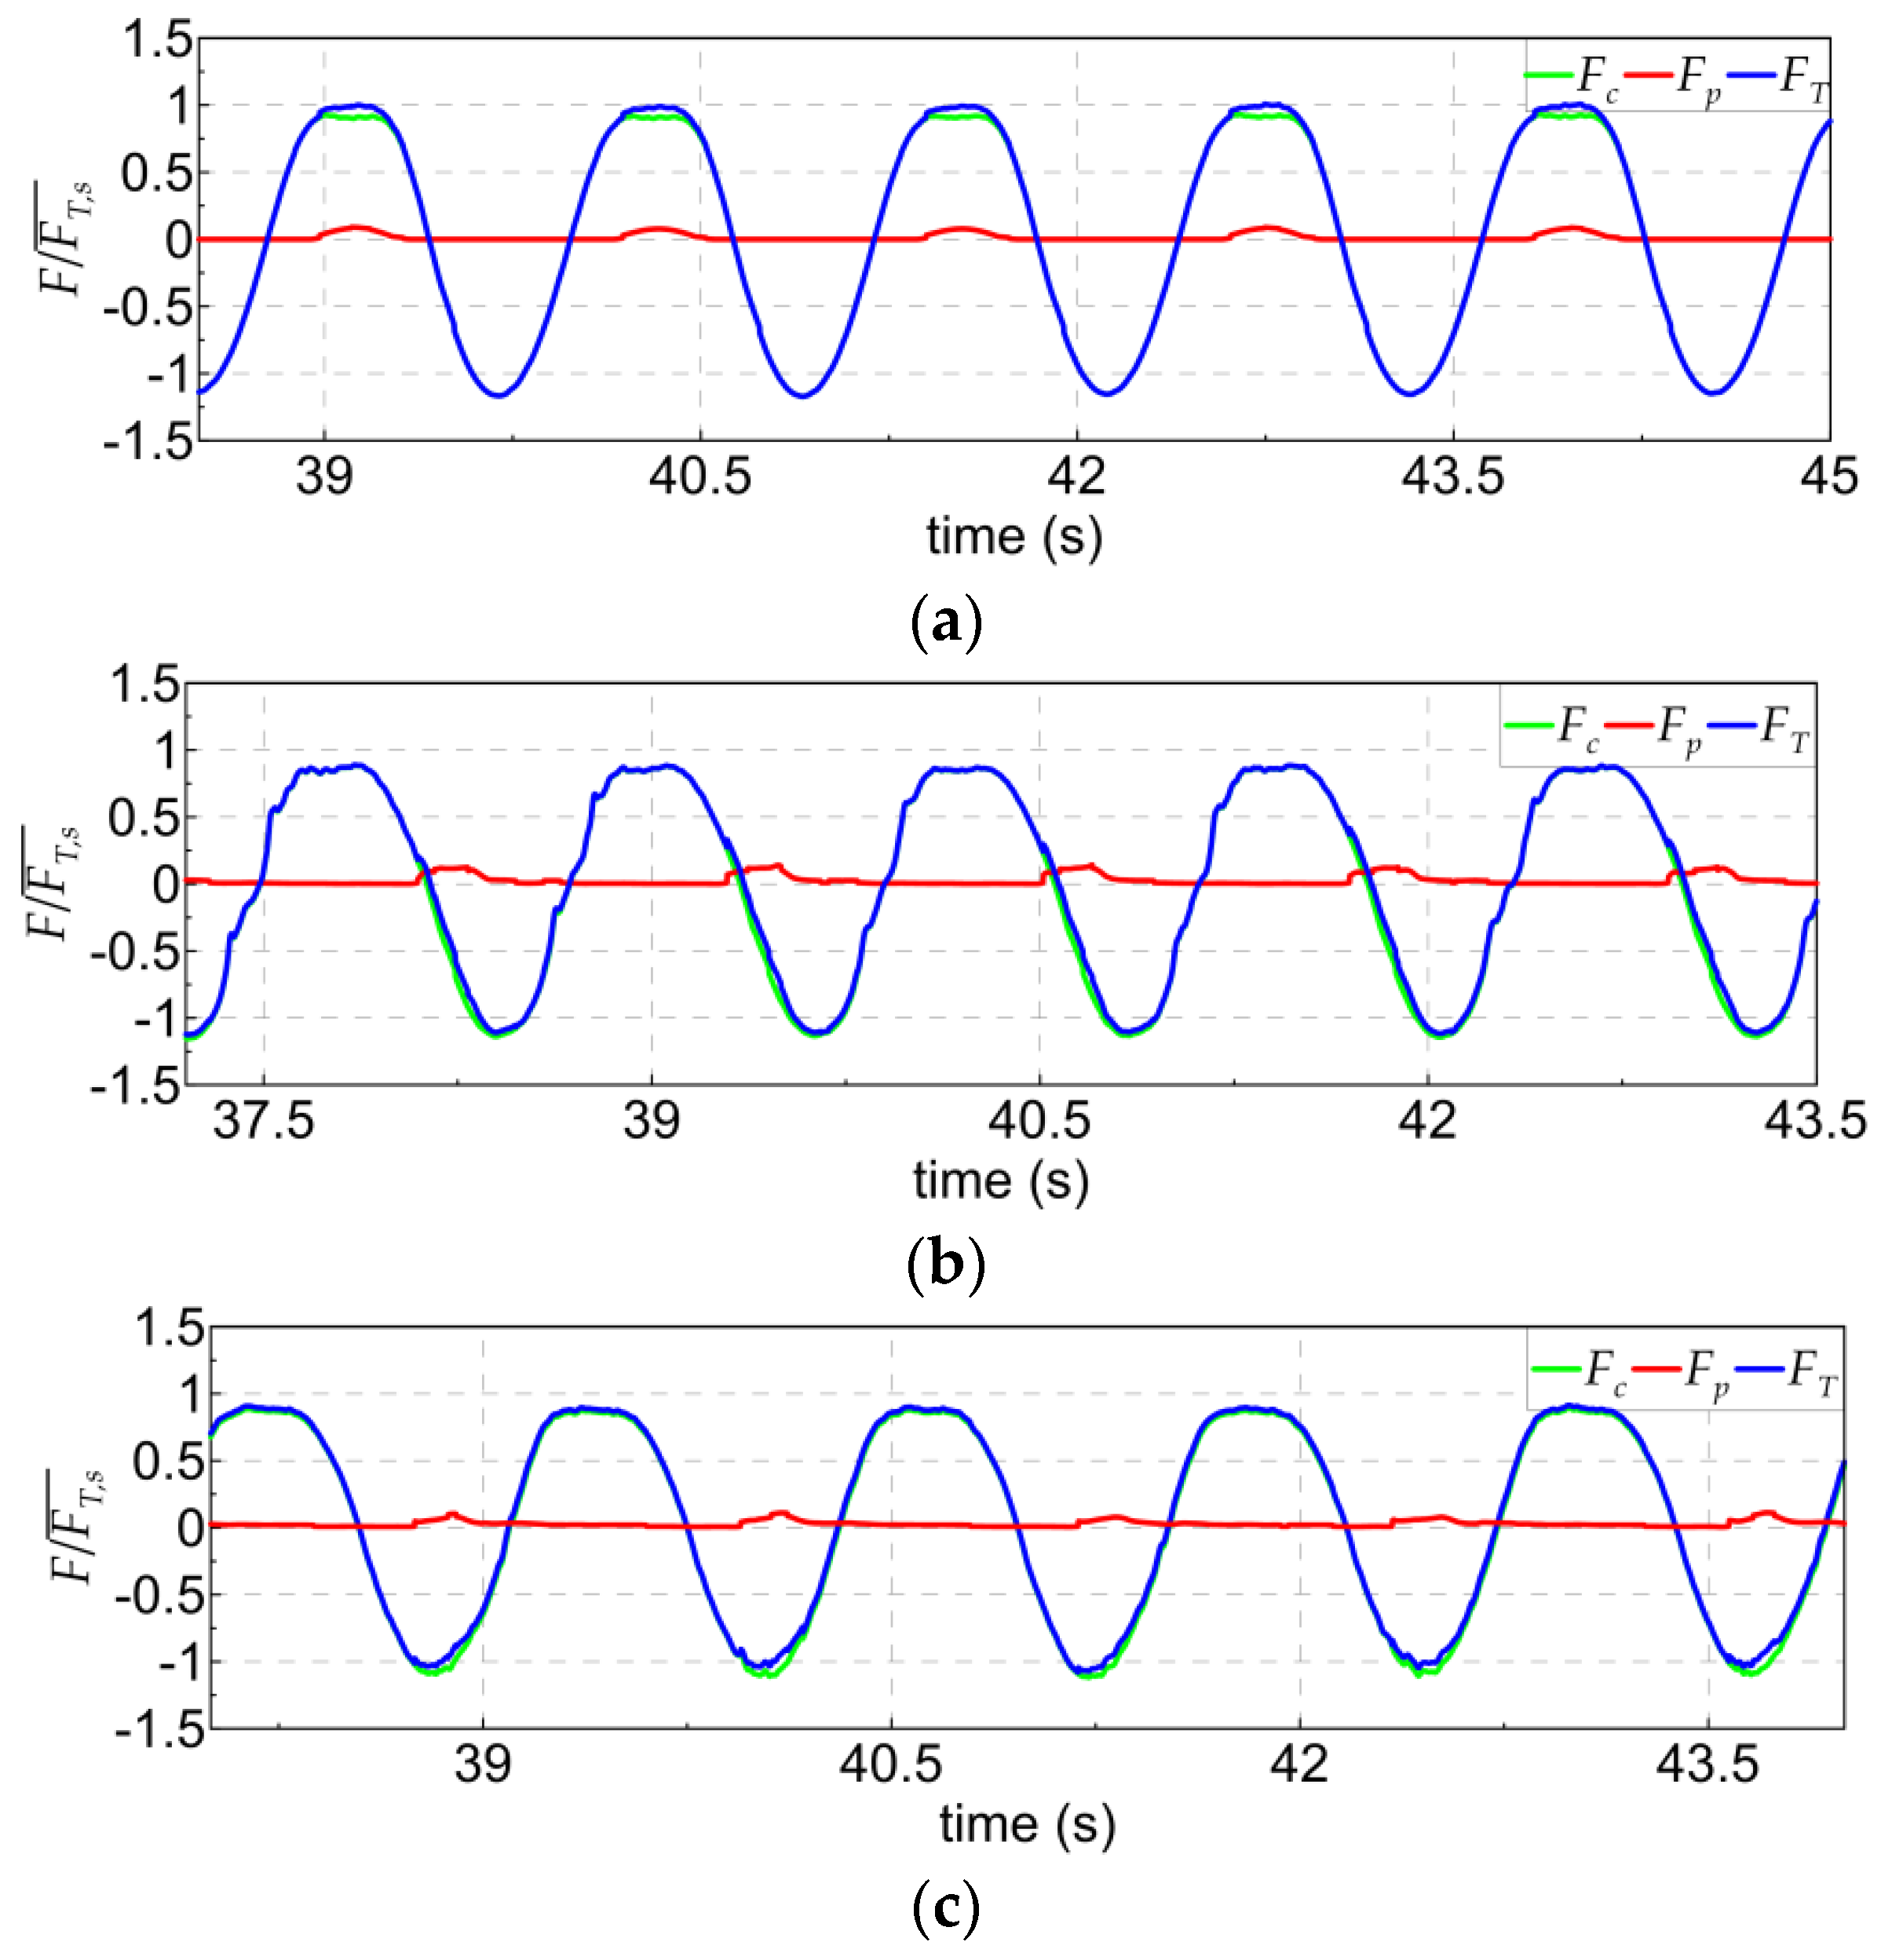
Figure 13, Figure 14 and Figure 15 qualitatively show the wave forces calculated under the same conditions as those in Figure 6, Figure 7 and Figure 8, respectively. To investigate the effect of the parapet position on the stability of the vertical breakwater, the wave forces were classified into three types based on the parapet position: the wave force acting on the caisson F c , wave force acting on the parapet F p , and total wave force acting on the vertical breakwater F T , which is the combination of F c and F p . For convenience, the calculated wave forces were nondimensionalized by the average maximum total wave force of Model 1 ( F T , s ¯ ), in which case the parapet is located on the seaside. The average maximum total wave force of Model 1 was determined by averaging the maximum wave force per wave period within the time range (i.e., five maximum total wave forces) depicted in Figure 13, Figure 14 and Figure 15. As shown, the wave force acting on the caisson decreases when the parapet is located on the harborside and at the center of the breakwater (Models 2 and 3). There are two reasons for the reduction: the reduction of reflected waves due to adopting the rear parapet and the large phase difference of the wave force acting on the parapet. The phase difference between the maximum wave forces acting on the caisson and parapet increases when the parapet position p is moved from the seaside to the harborside (Model 1→Model 2→Model 3). In particular, the wave force acting on the parapet does not affect the maximum total wave force of Model 3 because of the phase difference. In Figure 13b, which shows the results of the highest test condition for the wave height, wave period, and water depth in this experiment, the maximum total wave force of Model 2 increases because of the wave force acting on the parapet due to the reduced phase difference compared to Model 3; however, the maximum total wave force of Model 2 is lower than that of Model 1 (i.e., the maximum total wave force of Model 2 is less than unity). In addition, the wave force acting on the parapet F p is less than the wave force acting on the caisson F c even though the parapet height is approximately 30% of the total height of the breakwater. These results demonstrate that the reduction effect of the wave force acting on the breakwater can be improved by varying the parapet position which, in turn, can improve the design stability and reinforcement of vertical breakwaters as well as reduce the construction cost. As mentioned in the previous section, although the impulsive wave pressure acts on the parapet, it does not affect the calculated wave forces, because the water surface elevation in front of the parapet is not the maximum when the wave pressure acting on the parapet is the maximum. Thus, local parapet reinforcement should be considered in the design stage when the parapet position is moved to the harborside.
To analyze the wave force characteristics affecting the breakwater stability quantitatively, the averaged maximum total wave forces acting on the vertical breakwater F T , max ¯ with respect to the relative parapet position p / L were determined, as listed in Table 2. To find the contribution of the wave forces acting on the caisson and parapet to the maximum total wave force acting on the vertical breakwater, the average wave forces acting on the caisson F c ¯ and parapet F p ¯ were also evaluated (and listed in Table 2) when the average total wave force is maximum. All the average wave forces were nondimensionalized by the average maximum total wave force of Model 1 F T , s ¯ under each wave condition. In order to assess the contribution of F p ¯ to F T , max ¯ , the contribution ratio is defined as F p ¯ divided by F T , max ¯ . All the wave forces were averaged as mentioned in the previous paragraph.
As listed in Table 2, the dimensionless wave force acting on the parapet F p ¯ / F T , s ¯ tends to increase when the relative offshore freeboard h c / H decreases. There are some differences depending on the incident wave conditions and parapet position; nevertheless, the average maximum total wave force F T , max ¯ for the parapet located on the harborside (Model 3) is reduced by up to 20.78% (H = 15.10 cm, T = 2.01 s) compared to the average maximum total wave force for the parapet located on the seaside (Model 1). In this case, the contribution ratio of the wave force acting on the parapet is negligible (0.27%) because of the phase difference between the wave pressures. The reduction rate (20.78%) is greater than the contribution ratio (14.04%) for the parapet located on the seaside such as in the case of conventional breakwaters. The reduction rate is 6.78% larger, which can be seen as the effect of reducing reflected waves due to introducing the rear parapet. In addition, the reduction rate of the total wave force for the parapet located on the harborside is greater than the contribution ratio for the parapet located on the seaside in all the test cases. For relative offshore freeboard values of 0.3311 and 0.3356, the contribution ratios for the parapet located on the seaside (Model 1) and at the center of the vertical breakwater (Model 2) are the highest under the test conditions of this study; the contribution ratios for the parapet located on the harborside (Model 3) are sufficiently low to be ignored because of the phase difference between the wave pressures when the average total wave force is maximum. These results indicate that the rear-parapet can be used as an alternative to reducing the maximum wave force.

3.3. Required Self-Weight

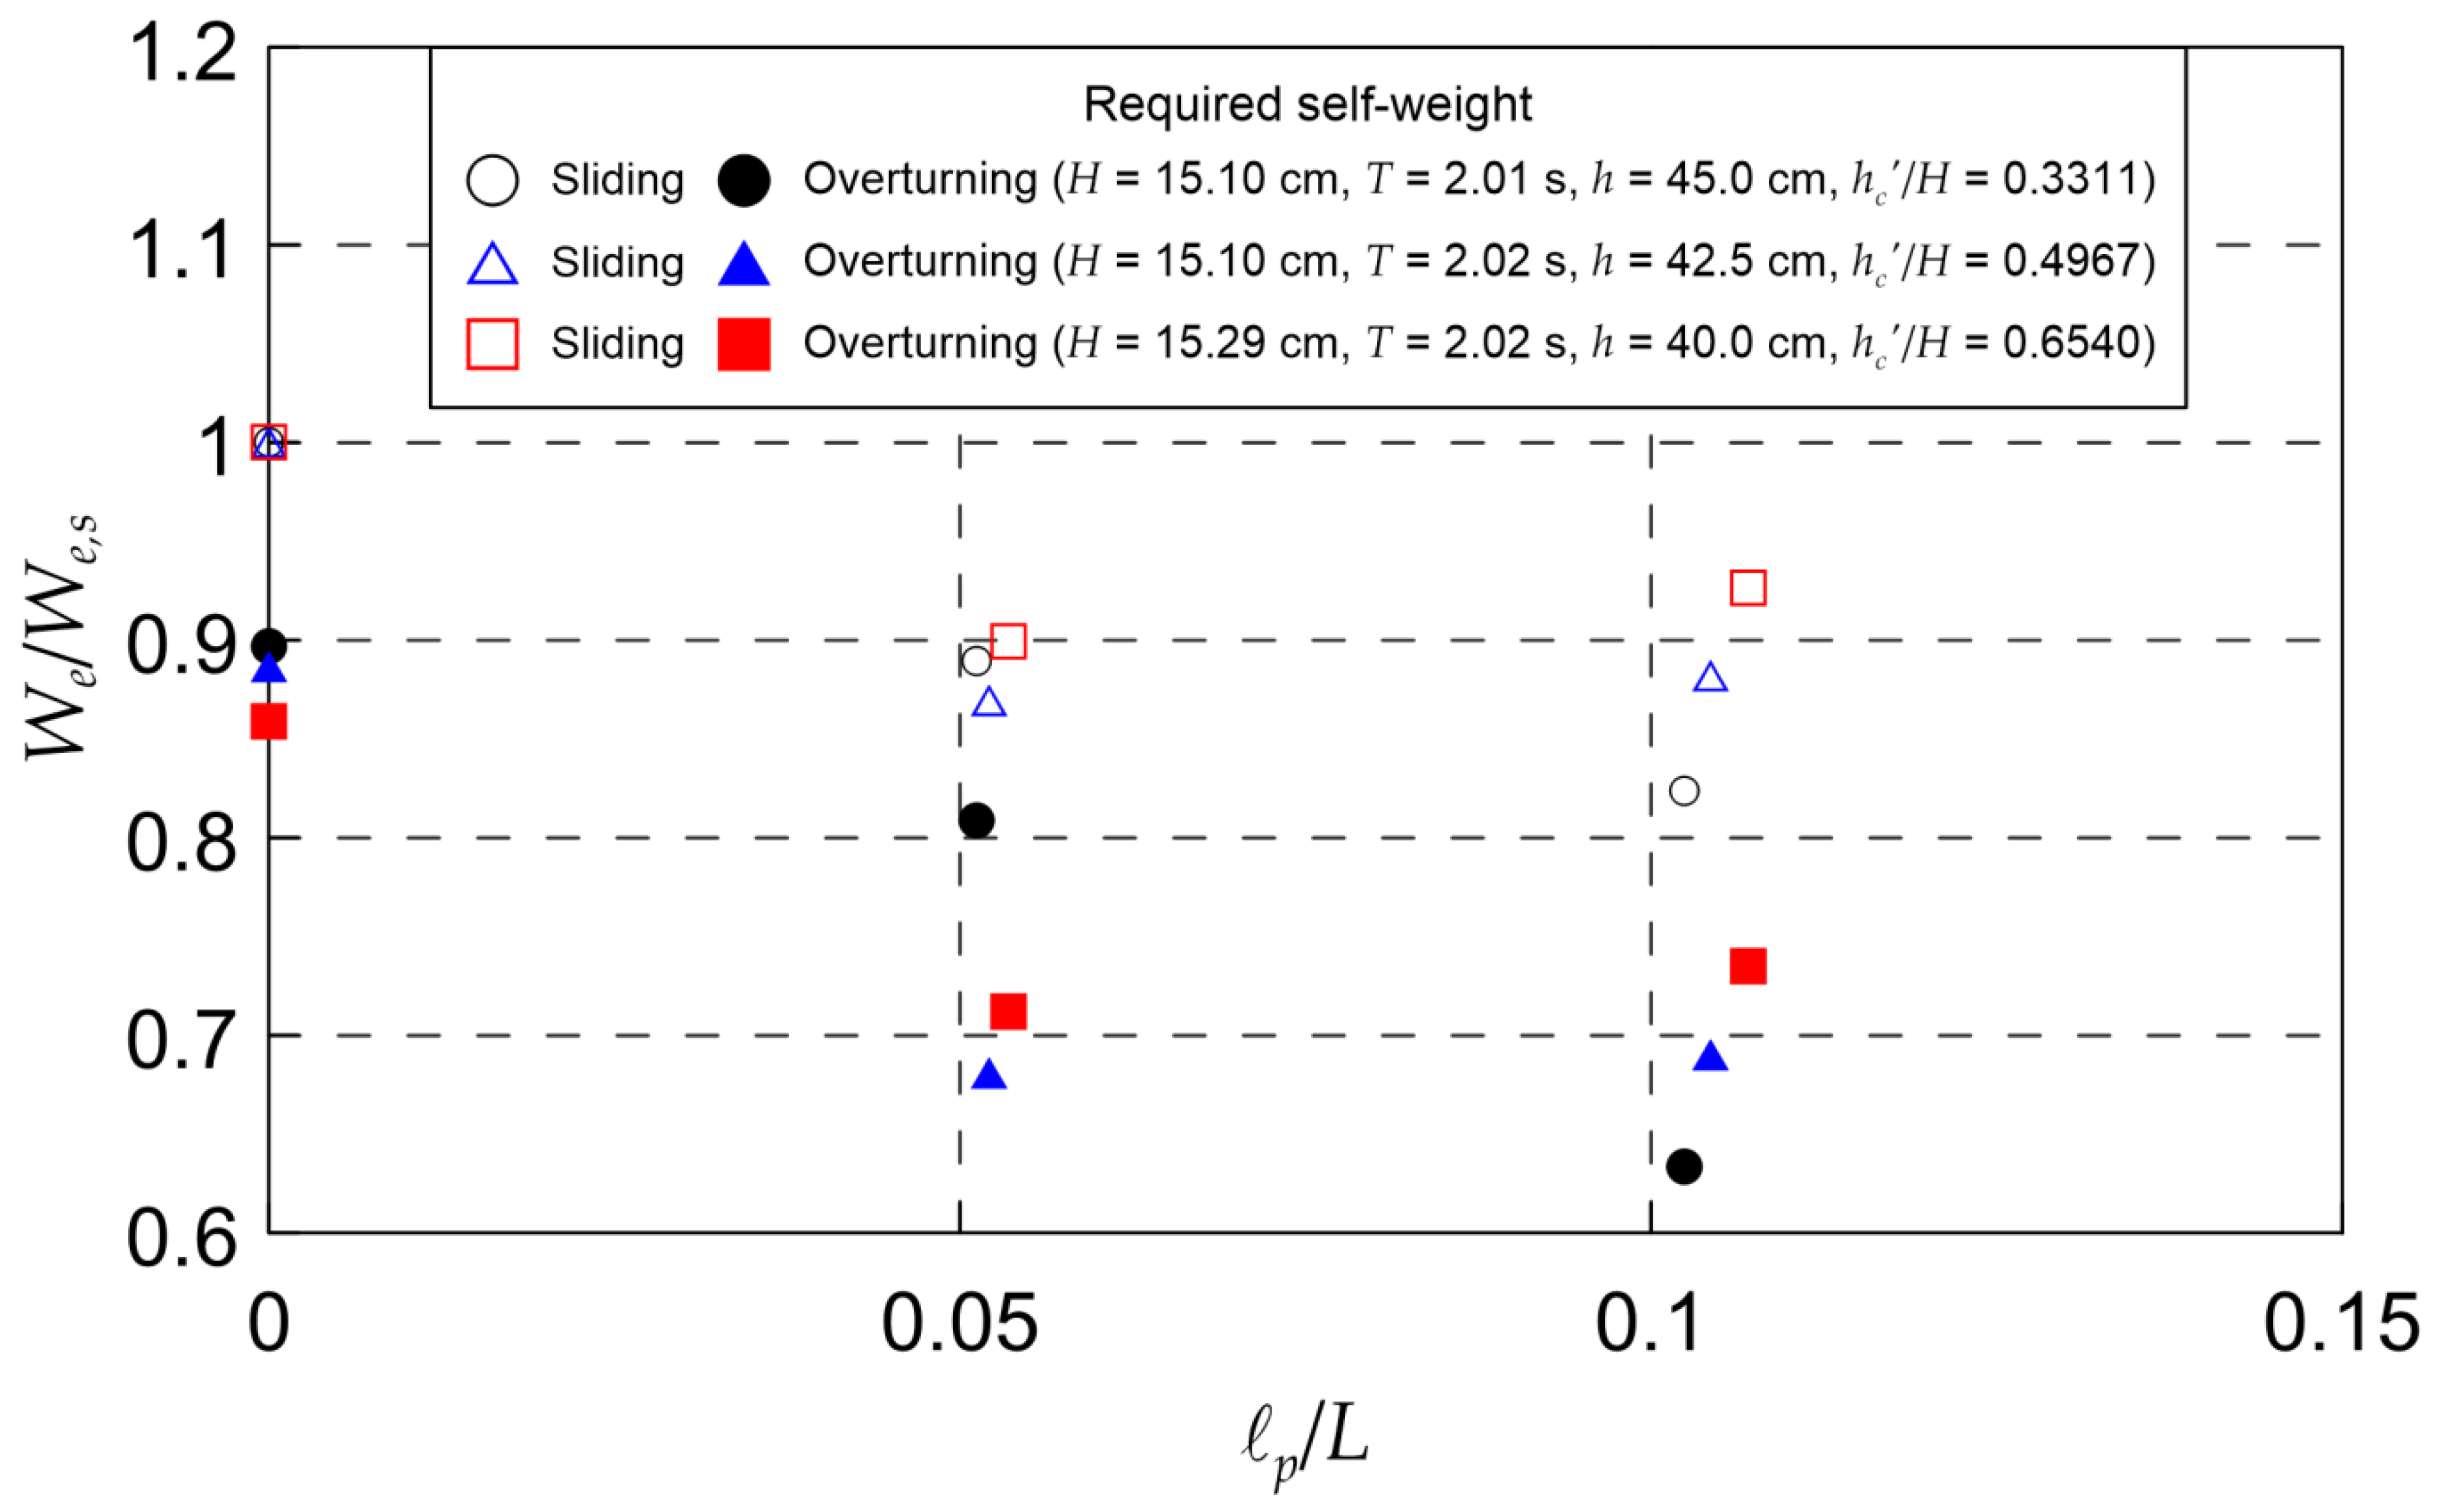
Figure 16 presents the required self-weight calculated from Equations (1) and (2). The round, triangular, and square markers indicate the required self-weights for water depths of 45.0, 42.5, and 40.0 cm, respectively. The y-axis represents the dimensionless required self-weight nondimensionalized by the required self-weight W e , s for the parapet located on the seaside (Model 1, p / L = 0 ). From Figure 15, it can be seen that the self-weight required to prevent sliding of the parapets located at the center (Model 2, p / L = 0.0512 ) and on the harborside (Model 3, p / L = 0.1024 ) are respectively reduced by approximately 11.1% and 17.7% for the depth of 45. 0 cm, 13.1% and 11.8% for the depth of 42.5 cm, and 10.1% and 7.4% for the depth of 40.0 cm, compared with that of Model 1. To summarize the results, as the parapet is moved toward the harborside, the required self-weight decreases up to 82.3% of Model 1. When the parapet is located on the harborside (Model 3), the required self-weight decreases due to a decrease in the relative offshore freeboard.

3.4. Bearing Pressure

Table 3 lists the bearing pressures at the heel of the caisson with the eccentricity. The bearing pressure at the heel was calculated using Equation (3) since the calculated eccentricities with respect to the parapet position are lower than W B / 3 (=16.67 cm). The bearing pressure for the parapet located on the seaside (Model 1) tends to increase with increasing water depth. However, the bearing pressures for the other parapet positions (Models 2 and 3) do not exhibit uniform tendencies with water depth variation, since they depend on the relative offshore freeboard and phase difference between the wave pressures. Thus, the bearing pressure can be reduced by moving the parapet position to the harborside. For example, when the water depth is 45.0 cm, the bearing pressures for the parapet located on the seaside, at the center, and on the harborside are 13.07, 12.09, and 6.85 kN/m2, respectively. In these cases, the bearing pressures for the parapet located at the center and on the harborside are reduced by approximately 7.5% and 47.6%, respectively, compared with that for the parapet located on the seaside. Considering a scale of 1/40, the bearing pressures for the parapet located on the harborside (Model 3) are 301.84, 289.95, and 273.86 kN/m2, which are lower than the allowable bearing pressure of 600 kN/m2 [34]. Thus, the width of the caisson, which was set to 20 m (50 cm for the model scale), can be reduced in the test conditions of this study, and the rear-parapet vertical breakwater is more stable than the other parapet breakwaters in terms of stability against the bearing pressure.

4. Conclusions

In this study, the effects of the installation position of a parapet on a vertical breakwater were investigated through hydraulic experiments with regular waves in a wave channel. The main results can be summarized as follows.
  • The introduction of a rear parapet can reduce the maximum wave force acting on a breakwater. Up to 20.78% reduction is possible under the tested conditions. This reduction is feasible because the wave energy reflected from the parapet is significantly attenuated by the wave breaking, splashing, waterfall, etc., in addition to allowing the wave force acting on the parapet to move with the phase difference by moving the parapet to the harborside.
  • Impulsive wave pressure, one of the problems experienced by rear parapets, can be mitigated by increasing the height at the offshore freeboard h c , and the more the parapet fits the inner side of the port, the more advantageous. Under the experimental conditions, impulsive wave pressure was not generated when the incident wave was 0.5 times or more, and the magnitude of the impulsive wave pressure was significantly reduced when the breakwater was installed inside the port rather than at the breakwater center.
  • By applying a rear parapet, it is possible to increase the economic efficiency of a breakwater. Under the experimental conditions, the required self-weight and maximum bearing pressure can be reduced by up to 82.7% and 47.6% of the conventional values.
This study was performed by employing hydraulic experiment using regular waves in a two-dimensional channel. To utilize these results in practice, it is necessary to verify and supplement them through hydraulic experiments conducted on irregular waves. In particular, it is necessary to confirm the occurrence of impulsive wave pressure reported previously [15] and, if its occurrence is confirmed, it will also be necessary to develop mitigation measures.

Author Contributions

Conceptualization, W.-S.P.; methodology, B.W.L. and W.-S.P.; validation, B.W.L. and W.-S.P.; formal analysis, B.W.L.; investigation, B.W.L. and W.-S.P.; data curation, B.W.L.; writing—original draft preparation, B.W.L.; writing—review and editing, W.-S.P.; visualization, B.W.L. All authors have read and agreed to the published version of the manuscript.

Funding

This research was a part of the project titled “Development of application technologies for ocean energy and harbour and offshore structures”, funded by Korea Institute of Ocean Science and Technology (KIOST), Korea (project No. PE99831).

Conflicts of Interest

The authors declare no conflict of interest.

References

  1. Yamada, Y.; Satoh, M.; Sugi, M.; Kodama, C.; Noda, A.T.; Nakano, M.; Nasuno, T. Response of tropical cyclone activity and structure to global warming in a high-resolution global nonhydrostatic model. J. Clim. 2017, 30, 9703–9724. [Google Scholar] [CrossRef]
  2. The Intergovernmental Panel on Climate Change (IPCC). Global Warming of 1.5 °C; Intergovernmental Panel on Climate Change (IPCC): Geneva, Switzerland, 2019. [Google Scholar]
  3. Cha, E.J.; Knutson, T.R.; Lee, T.C.; Ying, M.; Nakaegawa, T. Third assessment on impacts of climate change on tropical cyclones in the typhoon committee region–Part II: Future projections. Trop. Cyclone Res. Rev. 2020, 9, 75–86. [Google Scholar] [CrossRef]
  4. Hyein E&C. Report of the Working Design Project of Gageodo Port for the Construction to Repair Damage Caused by the Typhoon; Ministry for Food, Agriculture, Forestry and Fisheries (MIFAFF): Gwacheon-si, Korea, 2012. (In Korean)
  5. DY Engineering. Report of the Working Design Project of Seogwipo Port for the Construction to Repair Damage Caused by the Typhoon; DY Engineering: Jeju Special Self-Governing Province, Korea, 2013. (In Korean) [Google Scholar]
  6. SEKWANG EnC. Report of the Working Design Project of Counter Facilities of Gamcheon Port for the Construction to Repair Damage Caused by the Typhoon; Ministry of Oceans and Fisheries: Sejong-si, Korea, 2018. (In Korean)
  7. Contestabile, P.; Crispino, G.; Russo, S.; Gisonni, C.; Cascetta, F.; Vicinanza, D. Crown wall modifications as response to wave overtopping under a future sea level scenario: An experimental parametric study for an innovative composite seawall. Appl. Sci. 2020, 10, 2227. [Google Scholar] [CrossRef] [Green Version]
  8. Mares-Nasarre, P.; van Gent, M.R.A. Oblique wave attack on rubble mound breakwater crest walls of finite length. Water 2020, 12, 353. [Google Scholar] [CrossRef] [Green Version]
  9. Park, W.S.; Seo, J.; Won, D.; Lee, B.W. Stability assessment formulas for an interlocking caisson breakwater under oblique wave conditions. J. Coast. Res. 2018, 85, 1236–1240. [Google Scholar] [CrossRef]
  10. Zhang, N.; Zhang, Q.; Wang, K.-H.; Zou, G.; Jiang, X.; Yang, A.; Li, Y. Numerical simulation of wave overtopping on breakwater with an armor layer of accropode using SWASH model. Water 2020, 12, 386. [Google Scholar] [CrossRef] [Green Version]
  11. Di Lauro, E.; Maza, M.; Lara, J.L.; Losada, I.J.; Contestabile, P.; Vicinanza, D. Advantages of an innovative vertical breakwater with an overtopping wave energy converter. Coast Eng. 2020, 159, 103713. [Google Scholar] [CrossRef]
  12. Cho, J.H.; Park, W.K.; Choe, H.; Oh, S.B. Research and analysis on reinforcement case of rubble-mound and vertical caisson breakwaters. In Proceedings of the Korean Society of Civil Engineers, Gyeongju, Korea, 17–19 October 2018; pp. 11–12. (In Korean). [Google Scholar]
  13. Hong, K.; Kang, Y.-K.; Kim, H.-J.; Yoon, H.-S.; Ryu, C.-R. Analysis of change process in the design conditions of harbor breakwaters in Korea. J. Korean Soc. Coast. Ocean Eng. 2018, 30, 123–133. (In Korean) [Google Scholar] [CrossRef] [Green Version]
  14. Ko, J.-H.; Kwon, O.-G.; Song, S.-H.; Kim, D.-K. Design of construction of contour facilities to improve calmness of Gamcheon harbor. In Proceedings of the Conference of Korean Association of Ocean Science Technology Society, Busan, Korea, 2–3 June 2011; pp. 2021–2024. (In Korean). [Google Scholar]
  15. Yamamoto, Y.; Mototama, K.; Kamikubo, K. Study on an iMprovement Method for Breakwaters at Small Ports. Research Report, Cold-Region Hydraulic and Aquatic Environmental Engineering Research Group; Public Works Research Institute (PWRI): Ibaraki, Japan, 2013. (In Japanese) [Google Scholar]
  16. Niigata Research and Engineering Office for Port and Airport. Available online: http://www.gicho.pa.hrr.mlit.go.jp/english/activities/activities04-05.html (accessed on 24 July 2020).
  17. USA Army Corps of Engineers. Coastal Engineering Manual (CEM), Engineer Manual 1110-2-1100; USA Army Corps of Engineers: Washington, WA, USA, 2002; Volume 6.
  18. Oh, S.-H. Analysis of the effect of reducing wave overtopping by wave return walls. J. Korean Soc. Coast. Ocean Eng. 2016, 28, 1–6. (In Korean) [Google Scholar] [CrossRef]
  19. Van der Meer, J.W.; Allsop, N.W.H.; Bruce, T.; de Rouck, J.; Kortenhaus, A.; Pullen, T.; Schüttrumpf, H.; Troch, P.; Zanuttigh, B. Manual on Wave Overtopping of Sea Defences and Related Structures: An Overtopping Manual Largely Based on European Research, but for Worldwide Application. EurOtop. 2018. Available online: http://www.overtopping-manual.com (accessed on 24 July 2020).
  20. Jung, J.-S.; Yoon, J.-S. Experimental study for overtopping discharges of sea dike having low mound and high wave wall (LMHW). J. Korean Soc. Coast. Ocean Eng. 2019, 31, 335–343. (In Korean) [Google Scholar] [CrossRef] [Green Version]
  21. Oh, S.-H.; Lee, J.S.; Lee, J. Introduction to physical experiment building of KIOST in Busan. In Proceedings of the 10th International Conference on Asian and Pacific Coasts 2019 (APAC 2019), Hanoi, Vietnam, 25–28 September 2019; Nguyen, T.V., Dou, X., Tran, T.T., Eds.; Springer: Singapore, 2020; pp. 221–226. [Google Scholar]
  22. Lee, B.W.; Seo, J.; Park, W.-S.; Won, D. A hydraulic experimental study of a movable barrier on a revetment to block wave overtopping. Appl. Sci. 2020, 10, 89. [Google Scholar] [CrossRef] [Green Version]
  23. Andersen, T.L.; Eldrup, M.R.; Firgaard, P. Estimation of incident and reflected components in highly nonlinear regular waves. Coast. Eng. 2017, 119, 51–64. [Google Scholar] [CrossRef]
  24. Meinert, P.; Andersen, T.L.; Frigaard, P. AwaSys 7 User Manual; Aalborg University: Aalborg, Denmark, 2017. [Google Scholar]
  25. Andersen, T.L.; Clavero, M.; Firgaard, P.; Losada, M.; Puyol, J.I. A new active absorption system and its performance to linear and non-linear waves. Coast. Eng. 2016, 114, 47–60. [Google Scholar] [CrossRef]
  26. Park, W.S.; Oh, Y.M.; Chun, I.S. Separation technique of incident and reflected waves using least squares method. J. Korean. Soc. Coast. Ocean Eng. 1992, 4, 139–145. (In Korean) [Google Scholar]
  27. Suh, K.D.; Park, W.S.; Park, B.S. Separation of incident and reflected waves in wave-current flumes. Coast. Eng. 2001, 43, 149–159. [Google Scholar] [CrossRef] [Green Version]
  28. Goda, Y. Random Seas and Design of Maritime Structures, 3rd ed.; Advanced Series on Ocean Engineering; World Scientific: Singapore, 2010; Volume 33. [Google Scholar]
  29. Chen, X.; Hofland, B.; Altomare, C.; Suzuki, T.; Uijttewaal, W. Forces on a vertical wall on a dike crest due to overtopping flow. Coast. Eng. 2015, 95, 94–104. [Google Scholar] [CrossRef]
  30. Chen, X.; Hofland, B.; Uijttewaal, W. Maximum overtopping forces on a dike-mounted wall with a shallow foreshore. Coast. Eng. 2016, 116, 89–102. [Google Scholar] [CrossRef]
  31. Lundgren, H. Wave shock forces: An analysis of deformation and forces in the wave and in the foundation. In Symposium “Research on Wave Action”; Delft Hydraulics Lab: Delft, The Netherlands, 1969; pp. 1–20. [Google Scholar]
  32. Takahashi, S.; Tanimoto, K.; Suzumura, S. Generation Mechanism of Impulsive Pressure by Breaking Wave on a Vertical Wall. Rep. Port Harb. Res. Inst. 1983, 22, 3–31. (In Japanese) [Google Scholar]
  33. Takahashi, S.; Shimosako, K. Wave pressure on a perforated wall caisson. In Proceedings of the International Conference on Hydro-Technical Engineering for Port and Harbor Construction (HYDROPORT’94), Yokosuka, Japan, 19–21 October 1994; pp. 747–764. [Google Scholar]
  34. Oh, S.-H.; Ji, C.-H. Simultaneous measurement of wave forces and pressures on a double-chamber perforated caisson. Meas. Sci. Technol. 2019, 30, 105801. [Google Scholar] [CrossRef]
  35. Hattori, M.; Arami, A.; Yui, T. Wave impact pressure on vertical walls under breaking waves of various types. Coast. Eng. 1994, 22, 79–114. [Google Scholar] [CrossRef]
  36. Cuomo, G.; Allsop, W.; Bruce, T.; Pearson, J. Breaking wave loads at vertical seawalls and breakwaters. Coast. Eng. 2010, 57, 424–439. [Google Scholar] [CrossRef] [Green Version]
Figure 1. Schematic of the experiments: (a) Lateral view; (b) Plan view of the wave channel with the model structure and wave gauges (E01–E05, unit: m).
Water 12 02428 g001
Figure 2. Schematics of the vertical breakwater with respect to parapet position: (a) Conceptual design; (b) Model structures with pressure gauges (unit: cm).
Water 12 02428 g002
Figure 3. Wave pressure distributions on the caisson and parapet: (a) η c > 0 for Model 1; (b) η c > h c for Models 2 and 3; (c) η c < 0 for all model structures.
Water 12 02428 g003
Figure 4. Free surface profiles of Model 3 for a wave height of 15.10 cm, wave period of 2.01 s, and water depth of 45.0 cm.
Water 12 02428 g004
Figure 5. Reflection coefficients with respect to relative parapet position p / L : (a) h = 45.0 cm; (b) h = 42.5 cm; (c) h = 40.0 cm.
Water 12 02428 g005
Figure 6. Time series of water surface elevations ( η c = E04 and η p = E05) and wave pressures (pc = p06 and pp = p07) in front of the caisson and parapet: (a) Model 1; (b) Model 2; (c) Model 3 for a wave height of 15.10 cm, wave period of 2.01 s, and water depth of 45.0 cm.
Water 12 02428 g006
Figure 7. Time series of water surface elevations ( η c = E04 and η p = E05) and wave pressures (pc = p06 and pp = p07) in front of the caisson and parapet: (a) Model 1; (b) Model 2; (c) Model 3 for a wave height of 10.14 cm, wave period of 2.01 s, and water depth of 45.0 cm.
Water 12 02428 g007
Figure 8. Time series of water surface elevations ( η c = E04 and η p = E05) and wave pressures (pc = p06 and pp = p07) in front of the caisson and parapet: (a) Model 1; (b) Model 2; (c) Model 3 for a wave height of 9.99 cm, wave period of 1.21 s, and water depth of 45.0 cm.
Water 12 02428 g008
Figure 9. Dimensionless maximum wave pressure with respect to relative parapet position p / L : (a) pc,max; (b) pp,max for a water depth of 45.0 cm.
Water 12 02428 g009
Figure 10. Dimensionless maximum wave pressure with respect to relative parapet position p / L : (a) pc,max; (b) pp,max for a water depth of 42.5 cm.
Water 12 02428 g010
Figure 11. Dimensionless maximum wave pressure with respect to relative parapet position p / L : (a) pc,max; (b) pp,max for a water depth of 40.0 cm.
Water 12 02428 g011
Figure 12. Dimensionless maximum wave pressure with respect to relative offshore freeboard: (a) pc,max; (b) pp,max.
Water 12 02428 g012
Figure 13. Time series of dimensionless wave forces F / F T , s ¯ acting on the caisson F c , parapet F p , and vertical breakwater F T : (a) Model 1; (b) Model 2; (c) Model 3 for a wave height of 15.10 cm, wave period of 2.01 s, and water depth of 45.0 cm.
Water 12 02428 g013
Figure 14. Time series of dimensionless wave forces F / F T , s ¯ acting on the caisson F c , parapet F p , and vertical breakwater F T : (a) Model 1; (b) Model 2; (c) Model 3 for a wave height of 10.14 cm, wave period of 2.01 s, and water depth of 45.0 cm.
Water 12 02428 g014
Figure 15. Time series of dimensionless wave forces F / F T , s ¯ acting on the caisson F c , parapet F p , and vertical breakwater F T : (a) Model 1; (b) Model 2; (c) Model 3 for a wave height of 9.99 cm, wave period of 1.21 s, and water depth of 45.0 cm.
Water 12 02428 g015
Figure 16. Self-weight of the parapet required to prevent sliding and overturning.
Water 12 02428 g016
Table 1. Test conditions of regular waves.
h (cm)T (s)H (cm)
40.01.2110.20
1.5110.20
1.5215.10
2.019.87
2.0215.29
42.51.2110.04
1.519.94
1.5215.14
2.0110.01
2.0215.10
45.01.219.99
1.5010.00
1.5114.90
2.0110.14
2.0115.10
Table 2. Average maximum wave forces with the contribution ratio of the wave force acting on the parapet.
h (cm)H (cm)T (s) h c H Model p L F T , max ¯ F T , s ¯ F c ¯ F T , s ¯ F p ¯ F T , s ¯ Contribution Ratio (%)
40.010.201.210.98041
2
3
0
0.1021
0.2041
1.0
0.9748
0.9791
0.9899
0.9724
0.9747
0.0101
0.0024
0.0044
1.01
0.25
0.45
10.201.510.98041
2
3
0
0.0758
0.1516
1.0
0.9855
0.9841
0.9904
0.9835
0.9806
0.0096
0.0020
0.0035
0.96
0.20
0.36
15.101.520.66231
2
3
0
0.0752
0.1504
1.0
0.9149
0.9464
0.9541
0.9128
0.9438
0.0459
0.0021
0.0026
4.59
0.23
0.27
9.872.011.01321
2
3
0
0.0538
0.1076
1.0
0.9800
0.9827
0.9902
0.9790
0.9811
0.0098
0.0010
0.0017
0.98
0.10
0.17
15.292.020.65401
2
3
0
0.0535
0.1070
1.0
0.8831
0.9004
0.9295
0.8819
0.8991
0.0705
0.0012
0.0013
7.05
0.13
0.15
42.510.041.210.74701
2
3
0
0.1004
0.2007
1.0
0.9580
0.9459
0.9548
0.9553
0.9372
0.0452
0.0027
0.0087
4.52
0.28
0.92
9.941.510.75451
2
3
0
0.0742
0.1483
1.0
0.9341
0.9512
0.9628
0.9325
0.9458
0.0372
0.0016
0.0054
3.72
0.17
0.57
15.141.520.49541
2
3
0
0.0735
0.1471
1.0
0.8465
0.8897
0.8934
0.8191
0.8872
0.1066
0.0274
0.0025
10.66
3.23
0.28
10.012.010.74931
2
3
0
0.0524
0.1049
1.0
0.9360
0.9574
0.9696
0.9350
0.9553
0.0304
0.0010
0.0021
3.04
0.11
0.22
15.102.020.49671
2
3
00
.0521
0.1043
1.0
0.8450
0.8531
0.8914
0.8438
0.8518
0.1086
0.0013
0.0014
10.86
0.15
0.16
45.09.991.210.50051
2
3
0
0.0989
0.1978
1.0
0.8823
0.9036
0.9172
0.8796
0.8815
0.0828
0.0027
0.0221
8.28
0.31
2.45
10.001.500.501
2
3
0
0.0733
0.1466
1.0
0.8640
0.9107
0.9255
0.8622
0.9057
0.0745
0.0018
0.0050
7.45
0.21
0.55
14.901.510.33561
2
3
0
0.0727
0.1454
1.0
0.8332
0.8223
0.8593
0.6840
0.8187
0.1407
0.1492
0.0036
14.07
17.91
0.43
10.142.010.49311
2
3
0
0.0512
0.1024
1.0
0.8822
0.9016
0.9355
0.8812
0.8984
0.0645
0.0010
0.0033
6.45
0.11
0.36
15.102.010.33111
2
3
0
0.0512
0.1024
1.0
0.8812
0.7922
0.8596
0.7617
0.7900
0.1404
0.1196
0.0022
14.04
13.57
0.27
Table 3. Bearing pressure at the heel of the caisson.
h (cm)H (cm)T (s)Model p / L t e (cm) p h   ( kN / m 2 ) for
Model Scale
p h   ( kN / m 2 ) for
Real Scale
40.015.292.02107.4310.36414.25
20.05359.187.40296.00
30.10709.187.55301.84
42.515.102.02106.7211.92476.98
20.05219.407.21288.25
30.10439.437.25289.95
45.015.102.01106.4613.07522.91
20.05126.1612.09483.52
30.10249.776.85273.86