Article

Wave Force Characteristics and Stability of Detached Breakwaters Consisting of Open Cell Caissons Interlocked via Crushed Stones

1
International Hydraulic Research Center, Rural Research Institute, Korea Rural Community Corporation, Gyeonggi-do 15634, Korea
2
Coastal Development and Ocean Energy Research Center, Korea Institute of Ocean Science & Technology, Busan 49111, Korea
*
Author to whom correspondence should be addressed.
Water 2020, 12(10), 2873; https://doi.org/10.3390/w12102873
Submission received: 21 September 2020 / Revised: 11 October 2020 / Accepted: 12 October 2020 / Published: 15 October 2020
(This article belongs to the Special Issue Wave-structure Interaction Processes in Coastal Engineering)

Abstract

:
The maximum external force acting on a long continuous harbor structure can be reduced by controlling the phase difference of forces acting longitudinally. This strategy can be used to increase the structural stability of breakwaters consisting of caissons. Breakwaters have been developed using interlocking caissons to effectively respond to the constant increase in wave height due to climate change. In this study, we investigated the wave force characteristics and stability of a detached breakwater consisting of open cell caissons interlocked via crushed stones. We performed wave basin experiments and compared the results with analytical solutions of linear diffraction waves. The results revealed that the maximum wave force acting on the front of the breakwater decreased as the incident angle increased, reducing by as much as 79% for an incident angle of 30°. Although the variability of the maximum wave force for each caisson is large owing to the influence of the diffracted waves, the maximum wave force acting on the entire detached breakwater was not significantly affected by this variability. The analytical solutions based on linear wave theory agreed with the experimental results, indicating that the findings can be applied to actual designs. The structural stability of the breakwater was enhanced, even for low incident wave angles, compared to that of a single integral structure, as the frictional resistance produced by the sliding structure increased due to the shear resistance between the filled crushed stones and the rubble mound.

1. Introduction

According to a report by the Intergovernmental Panel on Climate Change [1], the global mean sea level is expected to rise by approximately 0.26 to 0.77 m by 2100 as a result of a global warming-induced temperature rise of 1.5 °C. The number of intense typhoons is increasing as a result of global warming, even though the total frequency of typhoons is decreasing [2,3]. Consequently, the height of the waves is expected to increase, requiring the reinforcement of existing marine structures. Reinforced coastal structures in Korea have incurred damages owing to the high waves caused by recent typhoons [4]. In particular, the Seogwipo Port in South Korea, for which reinforcement construction was underway, was damaged by Typhoon Maemi in 2003. Although the reinforcement was completed in 2007, the Seogwipo Port experienced considerable damages due to Typhoon Bolaven in 2012 [5]. The main cause of these damages was that the heights of the waves generated by the typhoon were greater than those of the waves considered in the design of the reinforcements. The change in wave heights over a period of 10 years may be an effect of the increase in typhoon intensity as a result of climate change due to global warming. Interestingly, the duration of the storm waves was 10 h during Typhoon Bolaven. Considering that the storm duration assumed in the design stage is just 3 h, the actual storm duration was about three times longer.
Researchers have been developing new breakwater technologies that can actively cope with environmental changes. Among the various methods used to produce breakwaters, the elongation of the harbor structure has recently received considerable attention. As shown in Figure 1, the maximum wave force acting on the breakwater can be reduced through consideration of the phase difference of the hydrodynamic pressures by elongating the harbor structure when an oblique incident wave approaches the breakwater, thereby improving the stability of the breakwater [6,7,8,9,10]. Takahashi and Shimosako [8] and Burcharth and Liu [9] analytically showed that the maximum wave force decreases when the wave obliquely enters the elongated structure. In addition, it is possible to substantially reduce the effect of large wave pressure fluctuations in the longitudinal direction of the breakwater caused by diffracted waves [11,12] by the elongation. Recently, research results have been reported that an increase in wave pressure caused by the diffracted wave can be one of the reasons of destruction of the conventional caisson breakwater [13], therefore the elongation has great implications.
The construction of a long physical structure has always involved technical challenges, e.g., inefficient responses to the uneven ground settlement and technical difficulties in manufacturing and installation. However, in recent years, the interlocking of adjacent caissons has been proposed as an effective method for the elongation of breakwaters [14]. Seo et al. [15] reported that the elongation can be effectively performed by interlocking caissons with cross cables, and they found that the wave dispersion increases and the maximum wave force acting on the breakwater decreases as the incident angle of the wave increases. Park et al. [4,16] presented a stability evaluation equation for the sliding, overturning, and rotation of an elongated breakwater by caisson interlocking.
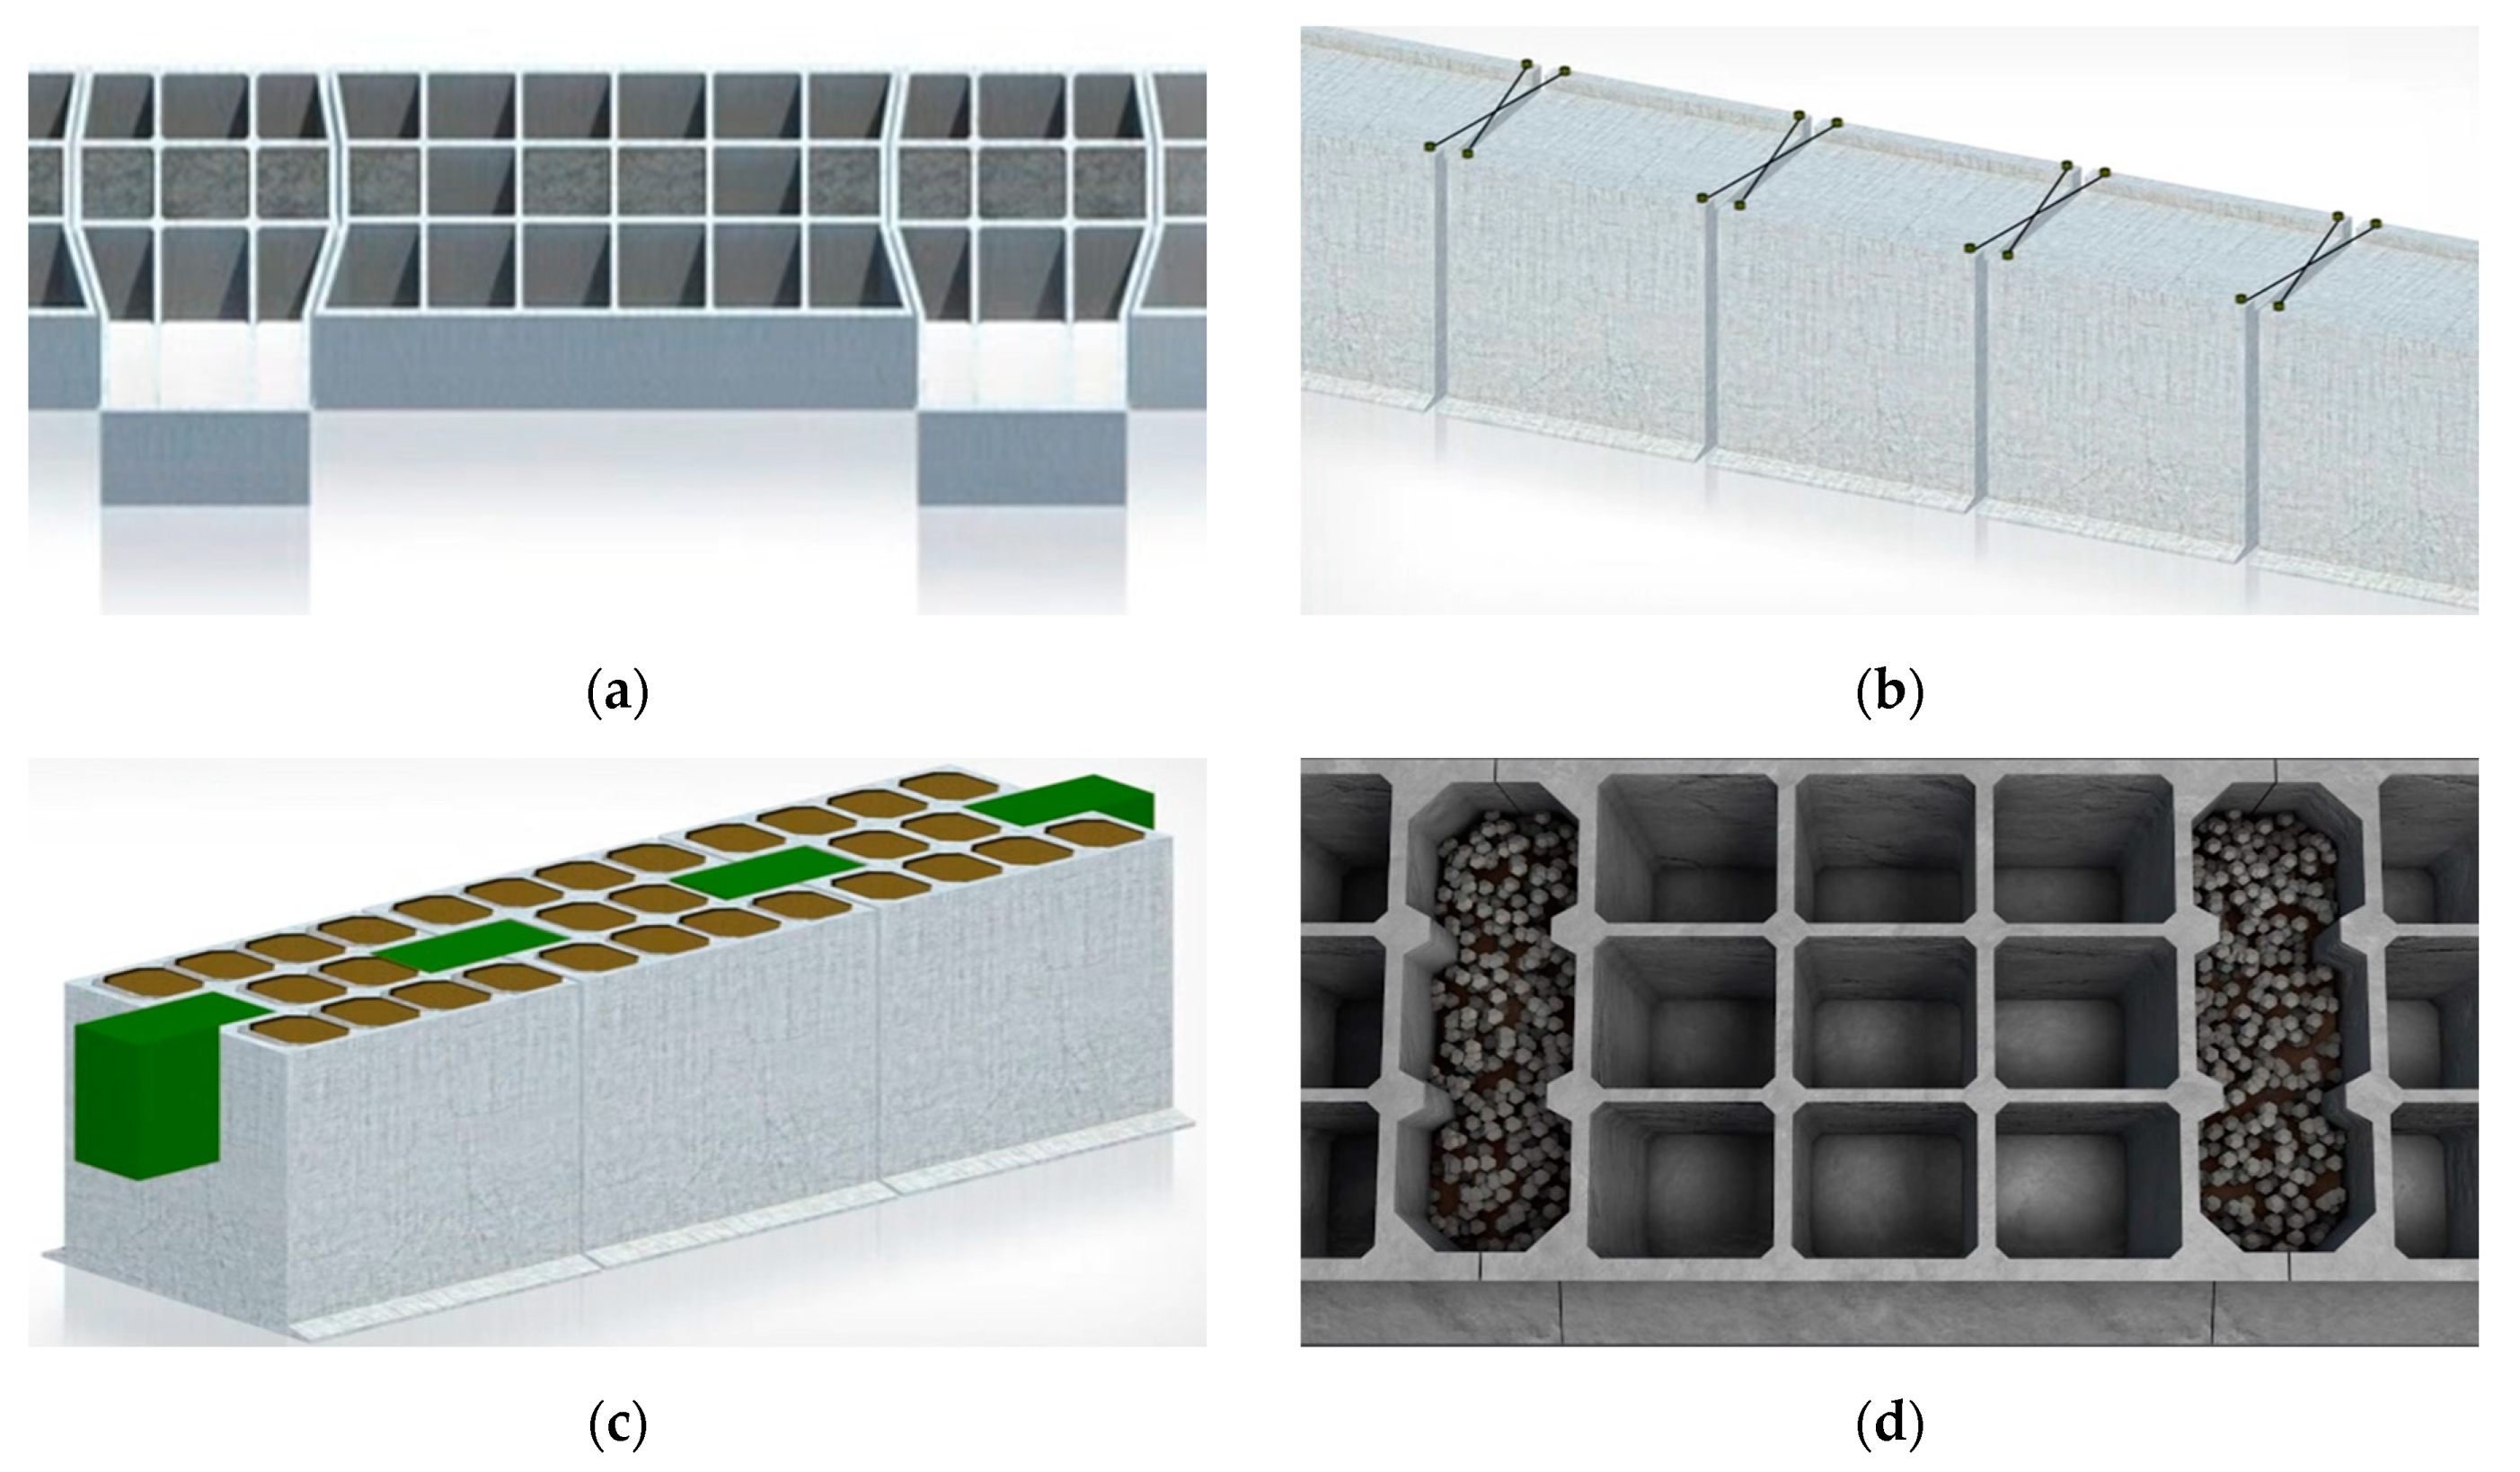
Figure 2 shows schematics of typical interlocked caisson designs presented to date [4]. Currently, no design has been applied to the actual harbor site. In Korea, the fourth method is receiving the most attention, because the technology based on this method was certified by the Ministry of Oceans and Fisheries and the quay to which this technology is applied is currently under construction in Busan New Port for the first time in the world. Accordingly, the present study is concerned with the technology applied to breakwaters.
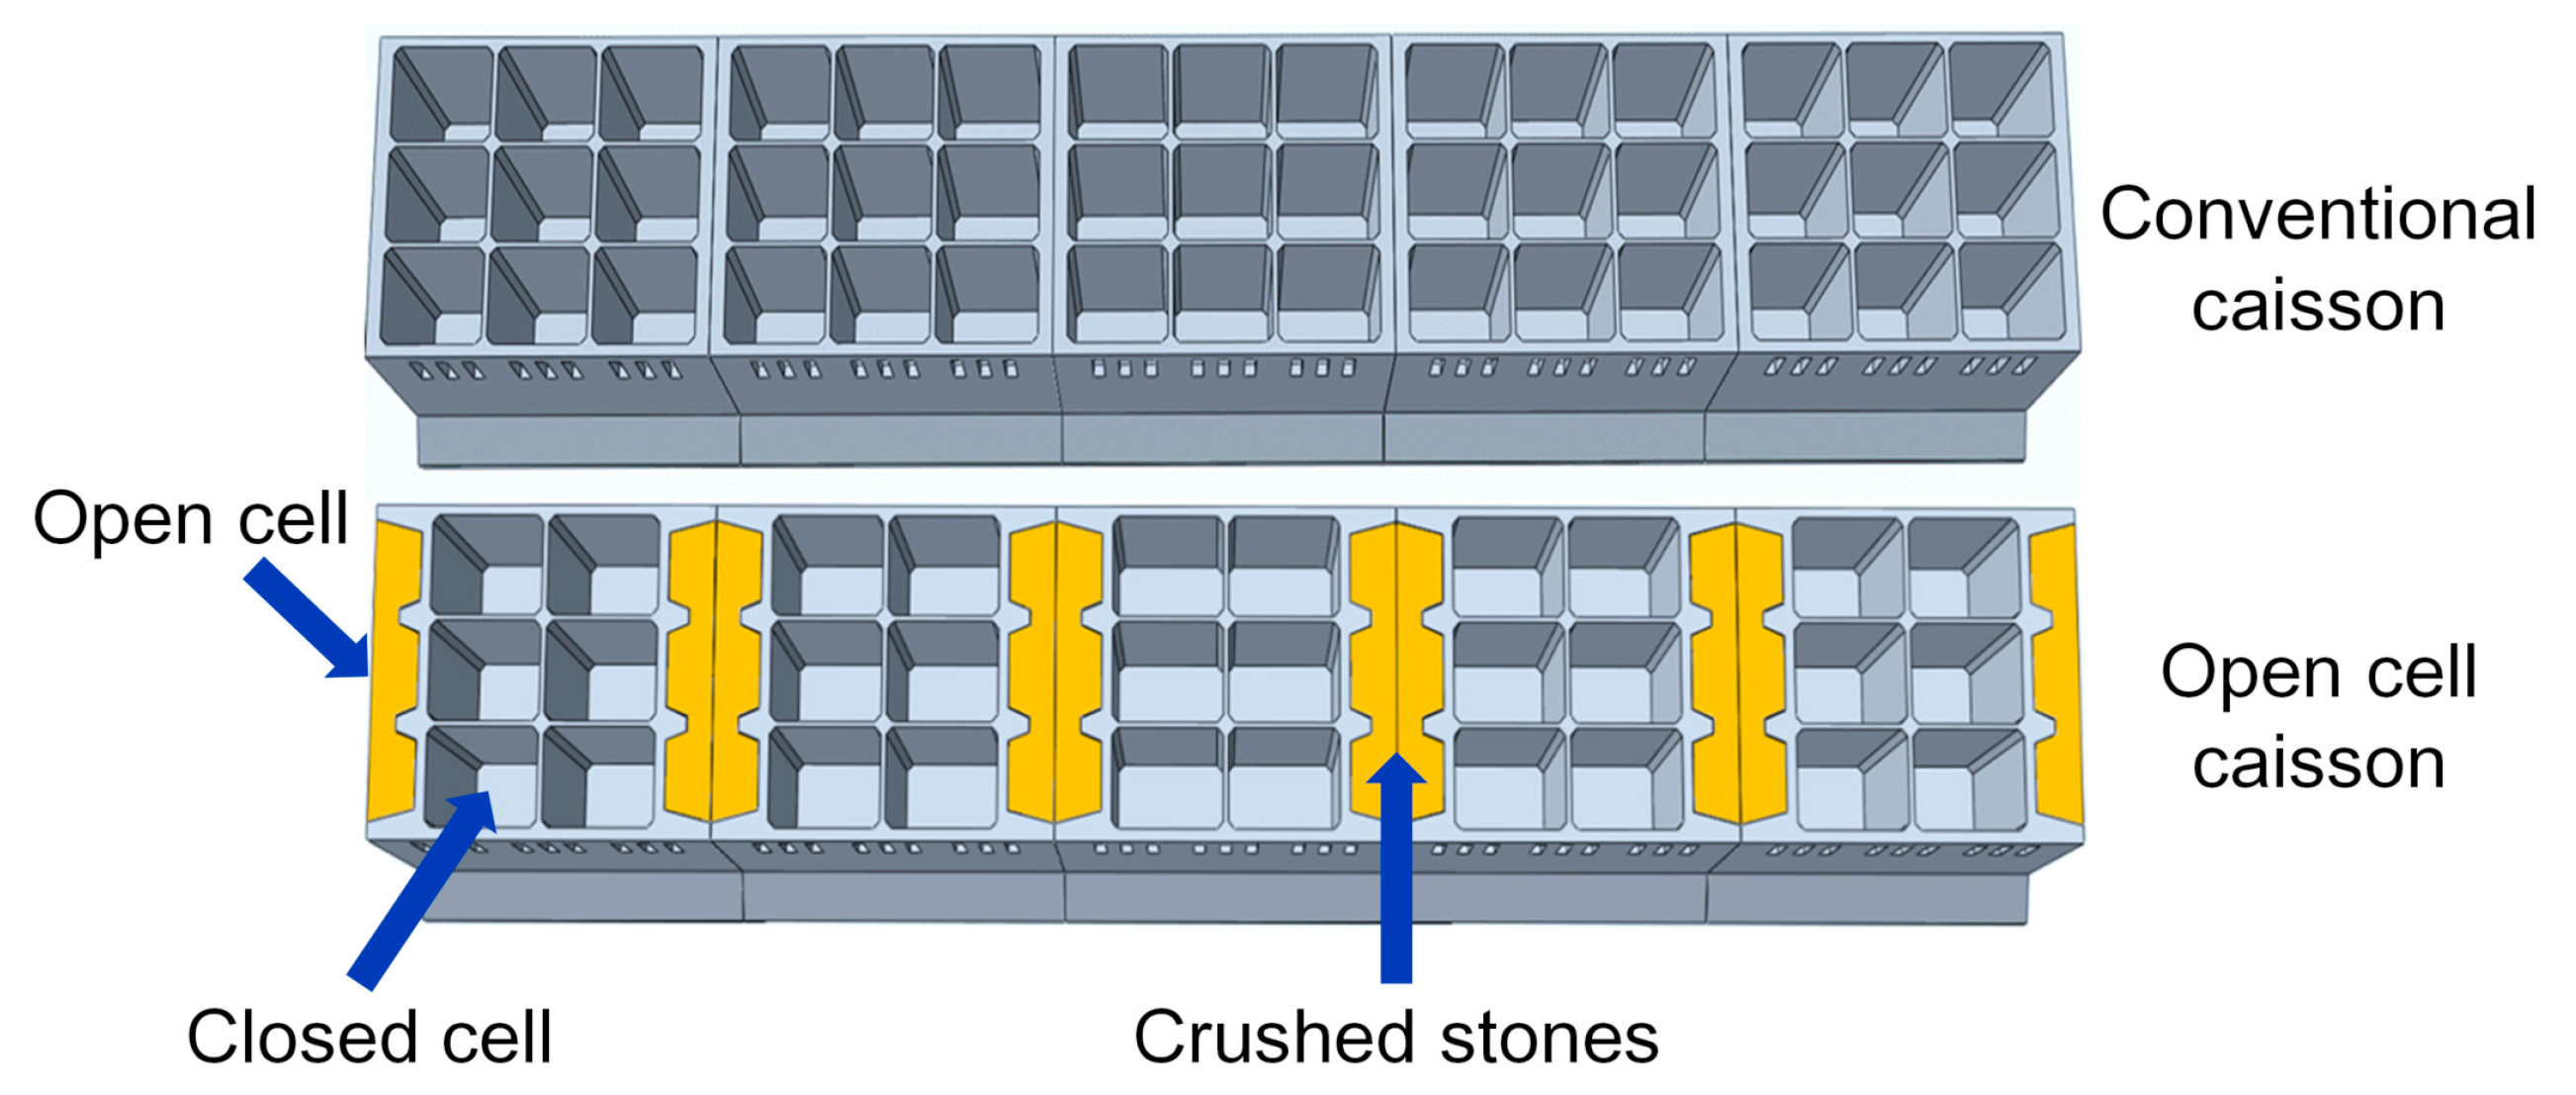
Figure 3 shows the schematics of harbor structures based on conventional and open cell caissons. In the open cell caisson structure, the walls of two adjacent caissons are opened and flexibly interlocked using crushed stones in two open cells facing each other. It is possible to realize a harbor structure that is elongated through caisson interlocking by simply inserting crushed stones into the open cells facing each other in the conventional caisson structure. Structures implemented through this method have the advantages of the existing caisson structure and elongation properties, thereby improving the structural stability in an economical way. In particular, the stability of sea structures is improved, where the load is concentrated in a specific caisson, making them capable of dealing with a variety of wave states.
In this study, we investigated the wave force characteristics and stability of a breakwater that was elongated by caisson interlocking with crushed stones through three-dimensional hydraulic model experiments. The breakwater model was constructed using 15 open cell caissons, wave forces acting on the breakwater were calculated, and its characteristics were analyzed using data measured from 14 wave gauges and 15 pressure gauges. In addition, a stability evaluation experiment for sliding was conducted on the breakwater with a critical weight for the design wave. To examine the effect of the incident wave angle, cases where the angles were 0°, 15°, and 30° were considered. For comparison purposes, experiments were also performed on breakwaters with non-interlocked caissons.

2. Experimental Setup and Analysis Methods

2.1. Experimental Setup

2.1.1. Wave Basin and Model Setup

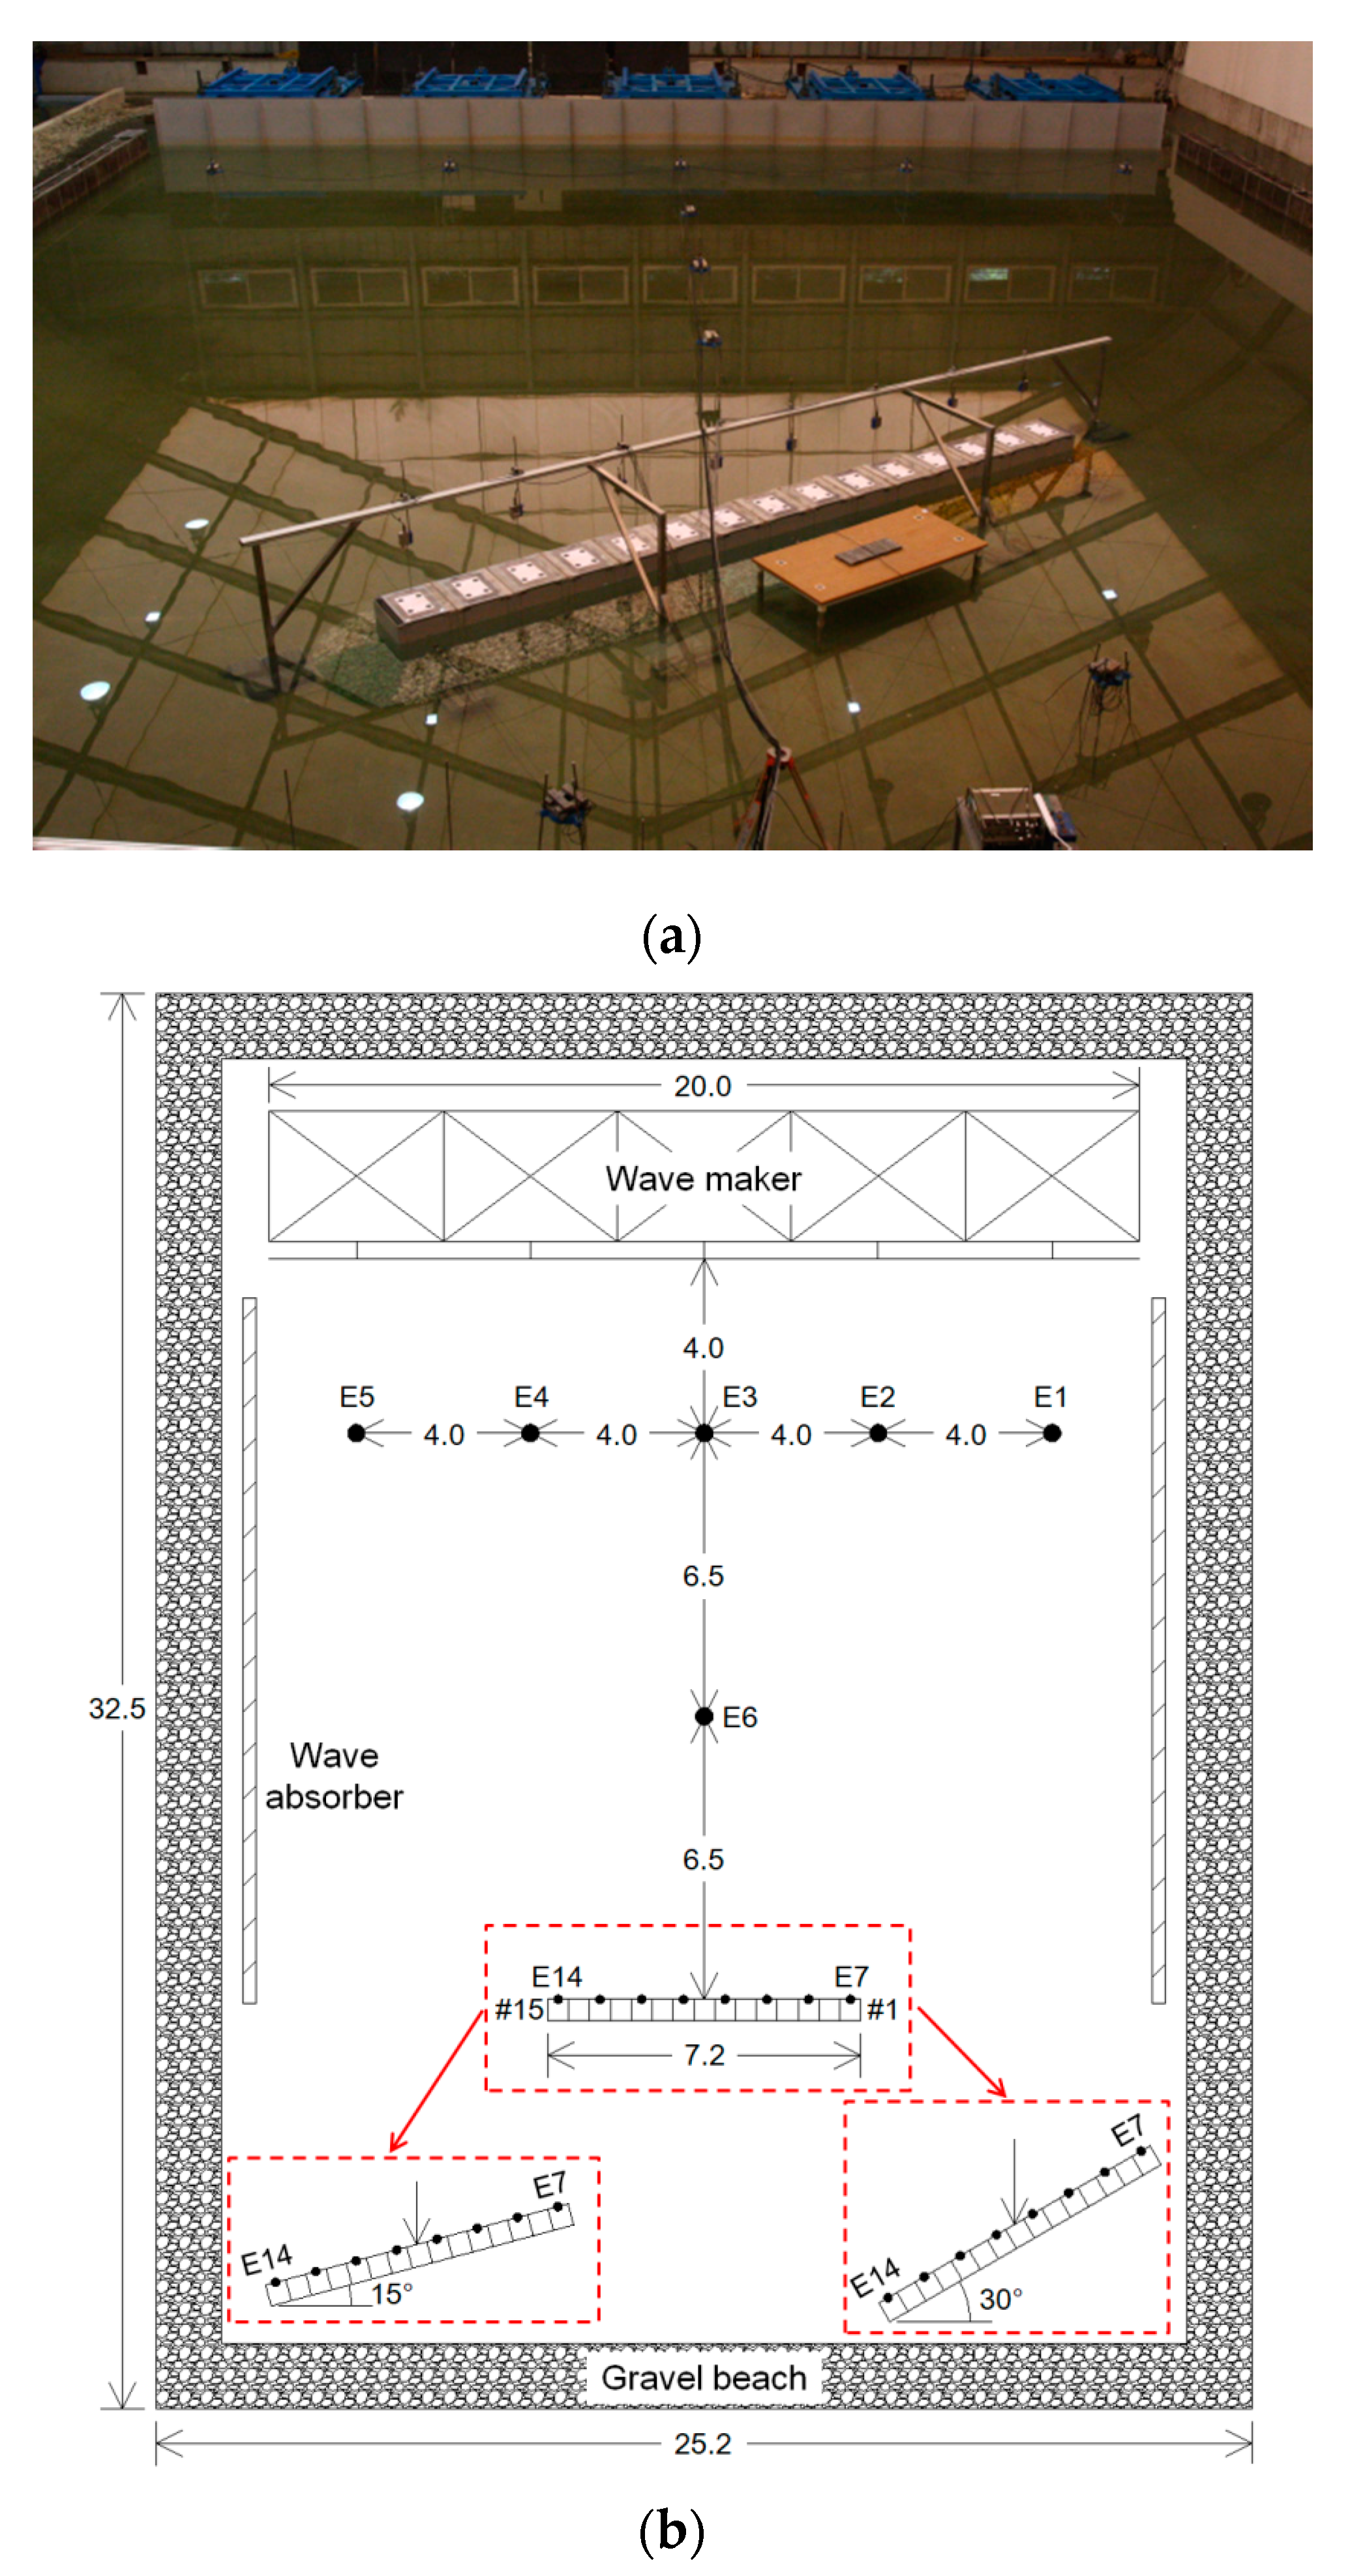
The hydraulic experiment was conducted in a wave basin located at the Korea Institute of Ocean Science and Technology in Ansan, Republic of Korea. The length, width, and height of the wave basin are 32.5, 25.2, and 1.2 m, respectively, as shown in Figure 4. The wave basin was equipped with five piston-type wave makers. Wave absorbers were placed at both sides of the wave basin, and a sloping gravel beach was introduced around the wave basin to reduce the reflected wave energy.
The model breakwater was installed 17 m away from the wave maker paddles. The breakwater length is 7.2 m, and the installation water depth is 0.5 m. For the experiment examining the angle of incidence, three models were considered in which the model breakwater was rotated by 0°, 15°, and 30° counterclockwise based on the center point (see Figure 4b). The water depth of 0.5 m was determined to be the maximum possible water depth, considering the wave basin specifications and experimental wave conditions. Considering that the water depth of the breakwater at the harbor entrance installed in Korea is around 20 m, the scale of this experiment can be said to be 1:40. In general, the experiment on the wave force acting on the caisson breakwater and its stability follows Froude’s similarity law [17]. Therefore, the measured water level, wave pressure, and wave force can be converted into prototype values based on Froude’s similarity law. That is, the measured wave runup and wave pressure from experiments can be converted into prototype values by multiplying them by 40, so the calculated wave force is 403. Times, such as wave period, duration, and sampling time, can be converted by multiplying by 40 .
As shown in Figure 4b, 14 capacitance-type wave gauges (E1–E14) were installed to measure the water surface fluctuations in the basin during the experiment; eight of these (E7–E14) were installed at equal intervals in front of the breakwater.

2.1.2. Breakwater Model

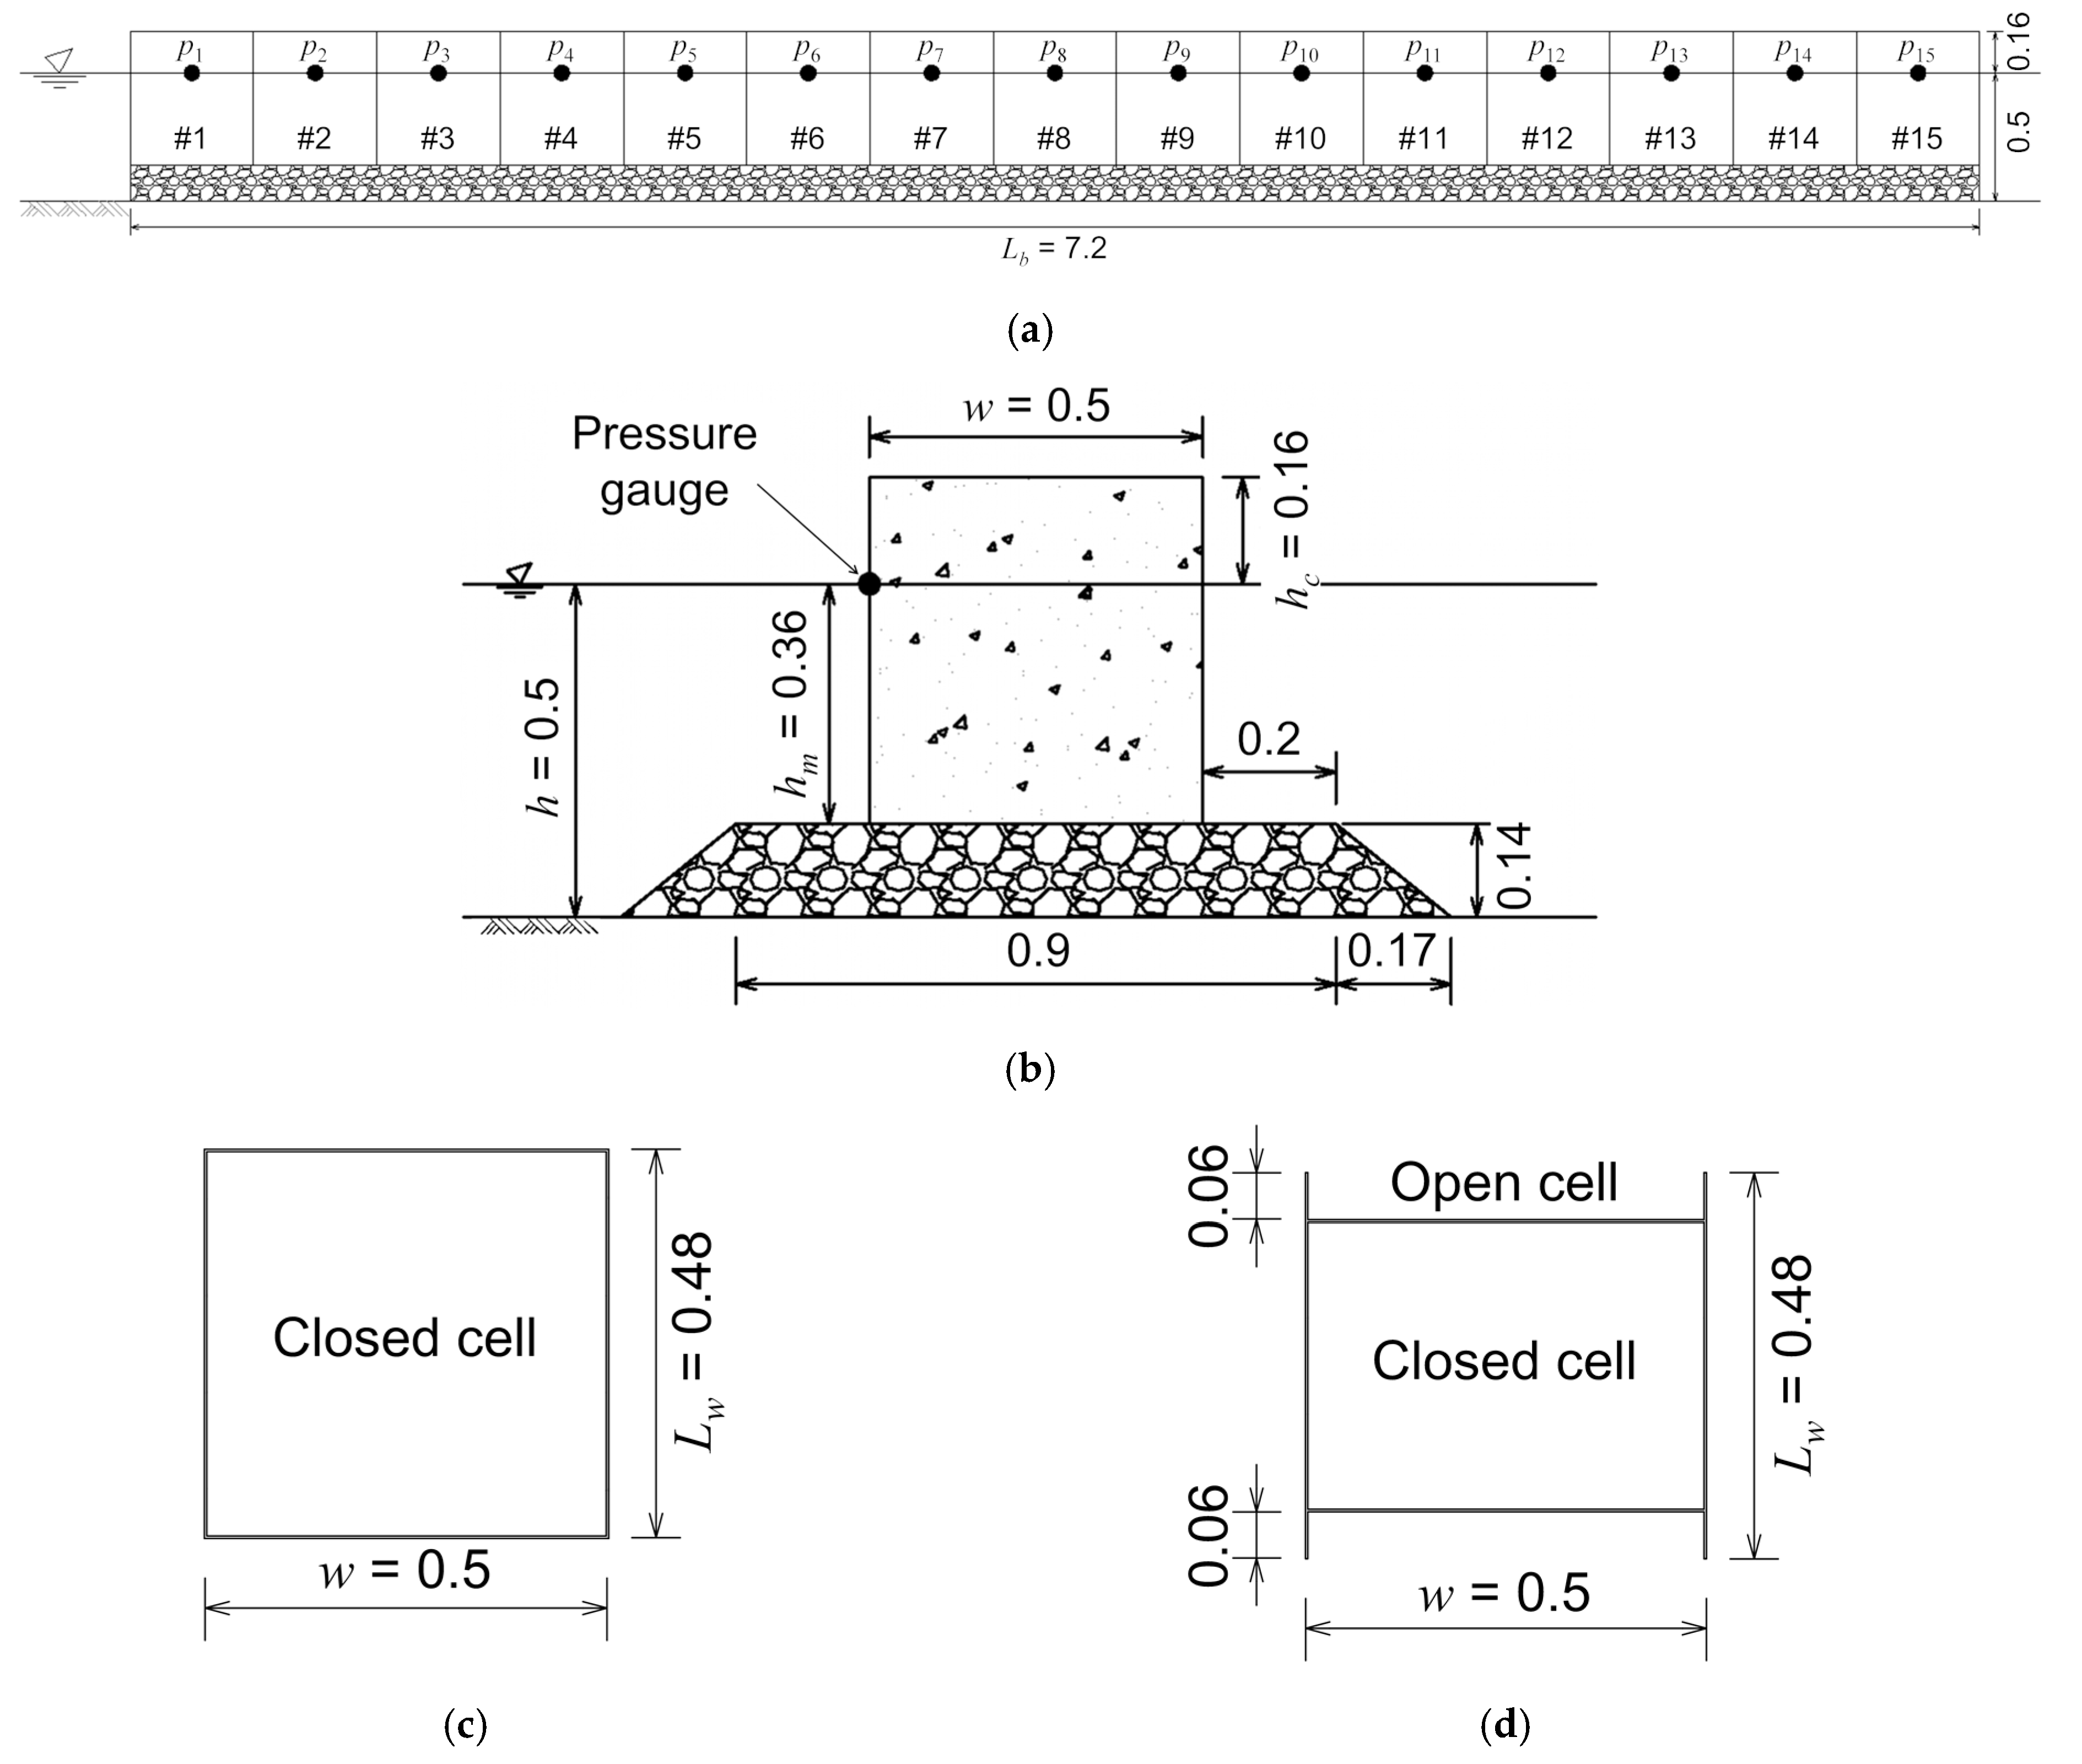
Figure 5 shows the breakwater model used in the experiment. The breakwater model consists of 15 caissons placed on a rubble mound, interlocked via crushed stones. The dimensions of the breakwater model were determined by the aforementioned 1:40 scale. Figure 5b shows the dimensions of the breakwater cross section, and Figure 5c and 5d show planar sections of the conventional and open cell caissons, respectively. The length of the breakwater (Lb) is 7.2 m; the height of the mound was 0.14 m; the height of the caisson including the concrete cap is 0.52 m; and the height of the freeboard (hc) is 0.16 m. The water depth (h) is set to 0.5 m, and the depth above the mound (hm) is 0.36 m. The caissons were made of steel plates with a width ( w ) of 0.5 m and a length ( L w ) of 0.48 m and were simplified into one closed cell with two open cells on both sides for the convenience of the experiment. The open cell was modeled using plates with a length, height, and thickness of 0.06, 0.5, and 0.003 m, respectively. The closed cell was filled with lead bars to obtain the required weight. Two open cells facing each other were filled with scaled crushed stones, according to Froude’s law. In the open cell method, it is recommended to use rubble stones of 0.015~0.03 m3 [18] as filling stones. The weight of the head caissons (#1, #15) at both ends was set to approximately 1.5 times that of the trunk caissons. This reflects the design regulations in Korea, which recommends that the safety factor for the armor blocks of the head caisson are designed to be 1.5 times higher than that of the trunk caisson [18]. This is because securing the stability of the head caisson is believed to have great influence on the stability of the entire breakwater. In the case of the interlocking caisson breakwater in this study, the stability of the head caisson is even more important, so it was set as above.
To measure the wave pressure acting on the breakwater and calculate the wave force, wave pressure gauges were installed at the center of the front surface of each caisson on the free surface, as shown in Figure 5a. The reason why the wave pressure gauge is installed on the free surface is because the hydrodynamic pressure is largest there, theoretically. As such, the pressure distribution on the breakwater surface can be approximately determined from the measured wave pressure on the free surface by using the wave runup data and linear wave theory, as will be explained later in Section 2.2.2. In addition, when performing the breakwater activity experiment, displacement gauges were installed on the back of the 1st and 15th (heads) and 8th (center) caissons to measure their displacement.
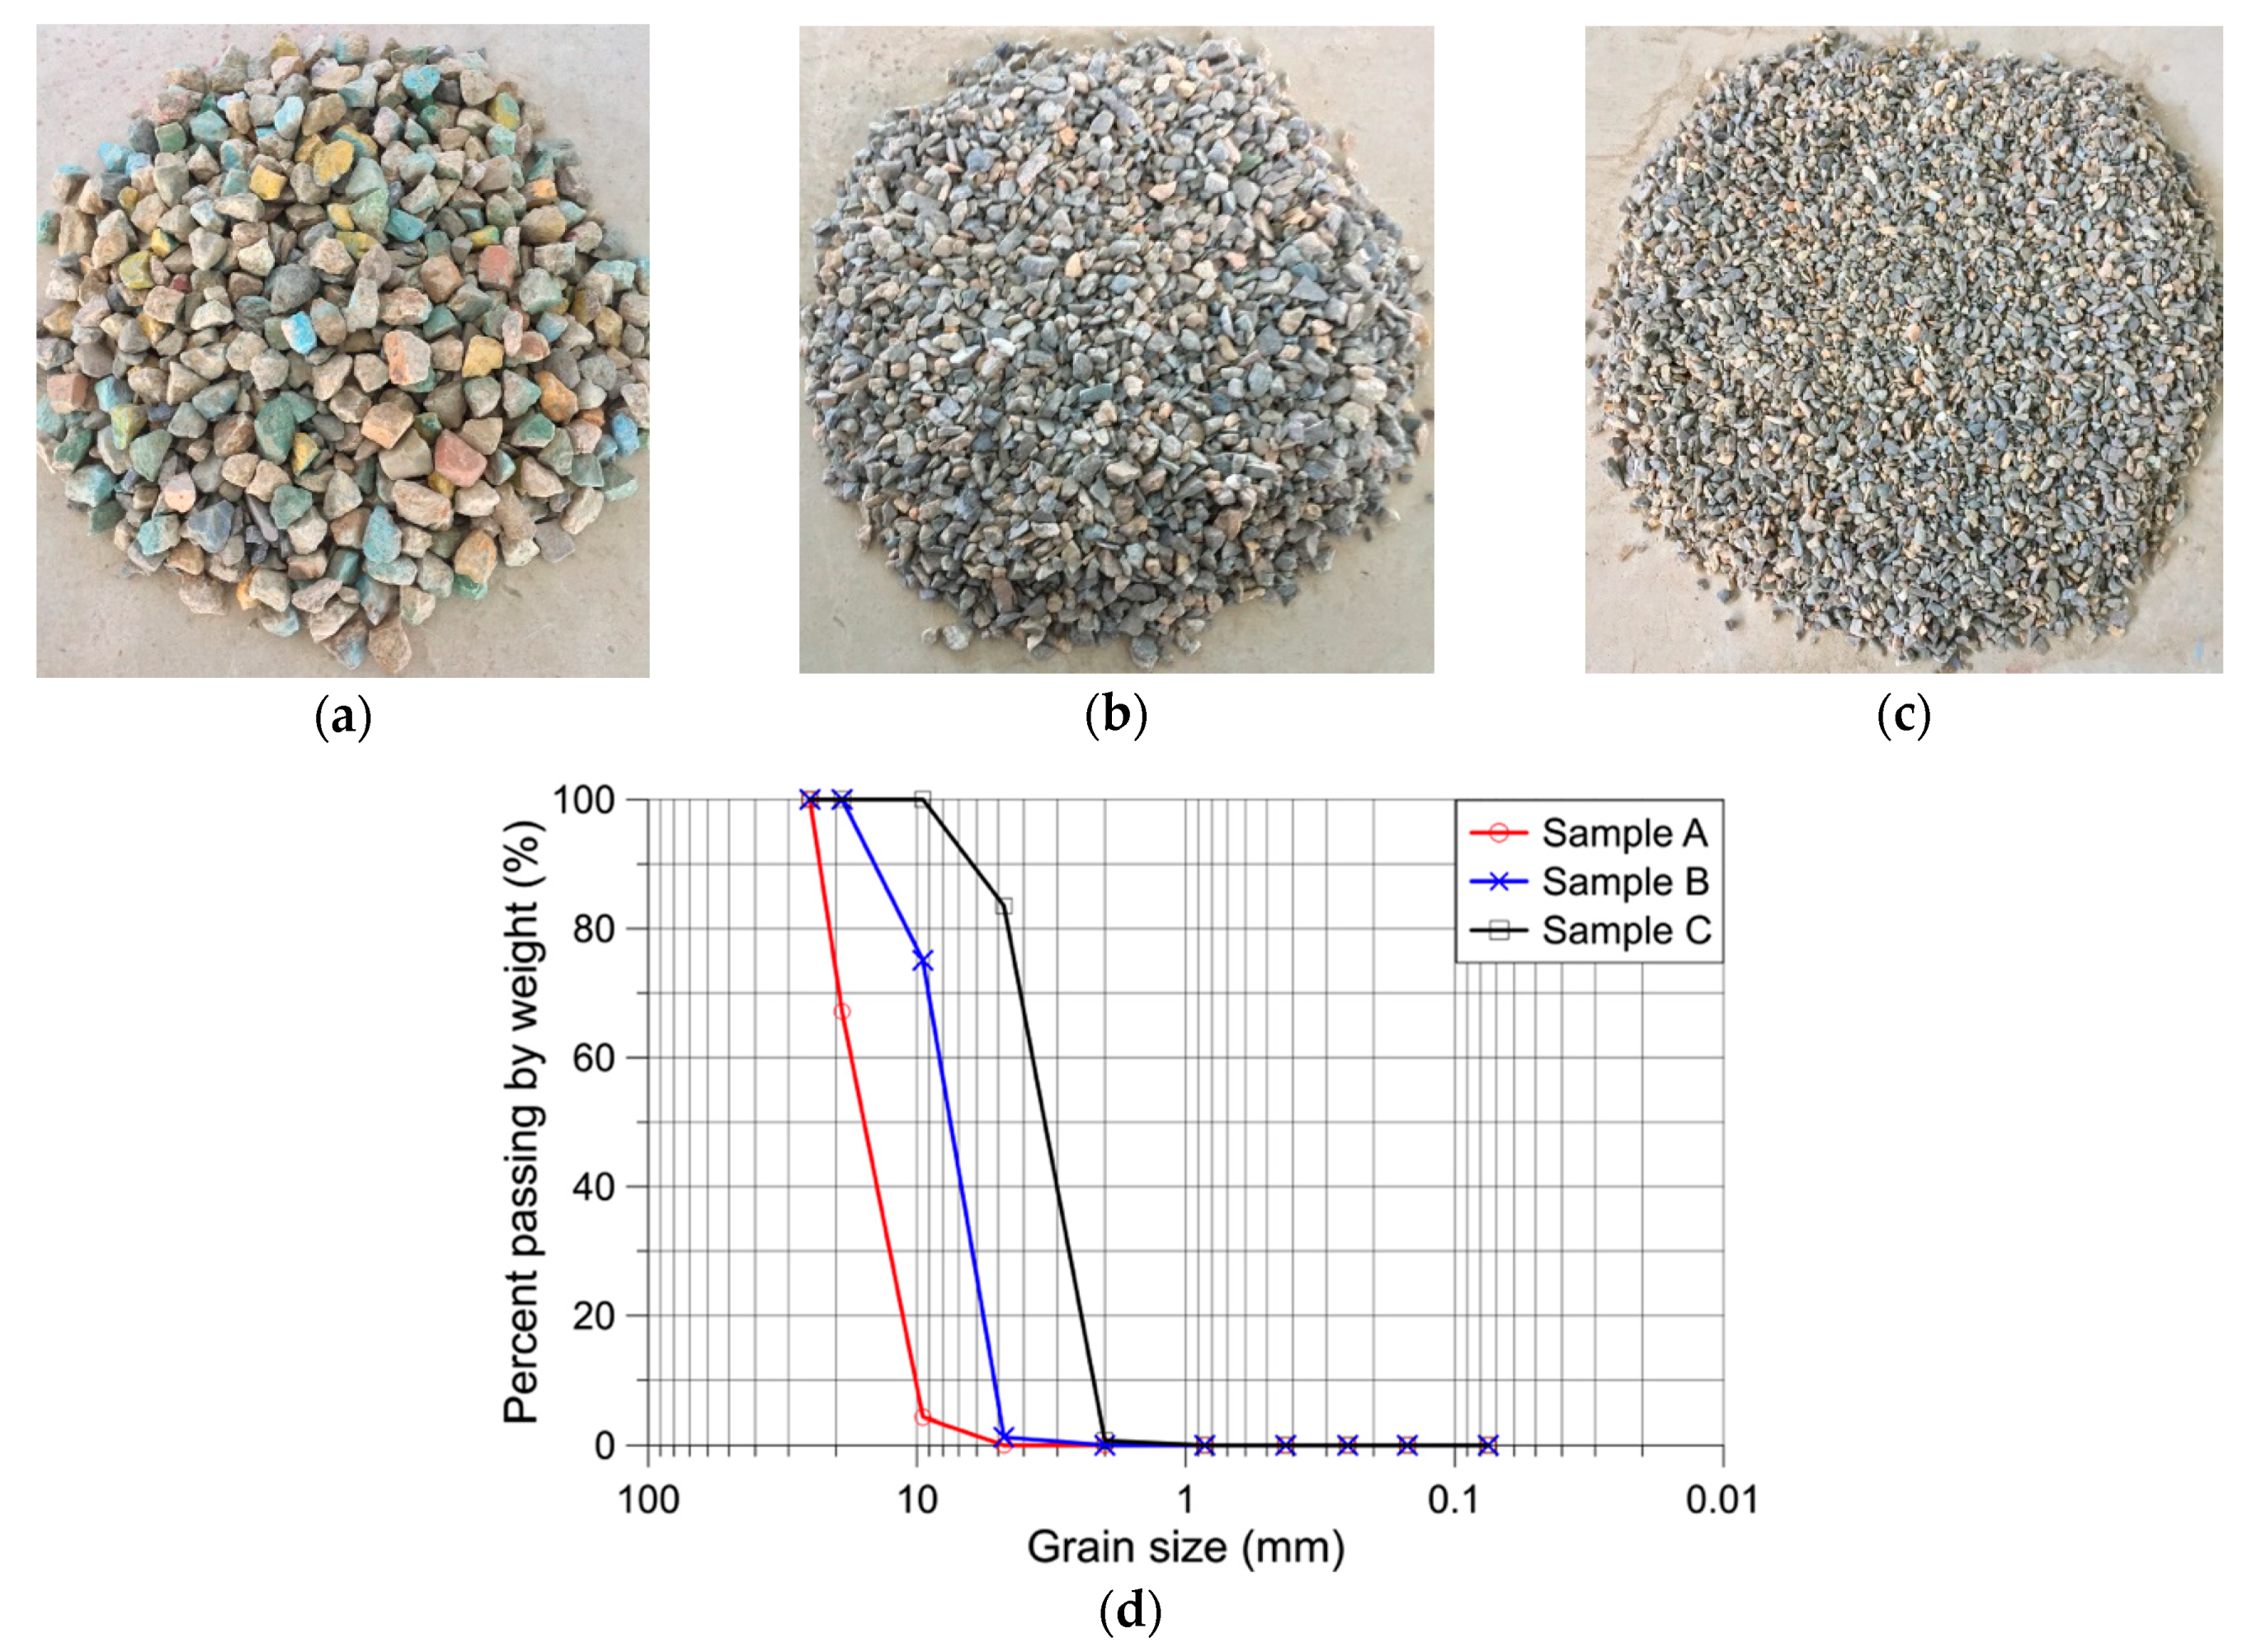
The crushed stones that filled in the open cells facing each other were evaluated through a sieve analysis. Figure 6 shows the photographs of crushed stones with different sizes. Samples A, B, and C were classified through sieve analysis using 10 testing sieves (25, 19, 9.5 mm, #4 (4.75 mm), #10 (2 mm), #20 (0.85 mm), #40 (0.425 mm), #60 (0.25 mm), #100 (0.15 mm), and #200 (0.075 mm)). Table 1 summarizes the properties of the sample gravel classified according to the Unified Soil Classification System (USCS). The D10 value, with respect to effective grain size De, corresponds to the proportion of grains that are 10% finer than the given grain size. The values of D30, D50, and D60 are defined in the same manner as D10. Cu and Cc denote the uniformity coefficient and coefficient of curvature, respectively, and these coefficients were used to classify the sample gravel as having well-graded (unevenly graded) or poorly graded (uniformly graded) grains. In this context, samples A and B corresponded to poorly graded gravel (GP), and sample C corresponded to poorly graded sand (SP). In other words, each sample was uniformly graded as the samples had already been sorted by size before conducting the sieve analysis test. Considering that the recommended size of the crushed stones in the field is 0.015 to 0.03 m3 [18], A, B, and C correspond to the 1/20, 1/40, and 1/90 scales, respectively. Sample B was used as the filler because it matched the 1/40 scale used in this study.
The breakwater deformation varies depending on the degree of compaction of crushed stones. If the crushed stones are filled and compacted, then the void between the crushed stones decreases, reducing the amount of deformation and increasing the shear resistance. However, because it is not easy to compact crushed stones in the field, they were freely dropped in the open cells without artificially compacting them in this experiment. In the stability evaluation, waves smaller than the design waves were utilized beforehand, so the natural compaction effect occurring in the field could be somewhat reproduced.

2.1.3. Test Waves

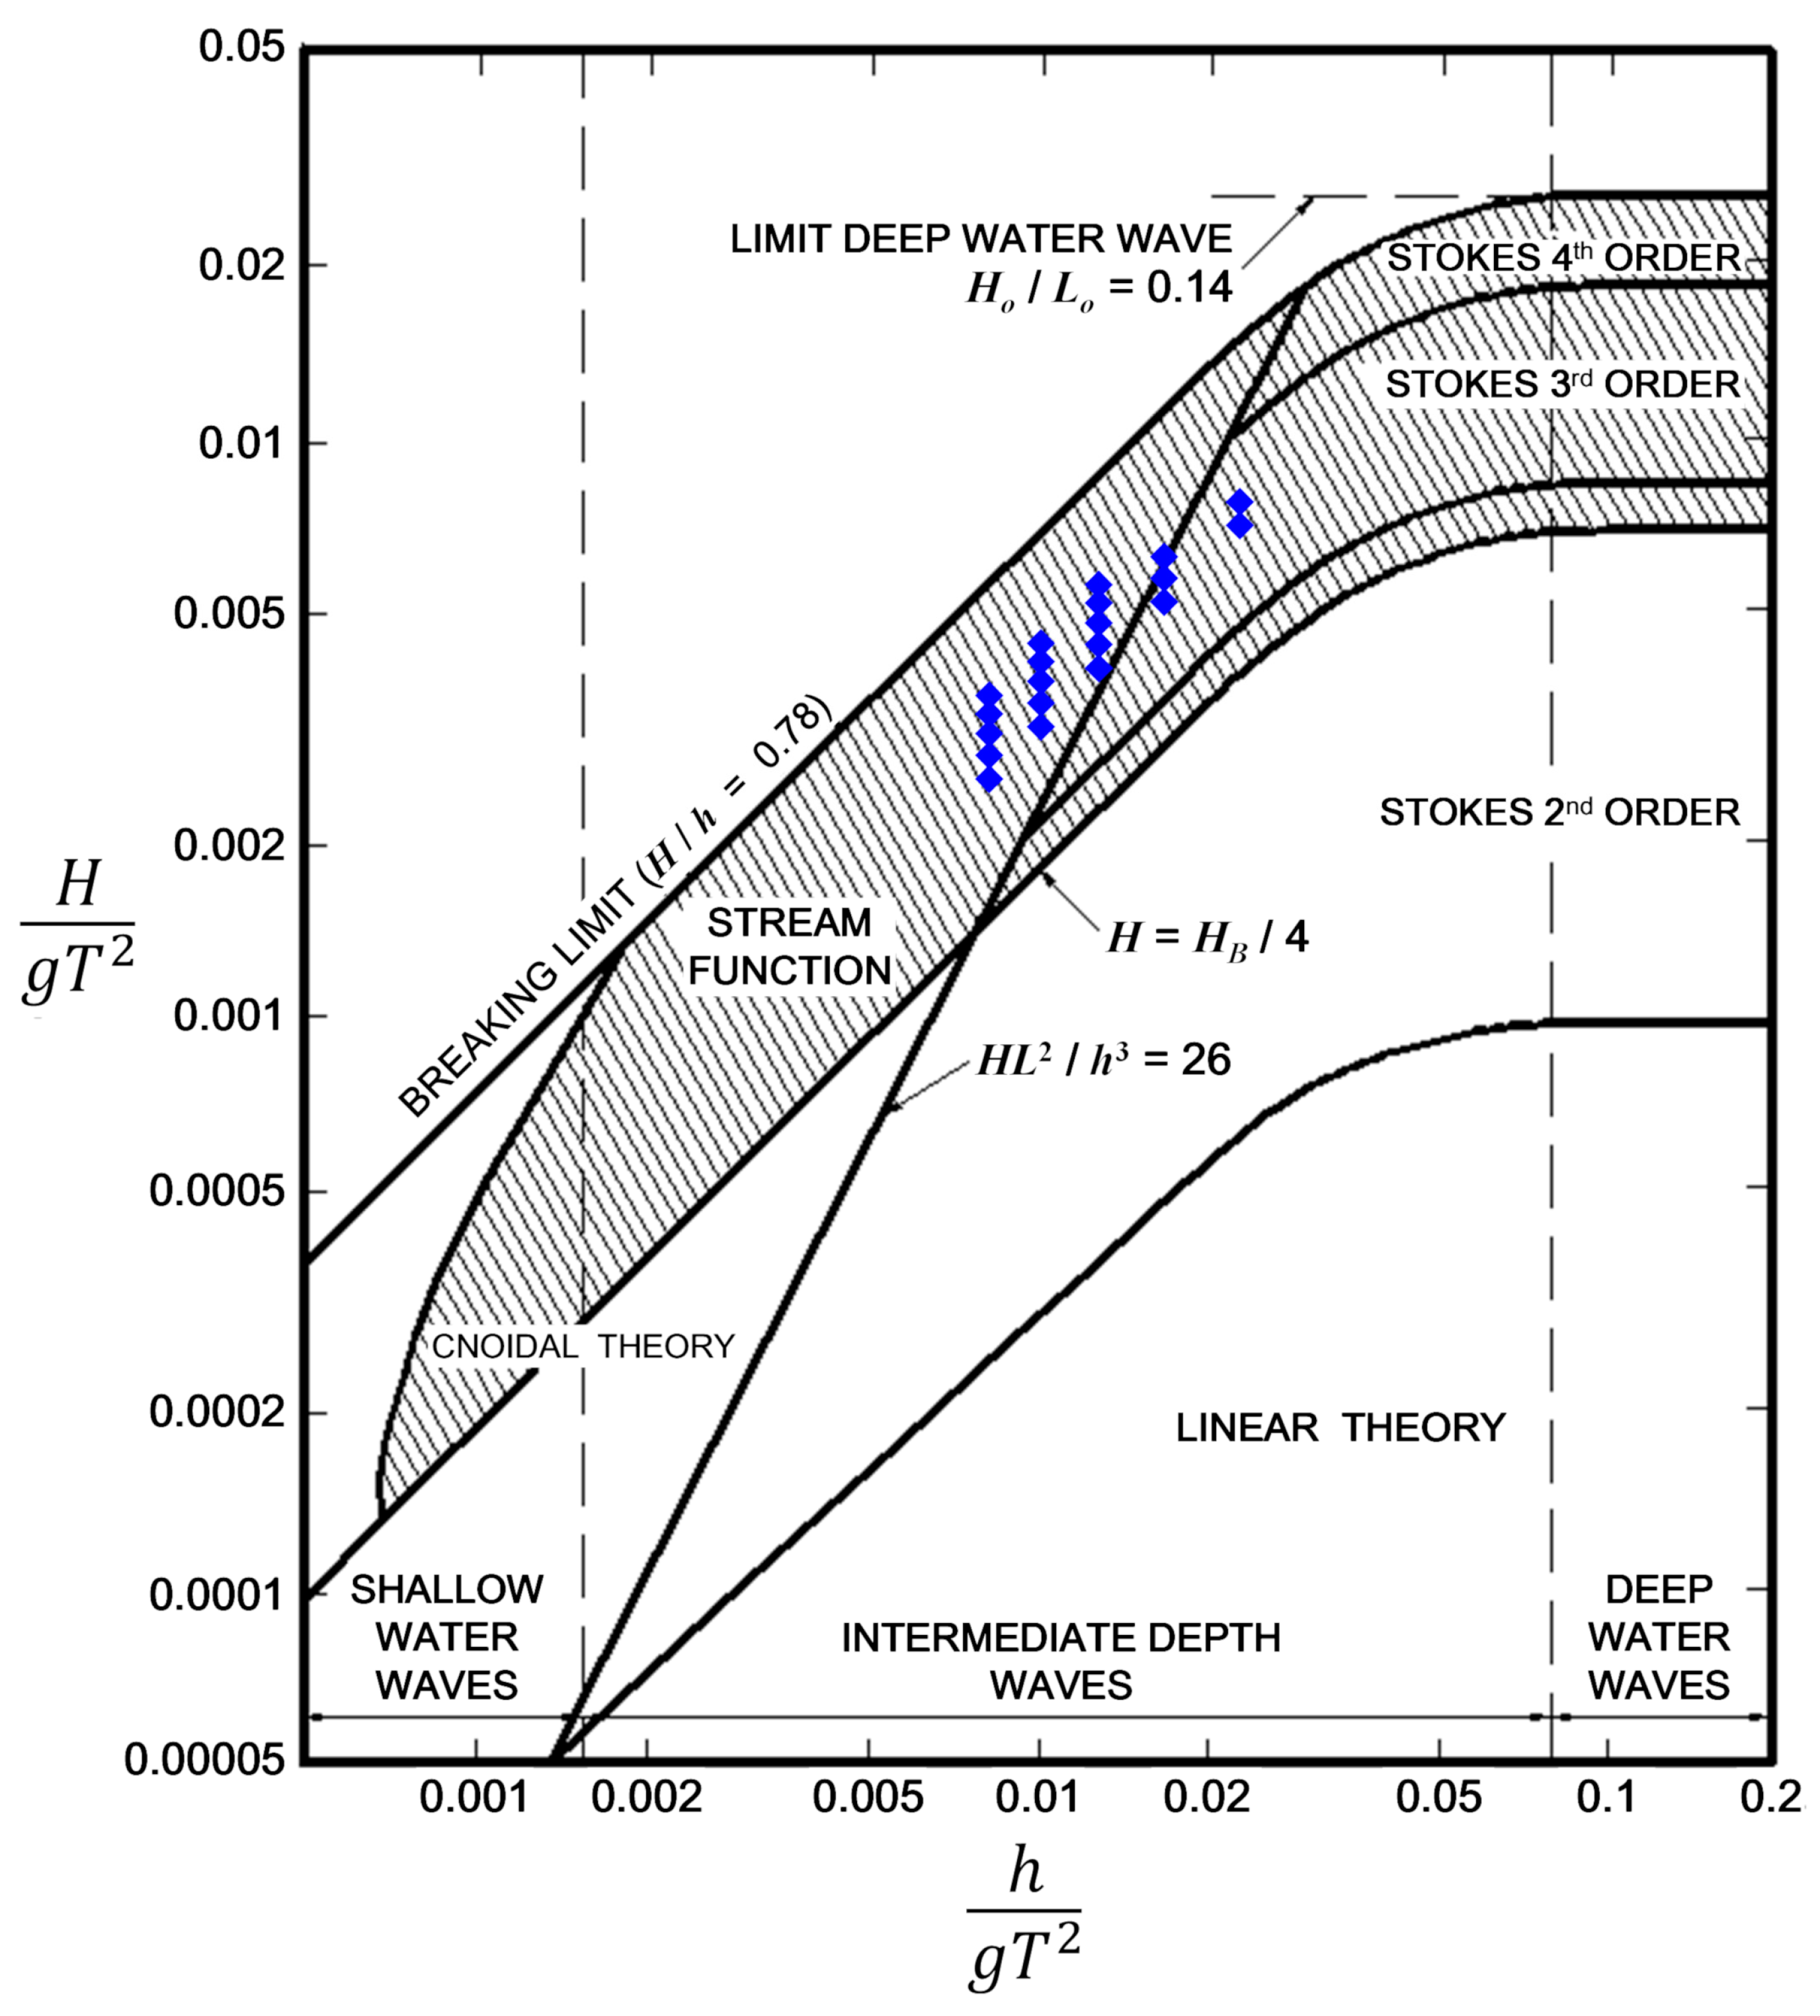
To simplify the analysis of the wave force characteristics, hydraulic experiments with regular waves were conducted. The specifications of the experimental waves were set considering the characteristics of the design waves with large non-linearity and the destruction test of the breakwater. Table 2 shows the test wave conditions. The actual test waves were made so that the target wave height in Table 2 was reproduced where the center of the breakwater would be (between wave gauges E10 and E11), but without the breakwater present in the wave basin. The actual experimental wave height showed a relative error of less than 2% compared to the target wave height, so it was judged to be sufficiently suitable for the purpose of this experiment from an engineering design point of view. The values in parentheses in Table 2 are the wave steepness, defined as the wave height ( H ) divided by the incident wave length ( L ), which satisfies the dispersion relation. The test waves correspond to the third-order Stokes wave or the stream function wave similar to general breakwater design wave conditions with fairly large wave heights, as shown in Figure 7. The wave W06 (period: 2 s; wave height: 0.16 m) was set as a design wave for determining the caisson self-weight during the sliding test of the breakwater. The design caisson weight was determined as the weight needed for a safety factor of 1.0 when W06 is applied.
The wave generation time was set to 25 s. This is the shortest time for the experimental wave reflected from the breakwater to return to the breakwater after being reflected from the wave paddle.

2.2. Analysis Method

2.2.1. Data Acquisition and Analysis

During the experiment, a sampling rate of 600 Hz was set to measure water level fluctuations, wave pressures, and displacements. In generating impulsive pressure by breaking waves, it should be set to be 1 kHz or higher [20,21,22], but our sampling rate is sufficient to acquire data to qualitatively confirm the occurrence of impulsive pressure in this experiment [23].
Data analysis was performed by selecting five consecutive waves determined to have stabilized within the data read for 25 s, in which only the target experimental wave, wave reflected from the breakwater, and diffraction wave were present.

2.2.2. Wave Force Calculation

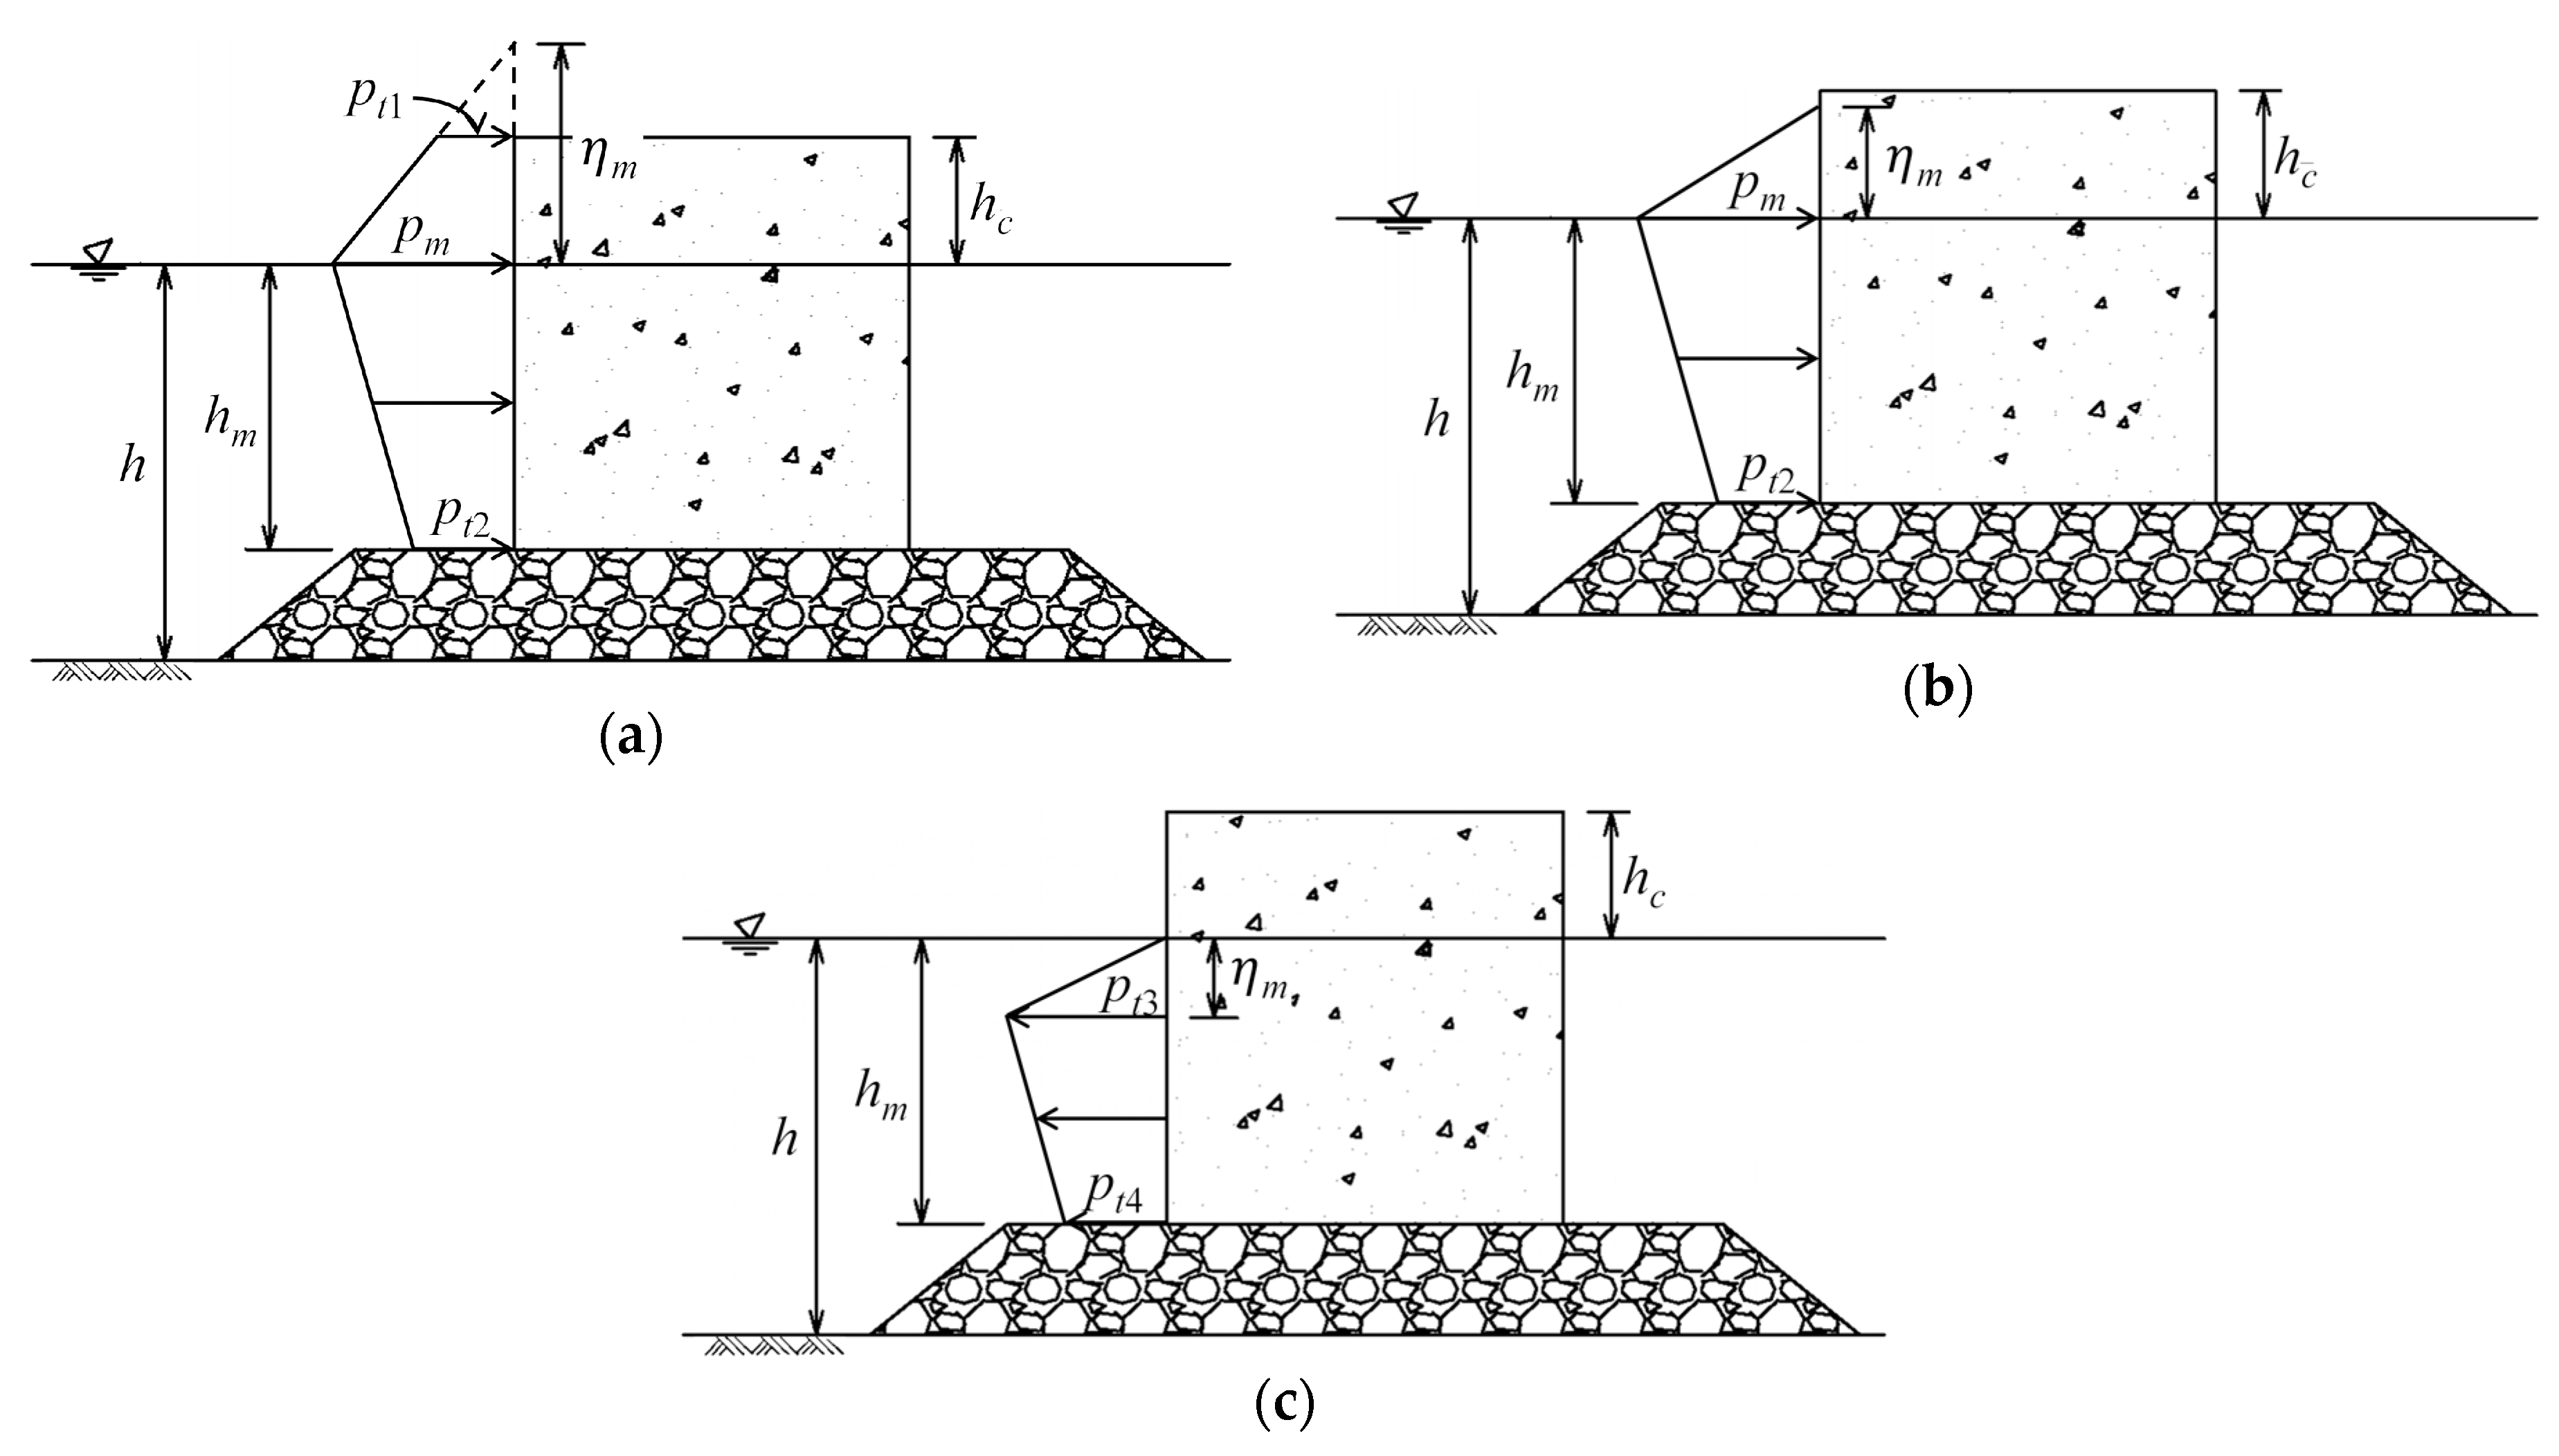
The wave force acting on each caisson was determined using the data obtained from the wave pressure gauges installed on each caisson at the still water level and the wave gauges installed on the front surface of the caisson. Figure 8 shows the pressure distributions used in this study. In the first case, the water level in front of the caisson is higher than the freeboard (Figure 8a). In the second case, the water level is between the still water level and the freeboard (Figure 8b). In the third case, the water level is below the still water level (Figure 8c). Considering the hydrodynamic pressure distribution in the vertical direction, the pressures, pt1pt4, can be determined as follows:
p t 1 = p m ( 1 h c η m )
p t 2 = p m cosh k ( h h m ) cosh k h
p t 3 = ρ g η m
p t 4 = ρ g η m cosh k ( h h m ) cosh k h
where pm is the wave pressure measured from pressure gauges, p1 to p15 in Figure 5a; ηm is the wave runup measured from wave gauges, E7 to E14 in Figure 4b; k is the wave number; ρ is the water density; and g is the gravitational acceleration. For caissons without a wave gauge installed on the front, ηm was determined by interpolating the measured data of the caissons on both sides.
Using the pressure distributions in Figure 8, the wave force per unit length was determined by integrating vertically as follows:
F = ( p t 1 + p m ) 2 h c + ( p m + p t 2 ) 2 h m   for   η m > 0   and   η m > h c
F = p m 2 η m + ( p m + p t 2 ) 2 h m   for   η m > 0   and   η m < h c
F = p t 3 2 η m + ( p t 3 + p t 4 ) 2 ( h m + η m )   for   η m < 0
where F is the wave force per unit length at the center of the caisson. After determining the wave force acting on each caisson by multiplying the width of each caisson with F , the total wave force acting on the entire breakwater was determined by adding all the forces.

2.2.3. Analytical Solution for Wave Forces

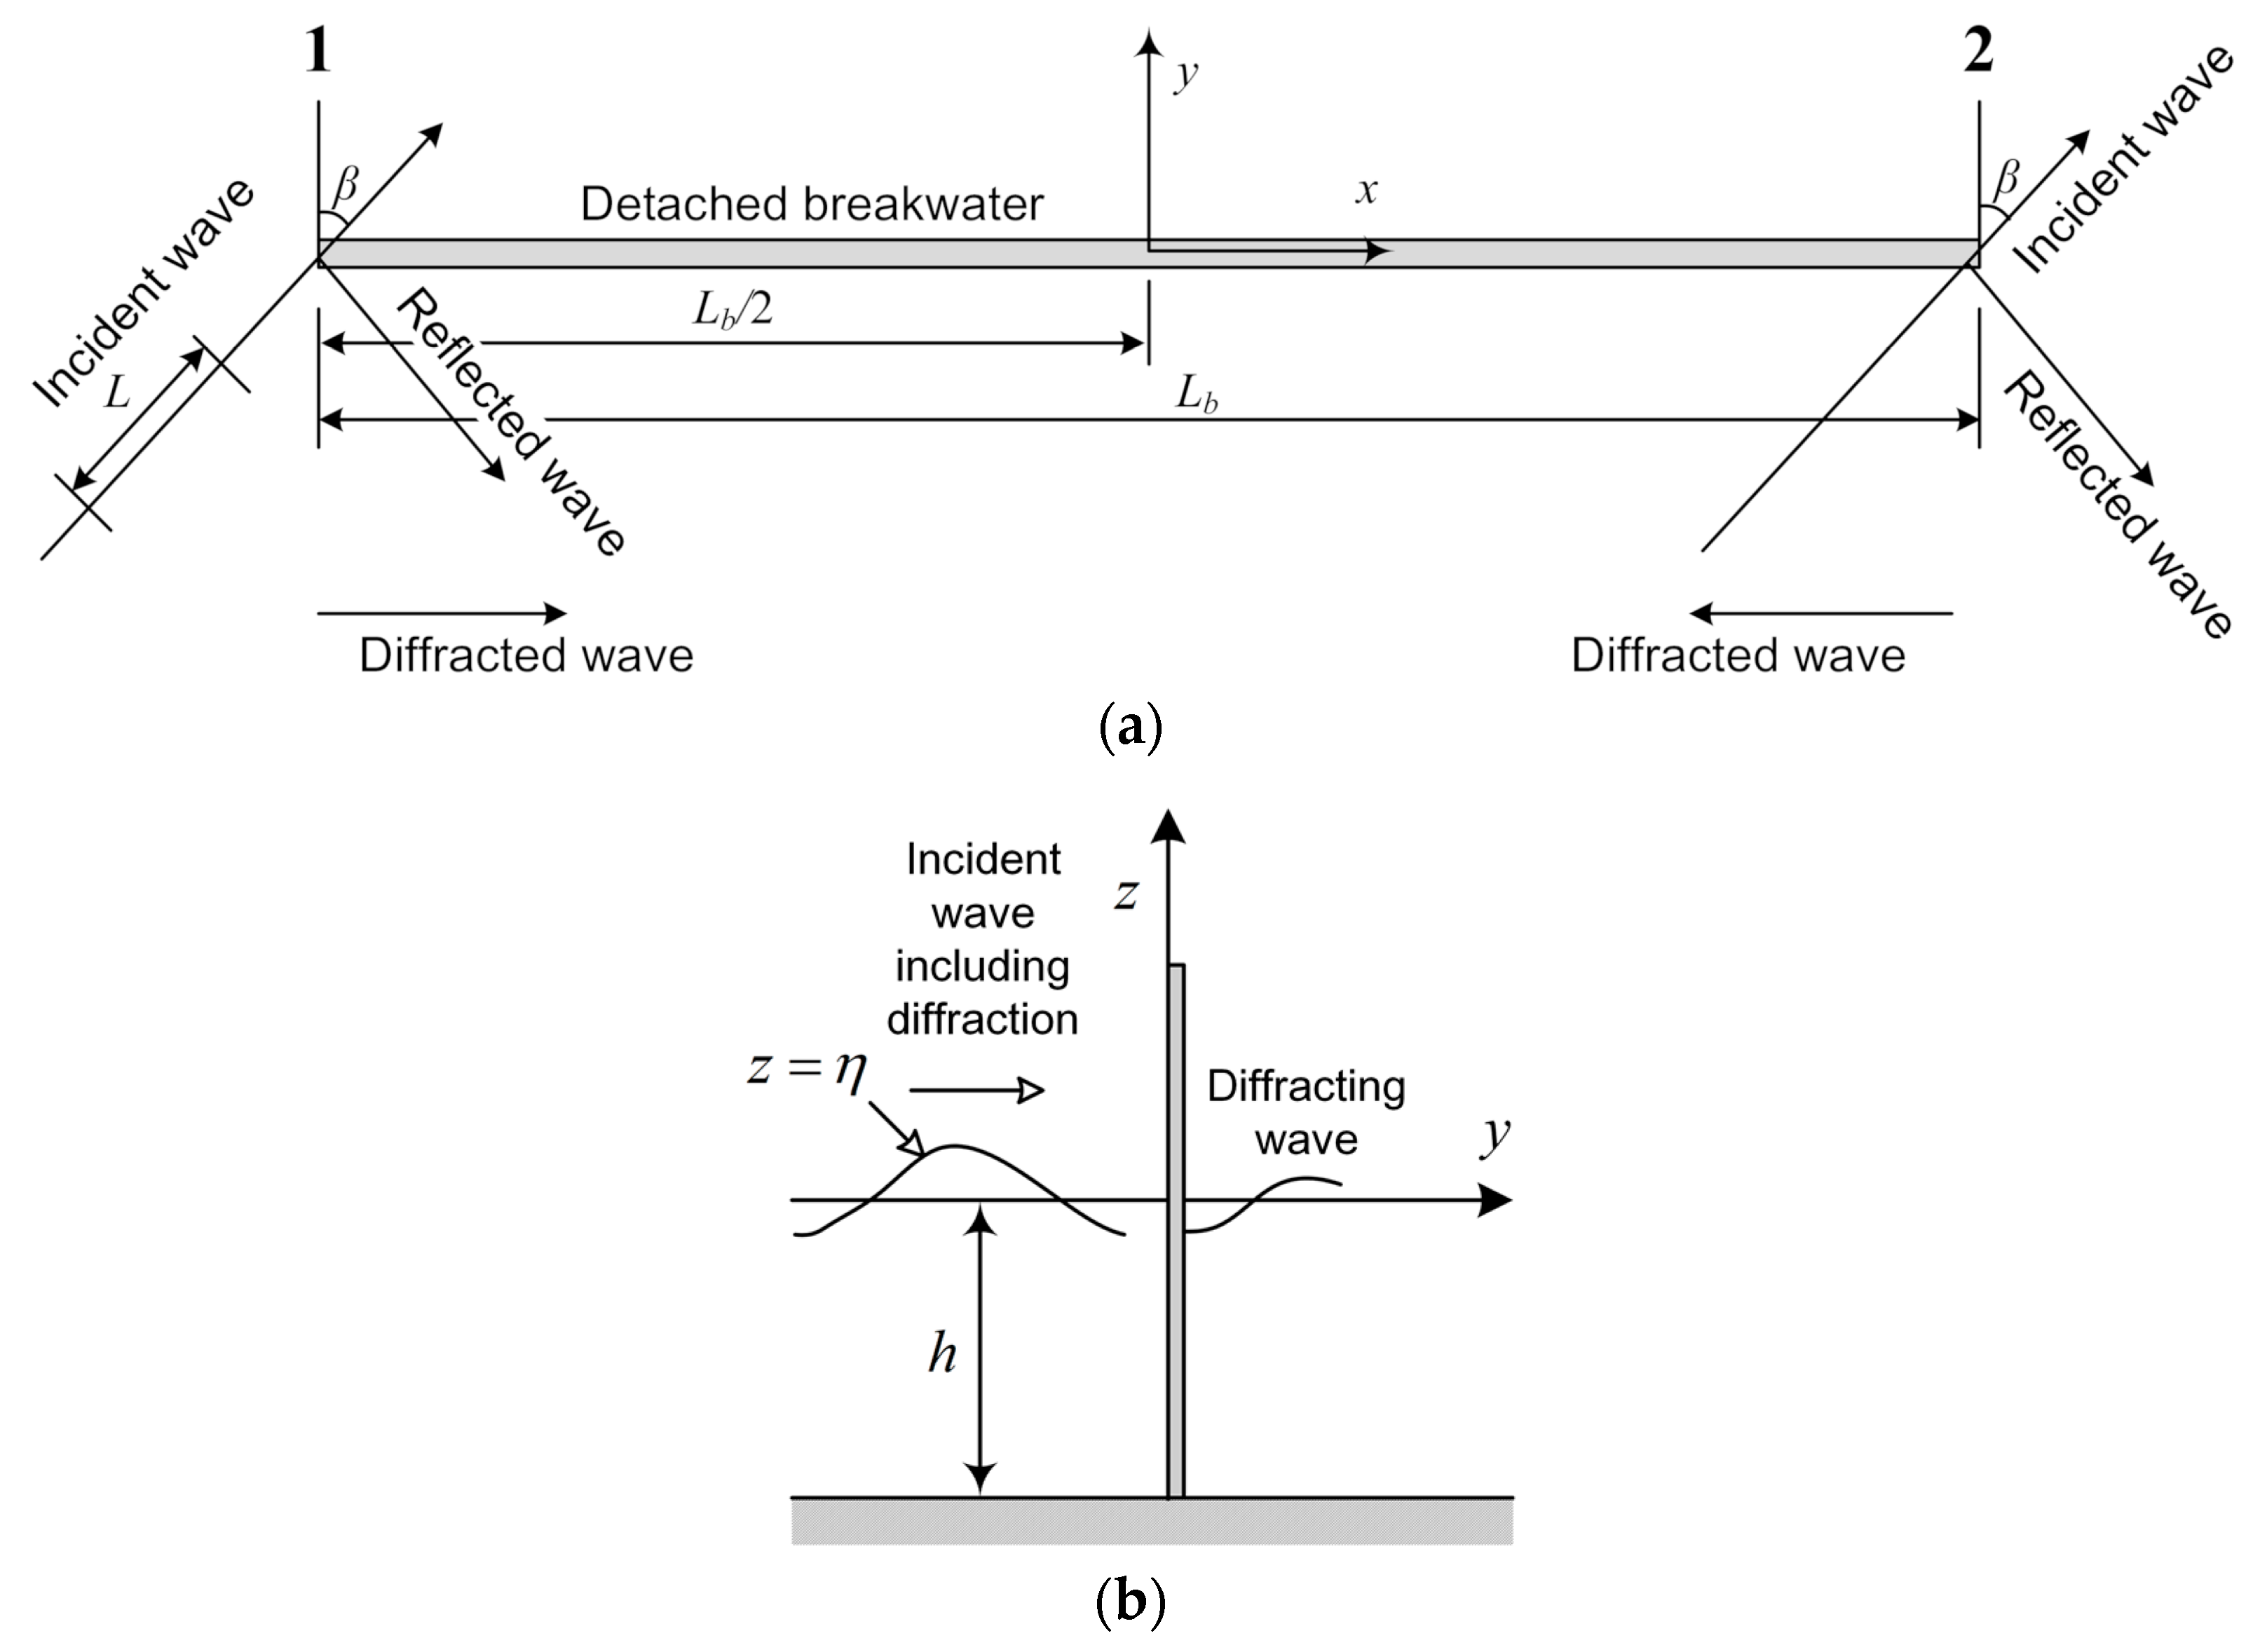
For comparison with the results of hydraulic experiments, an analytical solution for a detached breakwater was derived using the solution of Penny and Price [24]. To formulate the related boundary value problem, a coordinate system was introduced, and each variable was defined, as shown in Figure 9, where h is the water depth, L is the previously defined wavelength, β is the angle of incidence, and Lb is the length of the breakwater. A detached breakwater with a rubble mound was assumed to have a very thin plate structure.
Assuming that the fluid is incompressible and the flow is irrotational, the continuity equation can be expressed as follows:
2 Φ x 2 + 2 Φ y 2 + 2 Φ z 2 = 0
where Φ is the velocity potential. For small wave amplitudes, the dynamic boundary condition on the free surface can be expressed as follows:
Φ t + g η = 0 on   z = 0
where η is the water surface elevation. The kinematic boundary conditions to be satisfied on the free surface can be defined on the still water level as
η t + Φ z = 0 on   z = 0
Equations (9) and (10) can be combined to yield
2 Φ t 2 + g Φ z = 0 on   z = 0
The velocity potential, Φ , should satisfy no flux conditions on the bottom, such that
Φ z = 0 on   z = h
Assuming a harmonic wave which is periodic in t , the velocity potential can be expressed as a complex-valued velocity potential, ϕ , i.e.,
Φ = Re [ ϕ ]
where Re [ ϕ ] is the real part of ϕ . Using Equation (13), the solution of Equation (8) that satisfies the bottom boundary condition in Equation (12) can be obtained as
ϕ = G cosh [ k ( z + h ) ] F ( x , y ) e i k c t
where F ( x , y ) is a complex-valued function satisfying
2 F x 2 + 2 F y 2 + k 2 F = 0
From Equation (11), the dispersion relationship can be derived as
ω 2 = g k tanh ( k h ) ,   c = ω k
where ω is the angular frequency, k is the wavenumber, and c is the wave speed. The constant G in Equation (14) can be defined as
G = i g a i ω cosh ( k h )
where a i is the incident wave amplitude and g is the acceleration due to gravity. In front of the breakwater, incident and reflected wave components exist along with the diffraction wave components from the incident and reflected waves. Following the approach developed in references [24] and [25], the function F ( x , y ) from Equation (14) in front of the breakwater can be expressed as follows:
F ( x , y ) = e i k ( x sin β + y cos β ) + K r e i k ( x sin β + y cos β ) b i , f 1 ( x , y ) e i k ( x sin β + y cos β ) K r b r , f 1 ( x , y ) e i k ( x sin β + y cos β ) b i , f 2 ( x , y ) e i k ( x sin β y cos β ) K r b r , f 2 ( x , y ) e i k ( x sin β y cos β )
where K r is the reflection coefficient; b i , f ( x , y ) and b r , f ( x , y ) are the relative amplitudes of the waves diffracting from the incident and reflected waves, respectively, in front of the breakwater; and f 1 and f 2 denote the components diffracting from the left (1 in Figure 9a) and right sides (2 in Figure 9a), respectively. These diffraction components in front of the breakwater include the phase information in their complex solution and can be calculated as follows [24], where y = 0 :
b i , f 1 ( x , 0 ) = f ( ψ f 1 ) , b r , f 1 ( x , 0 ) = f ( ψ f 1 ) , b i , f 2 ( x , 0 ) = f ( ψ f 2 ) , b r , f 2 ( x , 0 ) = f ( ψ f 2 )
where
f ( ψ ) = 1 2 ( 1 + i ) ψ e 1 2 i π u 2 d u
ψ f 1 = 2 k ( x + L b 2 ) π sin [ 1 2 ( β + 3 π 2 ) ]
ψ f 1 = 2 k ( x + L b 2 ) π sin [ 1 2 ( β + 5 π 2 ) ]
ψ f 2 = 2 k ( x + L b 2 ) π sin [ 1 2 ( β + 3 π 2 ) ]
ψ f 2 = 2 k ( x + L b 2 ) π sin [ 1 2 ( β + 5 π 2 ) ]
In Equations (20)–(24), y = 0 , f ( ψ ) is a function containing a Fresnel integral, ψ is a parameter that determines the integral section, ψ f 1 = ψ f 1 , and ψ f 2 = ψ f 2 . Therefore, the following parameters can be used:
1 = f ( ψ f 1 ) = f ( ψ f 1 ) , 2 = f ( ψ f 2 ) = f ( ψ f 2 )
Finally, the complex-valued velocity potential in front of the detached breakwater can be derived as
ϕ = i g ω cosh [ k ( h + z ) ] cosh ( k h ) a i ( 1 + K r ) [ ( 1 1 ) e i k x sin β 2 e i k x sin β ] e i ω t
The complex-valued wave pressure excluding the static pressure in front of the breakwater can be expressed as follows:
p = ρ g cosh [ k ( h + z ) ] cosh ( k h ) a i ( 1 + K r ) [ ( 1 1 ) e i k x sin β 2 e i k x sin β ] e i ω t
The complex-valued wave force per unit length acting on the structure can be calculated by integrating the wave pressure in the z-direction as follows:
F = ρ g h tanh ( k h ) k h a i ( 1 + K r ) [ ( 1 1 ) e i k x sin β 2 e i k x sin β ] e i ω t
Neglecting the diffraction, the complex-valued wave force per unit length, F 0 , of the perpendicularly incident wave can be expressed as follows:
F 0 = ρ g h tanh ( k h ) k h a i ( 1 + K r ) e i ω t
The relative maximum wave force per unit length of the breakwater when the diffracted waves are considered for the case of normal incidence ignoring diffracted waves can be calculated as follows:
| F | | F 0 | = | ( 1 1 ) e i k x sin β 2 e i k x sin β |
The maximum total wave force acting on the entire length of the breakwater can be calculated by integrating Equation (28) in the x-direction as follows:
F max t = | L b 2 L b 2 F d x | = ρ g h L b ( 1 + K r ) a i tanh ( k h ) k h R
where
R = | A + B + C |
A = 1 L b L b 2 L b 2 e i k x sin β d x = sin ( k L b sin β ) k L b sin β
B = 1 L b L b 2 L b 2 1 e i k x sin β d x
C = 1 L b L b 2 L b 2 2 e i k x sin β d x
As explained above, the relative maximum wave force acting on the entire length of the breakwater can be obtained as follows:
F max t F 0 , max t = | L b 2 L b 2 F d x | | L b 2 L b 2 F 0 d x | = R
The definition of the relative wave force in Equation (36) is the same as that for the wave force reduction ratio when the waves are obliquely incident on the long breakwater suggested in reference [7]. This is different from the previous equations because B and C in Equations (34) and (35), which explain the effects of diffracted waves, are included.

3. Results and Discussion

3.1. Maximum Wave Force Per Unit Length

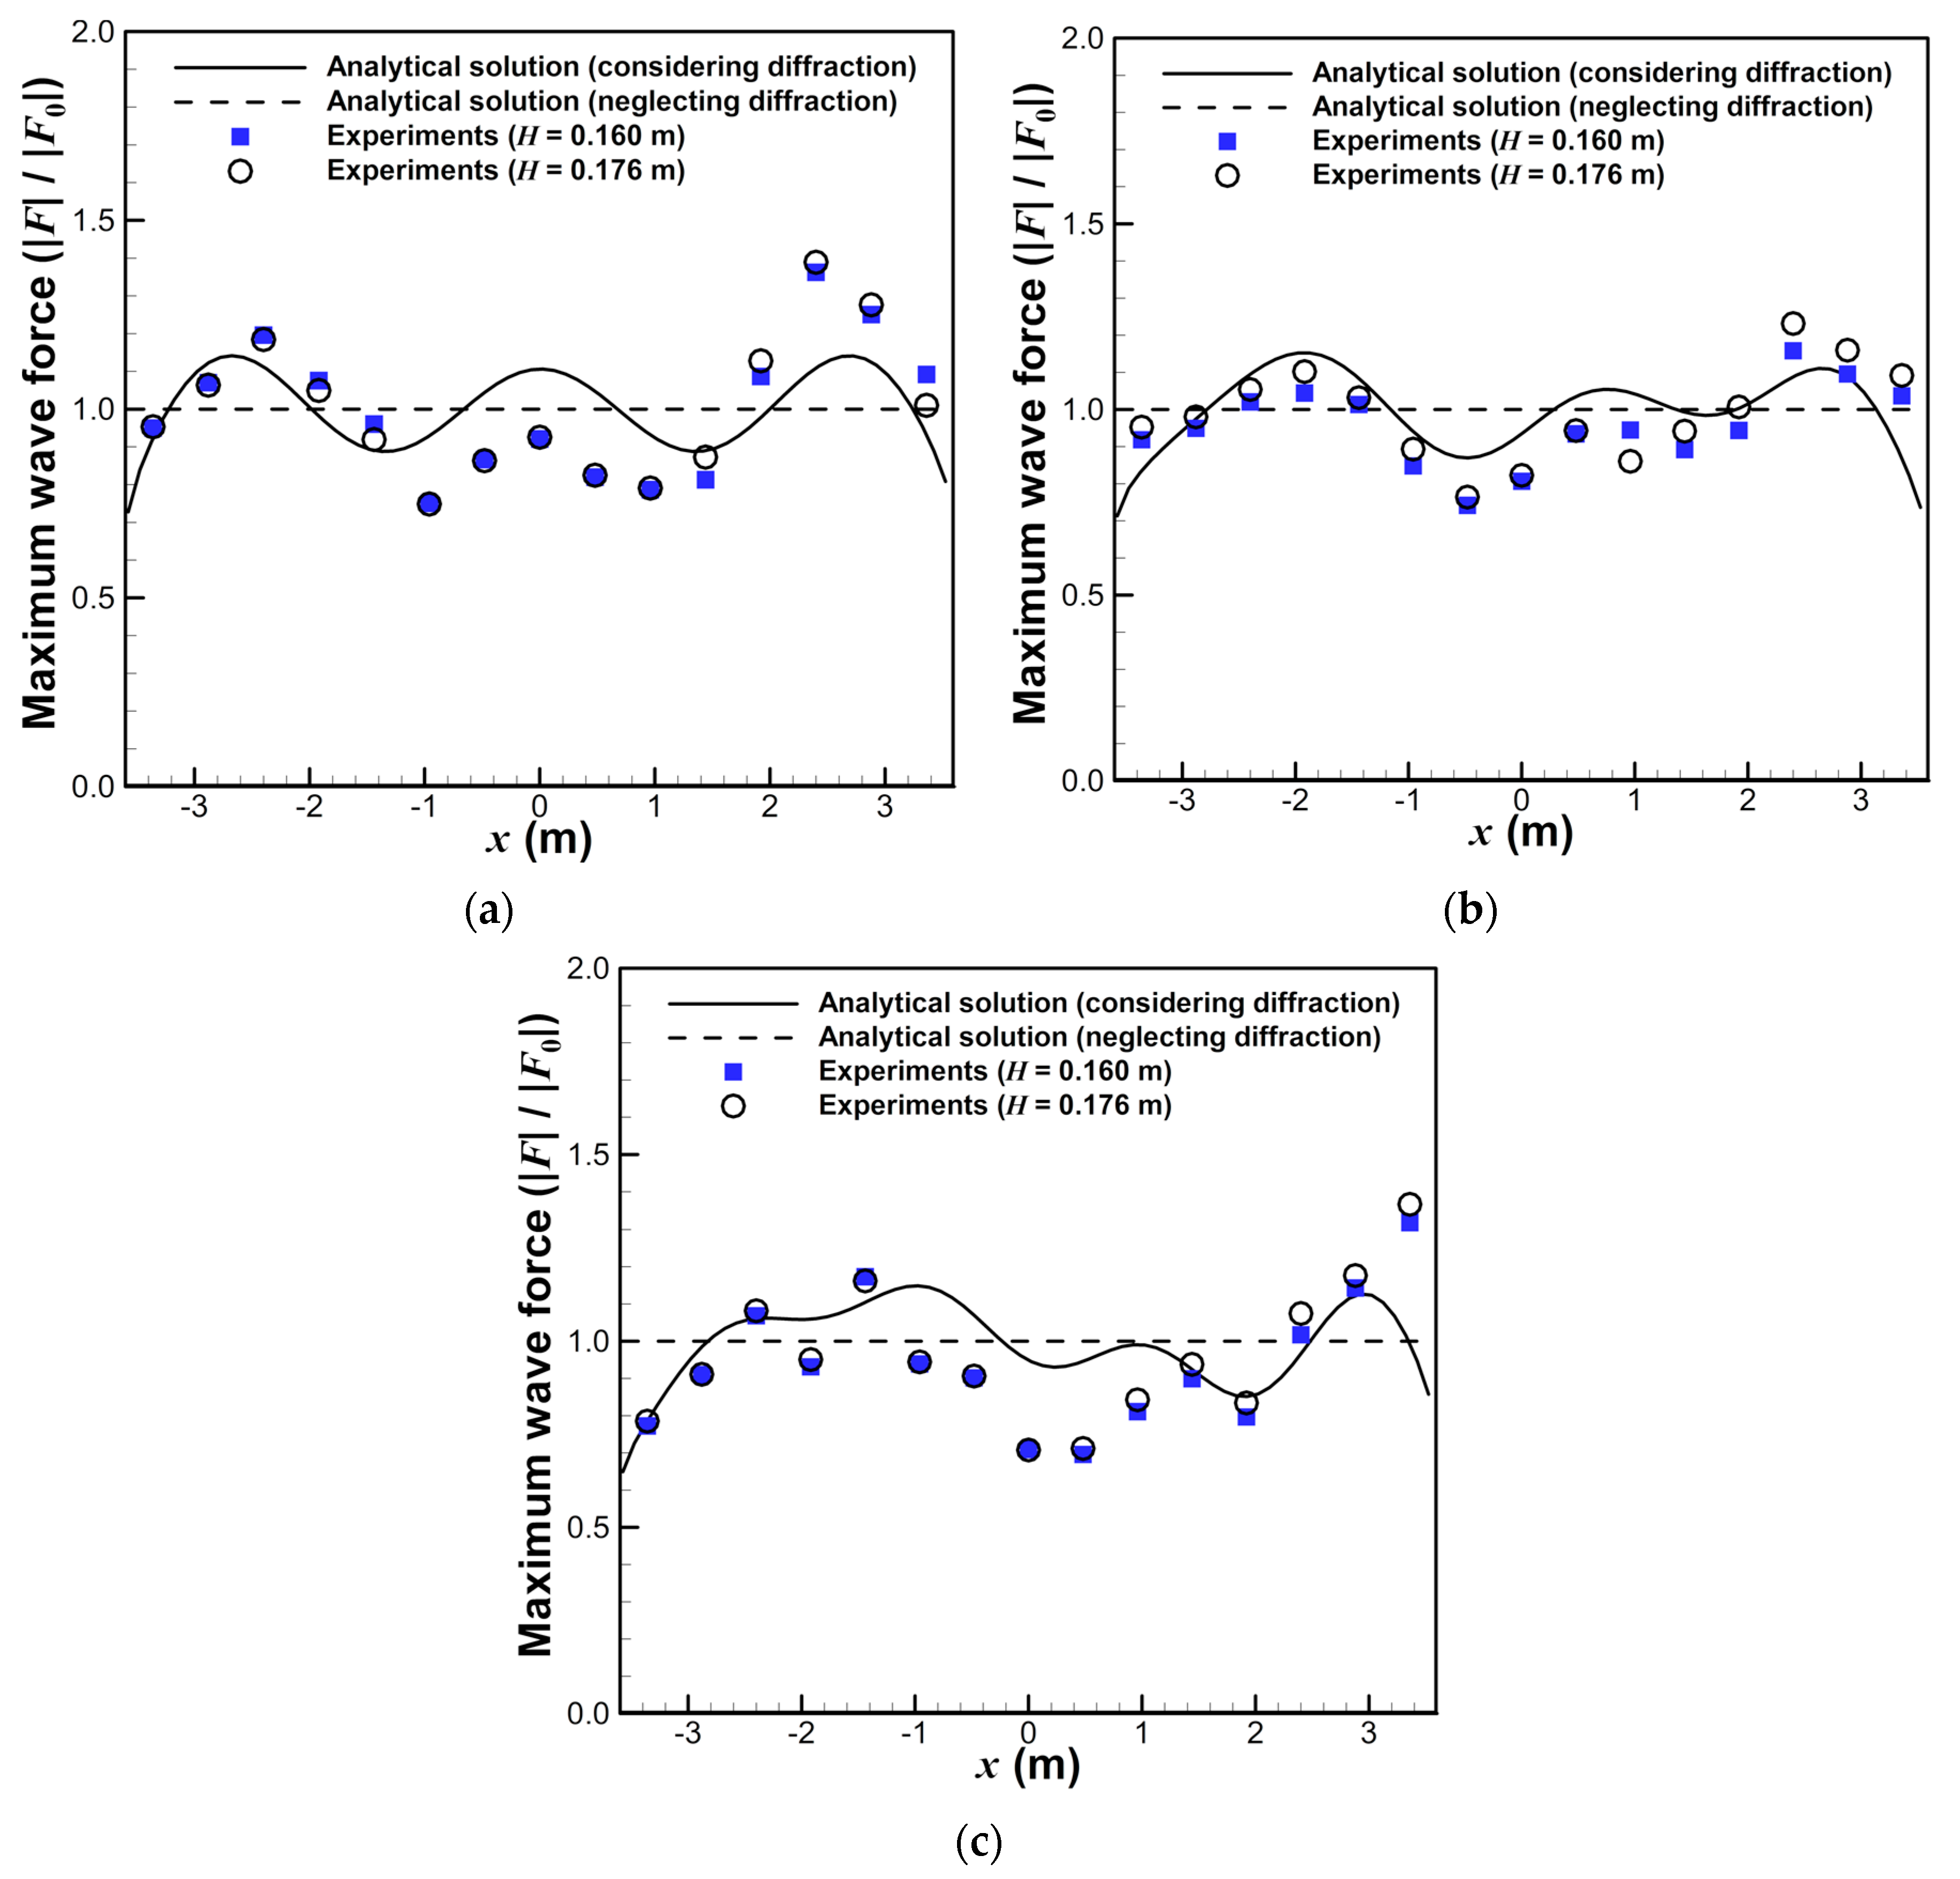
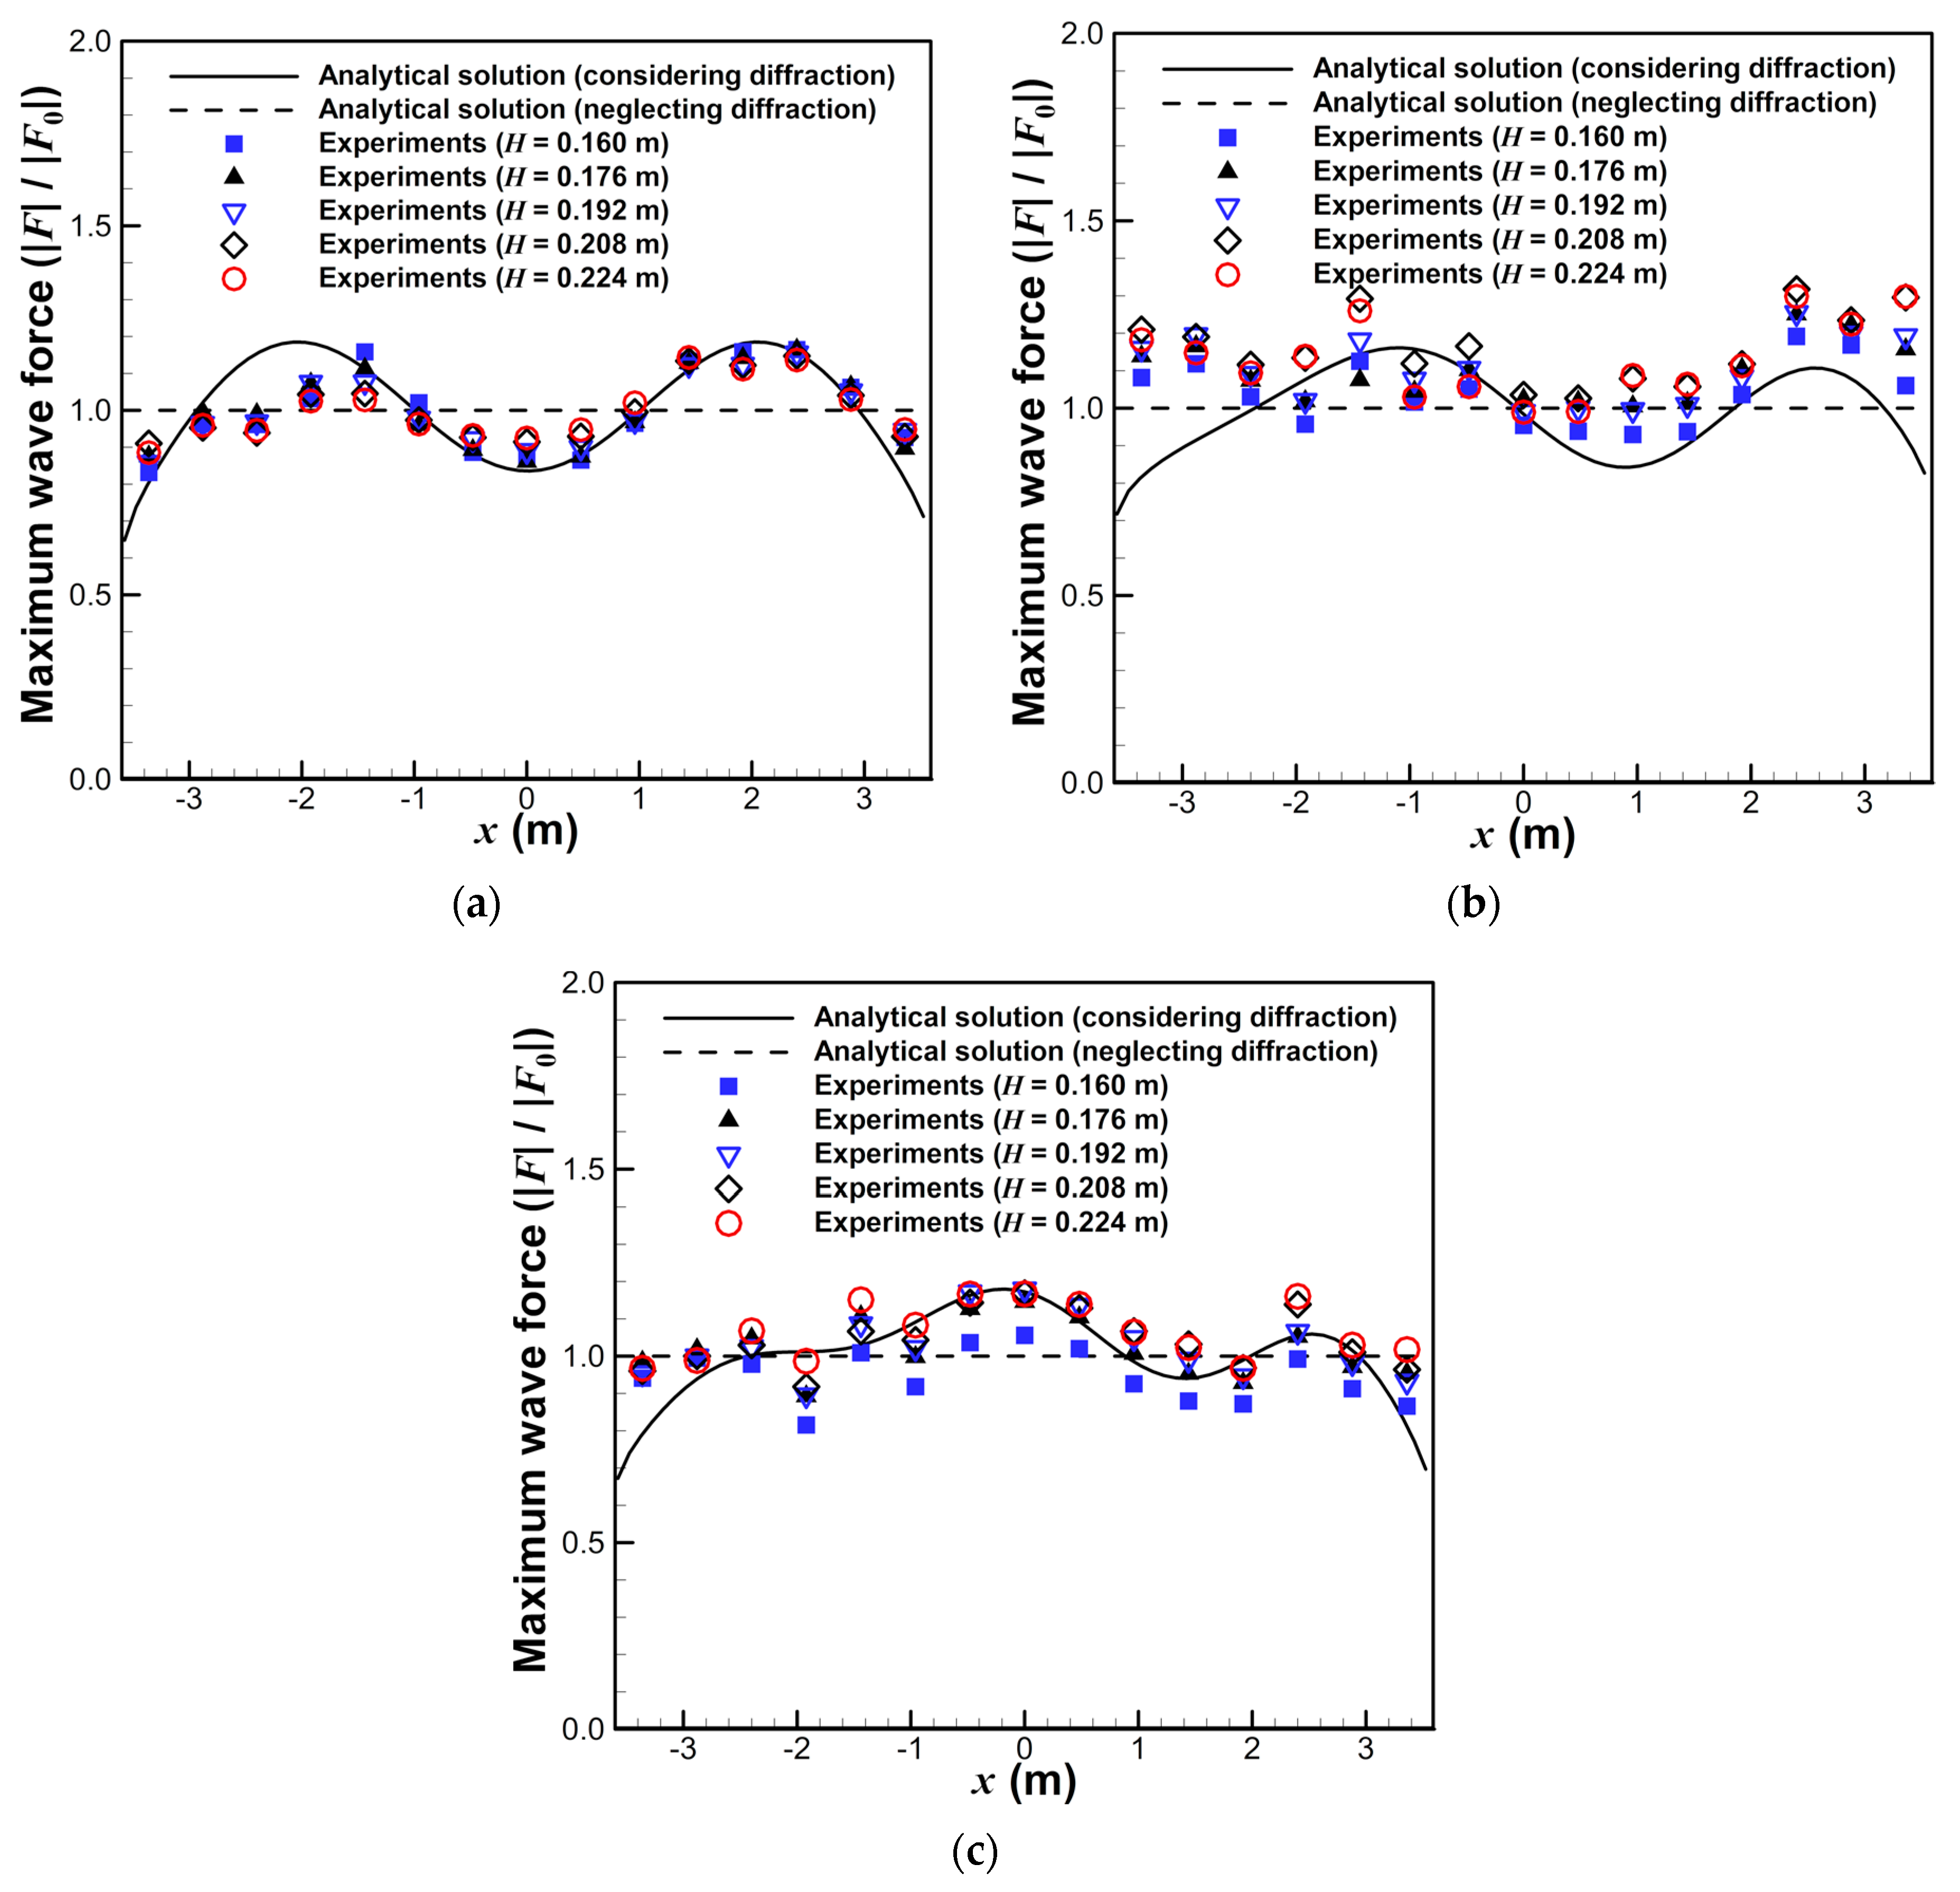
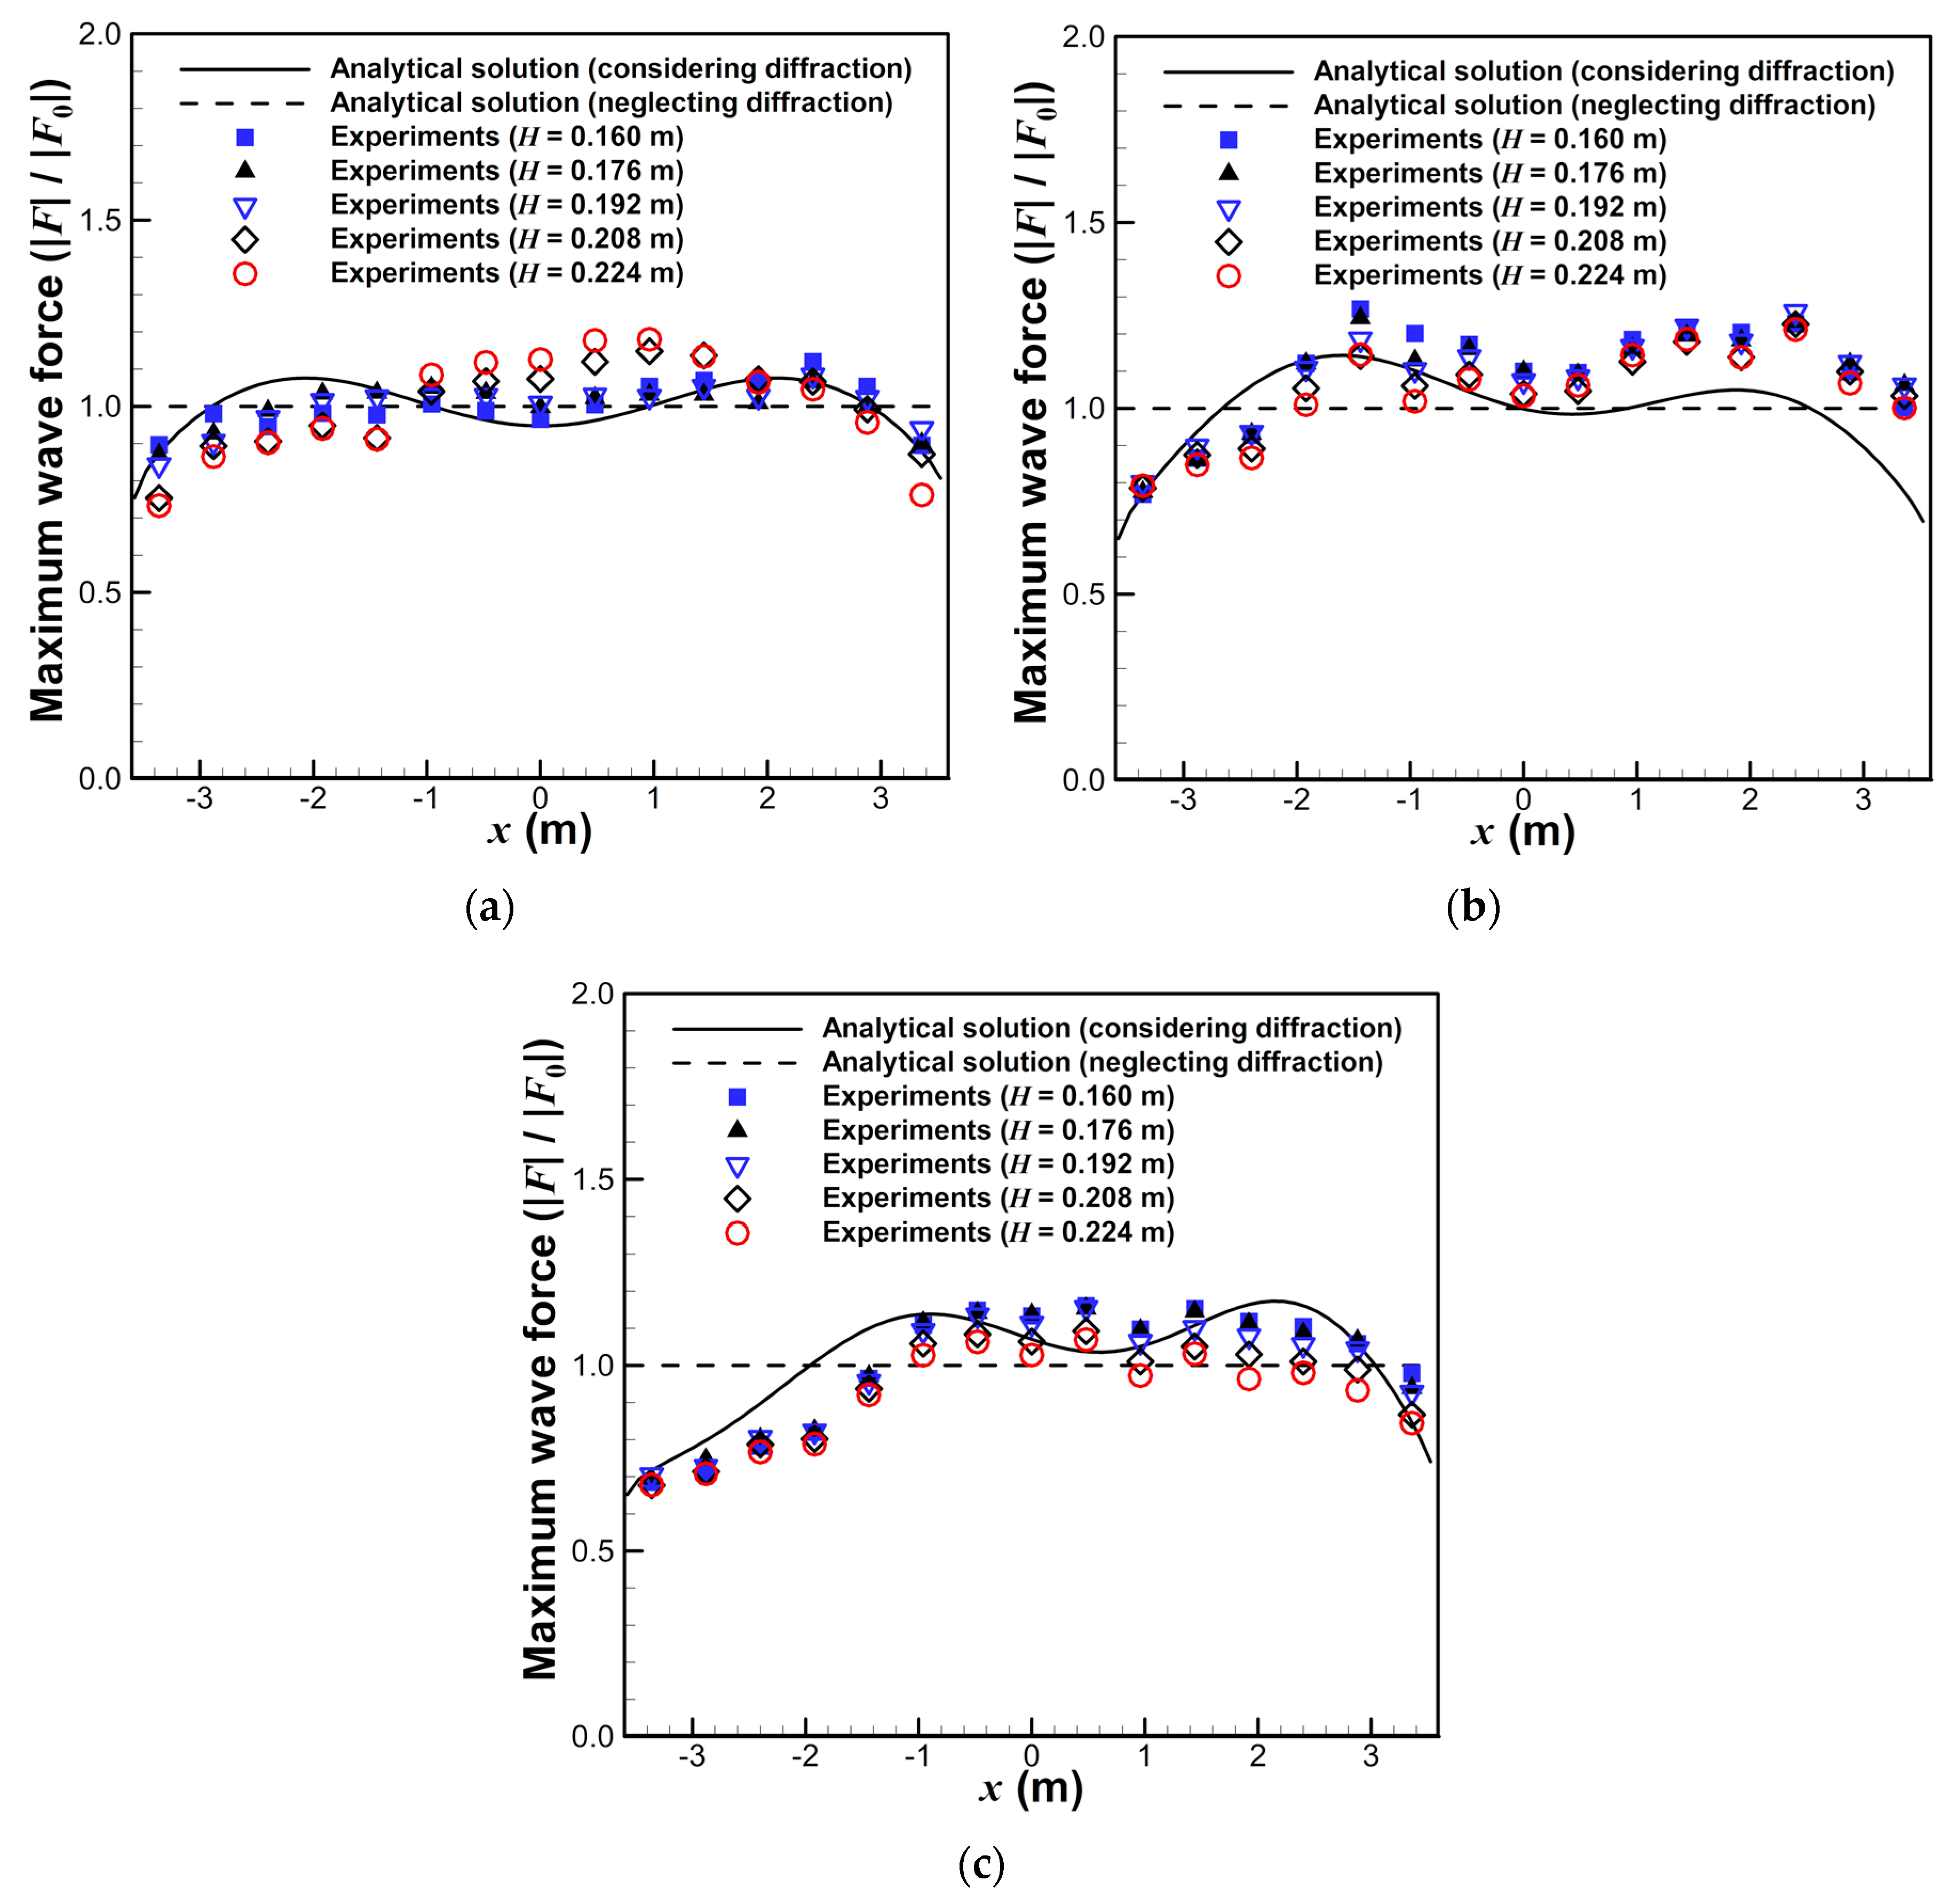
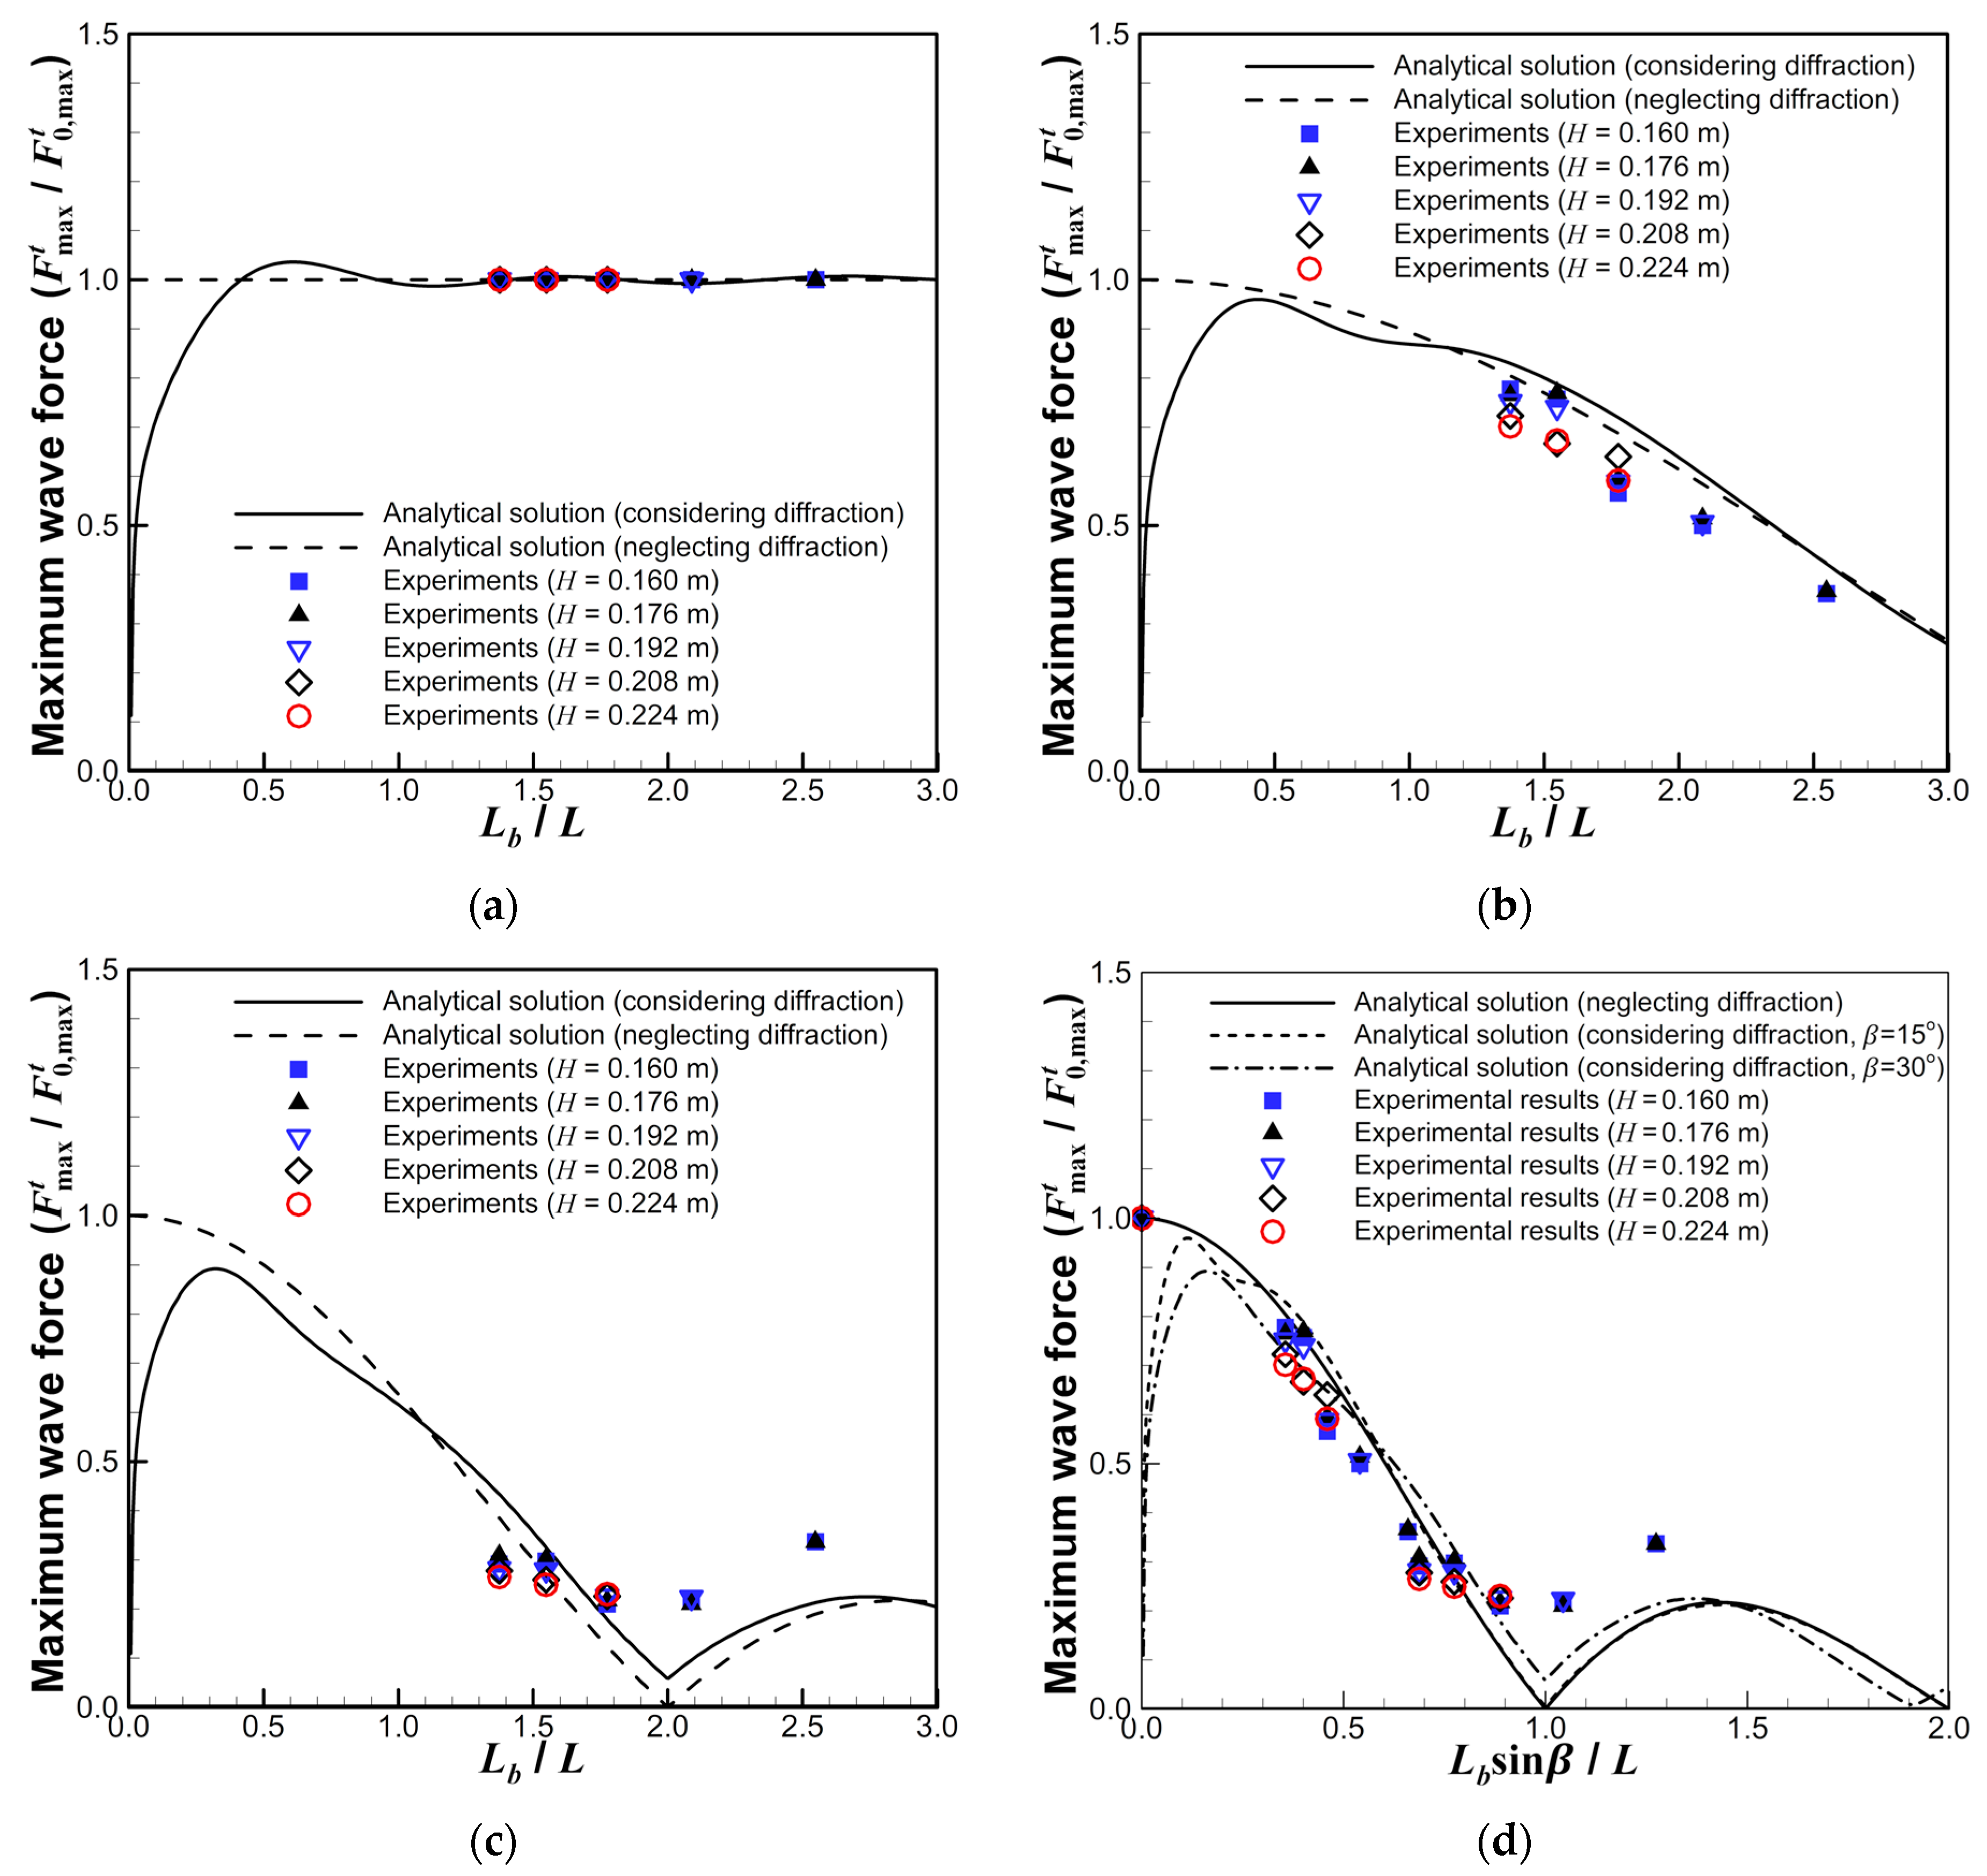
Figure 10, Figure 11 and Figure 12 show plots of the non-dimensionalized maximum wave force per unit length as a function of the x-coordinate distance from the breakwater center with different wave periods and incident angles. To examine the effect of the diffraction wave, the maximum wave force of only the incident and reflected waves was used as a reference. This reference wave force is obtained analytically using Equation (30). The influence of the diffraction wave was removed from the measured wave force in the experimental value by integrating the wave force per unit length (Equations (5) and (6) over the entire breakwater) and dividing it by the breakwater length. The rationale for this can be understood by examining Figure 13a. The figure shows that the total wave force of the detached breakwater analytically obtained under the experimental wave conditions is close to 1.0, which means that it is not significantly affected by the diffraction wave, especially when waves are incident normally to the breakwater.
Figure 10, Figure 11 and Figure 12 also show that the experimental and calculated values of the maximum wave force do not exactly match but have similar trends. In addition, the maximum wave force along the detached breakwater fluctuates in the range of −30% to +50%, and the analytical solution is within the range of −30% to +20%. This result suggests that the maximum wave force acting on the detached breakwater is significantly affected by the diffraction wave. The effect of diffraction waves may not have been considered in the Goda wave pressure formula [17], which is currently used in the design of caisson breakwaters in Korea and Japan. This wave distribution does not appear to be related to the snake-like destruction of the caisson breakwaters reported in Japan [26,27]. In particular, according to the analytical solution, the wave force due to the diffraction wave acting on the inner side acts in the direction opposite to that acting on the outer sea side, and the maximum wave force can be further increased. Therefore, the diffraction effects should be considered, especially for designing conventional detached breakwaters, which are not long structures.
The normal wave incident on the breakwater reveals that the analytical solution is perfectly symmetric, but the experimental results are not. The experimental results likely include certain experimental errors. In general, the reflected waves at the boundary in the wave basin cannot be easily controlled because it is impossible to completely prevent reflection from the absorption layers at the basin boundary [28,29]. Spinneken and Swan [28] observed a contamination of the test area after a short period of time due to the effect of reflections at the boundary of the three-dimensional (3D) wave basin, and Stratigaki et al. [29] argued that the spatial variation of the wave height in the wave basin can be attributed to the development of slightly varying reflections from the wave absorbing beach. In these experiments, the reason for the asymmetry is that the incident wave heights were not constant in the entire extension of the breakwater. From the video taken during the experiment, it was seen that the wave height in the front of the breakwater from the right side was high based on the incident wave direction. Therefore, it can be said that the calculated maximum wave force for each caisson due to the measured wave pressure showed the same trend (Figure 10a, Figure 11a and Figure 12a). As for the cause of the higher wave height on the right side, various factors mentioned above were considered, but in this experiment, the unevenness of the bottom of the basin is expected to have the greatest influence. In other words, it is presumed that the wave was concentrated on the right side of the breakwater due to refraction from the bottom surface, such as a shoal with a mild slope. Nevertheless, the diffraction effects were observed relatively clearly in the experiments. It could be seen that the diffraction wave has a considerable influence on the experimental results, considering that the maximum wave force for each caisson of the breakwater fluctuates significantly along the breakwater and shows a similar trend to the analytical solution. This is based on the linear analytical solution that the maximum wave force acting on each point of the breakwater appears constant except for the components by diffraction waves in Equations (34) and (35). The analytical solution is also based on the linear wave with a small wave height, so it is impossible to accurately simulate the phenomenon at a relatively large wave height as in the experiment. Therefore, to accurately evaluate the effects of diffraction waves on the design wave action, more precise hydraulic experiments and numerical analyses based on non-linear wave theory should be performed.

3.2. Wave Force Acting on the Entire Breakwater

Figure 13a–c shows plots of the dimensionless maximum wave force acting on the entire detached breakwater as a function of the length of the breakwater ( L b ) relative to the incident wavelength ( L ) at incident angles of 0°, 15°, and 30°, respectively. Figure 13d shows a plot of the dimensionless maximum wave force acting on the entire detached breakwater as a function of the projected length of the breakwater to the wave traveling direction ( L b sin β ), relative to the incident wavelength ( L ). To examine the effects of the incident angles and diffraction waves, the maximum wave force induced by only the incident and reflected waves when the normal incident wave was used as a reference. Equation (36) was used to analytically obtain the reference wave force. The maximum wave force, including diffraction effects, was used with the normal incident wave in the breakwater because the influence of the diffraction waves could not be excluded. As mentioned in Section 3.1, this argument is based on the fact that the maximum wave force obtained from the analysis (Figure 13a) is almost 1.0 under experimental conditions.
Figure 13a shows that the maximum wave force acting on the entire detached breakwater is not influenced by diffraction waves even though the maximum wave force per unit length greatly fluctuates with the period of the diffraction wave shown in Figure 10, Figure 11 and Figure 12. On the other hand, the angle of incidence and length of the breakwater are greatly affected. As the angle of incidence increases, it decreases. As the length of the breakwater increases, it increases when the projection length of the breakwater to the wave traveling direction is within one wavelength of the incident wavelength. This result is attributed to the wave pressure along the detached breakwater acting with a phase difference. When the wave is inclined, the maximum wave force acting on each caisson is sequentially applied, and the time difference increases as the incident angle increases. Therefore, the maximum value of the sum of the wave forces acting on each caisson decreases.
This result indicates that a long breakwater can have a lower maximum wave force than a short one, which is important from a design point of view. Particularly, in areas where design wave heights are rising due to climate change, economical and high stability designs can be obtained by elongating the breakwater. Most breakwaters are installed at normal incidence to the predominant waves, so the effect can be considered insignificant. However, the actual storm conditions that affect the stability of breakwaters is not the unidirectional wave condition considered during design, but the multidirectional wave condition, so the wave force reduction effect due to the inclined incidence shown above can take place. This effect is not observed with existing breakwater designs where caissons are independently installed, nor when using interlocking caissons. In particular, with interlocking caissons, when waves with heights greater than those of the design waves are concentrated in a specific caisson, adjacent caissons can share the wave force and withstand it. The elongated structure has high internal stability owing to this effect, which is difficult to consider in the design, but may be the best alternative to withstand waves that vary significantly from the design height due to climate change.

3.3. Stability Against Sliding

To directly evaluate the effects of caisson interlocking, sliding experiments were conducted. For comparison, a detached breakwater with non-interlocked caissons was also tested. The self-weight of each caisson was determined using the Goda wave pressure formula [17] for the design conditions of the W06 wave with a safety factor of 1.0. Table 3 presents the experimental model caisson weights. To measure the sliding distance of the breakwater, three displacement gauges were installed at the bottom of the head caissons (#1, #15) and center caisson (#8). The experimental waves were selected so that the expected wave force sequentially increased among the test waves described in Table 2, and the waves were applied in order until the sliding failure occurred.
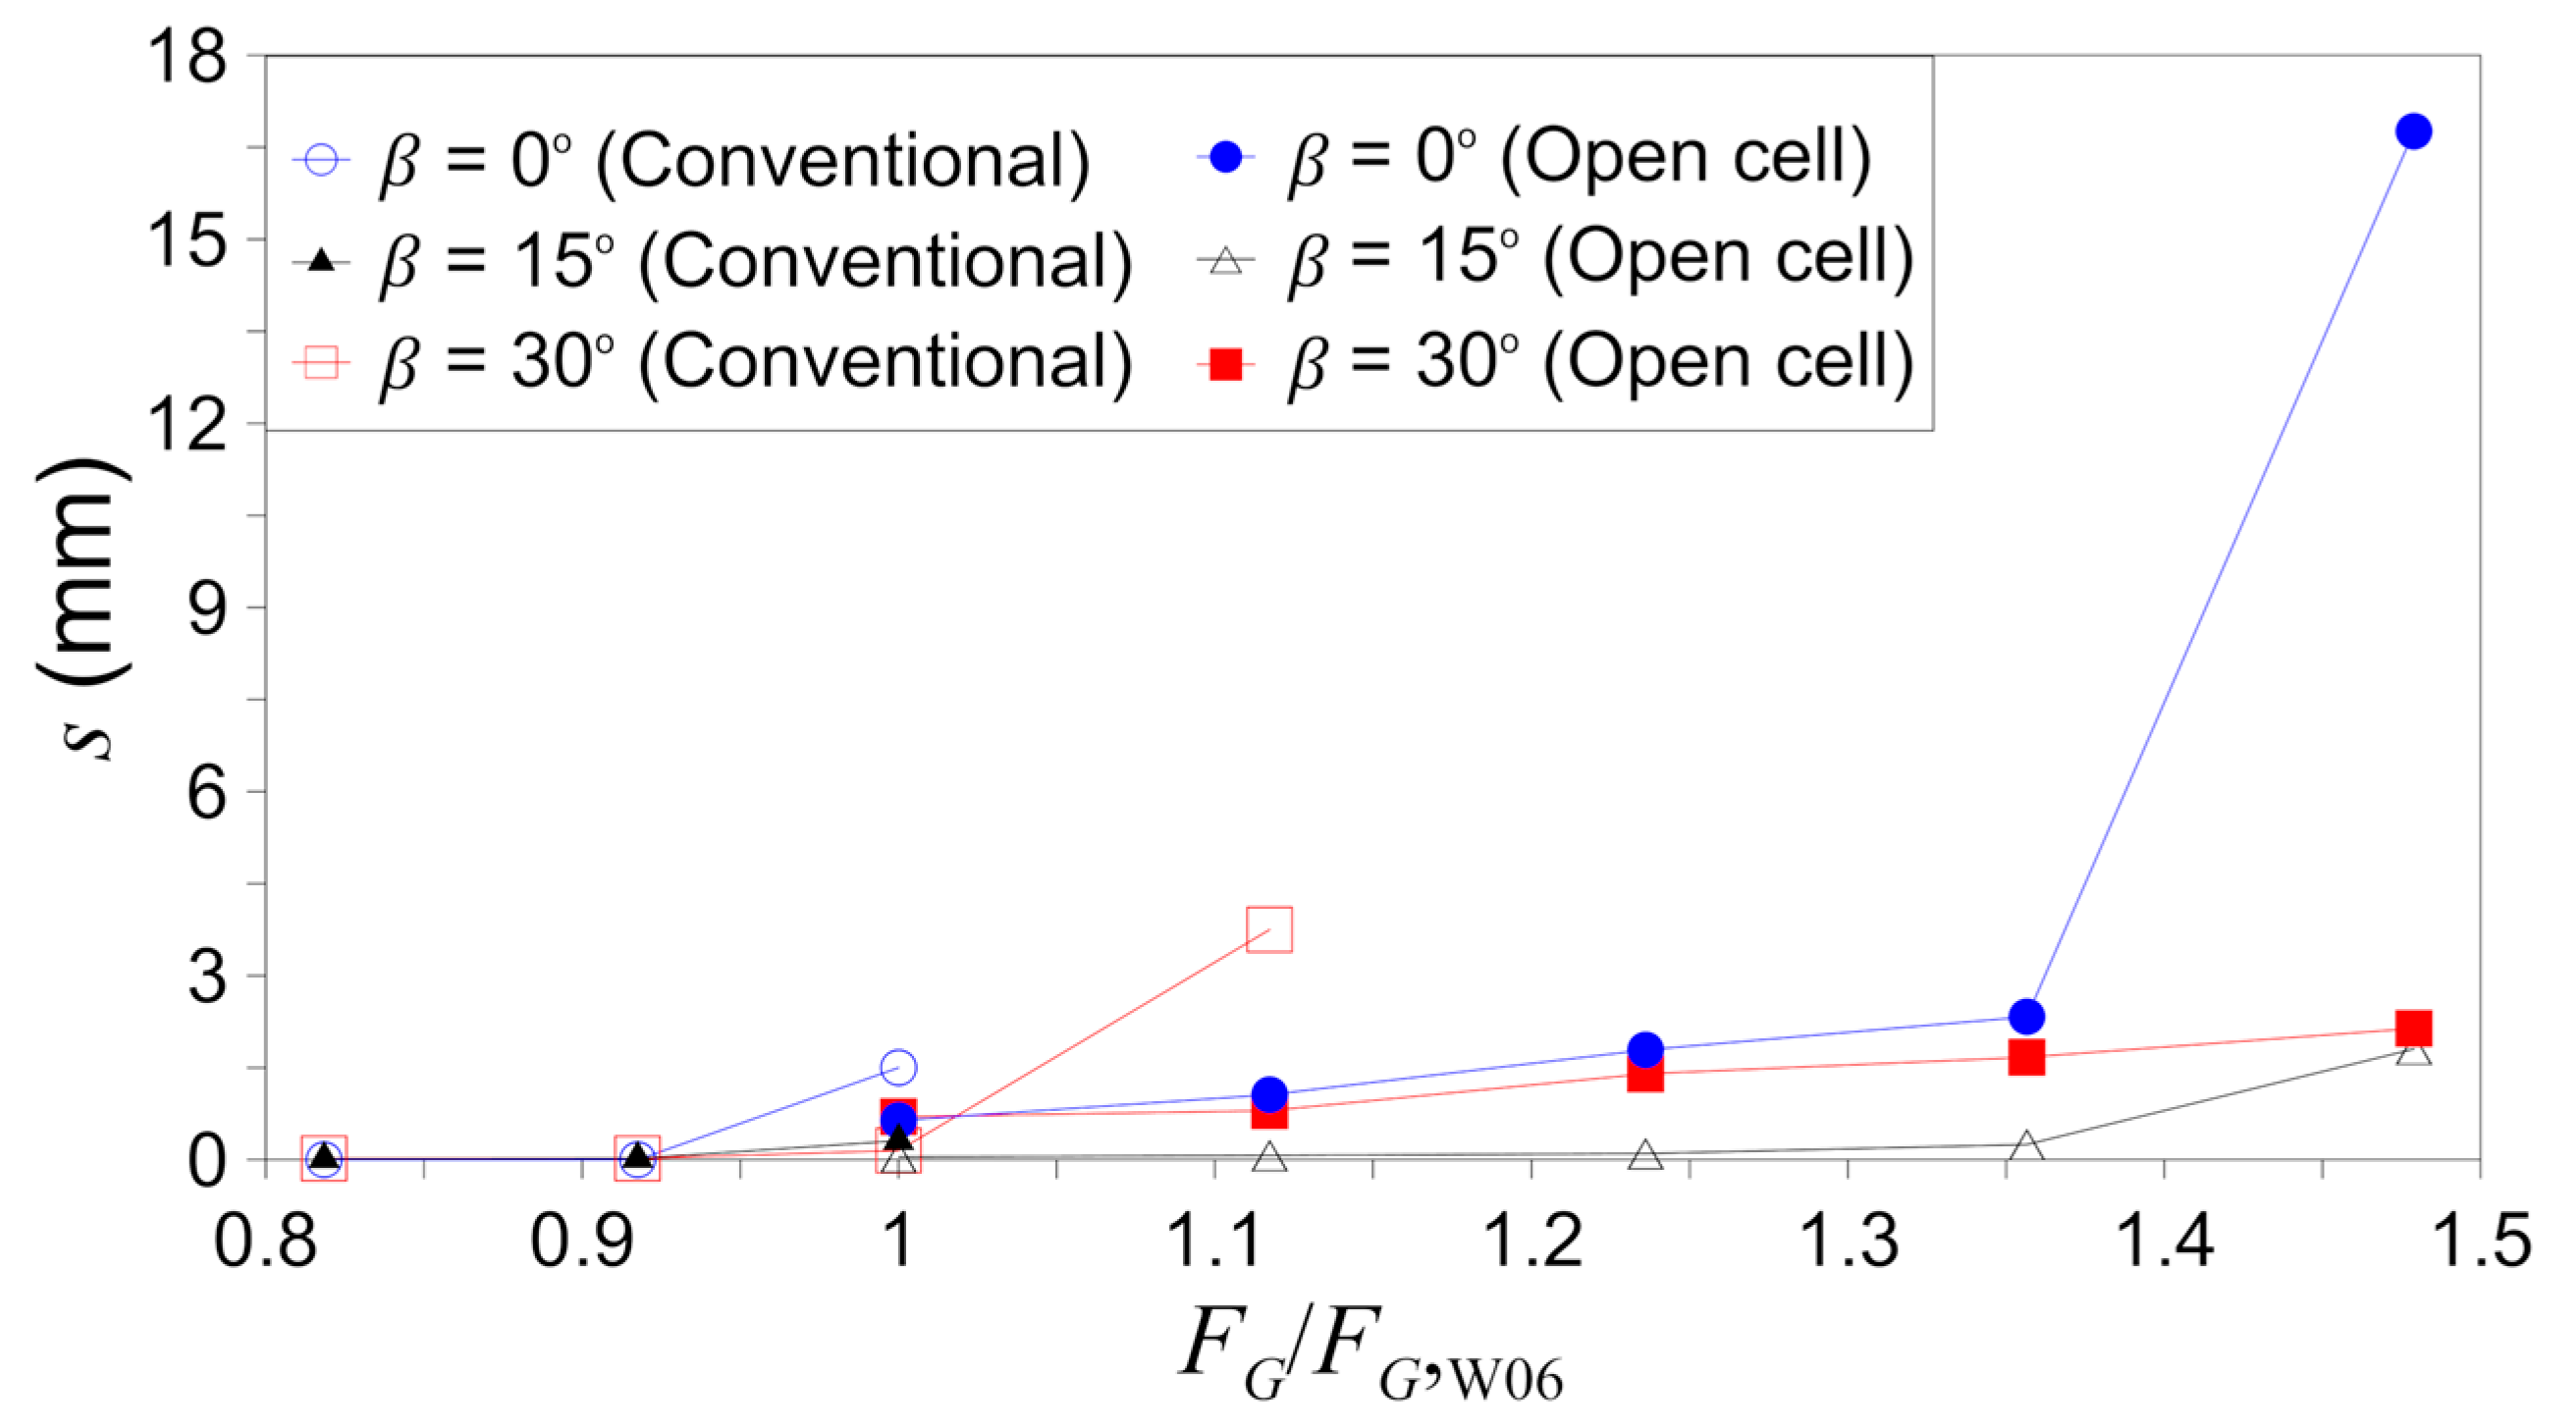
Figure 14 shows the plot of the sliding distance (s) measured from the displacement gauge installed in caisson #8 as a function of the non-dimensional wave force divided by the design wave force (obtained by applying the Goda wave pressure distribution formula [17]). The Figure shows that with the non-interlocked caissons, sliding starts near the design load. Furthermore, with the interlocked open cell caissons, no sliding occurred even for acting loads greater than 35% and 48% in the normal and inclined cases, respectively.
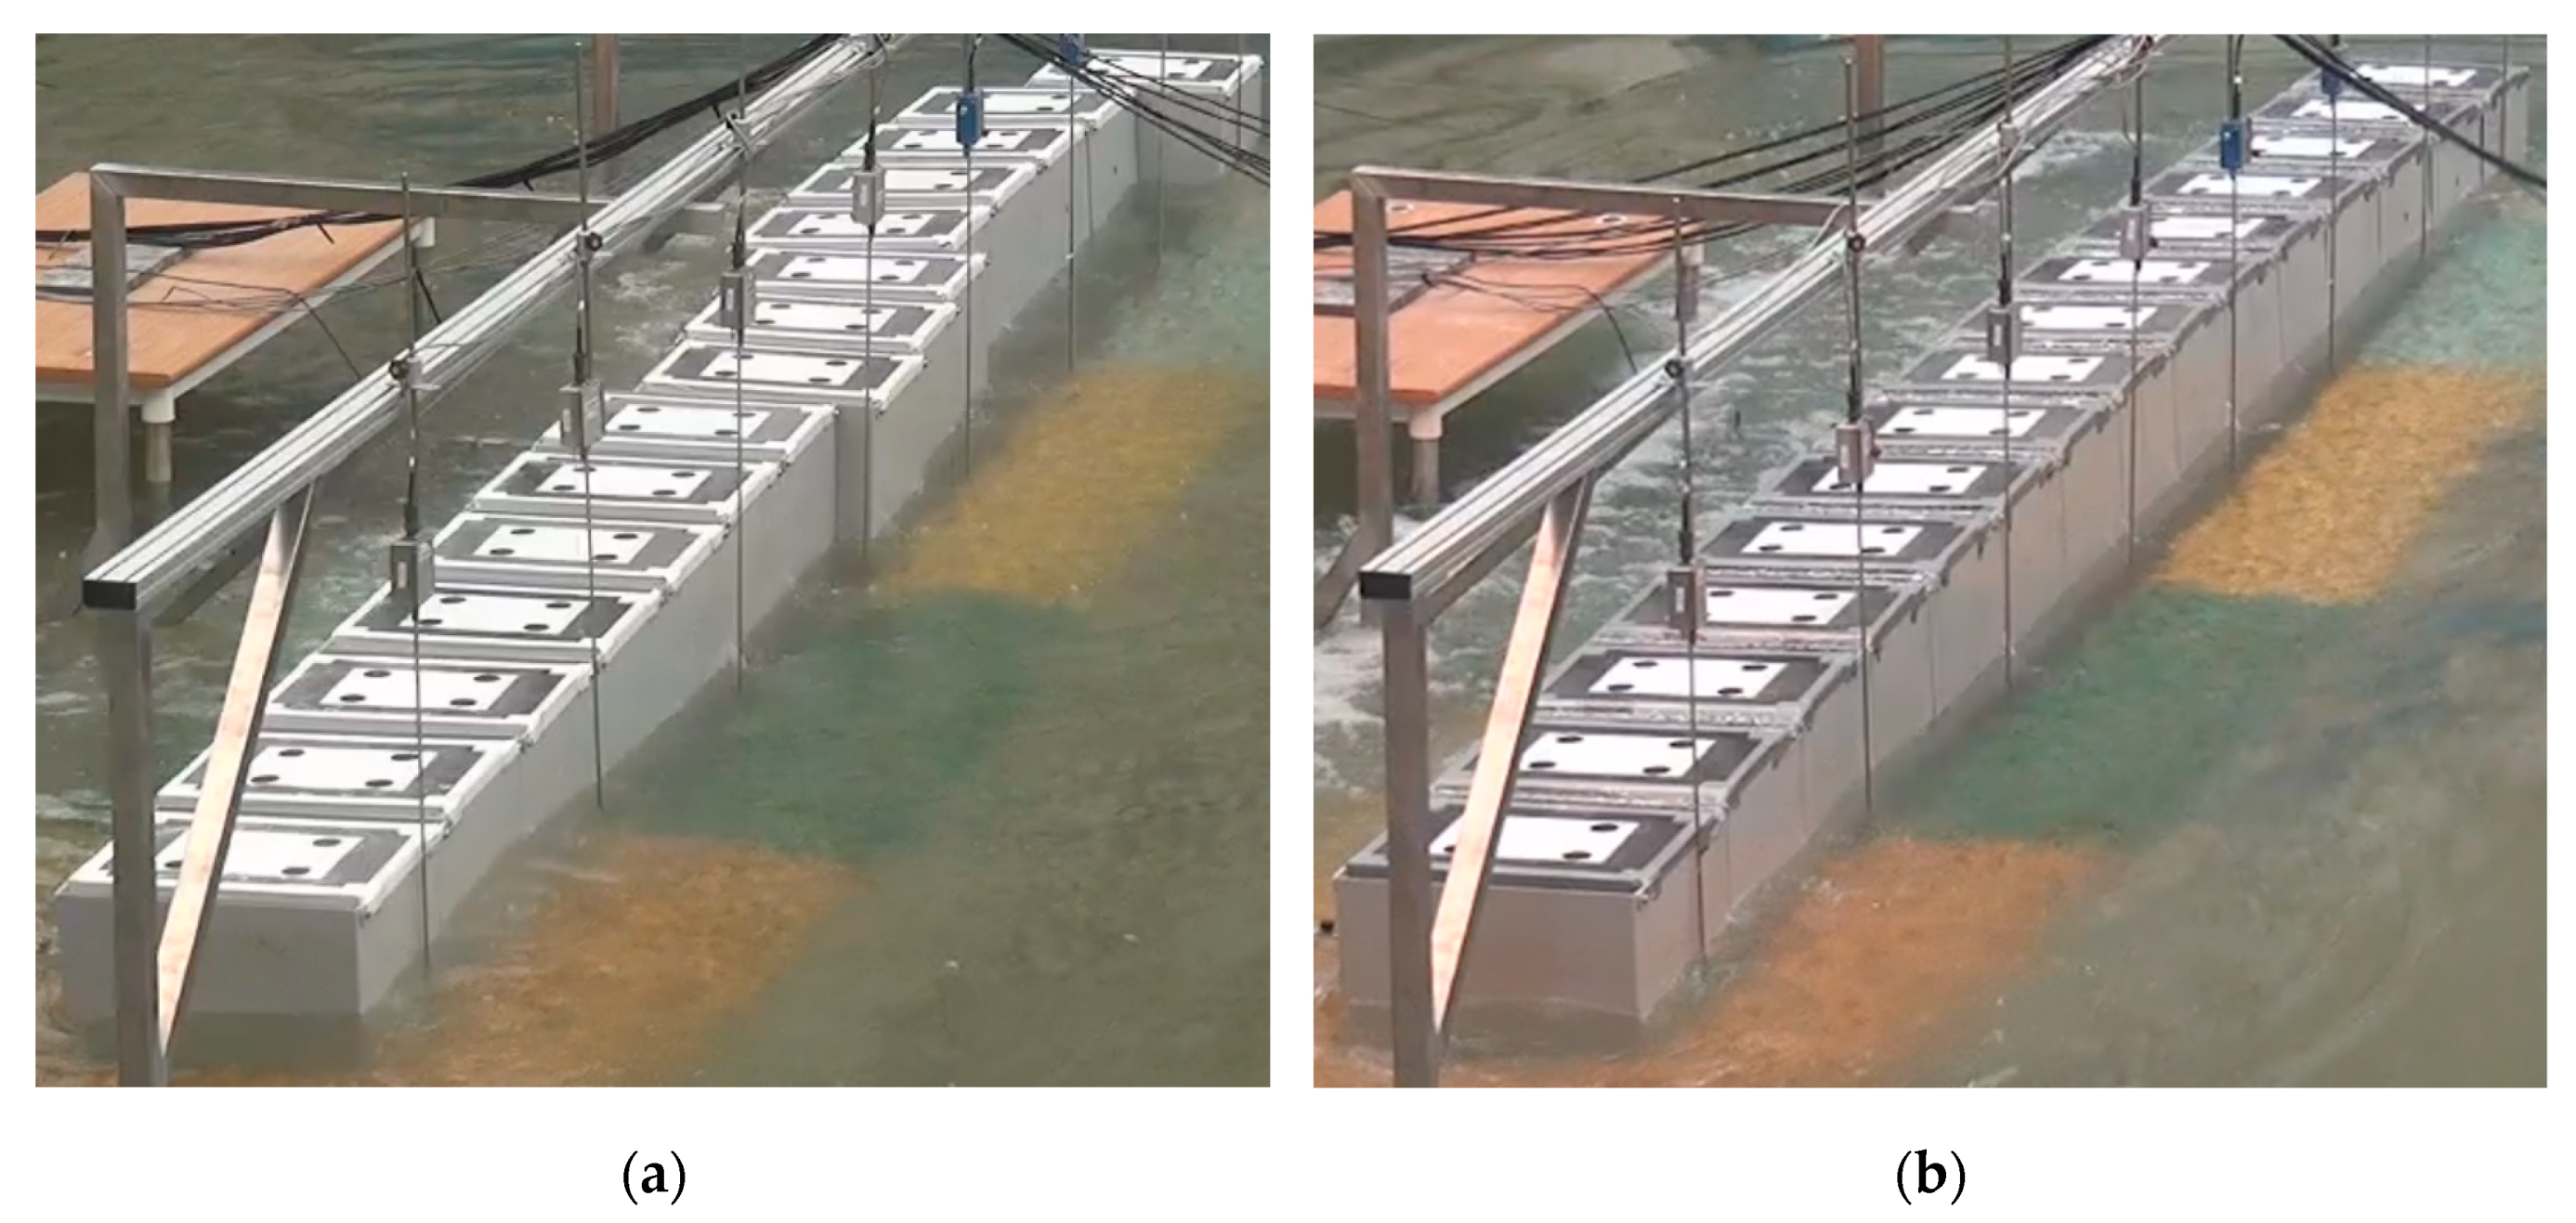
Although the above results are reasonable, they are insufficient to explain the entire pattern of breakwater destruction. The experimental video reveals that the failure behavior has a significant correlation with the maximum wave force distribution for each caisson in the case of a conventional caisson breakwater, as shown in Figure 11, which is not applicable in an open cell caisson breakwater. In the case of a conventional caisson breakwater, the failure proceeded with a maximum wave force distribution and a similar shape, especially for waves that enter normally to the breakwater. When the applied load is 1.1 times that of the design wave, the #13 caisson with the greatest maximum wave force among the 15 caissons was slid first, and it spread to adjacent caissons, leading to the final destruction (Figure 15a). However, for the open cell caisson breakwater, the deformation of the breakwater did not follow the shape of the maximum wave force distribution, even though the incident wave entered normally to the breakwater but proceeded similarly to the deflection shape of a simply supported beam subjected to a distributed load (Figure 15b). Similar tendencies were observed for the oblique incidence.
Interestingly, the interlocking with simple crushed stones led to an increase in stability by more than 35% even in the case of the normal incidence condition where no reduction effect of the maximum wave force due to the phase difference of wave pressure can be expected. This result was not observed in conventional caissons and was induced by the increase in frictional force due to the crushed stones in the open cells facing each other and the weight of the head caisson, which is 1.5 times greater than that of the trunk caisson.
Furthermore, with the open cell caisson, the breakwater deformation occurred around the caisson when a load greater than the design load of the individual caisson was concentrated in a particular caisson before the sliding failure occurred. This deformation occurred because the crushed stones that filled in the open cells have voids. Therefore, when a large load was applied, the crushed stones located at the sea side were compressed and deformed in the longitudinal direction of the breakwater. Filling the voids with sufficiently compacted crushed stones or low-flow mortar may suppress deformation.

4. Conclusions

In this study, the wave force characteristics and stability of detached breakwaters based on open cell caissons were investigated through hydraulic experiments in a wave basin and analytical solutions. The main results are summarized as follows:
  • The wave force acting on the open cell caisson breakwater decreased as the relative length of the breakwater and incident wave angle increased. The reduced force ratio was 0.210 when the relative length of the breakwater ( L b sin β / L ) was 0.887. These results demonstrate the effectiveness of the force reduction of open cell caisson breakwaters. In some cases, the relative wave force exceeded 1.0 due to diffraction, and the analytical solution predicted this phenomenon well. Moreover, the diffraction effects were considerable for the conventional caisson breakwater but negligible for the long-detached breakwater ( L b sin β / L > 0.2 ) involving open cell caissons.
  • When the incident wave was obliquely propagated along the long structure, the acting wave force was reduced, owing to the phase difference of the wave pressures. The open cell caisson breakwater was more stable than the conventional one for oblique and normal incident waves. Specifically, at an incident wave angle of 0° (normal incidence), the open cell caisson breakwater could withstand a relative wave force 35% higher than that tolerated by the conventional caisson breakwater, owing to the frictional resistance force induced by the crushed stones in two open cells facing each other.
  • The structures based on open cell caissons could experience excessive deformations before the sliding failure occurred. To prevent this, the deformation of the crushed stones filled in the open cells should be controlled by compacting the crushed stones or by using low-flow mortar to reduce the void.
The results of this study were derived through hydraulic experiments on limited regular waves. Thus, they should be verified and supplemented through more experimental studies in the future. In particular, experiments using irregular waves should be conducted, and a more practical review is needed from a design point of view. Although the results obtained in this study can be used for actual design purposes, it is not easy to implement them practically, owing to the lack of design standards for long structures and the concerns of safety-conscious engineers. This is specifically observed in highly competitive turnkey projects being implemented in Korea. Thus, for utilizing the findings of this study in designing breakwater structures, it is necessary to prepare related design standards and guidelines for harbor engineers to follow.

Author Contributions

Conceptualization, W.-S.P.; methodology, B.W.L., J.-S.J., and W.-S.P.; validation, B.W.L. and J.-S.J.; formal analysis, B.W.L. and J.-S.J.; investigation, J.-S.Y.; data curation, J.-S.Y.; writing—original draft preparation, B.W.L. and J.-S.J.; writing—review and editing, W.-S.P.; visualization, B.W.L., J.-S.J., and J.-S.Y. All authors have read and agreed to the published version of the manuscript.

Funding

This research was a part of the projects titled “Development of Design Technologies for Interlocking Caisson Breakwaters Using Fillers (2017),” funded by the Ministry of Oceans and Fisheries (MOF), Korea (project No. 20160147), and “Development of application technologies for ocean energy and harbour and offshore structures,” funded by the Korea Institute of Ocean Science and Technology (KIOST), Korea (project No. PE99831).

Conflicts of Interest

The authors declare no conflict of interest.

References

  1. The Intergovernmental Panel on Climate Change (IPCC). Global Warming of 1.5 °C; Intergovernmental Panel on Climate Change (IPCC): Geneva, Switzerland, 2019.
  2. Yamada, Y.; Satoh, M.; Sugi, M.; Kodama, C.; Noda, A.T.; Nakano, M.; Nasuno, T. Response of tropical cyclone activity and structure to global warming in a high-resolution global nonhydrostatic model. J. Clim. 2017, 30, 9703–9724. [Google Scholar] [CrossRef]
  3. Cha, E.J.; Knutson, T.R.; Lee, T.C.; Ying, M.; Nakaegawa, T. Third assessment on impacts of climate change on tropical cyclones in the typhoon committee region–Part II: Future projections. Trop. Cyclone Res. Rev. 2020, 9, 75–86. [Google Scholar] [CrossRef]
  4. Park, W.S.; Seo, J.; Won, D.; Lee, B.W. Stability assessment formulas for an interlocking caisson breakwater under oblique wave conditions. J. Coastal Res. 2018, 85, 1236–1240. [Google Scholar] [CrossRef]
  5. DY Engineering. Report of the Working Design Project of Seogwipo Port for the Construction to Repair Damage Caused by the Typhoon; Jeju Special Self-Governing Province: Jeju-do, Korea, 2013. (In Korean) [Google Scholar]
  6. Trӕtteberg, A. The effects of wave crests on wave forces. In Proceedings of the 11th Conference on Coastal Engineering, London, UK, September 1968; pp. 934–939. [Google Scholar]
  7. Battjes, J.A. Effects of short-crestedness on wave loads on long structures. Appl. Ocean Res. 1982, 4, 165–172. [Google Scholar] [CrossRef]
  8. Takahashi, S.; Shimosako, K. Reduction of Wave Force on a Long Caisson of Vertical Breakwater and Its Stability; Technical Notes No. 685 of Port and Harbour Research Institute; Harbour Research Institute: Nagase, Yokosuka, Japan, 1990; pp. 1–20. (In Japanese)
  9. Burcharth, H.F.; Liu, Z. Force Reduction of Short-Crested Non-Breaking Waves on Caissons; Final Report of Mast III Project PROVERBS (PRObabilistic Design Tools for VERtical BreakwaterS); Technical University of Braunschweig: Braunschweig, Germany, 1999; Volume IIa, Chapter 4.3; pp. 1–26. [Google Scholar]
  10. Mares-Nasarre, P.; van Gent, M.R.A. Oblique wave attack on rubble mound breakwater crest walls of finite length. Water 2020, 12, 353. [Google Scholar] [CrossRef] [Green Version]
  11. Jung, J.S.; Lee, C.; Cho, Y.S. Prediction of wave force on a long structure of semi-infinite breakwater type considering diffraction. J. Korean Soc. Coast. Ocean Eng. 2015, 27, 424–433. (In Korean) [Google Scholar] [CrossRef]
  12. Jung, J.S.; Lee, C.; Cho, Y.S. Distribution of wave forces at points on a vertical structure of semi-infinite breakwater considering diffraction. J. Korean Soc. Coast. Ocean Eng. 2016, 28, 240–249. (In Korean) [Google Scholar] [CrossRef] [Green Version]
  13. Jung, J.S.; Lee, C. Spatial variation of wave forces along a semi-infinite breakwater due to wave diffraction. In Proceedings of the Conference of Korean Association of Ocean Science Technology Society, Busan, Korea, 22–23 July 2020; p. 683. (In Korean). [Google Scholar]
  14. Kim, B.H.; Park, W.S.; Lee, J.W.; Jung, J.S. Making long caisson breakwater using interlocking system. Mag. Korean Soc. Civ. Eng. 2010, 58, 65–72. (In Korean) [Google Scholar]
  15. Seo, J.H.; Yi, J.H.; Park, W.S.; Won, D.H. Dispersion characteristics of wave forces on interlocking caisson breakwaters by cross cables. J. Korean Soc. Coast. Ocean Eng. 2015, 27, 315–323. (In Korean) [Google Scholar] [CrossRef]
  16. Park, W.S.; Won, D.; Seo, J.; Lee, B.W. Proposal of rotating stability assessment formula for an interlocking caisson breakwater subjected to wave forces. J. Korean Soc. Coast. Ocean Eng. 2020, 32, 11–16. (In Korean) [Google Scholar] [CrossRef] [Green Version]
  17. Goda, Y. Random seas and design of maritime structures. In Advanced Series on Ocean Engineering, 3rd ed.; World Scientific: Singapore, 2010; Volume 33. [Google Scholar]
  18. Ministry of Oceans and Fisheries (MOF). KC CODE KDS 64 45 20; Ministry of Oceans and Fisheries: Sejong-si, Korea, 2017. (In Korean)
  19. U.S. Army Corps of Engineers. Coastal Engineering Manual (CEM), Engineer Manual 1110-2-1100; U.S. Army Corps of Engineers: Washington, DC, USA, 2002.
  20. Cuomo, G.; Allsop, W.; Bruce, T.; Pearson, J. Breaking wave loads at vertical seawalls and breakwaters. Coast. Eng. 2010, 57, 424–439. [Google Scholar] [CrossRef] [Green Version]
  21. Facci, A.L.; Falcucci, G.; Agresta, A.; Biscarini, C.; Jannelli, E.; Ubertini, S. Fluid structure interaction of buoyant bodies with free surface flows: Computational modelling and experimental validation. Water 2019, 11, 1048. [Google Scholar] [CrossRef] [Green Version]
  22. Stagonas, D.; Ravindar, R.; Sriram, V.; Schimmels, S. Experimental evidence of the influence of recurves on wave loads at vertical seawalls. Water 2020, 12, 889. [Google Scholar] [CrossRef] [Green Version]
  23. Lee, B.W.; Seo, J.; Park, W.-S.; Won, D. A hydraulic experimental study of a movable barrier on a revetment to block wave overtopping. Appl. Sci. 2020, 10, 89. [Google Scholar] [CrossRef] [Green Version]
  24. Penney, W.G.; Price, A.T. The diffraction theory of sea waves by breakwaters and the shelter afforded by breakwaters. Philos. Trans. R. Soc. Lond. A 1952, 244, 236–253. [Google Scholar]
  25. Kim, H.; Do, K.D.; Suh, K.D. Scattering of obliquely incident water waves by partially reflecting non-transmitting breakwaters. Ocean Eng. 2011, 38, 148–158. [Google Scholar] [CrossRef]
  26. Hattori, C.; Shibata, K.; Ohori, K. Disasters of Breakwaters by Wave Action (Part 3); Technical Notes of Port and Harbour Research Institute; Harbour Research Institute: Kanagawa, Japan, 1984; p. 485. (In Japanese)
  27. Miyai, S.; Ohira, K.; Shiomi, M. Disasters of Breakwaters by Wave Action (Part 4); Technical Notes of Port and Harbour Research Institute; Harbour Research Institute: Kanagawa, Japan, 1993; p. 765. (In Japanese)
  28. Spinneken, J.; Swan, C. The operation of a 3D wave basin in force control. Ocean Eng. 2012, 55, 88–100. [Google Scholar] [CrossRef] [Green Version]
  29. Stratigaki, V.; Troch, P.; Stallard, T.; Forehand, D.; Kofoed, J.P.; Folley, M.; Benoit, M.; Babarit, A.; Kirkegaard, J. Wave basin experiments with large wave energy converter arrays to study interactions between the converters and effects on other users in the sea and coastal area. Energies 2014, 7, 701–734. [Google Scholar] [CrossRef]
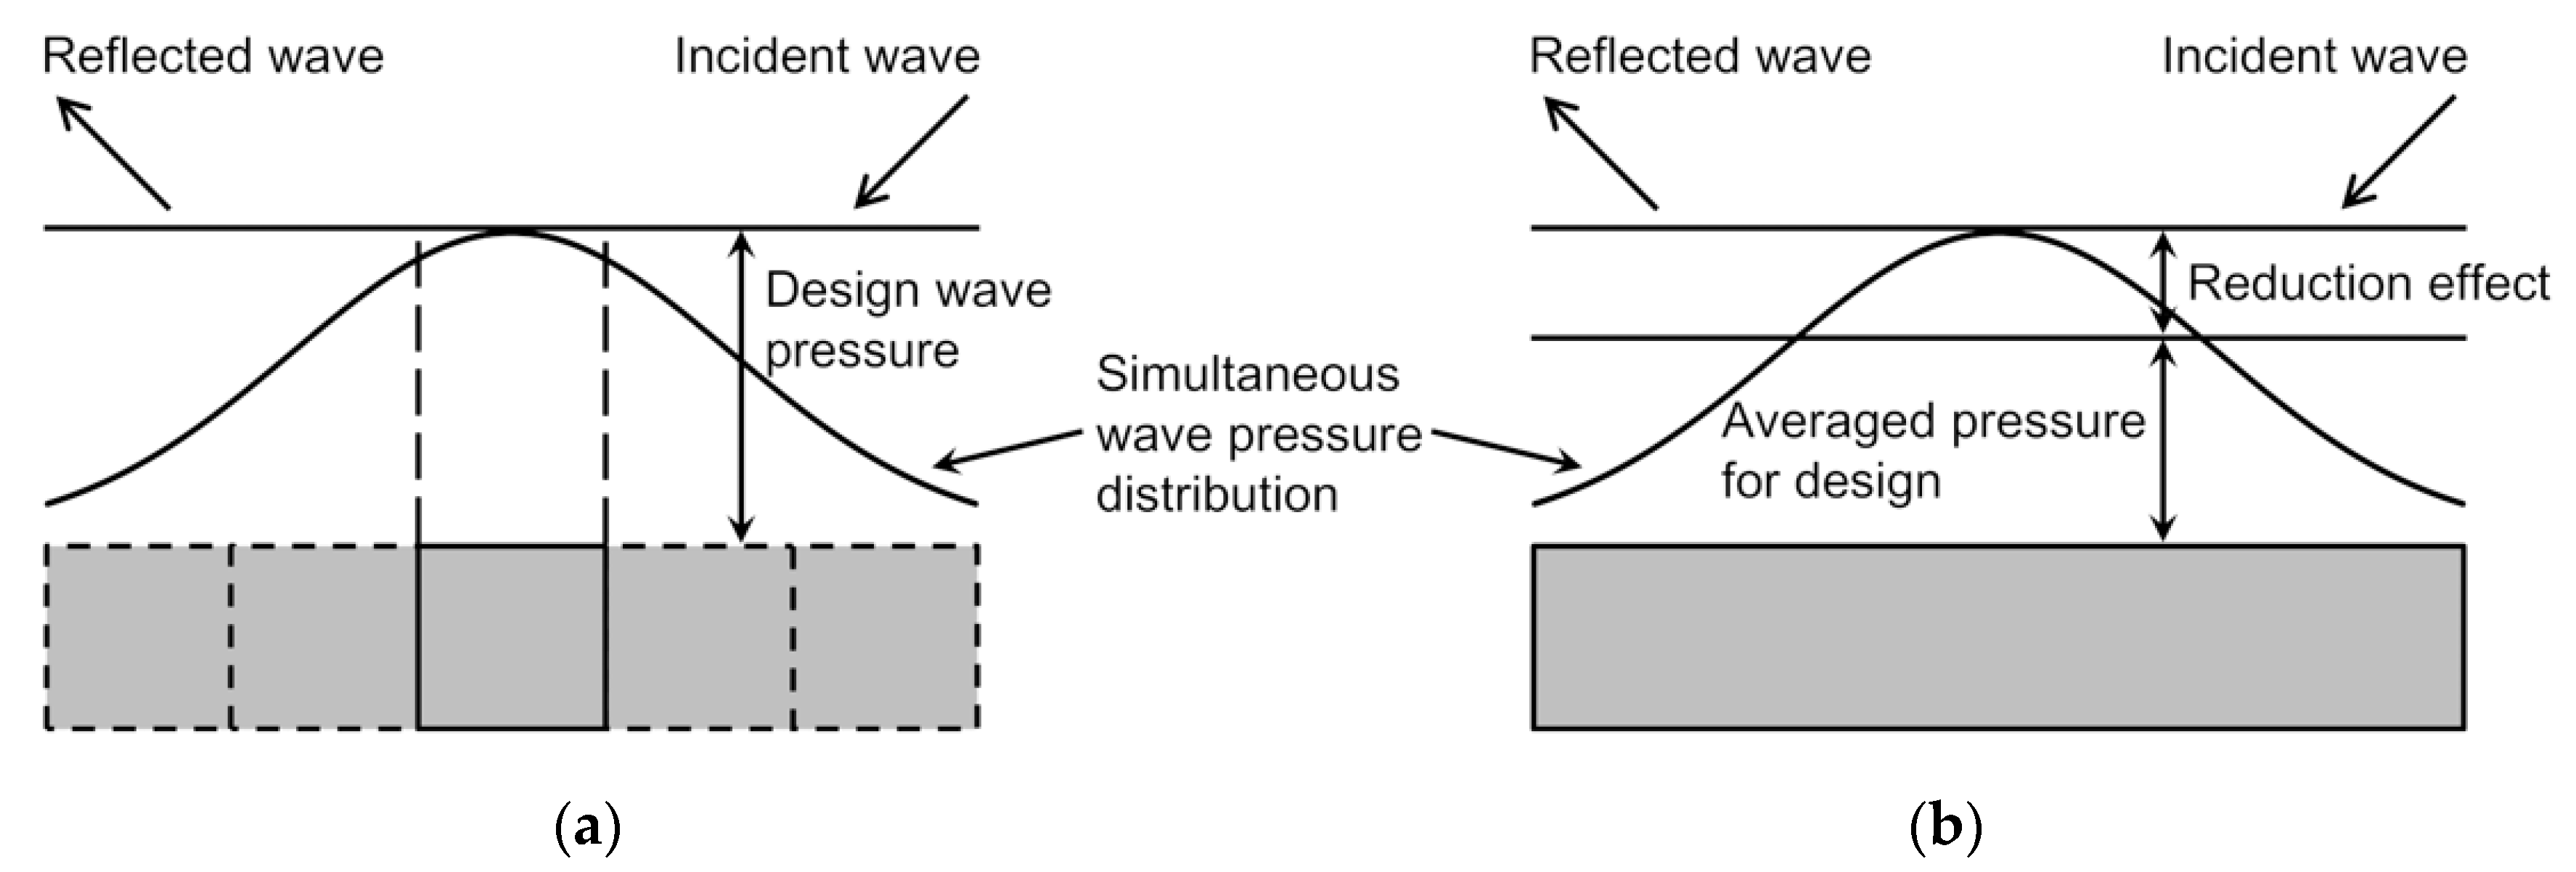
Figure 1. Design wave pressure for (a) conventional caisson and (b) long caisson breakwater, under an oblique incident wave.
Water 12 02873 g001
Figure 2. Schematics of caisson interlocking methods: (a) with protrusions and recesses; (b) with cross cables; (c) with key blocks; (d) with crushed stones.
Water 12 02873 g002
Figure 3. Schematics of harbor structures based on conventional and open cell caissons.
Water 12 02873 g003
Figure 4. Wave basin and model setup: (a) Photograph of the wave basin and (b) its specifications with the model breakwater and wave gauges installed (E1–E14, unit: m).
Water 12 02873 g004
Figure 5. Specifications of the model breakwater, including pressure gauges installed: (a) front and (b) lateral views of the model breakwater; top views of (c) the conventional and (d) open cell caissons (unit: m).
Water 12 02873 g005
Figure 6. Photographs of the crushed stone samples: (a) sample A; (b) sample B; (c) sample C; (d) grain size distributions of the samples.
Water 12 02873 g006
Figure 7. Relationship between wave theories [19] and test waves; the blue marks denote the test waves W01 to W20.
Water 12 02873 g007
Figure 8. Distribution of wave pressures on a caisson front: (a) ηm > hc; (b) 0 ≤ ηmhc; (c) ηm < 0. ηm, wave runup; hc, height of the freeboard.
Water 12 02873 g008
Figure 9. Sketch of how the detached breakwater was defined, (a) in plane and (b) side views, for an analytical approach.
Water 12 02873 g009
Figure 10. Distribution of maximum wave forces per unit length on the front face of the detached breakwater with T = 1.5 s: (a) β = 0°; (b) β = 15°; (c) β = 30°. T, period; β, angle of incidence.
Water 12 02873 g010
Figure 11. Distribution of maximum wave forces per unit length on the front face of the detached breakwater with T = 2.0 s: (a) β = 0°; (b) β = 15°; (c) β = 30°.
Water 12 02873 g011
Figure 12. Distribution of maximum wave forces per unit length on the front face of the detached breakwater with T = 2.5 s: (a) β = 0°; (b) β = 15°; (c) β = 30°.
Water 12 02873 g012
Figure 13. Maximum wave force on the front face of the entire detached breakwater: (a) β = 0°; (b) β = 15°; (c) β = 30°; (d) all tested cases.
Water 12 02873 g013
Figure 14. Sliding distances (s) at the #8 caisson of the conventional and open cell caisson breakwaters with different incident wave angles (β).
Water 12 02873 g014
Figure 15. Deformed shapes of the breakwaters with (a) conventional and (b) open cell caissons for β = 0°.
Water 12 02873 g015
Table 1. Properties of sample gravel.
SampleD10 (= De, mm)D30 (mm)D50 (mm)D60 (mm)CuCcUSCS
A10.35913.38316.40817.9201.7300.965GP
B5.3136.6007.8868.5291.6050.961GP
C2.3082.9723.6363.9691.7200.946SP
Table 2. Test wave conditions in the hydraulic experiment.
H (m)0.1600.1760.1920.2080.224
T (s)
1.50W01 (0.0566)W02 (0.0623)
1.75W03 (0.0464)W04 (0.0510)W05 (0.0557)
2.00W06 (0.0395)W07 (0.0434)W08 (0.0473)W09 (0.0513)W10 (0.0552)
2.25W11 (0.0344)W12 (0.0378)W13 (0.0413)W14 (0.0447)W15 (0.0482)
2.50W16 (0.0306)W17 (0.0336)W18 (0.0367)W19 (0.0397)W20 (0.0428)
Table 3. Weights of the conventional and open cell caissons for sliding tests.
CaseConventional CaissonOpen Cell Caisson
HeadTrunkHead (Crushed Stones)Trunk (Crushed Stones)
Self-weight (kN)1.801.201.89 (0.18)0.96 (0.37)
Effective self-weight (kN)1.190.571.19 (0.12)0.57 (0.25)
Publisher’s Note: MDPI stays neutral with regard to jurisdictional claims in published maps and institutional affiliations.