Article

A Scheme to Estimate Diurnal Cycle of Evapotranspiration from Geostationary Meteorological Satellite Observations

1
State Key Laboratory of Remote Sensing Science, Aerospace Information Research Institute, Chinese Academy of Sciences, Beijing 100101, China
2
State Key Laboratory of Resources and Environmental Information System, Institute of Geographic Sciences and Natural Resources Research, Chinese Academy of Sciences, Beijing 100101, China
*
Author to whom correspondence should be addressed.
Water 2020, 12(9), 2369; https://doi.org/10.3390/w12092369
Submission received: 18 June 2020 / Revised: 13 August 2020 / Accepted: 21 August 2020 / Published: 24 August 2020
(This article belongs to the Special Issue Evapotranspiration Measurements and Modeling)

Abstract

:
The diurnal cycle of evapotranspiration (ET) is significant in studying the dynamics of land–atmosphere interactions. The diurnal ET cycle can be considered as an indicator of dry/wet surface conditions. However, the accuracy of current models in estimating the diurnal ET cycle is generally low. This study developed an improved scheme to estimate the diurnal cycle of ET by solving the surface energy balance equation combined with simplified parameterization, with daily ET as the constraint. Meteosat Second Generation (MSG) land surface temperature, and longwave and shortwave radiation products were the primary inputs. Daily ET was from the remote sensing-based ETMonitor model. The estimated instantaneous (30 min) ET from the improved scheme outperformed the official MSG instantaneous ET product when compared with in situ half-hourly measurements at 35 flux sites from the FLUXNET2015 dataset, and was also comparable with European Center for Medium-Range Weather Forecasts (ECMWF) ERA5 ET data, with an R2 of 0.617 and root mean square error (RMSE) of 65.8 W/m2 for the improved scheme. Results were largely improved compared with those without daily ET as the constraint. The improved method was stable for the estimation of ET’s diurnal cycle at the similar atmospheric conditions and the accuracy was comparative at different land cover surfaces. Errors in the input variables and the simplification of surface heat flux parameterization affected surface energy balance closure, which can lead to instability of the solution of constants in the simplified parameterization and further to the uncertainty of ET’s diurnal cycle estimation. Measurement errors, different source areas in measured variables, and inconsistent spatial representativeness between remote sensing and site measurements also impacted the evaluation.

1. Introduction

Turbulent fluxes of sensible and latent heat represent the principal means by which the surface cools and exchanges moisture with the atmosphere [1]. Evapotranspiration (ET) is the leading way of surface water loss from the land surface. Latent heat flux due to ET is a significant component in the surface energy balance equation [2,3]. ET and latent heat flux are different expressions of the same process and can be converted to each other. Accurate ET estimation is critical in many fields, such as atmospheric and hydrological processes, climate change, crop irrigation management, drought monitoring, and water resources management [4,5,6,7,8]. Remote sensing (RS) techniques provide an approach to obtain ET on the regional and global scales. Current RS-based ET models are mainly classified as land surface temperature (LST)-based algorithms and Penman–Monteith (PM) equation-based methods [9,10,11,12,13]. These models can generate ET at different temporal and spatial resolutions with the corresponding available input data. However, enormous disagreement between different ET models was found on the hourly timescales, rather than on daily or longer timescales [14].
The diurnal cycle of ET/latent heat flux is significant on the dynamics of the atmospheric boundary layer and heat exchange across the entrainment zone, which is essential for the parameterization of the land surface model [15]. The diurnal cycles of surface energy fluxes are important drivers of atmospheric boundary layer development and convective precipitation, particularly in regions with heterogeneous land surface conditions [16]. Meanwhile, phase lags of the diurnal variation of the heat flux response to incoming solar radiation contain essential information on the different mechanisms of diurnal heat storage and exchange, which vary with wet and dry surface conditions, generally longer in wet than in dry surface condition [17,18]. Phase lags of the diurnal ET cycle to the incoming solar radiation can be considered as a signal for drought monitoring in the future.
Geostationary meteorological satellite can provide continuous observations for the surface heat status by surface radiometric temperature, which is strongly linked to the diurnal cycle of ET [9]. By using the rise of morning surface temperature measured from the geostationary operational environmental satellite (GEOS), Anderson et al. (2007) developed the atmosphere–land exchange inverse (ALEXI) model and a gap-filling method to estimate hourly surface fluxes in the United States [19]. On the basis of a simplified soil–vegetation–atmosphere transfer (SVAT) scheme, with Meteosat Second Generation (MSG) data as inputs, Ghilain et al. (2010) developed an operational ET model to produce ET maps every 30 min and every day over the whole MSG field of view [20]. ET products (30 min and daily) were generated at the European Organisation for the Exploitation of Meteorological Satellites’ (EUMERSAT’s) Satellite Application Facility on Land Surface Analysis (LSA–SAF) operations center [21]. RS-based ET models require many inputs to calculate the various resistances that are somewhat uncertain on a regional scale. The mean absolute percentage error for ET estimates from one- and two-source models caused by resistance varied from 32% to 53% [22]. Uncertainties and challenges of LST-based ET models include parameterization and spatial scaling, representative spatial and temporal resolution, and ET partitioning water-stress characterization uncertainties [23]. The accuracy of these models also depends on the retrieval error of surface variables from satellite sensors [24,25].
Avoiding resistance is a solution to reduce uncertainties in ET estimation [22]. Some models were developed, including the Priestley-Taylor method and its derivatives by parameterizing the α parameter [26,27], the triangular or trapezoidal method by using remote sensing-based spatial information [28,29,30], the maximum entropy production model [31,32], and the three-temperature model [33,34]. To reduce uncertainty for resistance calculation and the impact of RS retrieval error on ET estimates by fewer inputs, Lu et al. (2014) [35] developed a new scheme for estimating continuous surface energy fluxes in one day period only with surface temperature, air temperature, and net surface radiation measurements as inputs without resistance calculation. In this scheme, sensible, latent, and soil heat fluxes were simplified as functions of some constants in one day, land surface temperature, and air temperature. The linear least-squares method based on the surface energy balance equation was used to simultaneously solve seven unknown constants in the simplified parameterization of sensible, latent, and soil heat fluxes. Geostationary meteorological satellite data could be the primary data source for this ET scheme. However, the scheme was not stable to obtain those constants because of errors in input variables and in simplifying the parameterization of surface heat fluxes, which is also the nature of the ill-posed problem. It can probably be improved by introducing more prior knowledge to constrain the unknown constants’ solution.
Daily ET estimates from remote sensing data have been widely studied, and some daily ET products were released for various purposes. Zhang et al. (2015) updated a process-based land surface ET algorithm using satellite observations of photosynthetic canopy cover and surface meteorology inputs to estimate global terrestrial ET on a daily scale from 1982 to 2013 for analysis of global ET changes [36]. The third version of the Global Land Evaporation Amsterdam Model (GLEAM v3) (https://www.gleam.eu/) was developed. Two datasets on the daily scale, differing in their forcing and temporal coverage, are currently available [37]. ETMonitor is a process-based ET model with mainly satellite observation datasets as inputs. It has the capacity to generate global daily ET at a high spatial resolution of 1 km [38]. Considering these available daily ET products, the objective of this study was to develop an improved scheme from that of Lu et al. (2014) to estimate ET’s diurnal cycle with daily ET as the constraint. Daily ET data were from ETMonitor model, and MSG land surface temperature and radiation products were the input data sources. All in situ measurements in this study were from the FLUXNET2015 dataset, which was used to evaluate the estimated results. Results were also compared with MSG ET products and European Center for Medium-Range Weather Forecasts (ECMWF) ERA5 ET data. The method and data are detailed in Section 2. Section 3 gives the evaluation and comparison results and analyzes the error sources for the improved method. Conclusions are summarized in Section 4.

2. Materials and Methods

2.1. Methods

The principle of the parameterization scheme for estimating continuous surface fluxes, developed by Lu et al. (2014), is that the surface sensible heat flux (H), latent heat flux (LE), and soil heat flux (G) are first simplified as the functions of LST, air temperature, and some constants in one day period derived from bulk heat transfer equation and the heat conductivity equation on the basis of some reasonable assumptions. With known net radiation, unchangeable constants in the parameterization scheme in one day can be solved by a minimization technique based on the surface energy balance equation. H, LE, and G were, respectively, parameterized as
H = d 1 [ ( T s T a ) ] + d 2 [ ( T s T a ) 2 ]
L E = d 3 [ P s ( T s ) ] + d 4 [ P s ( T ) T T = T s × ( T s T a ) ] + d 5
G ( t ) = d 6 [ T s ( t ) t ] + d 7 [ ( T s ( t ) T s ¯ ) ] ,
where Ts and Ta are land surface temperature and air temperature, respectively (K); Ps(Ts) is the saturated vapor pressure at Ts (hPa); P s ( T ) T T = T s is the derivative of the saturated vapor pressure at Ts (hPa/K); t is time in the unit of hour; and d17 are the unknown constants. Combining Equations (1)–(3), the surface energy balance equation (Rn = H + LE + G) can be rewritten as
R n ( t ) = k = 1 7 d k φ k ( T s , T a , t ) ,
where Rn is net surface radiation (W/m2). φk(Ts, Ta, t) are functions related to Ts and Ta within square brackets in Equations (1–3), i.e., φ k ( T s , T a , t ) = ( T s T a ) , ( T s T a ) 2 , P s ( T s ) , P s ( T ) T T = T s × ( T s T a ) , 1 , T s ( t ) t , ( T s ( t ) T s ¯ ) . With known Rn, Ts, and Ta, Equation (4) is converted into a linear system as
A d =   b ,
where A i j = φ i ( T s , T a , t j ) , 1 i 7 , 1 j n , n is the number of measurements, and b j = R n ( t j ) . Because of errors in the simplified parameterization schemes and input variables, Equation (5) essentially solves an ill-posed problem. It is difficult to obtain true solutions for the ill-posed problem. In the initial version of this parameterization scheme, the least-squares method with weak constraints was used to solve Equation (5). Constraints included dk (k = 1, 2, 3, 4, 6, 7) > 0 and d5 < 0. The weak constraint sometimes brought an unstable solution for dk, leading to large LE estimation errors, especially at dry surface condition.
The accurate solution of the ill-posed problem needs the assistance of more prior knowledge. With the release of some available ET products at the daily scale, actual daily ET can be considered as prior knowledge to constrain the solution of Equation (5) and further improve the accuracy of the diurnal cycle of LE estimation. This is the improvement of this study compared with the study of Lu et al. (2014). Equation (5) was also solved by the least-squares method in this study, but with new constraint conditions implemented by the lsqlin function in MATLAB software, i.e.,
min 1 2 A d   b 2 2 such   that   d k ( k = 1 , 2 , 3 , 4 , 6 , 7 ) > 0 d k ( k = 5 ) < 0 ( d 3 φ 3 , j + d 4 φ 4 , j + d 5 ) n i g h t t i m e = 0 0 < j = 1 n ( d 3 φ 3 , j + d 4 φ 4 , j + d 5 ) < = E T d a i l y
where d k ( k = 1 , 2 , 3 , 4 , 6 , 7 ) > 0 and d k ( k = 5 ) < 0 are the weak constraints in the original version. ( d 3 φ 3 , j + d 4 φ 4 , j + d 5 ) n i g h t t i m e = 0 is the assumption of no ET at nighttime. 0 < j = 1 n ( d 3 φ 3 , j + d 4 φ 4 , j + d 5 ) < = E T d a i l y is the main improvement in this study, i.e., known daily ET was used to restrain LE estimation at the instantaneous scale. In theory, because there are seven unknown variables in Equations (1)–(3), at least seven sets of known values of Ts, Ta, and Rn during the daytime are required as inputs of Equation (6). After obtaining the unknown constants of d17, the instantaneous LE in one day is calculated by Equation (2) with known d3, d4, d5, Ts, and Ta. In this study, input variables of Ts and Rn were from MSG products at a half-hourly scale; input Ta was from ECMWF ERA5 data at hourly temporal resolution, and linearly interpolated to 30 min interval; and daily ET was from the ETMonitor model. In situ measurement data for evaluation and comparison were from the FLUXNET2015 dataset. All these data and the data process are detailed in Section 2.2. The flow of this study is shown in Figure 1, and details are given in Section 2.2.

2.2. Data

2.2.1. MSG Data

Various MSG-derived operational products were produced by the LSA–SAF partners and distributed via their website (https://landsaf.ipma.pt). The MSG products can be found in four geographical regions (Euro, NAfr, SAfr, and SAme) and/or on one area covering the four regions (MSG–Disk) in the current LSA–SAF system. MSG Euro products were downloaded and used in this study, including operational products of MSG land surface temperature (MLST) at a temporal resolution of 15 min, MSG downward surface shortwave flux (MDSSF) and downward surface longwave flux (MDSLF) at the temporal resolution of 30 min, MSG daily surface albedo (MDAL), MSG evapotranspiration (MET) at a temporal resolution of 30 min, and MSG daily evapotranspiration (DMET) in 2013. The internal product of daily land surface emissivity (EM) was also downloaded for Rn calculation with MLST, MDSLF, MDSSF, and MDAL products. MDSSF and MDAL were used to calculate net shortwave radiation (Rns), and EM, MLST, and MDSLF were used to calculate net longwave radiation (Rnl). Net radiation is then the sum of Rns and Rnl. This study used all these instantaneous products at a temporal frequency of 30 min, coincidental with in situ measurements. The spatial resolution of MSG products was 3.1 km. Calculated instantaneous Rn, MLST, and ERA5 Ta, as inputs of Equation (6), were used to estimate LE’s diurnal cycle. Instantaneous LE estimation was then evaluated by in situ LE measurements from the FLUXNET2015 dataset, and compared with MSG MET product and ERA5 ET data. The MET, DMET, and MLST products and the calculated Rn were also assessed by in situ measurements. The process can be found in the flowchart in Figure 1. The units of the released MET and DMET products, mm/h and mm/day, respectively, were converted into W/m2 by the latent heat of vaporization of 2.45 × 10⁶ J/kg.

2.2.2. ETMonitor Daily ET Data

ETMonitor is a process-based model with remote sensing data as inputs [13,39,40] that was developed on the basis of the Shuttleworth-Wallace dual-source model. It includes five main modules of soil evaporation, vegetation transpiration, canopy interception evaporation, water body evaporation, and ice and snow sublimation. Daily ET is the sum of the evaporation of the five components. Global daily ET products for 2013 and 2014 were released by the National Tibetan Plateau Data Center [41]. Only 2013 data were used for this study. The ET version was generated by using ECMWF ERA5 reanalysis data as forcing driving data, and remote sensing-based net radiation, dynamical area of water bodies, leaf area index, soil moisture, and land use and land cover were also used as inputs. The temporal and spatial resolutions of this ET dataset were 1 day and 5 km, respectively. The unit of this dataset is mm/day, which in this study was converted into the daily average latent heat flux in the unit of W/m2 by the latent heat of vaporization of 2.45 × 10⁶ J/kg. ETMonitor daily ET data were assessed by FLUXNET2015 in situ measurement data and compared with MSG DMET products.

2.2.3. FLUXNET2015 Dataset

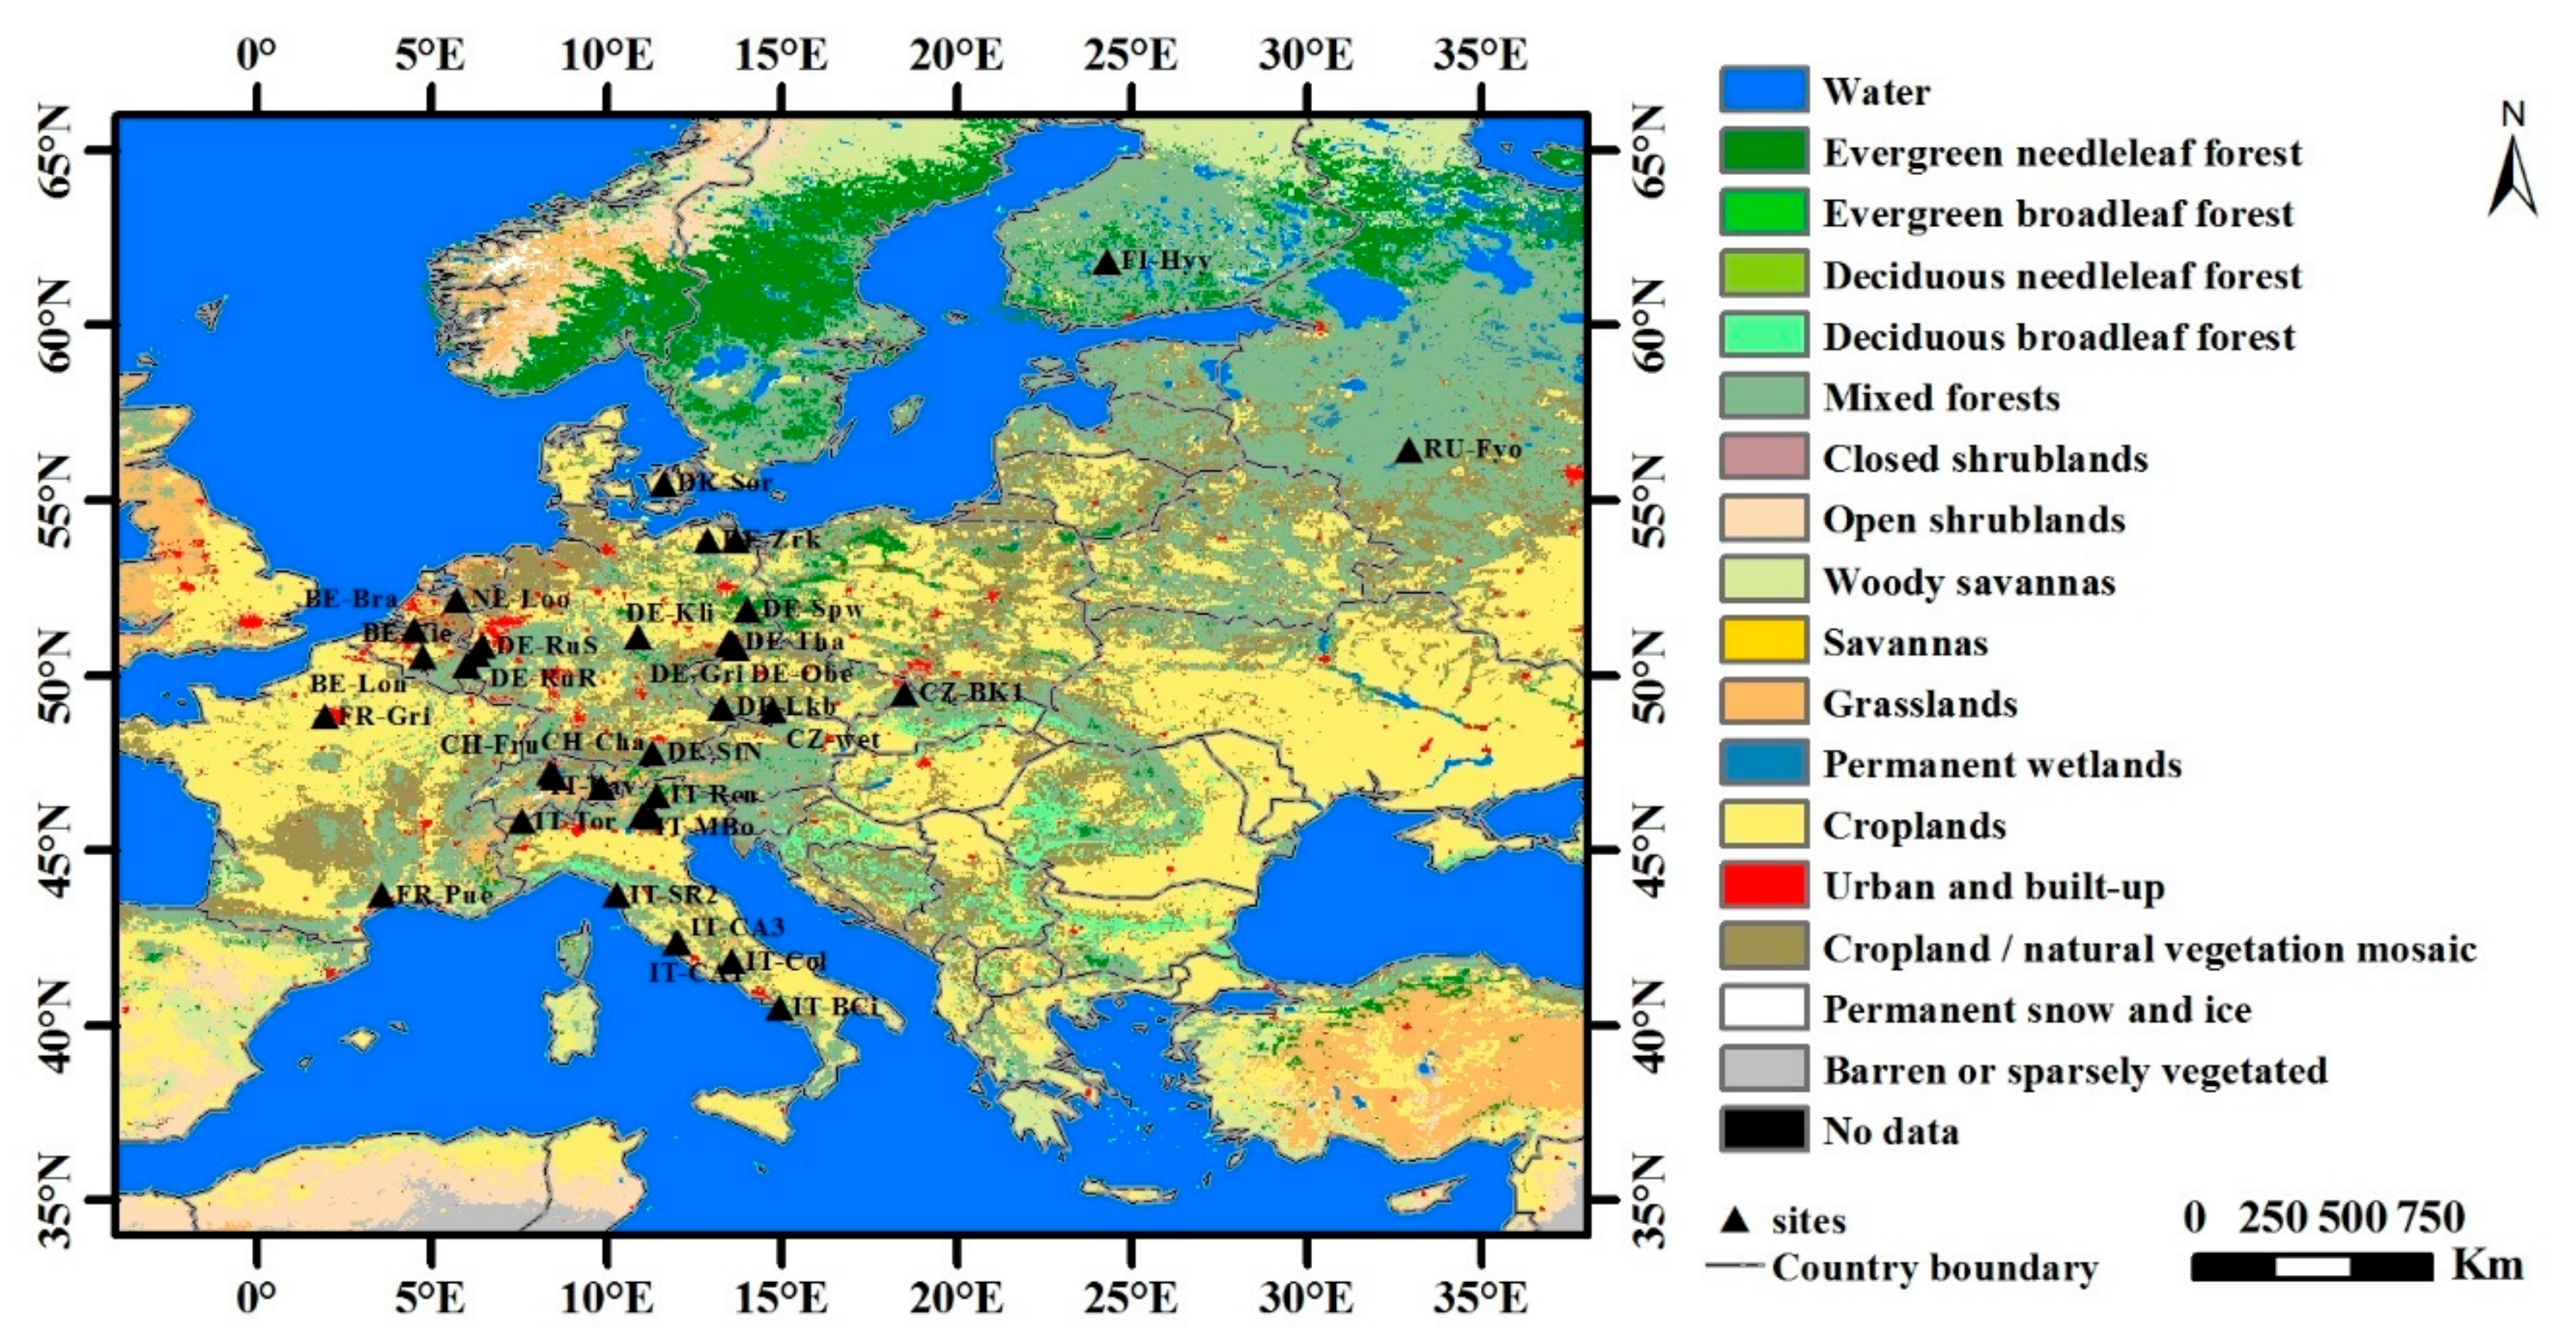
The FLUXNET2015 dataset is the most recent dataset (last updated on 6 February 2020) produced by the FLUXNET research community, and it includes over 1500 site-years of data from 212 sites of multiple regional flux networks, such as AmeriFlux, AsiaFlux, and EuroFlux. The FLUXNET2015 dataset includes several improvements to data quality control protocols and the data processing pipeline compared to previous versions of FLUXNET Marconi dataset (2000) and the FLUXNET LaThuile dataset (2007) (https://fluxnet.fluxdata.org/data/fluxnet2015-dataset/). The FULLSET Data Product for the FLUXNET2015 release includes all data product variables with a standardized data format, a uniform data quality flag, highly vetted gap filling, and many variables generated by intermediate processing steps to allow for the in-depth understanding of individual processing steps and their effect in the final data products. Taking MSG cover for the Euro part and the available FLUXNET2015 dataset in 2013 into consideration, there were 35 sites with high data quality that were lastly selected in this study. General information for the 35 selected sites is listed in Table 1, and the location is shown in Figure 2.
There were 2 mixed forests (MF), 6 croplands (CRO), 6 grasslands (GRA), 11 evergreen needleleaf forests (ENF), 5 water (WET), 4 deciduous broadleaf forest (DBF), and 1 evergreen broadleaf forest (EBF) sites. Mean annual precipitation for these sites varied from about 470 to 1650 mm. Observed incoming and outgoing longwave radiation was used to calculate LST on the basis of the Stefan-Boltzmann law to compare against LST retrieval from MSG data. The non-closure of the energy balance is a problem of eddy covariance flux data. This study directly used the measured H and LE without any correction for the evaluation of the estimated results and the comparison with MSG and ERA5 ET data. To reduce the cloud’s influence, those days with at least 10 valid MSG–LST values during daytime were used to evaluate the performance of the improved method. Lastly, 1431 days were available, and the number of the selected days for each site is given in Table 1.
For the comparison of RS-based results with in situ measurements, the RS-based value is from the pixel value containing the site location. The spatial representativeness of RS data used in this study was about 3–5 km. The ground-based observation was commonly conducted with a smaller spatial representativeness, from several hundred meters to several kilometers for the tower-based eddy covariance measurement [42]. The footprint of the eddy covariance measurement depends on measurement height, wind direction/velocity, atmospheric stability, and underlying surface conditions [43]. This mismatch of spatial representativeness may be ignorable for homogeneous regions but may introduce large bias for results in heterogeneous regions. To test the homogeneity of the RS pixels with flux site, the proportions of the predominant land cover classes in the pixel with flux station was obtained by using MCD12C1 data (Table 1). MCD12C1 data are the MODIS Land Cover Climate Modeling Grid data product, which provided the sub-pixel proportions of each land cover class in each 0.05 degree pixel, similar to the spatial resolution of RS-based data in this study. The proportions of the predominated land cover class varied from 29% to 98%. There are 30 sites with the proportion of the predominated land cover class larger than 50%, which could mean that the land cover in the pixel with flux site was relatively single. For those sites with the proportion of the predominated land cover class less than 50%, the number of land cover classes was at least 4 and up to 10 at CZ-wet site with a maximum proportion of 29%, which indicated that the surface conditions at these sites were heterogeneous. It is commonly challenging to obtain the measurement at the pixel scale for a heterogeneous surface [44]. Therefore, the in situ measurements from FLUXNET2015 was directly used to validate the value of RS-based data in this study, although some bias may be introduced in the heterogeneous regions.

2.2.4. ERA5 Reanalysis Data

ERA5 is the fifth generation ECMWF atmospheric reanalysis of the global climate. Daily updates are available 5 days behind real time. The two variables of air temperature and evapotranspiration used in this study were from the “ERA5 hourly estimates of variables on single levels” dataset with a spatial resolution of 0.25°, downloaded from https://cds.climate.copernicus.eu/cdsapp#!/dataset/reanalysis-era5-single-levels?tab = overview. Air temperature is the temperature of the air at 2 m above land surface, and it is calculated by interpolating between the lowest model level and Earth’s surface, considering atmospheric conditions. Evapotranspiration is the hourly accumulated amount of water (in m unit) that evaporated from Earth’s surface, including a simplified representation of transpiration from vegetation into vapor in the air. Data on the hourly scale were linearly interpolated to the half-hourly scale in this study. Half-hourly air temperature data were the input of the improved method, while half-hourly evapotranspiration data were used to compare and evaluate the estimated results.

2.3. Evaluation Indices

Evaluation indices used in this study were the determination coefficient (R2), root mean square error (RMSE), mean absolute bias (BIAS), and the error frequency distribution histogram. Equations for these indices are listed in Table 2.

3. Results and Discussion

3.1. Evaluation of Instantaneous LE estimation

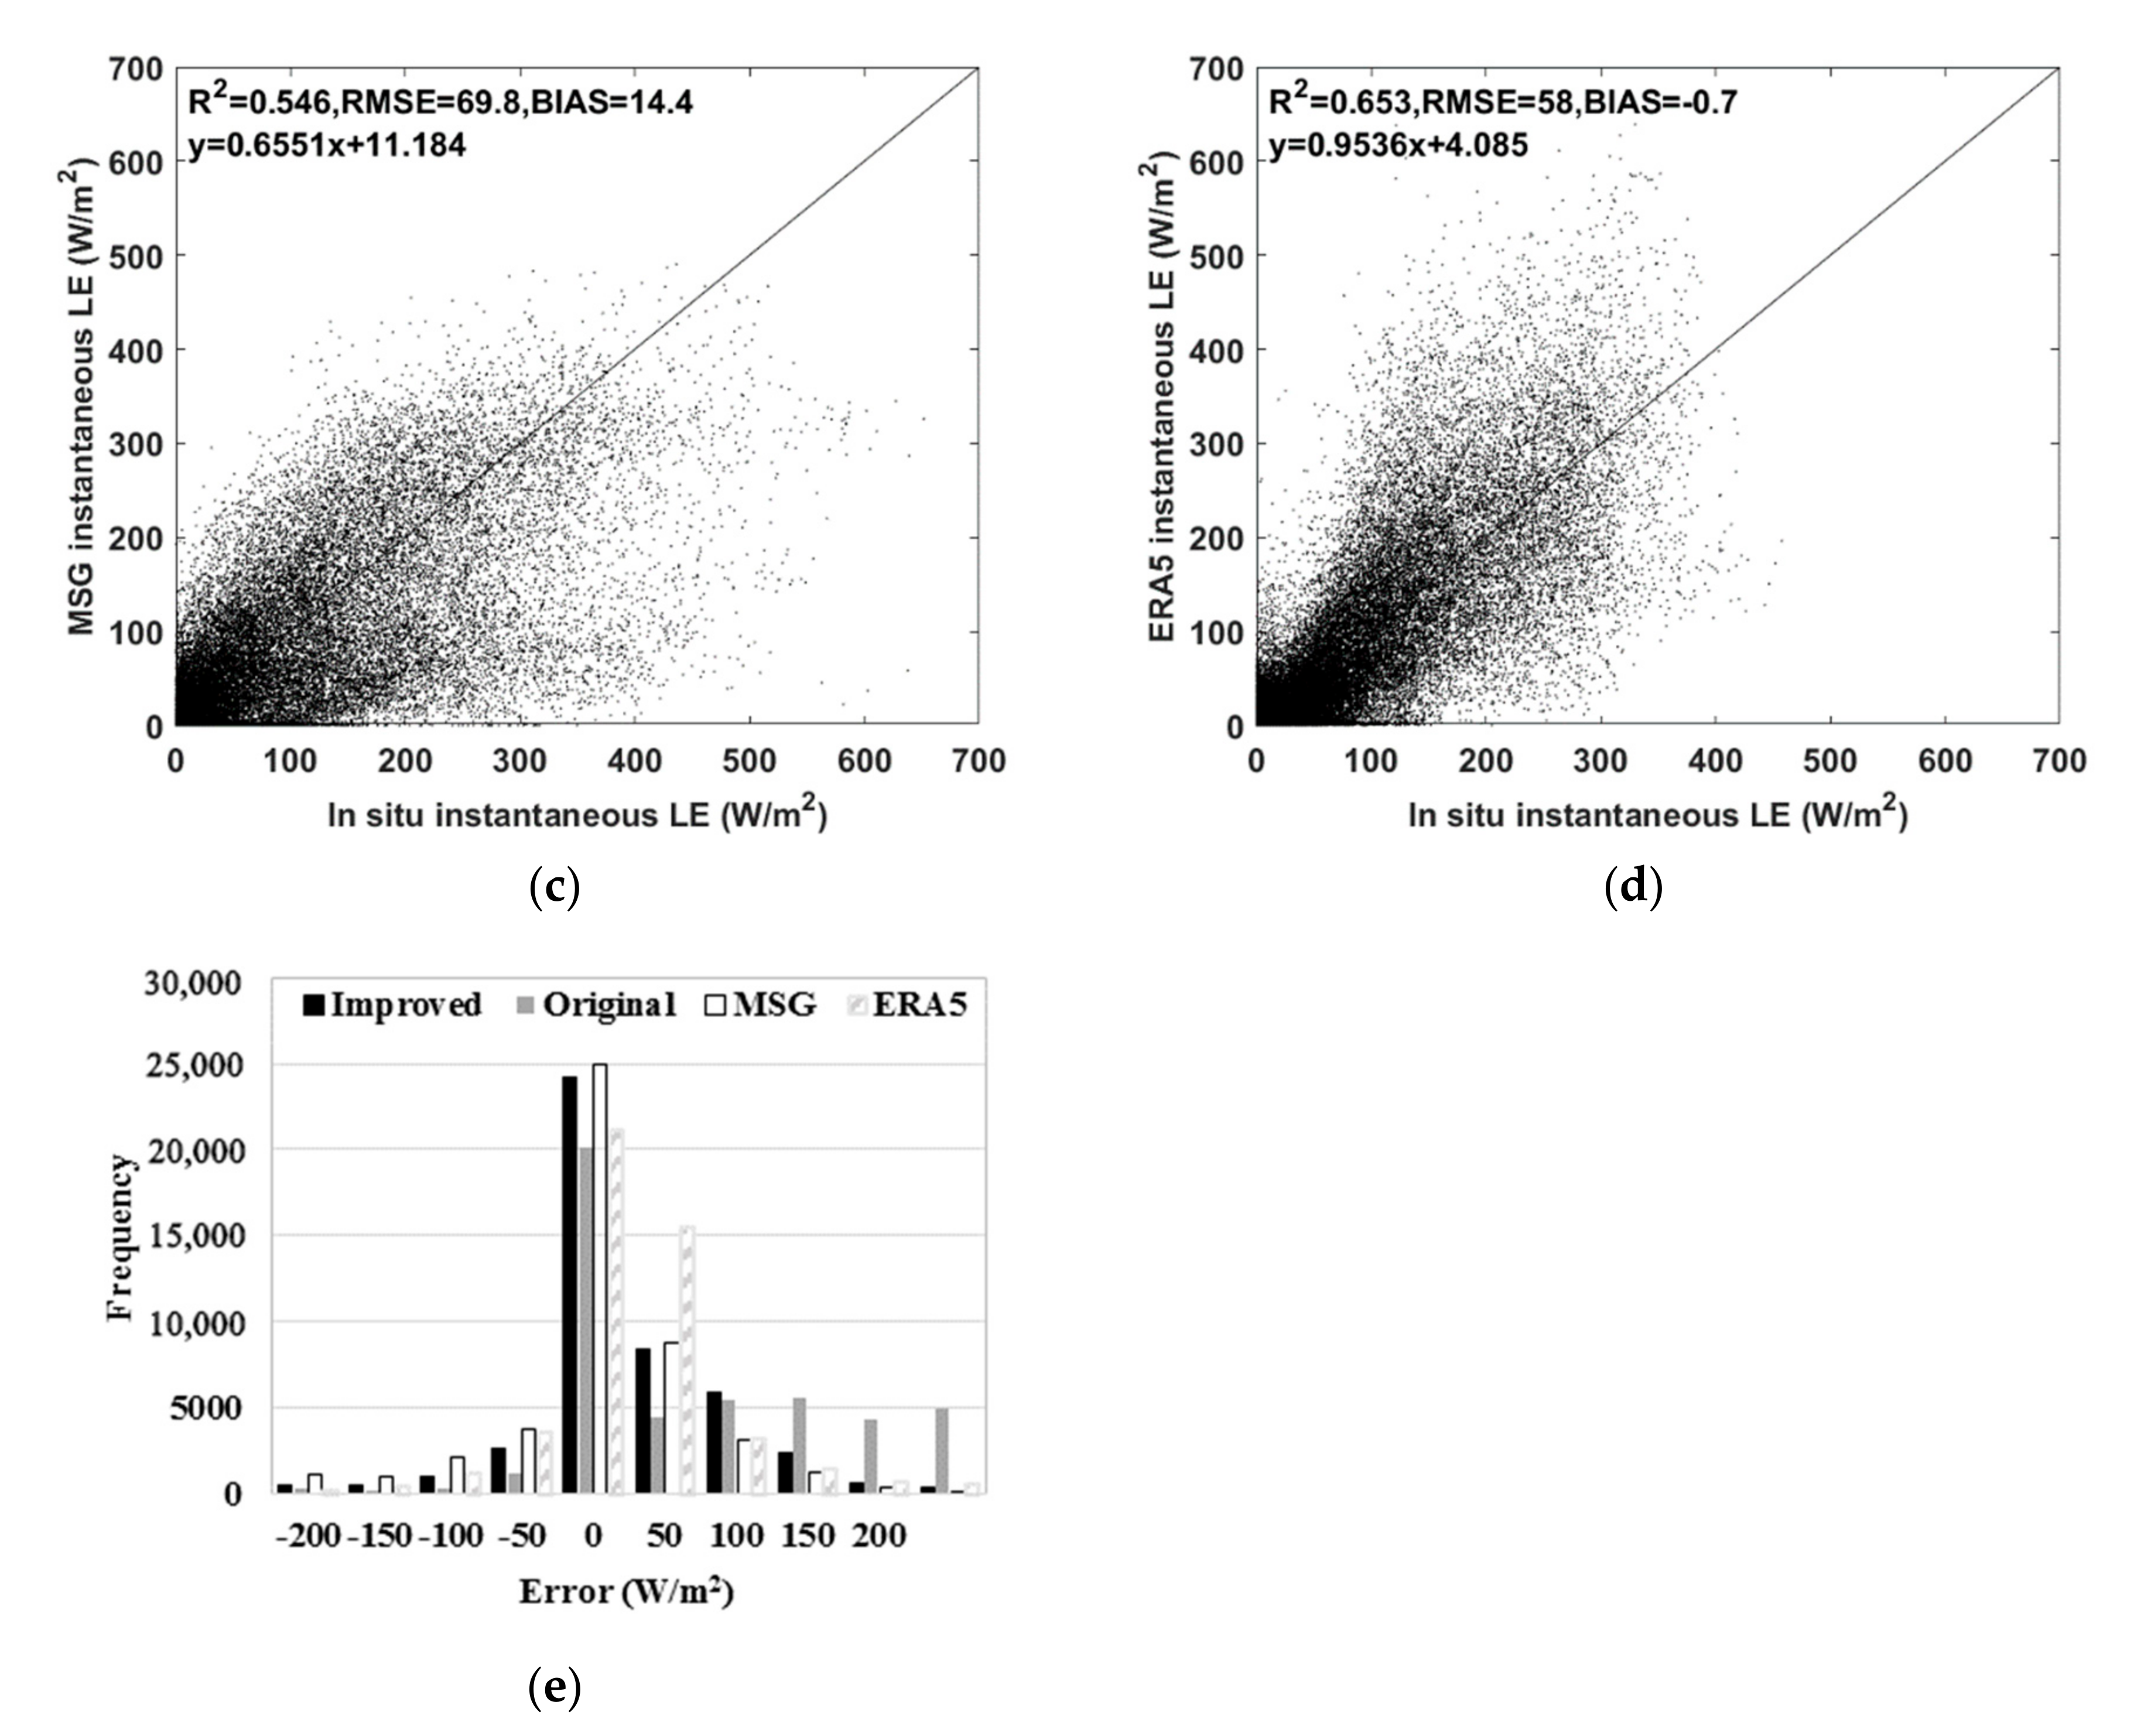
Following the flowchart of Figure 1, with MSG LST, ERA5 Ta, MSG-based Rn, and ETMonitor daily ET as the inputs into the improved scheme, estimated instantaneous LE for the selected days is shown in Figure 3a. Compared with in situ LE measurements from the FLUXNET2015 dataset, R2 was 0.617, RMSE was 65.8 W/m2, with BIAS of 7.6 W/m2, which was better than the estimated results without daily ET as the constraint (i.e., the original scheme), shown in Figure 3b. The original scheme generally overestimated instantaneous LE by 61.8 W/m2 with R2 of 0.567 and RMSE of 120.9 W/m2. The estimated instantaneous LE from the improved scheme was better than MSG ET (MET) product shown in Figure 3c. Some evaluations and comparisons for MET and DMET products were made with in situ measurements, RS-based ET products and global reanalysis data [45,46]. The MSG ET product was generally satisfied. When the MET product for selected days was compared with in situ LE measurements from the FLUXNET2015 dataset in this study, it was underestimated by 14.4 W/m2, with R2 of 0.546 and RMSE of 69.8 W/m2. ERA5 ET data were also compared with in situ LE, shown in Figure 3d. Evaluation index values appeared better than the results from the improved method, but there was slight overestimation by ERA5 ET data when ET was large. The error frequency distribution histograms for the four instantaneous LE estimations are shown in Figure 3e. The overestimation of the original method is evident. Error distribution for the improved method was similar to that of the MET product. The majority of errors, 76% for the improved method, 81% for the MET product, and 84% for ERA5 ET data, were between −50 and 50 W/m2.
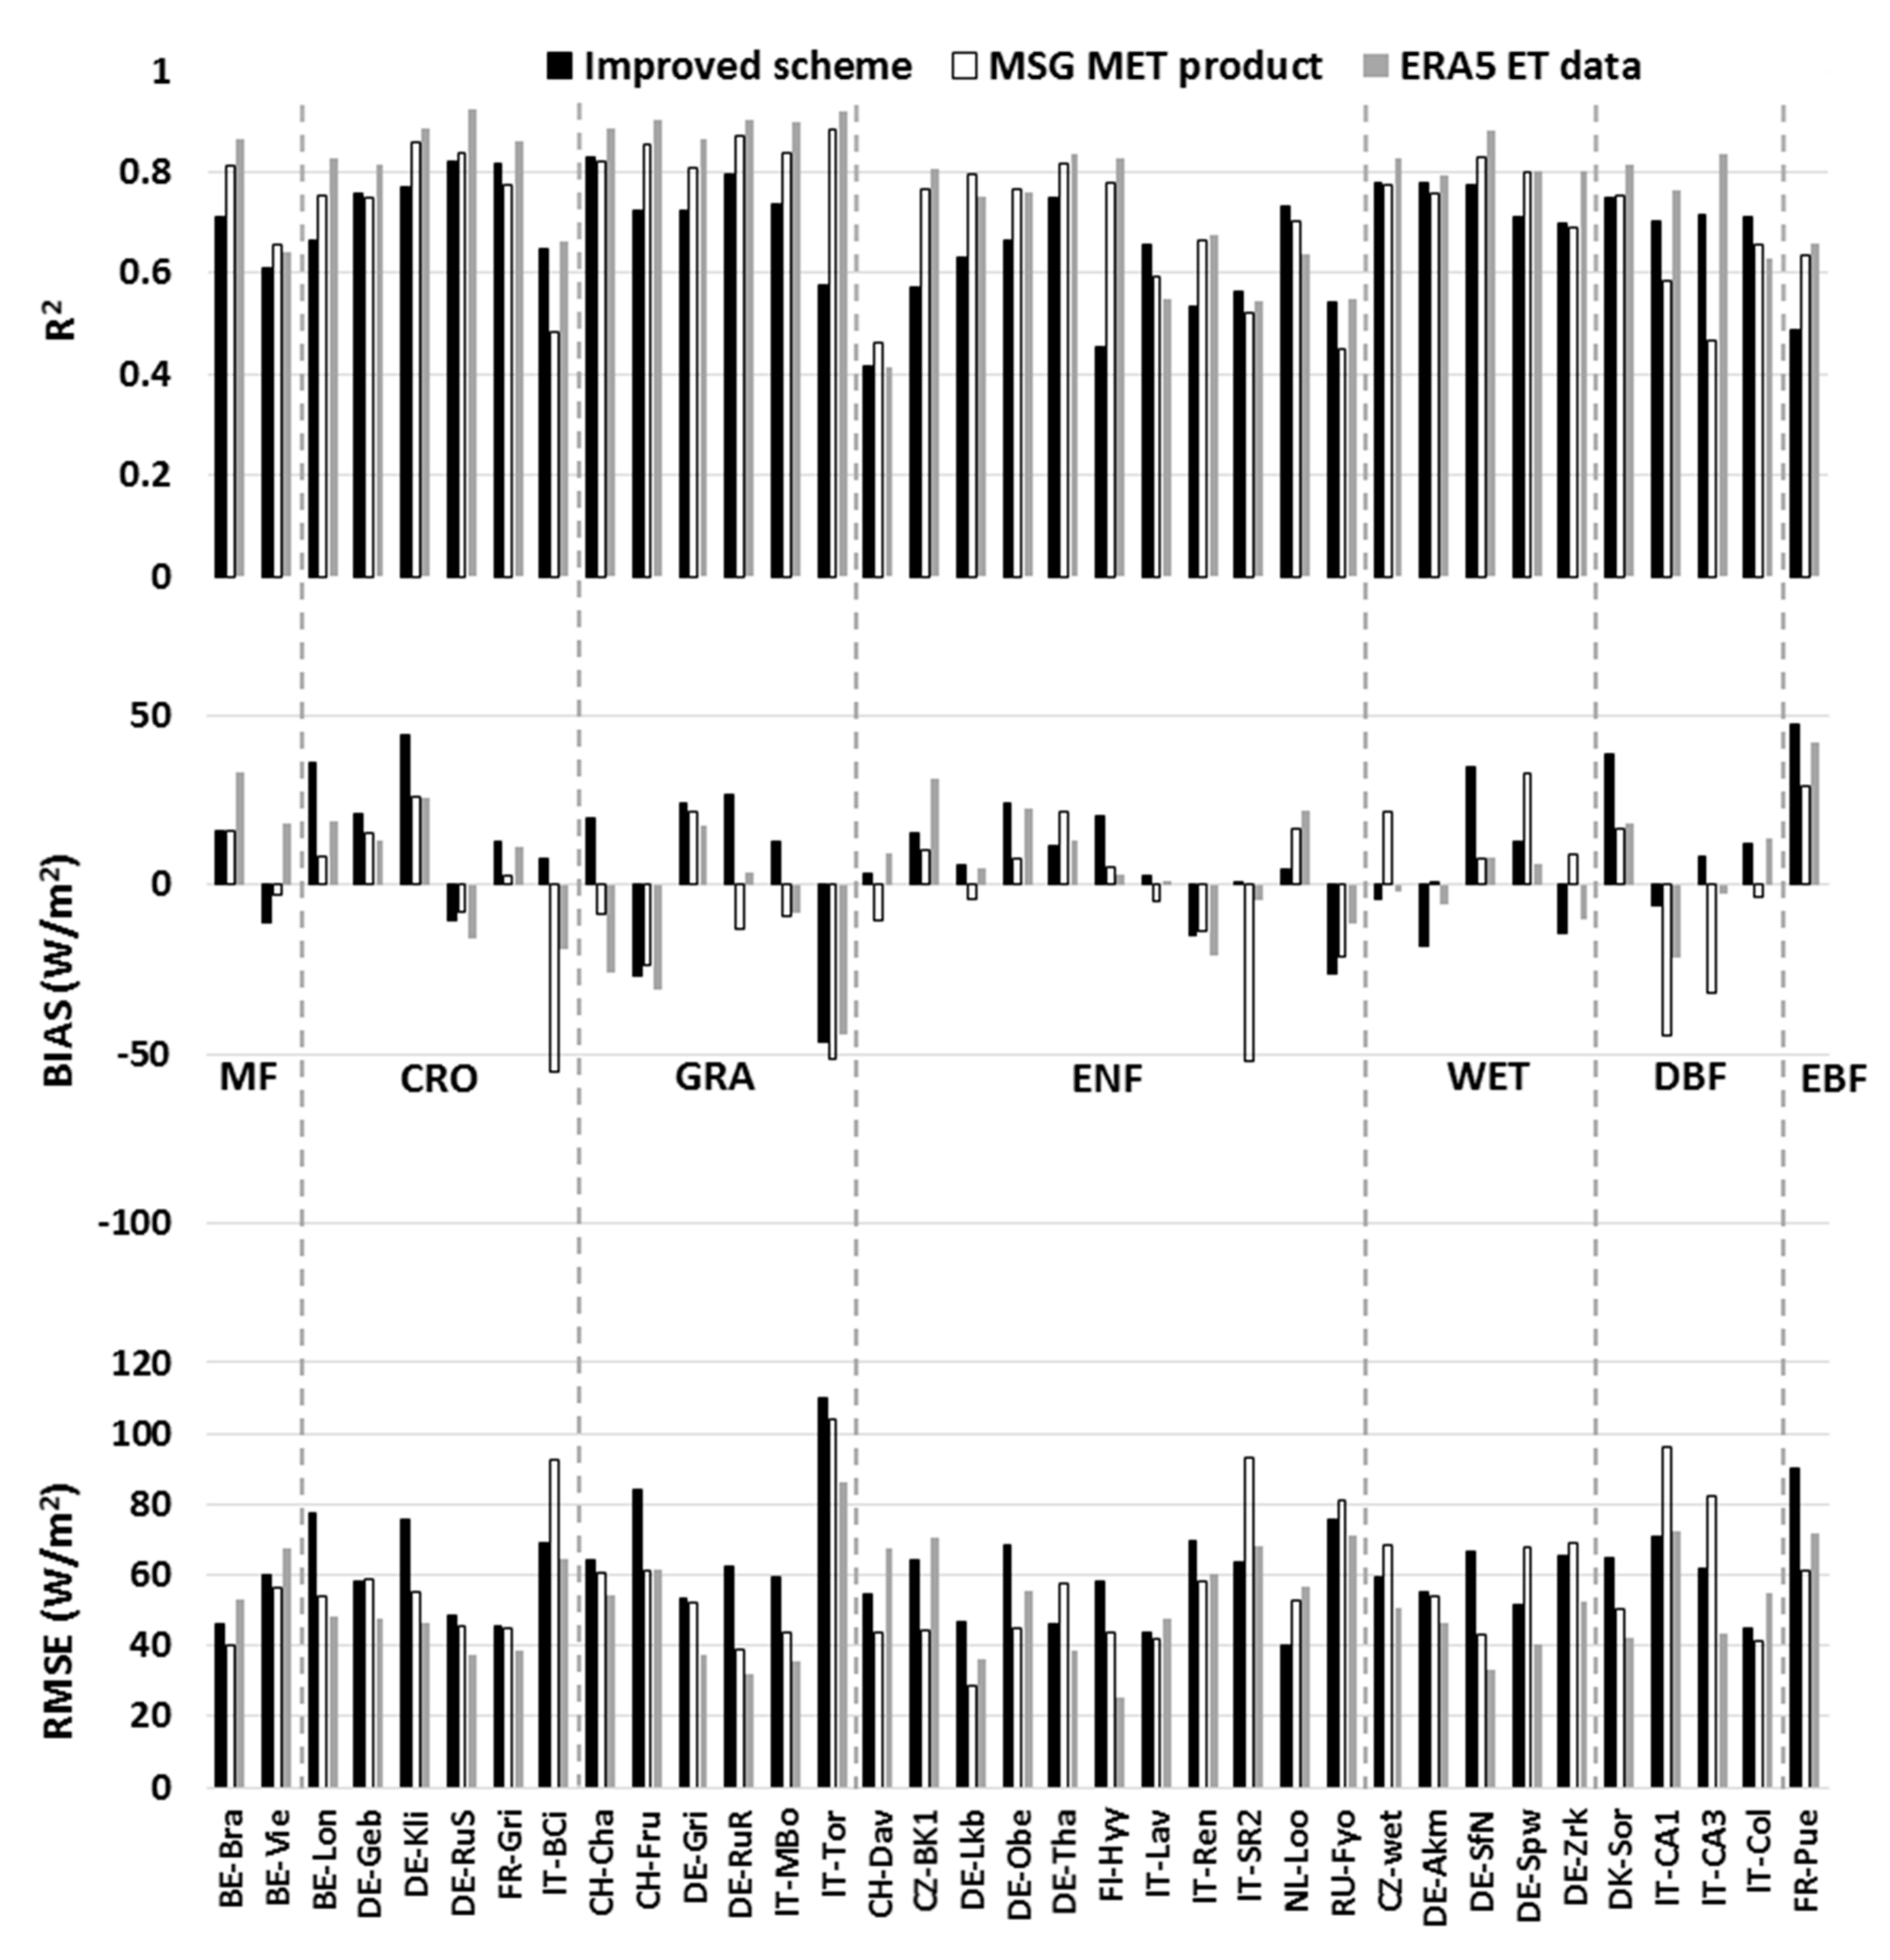
Comparisons of the estimated instantaneous LE by the improved method, the MET product, and ERA5 ET data with in situ measurements for each site are given in the bar chart in Figure 4. For most of these sites, more than 60%, estimated results were consistent with in situ measurements with good correlation of R2 > 0.7. The MET product had similar performance. The serious underestimation by more than 50 W/m2 was from the MET product at three Italian sites, namely the IT-BCi croplands site, IT-Tor grassland site, and IT-SR2 evergreen needleleaf forest site, which could be evidently reduced by the improved scheme and ERA5 ET data, except for the IT-Tor site. At the IT-Tor site, the improved method underestimated LE by 46 W/m2, and ERA5 ET data gave an LE underestimation by 43 W/m2. The RMSE for the improved method and MET products was more than 100 W/m2, and 86 W/m2 for the ERA5 ET data. No matter which method, the immense RMSE value occurred at this site. The IT-Tor site is located in the north of Italy with an elevation of 2160 m, and the mountain is the predominant terrain in this region. The complex underlying surface can lead to more uncertainties for remote sensing-based ET estimates because of heterogeneous surface characteristics [47]. Overestimations from the improved method at BE-Lon, DE-Kli, DE-SfN, DK-Sor, and FR-Pue sites were due to overestimations of daily ET from ETMonitor. Figure 4 also shows that the accuracy of LE estimation did not change with different land covers.
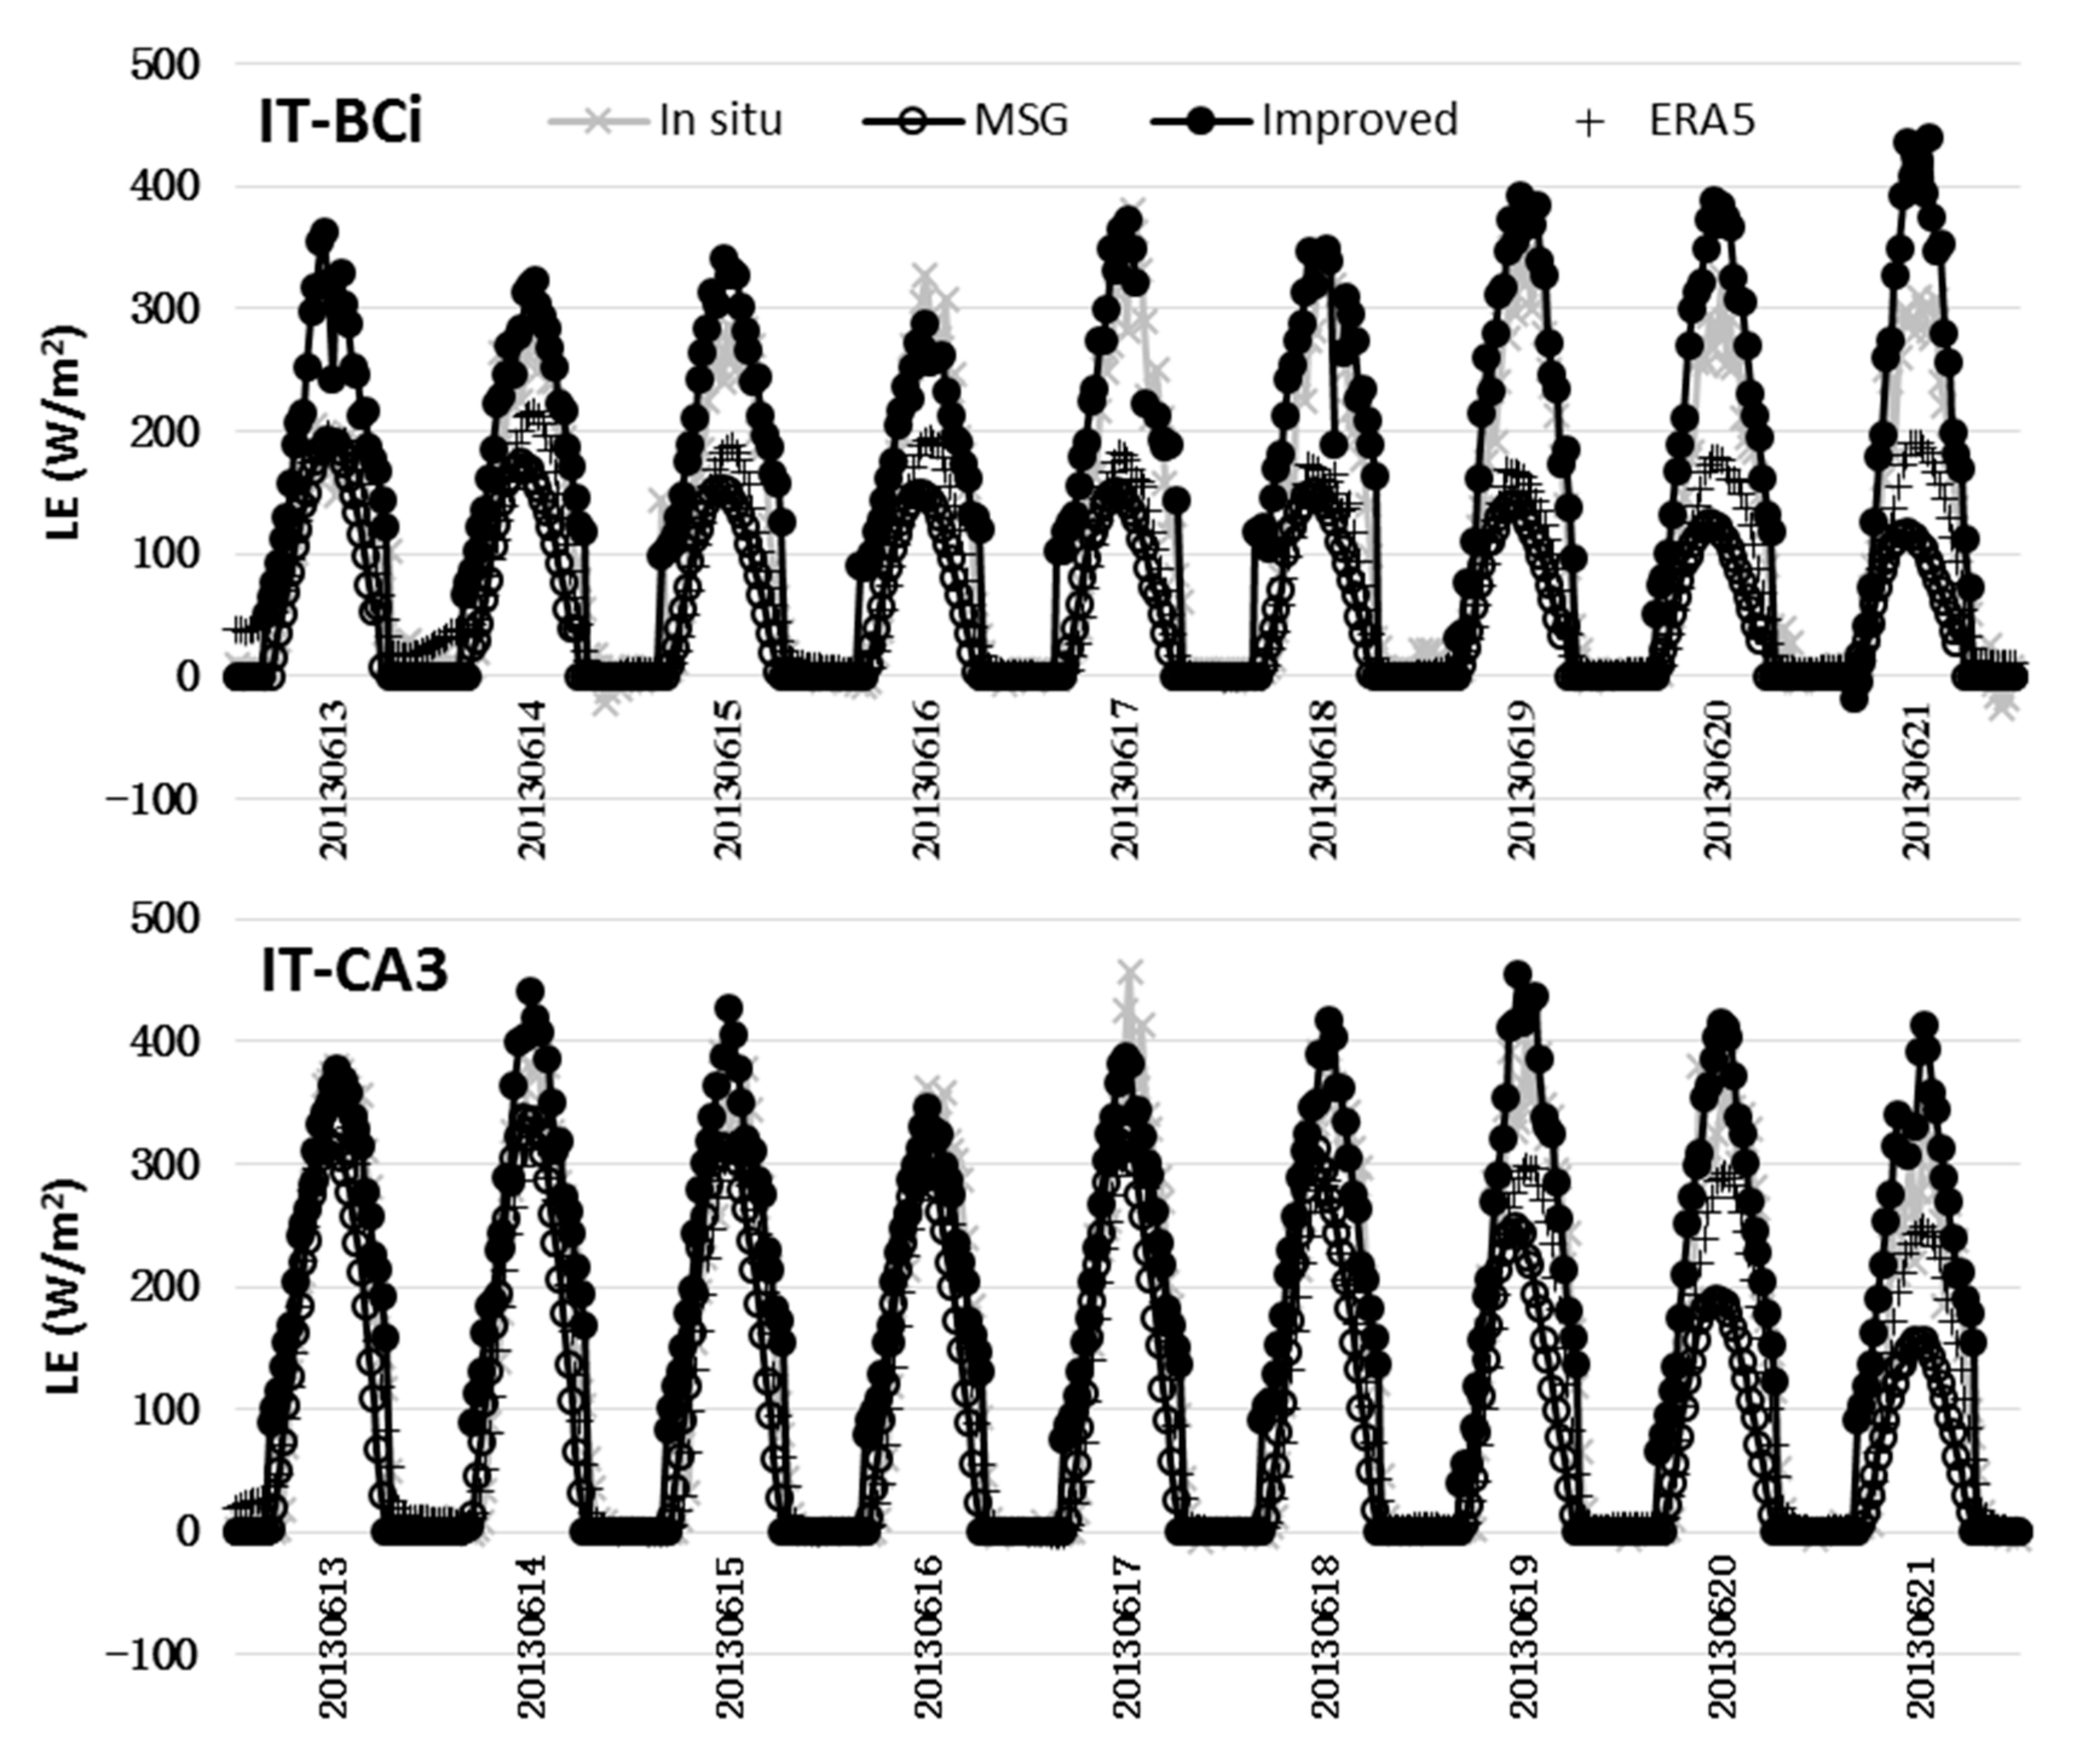
Instantaneous LE at the IT-BCi and IT-CA3 sites for nine consecutive days (13–21 June 2013) is shown in Figure 5. During these nine consecutive days, similar atmospheric and underlying conditions were found. The improved scheme, MET product, and ERA5 ET data could smoothly simulate LE’s diurnal cycle except for several outliers from the improved method because of LST uncertainty. However, the LE from the improved scheme was closer to in situ observations than the MET product and ERA5 ET data were for the two sites. For similar atmospheric conditions, the estimated LE was also similar at the same site, implying that the improved scheme was stable for the diurnal cycle of LE estimation. The MET product and ERA5 ET data generally underestimated LE, more seriously at the IT-BCi site. The assumption of no ET at nighttime in the improved scheme was consistent with the MET product at nighttime.

3.2. Impact of Input Variables on Diurnal Cycle of ET Estimation

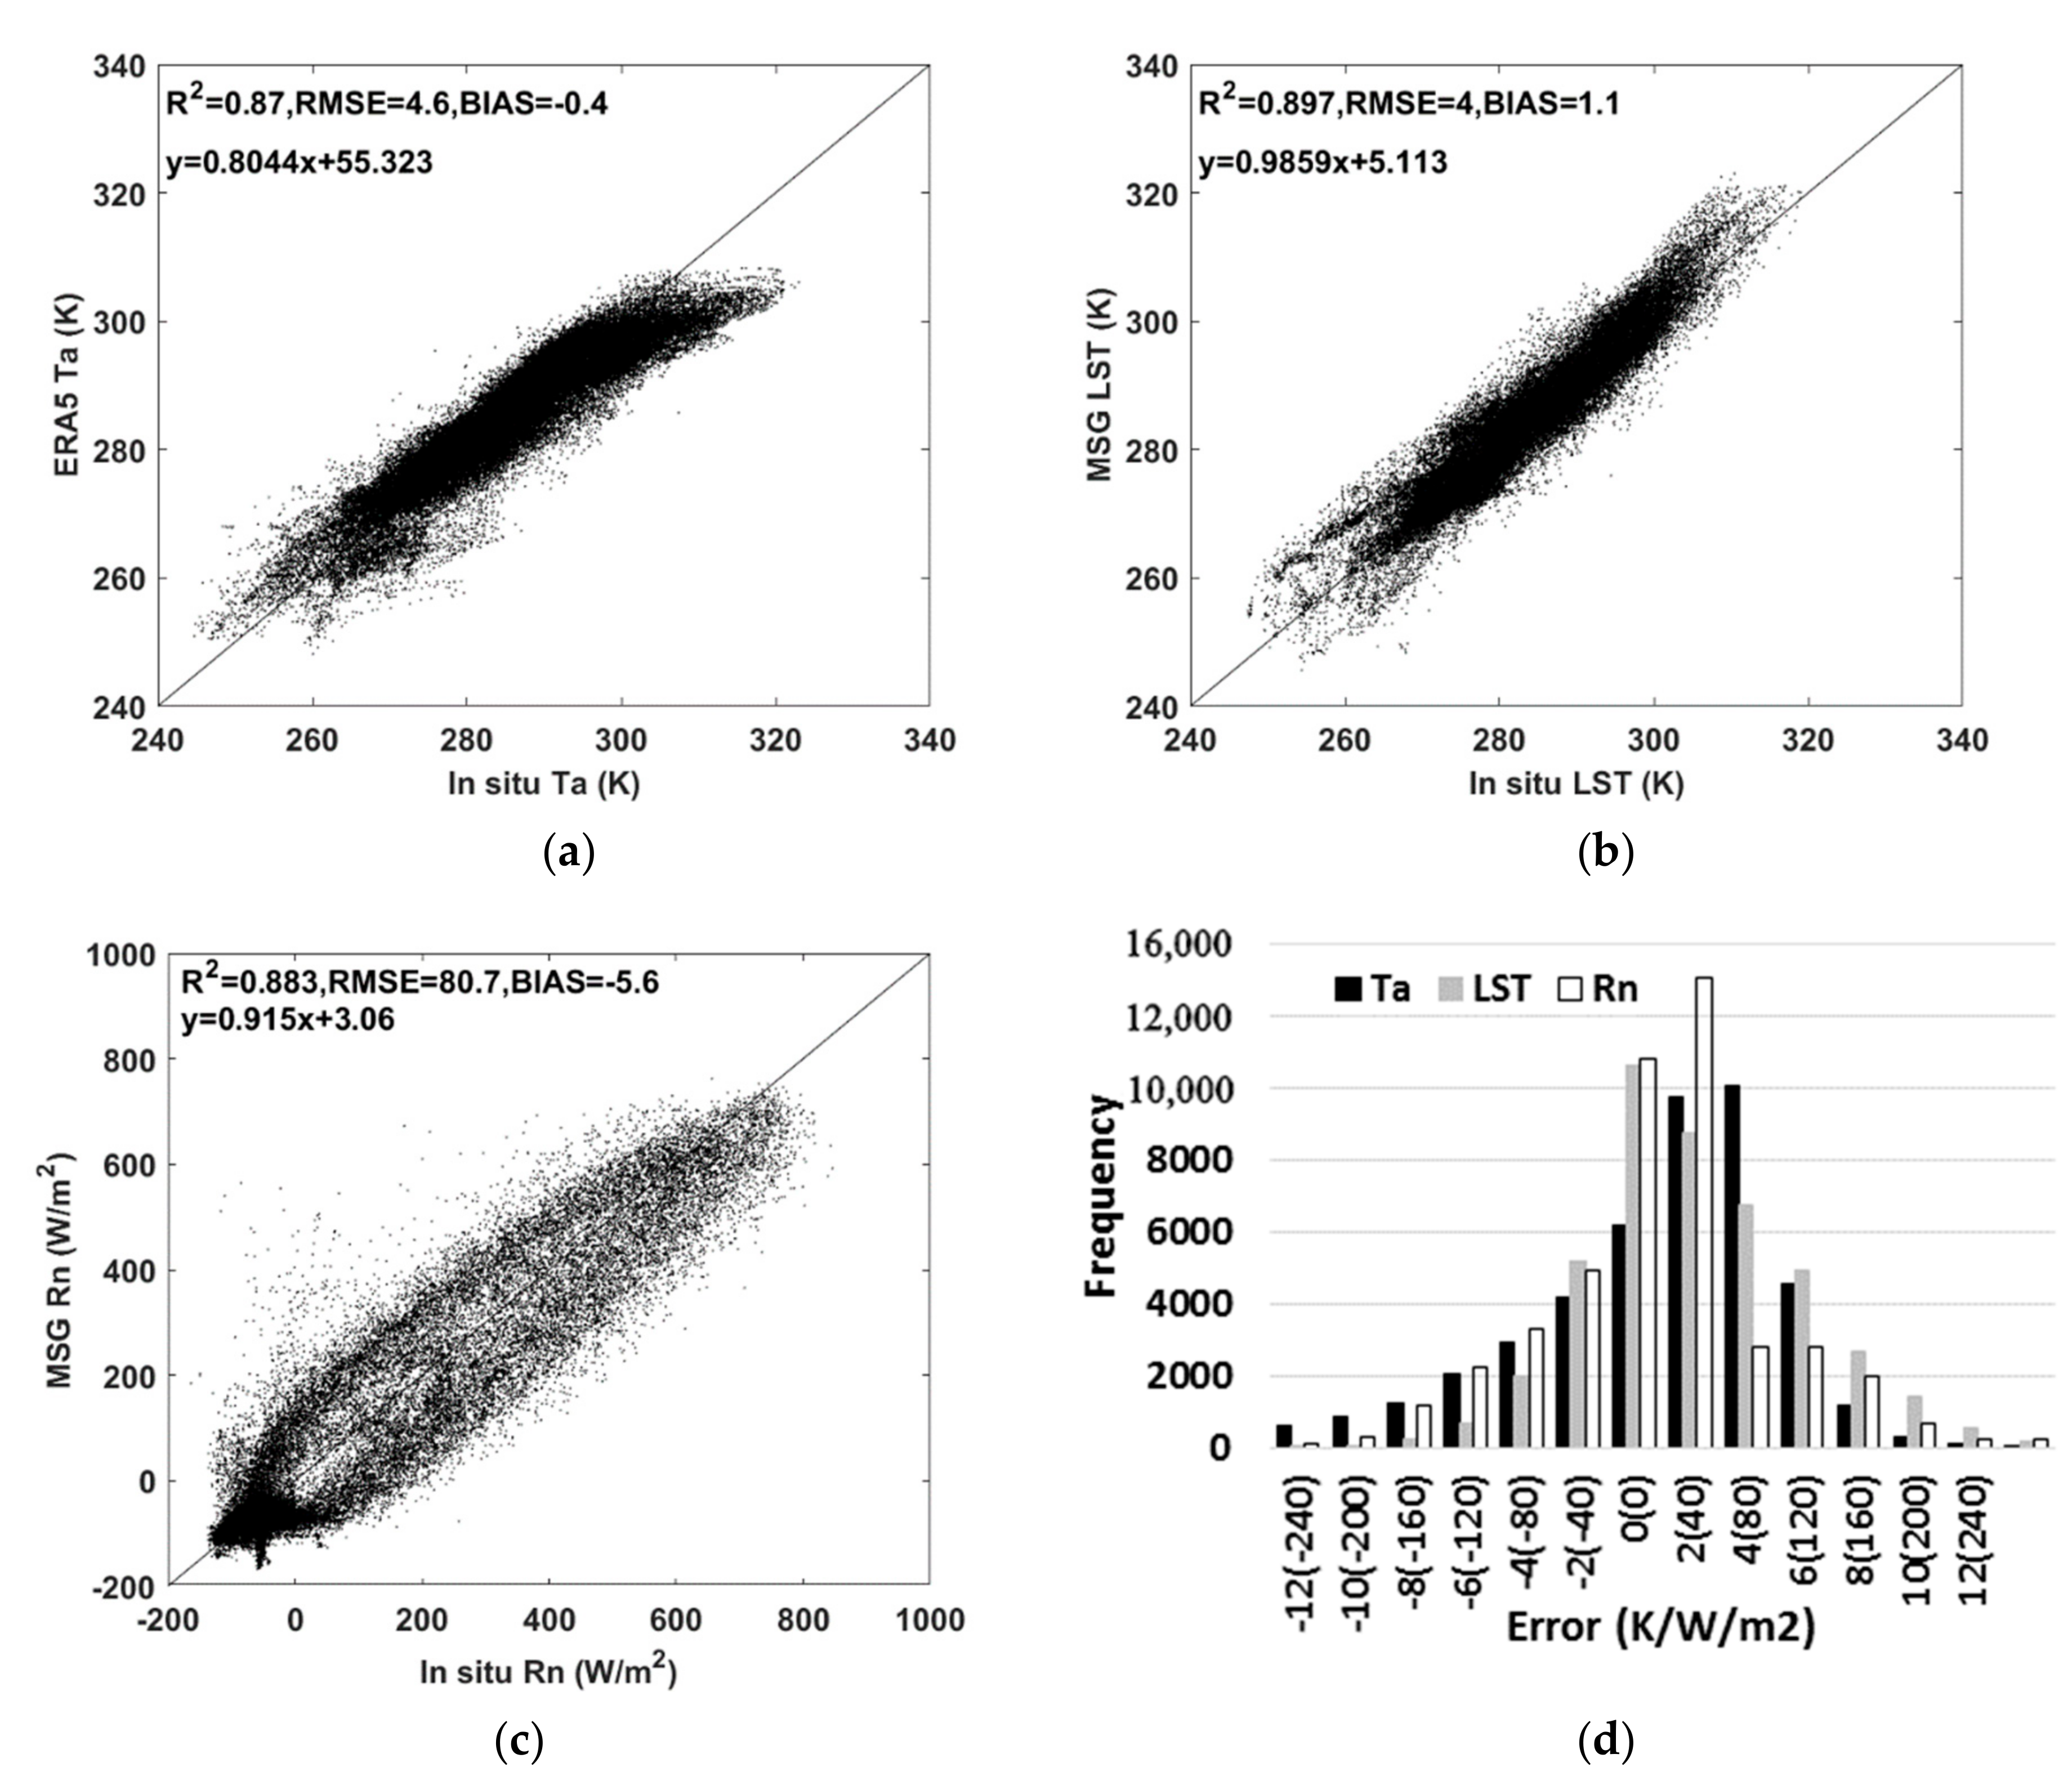
The input variables of the improved scheme for instantaneous LE estimation were instantaneous Ta, LST, and Rn and daily ET. The error in these variables was an error source for instantaneous LE estimation from the improved scheme. Evaluation results for instantaneous ERA5 Ta, MSG LST, and MSG-based Rn by FLUXNET2015 are shown in Figure 6a–c. These RS-based variables had good agreement with in situ measurements from the FLUXNET2015 dataset, with an R2 larger than 0.870. RMSEs for Ta and LST were 4.6 and 4.0 K, respectively, and 80.7 W/m2 for Rn. Their error frequency histograms are given in Figure 6d. More than 73% of errors ranged from −4 to 4 K for Ta and LST, and from −80 to 80 W/m2 for Rn. Inconsistent spatial representativeness between remote sensing spatial resolution and site observations is a key problem for remote sensing validation [48,49], which is also the main reason for the inconsistency of RS-based variables compared with in situ measurements in this section, as well as for the results shown in Section 3.1.
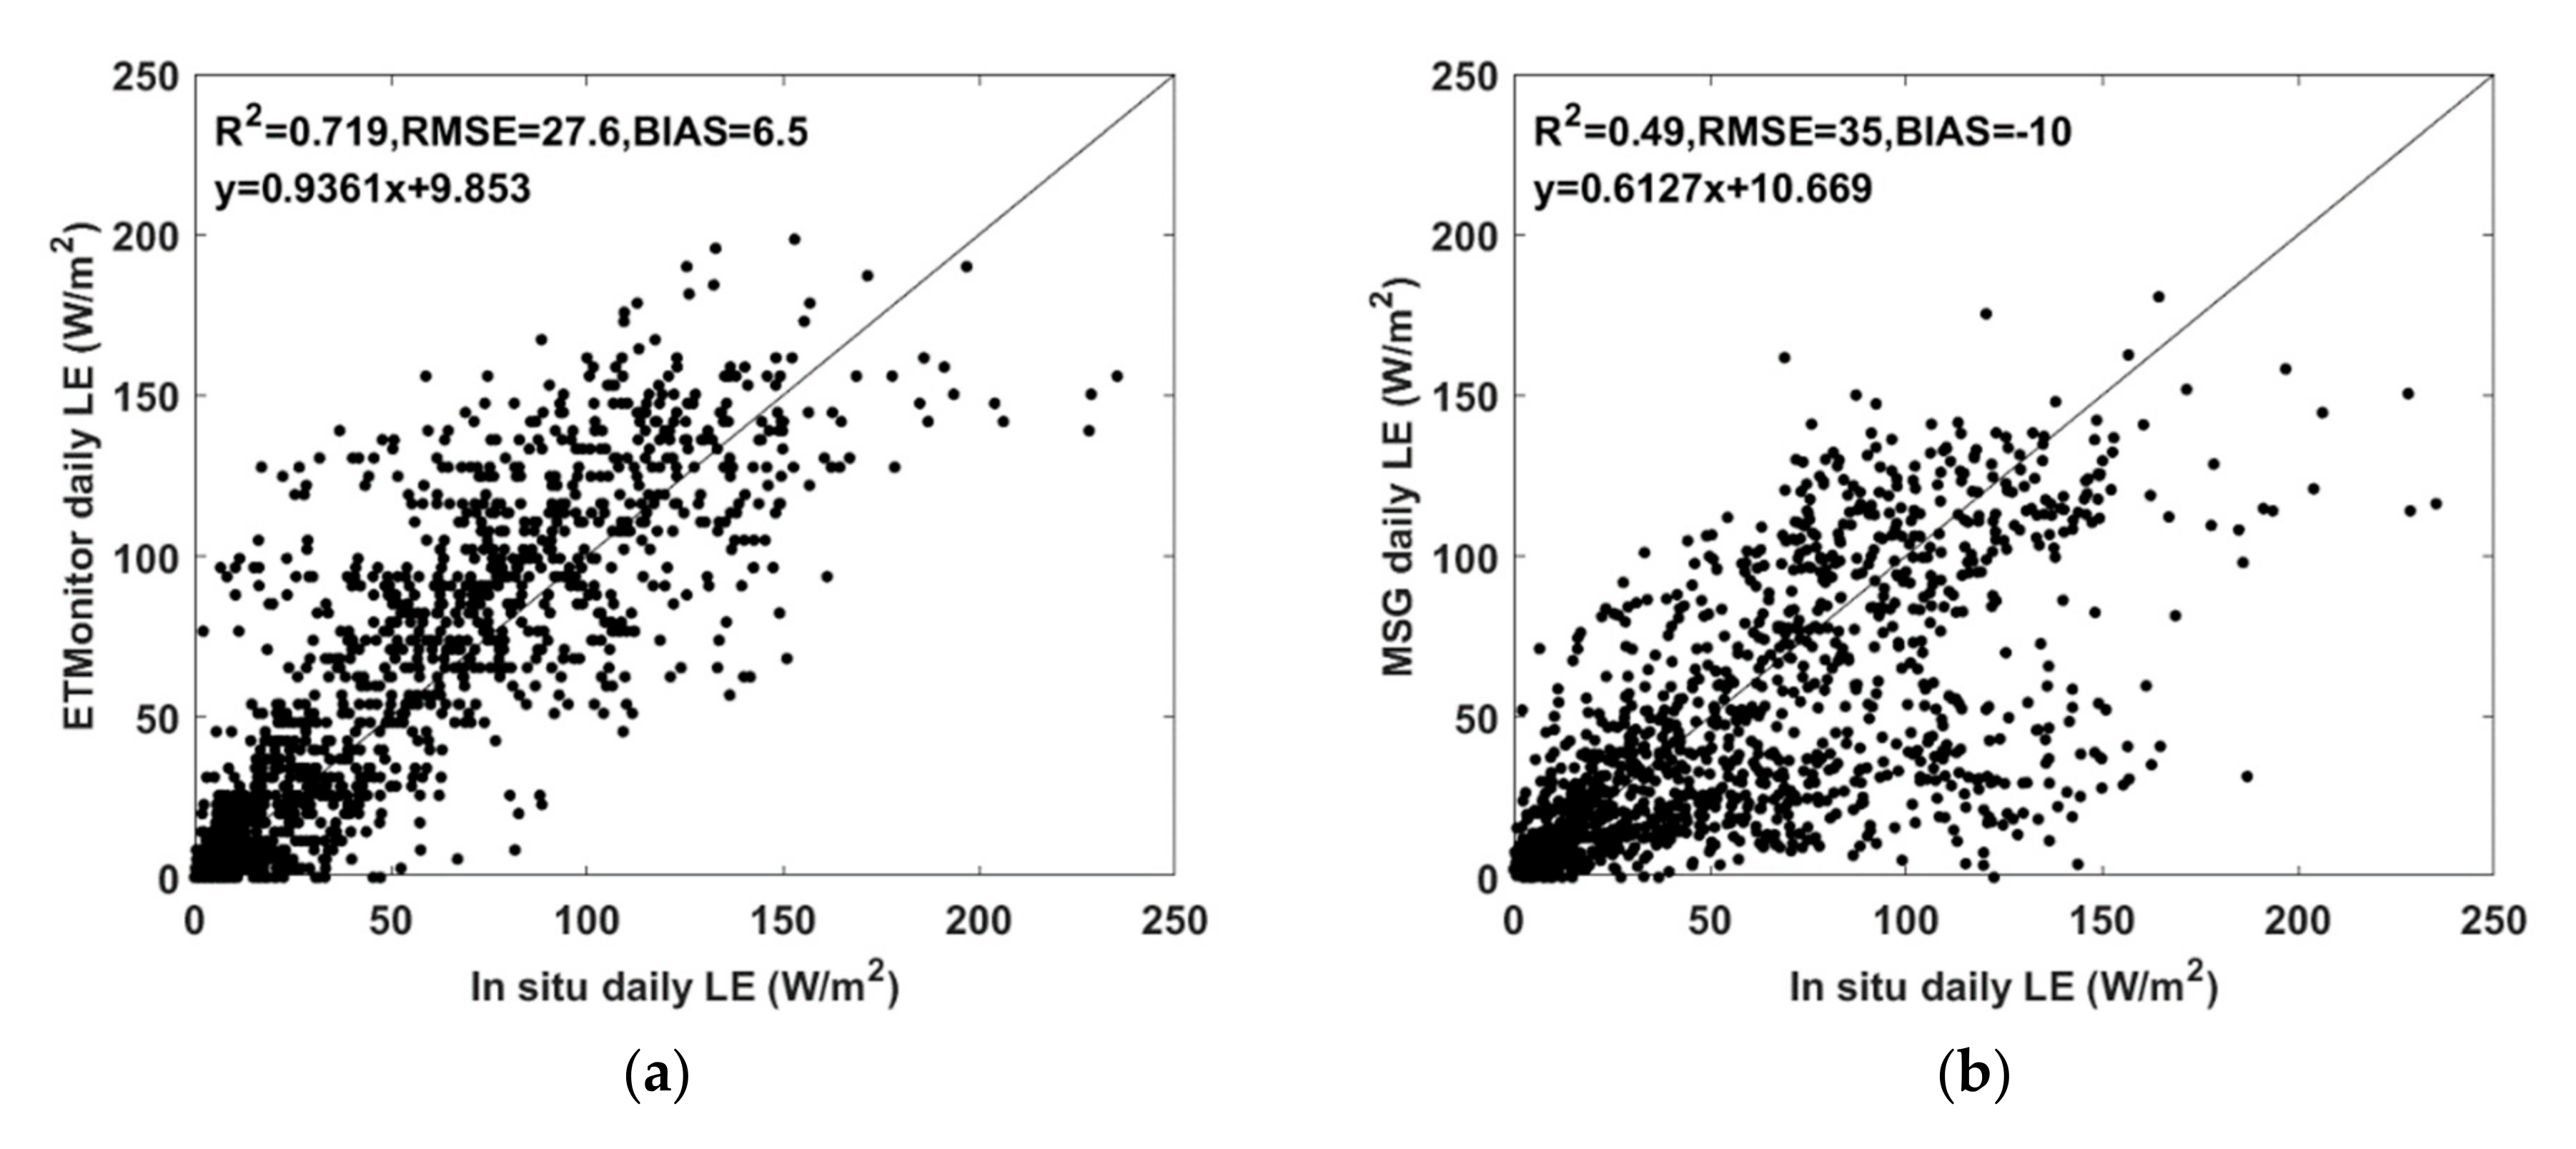
Daily LE is required as a constraint in the improved method. Although it is not a direct input variable for instantaneous LE estimation, it constrains the solution of Equation (6) and further affects instantaneous LE. Figure 7a shows that ETMonitor daily ET was in good agreement with in situ measurements, with an R2 of 0.719, RMSE of 27.6 W/m2 (0.96 mm/day), and slight overestimation, with a BIAS of 6.5 W/m2. The result was better than that of the MSG daily ET product, as shown in Figure 7b. As with the MSG instantaneous ET product shown in Figure 3c, the MSG daily ET product underestimated ET by 10 W/m2, with an R2 of 0.490 and RMSE of 35 W/m2 (1.42 mm/day).
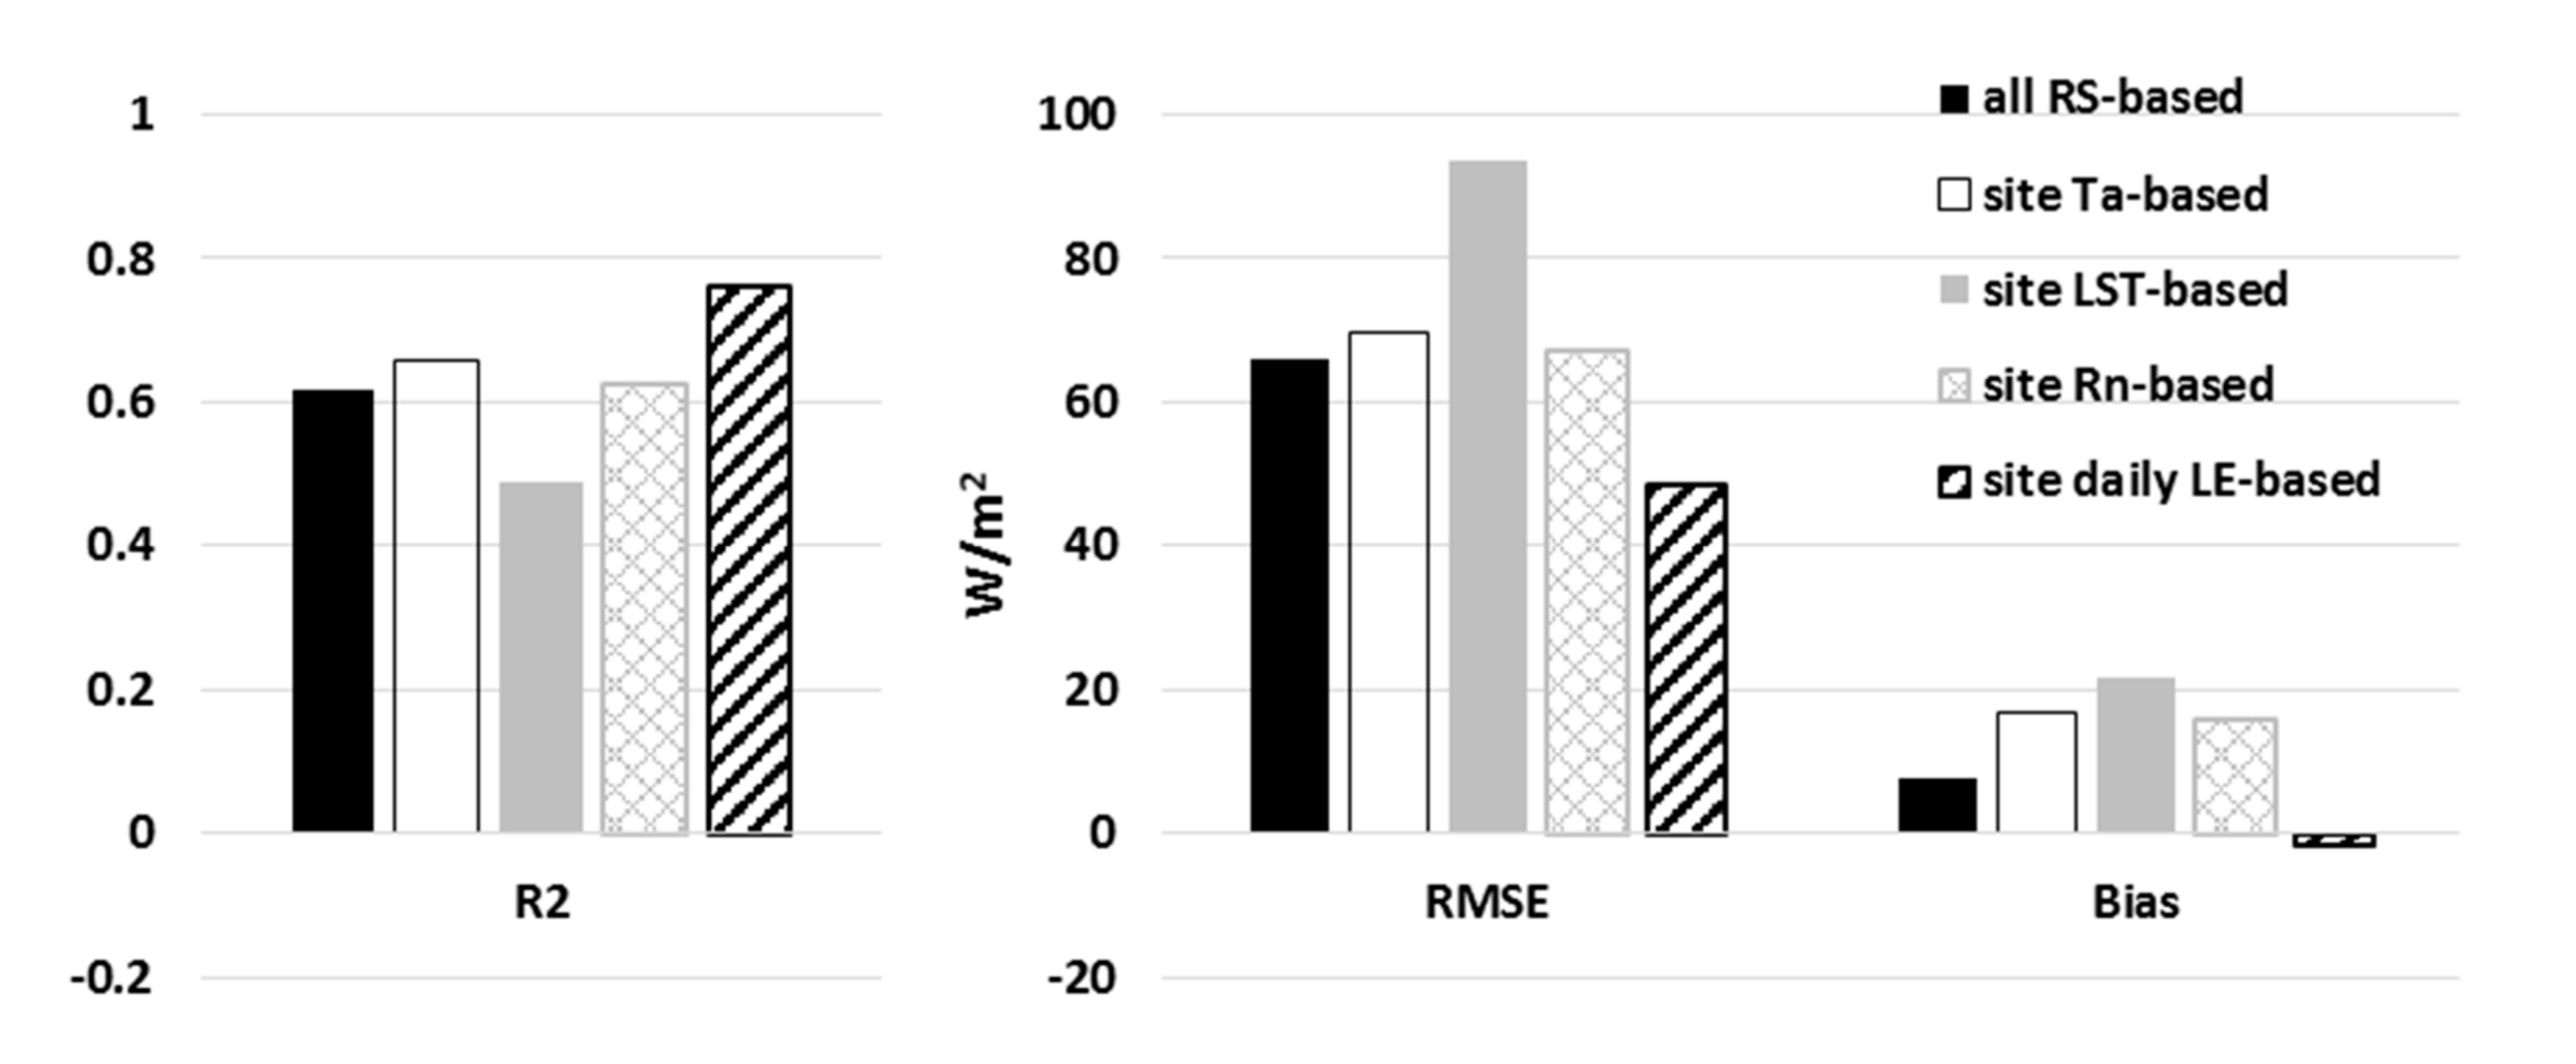
To analyze the sensitivity of the instantaneous LE estimates to the error of the input variable, we used each input variable from site observations to replace each input from remote sensing into the improved method. The estimated instantaneous LE are compared with in situ measurements, and the R2, RMSE, and BIAS are shown by the bar chart in Figure 8. The black mark is the result shown in Figure 3a, i.e., all inputs from remote sensing data. When site Ta, LST, and Rn are, respectively, the input, the estimated LE is not improved, even becoming a little worse, especially for estimation based on site LST as input. Surface net radiation, especially for the outgoing longwave radiation, is related to land surface temperature. When site LST is the input, the input Rn is still from MSG-based Rn. Inconsistent inputs cause the energy balance non-closure because of the inconsistent radiation source, while surface energy balance is the principal foundation of the method of Lu et al. (2014). When site daily LE instead of ETMonitor daily LE is regarded as the constraint into Equation (6), the estimated instantaneous LE is optimal with R2 of 0.761, RMSE of 48.5 W/m2, and a slight underestimation of 1.5 W/m2. The results indicate that the accuracy of the instantaneous LE estimation from the improved scheme depends on the daily ET error and is not very sensitive to the error of Ta, LST, and Rn. The higher is the accuracy for the daily ET, the closer are the real values to the instantaneous ET estimation.

3.3. Uncertainties from Simplified Parameterization

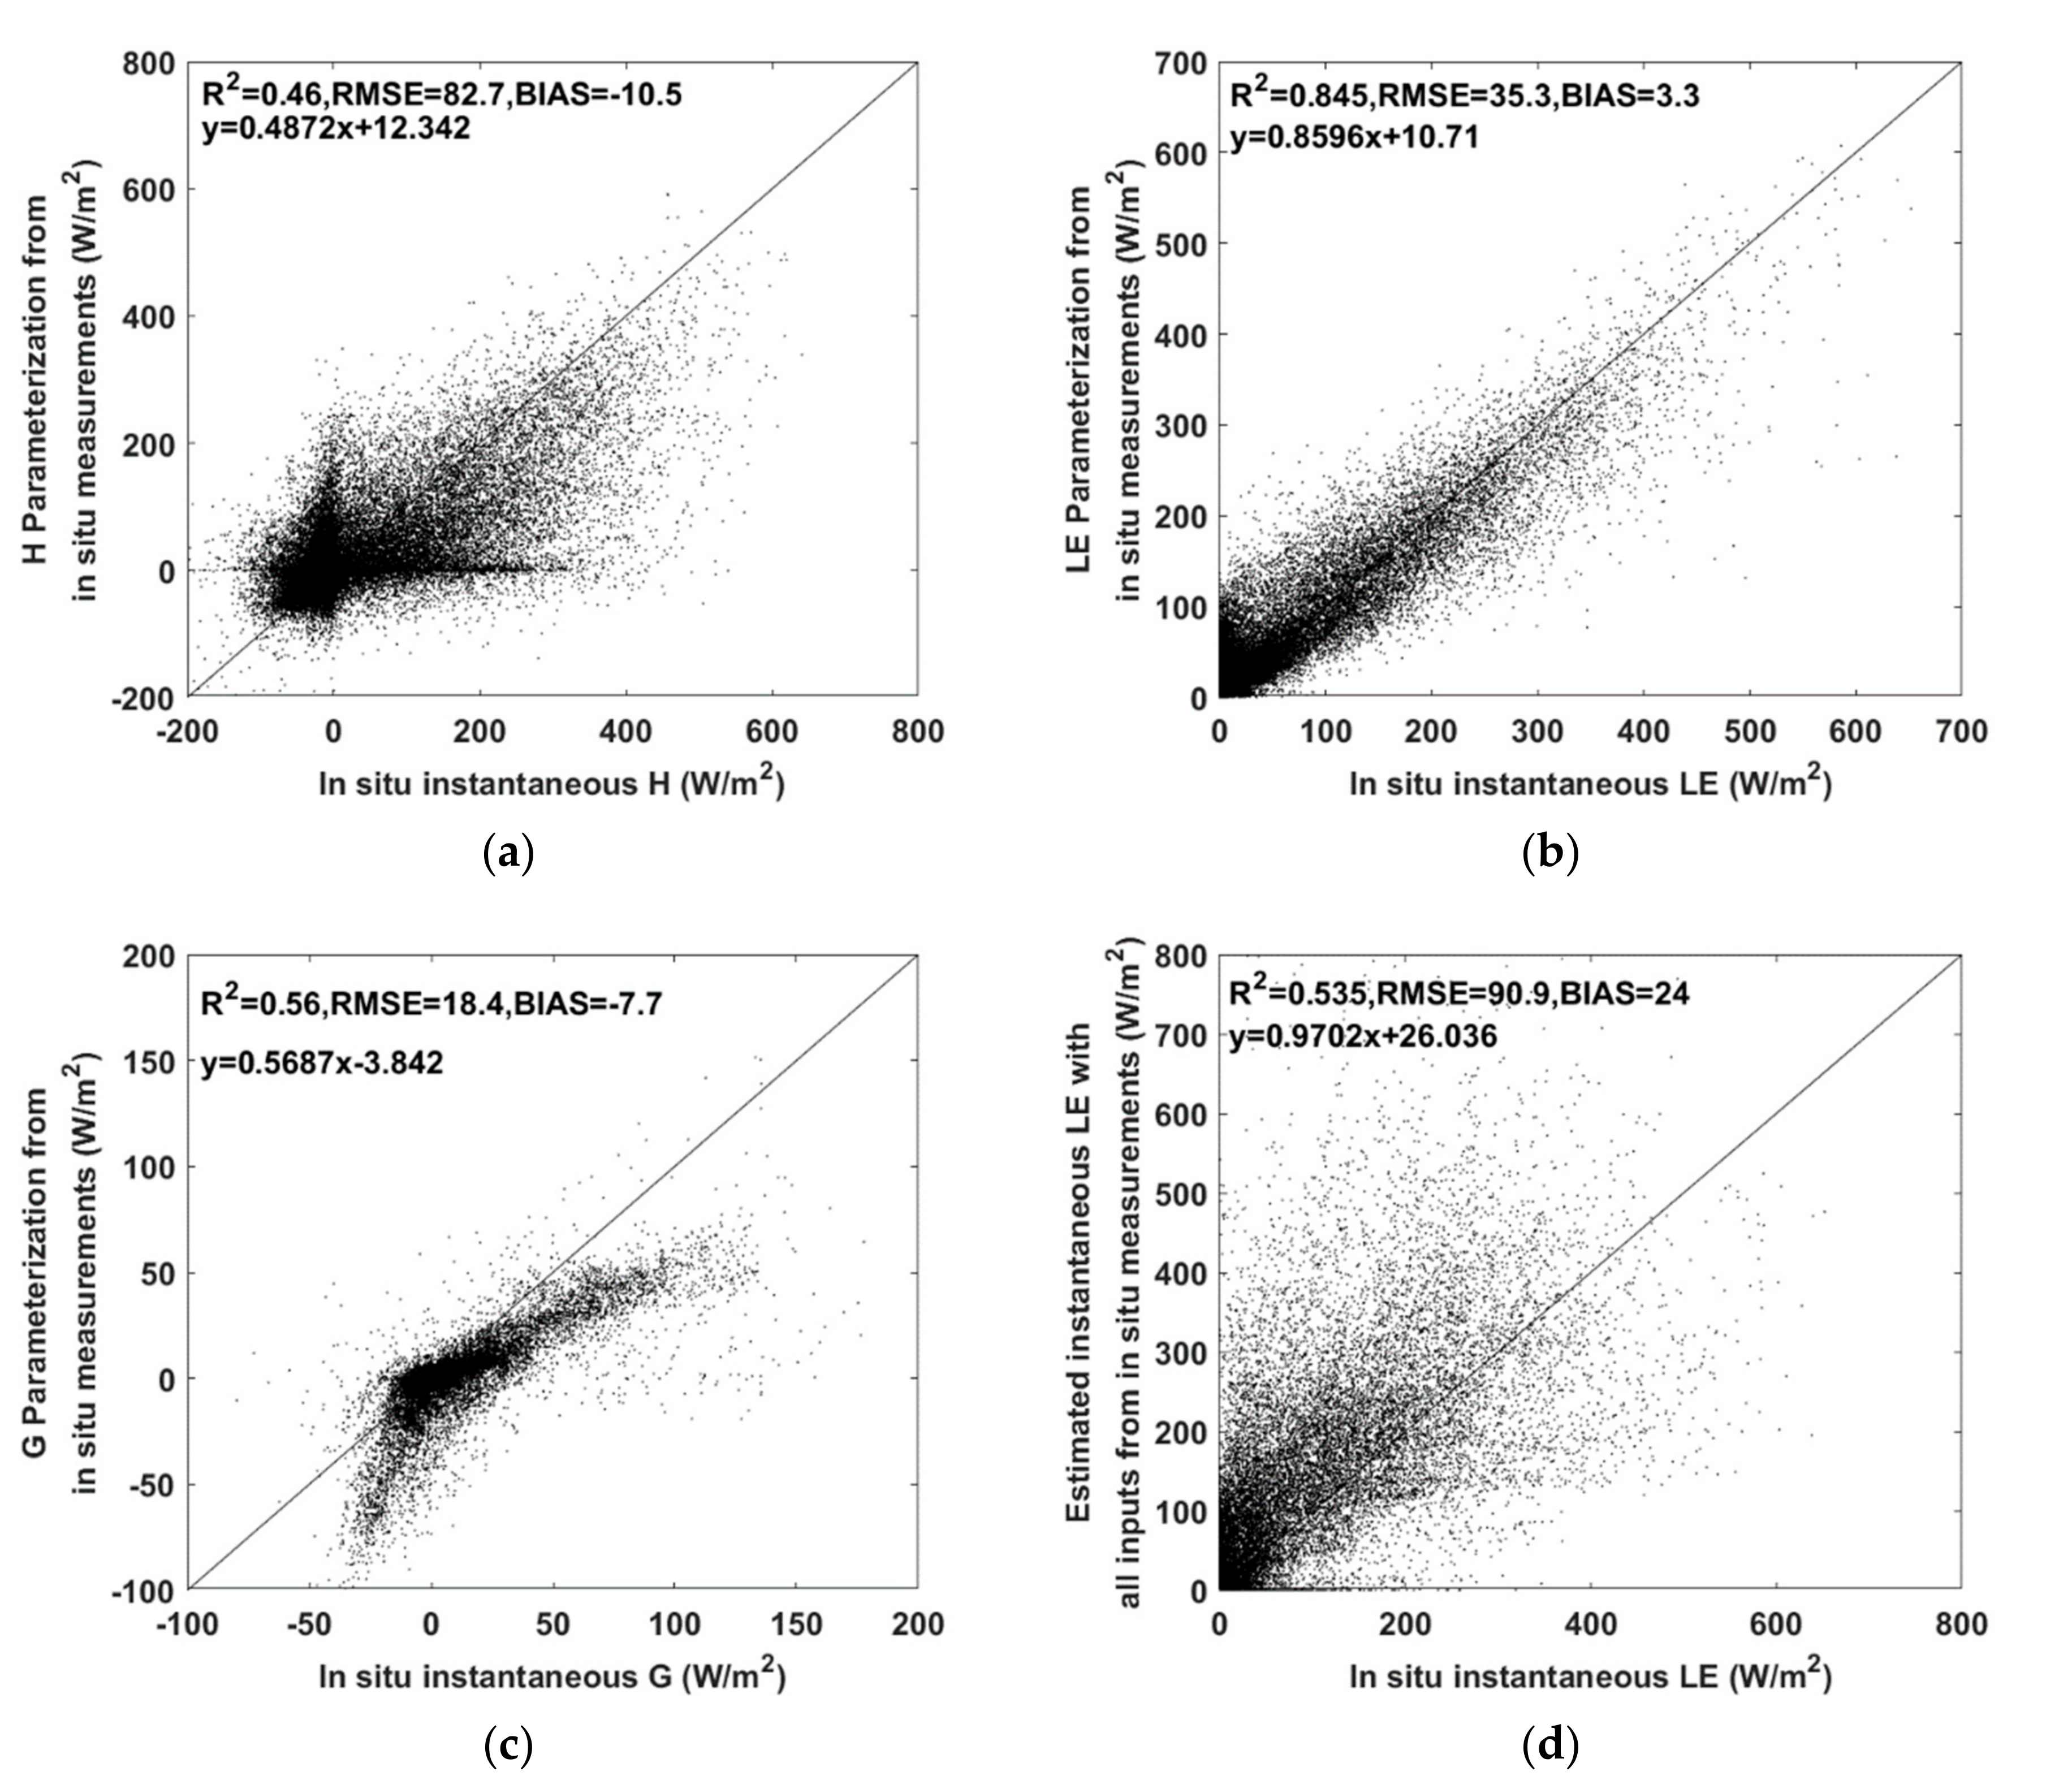
H, LE, and G were simplified as functions of some unknown constants in one-day period, land surface temperature, and air temperature on the basis of the bulk heat transfer and heat conductivity equations, that is, the expressions in Equations (1)–(3). These unknown constants would be solved by the surface energy balance equation, which had been converted to solve the ill-posed problem of Equation (6). The accuracy of simplified parameterization affected the stability of the solution of the ill-posed problem. If simplified parameterization is not perfect, it leads to vast differences between the parameterized net radiation and the one as input, and directly influences the solution of the ill-posed equation. To test the adaptability of these simplified parameterizations at the sites in this study, H, LE, and G parameterizations, given in Section 2.1, were assessed using in situ measurements (Figure 9a–c). Parameterized H, LE, and G were calculated by the fit of the least-squares method according to Equations (1)–(3) using in situ measurements. The parameterized LE was more related to in situ measurements with an R2 of 0.845 and RMSE of 35.3 W/m2. The simplified scheme for H was not very well compared with in situ measurements, which may be attributed to the improper simplification in H parameterization [35]. The deficiency of H parameterization requires more studies in the future. The parameterized G had slight underestimation. Measurement errors, the imperfect parameterization, and the inconsistent source area of the observed variables led to significant discrepancy between the sum of parameterized H, LE, and G and measured Rn in the surface energy balance equation. Therefore, even though all inputs in the improved scheme were from in situ measurements, the estimated instantaneous LE was not in good agreement with the in situ measurements shown in Figure 9d, and not better than the results from RS-based inputs shown in Figure 3a. The better results from the RS-based inputs may be attributed to the relatively consistent spatial representativeness from remote sensing data.
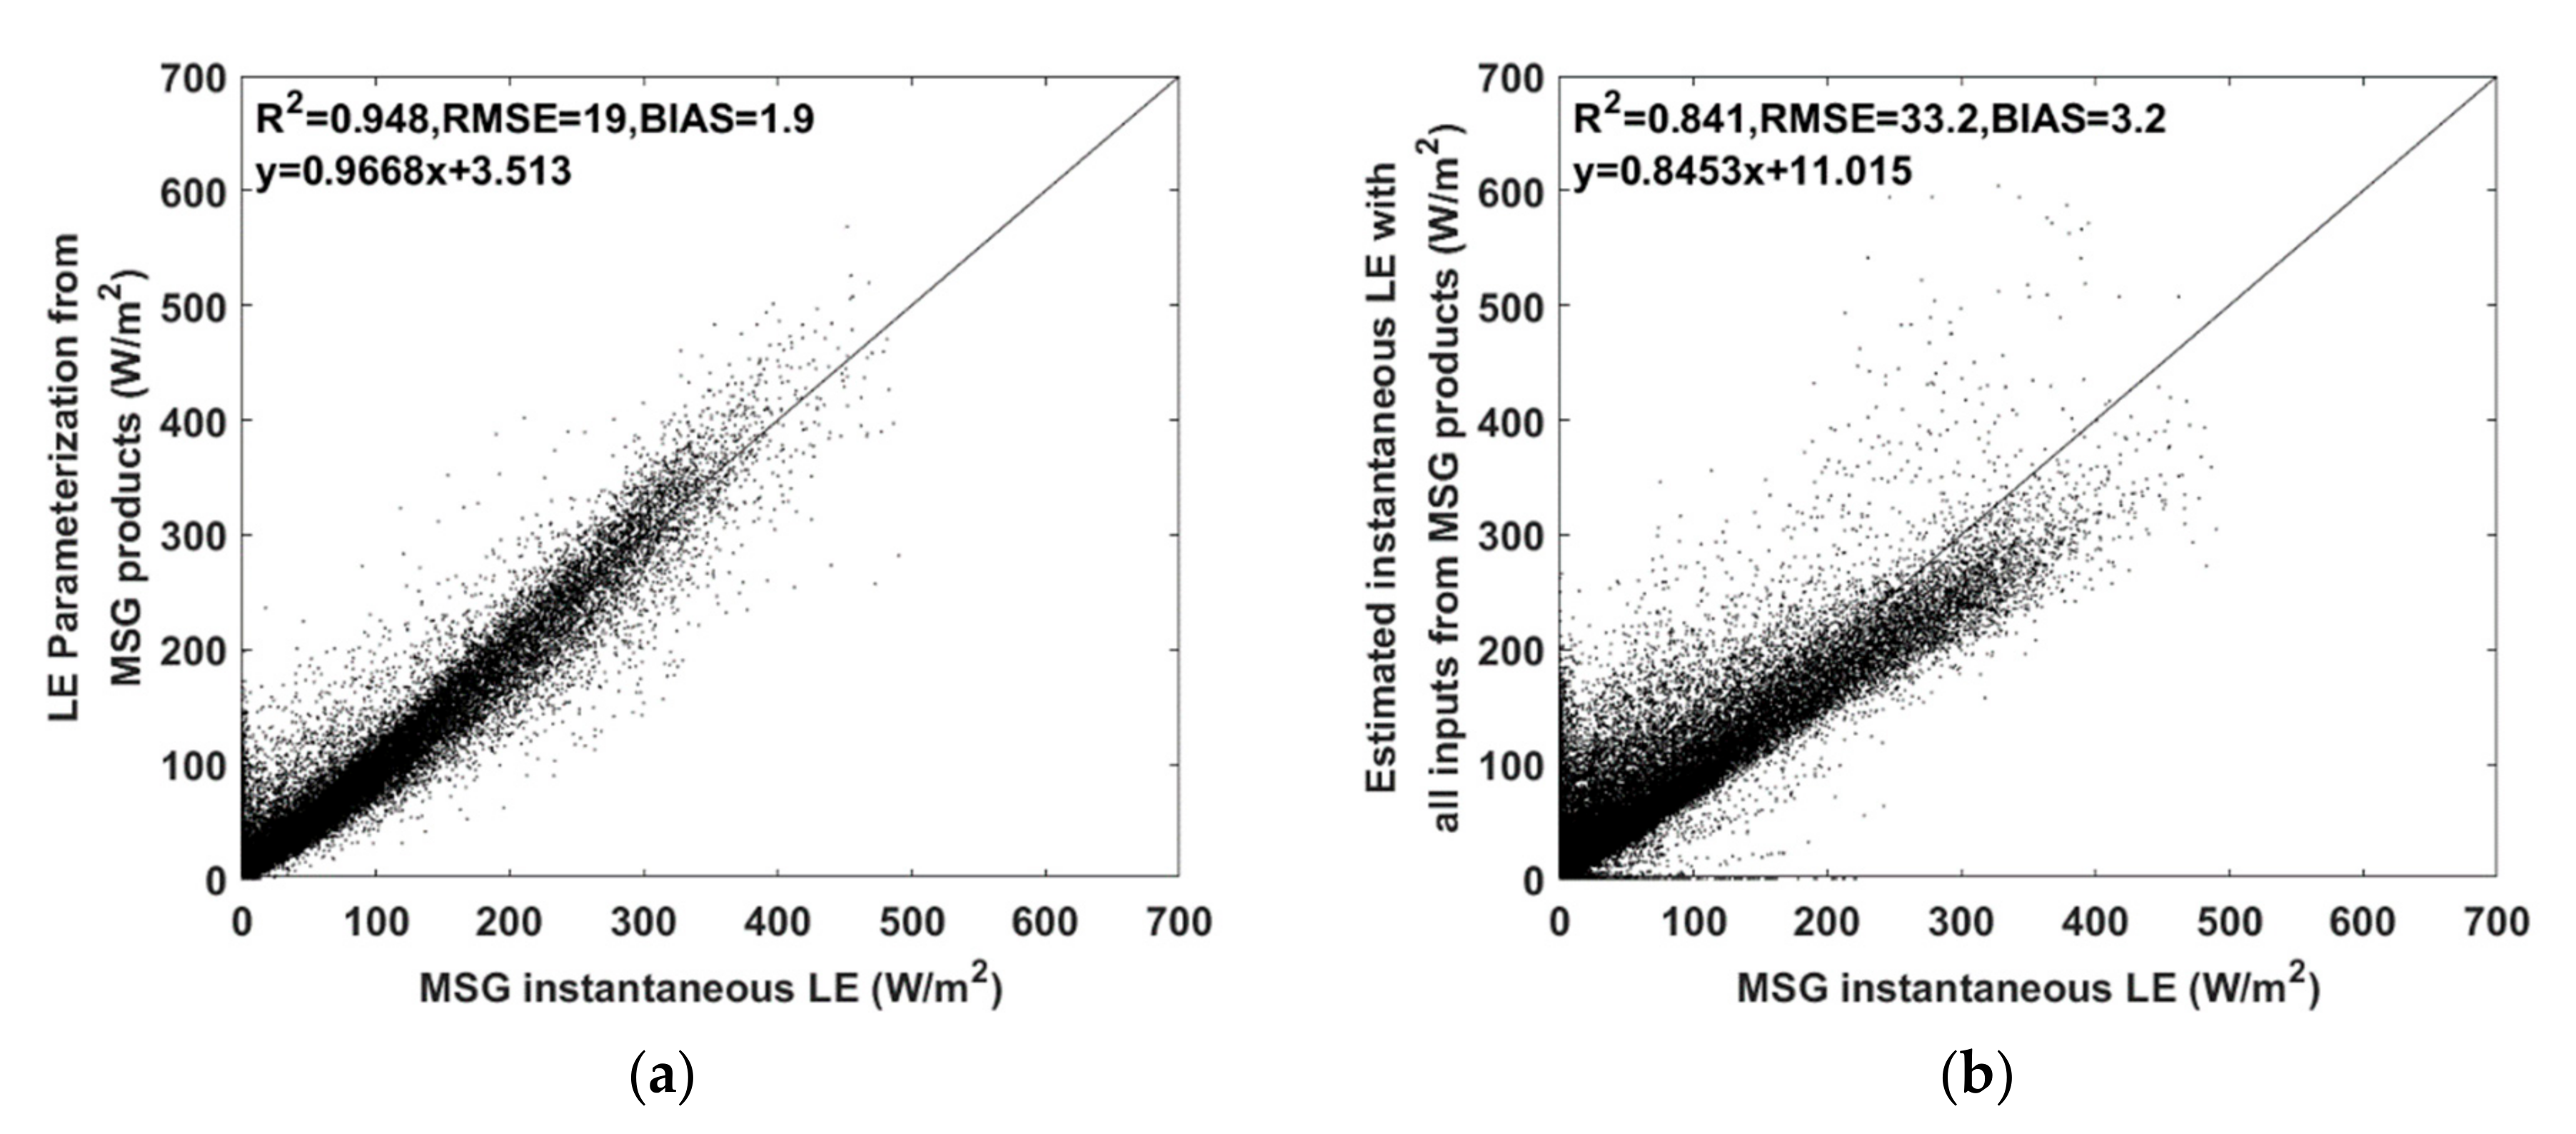
MET products at the half-hourly scale were used to evaluate the accuracy of LE parameterization. LE parameterization was close to the MET product, with an R2 of 0.948 and RMSE of 19.0 W/m2 (Figure 10a). This can easily be understood because the MET product was mainly generated by bulk transfer formulation, which is also the foundation of the simplified parameterization. Generally, the simplification of LE parameterization is reasonable, i.e., LE could be parameterized as the function of three constants, land surface temperature, and air temperature. When all inputs in Equation (6) were from MSG products, estimated instantaneous LE was strongly related to the MSG ET product, as expected, with an R2 of 0.841 and RMSE of 33.2 W/m2 (Figure 10b). ET estimation in the MSG ET scheme was based on surface energy balance. Meanwhile, all inputs were from MSG products, implying the same spatial representativeness and good surface energy balance closure. Therefore, under the condition of good surface energy balance closure, the improved scheme could estimate instantaneous LE well. Any factors leading to energy balance non-closure influence the solution of Equation (6). This may be the primary error source of the improved scheme.

4. Conclusions

The diurnal ET cycle is helpful in the study of the dynamics of the atmospheric boundary layer. Geostationary meteorological satellites can provide continuous surface observation, which is very important for continuous surface flux estimation. Differing from the conventional RS-based ET method, the study used MSG land surface temperature and radiation data as inputs to develop an improved scheme to estimate the diurnal ET cycle by solving the surface energy balance equation with ETMonitor daily ET as the constraint, i.e., a scheme from daily ET to the diurnal cycle of ET. Results were evaluated by measurements at 35 sites located in Europe from the FLUXNET2015 dataset. The estimated half-hourly LE agreed well with in situ measurements, with an R2 of 0.617 and RMSE of 65.8 W/m2, better than those of the MSG ET product, and comparable with ECMWF ERA5 ET data. The improved scheme for estimating the diurnal cycle of ET is not very sensitive to errors in air temperature, land surface temperature, and net radiation, but depends on daily ET errors. When daily ET is from in situ measurements, estimated instantaneous LE can be improved. Errors leading to surface energy balance non-closure influenced the accuracy of the improved scheme. When all inputs were from MSG products, estimated instantaneous LE was strongly related to the MSG ET product. Because land surface temperature is an input of the method, obtaining continuous land surface temperature data, especially during cloudy days, is crucial for this method, which is also key to current LST-based ET methods. With the development of methods for LST retrieval for cloudy days and accuracy improvement of daily ET estimation, the method of the diurnal cycle of ET estimation developed in this study has the application potential.

Author Contributions

J.L. developed the methodology, analyzed results, and wrote the original manuscript; L.J. supervised the paper and suggested data use; C.Z. provided the RS-based ETMonitor ET data and the processing of the FLUXNET2015 dataset and reviewed the manuscript; R.T. gave some advice and ideas about the development of the methodology; and Y.J. reviewed and polished the manuscript. All authors have read and agreed to the published version of the manuscript.

Funding

This study was supported by the National Key Research and Development Program of China [grant number 2017YFC0405802] and the National Natural Science Foundation of China [grant numbers 41501405, 41801346, and 41701495].

Acknowledgments

The EUMERSAT’s Satellite Application Facility on Land Surface Analysis (LSA–SAF) operations center, FLUXNET research community, ECMWF’s Climate Data Store, and the National Tibetan Plateau Data Center are acknowledged for providing the freely downloadable data for this study.

Conflicts of Interest

The authors declare no conflict of interest.

References

  1. Kleidon, A.; Renner, M. Diurnal land surface energy balance partitioning estimated from the thermodynamic limit of a cold heat engine. Earth Syst. Dynam. 2018, 9, 1127–1140. [Google Scholar] [CrossRef] [Green Version]
  2. Stocker, T.F.; Qin, D.; Plattner, G.-K.; Tignor, M.; Allen, S.K.; Boschung, J.; Nauels, A.; Xia, Y.; Bex, V.; Midgley, P.M. Climate Change 2013: The Physical Science Basis. Working Group I Contribution to the Fifth Assessment Report of the Intergovernmental Panel on Climate Change; Cambridge University Press: Cambridge, UK; New York, NY, USA, 2013; p. 1535. [Google Scholar]
  3. Oki, T.; Kanae, S. Global hydrological cycles and world water resources. Science 2006, 313, 1068. [Google Scholar] [CrossRef] [PubMed] [Green Version]
  4. Gowda, P.H.; Chavez, J.L.; Colaizzi, P.D.; Evett, S.R.; Howell, T.A.; Tolk, J.A. ET mapping for agricultural water management: Present status and challenges. Irrig. Sci. 2008, 26, 223–237. [Google Scholar] [CrossRef] [Green Version]
  5. McCabe, M.; Wood, E.; Wojcik, R.; Pan, M.; Sheffield, J.; Gao, H. Hydrological consistency using multi-sensor remote sensing data for water and energy cycle studies. Remote Sens. Environ. 2008, 112, 430–444. [Google Scholar] [CrossRef]
  6. Wambura, F.J.; Dietrich, O. Analysis of Agricultural Drought Using Remotely Sensed Evapotranspiration in a Data-Scarce Catchment. Water 2020, 12, 998. [Google Scholar] [CrossRef] [Green Version]
  7. Wang, H.J.; Xiao, W.H.; Zhao, Y.; Wang, Y.C.; Hou, B.D.; Zhou, Y.Y.; Yang, H.; Zhang, H.; Cui, H. The Spatiotemporal Variability of Evapotranspiration and Its Response to Climate Change and Land Use/Land Cover Change in the Three Gorges Reservoir. Water 2019, 11, 1739. [Google Scholar] [CrossRef] [Green Version]
  8. Nhamo, L.; Mabhaudhi, T.; Magombeyi, M. Improving Water Sustainability and Food Security through Increased Crop Water Productivity in Malawi. Water 2016, 8, 411. [Google Scholar] [CrossRef]
  9. Li, Z.-L.; Tang, R.L.; Wan, Z.M.; Bi, Y.Y.; Zhou, C.H.; Tang, B.H.; Yan, G.J.; Zhang, X.Y. A review of current methodologies for regional evapotranspiration estimation from remotely sensed data. Sensors 2009, 9, 3801–3853. [Google Scholar] [CrossRef] [Green Version]
  10. Zhang, K.; Kimball, J.S.; Running, S.W. A review of remote sensing based actual evapotranspiration estimation. Wires Water 2016, 3, 834–853. [Google Scholar] [CrossRef]
  11. Su, Z. The Surface Energy Balance System (SEBS) for estimation of turbulent heat fluxes. Hydrol. Earth Syst. Sci. 2002, 6, 85–99. [Google Scholar] [CrossRef]
  12. Mu, Q.Z.; Zhao, M.S.; Running, S.W. Improvements to a MODIS global terrestrial evapotranspiration algorithm. Remote Sens. Environ. 2011, 115, 1781–1800. [Google Scholar] [CrossRef]
  13. Hu, G.; Jia, L. Monitoring of evapotranspiration in a semi-arid inland river basin by combining microwave and optical remote sensing observations. Remote Sens. 2015, 7, 3056–3087. [Google Scholar] [CrossRef] [Green Version]
  14. Jansen, F.A.; Teuling, A.J. Evaporation from a large lowland reservoir-(dis)agreement between evaporation models from hourly to decadal timescales. Hydrol. Earth Syst. Sci. 2020, 24, 1055–1072. [Google Scholar] [CrossRef] [Green Version]
  15. Davis, K.J.; Lenschow, D.H.; Oncley, S.P.; Kiemle, C.; Ehret, G.; Giez, A.; Mann, J. Role of entrainment in surface-atmosphere interactions over the boreal forest. J. Geophys. Res. 1997, 102, 29219–29230. [Google Scholar] [CrossRef]
  16. Xiang, T.; Vivoni, E.R.; Gochis, D.J.; Mascaro, G. On the diurnal cycle of surface energy fluxes in the North American monsoon region using the WRF-Hydro modeling system. J. Geophys. Res. 2017, 122, 9024–9049. [Google Scholar] [CrossRef]
  17. Renner, M.; Brenner, C.; Mallick, K.; Wizemann, H.D.; Conte, L.; Trebs, I.; Wei, J.; Wulfmeyer, V.; Schulz, K.; Kleidon, A. Using phase lags to evaluate model biases in simulating the diurnal cycle of evapotranspiration: A case study in Luxembourg. Hydrol. Earth Syst. Sci. 2019, 1, 1–535. [Google Scholar] [CrossRef] [Green Version]
  18. Wilson, K.B.; Baldocchi, D.; Falge, E.; Aubinet, M.; Berbigier, P.; Bernhofer, C.; Dolman, H. Diurnal centroid of ecosystem energy and carbon fluxes at FLUXNET sites. J. Geophys. Res. 2003, 108, D21. [Google Scholar] [CrossRef]
  19. Anderson, M.C.; Norman, J.M.; Mecikalski, J.R.; Otkin, J.A.; Kustas, W.P. A climatological study of evapotranspiration and moisture stress across the continental United States based on thermal remote sensing: 1. Model formulation. J. Geophys. Res. 2007, 112, 10117. [Google Scholar] [CrossRef]
  20. Ghilain, N.; Arboleda, A.; Gellens-Meulenberghs, F. Evapotranspiration modelling at large scale using near-real time MSG SEVIRI derived data. Hydrol. Earth Syst. Sci. 2010, 7, 7079–7120. [Google Scholar] [CrossRef]
  21. Arboleda, A.; Ghilain, N.; Gellens-Meulenberghs, F. Continuous monitoring of evapotranspiration (ET) overview of LSA-SAF evapotranspiration products. In SPIE Remote Sens 10421, Remote Sensing for Agriculture, Ecosystems, and Hydrology XIX; International Society for Optics and Photonics: Bellingham, WA, USA, 2017. [Google Scholar] [CrossRef]
  22. Zhao, W.L.; Qiu, G.Y.; Xiong, Y.J.; Paw, U.K.T.; Gentine, P.; Chen, B.Y. Uncertainties Caused by Resistances in Evapotranspiration Estimation Using High-Density Eddy Covariance Measurements. J. Hydrometeorol. 2020, 21, 1349–1365. [Google Scholar] [CrossRef]
  23. Gerhards, M.; Schlerf, M.; Mallick, K.; Udelhoven, T. Challenges and Future Perspectives of Multi-/Hyperspectral Thermal Infrared Remote Sensing for Crop Water-Stress Detection: A Review. Remote Sens. 2019, 11, 1240. [Google Scholar] [CrossRef] [Green Version]
  24. Zheng, C.; Wang, Q.; Li, P.H. Coupling SEBAL with a new radiation module and MODIS products for better estimation of evapotranspiration. Hydrol. Sci. J. 2016, 61, 1535–1547. [Google Scholar] [CrossRef]
  25. Long, D.; Singh, V.P.; Li, Z.-L. How sensitive is SEBAL to changes in input variables, domain size and satellite sensor? J. Geophys. Res. 2011, 116, D21107. [Google Scholar] [CrossRef]
  26. Priestley, C.; Taylor, R. On the assessment of surface heat flux and evaporation using large-scale parameters. Mon. Weather Rev. 1972, 100, 81–92. [Google Scholar] [CrossRef]
  27. Yao, Y.; Liang, S.; Yu, J.; Zhao, S.; Lin, Y.; Jia, K.; Zhang, X.; Cheng, J.; Xie, X.; Sun, L.; et al. Differences in estimating terrestrial water flux from three satellite-based Priestley-Taylor algorithms. Int. J. Appl. Earth Obs. 2017, 56, 1–12. [Google Scholar] [CrossRef]
  28. Price, J.C. Using spatial context in satellite data to infer regional scale evapotranspiration. IEEE T. Geosci. Remote 1990, 28, 940–948. [Google Scholar] [CrossRef] [Green Version]
  29. Tang, R.; Li, Z.-L.; Tang, B. An application of the Ts–VI triangle method with enhanced edges determination for evapotranspiration estimation from MODIS data in arid and semi-arid regions: Implementation and validation. Remote Sens. Environ. 2010, 114, 540–551. [Google Scholar] [CrossRef]
  30. Long, D.; Singh, V.P.; Scanlon, B.R. Deriving theoretical boundaries to address scale dependencies of triangle models for evapotranspiration estimation. J. Geophys. Res. 2012, 117, D05113. [Google Scholar] [CrossRef]
  31. Wang, J.; Bras, R. A model of evapotranspiration based on the theory of maximum entropy production. Water Resour. Res. 2011, 47, W03521. [Google Scholar] [CrossRef]
  32. Xu, D.; Agee, E.; Wang, J.; Ivanov, V.Y. Estimation of Evapotranspiration of Amazon Rainforest Using the Maximum Entropy Production Method. Geophys. Res. Lett. 2019, 46, 1402–1412. [Google Scholar] [CrossRef]
  33. Qiu, G.Y.; Shi, P.; Wang, L. Theoretical analysis of a remotely measurable soil evaporation transfer coefficient. Remote Sens. Environ. 2006, 101, 390–398. [Google Scholar] [CrossRef]
  34. Xiong, Y.J.; Zhao, W.L.; Wang, P.; Paw, U.K.T.; Qiu, G.Y. Simple and Applicable Method for Estimating Evapotranspiration and Its Components in Arid Regions. J. Geophys. Res. 2019, 124, 9963–9982. [Google Scholar] [CrossRef]
  35. Lu, J.; Tang, R.; Tang, H.; Li, Z.-L. A new parameterization scheme for estimating surface energy fluxes with continuous surface temperature, air temperature, and surface net radiation measurements. Water Resour. Res. 2014, 50, 1245–1259. [Google Scholar] [CrossRef]
  36. Zhang, K.; Kimball, J.S.; Nemani, R.R.; Running, S.W.; Hong, Y.; Gourley, J.J.; Yu, Z. Vegetation Greening and Climate Change Promote Multidecadal Rises of Global Land Evapotranspiration. Sci. Rep. 2015, 5, 15956. [Google Scholar] [CrossRef] [PubMed]
  37. Martens, B.; Gonzalez Miralles, D.; Lievens, H.; van der Schalie, R.; de Jeu, R.A.; Fernández-Prieto, D.; Beck, H.E.; Dorigo, W.; Verhoest, N. GLEAM v3: Satellite-based land evaporation and root-zone soil moisture. Geosci. Model Dev. 2017, 10, 1903–1925. [Google Scholar] [CrossRef] [Green Version]
  38. Zheng, C.; Jia, L.; Hu, G.; Lu, J. Earth Observations-Based Evapotranspiration in Northeastern Thailand. Remote Sens. 2019, 11, 138. [Google Scholar] [CrossRef] [Green Version]
  39. Jia, L.; Zheng, C.; Hu, G.C.; Menenti, M. Evapotranspiration. In Comprehensive Remote Sensing; Liang, S., Ed.; Elsevier: Oxford, UK, 2018; pp. 25–50. [Google Scholar]
  40. Zheng, C.; Jia, L. Global canopy rainfall interception loss derived from satellite earth observations. Ecohydrology 2020, 13, e2186. [Google Scholar] [CrossRef] [Green Version]
  41. Zheng, C.; Jia, L.; Hu, G. Global Land Surface Actual Evapotranspiration (2013–2014); National Tibetan Plateau Data Center: Beijing, China, 2019. [Google Scholar] [CrossRef]
  42. Allen, R.G.; Pereira, L.S.; Howell, T.A.; Jensen, M.E. Evapotranspiration information reporting: I. factors governing measurement accuracy. Agric. Water Manag. 2011, 98, 899–920. [Google Scholar] [CrossRef] [Green Version]
  43. Jia, Z.; Liu, S.; Xu, Z.; Chen, Y.; Zhu, M. Validation of remotely sensed evapotranspiration over the Hai River Basin, China. J. Geophys. Res. 2012, 117, D13113. [Google Scholar] [CrossRef]
  44. McCombs, A.G.; Hiscox, A.L.; Suyker, A.E. Point-to-Grid Conversion in Flux Footprints: Implications of Method Choice and Spatial Resolution for Regional-Scale Studies. Bound Layer Meteorol. 2019, 172, 457–479. [Google Scholar] [CrossRef]
  45. Ghilain, N.; Arboleda, A.; Sepulcre-Cantò, G.; Batelaan, O.; Ardö, J.; Gellens-Meulenberghs, F. Improving evapotranspiration in a land surface model using biophysical variables derived from MSG/SEVIRI satellite. Hydrol. Earth Syst. Sci. 2012, 16, 2567–2583. [Google Scholar] [CrossRef] [Green Version]
  46. Hu, G.; Jia, L.; Menenti, M. Comparison of MOD16 and LSA-SAF MSG evapotranspiration products over Europe for 2011. Remote Sens. Environ. 2015, 156, 510–526. [Google Scholar] [CrossRef]
  47. Lu, J.; Li, Z.-L.; Tang, R.; Tang, B.; Wu, H.; Yang, F.; Labed, J.; Zhou, G. Evaluating the SEBS-estimated evaporative fraction from MODIS data for a complex underlying surface. Hydrol. Process 2013, 27, 3139–3149. [Google Scholar] [CrossRef]
  48. Duan, S.-B.; Li, Z.-L.; Li, H.; Göttsche, F.-M.; Wu, H.; Zhao, W.; Leng, P.; Zhang, X.; Coll, C. Validation of Collection 6 MODIS land surface temperature product using in situ measurements. Remote Sens. Environ. 2019, 225, 16–29. [Google Scholar] [CrossRef] [Green Version]
  49. Freitas, S.C.; Trigo, I.F.; Bioucas-Dias, J.M.; Gottsche, F. Quantifying the Uncertainty of Land Surface Temperature Retrievals from SEVIRI/Meteosat. IEEE T. Geosci. Remote 2010, 48, 523–534. [Google Scholar] [CrossRef] [Green Version]
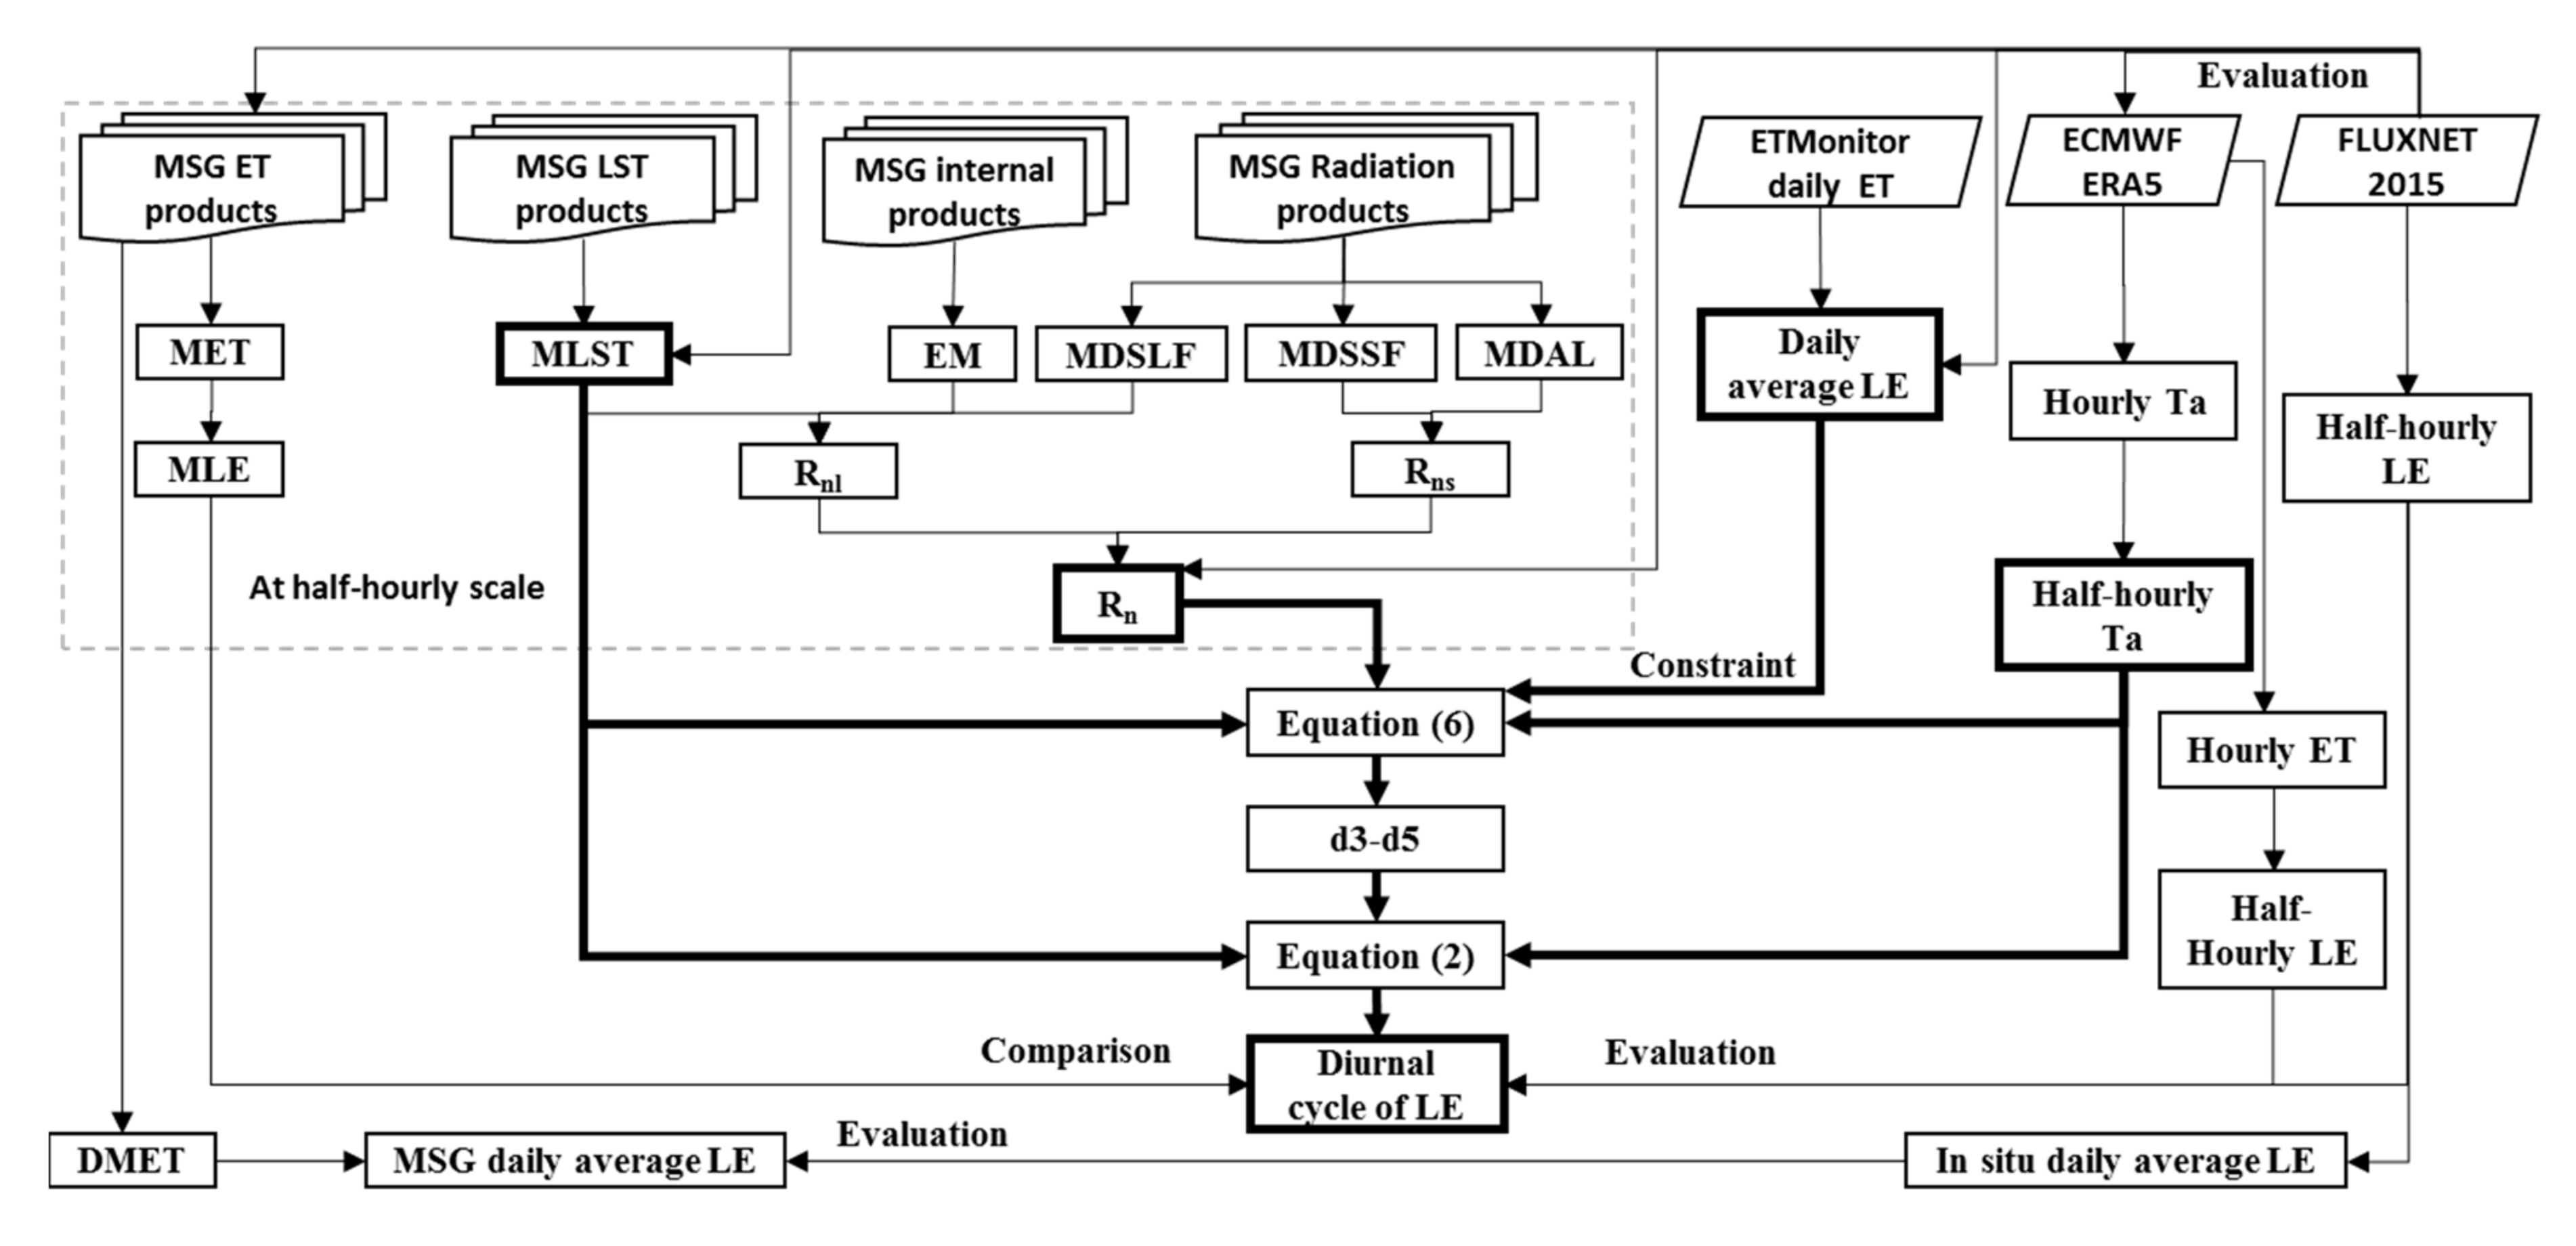
Figure 1. Study of flowchart.
Water 12 02369 g001
Figure 2. Location of FLUXNET2015 sites used in this study (land cover from MCD12C1 product in 2013).
Water 12 02369 g002
Figure 3. Comparisons of estimated instantaneous latent heat flux (LE) with in situ measurements from the FLUXNET2015 dataset: (a) improved method constrained by ETMonitor daily evapotranspiration (ET); (b) original method without constraint; (c) Meteosat Second Generation (MSG) ET (MET) product; (d) ERA5 ET data; and (e) their error frequency distribution histograms.
Water 12 02369 g003aWater 12 02369 g003b
Figure 4. Statistical values of comparisons of instantaneous LE from improved scheme, MET product and ERA5 ET data with in situ measurements from FLUXNET2015 for each site (dashed lines separate sites with different land covers).
Water 12 02369 g004
Figure 5. Diurnal LE variation from improved scheme, MET product, ERA5 ET data, and in situ measurements from FLUXNET2015 during nine consecutive days for two flux sites.
Water 12 02369 g005
Figure 6. Comparisons of: (a) ERA5 Ta; (b) MSG land surface temperature (MLST) product; and (c) MSG-calculated Rn at 30 min intervals with in situ measurements from the FLUXNET2015 dataset; and (d) their error frequency histograms.
Water 12 02369 g006
Figure 7. Comparisons of: (a) ETMonitor daily average LE; and (b) MSG daily average LE with in situ measurements from the FLUXNET2015 dataset.
Water 12 02369 g007
Figure 8. Evaluation results of instantaneous LE estimates based on each measured site input.
Water 12 02369 g008
Figure 9. Evaluation of: (a) sensible heat flux (H); (b) latent heat flux (LE); (c) soil heat flux (G) parameterization by in situ measurements; and (d) estimated instantaneous LE with all inputs from in situ measurements.
Water 12 02369 g009
Figure 10. Evaluation of: (a) LE parameterization by MSG ET (MET) product; and (b) estimated instantaneous LE with all inputs from MSG products.
Water 12 02369 g010
Table 1. General information of 35 sites from the FLUXNET2015 dataset. Note: LAT, latitude; LON, longitude; ELV, elevation; IGBP, International Geosphere–Biosphere Programme (here it means the classification scheme of land use and land cover from IGBP); MF, mixed forests; CRO, croplands; GRA, grasslands; ENF, evergreen needleleaf forest; WET, Permanent Wetlands; DBF, deciduous broadleaf forest; EBF, evergreen broadleaf forest.
Site_IDLATLONELV (m)IGBPProportions of Predominated Land Cover (%)Mean Annual Temperature (°C)Mean Annual Precipitation (mm)Number of Selected Days
BE-Bra51.307614.5198416MF639.875027
BE-Vie50.304935.99812493MF687.8106217
BE-Lon50.551624.74623167CRO961080031
DE-Geb51.0997310.91463162CRO988.547024
DE-Kli50.8930613.52238478CRO837.684227
DE-RuS50.865916.44714103CRO791070025
FR-Gri48.844221.95191125CRO451265035
IT-BCi40.5237514.9574420CRO7618600136
CH-Cha47.210228.41044393GRA659.5113638
CH-Fru47.115838.53778982GRA567.2165138
DE-Gri50.9500413.51259385GRA737.890129
DE-RuR50.621916.30413515GRA807.7103322
IT-MBo46.0146811.045831550GRA655.1121427
IT-Tor45.844447.578062160GRA652.992050
CH-Dav46.815339.855911639ENF622.8106253
CZ-BK149.5020818.53688875ENF536.7131627
DE-Lkb49.0996213.304671308ENF614159920
DE-Obe50.7866613.72129734ENF605.599620
DE-Tha50.9625613.56515385ENF408.284328
FI-Hyy61.8474124.29477181ENF863.870927
IT-Lav45.956211.281321353ENF697.8129152
IT-Ren46.5868611.433691730ENF654.780956
IT-SR243.7320210.290914ENF6814.2920114
NL-Loo52.166585.7435625ENF519.878623
RU-Fyo56.4615332.92208265ENF833.971114
CZ-wet49.0246514.77035426WET297.760424
DE-Akm53.8661713.68342−1WET578.755831
DE-SfN47.8063911.3275590WET378.6112738
DE-Spw51.8922514.0336961WET728.755823
DE-Zrk53.8759412.889010WET458.758416
DK-Sor55.4858711.6446440DBF918.266031
IT-CA142.3804112.02656200DBF911476687
IT-CA342.3812.0222197DBF911476690
IT-Col41.8493613.588141560DBF756.3118051
FR-Pue43.74133.5957270EBF6913.588380
Table 2. Calculating equations of evaluation indices.
IndexAnnotations
R 2 = ( ( X X ¯ ) ( Y Y ¯ ) [ ( X X ¯ ) 2 ] [ ( ( Y Y ¯ ) 2 ) ] ) 2 X and Y are the estimated and observed (referenced) variables, respectively.
Error here is the difference of the estimated results to the observed or referenced variables.
R M S E = ( X Y ) 2 n
B I A S = ( X Y ) n
E r r o r = X Y