Article

Accounting for the Three-Dimensional Distribution of Escherichia coli Concentrations in Pond Water in Simulations of the Microbial Quality of Water Withdrawn for Irrigation

1
Environmental Microbial and Food Safety, Laboratory, USDA-ARS, Beltsville, MD 20705, USA
2
Water and Land Research Group, Division for Integrated Water Management, Korea Environment Institute, Sicheong-daero, Sejong-si 30147, Korea
3
Department of Civil and Environmental Engineering, Water Environment Technology, Chalmers University of Technology, SE-412 96 Gothenburg, Sweden
4
Life &Environment Science, Department of Biosystems Engineering, College of Agriculture, Chungbuk National University, Cheongju, Chungbuk 28644, Korea
*
Author to whom correspondence should be addressed.
Water 2020, 12(6), 1708; https://doi.org/10.3390/w12061708
Submission received: 22 May 2020 / Revised: 10 June 2020 / Accepted: 11 June 2020 / Published: 15 June 2020
(This article belongs to the Special Issue Irrigation Management)

Abstract

:
Evaluating the microbial quality of irrigation water is essential for the prevention of foodborne illnesses. Generic Escherichia coli (E. coli) is used as an indicator organism to estimate the microbial quality of irrigation water. Monitoring E. coli concentrations in irrigation water sources is commonly performed using water samples taken from a single depth. Vertical gradients of E. coli concentrations are typically not measured or are ignored; however, E. coli concentrations in water bodies can be expected to have horizontal and vertical gradients. The objective of this work was to research 3D distributions of E. coli concentrations in an irrigation pond in Maryland and to estimate the dynamics of E. coli concentrations at the water intake during the irrigation event using hydrodynamic modeling in silico. The study pond is about 22 m wide and 200 m long, with an average depth of 1.5 m. Three transects sampled at 50-cm depth intervals, along with intensive nearshore sampling, were used to develop the initial concentration distribution for the application of the environmental fluid dynamic code (EFDC) model. An eight-hour irrigation event was simulated using on-site data on the wind speed and direction. Substantial vertical and horizontal variations in E. coli concentrations translated into temporally varying concentrations at the intake. Additional simulations showed that the E. coli concentrations at the intake reflect the 3D distribution of E. coli in the limited pond section close to the intake. The 3D sampling revealed E. coli concentration hot spots at different depths across the pond. Measured and simulated 3D E. coli concentrations provide improved insights into the expected microbial water quality of irrigation water compared with 1D or 2D representations of the spatial variability of the indicator concentration.

1. Introduction

The microbial quality of irrigation water is a matter of public safety and concern. The World Health Organization reported that an estimated 600 million people in the world suffer from diseases after eating contaminated food every year [1]. The consumption of fresh produce has been increasingly viewed as a serious matter influencing food safety and health [2]. The microbial quality of irrigation water is recognized as a substantial factor affecting the contamination of produce, including fresh fruits and vegetables [3,4,5].
Generic Escherichia coli (E. coli) and enterococci are commonly used as fecal indicator microorganisms for the determination of the microbial quality of irrigation water [6,7,8]. In the United States, the US Food and Drug Administration (FDA) implements the Food Safety Modernization Act (FSMA) to prevent the risk of foodborne disease [9]. As part of the FSMA, the Produce Safety Rule sets standards on the microbiological quality of irrigation water. This rule proposes specific standards of E. coli concentrations to evaluate the microbial water quality based on two calculated values: the geometric mean (GM) and the statistical threshold value (STV). The STV is calculated as an approximation of the 90th percentile of the water quality distribution and no more than 10% of samples used to calculate the GM should exceed this value. Both the GM and STV are calculated using 20 grab samples collected over a 2 to 4-year period. Ponds, impoundments, and agricultural water recovery basins are common sources of irrigation water [10].
The microbial quality of irrigation waters in the USA was essentially unknown until recently [3]. Since then, survey studies have been conducted in various regions of the United States, including studies on farm ponds and agricultural reservoirs in New York State [11], Georgia [12,13,14], Florida [15], Virginia [16], Mississippi [17], and California [17]. The majority of work was done by taking a single sample from a single depth when sampling irrigation ponds or reservoirs. In many cases, the depth was not reported. Where the sampling depth was recorded, it was either 20 cm [18] or 50 cm [13,14,16]. A depth of 1 m was also used to characterize the microbial water quality near the irrigation intake [12].
Taking more than one sample during a sampling event has been shown to result in a substantial spatial variability of E. coli concentrations measured at the same depth across irrigation ponds. Pahl et al. [19] took three samples across a pond on a biweekly and later weekly basis in the summer of 2009 and reported standard deviations of logarithms of E. coli concentrations between 0.25 and 0.5. Pachepsky et al. [20] took surface samples in 34 locations across an irrigation pond on a biweekly basis in the summer of 2016 and reported standard deviations of logarithms of E. coli concentrations between 0.1 and 0.75. The latter authors also demonstrated that there was a spatial pattern in E. coli concentrations during the summer months of June, July, and August, meaning that some areas in the pond mostly had higher than average concentrations of E. coli and other areas mostly had lower than average concentrations of E. coli.
The spatial variation of fecal indicator concentrations across a waterbody is commonly studied in research on wastewater stabilization ponds [21,22,23]. In particular, it has been shown that considering variations of microbial concentrations in three dimensions is beneficial for understanding the pond efficiency [24]. Three-dimensional hydrodynamic modeling has been used to explain functions of wastewater stabilization ponds, such as aerobic and anaerobic carbon and nutrient removal, sedimentation and mixing, and algae growth, among others [25,26,27]. To the best of our knowledge, no 3D information on the microbial water quality in irrigation ponds has been reported so far.
We hypothesized that information on the 3D distribution of E. coli concentrations in irrigation ponds may be useful for explaining and predicting the temporal variation of the microbial quality of water going to the fields. If irrigation water is taken at different times from different parts of a pond, and the E. coli concentrations in these parts are different, then one can anticipate differences in the irrigation water quality at different times during an irrigation event.
The objective of this work was to research the 3D distributions of E. coli concentrations in an irrigation pond in Maryland and to estimate the dynamics of E. coli concentrations at the water intake during irrigation events using hydrodynamic modeling.

2. Methodology

2.1. Study Area

The study was carried out at an excavated pond located at the University of Maryland Wye Research and Education Center (38°54′59.2′′ N–76°08′28.9′′ W). The pond is about 22 m wide and 200 m long, with an average depth of 1.5 m (Figure 1). The pond is surrounded by dense shrubs and grasses, with a few small trees. There are agricultural supply storage facilities and a parking lot on the eastern side of the pond. The crops around the pond receive chemical fertilizers in March and animal manures are not applied. The water level in the pond between irrigation events is controlled by precipitation, as well as by an ephemeral creek that enters through a culvert at the northern-end inflow. This creek directs overland flow from the surrounding corn fields to the pond. The water level is restricted by a water level-dependent orifice outflow drain that flows to a ponded marsh-like area that drains into a small creek. The irrigation pipe is located in the pond interior and is indicated in Figure 1. The irrigation water was drawn at a rate of 0.01 m3/s for durations ranging from 1 to 8 h.

2.2. Data Acquisition

Water sampling was conducted between 12:15 and 13:30 on the 24 August 2017. All sampling locations were geotagged with the handheld global positioning system (GPS) device (BE-2300; Bad Elf, Tariffville, CT). Interior water samples were collected using the Mobile Sensing and Sampling Hyper-Spectral Imaging Platform (MSSHIP, Figure S1). Samples were collected along three transects of the pond, which encompassed the bottom, middle, and top portions (Figure 1). At each sampling position, samples were collected at depth increments of 0.5 m (i.e., 0, 0.5, 1, and 1.5 m). Care was taken to monitor the water depth at each sampling location so that interaction between the sampling pump and the bottom sediments was avoided. For this reason, some locations only provided samples from as deep as 0.5 m, while others provided samples collected to a depth of 1.5 m, which was the maximum sampling depth employed in this experiment. Between each location and sampling depth, the water pump was thoroughly flushed with pond water from the target depth of interest prior to collecting the sample so as to minimize cross-contamination. Bank samples were collected every 20 m along the perimeter of the pond with a 500-mL grab sampler. A total of 26 and 24 interior and bank samples were collected, respectively. The bathymetry data were collected using a handheld digital depth sounder (Vexilar LPS1, Minneapolis, MN). Approximately 200 depth sample points were collected in the pond.
Weather data were recorded at the Wye Research and Education Center (38°54′46.15′′ N–76°09′06.75′′ W), which is less than 1 km from the study pond. The precipitation and maximum/minimum temperature were recorded on an hourly basis, and the wind speed and direction were recorded every 15 min. No rainfall occurred on the sampling date and the closest event consisted of a 57 mm rainfall one week before the monitoring day. A temperature maximum and minimum of 26.4 and 17.0 °C, respectively, were recorded during sampling. The wind speed and direction were 1.9 m/s and northward for 12 h from 8:00 to 20:00 on the sampling date.
Membrane filtration was used to enumerate E. coli (EPA method 1603, US EPA, 2002). Approximately 100 mL of sampled water was vacuum filtered through 0.45 um filters (Millipore Corp., Bedford, MA, USA), which were placed on modified mTEC agar plates (Difco, Sparks, MD, USA). The plates were placed in a 37 °C incubator for 2 h and were then transferred to a 44.5 °C incubator for 22 h. After the incubation period, purple colonies were counted as E. coli.

3. Model and Simulation Setup

The environmental fluid dynamic code (EFDC), which was developed at the Virginia Institute of Marine Science, is a comprehensive three-dimensional numerical model [28]. This model has been successfully applied to a wide range of environmental studies simulating the variation of hydrodynamic and water quality in lakes [29], rivers [30], estuaries [31], reservoirs [32], ponds [23,24,25,26,27,28,29,30,31,32,33], and wetlands. Details of the EFDC have been documented by Hamrick [28]. In the EFDC model, fecal coliform bacteria have no interaction with other state variables and only have a die-off term. The kinetic equation is written as
( F C B ) t = K F C B × T F C B ( T 20 ) × F C B + W F C B V
where FCB is the bacterial concentration (CFU per 100 mL), t is the time (day), KFCB is the first-order die-off rate at 20 °C, TFCB is the effect of temperature on the decay of bacteria (°C−1), WFCB represents the external loads of fecal coliform bacteria (CFU per 100 mL m3 day−1), and V is the cell volume (m3).
The righthand side of Figure 1 shows the boundary and corresponding topography of the irrigation pond. The water quality model was set by allocating 960 active cells in the horizontal plane and four layers in the vertical direction. The average cell size was 4.5 m2.
The kinetic equation was approximated using the finite difference, with a five second time step applied in each computational cell. The irrigation event was simulated by adding the negative component of the water mass balance in the computational cell where the intake was located. This component was equal to the intake rate multiplied by the time step. The interpolation was performed with the EFDC explorer software interpolation routine that uses a Laplace equation filling technique [34]. A five second computational time step was used. Water extraction was simulated by setting a constant sink value corresponding to the actual water extraction rate (i.e., 9.8 L s−1).
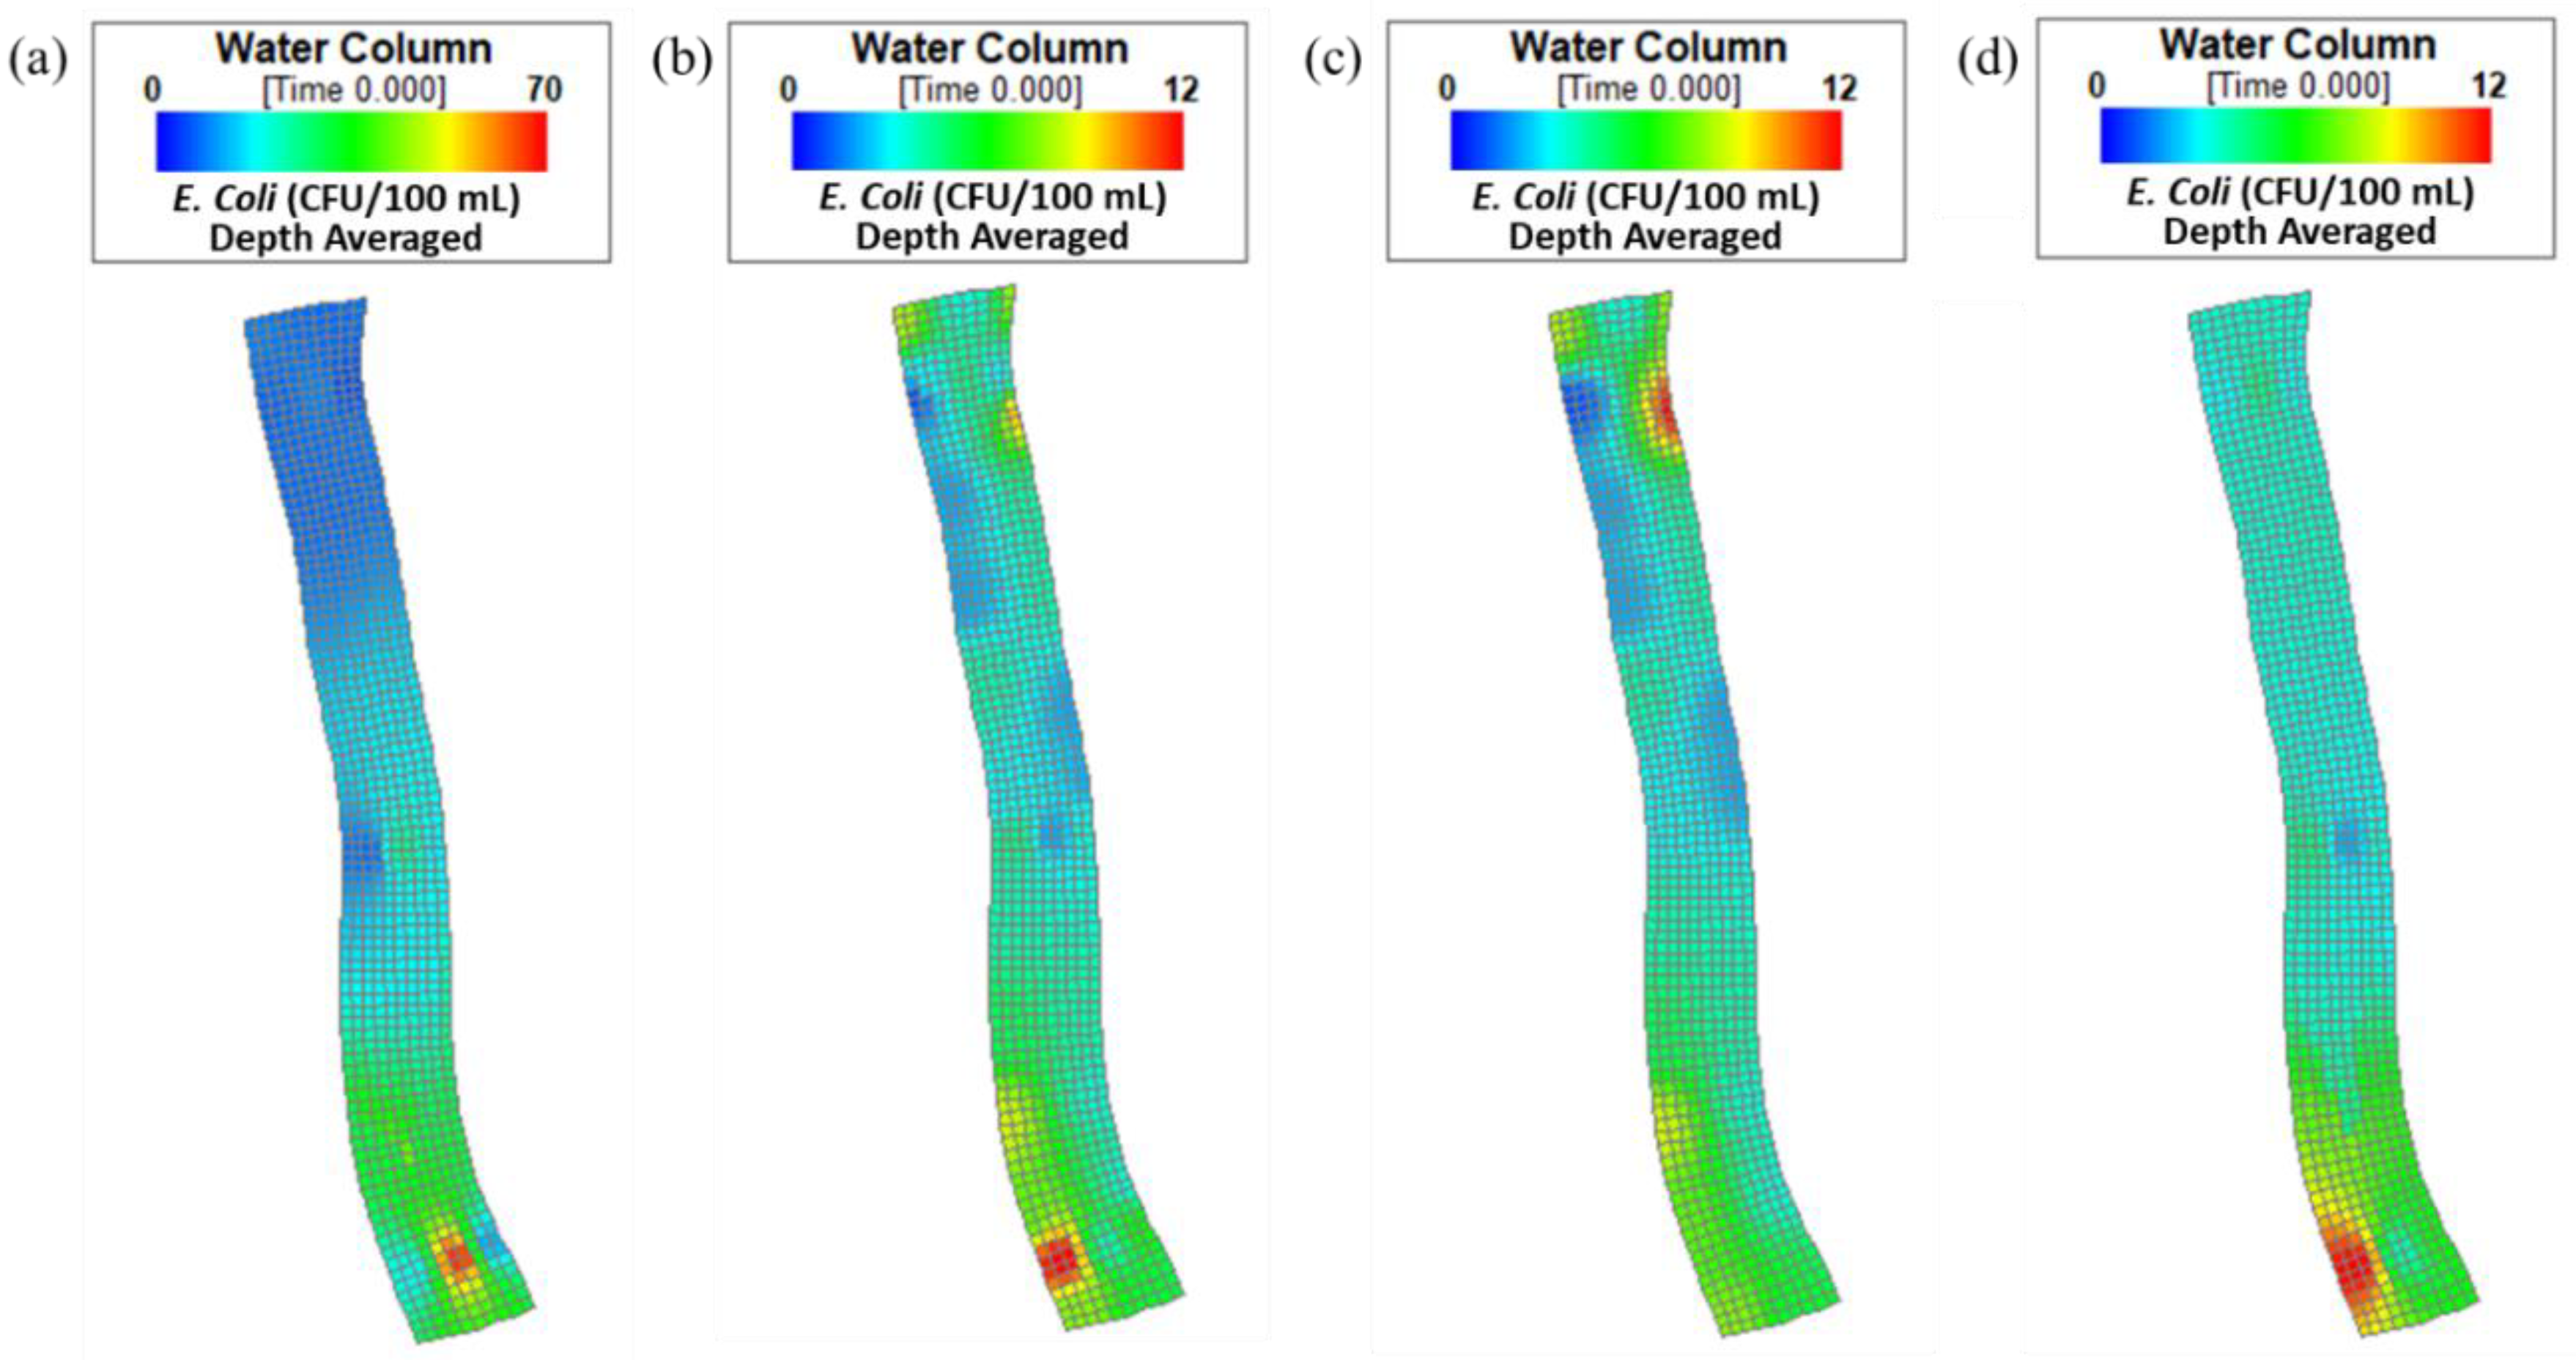
Four different E. coli concentration distribution scenarios were designed to examine the effectiveness and necessity of 3D information in microbial water quality assessments in the irrigation pond (Figure 2). The first scenario included data from the bank water samples and 3D interior water samples. The second scenario was built using bank water samples and interior water samples taken at the minimal depth (surface samples): the data obtained at the depth 0–15 cm were extrapolated down to the bottom of the pond. The third scenario included the interpolation of nearshore data across the pond and extrapolation of the results as constant values down to the bottom. The fourth scenario differed from the third one by using interior samples instead of nearshore samples. Internal EFDC routines were used for interpolation.
A set of scenarios was set for the simulations to examine the temporal variation of the microbial water quality at the intake, depending on the location of the intake pipe around the pond (Figure 3). The scenarios of different intake locations were designed by moving the intake location at an interval of about 16–25 m from the actual intake position shown in Figure 3. The hypothetical locations corresponded to other sampling sites along the perimeter of the pond.
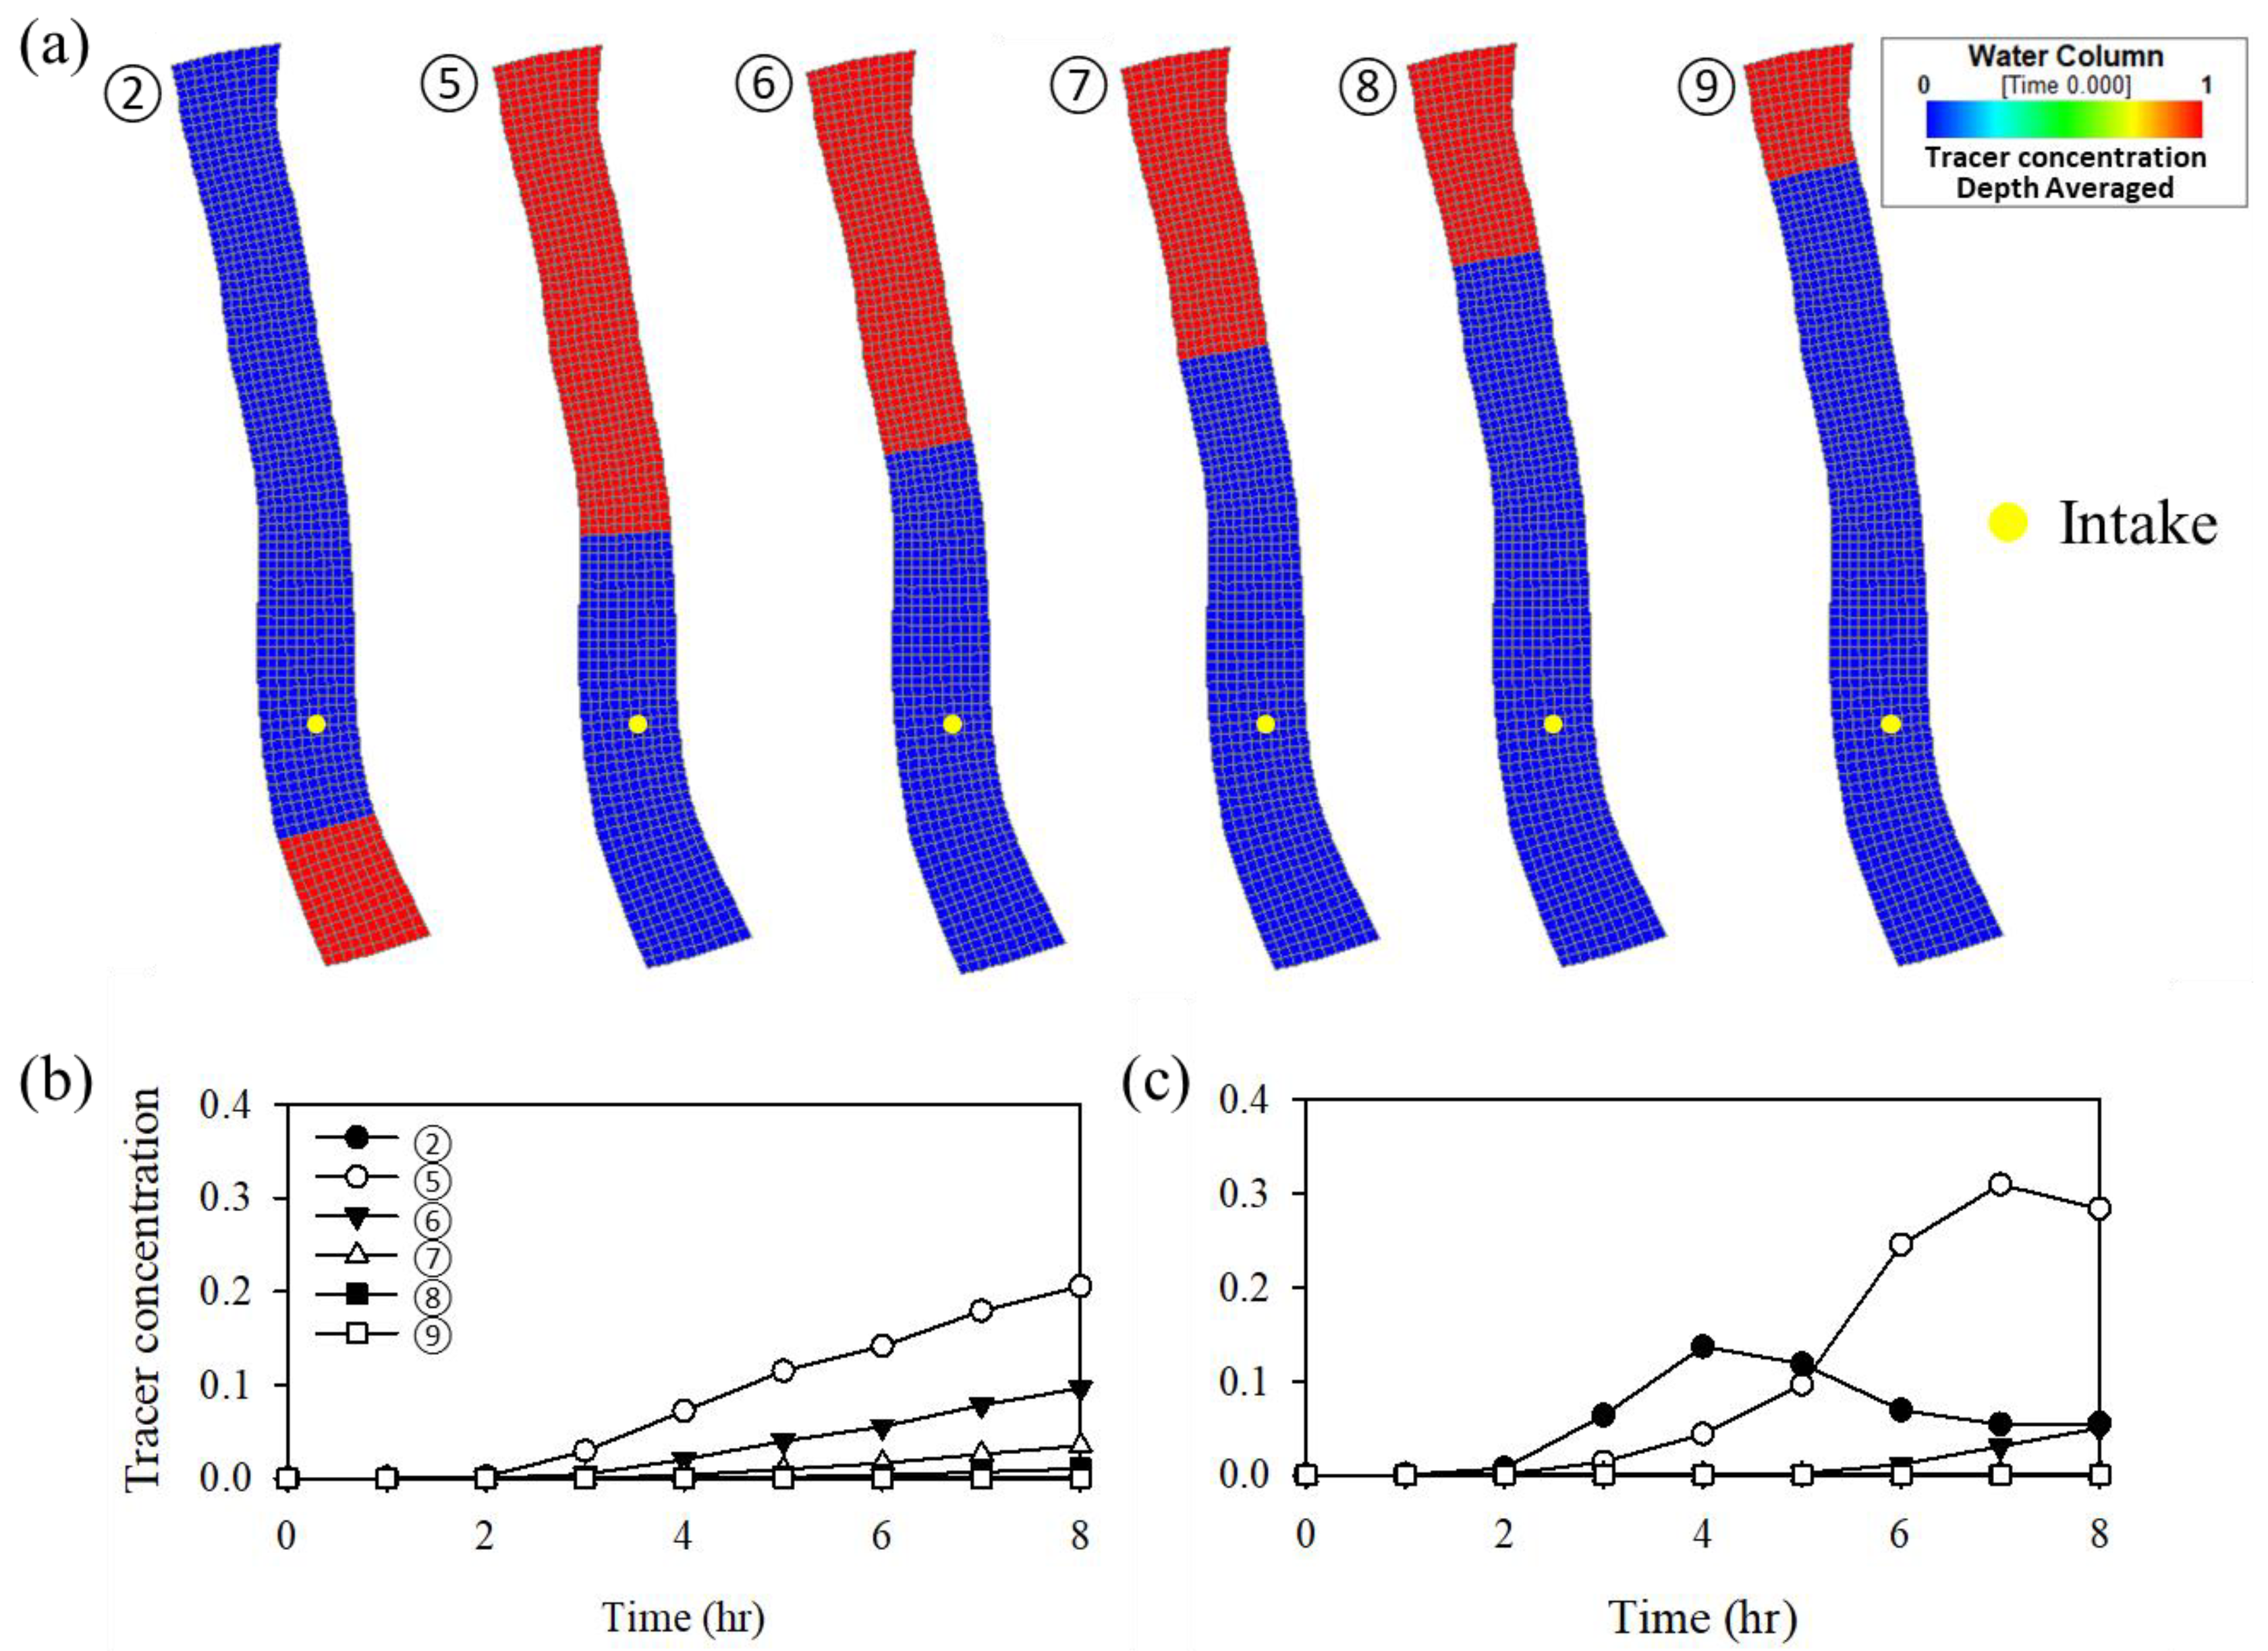
To assess the zone of influence of the intake pipe, five hypothetical spatial distributions of initial concentrations of an inert tracer were assumed. Each of these distributions assumed a zero concentration in the section of the pond that included the intake and a concentration equal to one in the section that did not include the intake. The boundaries between the sections were set at locations 2, 5, 6, 7, 8, and 9 for the six scenarios, respectively.
E. coli concentrations were log-transformed prior to statistical analysis. Statistics were computed using the Paleontological Statistics Software Program for education and data analysis (PAST) [35].

4. Results

4.1. Spatial Variability of E. coli Concentrations

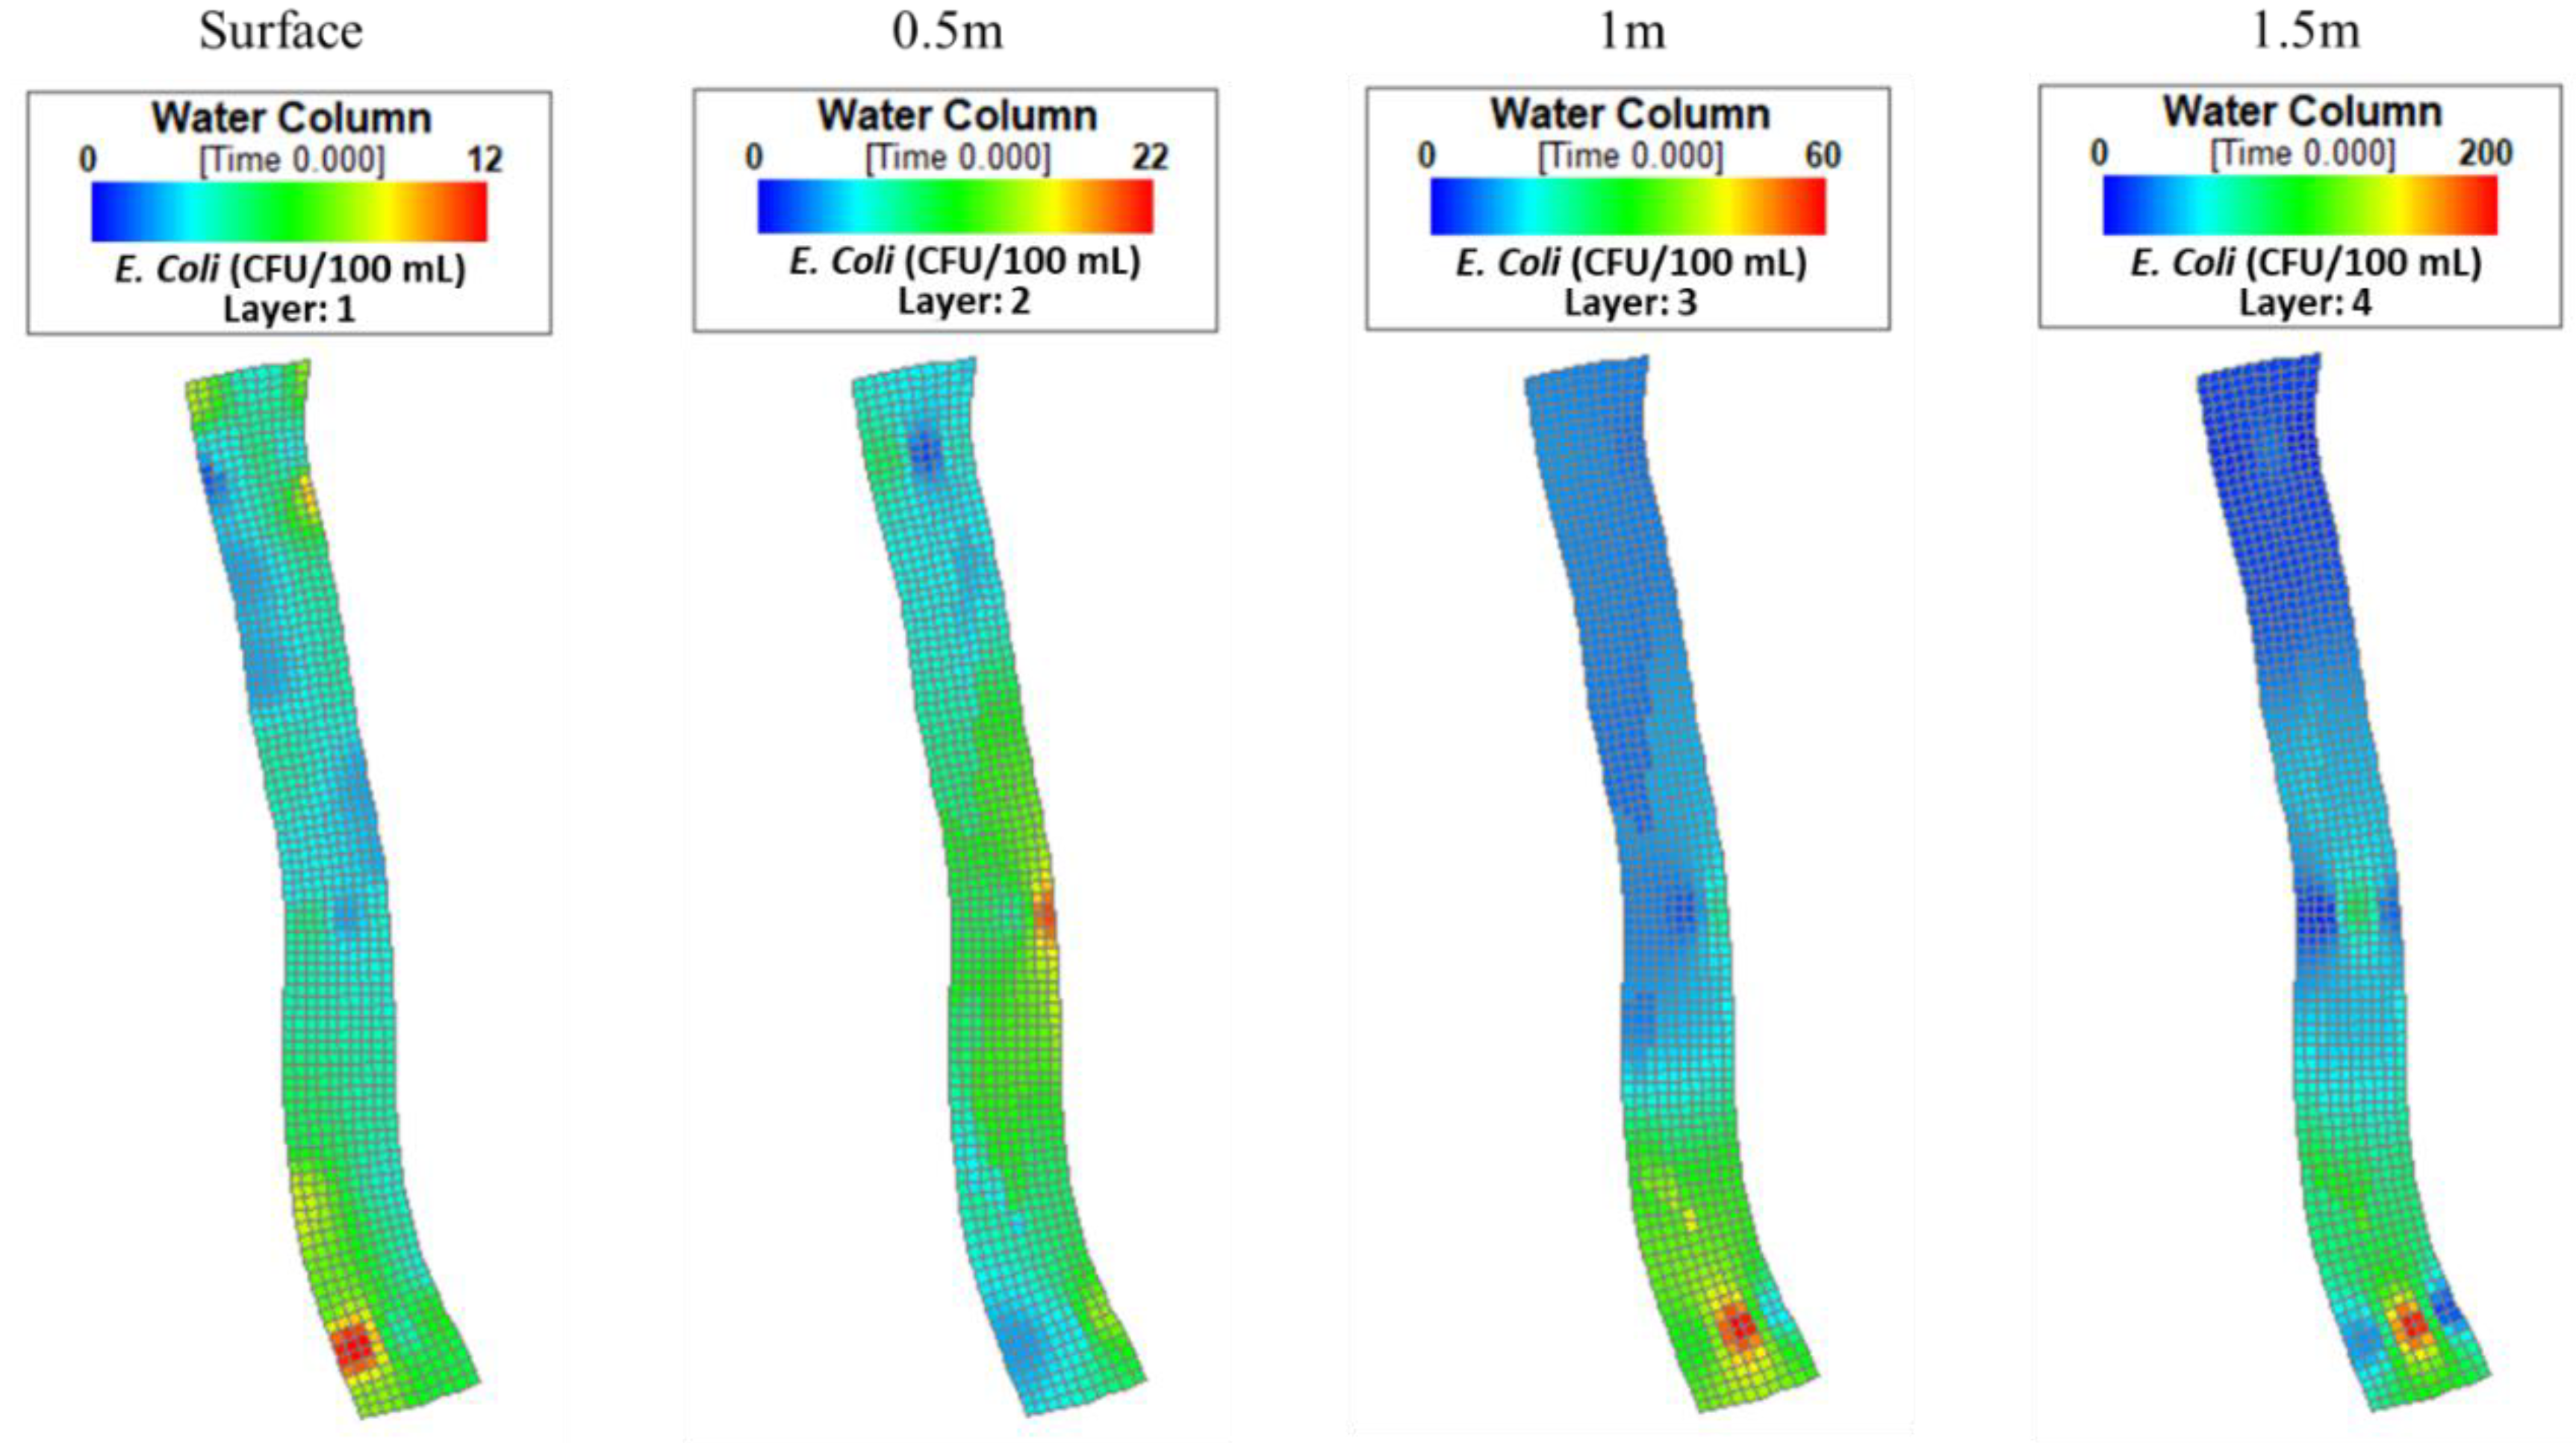
Figure 4 shows the lateral distributions of E. coli concentrations according to depth. A t-test demonstrated that there was no significant difference between the average values of E. coli concentrations near the shore and in the interior of the pond (p = 0.491). Lateral distributions of E. coli concentrations at all depths showed higher concentrations in the southern part of the pond than the middle or northern part, except for at the 0.5 m depth. Concentrations of E. coli increased with an increasing depth. The average concentrations of E. coli in the 0.5 and 1.0 m water depths were about 2 and 4 times higher, respectively, than the average concentration at the surface (0 m). The average concentration at the 1.5 m water depth (bottom layer) was 101.7 CFU 100 mL−1, which was 21 times higher than that of the surface water. An analysis of variance (ANOVA) on the E. coli values showed that the concentrations significantly differed by water depth range (p < 0.001). Tukey’s pairwise testing showed that the 1.5 m depth contained significantly higher concentrations than the 0 m (p < 0.001), 0.5 m (p < 0.001), and 1.0 m (p = 0.043) depths. The 0 and 1.0 m depth ranges also significantly differed (p = 0.044), but comparisons of other depth ranges were not statistically significant.
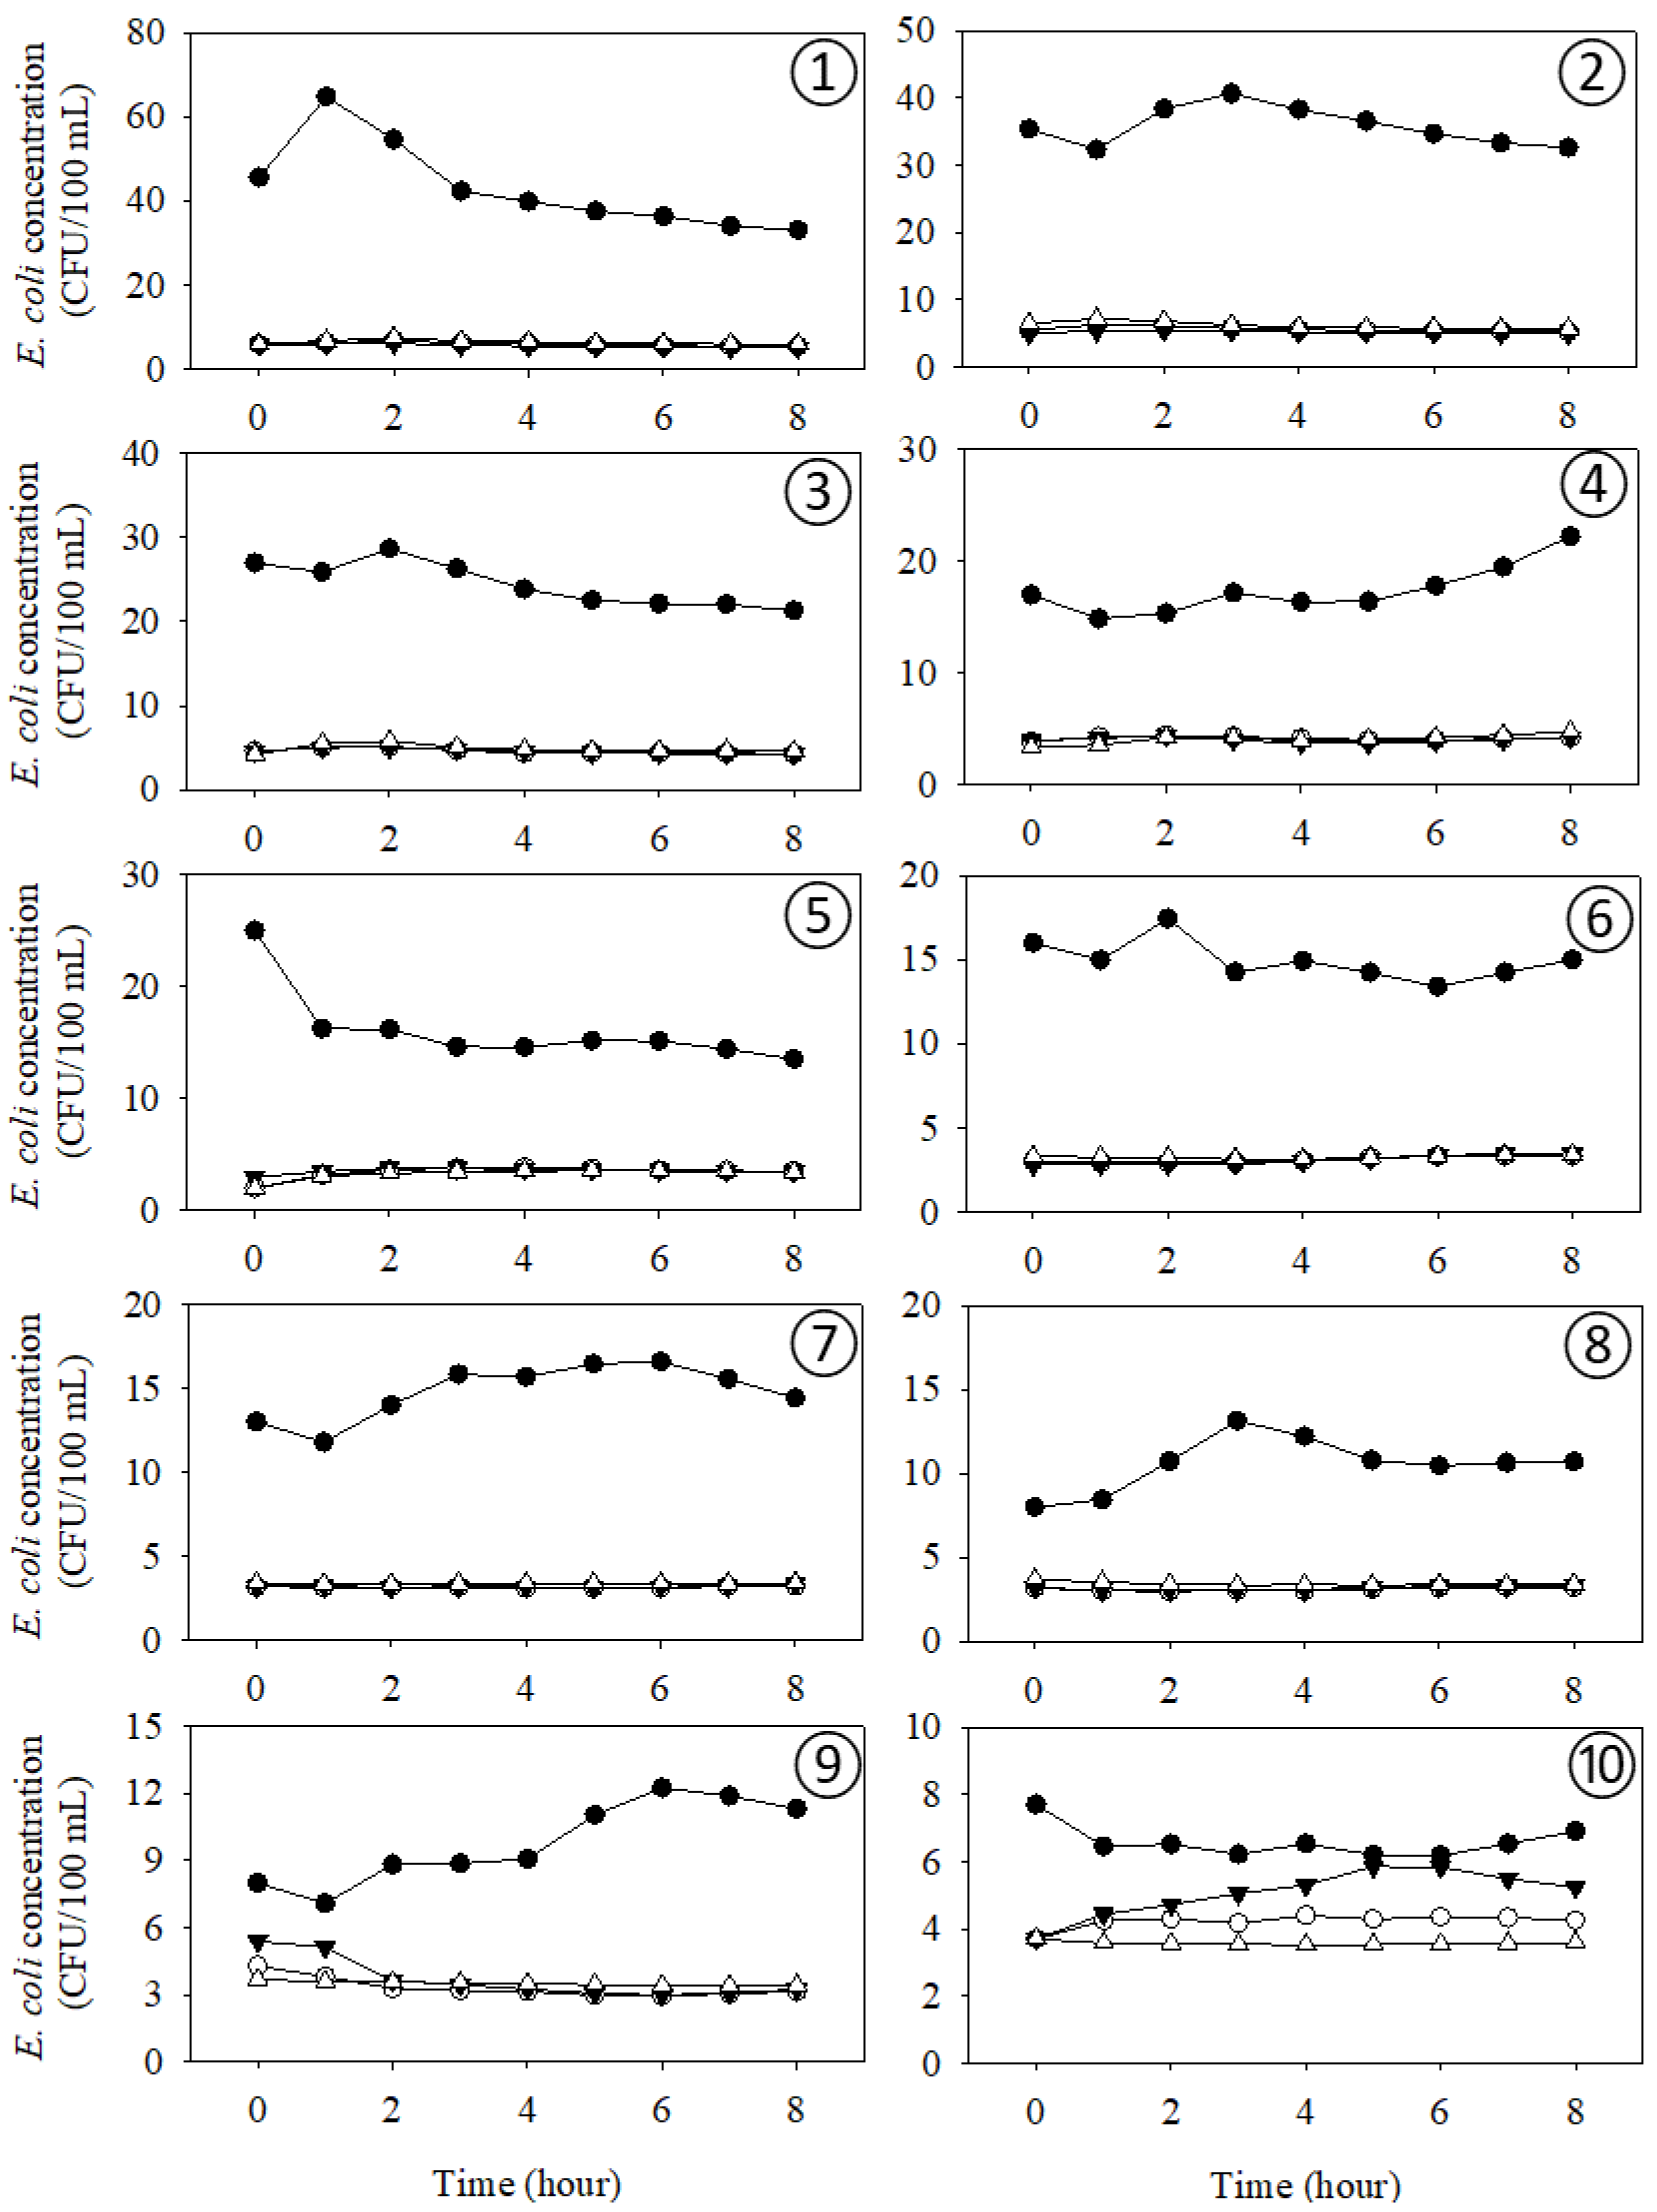
Figure 5 shows that the predictions of the temporal variation of the E. coli concentration in the withdrawn water dependent on the different initial concentration distributions. The simulation results based on the initial distribution using 3D information were substantially different from the simulation results based on initial distributions using only surface water information. In the simulation involving the actual location of the intake pipe (Figure 5. Panel 3), using the 3D dataset yielded an initial concentration of pumped water of 27 CFU 100 mL−1 which slowly declined over the 8-h simulation. Using the other three interpolation scenarios in this case all resulted in similar but lower results, which consisted of roughly 5 CFU 100 mL−1 in the pumped water over the course of the simulation.

4.2. Simulations with Different Intake Locations

Figure 5 shows the temporal variation of E. coli in the withdrawn water for several irrigation intake locations. Figure 5 panel 3 presents the change in E. coli concentrations of irrigation water taken at the actual pumping location. The other panels represent the change in E. coli concentrations when the location of the irrigation pipe is moved upwards along the pond according to the hypothetical locations presented in Figure 3. Simulations involving the 3D data distributions resulted in consistently higher E. coli concentrations than the 1or 2D information distributions in all proposed locations. This was particularly true for locations 1–7; however, locations 8–10 contained the smallest differences between scenarios of initial concentration interpolation. Placing the irrigation pipe at location 10 resulted in the most similar result across scenarios.

4.3. Assessment of the Zone of Influence for the Intake

Figure 6a shows the results of setting the boundaries between sections with the tracer being present and absent at different locations within the pond. Figure 6b shows the simulated dynamics of the tracer at the actual intake location, depending on the different microbial contaminated area boundaries under an actual wind direction condition. Scenarios with the boundary between sections at locations 5 to 8 indicated an increase in the E. coli concentration during the irrigation event. On the other hand, scenarios with boundaries between sections at locations 2 and 9 maintained a stable concentration during the entire irrigation event time of 8 h. Figure 6c shows the variations of the tracer concentration in the withdrawn water with the wind blowing in the opposite direction to the observed direction. The scenarios with the boundary between sections at locations 2, 5, and 6 demonstrated variation of the E. coli concentration during the irrigation event. The other scenarios maintained a zero tracer concentration during the entire 8-h event.

5. Discussion

Both vertical and lateral changes in E. coli concentrations were found across the pond (Figure 4). The lateral variations at the 0 to 15 cm depth range were demonstrated for this pond in earlier reports [20,36]. In these works, the southern part of the pond had concentrations that were persistently higher than other parts of the pond over the summers of 2016 and 2017. The hypothesis was that this hotspot was formed due to the proximity to a residential property equipped with a septic system, as well as the presence of domesticated pets [36]. Vertical gradients of E. coli concentrations were well-pronounced in some parts of the pond. A possible reason for gradient formation is the effect of UV radiation. Maraccini et al. [37] observed that a stronger UVB intensity significantly increased the inactivation rate constants of E. coli in an unmixed natural freshwater marsh, a brackish water lagoon, and a marine site. The absorbance of UVB and inactivation rates of E. coli likely decreased with depth in this work, thus creating conditions for the formation of vertical gradients of concentrations. The elevated levels of E. coli in the southern part of the pond may also be the result of the increased shading that this region receives relative to the middle and northern parts throughout the day. The amount of particulate matter present in the pond would have also likely influenced both the vertical and lateral concentrations of E. coli, since it has been shown that particulate and dissolved organic matter may attenuate UV penetration and shield bacteria in water [38]. Future work may want to investigate the results of simulations when both organic matter and UV radiation measurements are collected and used as model inputs.
The temporal variation of E. coli concentrations in the withdrawn water based on 3D information had significantly different patterns compared with results based on three different 2D information scenarios (Figure 2). Under the conditions interpolated using the 3D dataset, E. coli concentrations of the intake water were high because of vertical gradients that were detected during sampling. All three scenarios assuming a constant concentration across the depth range gave an estimated E. coli withdrawal concentration that was five times lower than that of the scenario using the 3D information. Therefore, it may not be sufficient to characterize the microbial quality of irrigation water based on E. coli concentrations measured in samples taken close to the pond water surface. Additionally, such characterization may mask the possibility that the microbial quality of irrigation water exceeds permitted thresholds when vertical concentration gradients are formed between rainfall periods.
Changing the intake location substantially changed the simulated E. coli concentrations and dynamics in the extracted water (Figure 5). The simulated E. coli concentration in the extracted water based on 3D information demonstrated higher concentrations than the results of 2D information during irrigation events up to location 9 due to the vertical gradient of E. coli concentrations present in the pond. With water uptake at location 10, no difference was found in the results obtained between 3D information and 2D information. Therefore, if the location of the irrigation pipe is moved to location 10 in the studied pond, then the microbial quality of the extracted water may be improved both initially and throughout the course of a multi-hour irrigation event.
The 3D sampling information helps to more realistically predict the temporal variation of the E. coli concentration in the extracted water compared to using 2D survey information. However, 3D surveys have disadvantages in terms of time, costs, and labor compared with 1D survey tasks. Therefore, reducing the area in which a 3D survey is performed would alleviate these disadvantages while maintaining a high prediction accuracy of the microbial quality in the extracted water. We have confirmed that the northern-most area from location 9 and the southern-most area from location 2 do not affect the temporal variation of E. coli concentrations in the extracted water taken from location 3 under actual wind direction conditions (Figure 3). The 3D survey information from location 9 to location 2 is sufficient to accurately predict the microbial quality in the extracted water. Furthermore, the decreased survey area will contribute to reducing the time, costs, and labor for subsequent 3D surveys. The results on the selection of the survey area are obviously pond shape-specific. Simulations can be helpful in selecting the parts of a pond that should be researched in a 3D survey.
To examine the impact of the wind direction on the spread of E. coli in the studied pond, we compared the intake influence zones which were estimated under the actual wind direction, as well as the opposite wind direction (Figure 6). The survey area was considerably reduced as the wind direction changed from a northerly wind direction to a southerly wind direction (data not shown). The northerly wind encourages more movement of the microbially contaminated water from the upper area to lower areas. Otherwise, the southern wind disturbs the movement from the northern area to the southern area. The wind direction and speed have dramatically influenced water circulation and the spread of microbial contamination in various bodies of surface water [39,40,41]. Sokolova et al. [42] concluded that the microbial contamination from different sources was transported faster or slower to the water intake, depending on the wind speed and direction. Therefore, these simulations demonstrated that the wind direction should be considered when designing a 3D survey area.
We realize that our simulations with a constant inactivation rate only present a first approximation of the fate and transport of E. coli in the pond during irrigation. A decrease in the inactivation rate with depth is expected [37]. However, the differences between the inactivation rates at different depths will support and may increase the vertical gradients and possibly lateral variation of concentrations. Quantifying the effect of E. coli survival variation in space and time on the variation of the microbial quality of the extracted water presents an interesting research avenue. Future work should also investigate the applicability of the EFDC model for irrigation water sources of different shapes, sizes, and types (such as streams, rivers, or canals). Validating the model by sampling the withdrawn water and pond water over time would also be an interesting venture, but would require intensive 3D sampling, which would be time-consuming and costly. Additionally, the simulation scenarios presented in this work are just a few of many possible ways to configure the model and simulate the irrigation event. Therefore, we encourage future researchers to experiment with differing sample sizes, sampling depths, interpolation methods, wind patterns, and locations of irrigation withdrawal. Finally, it would be interesting to incorporate other measured water quality variables into the model to assess their dynamics during an irrigation event and examine whether levels of other water quality parameters such as dissolved oxygen or pH influence the concentrations of E. coli in the withdrawn water.
The results of this work indicate that sampling irrigation water in the field should not be done once. The spatial variability of the microbial concentrations in the water source translates to the temporal variation of concentrations in the irrigation water reaching the field. The variation of the microbial water quality in the field over time will indicate that there is a spatial variability of the indicator concentrations in the water source. Understanding the reasons for this variability may lead to management actions that will improve the quality of the irrigation water from the source.

6. Conclusions

Through simulations using the EFDC model, we were able to estimate the temporal dynamics of E. coli concentrations based on hydrodynamic information, such as inflow and outflow rates, and mixing due to wind. E. coli concentrations were measured at depth increments of 0.5 m in the interior area and at the water surface along the bank of an irrigation pond. Albeit small, the studied pond is not a homogeneous body of water. Both vertical and lateral changes in E. coli concentrations were observed across the pond. Modeling confirmed that the initial 3D distribution of E. coli concentrations significantly influenced the dynamics of the E. coli concentration in extracted water going to the field. The simulation study confirmed that changing the intake location can change the microbial quality of the extracted water. Moreover, simulations can be helpful in defining the pond sections for which to collect 3D data. The delineation of this section must be done for different realistic wind conditions that may have significant effects on the E. coli transport in the pond. The 3D spatial distributions of E. coli in irrigation ponds appear to be an underestimated factor which may influence the microbial quality of water by creating substantial temporal variations. Hydrodynamic modeling can be a useful tool for improving microbial water quality monitoring strategies by considering site-specific environmental characteristics of irrigation water sources.

Supplementary Materials

The following are available online at https://www.mdpi.com/2073-4441/12/6/1708/s1, Figure S1: Schematics of the Mobile Sampling, Sensing, and Hyperspectral Imaging Platform (MSSHIP).

Author Contributions

M.D.S. designed and conducted the experiment, cowrote the manuscript, edited the manuscript, and performed formal data analysis. D.J.J. performed the data simulations and visualizations and prepared an initial draft of the manuscript. E.S. provided conceptual feedback and advice on how to perform the experiment. H.L. helped with the methodology and resources, and designed the sampling platform used in the study. M.S.K. helped with the methodology, resources, and supervision of this work. Y.A.P. participated in the conceptualization, formal analysis, funding acquisition, investigation, project administration, software, and writing of the original draft. All authors have read and agreed to the published version of the manuscript.

Funding

This work was supported through USDA’s Agricultural Research Service project number 8042-12630-011-00D.

Acknowledgments

We acknowledge Jaclyn Smith for helping to organize and perform the field measurements. Additionally, we would like to thank Insuck Baek for his involvement in the creation of the MSSHIP that was used to collect samples. Finally, thank you to the owners and operators of the Wye Research Pond that allowed us to work on their property and supported our research needs.

Conflicts of Interest

The authors declare no conflicts of interest.

References

  1. World Health Organization. WHO’s First Ever Global Estimates of Foodborne Diseases Find Children under 5 Account for Almost One Third of Deaths; World Health Organization: Geneva, Switzerland, 2015; Volume 37, pp. 109–110. [Google Scholar]
  2. Kearney, J. Food consumption trends and drivers. Philos. Trans. R. Soc. B Biol. Sci. 2010, 365, 2793–2807. [Google Scholar] [CrossRef] [PubMed]
  3. Pachepsky, Y.; Shelton, D.R.; McLain, J.E.; Patel, J.; Mandrell, R.E. Irrigation waters as a source of pathogenic microorganisms in produce: A review. In Advances in Agronomy; Academic Press: Cambridge, MA, USA, 2011; Volume 113, pp. 75–141. [Google Scholar]
  4. Oliveira, M.; Viñas, I.; Usall, J.; Anguera, M.; Abadias, M. Presence and survival of Escherichia coli O157: H7 on lettuce leaves and in soil treated with contaminated compost and irrigation water. Int. J. Food Microbiol. 2012, 156, 133–140. [Google Scholar] [CrossRef] [PubMed]
  5. Akinde, S.B.; Sunday, A.A.; Adeyemi, F.M.; Fakayode, I.B.; Oluwajide, O.O.; Adebunmi, A.A.; Oloke, J.K.; Adebooye, C.O. Microbes in Irrigation Water and Fresh Vegetables: Potential Pathogenic Bacteria Assessment and Implications for Food Safety. Appl. Biosaf. 2016, 21, 89–97. [Google Scholar] [CrossRef] [Green Version]
  6. Steele, M.; Mahdi, A.; Odumeru, J. Microbial assessment of irrigation water used for production of fruit and vegetables in Ontario, Canada. J. Food Prot. 2005, 68, 1388–1392. [Google Scholar] [CrossRef]
  7. Boehm, A.B.; Sassoubre, L.M. Enterococci as indicators of environmental fecal contamination. In Enterococci: From Commensals to Leading Causes of Drug Resistant Infection; Massachusetts Eye and Ear Infirmary: Boston, MA, USA, 2014. [Google Scholar]
  8. Chandrasekaran, R.; Hamilton, M.J.; Wang, P.; Staley, C.; Matteson, S.; Birr, A.; Sadowsky, M.J. Geographic isolation of Escherichia coli genotypes in sediments and water of the Seven Mile Creek—A constructed riverine watershed. Sci. Total Environ. 2015, 538, 78–85. [Google Scholar] [CrossRef]
  9. US FDA. 2018. Available online: https://www.fda.gov/food/foodborneillnesscontaminants/peopleatrisk/ucm352830.htm (accessed on 4 May 2020).
  10. Dieter, C.A.; Caldwell, R.R.; Harris, M.A.; Ivahnenko, T.I.; Lovelace, J.K.; Barber, N.L.; Lisney, K.S. Estimated use of water in the United States in 2015: U.S. Geol. Surv. Circ. 2018, 1441, 65. [Google Scholar]
  11. Jones, L.A.; Worobo, R.W.; Smart, C.D. Plant-pathogenic oomycetes, Escherichia coli strains, and Salmonella spp. frequently found in surface water used for irrigation of fruit and vegetable crops in New York State. Appl. Environ. Microbiol. 2014, 80, 4814–4820. [Google Scholar] [CrossRef] [Green Version]
  12. Antaki, E.M.; Vellidis, G.; Harris, C.; Aminabadi, P.; Levy, K.; Jay-Russell, M.T. Low concentration of Salmonella enterica and generic Escherichia coli in farm ponds and irrigation distribution systems used for mixed produce production in Southern Georgia. Foodborne Pathog. Dis. 2016, 13, 551–558. [Google Scholar] [CrossRef]
  13. Gu, G.; Luo, Z.; Cevallos-Cevallos, J.M.; Adams, P.; Vellidis, G.; Wright, A.; van Bruggen, A.H. Factors affecting the occurrence of Escherichia coli O157 contamination in irrigation ponds on produce farms in the Suwannee River Watershed. Can. J. Microbiol. 2012, 59, 175–182. [Google Scholar] [CrossRef]
  14. Lee, D.; Tertuliano, M.; Vellidis, G.; Harris, C.; Grossman, M.K.; Rajeev, S.; Levy, K. Evaluation of Grower-Friendly, Science-Based Sampling Approaches for the Detection of Salmonella in Ponds Used for Irrigation of Fresh Produce. Foodborne Pathog. Dis. 2018, 15, 627–636. [Google Scholar] [CrossRef]
  15. Havelaar, A.H.; Vazquez, K.M.; Topalcengiz, Z.; Muñoz-Carpena, R.; Danyluk, M.D. Evaluating the US Food Safety Modernization Act Produce Safety Rule standard for microbial quality of agricultural water for growing produce. J. Food Prot. 2017, 80, 1832–1841. [Google Scholar] [CrossRef] [PubMed]
  16. Truitt, L.N.; Vazquez, K.M.; Pfuntner, R.C.; Rideout, S.L.; Havelaar, A.H.; Strawn, L.K. Microbial quality of agricultural water used in produce preharvest production on the Eastern Shore of Virginia. J. Food Prot. 2018, 81, 1661–1672. [Google Scholar] [CrossRef]
  17. Partyka, M.L.; Bond, R.F.; Chase, J.A.; Kiger, L.; Atwill, E.R. Multistate evaluation of microbial water and sediment quality from agricultural recovery basins. J. Environ. Qual. 2016, 45, 657–665. [Google Scholar] [CrossRef] [PubMed] [Green Version]
  18. McEgan, R.; Mootian, G.; Goodridge, L.D.; Schaffner, D.W.; Danyluk, M.D. Predicting Salmonella populations from biological, chemical, and physical indicators in Florida surface waters. Appl. Environ. Microbiol. 2013, 79, 4094–4105. [Google Scholar] [CrossRef] [PubMed] [Green Version]
  19. Pahl, D.M.; Telias, A.; Newell, M.; Ottesen, A.R.; Walsh, C.S. Comparing source of agricultural contact water and the presence of fecal indicator organisms on the surface of ‘Juliet’grape tomatoes. J. Food Prot. 2013, 76, 967–974. [Google Scholar] [CrossRef] [PubMed]
  20. Pachepsky, Y.; Kierzewski, R.; Stocker, M.; Sellner, K.; Mulbry, W.; Lee, H.; Kim, M. Temporal stability of Escherichia coli concentrations in waters of two irrigation ponds in Maryland. Appl. Environ. Microbiol. 2018, 84, e01876-17. [Google Scholar]
  21. Dias, D.F.C.; Passos, R.G.; Von Sperling, M. A review of bacterial indicator disinfection mechanisms in waste stabilisation ponds. Rev. Environ. Sci. Bio/Technol. 2017, 16, 517–539. [Google Scholar] [CrossRef]
  22. Dias, D.F.; von Sperling, M. Vertical profiling and modelling of Escherichia coli decay in a shallow maturation pond operating in a tropical climate. Environ. Technol. 2018, 39, 759–769. [Google Scholar] [CrossRef]
  23. Li, M.; Zhang, H.; Lemckert, C.; Roiko, A.; Stratton, H. On the hydrodynamics and treatment efficiency of waste stabilisation ponds: From a literature review to a strategic evaluation framework. J. Clean. Prod. 2018, 183, 495–514. [Google Scholar] [CrossRef] [Green Version]
  24. Maïga, Y.; Wethe, J.; Denyigba, K.; Ouattara, A.S. The impact of pond depth and environmental conditions on sunlight inactivation of Escherichia coli and enterococci in wastewater in a warm climate. Can. J. Microbiol. 2009, 55, 1364–1374. [Google Scholar] [CrossRef]
  25. Sah, L.; Rousseau, D.P.; Hooijmans, C.M.; Lens, P.N. 3D model for a secondary facultative pond. Ecol. Model. 2011, 222, 1592–1603. [Google Scholar] [CrossRef]
  26. Sah, L.; Rousseau, D.P.; Hooijmans, C.M. Numerical modelling of waste stabilization ponds: Where do we stand? Water Air Soil Pollut. 2012, 223, 3155–3171. [Google Scholar] [CrossRef]
  27. Khan, S.; Melville, B.W.; Shamseldin, A.Y.; Fischer, C. Investigation of flow patterns in storm water retention ponds using CFD. J. Environ. Eng. 2013, 139, 61–69. [Google Scholar]
  28. Hamrick, J.M. A Three-Dimensional Environmental Fluid Dynamics Computer Code: Theoretical and Computational Aspects. Special Report in Applied Marine Science and Ocean Engineering; Virginia Institute of Marine Science, William & Mary: Gloucester Point, VA, USA, 1992. [Google Scholar] [CrossRef]
  29. Zhao, L.; Zhang, X.; Liu, Y.; He, B.; Zhu, X.; Zou, R.; Zhu, Y. Three-dimensional hydrodynamic and water quality model for TMDL development of Lake Fuxian, China. J. Environ. Sci. 2012, 24, 1355–1363. [Google Scholar] [CrossRef]
  30. Seo, D.; Kim, M.; Ahn, J.H. Prediction of chlorophyll-a changes due to weir constructions in the Nakdong River using EFDC-WASP modelling. Environ. Eng. Res. 2012, 17, 95–102. [Google Scholar] [CrossRef] [Green Version]
  31. Wool, T.A.; Davie, S.R.; Rodriguez, H.N. Development of three-dimensional hydrodynamic and water quality models to support total maximum daily load decision process for the Neuse River Estuary, North Carolina. J. Water Resour. Plan. Manag. 2003, 129, 295–306. [Google Scholar] [CrossRef]
  32. He, G.; Fang, H.; Bai, S.; Liu, X.; Chen, M.; Bai, J. Application of a three-dimensional eutrophication model for the Beijing Guanting Reservoir, China. Ecol. Model. 2011, 222, 1491–1501. [Google Scholar] [CrossRef]
  33. Luo, X.; Li, X. Using the EFDC model to evaluate the risks of eutrophication in an urban constructed pond from different water supply strategies. Ecol. Model. 2018, 372, 1–11. [Google Scholar] [CrossRef]
  34. EFDC_Explorer 8 User Guide. 2020. Available online: https://eemodelingsystem.atlassian.net/wiki/spaces/EEREF/overview (accessed on 7 June 2020).
  35. Hammer, Ø.; Harper, D.A.; Ryan, P.D. PAST: Paleontological statistics software package for education and data analysis. Palaeontol. Electron. 2001, 4, 9. [Google Scholar]
  36. Stocker, M.D.; Pachepsky, Y.A.; Hill, R.L.; Sellner, K.G.; Macarisin, D.; Staver, K.W. Intraseasonal variation of E. coli and environmental covariates in two irrigation ponds in Maryland, USA. Sci. Total Environ. 2019, 670, 732–740. [Google Scholar] [CrossRef] [PubMed]
  37. Maraccini, P.A.; Mattioli, M.C.M.; Sassoubre, L.M.; Cao, Y.; Griffith, J.F.; Ervin, J.S.; Van De Werfhorst, L.C.; Boehm, A.B. Solar inactivation of enterococci and Escherichia coli in natural waters: Effects of water absorbance and depth. Environ. Sci. Technol. 2016, 50, 5068–5076. [Google Scholar] [CrossRef] [PubMed]
  38. Smith, R.E.; Allen, C.D.; Charlton, M.N. Dissolved organic matter and ultraviolet radiation penetration in the Laurentian Great Lakes and tributary waters. J. Great Lakes Res. 2004, 30, 367–380. [Google Scholar] [CrossRef]
  39. Smith, P.; Carroll, C.; Wilkins, B.; Johnson, P.; Gabhainn, S.N.; Smith, L.P. The effect of wind speed and direction on the distribution of sewage-associated bacteria. Lett. Appl. Microbiol. 1999, 28, 184–188. [Google Scholar] [CrossRef] [PubMed]
  40. Zhang, C.; Gao, X.; Wang, L.; Chen, Y. Analysis of agricultural pollution by flood flow impact on water quality in a reservoir using a three-dimensional water quality model. J. Hydroinform. 2012, 15, 1061–1072. [Google Scholar] [CrossRef]
  41. Hatvani, I.G.; Kirschner, A.K.; Farnleitner, A.H.; Tanos, P.; Herzig, A. Hotspots and main drivers of fecal pollution in Neusiedler See, a large shallow lake in Central Europe. Environ. Sci. Pollut. Res. 2018, 25, 28884–28898. [Google Scholar] [CrossRef]
  42. Sokolova, E.; Pettersson, T.J.; Bergstedt, O.; Hermansson, M. Hydrodynamic modelling of the microbial water quality in a drinking water source as input for risk reduction management. J. Hydrol. 2013, 497, 15–23. [Google Scholar] [CrossRef] [Green Version]
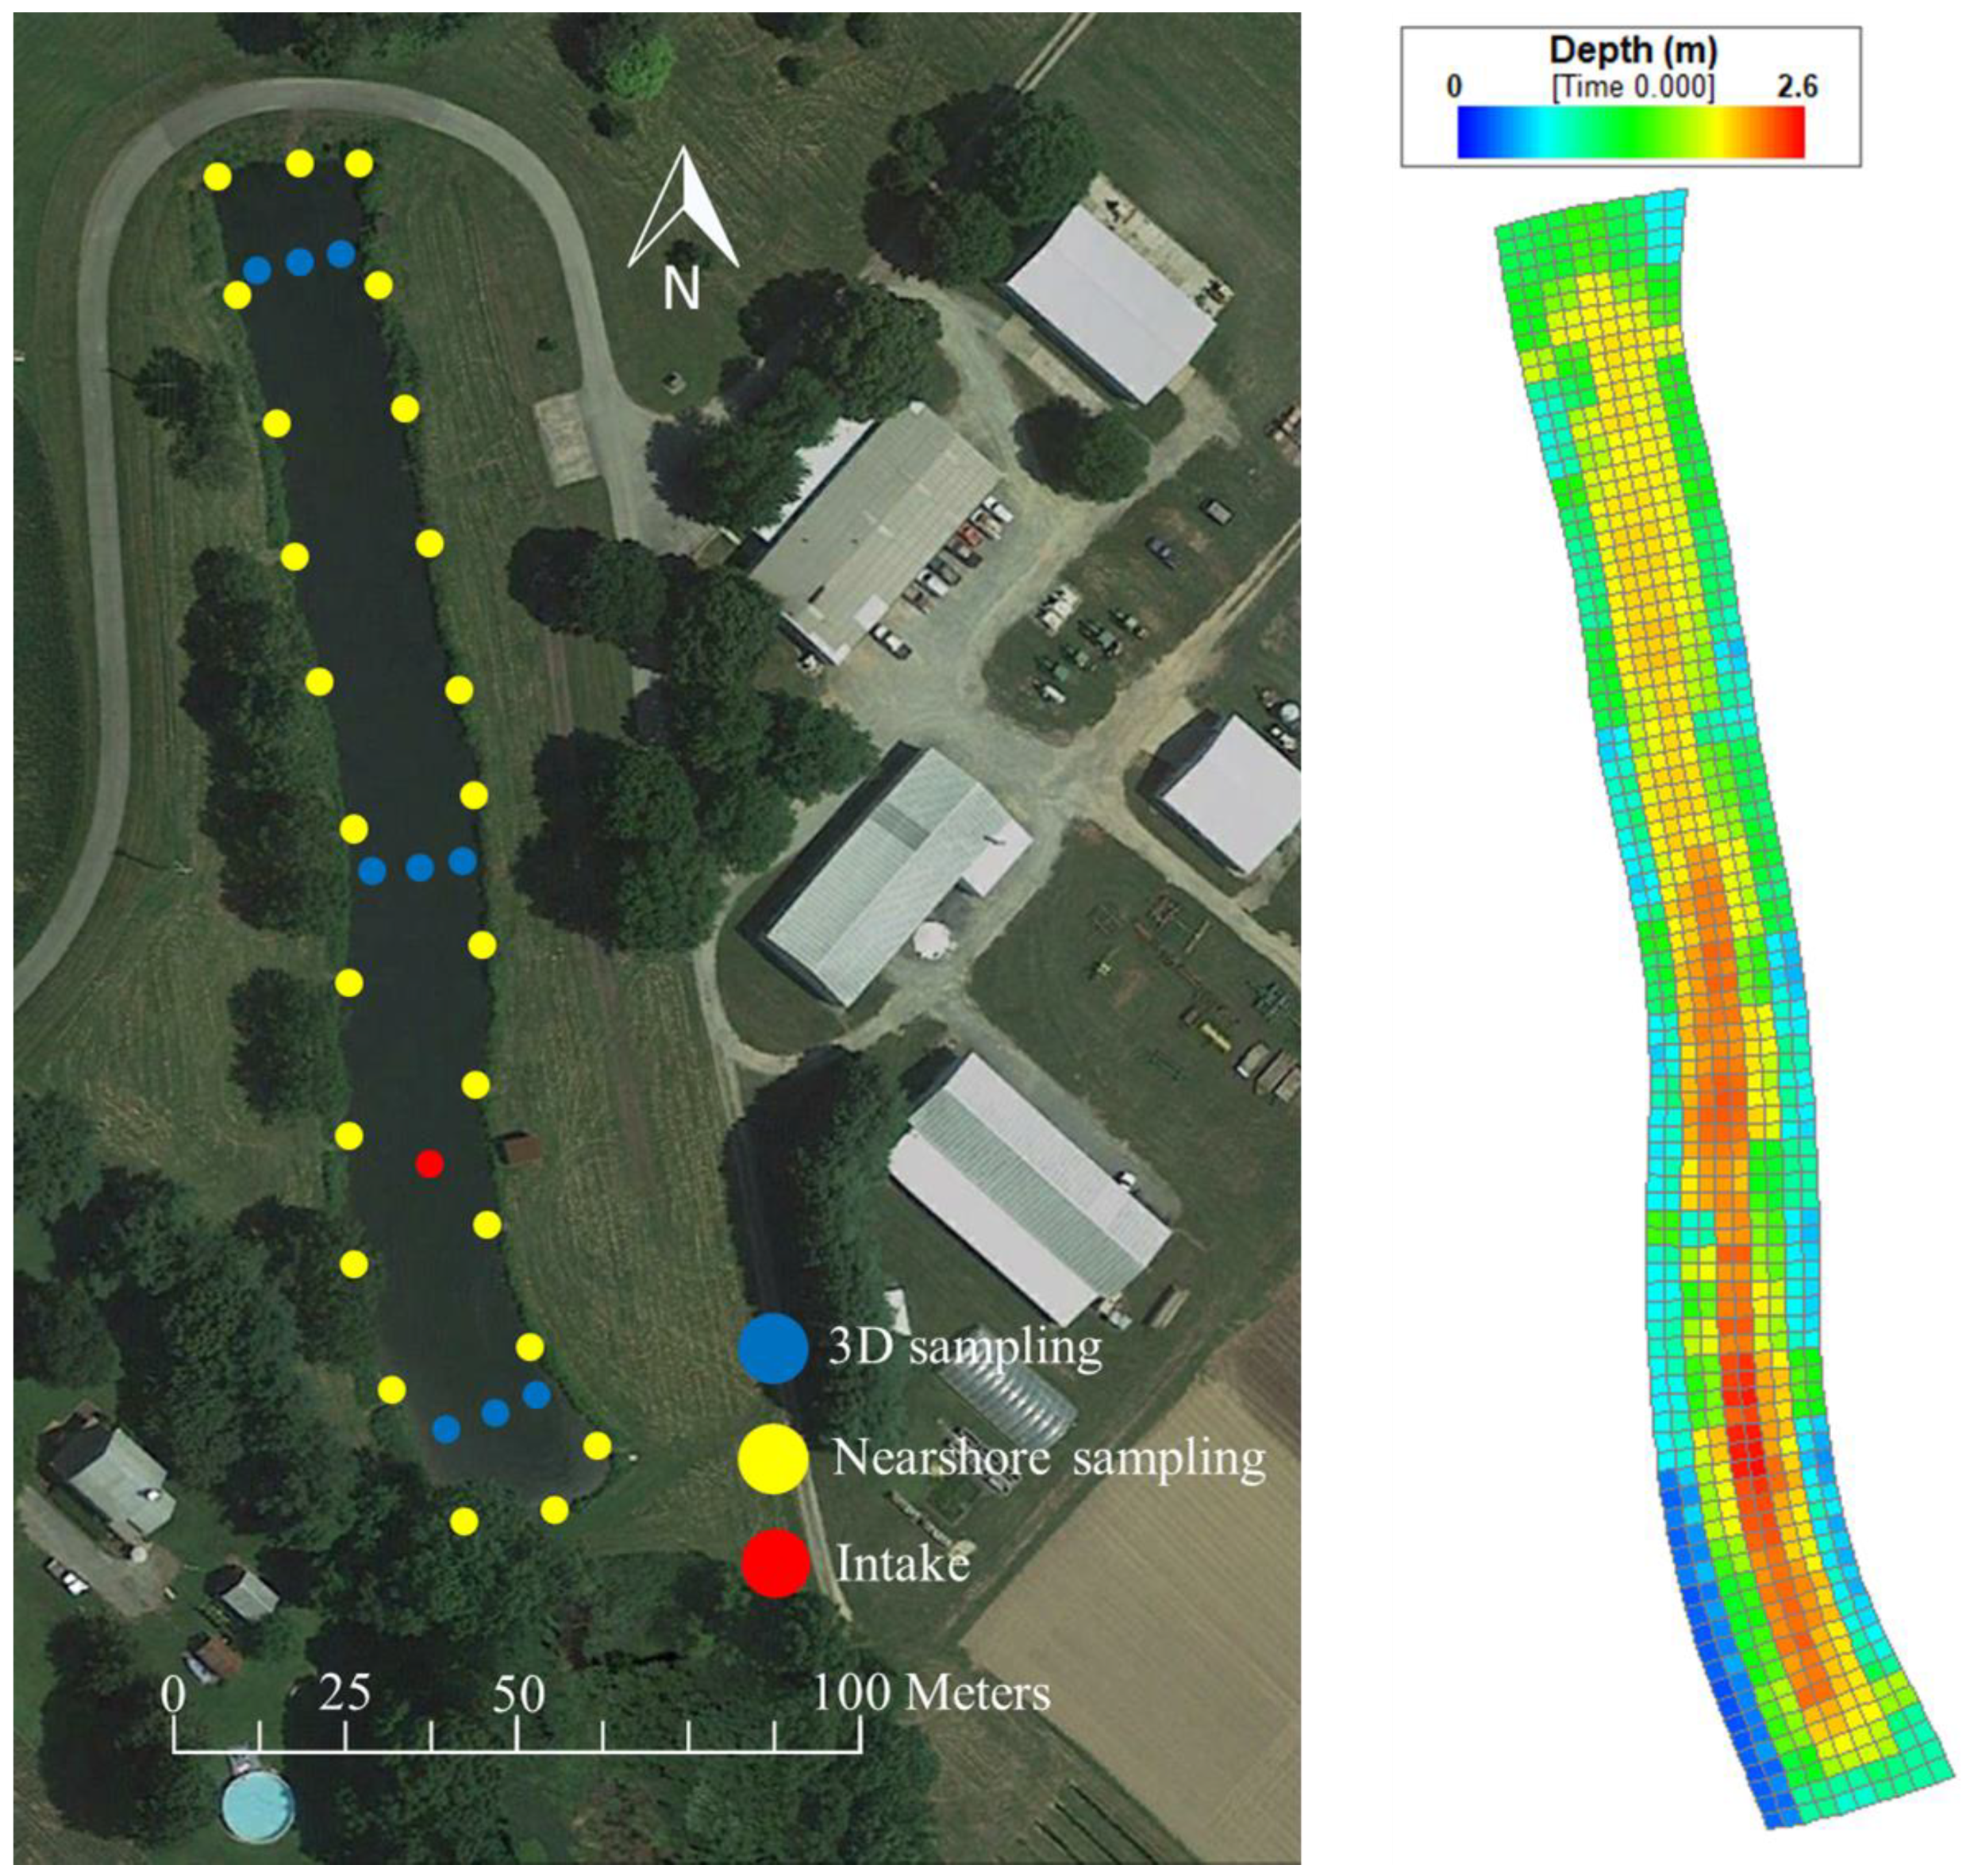
Figure 1. Map of the study area showing the locations of 3D sampling for the pond interior and nearshore sampling (left-hand side). The top view of the computational mesh is also shown (righthand side).
Water 12 01708 g001
Figure 2. Scenarios with the initial Escherichia coli concentration from different sources: (a) 3D sampling; (b) surface layer data (both nearshore and interior) interpolated in 2D and extended over the whole water column; (c) nearshore data interpolated in 2D over the surface layer and extended over the whole water column; and (d) interior surface layer data interpolated in 2D and extended over the whole water column.
Water 12 01708 g002
Figure 3. Hypothetical irrigation water intake locations. Locations 1–10 correspond with the ten hypothetical irrigation intake positions described in the text. Location 3 is the actual intake location.
Water 12 01708 g003
Figure 4. Initial E. coli concentration at different depths interpolated from the 3D sampling data. Concentrations at the surface (0 m), 0.5 m, 1 m, and 1.5 m depths are shown from left to right.
Water 12 01708 g004
Figure 5. E. coli concentrations in irrigation water in different irrigation pipe locations under four initial E. coli concentration distribution scenarios: ●, 3D sampling data; ○, 2D data from surface samples extended to the bottom; ▼, 2D data from nearshore samples extended to the bottom; and ∆, 2D data from interior samples extended to the bottom. Panels 1–10 correspond to the hypothetical irrigation intake locations displayed in Figure 3.
Water 12 01708 g005
Figure 6. Tracer distributions and simulation results in scenarios designed to evaluate the zone of influence of the intake. Panel (a) shows the boundaries between pond sections with the tracer present (red) and absent (blue). Panel (b) shows the simulated concentrations of the tracer withdrawn from the pond at different intake locations over the 8-hour irrigation event. Panel (c) displays the same scenario as in (b) except with the opposite wind direction.
Water 12 01708 g006