Article

Acquisition of Post-Depositional Effects on Stable Isotopes (δ18O and δD) of Snow and Firn at Dome A, East Antarctica

1
State Key Laboratory of Marine Geology, School of Ocean and Earth Science, Tongji University, Shanghai 200092, China
2
Polar Research Institute of China, Shanghai 200136, China
3
Key Laboratory of Geographic Information Science (Ministry of Education), School of Geographic Sciences and State Key Lab of Estuarine and Coastal Research, East China Normal University, Shanghai 200241, China
*
Authors to whom correspondence should be addressed.
Water 2020, 12(6), 1707; https://doi.org/10.3390/w12061707
Submission received: 17 April 2020 / Revised: 10 June 2020 / Accepted: 11 June 2020 / Published: 15 June 2020
(This article belongs to the Special Issue Isotope Hydrology)

Abstract

:
Water stable isotopes (δ18O and δD) in Antarctic snow pits and ice cores are extensively applied in paleoclimate reconstruction. However, their interpretation varies over some climate change processes that can alter isotope signals after deposition, especially at sites with a low snow accumulation rate (<30 mm w.e. year−1). To investigate post-depositional effects during the archival processes of snow isotopes, we first analyzed δ18O and δD variations in summer precipitation, surface snow and snow pit samples collected at Dome A. Then, the effects of individual post-depositional processes were evaluated from the results of field experiments, spectral analysis and modeling simulations. It was found that the sublimation–condensation cycle and isotopic diffusion were likely the dominant processes that modified the δ18O at and under the snow–air interface, respectively. The sublimation–condensation cycle can cause no significant isotopic modification of δ18O from field experiments with ~3 cm snow. The diffusion process can significantly erase the original seasonal variation of δ18O driven by atmospheric temperature, leading to an apparent cycle of ~20 cm average wavelength present in the δ18O profile. Through the comparison with the artificial isotopic profile, the noise input from the diffusion process was the dominant component in the δ18O signal. Although some other processes (such as drifting, ventilation and metamorphism) were not fully considered, the quantitative understanding for the sublimation–condensation and diffusion processes will contribute to the paleoclimate construction using the ice core water isotope records at Dome A.

1. Introduction

Water stable isotopes (δ18O and δD) in Antarctic ice cores can be used as an important proxy to reconstruct past temperature evolution at seasonal to orbital timescales over the Quaternary [1,2,3]. The relationship between local temperature (T) and isotopic content (δ) is usually obtained from the spatial statistics in surface snow [4]. However, this is now challenged by some discrepancies between the estimated temperature from the isotopic thermometer (δ-T) and instrument records or calibration values from other geological records [5,6,7]. This inaccuracy indicates that the δ-T does not remain constant over time. This temporal variability can be due to the influence of a significant noise, which interferes with the isotopic signal preserved in surface snow. As a series of complex processes take place during surface snow formation (including evaporation at moisture source, transportation, condensation, and post-deposition), this noise can be shaped by multiple effects (e.g., moisture source conditions, moisture transport trajectories, mixing between vapors from different origins, precipitation intermittency), which influence δ variations through equilibrium and kinetic fractionation [8,9,10].
In the low-accumulation and cold regions in Antarctica, post-depositional processes, including mechanical mixing, sublimation and re-condensation, molecular diffusion, ventilation, and metamorphism (Figure 1), play an important role in the modifying of the original isotope signal of the upper snow layers [11,12,13]. In mechanical mixing, strong winds can scour and erode the snow layer to form snowdrift. The shifted snow can be transported to deposit at a new location. Thus, the δ are likely to be modified by mechanical mixing between blowing snow and snowfall [14]. Sublimation and re-condensation cycles are defined as water phase changes between vapor and snow at the air–snow interface, which can cause an exchange between upper snow isotope content and mass [15,16]. Molecular diffusion is the random movement of water molecules in the vapor phase. This process occurs in pore-space and intra-ice-grain within firn. Both cases can lead to smooth the high-frequency variations of water isotope records, but the magnitude of transportation within the matrix of the ice grains is lower by a rate of several orders [17]. Wind-driven ventilation can carry atmospheric water vapor into the snow where it mixes with the vapor in the pore space, resulting in annual mean δ18O enrichment [18]. Metamorphism corresponds to the coarsening of the snow grains as a result of temperature gradients in the firn [13]. Its impact may cause the surface snow to retain the enriched summer isotopic composition of precipitation. In combination with all the above processes after deposition, an apparent cycle of 20 cm by counting the isotopic maxima are shown in snow pits from several East Antarctic interior sites, instead of the annual cycle [19].
Among these various post-depositional processes, the sublimation and re-condensation cycle is proposed to be the main factor in altering the initial isotopic profile of deposited precipitation at the air–snow interface [15]. Numerical modeling simulations suggest that with the increase of depth, the isotopic modification is mainly from the pore-space diffusion process [17,20]. Although the correlation between water isotopes and these two processes has been previously established, their influence has not yet been quantified at low-accumulation sites in Antarctica. Moreover, it is further needed to elucidate the association between the combined effect from post-depositional processes and the lowering δ-T slope at the seasonal scale. These motivate the importance of investigation on archival processes of the water stable isotope signal at interior Antarctic sites.
Dome A is located at the summit of East Antarctica, where the oldest ice may be preserved due to the cold temperature (−58.13 °C of annual averaged 10 m snow temperature), low accumulation (~23 mm w.e. year−1) and dry conditions (~0.06 g·kg−1 of the annual mean value) [21,22]. However, there were only several measurements of precipitation and surface snow isotopes in summer [23,24,25,26,27]. The lack of δ18O and δD observations in snow pits makes it difficult to verify the post-depositional changes of isotopic composition in snow and firn. In this study, we aim to distinguish the isotopic modification from post-depositional processes at Dome A, especially for the sublimation–condensation cycle and diffusion. The δ18O measurements along the continuum of precipitation, surface snow and buried snow were firstly compared to determine the dominant processes influencing the water isotopes after snow deposition. Then, the results from field experiments were proposed to investigate the sublimation process at the air–snow interface. Finally, spectral analysis was used to understand the influence of the diffusion process on the stable isotopic composition of snow.

2. Method and Data

2.1. On-Site Sampling and Laboratory Analysis

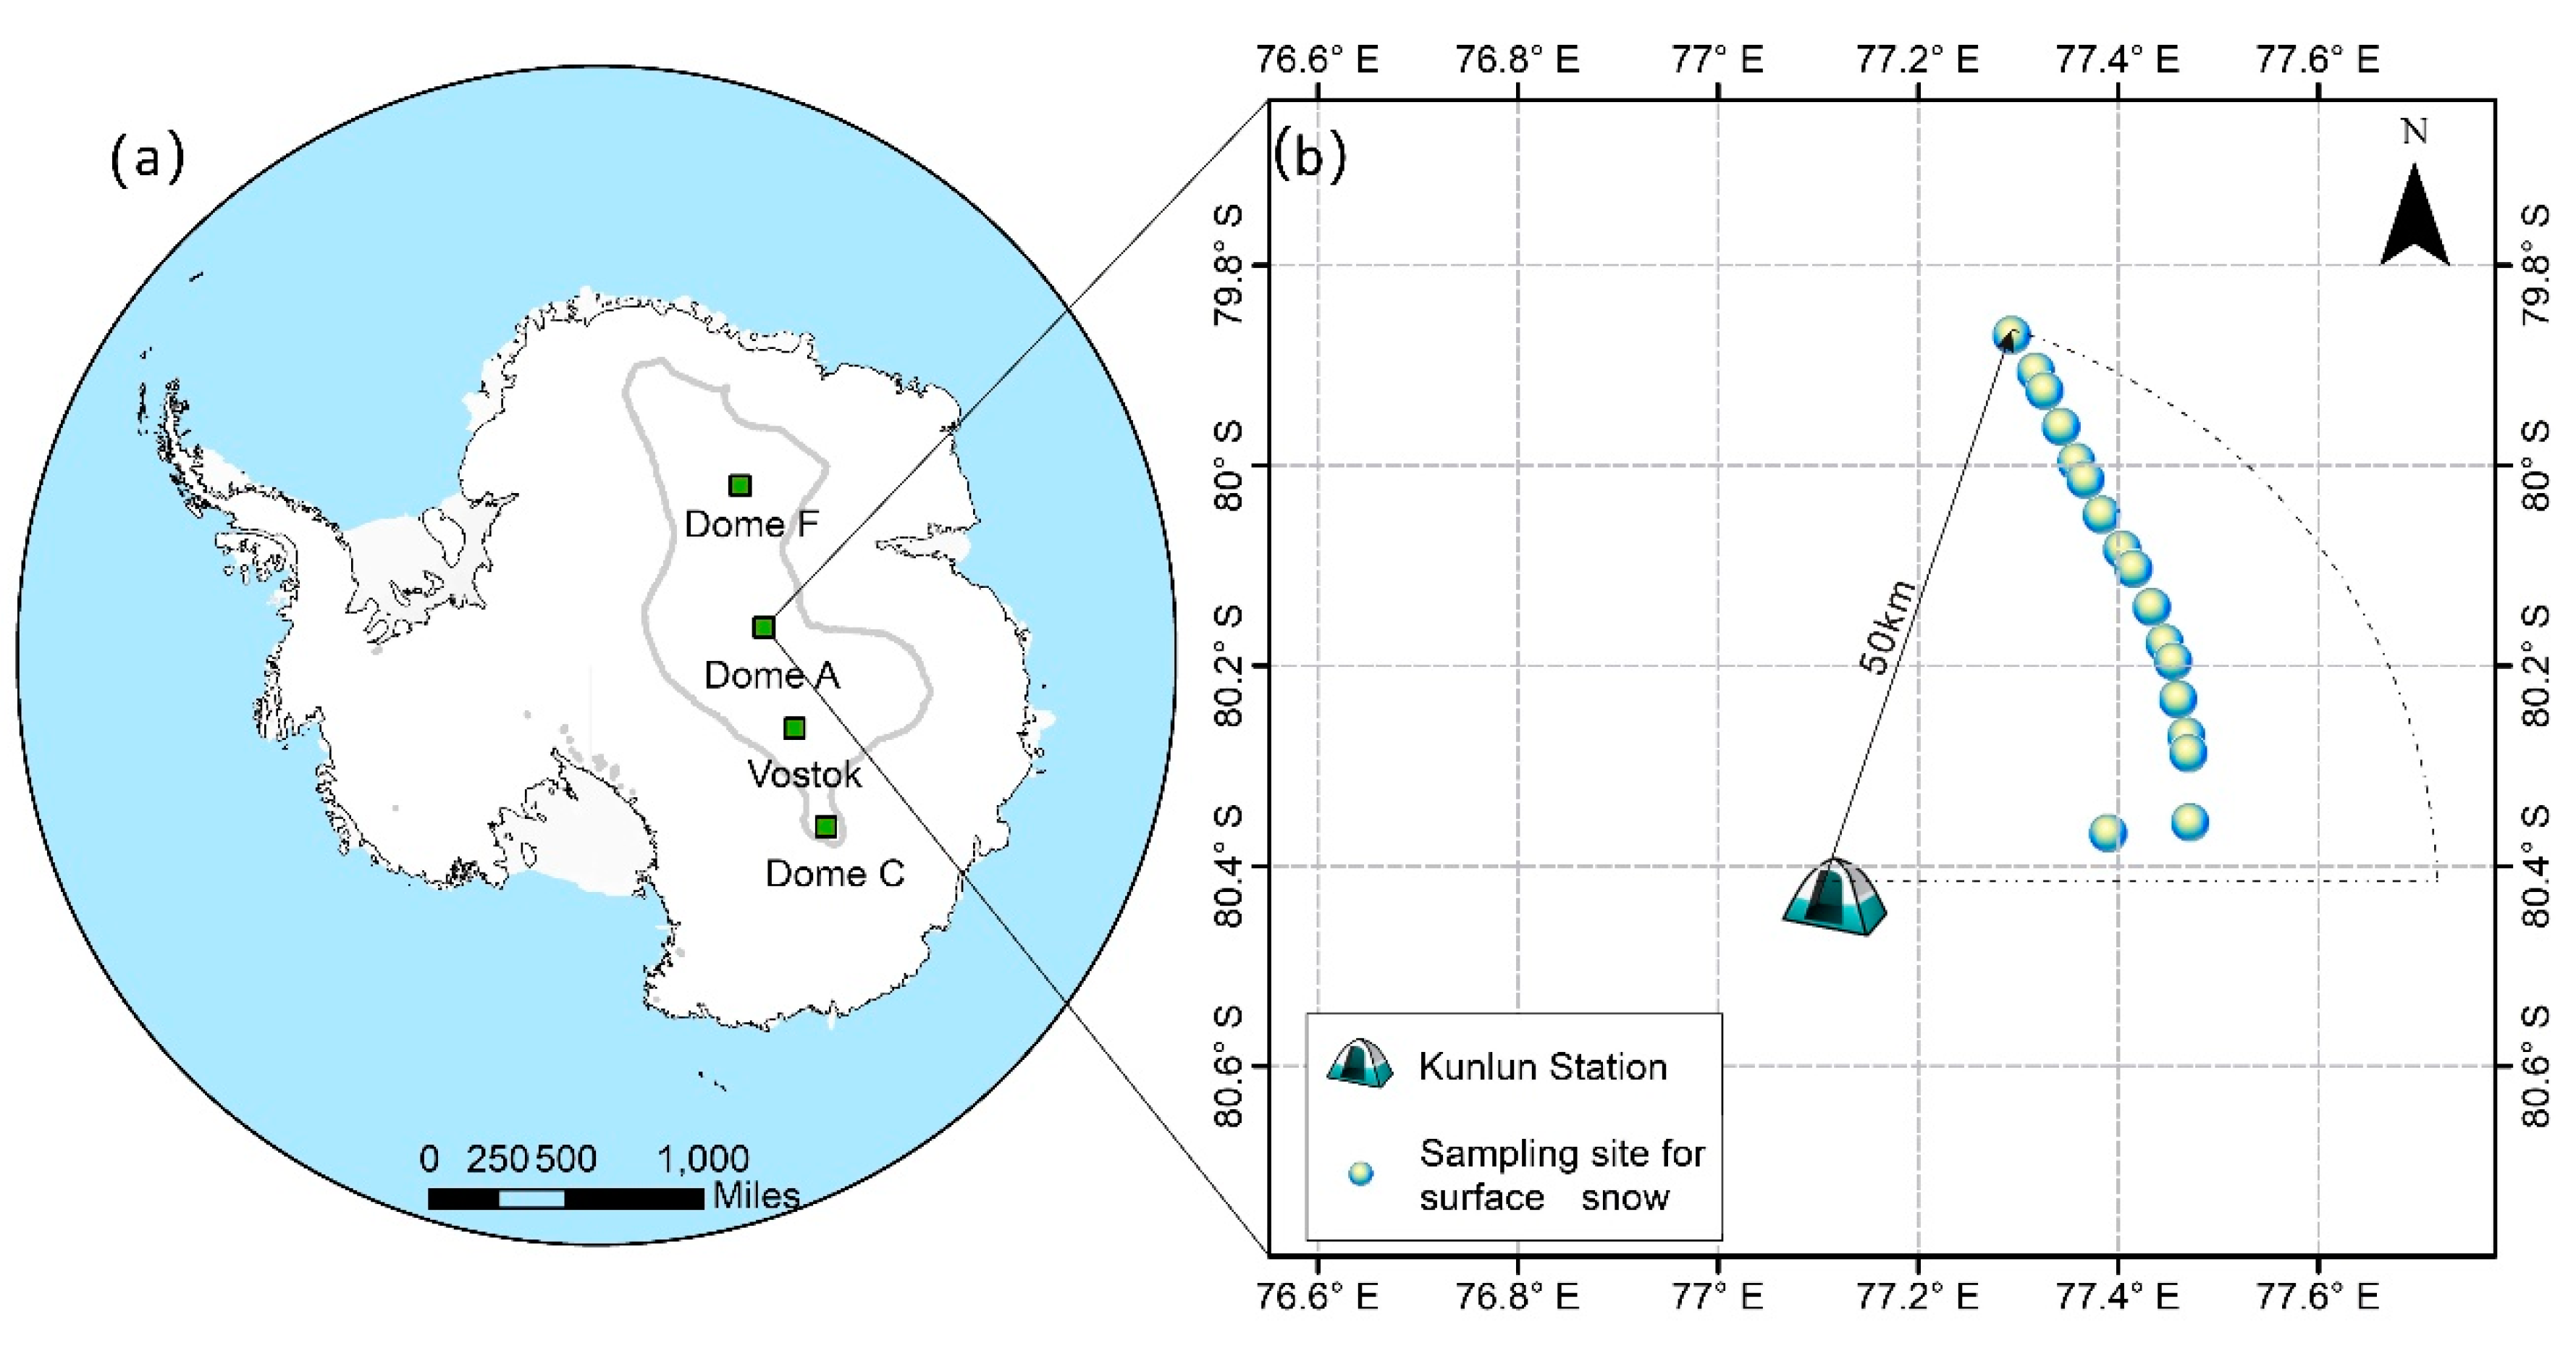
The on-site sampling was conducted at the Kunlun station (KL, 80.42° S, 77.12° E), Dome A (Figure 2a). Due to the limitation in weather conditions, the sample collection was conducted in summer (January and February). Note that all the used containers and tools were first cleaned by Milli-Q water (18.2 MΩ/cm) in the laboratory before sampling. Then they were dried under a class 100 clean hood and sealed in clean polyethylene (PE) bags.
Plastic plates (15.5 cm(L) × 15.5 cm(W)) were placed at the height of 50 cm above the ground (or higher) to collect precipitation samples at KL. During each event, the sampling was conducted at the earliest possible time of precipitation. Finally, 4 snow samples were collected in the two austral summers of 2016/2017 and 2018/2019. In addition, 8 existing measurements from 2009/2010 were also presented to characterize the isotopic composition of fresh precipitation at this site [26].
Surface snow sampling has been performed during the Chinese inland Antarctic expedition [23,24,25,26,27,28,29]. During sampling at each site, the topmost 3 ± 1 cm layer was collected in a randomly flat area. This depth corresponds to the 3–6 months of past net accumulation (20–40 mm w.e. year−1) at interior sites. Among the previous observations, we choose the data points located within 50 km of KL as the local variability of water stable isotopes in surface snow (Figure 2b). This selection finds a balance between the number of data and the representatives of local features at Dome A. In total, there are 18 data points obtained from the 2010/2011, 2012/2013 and 2014/2015 field seasons.
A 4.5 m deep snow pit was collected during the 2015/2016 field season. The sampling resolution is ~2.5 cm, which roughly equals the accumulation within half a year. In theory, the annual cycle could be recovered from these samples if there is no other noise. However, it is difficult to detect annual peaks of water stable isotopes in low accumulation regions. To accurately date the samples, a constant or average annual accumulation rate was used to calculate the age of each snow layer or depth, accompanied by prominent volcanic signals and snow density variations (Appendix A). The dating results can be seen in Section 3.1.
All of the snow samples were collected in clean 250 mL PE bottles, preserved in a clean insulated cabinet, and then transported to the laboratory under freezing conditions (≤20 °C) for treatment and analysis. All personnel wore PE gloves and face masks to prevent potential contamination.
Water stable isotope ratios of these samples were measured using a Picarro L-2130 cavity ring-down spectrometer. Each test for a single sample was conducted 6 times to reduce uncertainty induced by the instrument, and the last 3 injections were averaged to attain raw measurements. Then three standards from the VSMOW-SLAP scale were used as reference waters to calibrate these data. The analytical uncertainty for δ18O and δD are 0.05‰ and 0.2‰, respectively, resulting in a propagation error for deuterium excess of 0.45‰.

2.2. Field Experiments for Isotopic Exchange at the Snow–Air Interface

In the austral summer of 2015–2016 and 2016–2017, surface snow (the topmost 3 ± 1 cm layer) collected at Dome A (80.4° S, 77.1° E) was used for the field experiment, aiming at investigating the isotopic exchange between snow and air. The snow was collected using a clean high-density polyethylene (HDPE) scoop and then poured into a clean wide-mouth bucket to mix thoroughly using a shovel. To examine the homogeneity of the snow, two samples were collected randomly from the bucket for further chemistry measurements. The homogenized snow was equally transferred to square polyethylene (PE) boxes, with a volume of ~793 cm3 (15.5 cm(L) × 15.5 cm(W) × 3.3 cm(D)). The boxes were fully filled with snow, and the snow surface was scraped flat with a clean HDPE scraper. The snow density is close to that of the top ~10 cm layer at Dome A [30].
The field experiments were conducted at KL with an experimental duration of 16 days. Boxes in experiments were divided into two parallel groups and set in a room without temperature control (The mean temperatures were −35.1 °C), airtight conditions and solar insolation. The sampling was conducted at a 2-day resolution, and two boxes were sampled at each timepoint. The snow in each square box was weighed before and after the collection, with the weight difference representing the sublimated fraction. For more details of the field experiments, refer to Shi et al. [30].

2.3. Meteorological Data

To investigate the relationship between atmospheric temperature and stable isotopic signals of snow samples, the meteorological parameters were extracted from the records of automatic meteorological station (AWS) at KL. The AWS was installed in 2005 to perform hourly measurements of several parameters such as 2 m temperature (T2m), relative humidity (RH), surface pressure (p), wind speed and wind direction. These data are only available during the period of 2005–2011, but could reflect the temporal variations of measured parameters from a monthly to an inter-annual scale [31].
On a monthly scale, the mean T2m recorded by AWS varies from −30.74 °C in December to −62.12 °C in August (Figure 3a). This seasonal variation is in agreement with those of other sites in East Antarctica, including Vostok, Dome C and Dome F. Different from T2m, the mean RH remains relatively constant during the whole year, with a range of 34–50%. Moreover, the monthly mean wind speed and the constancy of wind direction have a small variability at an amplitude of 0.8–3.4 m/s and 0.7–0.8, respectively [31].
From the AWS records, the annual mean T2m is −52.07 °C. However, this result was insufficient to compare with the water isotopic profile in the snow pit. To extend the temperature variations to a longer period, we retrieve the annual T2m from ERA-20c and the ERA-interim reanalysis dataset with a 1° × 1° grid resolution, during the period of 1950–2016. In the past 66 years, the T2m from ERA reanalysis data shows an increasing trend, with an average of −51.80 °C (Figure 3b). Compared with the instrumental data, there is a small difference of 1.0 °C for the reanalysis dataset over the period of 2005–2011. The agreement indicates that the outputs from the ERA reanalysis dataset are reliable for local temperature variations. Thus, the annual mean temperature from the ERA reanalysis dataset can be used to compare with stable isotopic composition in snow pits.
In addition, the KL is characterized by snow accumulation of 23 ± 5 mm w.e. year−1 [32,33]. The annual mean wind speed is 2.2 m·s−1, with southward winds having the highest frequency. As for specific humidity, the annual mean value equals 0.06 g·kg−1, lower than its variation (0.2–0.4 g·kg−1) in summer [31]. The annual mean value of pressure is 574 mbar, with a variation of 9–18 mbar. These variables also provide model parameters for simulating isotopic composition in surface snow and snow pits.

2.4. Diffusion of Water Isotopes in Firn

The diffusion process in snow and firn is indeed the random movement of water molecules, which can attenuate the water isotope signal from the time of deposition [17]. The smoothing of water stable isotope profiles can be described as a convolution between the initial signal of surface snow δ0 and a Gaussian filter:
δ ( z , t ) = 1 σ 2 π δ 0 ( z ) · exp ( ( z z ) 2 2 σ 2 ) dz
where z is the depth of snow layer (m), and σ is termed the diffusion length as its square represents the average displacement of a water molecule along the z-axis.
In theory, the σ can be calculated by three models for densification, ice flow and firn diffusivity [34]. Here, the solving Equation for used models are described as:
d σ 2 d ρ d p d z d z d t = 2 ε ˙ z ( ρ ) σ 2 + 2 Ω f i ( ρ )
For densities below the critical density (ρ < 550 kg·m−3), the squared diffusion length thus can be evaluated by:
σ 2 ( ρ ) = ( 1 ρ ρ i c e ) 2 2 k 0 c m p Ω a i R T α i ( ρ 2 ρ 0 2 2 1.30 ρ 4 ρ 0 4 4 ρ i c e 2 )
where ρ is the density of firn, ρo = 360 (kg·m−3) is the density of surface snow, ρice = 917 (kg·m−3) is the density of ice, k0 is the parameter from the Herron–Langway model, c = 23 (kg·m−2·year−1) is the snow accumulation rate at Dome A, m = 18/1000 (kg) is the molar weight of water, p is the saturation vapor pressure over ice that can be calculated from temperature, Ωai is the diffusivity of water vapor in the air using Equation (4) from Holme et al., [20], R = 8.314 (m3·PaK−1·mol−1) is the molar gas constant, T is the average temperature, and αi is the vapor fractionation factor:
Ω a i = 2.1 × 10 5 ( T 273.15 ) 1.94 ( 1 P )

2.5. Spectral Analysis and Minimal Forward Model

According to the definition of σ in Section 2.5, the power spectral density (PSD) of the diffused isotopic time series, Pm (k), can be calculated as follows:
P m ( k ) = P 0 ( k ) · exp ( k 2 σ 2 ) + P n
where P0 is the PSD of the compressed profile without diffusion, k represents the frequency and Pn is the noise term. This suggests that the influence of molecular diffusion can be distinguished by looking at the difference of PSD between an actual δ18O profile and those from a null model of diffused noise.
Based on the above cognitions, spectra of observed and artificial δ18O data are estimated using Thomson‘s multitaper method with three windows. The observed δ18O profile is from measurements of the Dome A snow pit (Section 2.1) after a linear detrend. The artificial δ18O profiles are generated from a minimal forward model developed by Laepple et al., [19]. The model describes δ0 to be composed of the periodic signal (δp) from freshly solid precipitation and the white noise (δε) from precipitation intermittency, snow redistribution, accumulation variability, and other processes. The δp is calculated from seasonal T2m and the Antarctic spatial slope between T2m and water isotopes (0.8‰·°C−1). As for δε, it was set by the combination of white noise (εδ) and the variance of the seasonal cycle (σ2m) in temperature (11.8). Thus, the model for δ0 can be described as:
δ 0 = β ( ( 1 ξ ) 1 / 2 T 2 m + ξ 1 / 2 σ 2 m ε δ )
where the ξ determines the fraction of noise (0–1).
Significance testing of PSD is also performed by the null hypothesis of diffused white noise plus measurement noise in a Monte Carlo procedure with 1000 data sets. The critical significance level is chosen as 95% to guarantee the authentic peak derived from the temperature-dependent signal, rather than the noise term.

3. Results

3.1. Water Stable Isotopes and Their Link to Local Temperature

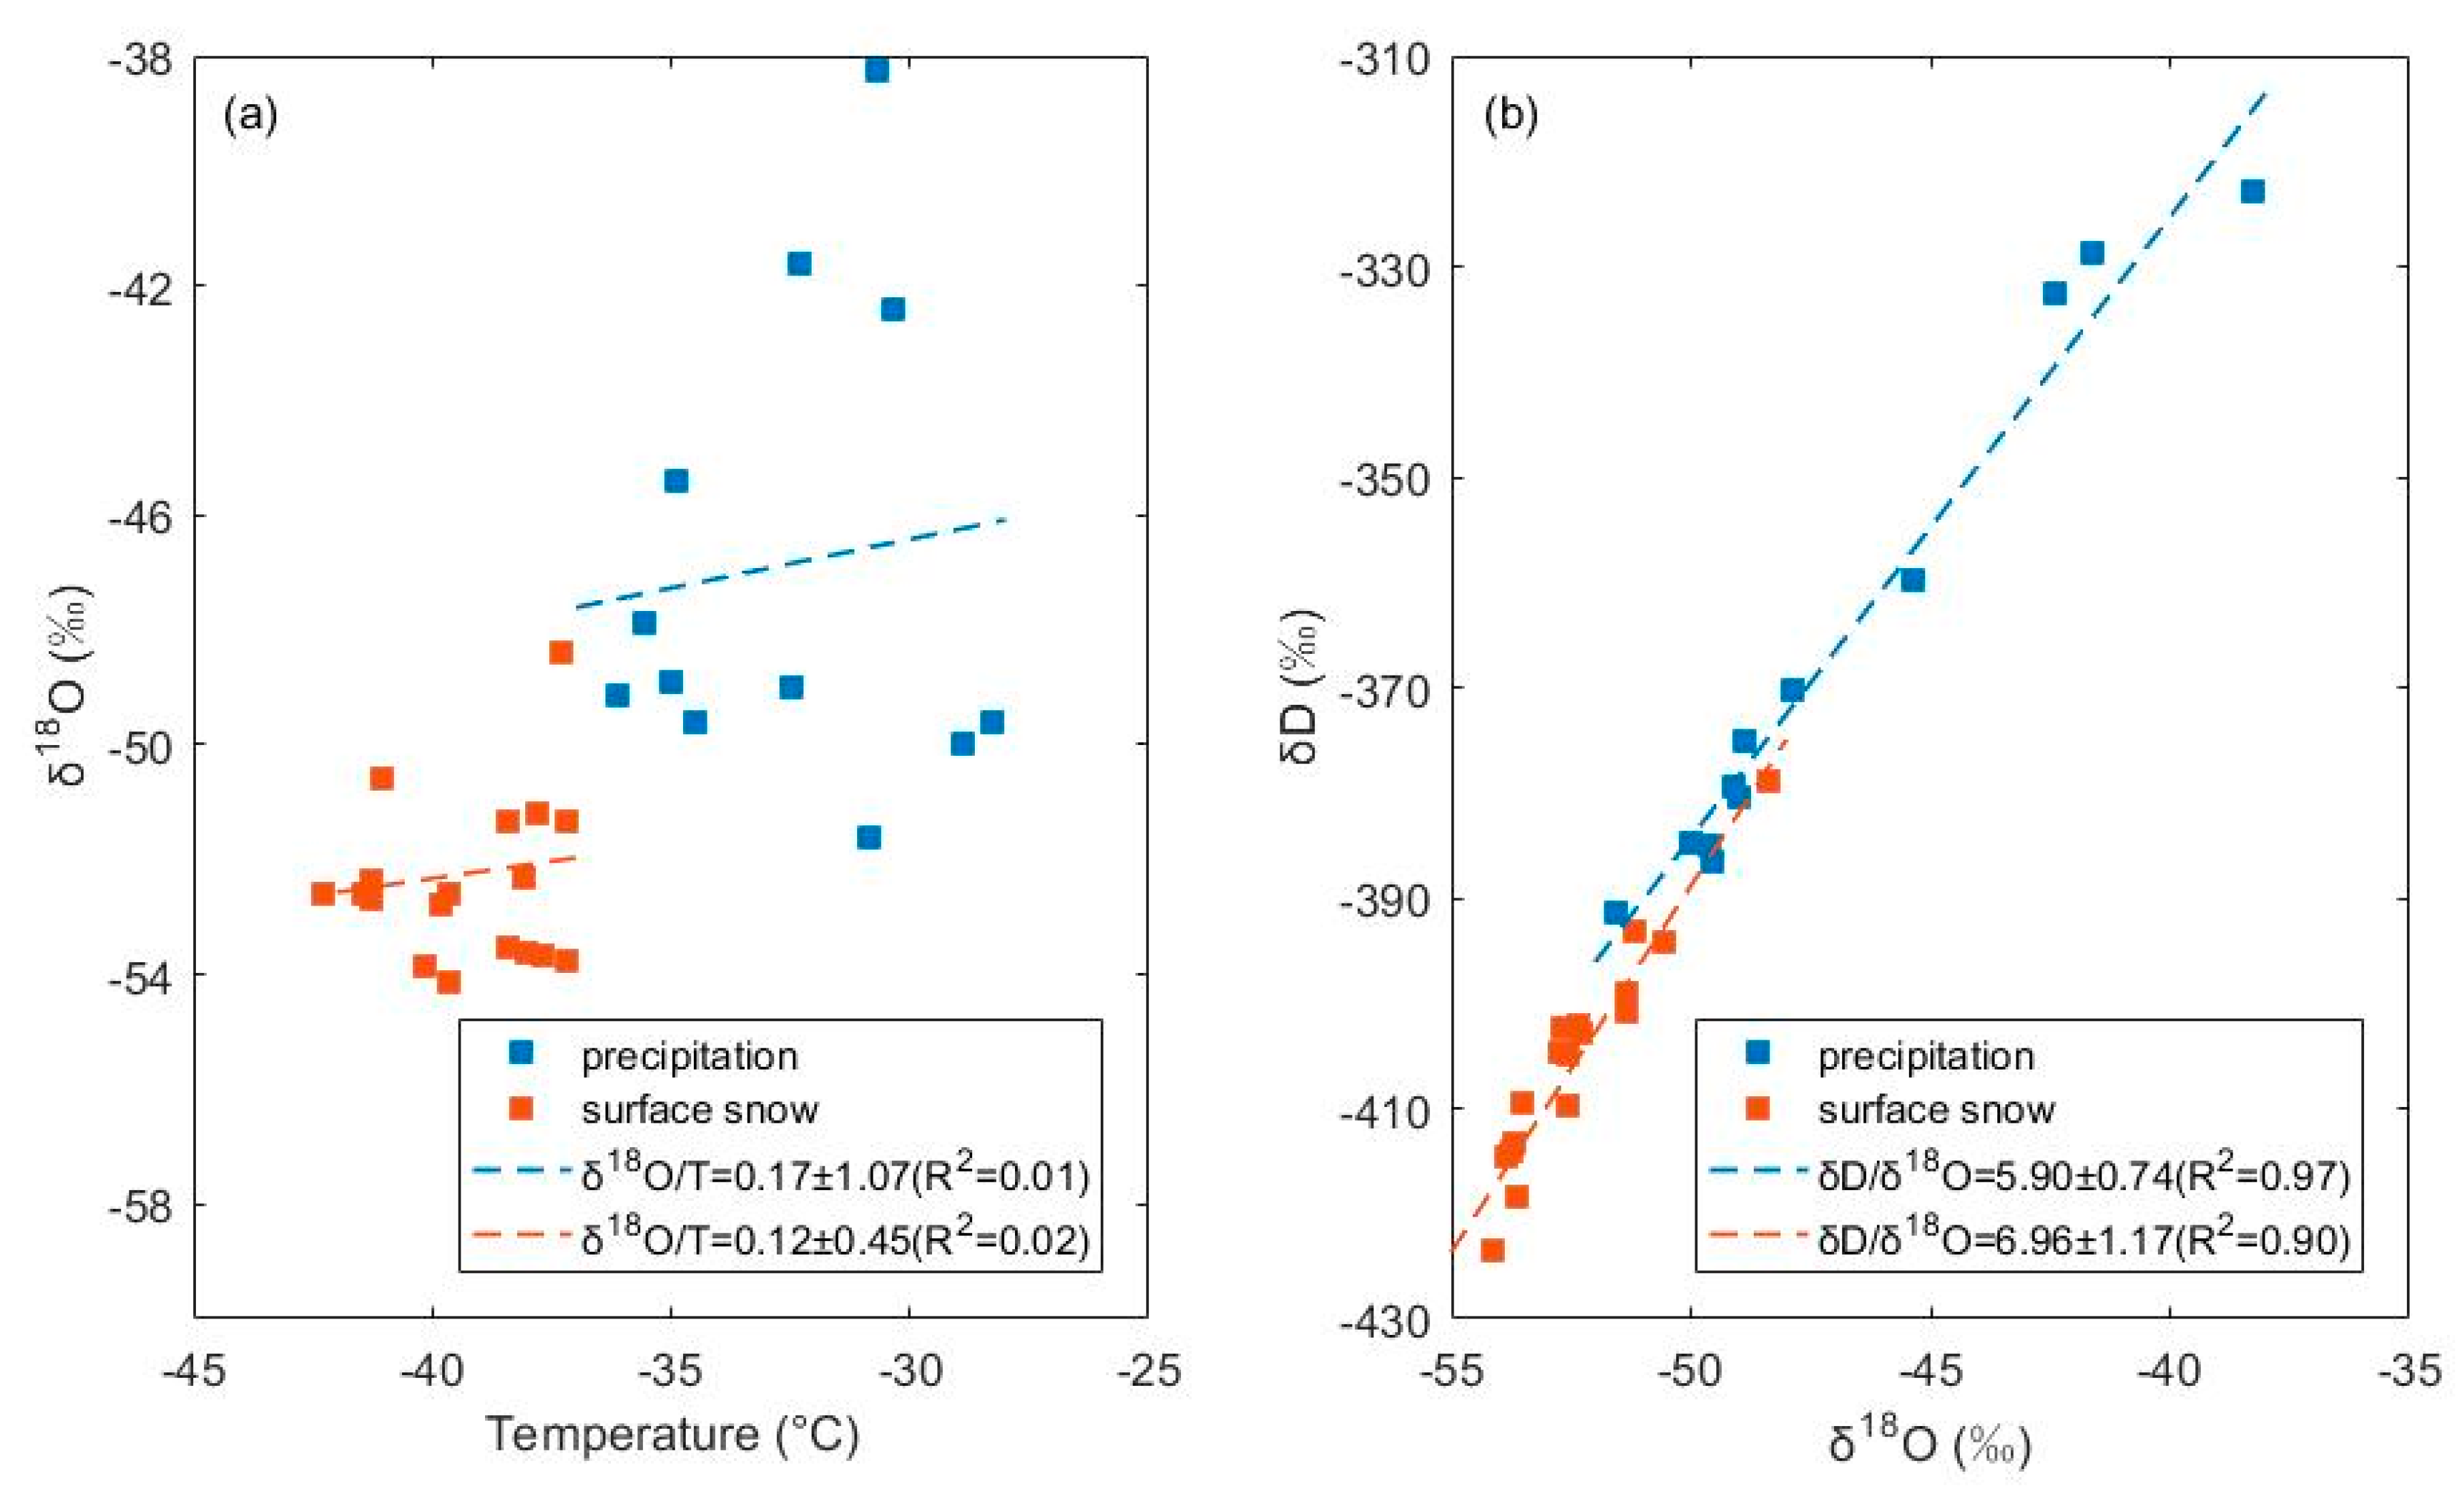
As for new observations, the δ18O of four precipitation events at KL are −41.60‰, −38.25‰, −49.13‰, and −49.58‰, respectively. Together with eight data points collected in the 2009/2010 austral summer season [26], the mean value of δ18O for summer precipitation is −46.94‰, with a standard deviation of 3.93‰. No significant correlation is found between 2 m air temperature and δ18O in precipitation, but the slope of δ18O-T2m is still assessed using linear regression analysis (R2 = 0.01, p > 0.05, Figure 4a). In addition, δ18O has a strong relationship with δD (R2 = 0.97, p < 0.05, Figure 4b), and their slope (δD/δ18O), named Local Meteoric Water Line (LMWL), is 5.90.
The mean δ18O of local surface snow samples in the Dome A region is −53.74‰, with a standard deviation of 2.39‰. This value is lower than the values of summer precipitation sampled at KL. To further understand the δ18O variation in the two kinds of samples, both δ18O-T2m and δD-δ18O relationships for surface snow samples have been examined, and no significant relationship was found (R2 = 0.02, p > 0.05, Figure 4a). Note that there is a close relationship between δD and δ18O, with a slope of 6.96 (R2 = 0.90, p < 0.05, Figure 4b).
The δ18O in snow pit samples at Dome A varies from −48.80‰ to −62.97‰, with a mean of −58.48‰ and a standard deviation of 2.27‰ (Figure 5). The averaged δ18O in the snow pit is lower than the values of Dome A precipitation and surface snow. Along with the vertical profile, there are 21 peaks of δ18O identified by manually counting the amplitude difference of 1.5‰ between two δ18O extremes (Figure 5a, blue hollow dot). It is estimated that the averaged wavelength of an apparent cycle at the Dome A snow pit is 21.4 cm (Figure 5b), in line with previous observations on the East Antarctic plateau (15–25 cm) [19]. Because the wavelength is inconsistent with annual snow accumulation (~6.3 cm snow, equals to 23 mm w·eq·year−1), the time series of the Dome A snow pit is mainly determined by the time-stratigraphic markers of volcanic eruption (method described in Appendix A). The profile covers the period from 1950 C.E. to 2016 C.E. (Figure 5a) Following the time series, the time-averaged 2 m air temperature derived from the ERA reanalysis dataset has been calculated for comparison with the stable isotopic composition of the snow pit at Dome A (Figure 5c). It is shown that the relationship between water isotopes and temperature is insignificant, similar to that in precipitation and surface snow (Figure 4).

3.2. Isotopic Modification at Air–Snow Interface from Field Experiments

During the course of the experiment, the minimum δ18O of both groups appeared at the beginning of the experiment, though the initial values of δ18O were different (Figure 6a). The maximum δ18O of remaining snow for the 2015/2016 field season is shown on the 4th day, while it is on the 12th day for the 2016/2017 field season. The difference between the highest and the lowest δ18O is 0.57‰ for the 2015/2016 field season and 0.73‰ for the 2016/2017 field season, respectively. As for δD, its temporal pattern is similar to that of δ18O (Figure 6b). The variations in both δ18O and δD are, in general, a fall within the uncertainty of the experiments (i.e., the difference in water isotopes of the experiment snow in individual boxes), and the snow mass fraction for each of the two groups is basically constant over the course of the experiment (Figure 6c), with a fractionation constant of close to zero.

3.3. Spectra of Observed δ18O Profile

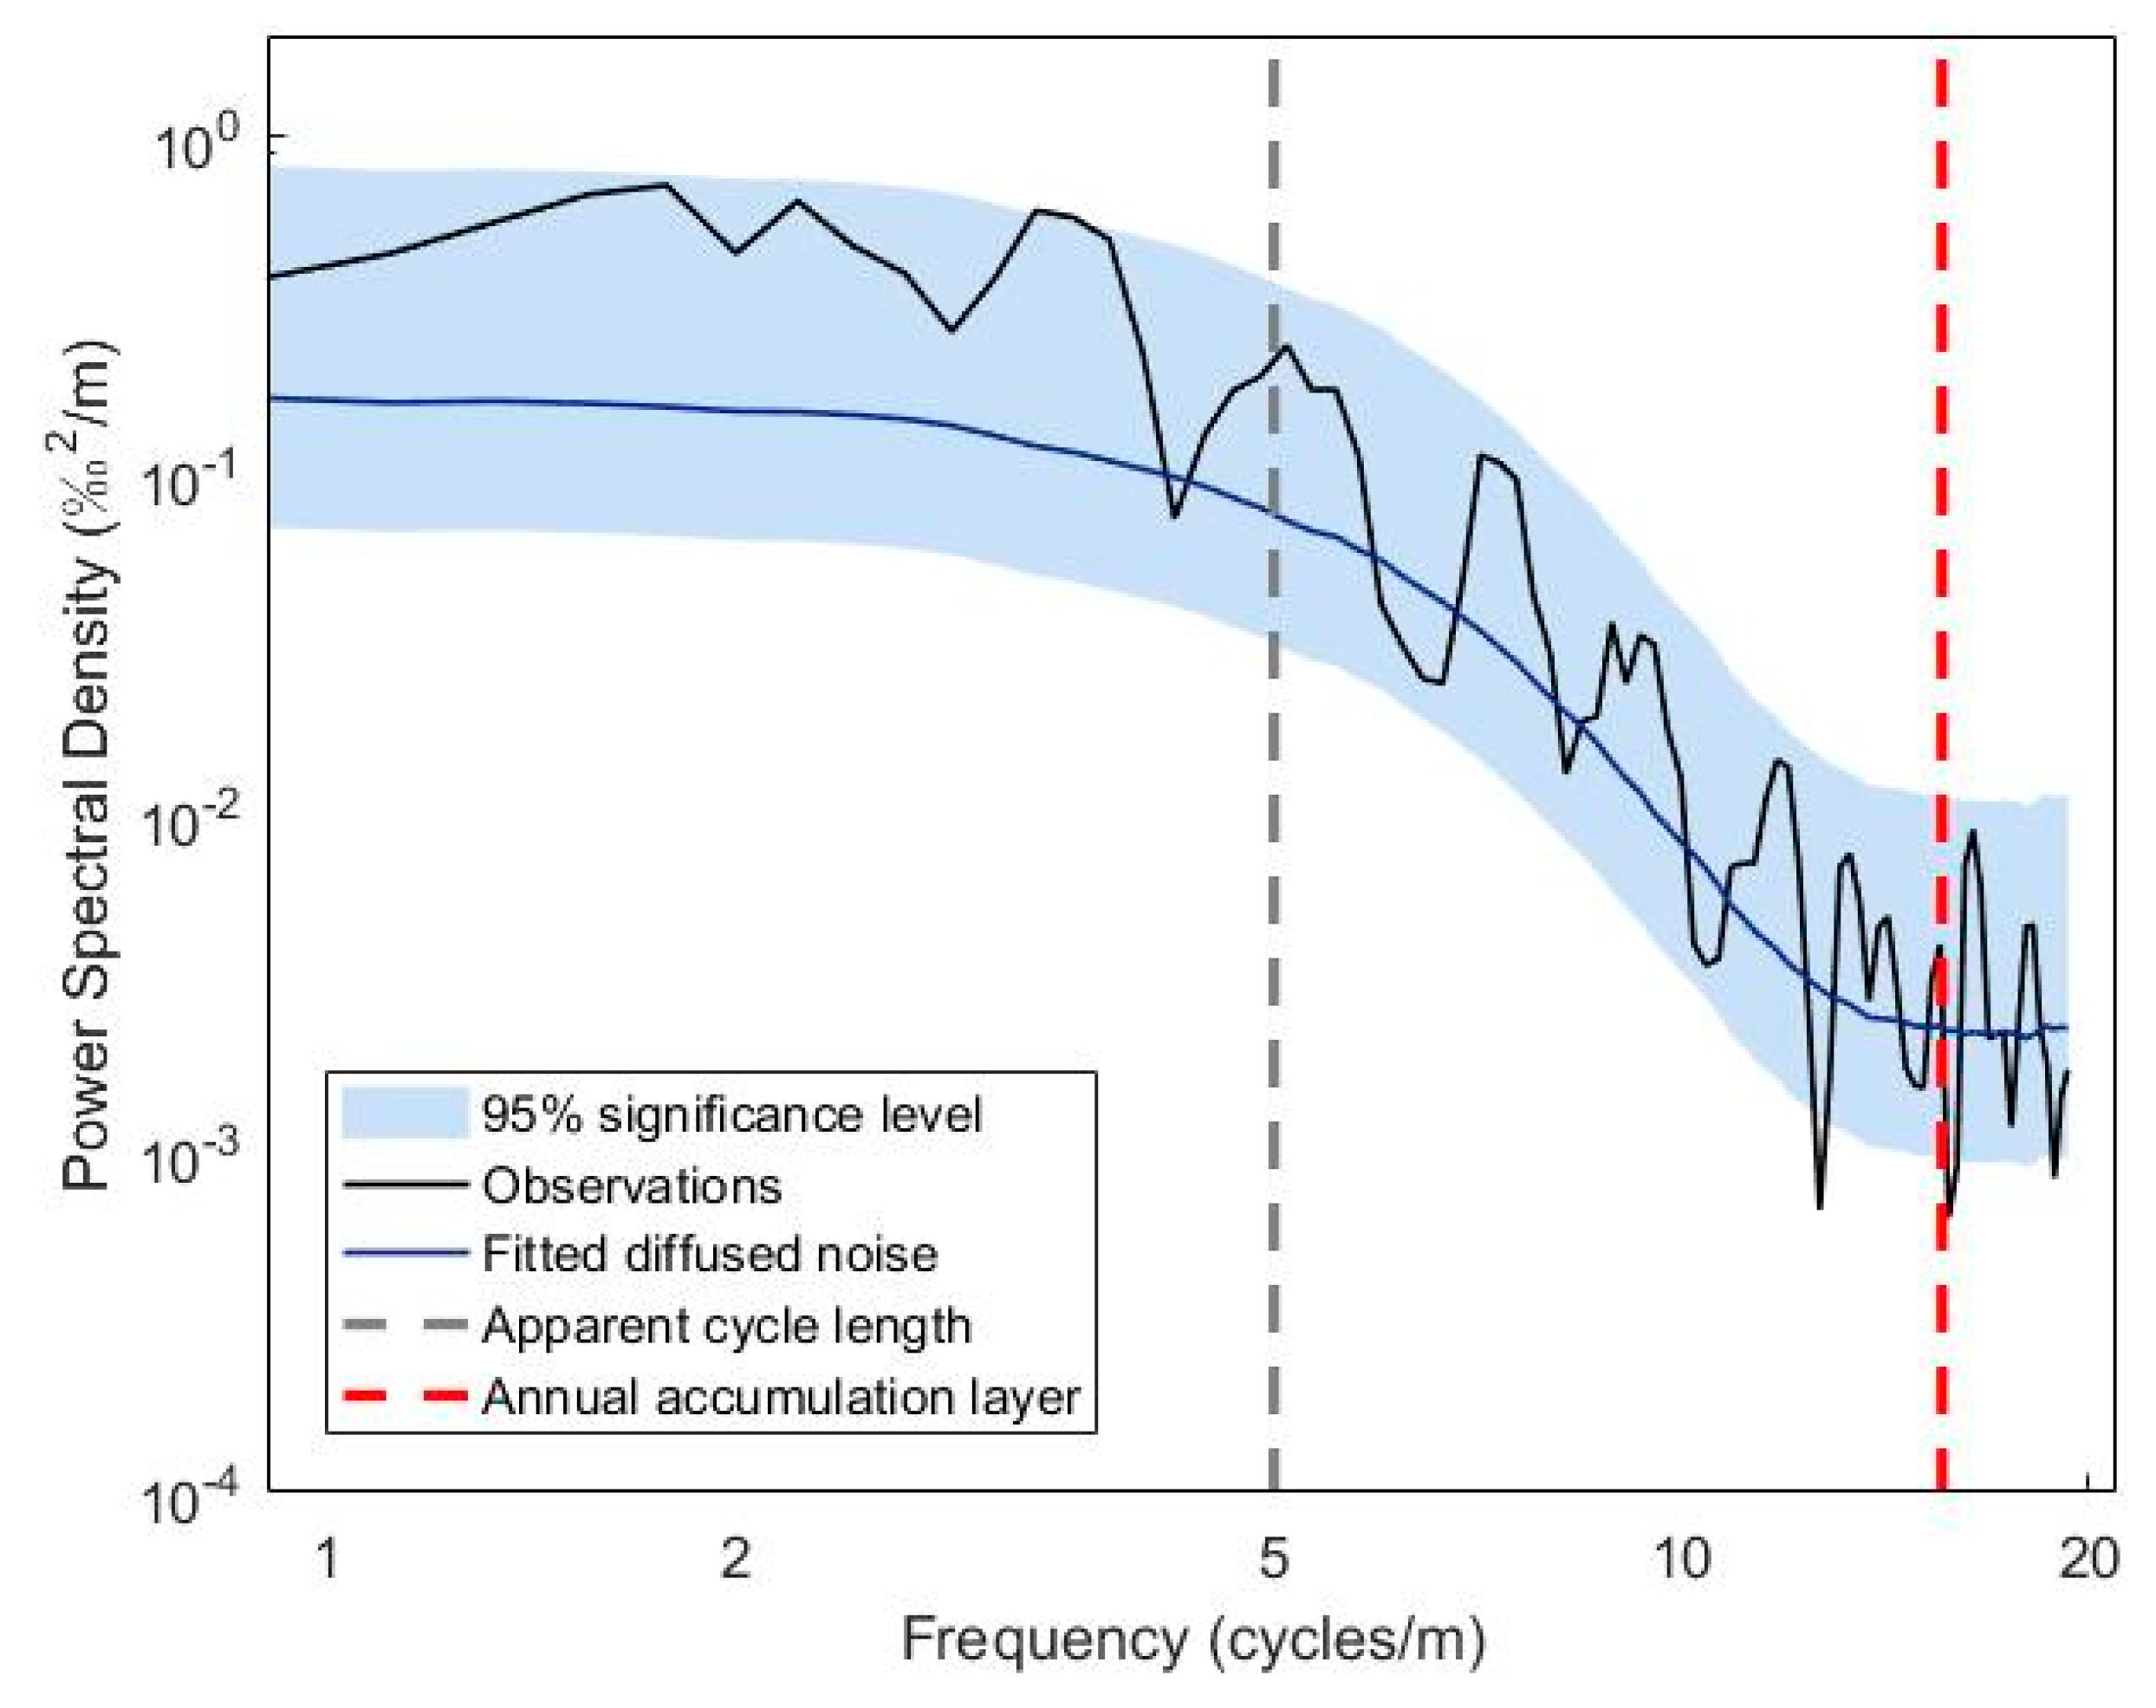
Figure 7 shows the actual power spectra of the observed δ18O profile in the Dome A snow pit (black line), based on Thomson’s multitaper method with three windows. The power spectra density (PSD) remains basically constant at the frequency range lower than 5 cycles/m, then decreases with the increase of frequency and finally drops to the value of 10−32/m. This pattern is similar to the diffused white noise plus the measurement noise spectra of the δ18O profile (blue line). The peaks at different frequencies are also found in the spectra of the observed δ18O profile from the Dome A snow pit, with respect to diffused white noise spectra. These peaks may be attributed to a superposition of temperature-dependence signals and to a variety of noise created by precipitation intermittency, downward-advection and snow redistribution, etc. However, they are not significant to the significant level of 95% (blue shading), even at the frequency of 5 cycles/m corresponding to the apparent cycle length (~20 cm) of δ18O profile in the Dome A snow pit.

4. Discussion

4.1. Implications for Archival Processes of the Water Stable Isotope Signal in the East Antarctic Plateau

In comparison, the mean δ18O value of summer precipitation samples at KL is lower than the results of −44.63‰ at Vostok [5], −45.88‰ at Dome C [13], and −45.14‰ at Dome F [35]. This can be attributed to the higher elevation of Dome A, because the water stable isotope ratio has a negative correlation with elevation [4]. The relationship between δ18O and T at Dome A is not significant, which is possibly associated with its sampling only one season. The δ18O-T slope is not significantly different to zero, and is lower than the results from other Antarctic interior sites, including Dome C, Vostok and Dome F (Table 1). This spatial discrepancy in isotopic thermometer may be related to different moisture source regions, the transportation paths of moisture, and local geographical factors among these interior sites [13].
Compared to summer precipitation, a relatively low value of δ18O is observed in surface snow (Figure 4). This possibly suggests the contribution from non-summer snow, considering the sampling depth of surface snow (~3 cm) corresponds to the 3–6 months of past net accumulation at Dome A. The δ18O-T slope is also not significantly different from zero, similar to that in precipitation (Figure 4a). It is noted that the different pattern in the δ18O-T slope between precipitation and surface snow is generally found at Dome C [13]. The results at Dome A and Dome C suggest that the δ-T slope obtained from local surface snow may not be suitable for atmospheric temperature reconstruction.
In addition, the slope (δD/δ18O) of the Local Meteoric Water Line (LMWL) in summer precipitation is lower than that in surface snow (Figure 4b). The influence of sampled snow possibly including parts of non-summer snow could explain the difference, since the δD/δ18O slope of non-summer snow is higher than that of summer snow at other Antarctic interior sites [26]. The increase in the δD/δ18O slope in non-summer snow cannot be independently caused by a distillation process, considering that the previously modeled δD/δ18O slope at Dome A (7.62) is much higher [26]. Thus, the isotopic modification from post-depositional processes may also account for the differences in the δD/δ18O slope between summer precipitation and surface snow.
For snow pits samples from other East Antarctic Plateau, the averaged δ18O of −58.48‰ is lower than the mean values of −56.26‰ at Dome F [11], −56.52‰ at Vostok [37] and −49.18‰ at Dome C [13]. These spatial patterns in δ18O are possibly related to the elevation, which is proposed to be closely related to water isotopes [4]. A lower mean value with respect to that of precipitation and surface snow also indicates that water isotopes have been modified during the transition from surface snow to firn.

4.2. The Isotopic Variation from Sublimation-Condensation Cycle

The values of δ18O and δD keep basically constant during the course of the experiment, suggesting that isotopic modification from the sublimation–condensation cycle is insignificant at around −35 °C, in line with previous experiments in the laboratory [15]. Previous investigations proposed that the functional depth of sublimation tends to be limited within the top 1–2 cm snow layer at −35 °C [15]. Considering this, ~3 cm snow used in our experiments is insufficient to make an obvious change of isotopic values in snow. It is noted that the field experiments are, at least in part, different from the natural conditions, without solar radiation and under very weak wind ventilation condition. In this case, the mass loss fraction and changes in water isotope could be underestimated [38], and further work is needed to evaluate the effects of sublimation.

4.3. Implications for Spectra of Artificial and the Observed δ18O Profile

The spectra obtained from the observed δ18O profile is similar to that from the diffused white noise plus the measurement noise of the δ18O profile (Figure 8), indicating that diffusion is a key process of isotopic modification during the transition from snow to firn. The similarity between these two spectra also suggests that the cycle signal from temperature is the minor component of the actual isotopic signal. It is in agreement with the results of other interior sites in East Antarctica, where snow accumulation rate is very low [19].
To further understand the ratio of diffused noise and signal, the artificial signal of δ18O in the snow is constructed by a minimal forward model to compare with observations. Three representative cases are considered as follows: seasonally dominated signal (ξ = 0.05, green line), equally mixed input (ξ = 0.5, blue line) and noise-dominated profile (ξ = 0.9, pink line). Then, the difference between the observed profile and artificial signal is evaluated by combining it with the correlation coefficient (R), Root Mean Square Error (RMSE), and Nash–Sutcliffe efficiency coefficient (NSE). As shown in Figure 8a, the amplitude of the signal in the seasonally dominated noise case (ξ = 0.9) is close to the observed profile. Its correlation coefficient appears higher than those in other cases, with a relatively low RMSE (Table 2). In parallel, the NSE of the seasonally dominated case is closer to 1 among the three cases. This indicates that the low fraction of temperature-dependent signal is preserved in the snow pit, consistent with the previous findings from other snow pits in Antarctic interior sites [19].
The average PSD of high signal-noise ratio case is deviated from the spectra of the actual signal, especially at the frequency range higher than 10 cycles/m. The PSD curve of the mixed input case (blue line in Figure 8b) also has an offset from the actual signal, but the deviation is smaller than that in the high signal–noise ratio case. In contrast, the low signal–noise ratio case (pink line in Figure 8b) is basically consistent with the PSD of the actual signal. The variation in these three cases confirms that the δ18O signal in the snow pit is mainly composed of noise. Note that there is a clear peak corresponding to the annual year thickness in each simulated case (vertical line in Figure 8b). Moreover, the magnitude of peak in high signal–noise ratio case is larger than that in the spectra of low signal–noise ratios. This difference could result from the strong effect of diffusion on the seasonally dominated fraction of the δ18O signal.

5. Conclusions

This study provides new observations and modeling δ18O of precipitation, surface snow, and snow pit samples at Dome A, the summit of the Antarctic ice sheet. Based on field experiments with ~3 cm snow, the sublimation–condensation cycle cannot significantly induce an isotopic enrichment of the initial signal at −35 °C, but this effect may be underestimated considering how the experiment conditions were inconsistent with natural ones. In the snow pit, the diffusion process causes attenuation of the δ18O signal with an increase of depth. The seasonal variation of δ18O is also disappeared because of the strong noise input from diffusion. Instead, an apparent cycle with a ~20 cm wavelength is found in the δ18O snow pit. This pattern from a single profile is consistent with the results at other low-accumulation sites in Antarctica, suggesting that the paleoclimate reconstruction at a seasonal timescale is difficult to achieve if only a firn or an ice core is used.

Author Contributions

Data curation, G.S.; Writing—Original draft, T.M.; Writing—Review and editing, L.L., Y.L. and G.S. All authors have read and agreed to the published version of the manuscript.

Funding

This research was funded by National Science Foundation of China (Grant No. 41922046), Chinese Polar Environment Comprehensive Investigation & Assessment Programmes (Grant No. CHINARE-02-02) and the State Eleventh Five-year Scientific and Technological Support Project (Grant No. 2006BAB18B00).

Acknowledgments

The authors are grateful to the members of the 27th, 29th, 31st, 32nd and 33rd CHINARE inland travel teams for technical support and assistance.

Conflicts of Interest

The authors declare that there is no conflict of interests regarding the publication of this article.

Appendix A

Snow Pits Dating
To date a snow pit in the low-accumulation region at Antarctic interior sites, the more accurate method is to identify prominent volcanic signals in the non-sea salt sulphate (nssSO42–) profile in combination with a constant or average annual accumulation rate. In this case, the sulphate (SO42–) in the snow pit has been firstly analyzed by ion chromatography at the same resolution of isotopic measurements. Then, the variation of nssSO42− was calculated based on the contribution by sea salt aerosol particles to sulfate concentration from sodium or chloride concentration (Equation (A1)). The average annual accumulation rate of ~23 mm w.e. year–1 was observed by bamboo stick height measurements.
nssSO 4 2 = SO 4 2 ( SO 4 2 / Na + ) seawater   ×   Na +
Based on the nssSO42− profile observed at Dome A, we found a very large nssSO42- signal at a depth of 3.07 m. which is likely the fallout from a massive eruption by Agung in 1964 [39,40]. Another large nssSO42– signal was found at a depth of 1.65 m and was identified as the fallout in 1991/92 Pinatubo [39,40]. From the depths of these two time-stratigraphic markers, the age of each snow layer is calculated by the constant accumulation rate method.

References

  1. EPICA Community Members Eight glacial cycles from an Antarctic ice core. Nature 2004, 429, 623–628. [CrossRef] [PubMed] [Green Version]
  2. Jouzel, J. A brief history of ice core science over the last 50 yr. Clim. Past Discuss. 2013, 9, 3711–3767. [Google Scholar] [CrossRef]
  3. WAIS Divide Project Members. Onset of deglacial warming in West Antarctica driven by local orbital forcing. Nature 2013, 500, 440–444. [Google Scholar] [CrossRef] [PubMed]
  4. Masson-Delmotte, V.; Hou, S.; Ekaykin, A.; Jouzel, J.; Aristarain, A.; Bernardo, R.T.; Bromwich, D.; Cattani, O.; Delmotte, M.; Falourd, S.; et al. A Review of Antarctic Surface Snow Isotopic Composition: Observations, Atmospheric Circulation, and Isotopic Modeling. J. Clim. 2008, 21, 3359–3387. [Google Scholar] [CrossRef] [Green Version]
  5. Touzeau, A.; Landais, A.; Stenni, B.; Uemura, R.; Fukui, K.; Fujita, S.; Guilbaud, S.; Ekaykin, A.A.; Casado, M.; Barkan, E.; et al. Acquisition of isotopic composition for surface snow in East Antarctica and the links to climatic parameters. Cryosphere 2016, 10, 837–852. [Google Scholar] [CrossRef] [Green Version]
  6. Goursaud, S.; Masson-Delmotte, V.; Favier, V.; Preunkert, S.; Legrand, M.; Minster, B.; Werner, M. Challenges associated with the climatic interpretation of water stable isotope records from a highly resolved firn core from Adélie Land, coastal Antarctica. Cryosphere 2019, 13, 1297–1324. [Google Scholar] [CrossRef] [Green Version]
  7. Klein, F.; Abram, N.J.; Curran, M.A.J.; Goosse, H.; Goursaud, S.; Delmotte, V.M.; Moy, A.; Neukom, R.; Orsi, A.J.; Sjolte, J.; et al. Assessing the robustness of Antarctic temperature reconstructions over the past 2 millennia using pseudoproxy and data assimilation experiments. Clim. Past 2019, 15, 661–684. [Google Scholar] [CrossRef] [Green Version]
  8. Hendricks, M.B.; DePaolo, D.J.; Cohen, R.C. Space and time variation of δ18O andδD in precipitation: Can paleotemperature be estimated from ice cores? Glob. Biogeochem. Cycles 2000, 14, 851–861. [Google Scholar] [CrossRef]
  9. Schlosser, E.; Reijmer, C.; Oerter, H.; Graf, W. The influence of precipitation origin on the δ18O–T relationship at Neumayer station, Ekstrmisen, Antarctica. Ann. Glaciol. 2004, 39, 41–48. [Google Scholar] [CrossRef] [Green Version]
  10. Yoshimura, K. Stable Water Isotopes in Climatology, Meteorology, and Hydrology: A Review. J. Meteorol. Soc. Jpn. 2015, 93, 513–533. [Google Scholar] [CrossRef] [Green Version]
  11. Hoshina, Y.; Fujita, K.; Nakazawa, F.; Iizuka, Y.; Miyake, T.; Hirabayashi, M.; Kuramoto, T.; Fujita, S.; Motoyama, H. Effect of accumulation rate on water stable isotopes of near-surface snow in inland Antarctica. J. Geophys. Res. Atmos. 2014, 119, 274–283. [Google Scholar] [CrossRef]
  12. Touzeau, A.; Landais, A.; Morin, S.; Arnaud, L.; Picard, G. Numerical experiments on vapor diffusion in polar snow and firn and its impact on isotopes using the multi-layer energy balance model Crocus in SURFEX v8.0. Geosci. Model Dev. 2018, 11, 2393–2418. [Google Scholar] [CrossRef] [Green Version]
  13. Casado, M.; Landais, A.; Picard, G.; Münch, T.; Laepple, T.; Stenni, B.; Dreossi, G.; Ekaykin, A.A.; Arnaud, L.; Genthon, C.; et al. Archival processes of the water stable isotope signal in East Antarctic ice cores. Cryosphere 2018, 12, 1745–1766. [Google Scholar] [CrossRef] [Green Version]
  14. Lenaerts, J.T.M.; Broeke, M.R.V.D. Modeling drifting snow in Antarctica with a regional climate model: 2. Results. J. Geophys. Res. Space Phys. 2012, 117, D05108. [Google Scholar] [CrossRef] [Green Version]
  15. Ekaykin, A.A.; Hondoh, T.; Lipenkov, V.Y.; Miyamoto, A. Post-depositional changes in snow isotope content: Preliminary results of laboratory experiments. Clim. Past Discuss. 2009, 5, 2239–2267. [Google Scholar] [CrossRef]
  16. Ritter, F.; Steen-Larsen, H.C.; Werner, M.; Masson-Delmotte, V.; Orsi, A.; Behrens, M.; Birnbaum, G.; Freitag, J.; Risi, C.; Kipfstuhl, S. Isotopic exchange on the diurnal scale between near-surface snow and lower atmospheric water vapor at Kohnen station, East Antarctica. Cryosphere 2016, 10, 1647–1663. [Google Scholar] [CrossRef] [Green Version]
  17. Johnsen, S.J.; Clausen, H.B.; Cuffey, K.M.; Hoffmann, G.; Schwander, J.; Creyts, T. Diffusion of stable isotopes in polar firn and ice: The isotope effect in firn diffusion. In Physics of Ice Core Records; Hokkaido University Press: Kita-ku, Japan, 2000; pp. 121–140. [Google Scholar]
  18. Town, M.S.; Warren, S.G.; Walden, V.P.; Waddington, E.D. Effect of atmospheric water vapor on modification of stable isotopes in near-surface snow on ice sheets. J. Geophys. Res. Space Phys. 2008, 113, 24303. [Google Scholar] [CrossRef] [Green Version]
  19. Laepple, T.; Münch, T.; Casado, M.; Hörhold, M.; Landais, A.; Kipfstuhl, S. On the similarity and apparent cycles of isotopic variations in East Antarctic snow pits. Cryosphere 2018, 12, 169–187. [Google Scholar] [CrossRef] [Green Version]
  20. Holme, C.; Gkinis, V.; Vinther, B. Molecular diffusion of stable water isotopes in polar firn as a proxy for past temperatures. Geochim. et Cosmochim. Acta 2018, 225, 128–145. [Google Scholar] [CrossRef]
  21. Xiao, C.; Li, Y.; Hou, S.; Allison, I.; Bian, L.; Ren, J. Preliminary evidence indicating Dome A (Antarctica) satisfying preconditions for drilling the oldest ice core. Chin. Sci. Bull. 2008, 53, 102–106. [Google Scholar] [CrossRef]
  22. Zhao, L.; Moore, J.C.; Sun, B.; Tang, X.; Guo, X. Where is the 1-million-year-old ice at Dome A? Cryosphere 2018, 12, 1651–1663. [Google Scholar] [CrossRef] [Green Version]
  23. Ding, M.; Xiao, C.; Jin, B.; Ren, J.; Qin, D.; Sun, W. Distribution of δ 18O in surface snow along a transect from Zhongshan Station to Dome A, East Antarctica. Chin. Sci. Bull. 2010, 55, 2709–2714. [Google Scholar] [CrossRef]
  24. Xiao, C.; Ding, M.; Delmotte, V.M.; Zhang, R.; Jin, B.; Ren, J.; Li, C.; Werner, M.; Wang, Y.; Cui, X.; et al. Stable isotopes in surface snow along a traverse route from Zhongshan station to Dome A, East Antarctica. Clim. Dyn. 2012, 41, 2427–2438. [Google Scholar] [CrossRef]
  25. Pang, H.; Hou, S.; Landais, A.; Masson-Delmotte, V.; Prie, F.; Steen-Larsen, H.C.; Risi, C.; Li, Y.; Jouzel, J.; Wang, Y.; et al. Spatial distribution of 17O-excess in surface snow along a traverse from Zhongshan station to Dome A, East Antarctica. Earth Planet. Sci. Lett. 2015, 414, 126–133. [Google Scholar] [CrossRef]
  26. Pang, H.; Hou, S.; Landais, A.; Masson-Delmotte, V.; Jouzel, J.; Steen-Larsen, H.C.; Risi, C.; Zhang, W.; Wu, S.-Y.; Li, Y.; et al. Influence of Summer Sublimation on δD, δ18O, and δ17O in Precipitation, East Antarctica, and Implications for Climate Reconstruction From Ice Cores. J. Geophys. Res. Atmos. 2019, 124, 7339. [Google Scholar] [CrossRef] [Green Version]
  27. Ma, T.; Li, L.; Li, Y.; An, C.; Yu, J.; Ma, H.; Jiang, S.; Shi, G. Stable isotopic composition in snowpack along the traverse from a coastal location to Dome A (East Antarctica): Results from observations and numerical modeling. Polar Sci. 2020, 100510. (In press) [Google Scholar] [CrossRef]
  28. Yan, M.; Li, Y.; Hammer, C.; Gundestrup, N.S.; Tan, D.; Wen, J.; Wang, D.; Sun, B.; Kang, J.; Liu, L. Oxygen isotope composition of surface snow collected along the traverse route from Zhongshan Station toward Dome A, Antarctica. Chin. J. Polar Res. 2002, 16, 133–139. [Google Scholar]
  29. Kang, J.; Jouzel, J.; Stievenard, M.; Qin, D.; Liu, L.; Wang, D.; Li, J. Variation of stable isotopes in surface snow along a traverse from coast to plateau’s interior in East Antarctica and its climatic significance. Sci. Cold Arid Reg. 2009, 1, 14–24. [Google Scholar]
  30. Shi, G.; Chai, J.; Zhu, Z.; Hu, Z.; Chen, Z.; Yu, J.; Ma, T.; Ma, H.; An, C.; Jiang, S.; et al. Isotope Fractionation of Nitrate During Volatilization in Snow: A Field Investigation in Antarctica. Geophys. Res. Lett. 2019, 46, 3287–3297. [Google Scholar] [CrossRef]
  31. Ma, Y.; Bian, L.; Xiao, C.; Allison, I.; Zhou, X. Near surface climate of the traverse route from Zhongshan Station to Dome A, East Antarctica. Antarct. Sci. 2010, 22, 443–459. [Google Scholar] [CrossRef]
  32. Hou, S.; Li, Y.; Xiao, C.; Ren, J. Recent accumulation rate at Dome A, Antarctica. Chin. Sci. Bull. 2007, 52, 428–431. [Google Scholar] [CrossRef]
  33. Ding, M.; Xiao, C.; Yang, Y.; Wang, Y.; Li, C.; Yuan, N.; Shi, G.; Sun, M.; Ming, J. Re-assessment of recent (2008–2013) surface mass balance over Dome Argus, Antarctica. Polar Res. 2016, 35, 26133. [Google Scholar] [CrossRef] [Green Version]
  34. Van Der Wel, G.; Fischer, H.; Oerter, H.; Meyer, H.; Meijer, H.A.J. Estimation and calibration of the water isotope differential diffusion length in ice core records. Cryosphere 2015, 9, 1601–1616. [Google Scholar] [CrossRef] [Green Version]
  35. Dittmann, A.; Schlosser, E.; Delmotte, V.M.; Powers, J.G.; Manning, K.W.; Werner, M.; Fujita, K. Precipitation regime and stable isotopes at Dome Fuji, East Antarctica. Atmos. Chem. Phys. Discuss. 2016, 16, 6883–6900. [Google Scholar] [CrossRef] [Green Version]
  36. Landais, A.; Ekaykin, A.; Barkan, E.; Winkler, R.; Luz, B. Seasonal variations of 17 O-excess and d-excess in snow precipitation at Vostok station, East Antarctica. J. Glaciol. 2012, 58, 725–733. [Google Scholar] [CrossRef] [Green Version]
  37. Fujita, K.; Abe, O. Stable isotopes in daily precipitation at Dome Fuji, East Antarctica. Geophys. Res. Lett. 2006, 33, L18503. [Google Scholar] [CrossRef] [Green Version]
  38. Gustafson, J.R.; Brooks, P.D.; Molotch, N.P.; Veatch, W. Estimating snow sublimation using natural chemical and isotopic tracers across a gradient of solar radiation. Water Resour. Res. 2010, 46, 12511. [Google Scholar] [CrossRef]
  39. Delmas, R.J.; Kirchner, S.; Palais, J.M.; Petit, J.R. 1000 years of explosive volcanism recorded at the South Pole. Tellus 1992, 44, 335–350. [Google Scholar] [CrossRef]
  40. Cole-Dai, J.; Mosley-Thompson, E.; Wight, S.P.; Thompson, L.G. A 4100-year record of explosive volcanism from an East Antarctica ice core. J. Geophys. Res. Space Phys. 2000, 105, 24431–24441. [Google Scholar] [CrossRef]
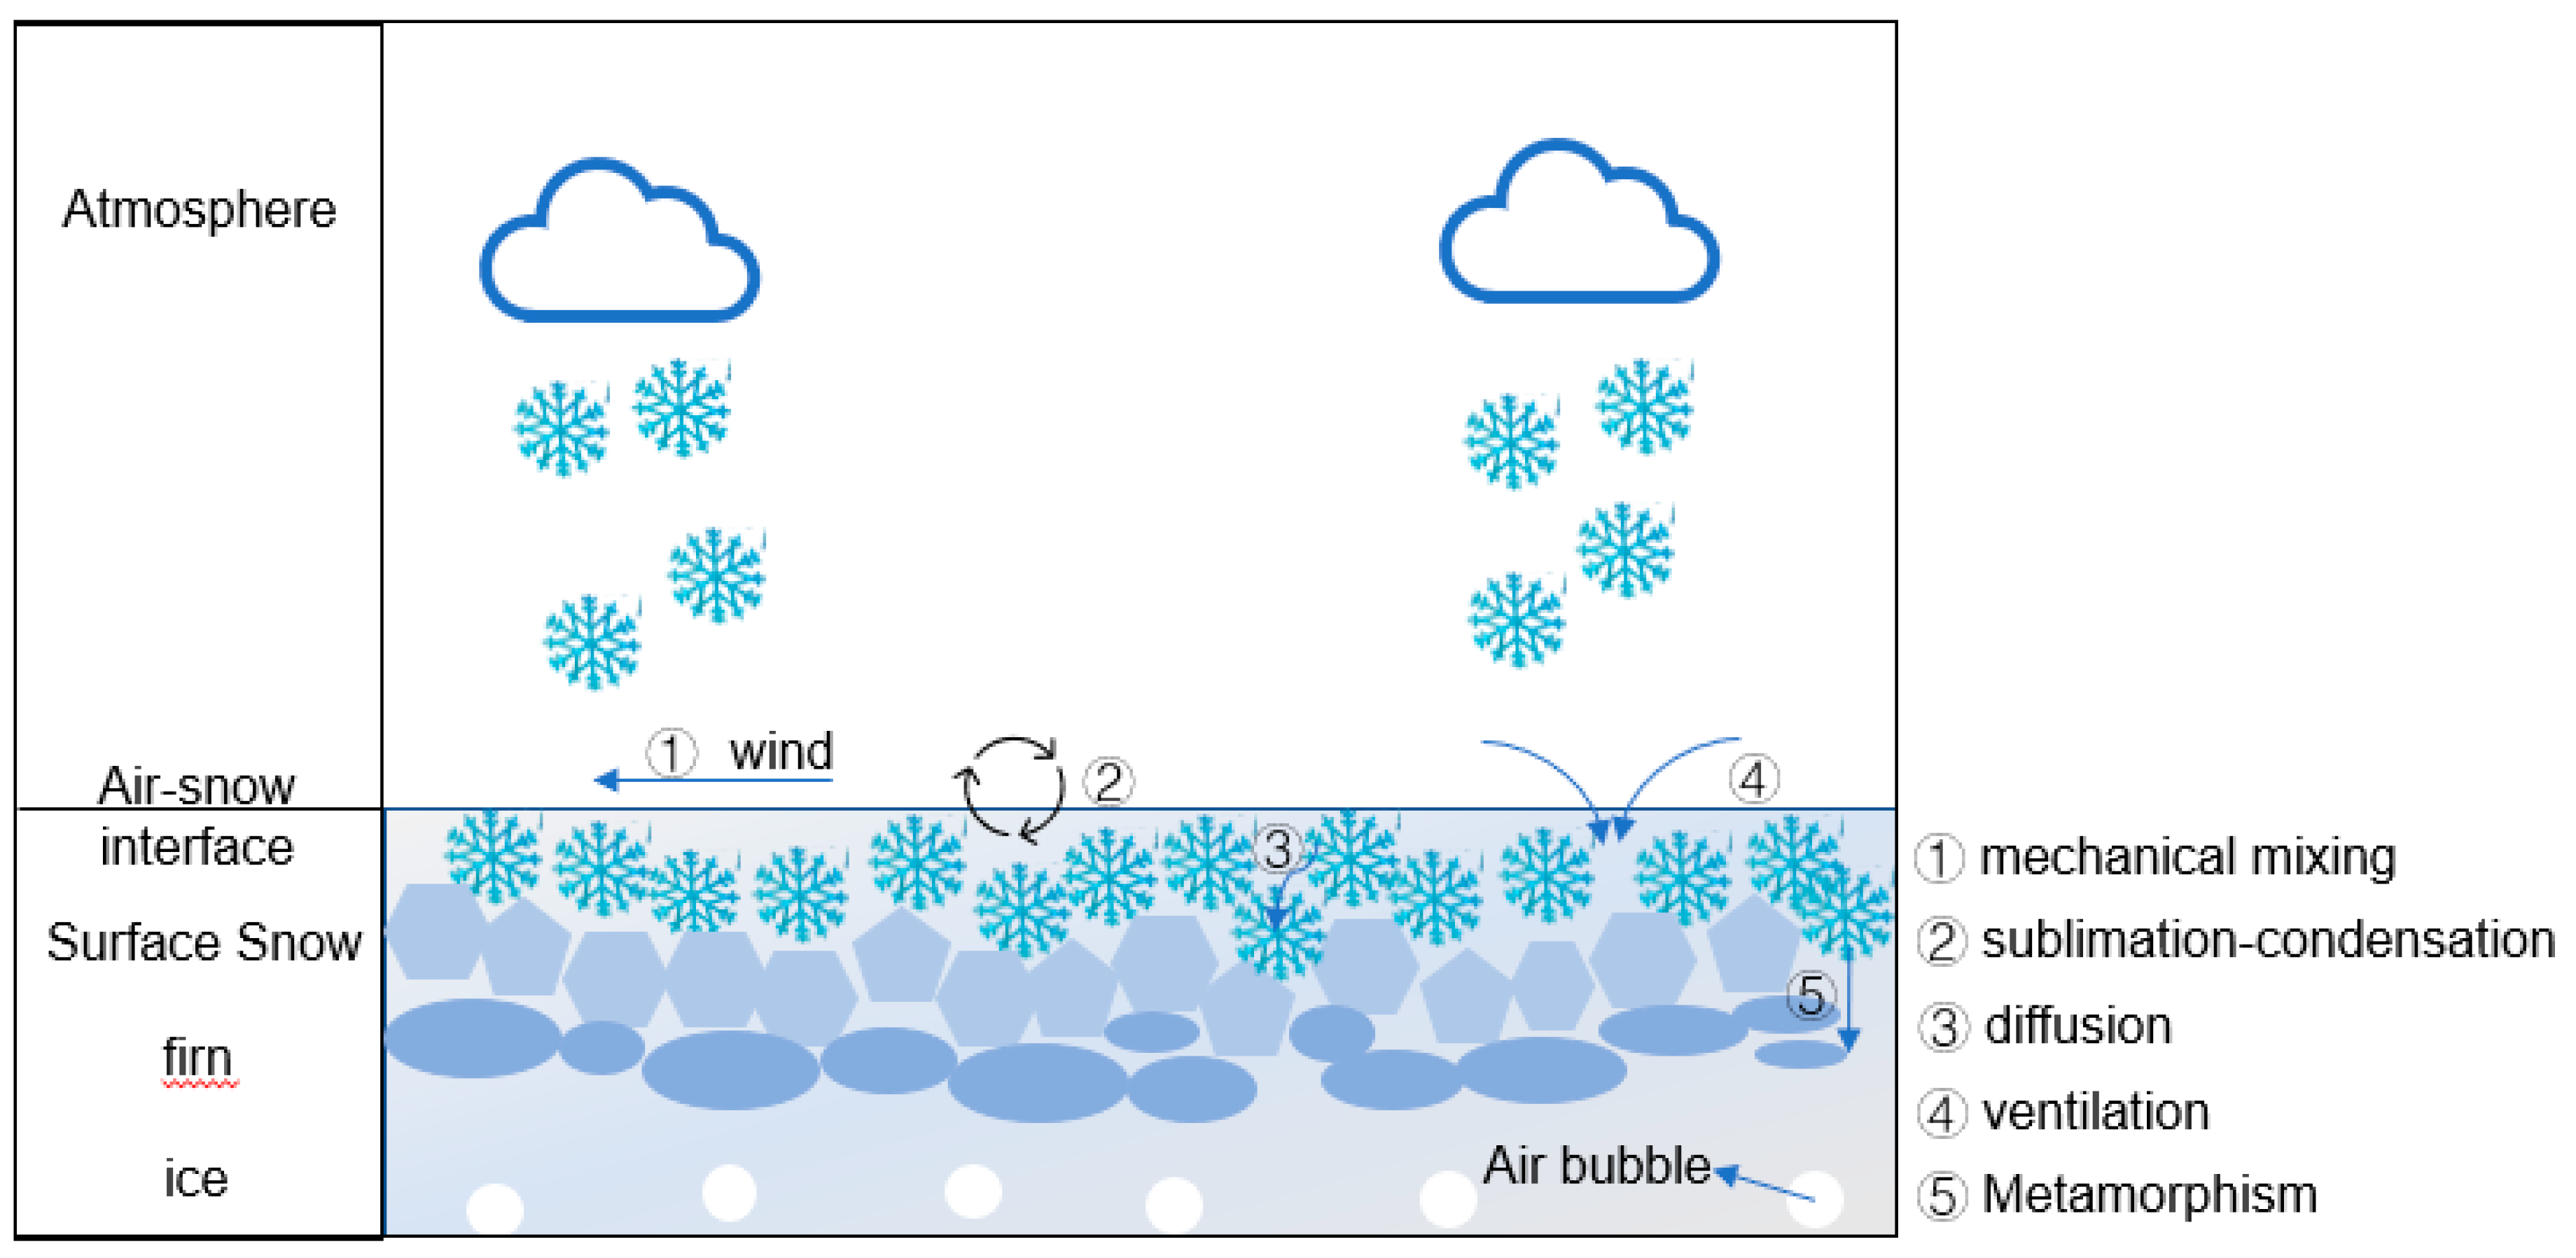
Figure 1. Schematic of different post-depositional processes during snowfall–ice transition.
Water 12 01707 g001
Figure 2. Map showing (a) interior sites in Antarctica (grey line is the contour of 3200 m a.s.l), and (b) sampling sites of surface snow, precipitation and snow pits at neighboring KL, Dome A.
Water 12 01707 g002
Figure 3. Variation in 2 m air temperature at Dome A: (a) Monthly mean temperature and (b) Inter-annual mean temperature from ERA-20c reanalysis dataset.
Water 12 01707 g003
Figure 4. The (a) δ18O/T relationship and (b) local meteoric water line for summer precipitation and surface snow at Dome A.
Water 12 01707 g004
Figure 5. (a) δ18O profile in snow pit at Dome A. The variations are shown as anomaly δ18O, which represents an offset with respect to the mean value of the whole dataset, (b) the cycle length from peak to peak (grey dot), the dashed black line is the averaged value of all cycle lengths and the black line is the best fitted curve, and (c) the relationship between stable isotopic composition of snow and temperature (grey dot).
Water 12 01707 g005
Figure 6. The (a) δ18O, (b) δD, and (c) mass changes in remaining surface snow during the 16-day simulated experiment at −35 °C.
Water 12 01707 g006
Figure 7. Power Spectra Density of the δ18O variations in the Dome A snow pit. The dark blue line and light blue area show the power spectral density (PSD) of diffused white noise plus measurement noise and confidence bound of the 95% critical significance level, respectively. The grey and blue dashed lines verticality correspond to the frequency of the apparent cycle found in the snow pit and the theoretical cycle of the annual layer, respectively.
Water 12 01707 g007
Figure 8. The comparison between observations and the best-fitted scenario among each simulated case: (a) amplitude and (b) PSD.
Water 12 01707 g008
Table 1. The δ18O-T slope obtained from surface snow and summer precipitation at interior sites, East Antarctica.
Locationsδ18O-T Slope (‰·°C−1)Reference
Summer PrecipitationLocal Surface Snow
Dome Anot significantly different from zeronot significantly different from zeroThis study; [26]
Dome C0.890.22–0.49[4,13]
Vostok0.590.35 (blowing snow)[5,36]
Dome F0.770.76 (including precipitation)[11,37]
Antarctica/0.80[4]
Table 2. Representativity of simulated δ18O firn profile in a best-case scenario expressed as the correlation coefficient (R), Root Mean Square Error (RMSE) and Nash–Sutcliffe efficiency coefficient (NSE). The closer the R and the NSE was to 1 with a low value of RMSE, the better the simulation from the minimal forward model was.
The Fraction of NoiseRRMSE (‰)NSE
0.050.392.170.05
0.50.442.010.26
0.90.481.950.47