1. Introduction
Floods are a major growing natural hazard that causes the loss of human lives and properties. The proportion of flood occurrence was the highest of all types of natural disasters from 1995 to 2015 [
1]. The frequency of flooding has increased during the last two decades (1995 to 2015) [
2]. During the same period, floods caused 157,000 fatalities globally (accounting for 26% of all weather-related disasters). In addition, it affected the quality of life of 2.3 billion people, which is the highest share (56%) among weather-related disasters [
1]. In terms of economic losses, based on UNISDR (2016), between 2006 and 2016, the average annual costs associated with flooding were about 50 billion USD. This ranks first among all natural disasters. These damages include all types of regions (i.e., land uses) including urban areas [
3].
There exist several key drivers of urban flood risk such as urbanization, urban sprawl, increasingly unresponsive engineering, global climate change, and fluvial and pluvial changes [
4]. Urbanization causes changes to terrains, slopes, soil type, and vegetative cover, which result in a change of the hydrologic behavior of urbanized areas [
5]. Among these changes, the expansion of impervious surfaces dramatically increases the volume of surface runoff [
6,
7,
8,
9]. The expansion of impervious surfaces can occur in two contexts: (1) within a constant area (by an increase of the imperviousness densification within a fixed area); and (2) by increasing the area of the city (expansion of impervious area). However, in our research, we only considered the first context. On the other hand, due to a higher population density and valuable properties in urban areas, the influence of floods on these environments is intensive and excessively costly. Thus, urban areas are more vulnerable to the effect of floods, and, by the growth of the urban population, therefore, vulnerability and exposure are also significantly higher [
2]. Climate change and the increase of rainfall intensity have also increased flood risk associated with the frequency of the occurrence of the flood [
2], and this trend is expected to continue in many regions.
To cope with this, the traditional and most common approach is using a stormwater collection network (SCN). The objective of SCN is to collect and rapidly convey surface runoff to a predetermined outfall (e.g., receiving water bodies such as rivers, lakes, or ponds) [
10]. However, several issues are associated with SCN. SCN is designed for a specific rainfall event; thus, there is an evident limitation of the capacity to manage extreme flood events which are likely due to climate change. This issue is exacerbated by the fact that existing SCNs are aging and performing at a lower capacity. Besides, SCN collects polluted runoff from urban surfaces, which causes environmental damages and financial losses. These losses are either due to contamination of receiving waters or treating the collected runoff at stormwater treatment plants. Even though using SCN is a well-known and well-documented method [
11,
12], it has several issues, which necessitate a different approach to managing runoff in urban areas.
The smart and sustainable urban growth approach commonly known as Low Impact Development (LID) is an innovative solution to complement SCN, which is increasingly being adopted in cities around the world [
13,
14,
15,
16,
17]. LID can be incorporated with existing SCN to increase the capacity of the SCN and, thus, improve their performance. LID allows for reducing the risk of floods by reducing urban runoff [
14,
17,
18,
19,
20,
21,
22]. This is achieved by reducing imperviousness, conserving natural resources and ecosystems, maintaining natural drainage courses, reducing the use of pipes, and minimizing clearing and grading during the development process. Structural techniques such as bioretention cells, rain gardens, green roofs, and permeable pavements are also used to increase infiltration, thereby decreasing the amount of runoff and delaying the time to peak [
15,
23,
24].
Demand for LID in different locations varies based on different factors such as land cover type, topography, etc. [
25,
26,
27]. From a hydrological-hydraulic point of view, this demand is associated with the extent of the runoff generated in each site. That is, the higher is the generated runoff, the higher is the demand for capturing the runoff at the source (the site) [
18,
25]. The change in rainfall intensity and depth (caused by climate change) and land cover type (caused by urbanization) are the two main factors that affect the extent of this demand. In a specific site, if the rainfall or the land cover changes, the demand for LID will change accordingly [
25]. This is due to the change in the volume of runoff generated at that site, which is a function of both climate and land cover.
At the city-scale additional complexity is introduced due to numerous LID sites, constant urban change (and growth), global climate change, and the non-uniform spatial distribution of land cover and rainfall [
2,
28,
29,
30,
31,
32]. Thus, it is extremely important to be able to quantify this complexity to attain insight into how changes in climate and urban land cover influence the demand for LID. Such information is useful for urban planning, designing multifunctional urban infrastructure, policymaking regarding urban growth, and the optimal assignment of financial resources for runoff and flood risk management. Therefore, the objective of our study was to investigate the effect of climate change and urbanization on the demand for LID.
The results of such an investigation will provide us with an insight into the effect of climate and urbanization on the demand for LID. This article holistically covers the scenarios under which either only one change takes place (i.e., climate or urbanization) or both (i.e., climate and urbanization), and discusses the causes and effects of the future demand for LID for three selected Canadian cities. It also discusses the contribution of climate change and urbanization factors on the change of hydrological and hydraulic processes. The manuscript is organized as follows.
Section 2 presents the methods including the study area, the geospatial data, and the development of climate change and urban growth scenarios.
Section 3 and
Section 4 include the results and discussion, respectively, followed with the conclusion in
Section 5.
3. Results
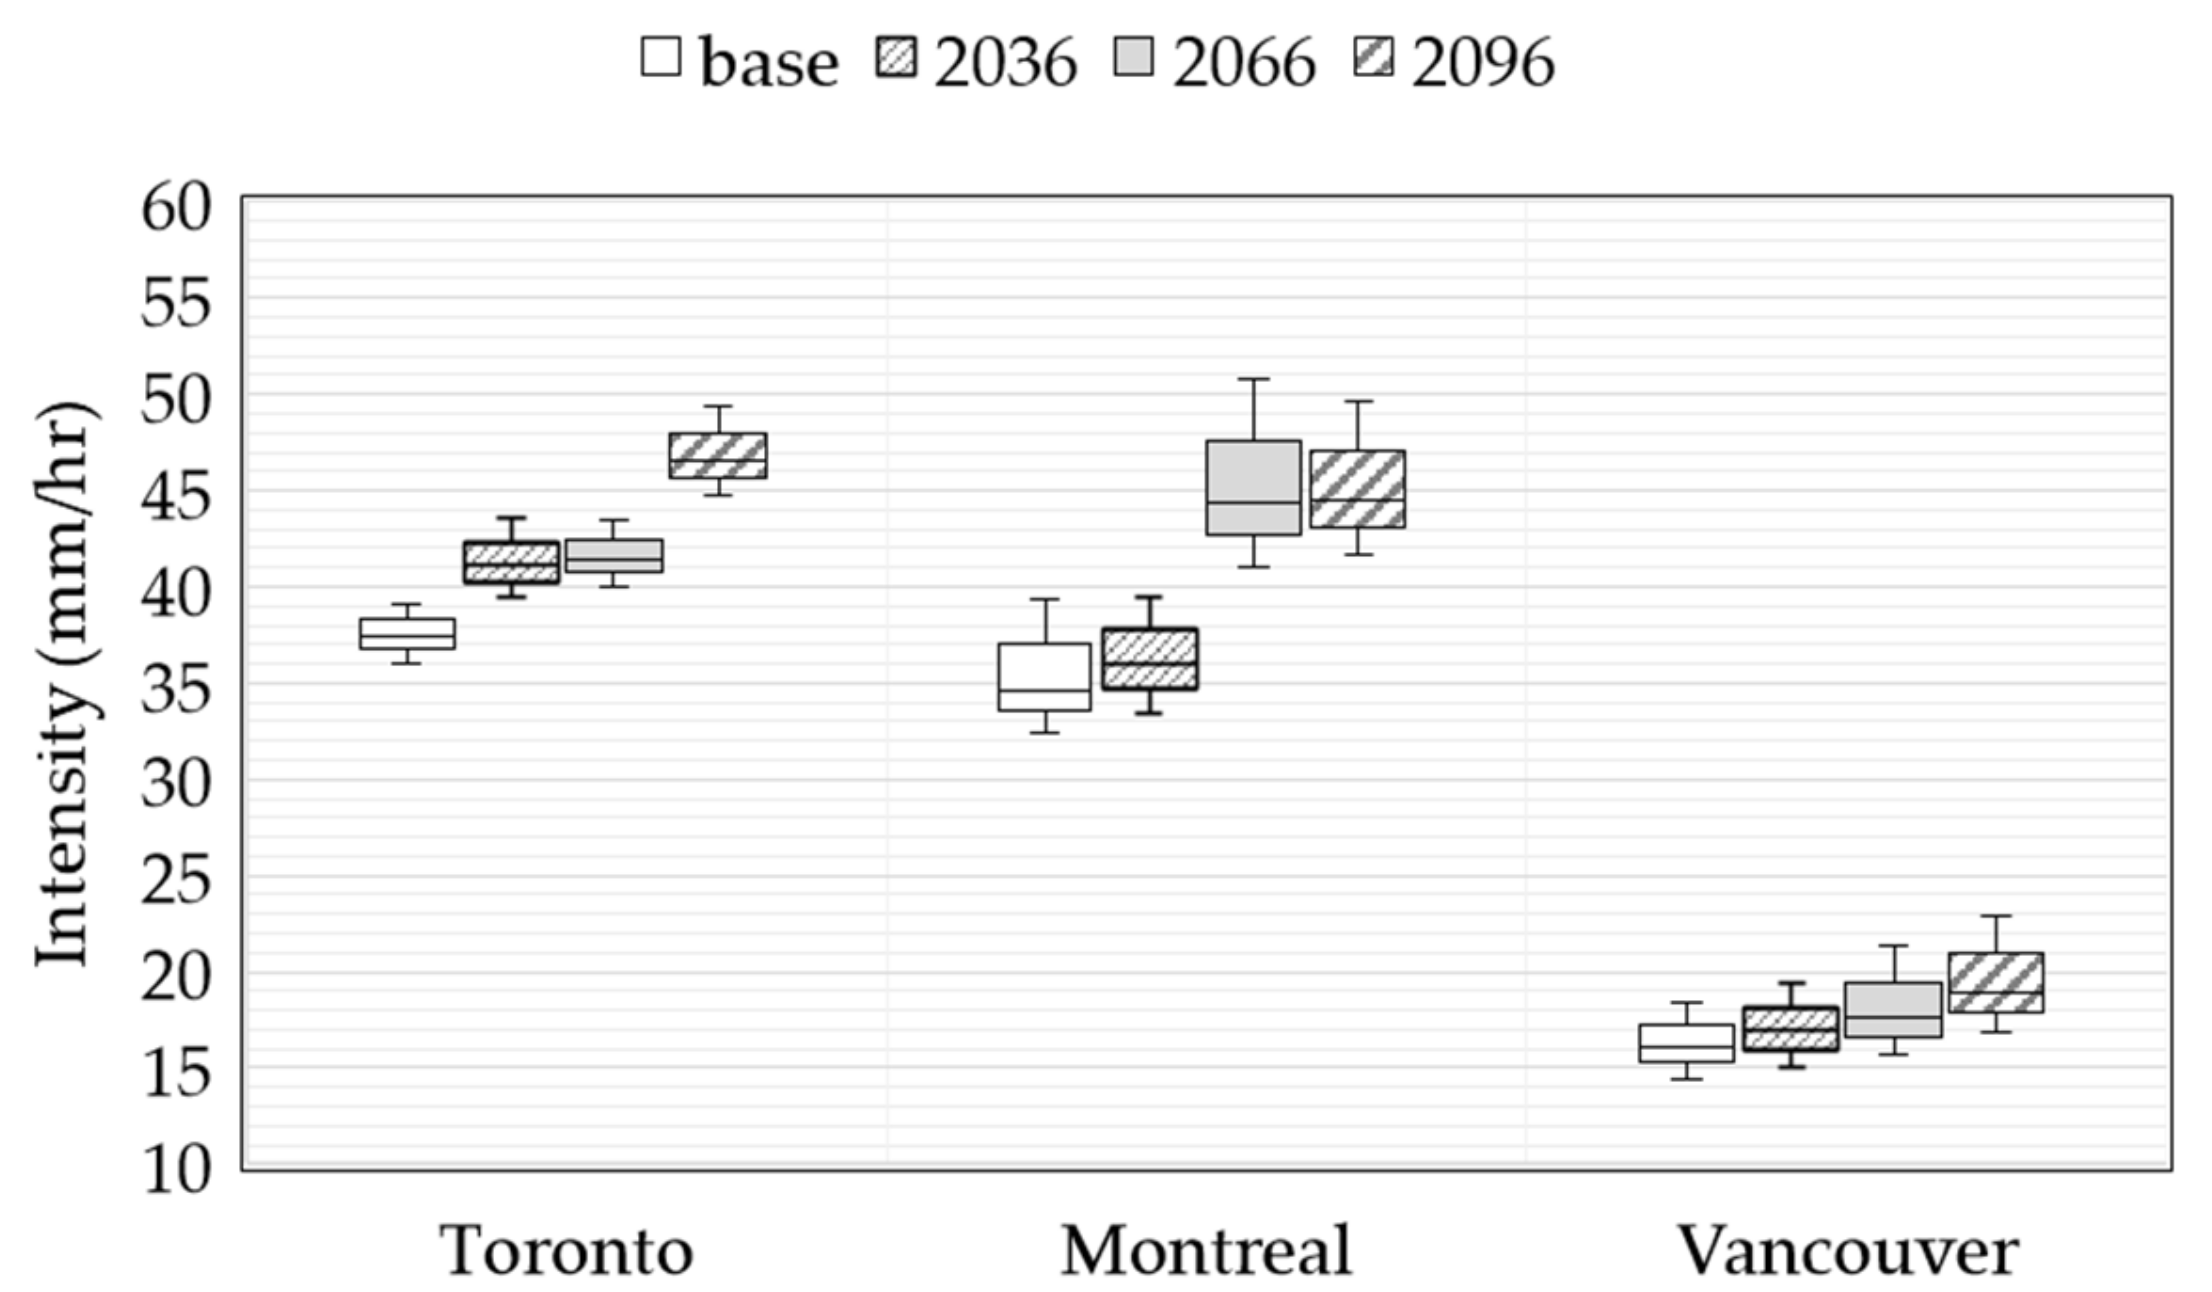
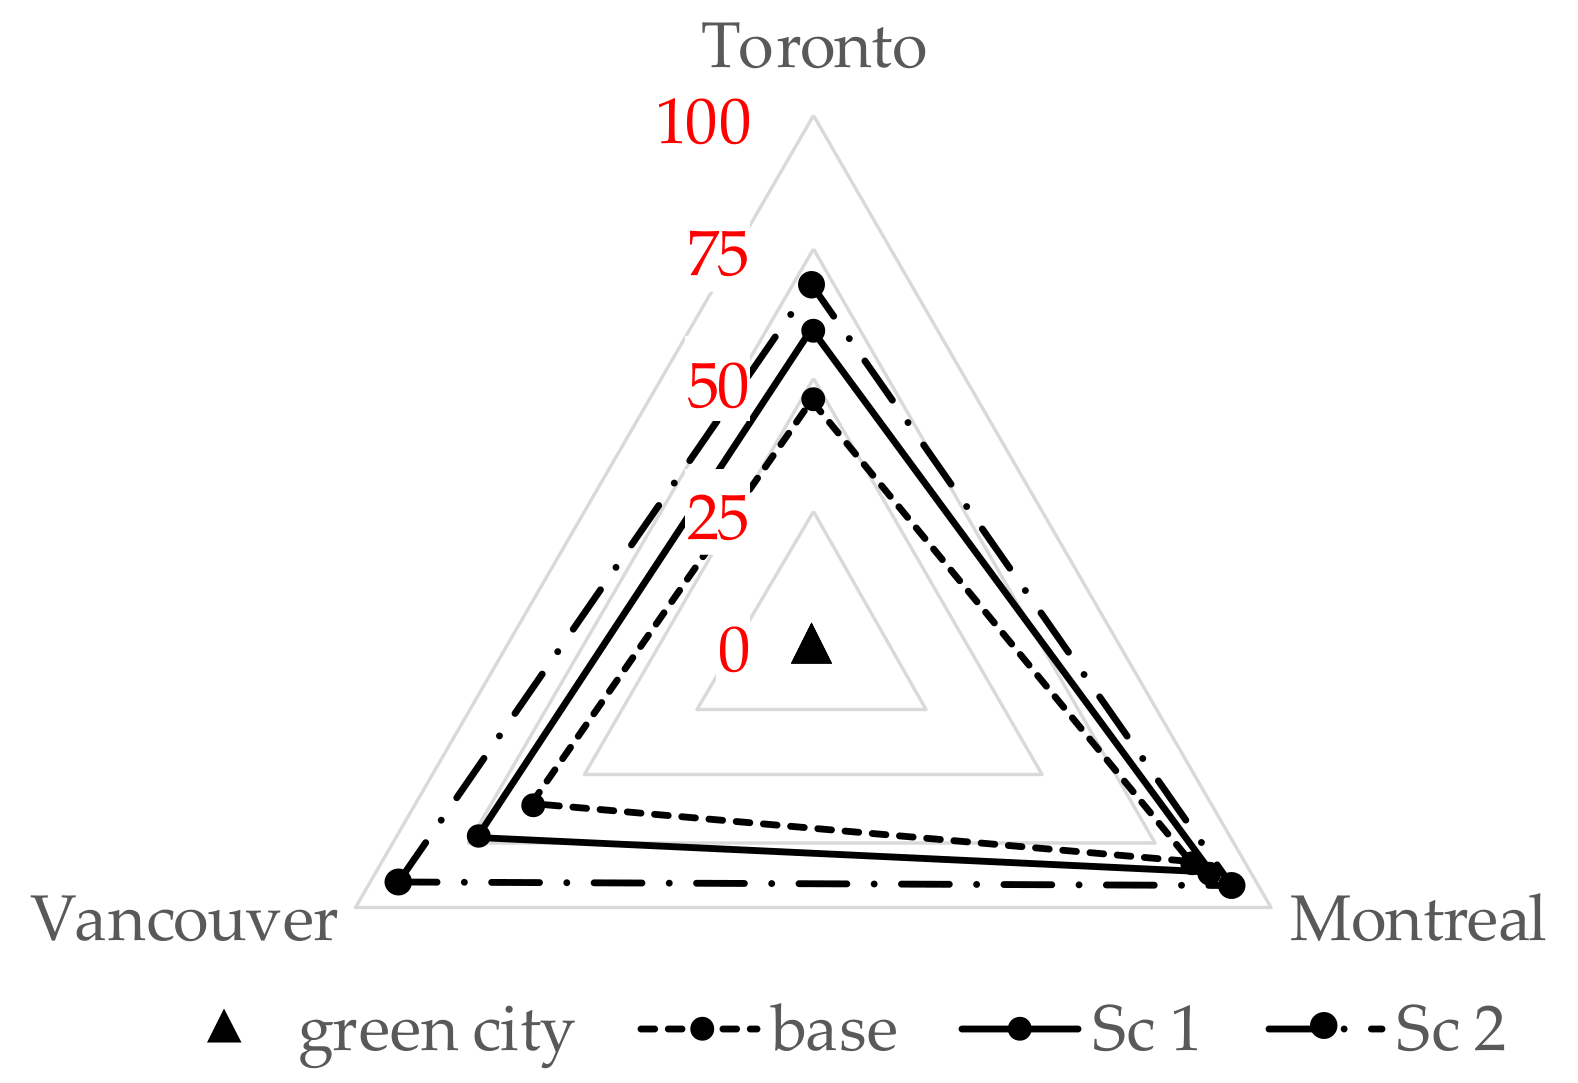
A brief comparison of climate condition and urbanization under different scenarios is presented in
Figure 2 and
Figure 3. The mean rainfall intensity of the cities shows that the rainfall intensity of Toronto is slightly higher than that of Montreal and more than double the rainfall intensity of Vancouver. However, Vancouver has a maximum average annual rainfall of 1569 mm, about 90% higher than Toronto and 50% higher than Montreal. Overall, the trend of projected mean rainfall intensity presents an increase in the intensity of rainfall in the future for each city for each future period. However, there is an exception for Toronto in Scenario 2066, where the intensity is shown to remain almost constant compared to the previous scenario (2036). This is similar to Montreal for Scenario 2096 compared to the previous scenario (2066). Note that the variability of rainfall intensity is higher in Montreal compared to the other two cities.
Figure 3 presents an overall comparison of all urbanization scenarios for the three cities. If zero impervious surface is defined as the “green city”,
Figure 3 shows that Toronto (for the base scenario) is the closest to the “green city” and Montreal is the most urbanized city (closest to 100% impervious cover). As expected, the two projected scenarios (Sc1 and Sc2 representing medium and high urbanization) move each city further away from the “green city”.
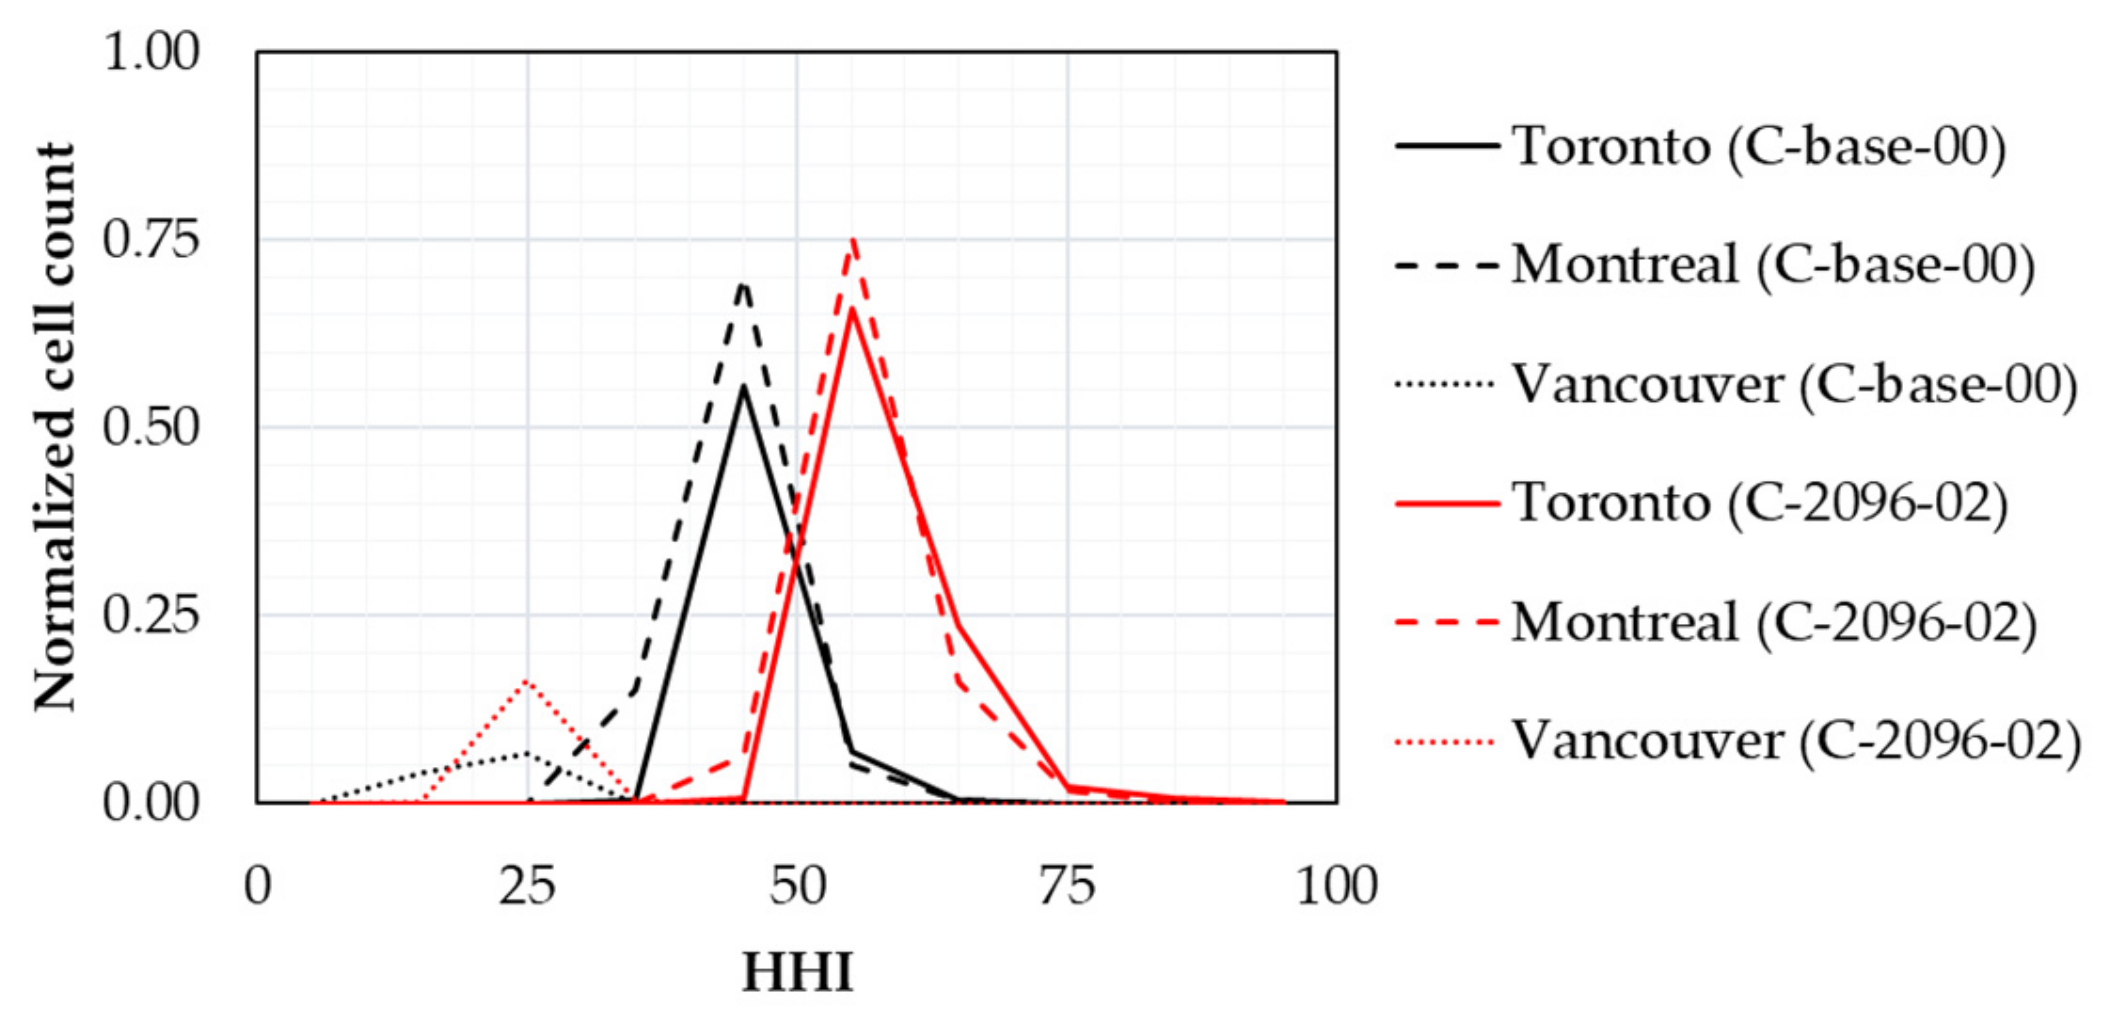
For the HHI, first, a general comparison of the three cities is presented in
Figure 4 which shows the current state (C-base-00, i.e., the base climate and the base urbanization scenarios) as well as the worst-case scenario (C-2096-02, i.e., Scenario 2096 climate and high urbanization, Scenario 2). Note that, as identified above, the C-base-00 comparison has some limitations: the base land cover for these cities is not for the same year, while the rainfall intensity is based on available historical data (which differs for each city).
This comparison was made based on the mean and frequency of HHI in each city.
Figure 4 shows the normalized histogram of HHI for each city for the two scenarios listed above; a low HHI value represents a lower demand for LID, and a higher value represents a higher demand. Generally, there a higher demand for LID in Montreal, with a slight difference compared to Toronto, and Vancouver has the lowest demand for LID. The mean HHI values for the C-base-00 and C-2096-02 scenarios range from 46.2 to 58.2 (a 26% increase) for Toronto, from 44.0 to 56.4 (a 28.2% increase) for Montreal, and from 21.3 to 25.1 (a 17.8% increase) for Vancouver.
Toronto and Montreal present a similar pattern in response to climate change and urbanization. For example, in both cities, a significant proportion of the C-2096-02 histograms is higher than an HHI value of 50, which shows a higher demand for LID compared with the C-base-00 scenarios. In addition, there is a general change towards a higher frequency of HHI for the C-2096-02 from the C-base-00 scenario. In Vancouver, if an HHI value of 25 is used for comparison, the histogram does not show that the proportion of the C-2096-02 histogram for values greater than 25 has changed. Both the initial and final HHI values for Vancouver are much lower than both Toronto and Vancouver. The C-2096-02 demand is higher, as expected, for Vancouver, but with lower variance than the C-base-00 scenario.
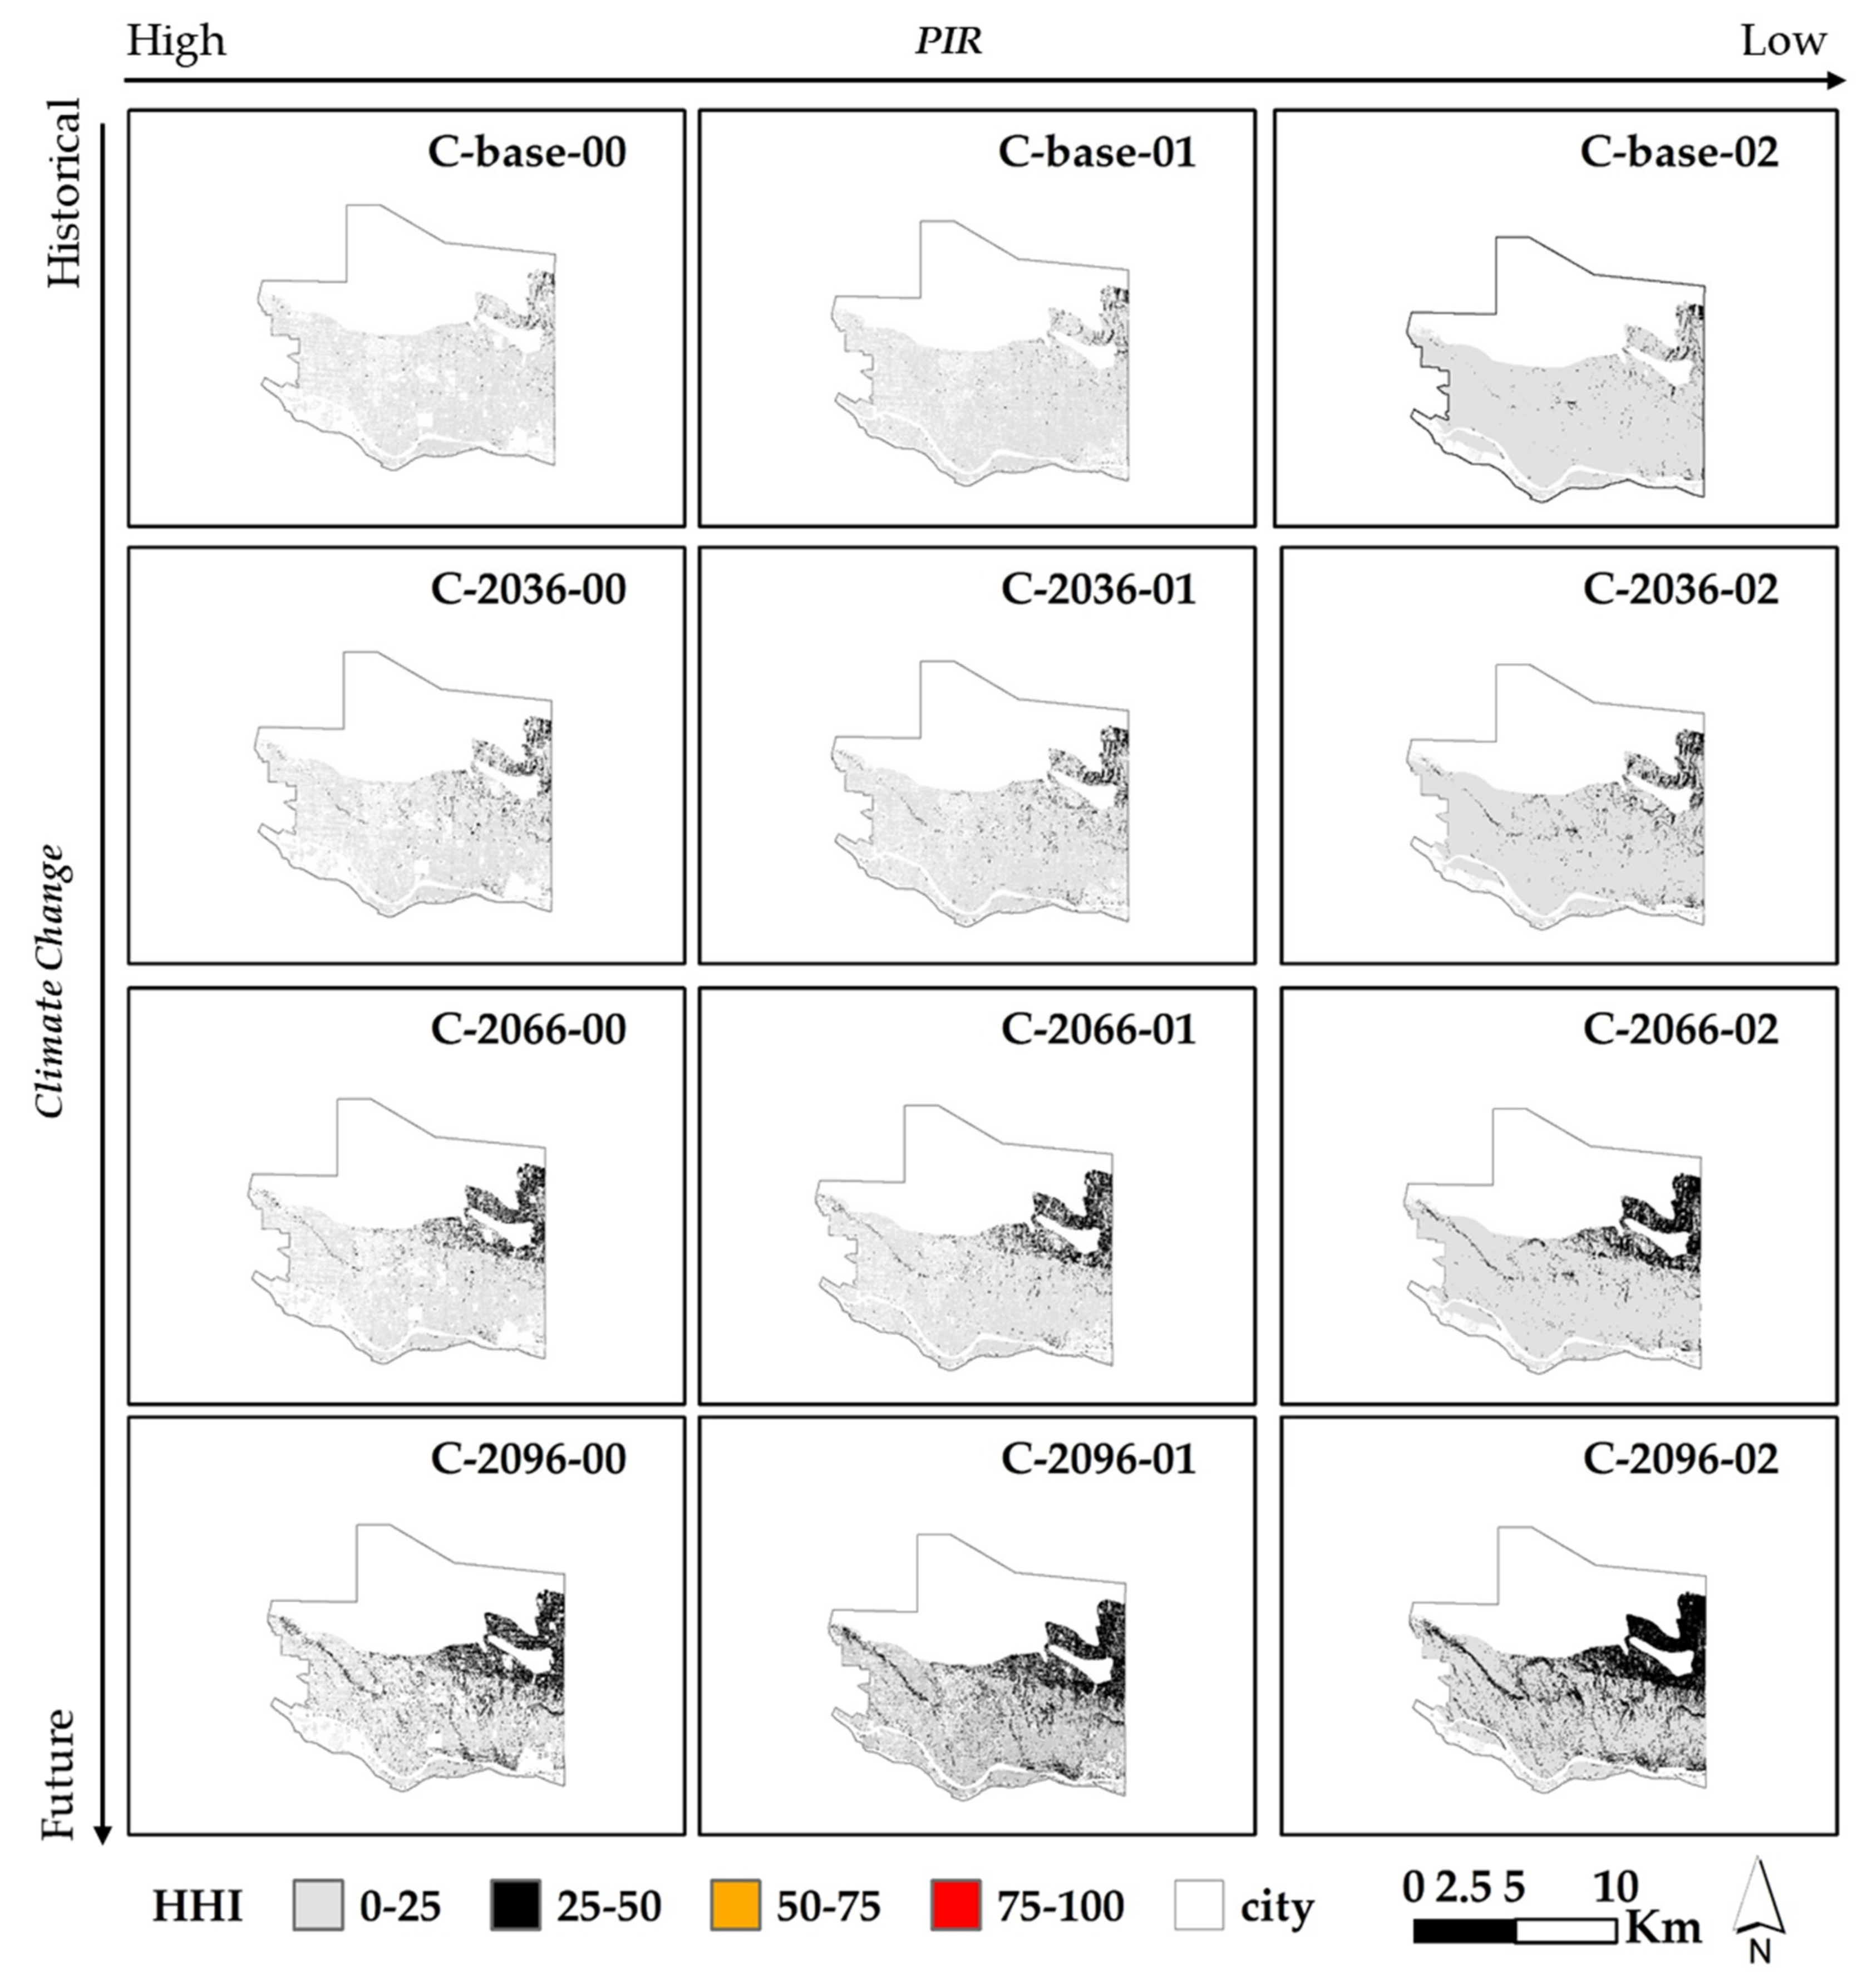
The HHI values for all three cities are visualized in maps presented in
Figure 5,
Figure 6 and
Figure 7. As expected, all scenario results indicate that climate change and urbanization increase the HHI and, thus, the runoff generation potential in each city, leading to a higher demand for LID for source control. Climate change also significantly impacts HHI more than urbanization in Toronto and Montreal. This can be due to two reasons: first, Montreal is already highly urbanized and, thus, the room for future change in land cover is limited; and, second, while Toronto has a high share of pervious land cover, most of the natural soil has low permeability (clayey silt till or silty clay to silt till [
63]), thus increasing the HHI further. Therefore, considering the current state of the land cover of these cities, urbanization has a lower effect than the change in the magnitude of rainfall intensity. Vancouver (results are shown in
Figure 7) responded to the integrated climate change and urbanization similarly to the other two cities (an increase of HHI), but with lower values of HHI overall. The difference between the sole effect of urbanization and climate change in this city was not as significant as the other two cities. This is because Vancouver has a lower rainfall intensity compared to the other two cities, so the HHI value is about half the values for Toronto and Montreal, which decreases the effect of climate change. Note that Vancouver is more pervious compared to the other two cities, thus it has more room for urbanization (
Figure 3).
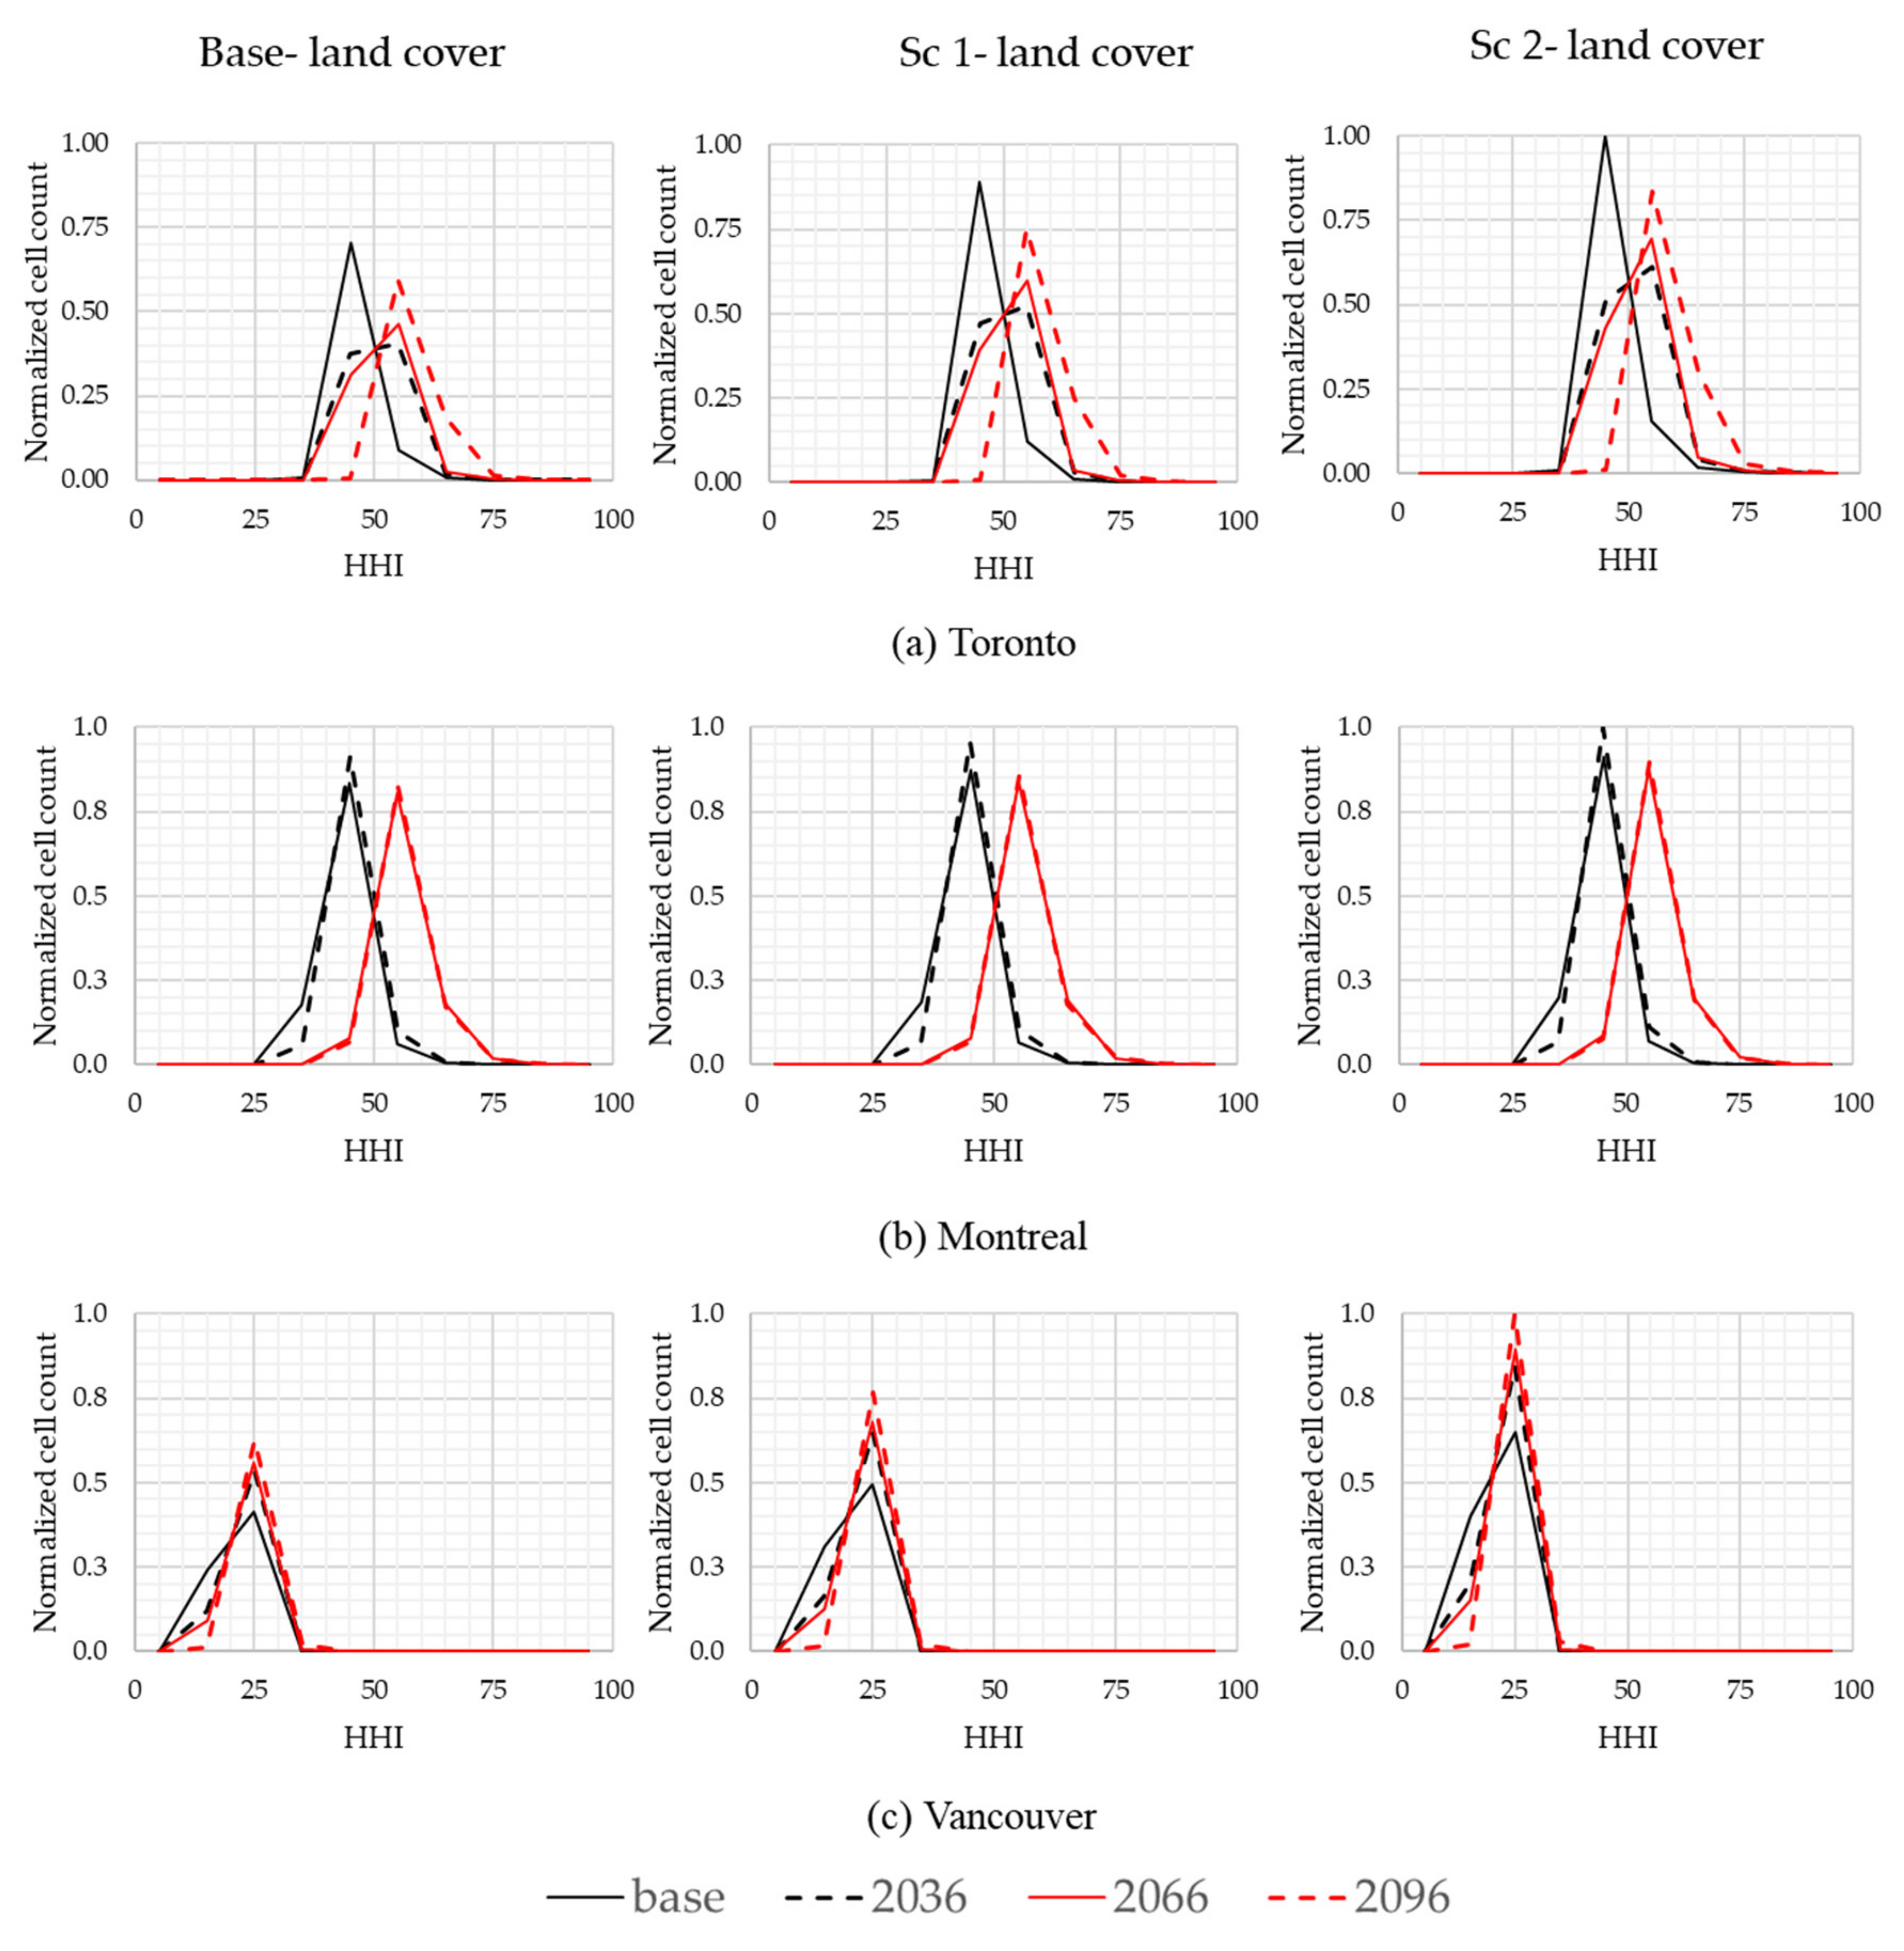
Figure 8 compares the histogram of HHI for each city, for each urbanization scenario, for the four climate periods. The results show that, with time (from the base time to 2096), the HHI values increase (i.e., have a higher mean), i.e. the histograms shift to the right, which indicates higher runoff generation potential and, thus, an increase in demand for LID for source control. This shift is the lowest for Vancouver compared with the other two cities. There is an exception in the observed trend in Toronto for the 2066 scenario for which the mean HHI change compared with the previous scenario (2036) is minor due to the similarity of the rainfall intensity of these scenarios. Likewise, in Montreal, Scenario 2096 has slightly followed the overall pattern because the rainfall intensity in this scenario has not increased compared with the previous scenario (2066). In addition, with urbanization, the number of cells (i.e., locations within the cities) generating runoff is increasing as well. This is because pervious areas have been converted to impervious areas—and thus, are generating runoff in areas that did not under the base urbanization scenario (resulting in higher peaks of the histograms).
Figure 9 shows a comparison of the climate change scenarios (i.e., rainfall intensity) for each city versus the different urbanization scenarios. This figure demonstrates that the change in climate has a relatively minor impact on the HHI frequency, as compared to the results shown in
Figure 8. An increase in urbanization results in an increase in the frequency of HHI as well as an increase in the number of cells generating runoff; this is more evident in Toronto and Vancouver than in Montreal. While the increasing rainfall intensity for each city results in higher HHI values for each urbanization scenario, the change is relatively smaller than the effect illustrated in
Figure 8.
A comparison of all scenarios was conducted to determine the influence of urbanization and climate change on the magnitude of the area of sites that have a high demand for LID (referred to as high demand sites, HDS). To do this, the area of sites that have a value of HHI greater than a threshold value was calculated. The threshold was set at an HHI value of 50 for Toronto and Montreal and an HHI value of 20 for Vancouver (these values are the approximate mean HHI value for the C-base-00 scenario for each city). The area of HDS (AHDS) sites, the count of cells with an area of 25 m
2, was calculated for all scenarios and compared to AHDS of the baseline C-base-00 scenario. This comparison is shown in
Figure 10.
Overall, in
Figure 10, all three cities show an increasing trend of AHDS under integrated climate change and urbanization as well as the sole effect of these scenarios. The overall pattern under the climate change only scenarios is similar to the corresponding rainfall patterns in
Figure 2. For Toronto, urbanization seems to have a slight effect on AHDS, e.g., starting from 1.4 million cells for C-base-00 and reaching 2.5 million cells for C-base-02. In contrast, an increase in rainfall intensity due to climate change has a significant influence on increasing AHDS, e.g., the AHDS is 11.5 million cells for C-2096-00 and rises to 16.9 million cells for C-2096-02. Montreal presents similar behavior as Toronto; the AHDS of this city also has a notable increase with time for different climate scenarios. However, Vancouver’s responses to climate change are similar to the impact of urbanization (from 1.2 million to 1.9 million cells in both cases) and are lower than in the other two cities. The reason is related to the low rainfall intensity of this city, which is a key difference between Vancouver and the other two cities.
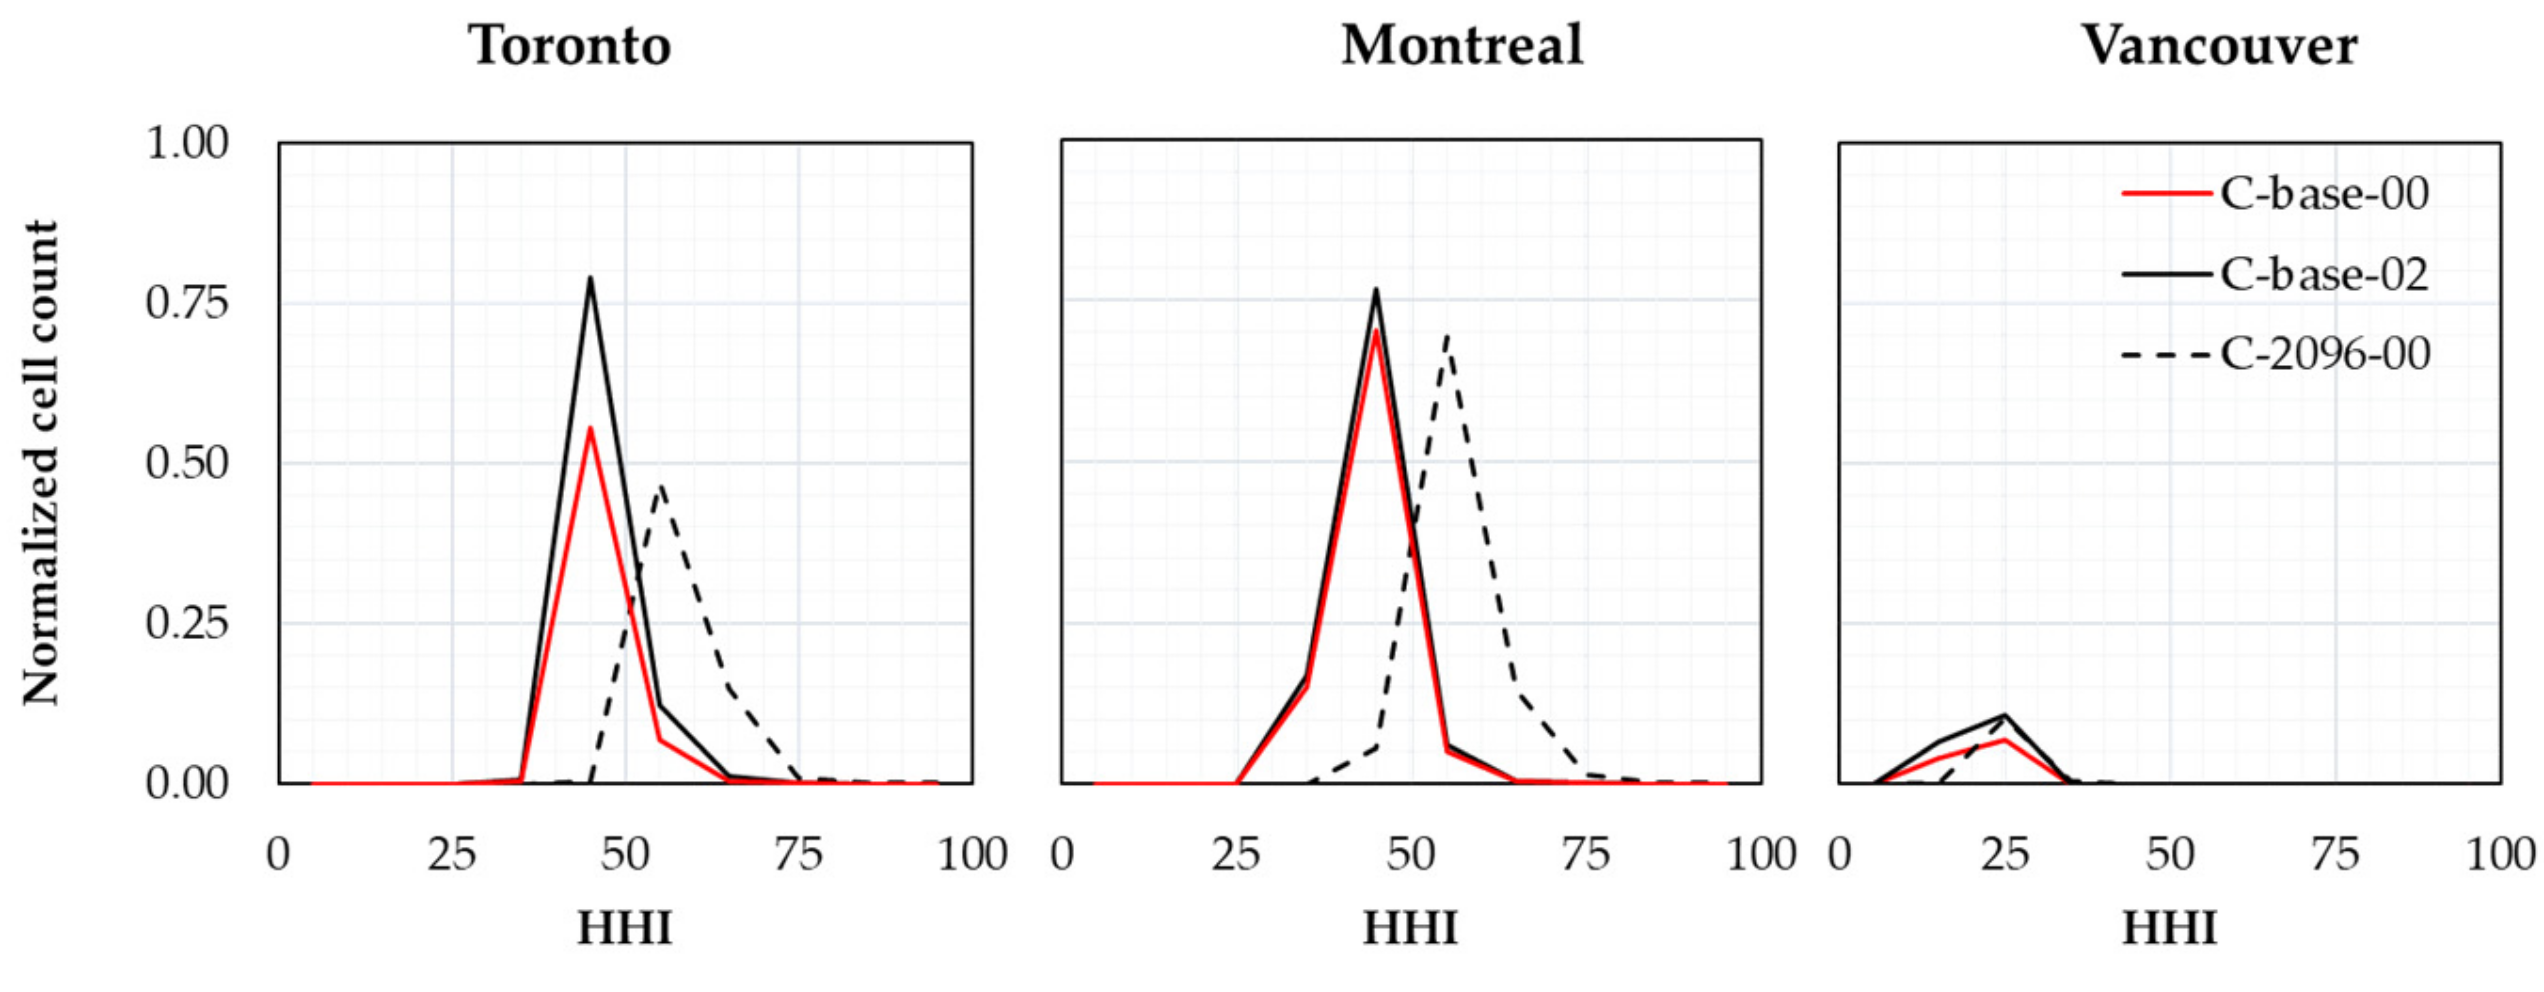
To further investigate the sole effect of urbanization and climate change on each city, the normalized histogram of the worst case climate change scenario (C-2096-00) versus the worst case urbanization scenario (C-base-02) was compared, as presented in
Figure 11. As concluded above, in response to the effects of climate change, Toronto and Montreal present an increase of HHI value with a shift of the histograms to the right, whereas this shift is lower in Vancouver. In terms of urbanization, it is evident that in all three cities the frequency of HHI has increased (i.e., higher peaks). As mentioned above, this increase is due to the increase in the number of cells that are generating runoff (non-zero runoff cells).
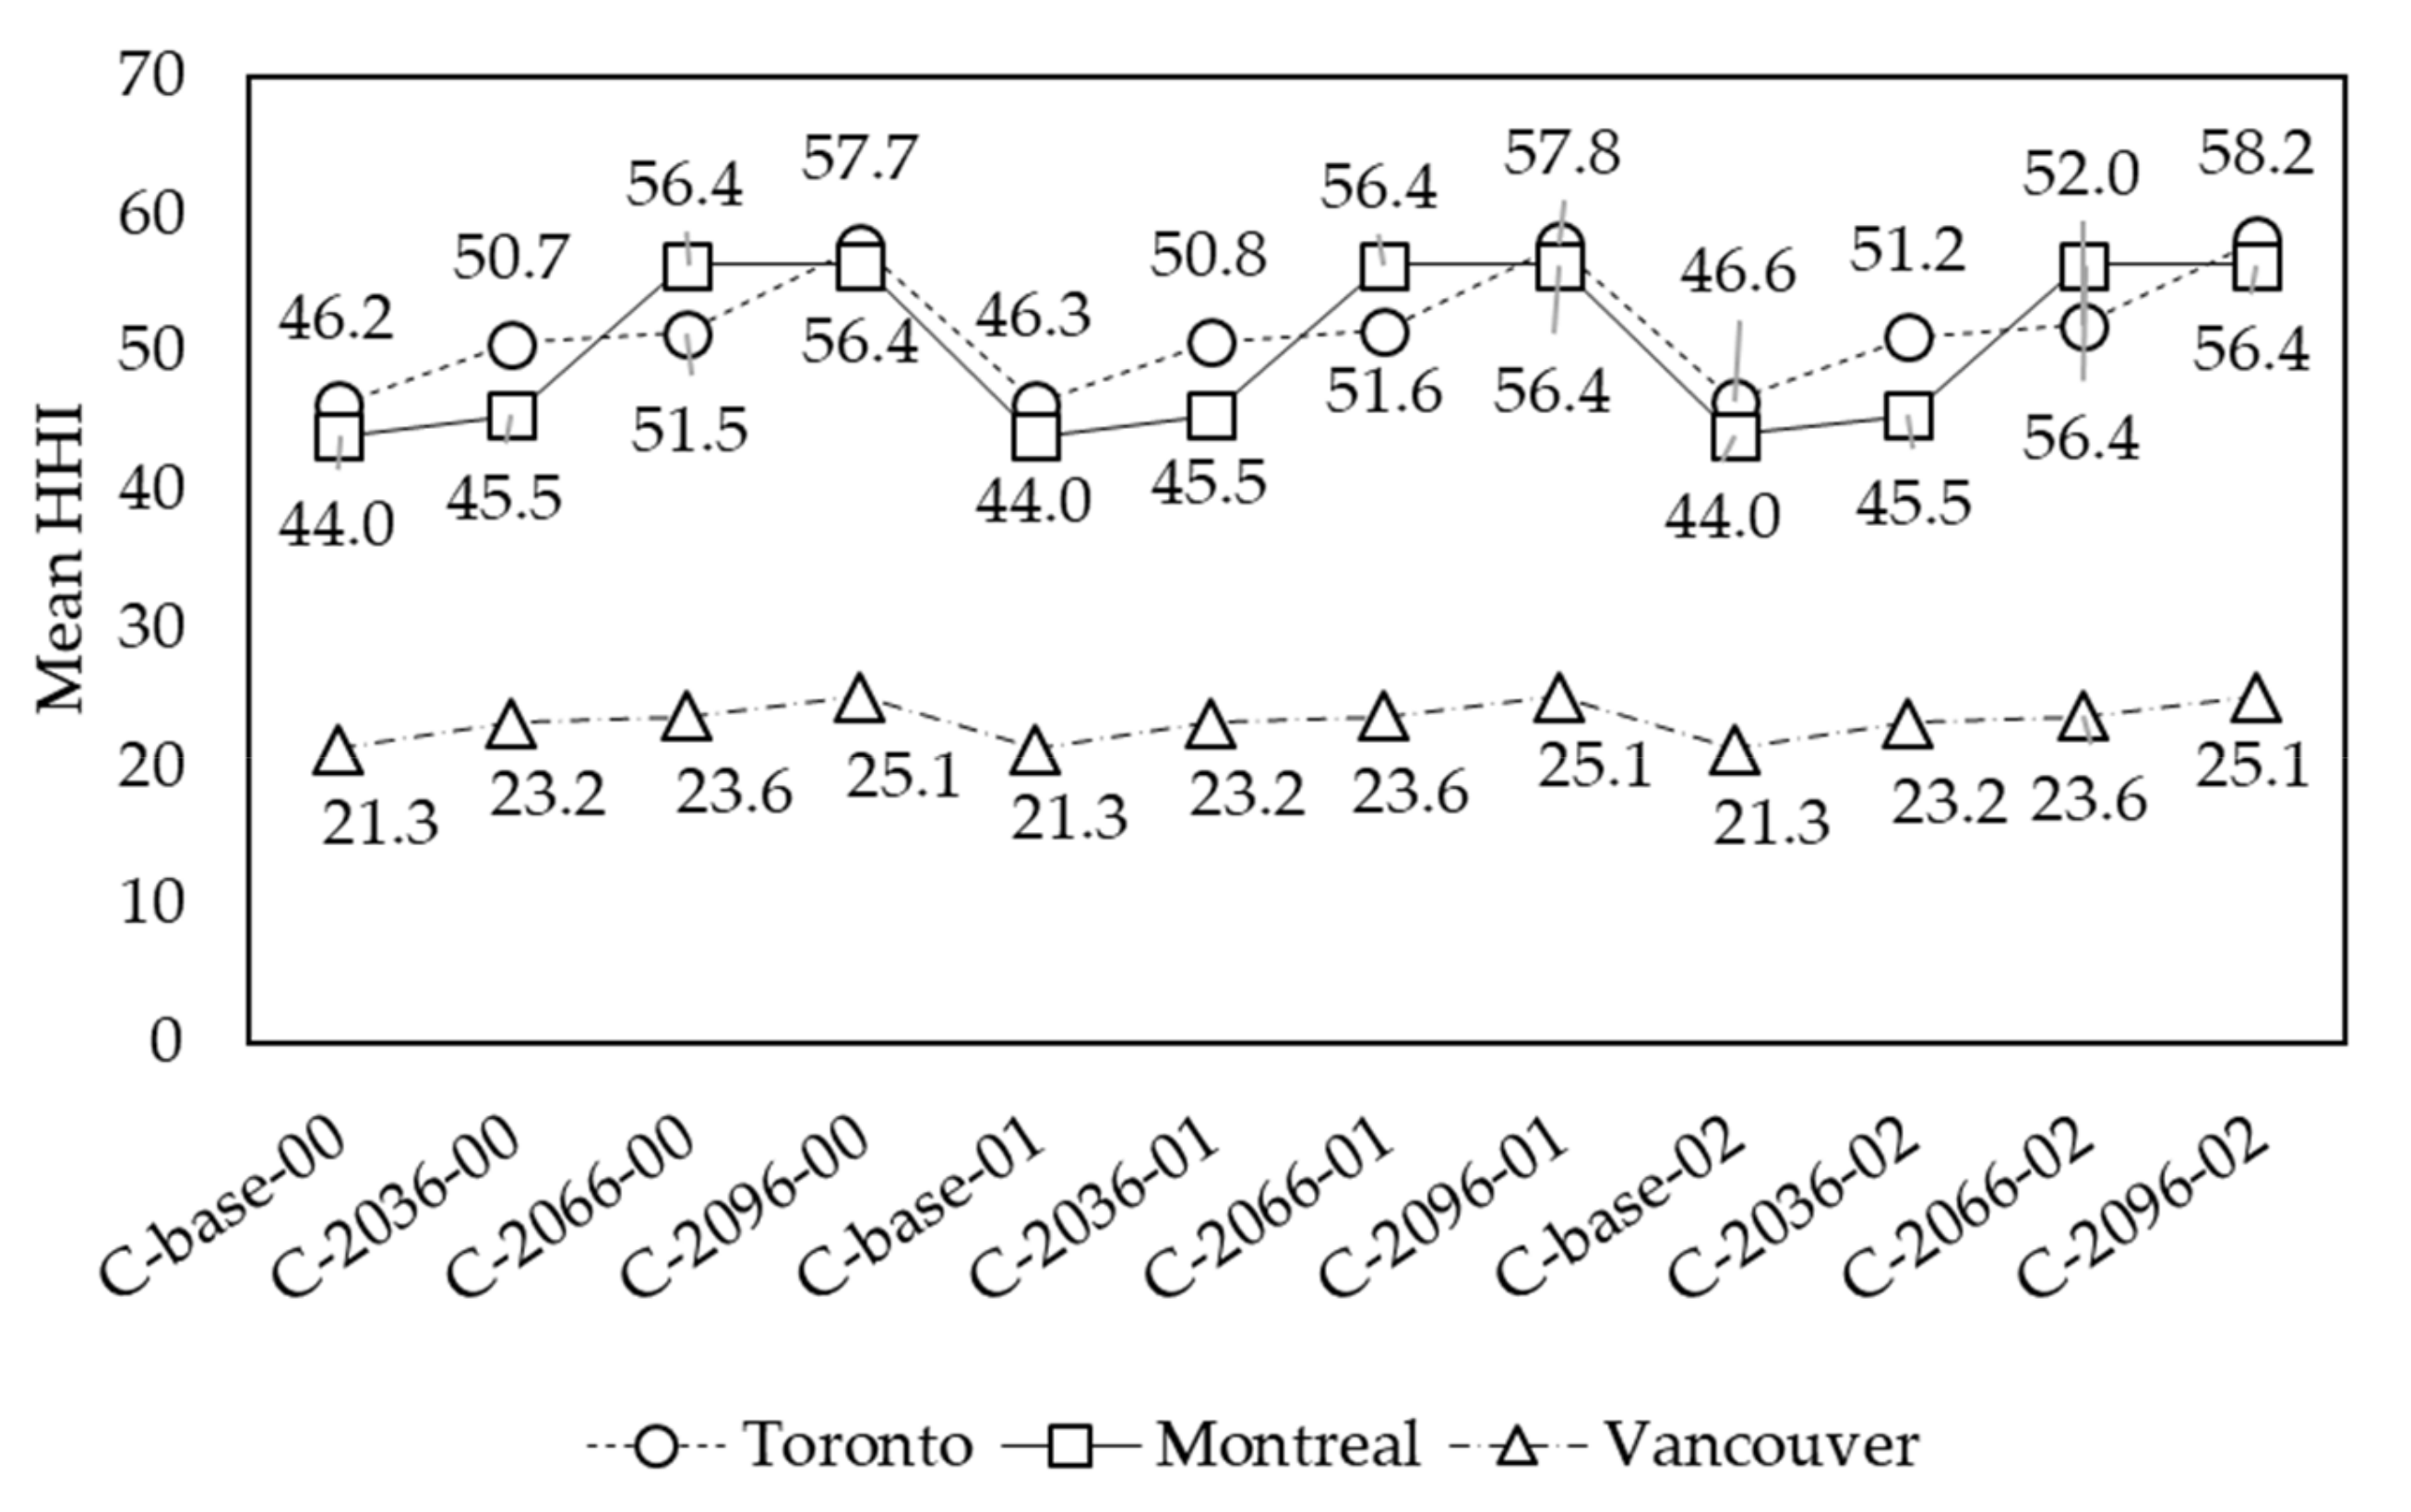
The trend of the mean HHI values for each city for all scenarios was also analyzed and is presented in
Figure 12. The base scenario (C-base-00) shows that Toronto has a high HHI with a mean of 46.2. The mean HHI increases to 57.7 (a 24.9% increase) due solely to climate change (C-2096-00) and slightly rises to 46.6 (a 0.9% increase) solely with urbanization (C-base-02). The integrated influence of climate change and urbanization raises HHI to 58.2 (C-2096-02) (a 26.0% increase). These results show that in Toronto the increase in mean HHI is due to climate change rather than urbanization. This is because the city has a high rainfall intensity and the natural soil has low permeability. The consequence of increasing the HHI is that the total area of sites that need LID is increasing (since more sites are generating runoff). In this respect, the AHDS of C-base-00 for this city is 1.4 million cells (0.2% of the city area) and reaches 11.5 million cells (8.4 times higher than the C-base-00) with the change of climate (C-2096-00). On the other hand, the AHDS growth is 78.6% by reaching 2.5 million cells with urbanization (C-base-02). The integrated effect of climate change and urbanization increases AHDS to 16.9 million, which is 12.3 times higher than AHDS of the current state.
Montreal has a mean HHI of 44.0 in the state of the base scenario. This value rises to 56.4 with only climate change (a 28.2% increase) and remains almost unchanged with only urbanization. The integrated effect of climate change and urbanization causes the increase of HHI value to the 56.4 (a 28.2% increase), which reveals the significant and dominant effect of climate change on HHI in Montreal. The highly urbanized land cover of Montreal leaves limited room for more urbanization; thus, the land cover of this city has a limited change in Scenarios 1 and 2. Thus, HHI in Montreal is more sensitive to climate change scenarios rather than urbanization. Regarding AHDS, in the base scenario, Montreal has AHDS of 1.0 million cells, which increases to 15.6 million cells with only climate change and 1.2 million cells with only urbanization. The AHDS for this city rises to 17.1 million cells in the integrated climate change and urbanization scenario.
The mean HHI value for Vancouver at the base scenario is 21.3, and this increases with climate change to 25.1 (a 17.8% increase) and remains unchanged with urbanization. The mean HHI rises to 25.1 (a 17.8%) for the integrated climate change and urbanization scenarios. The AHDS for this city at the current state is 1.2 million cells (0.9% of the city area), which increases to 1.9 million cells (1.6 times higher than the C-base-00) for only climate change scenarios and to 1.9 million cells (1.6 times higher than the C-base-00) for only urbanization scenario. The integrated climate change and urbanization scenario raises AHDS to 3.1 million cells, i.e., 2.5 times higher than the AHDS of the base scenario. The near-equal values of AHDS under the climate and urbanization scenarios indicate that the effect of both factors on HHI is similar. Although the mean HHI of urbanization scenarios remained the same, the increase of frequency of HHI has increased the overall AHDS.
4. Discussions
An overall comparison of the cities reveals the fact that the demand for LID (which is estimated using the HHI) in Toronto and Montreal is relatively similar and is about twice the demand for LID in Vancouver. This growth in demand is represented via AHDS: the AHDS increases from 2.5% to 16.8%, from the base scenario (C-base-00) to the worst-case scenario (C-2096-02), respectively, for all three cities, which indicates that all cities similarly respond to the integrated climate change and urbanization scenarios. The highest growth in AHDS is for Montreal (16.8 times higher than the C-base-00), followed by Toronto (12.3 times higher than the C-base-00), and last Vancouver (2.5 times higher than the C-base-00). The growth in LID demand is also shown in the increase of the mean HHI values, which increased by 26%, 28.2%, and 17.8% in Toronto, Montreal, and Vancouver, respectively. In addition, we showed that the demand for LID highly depends on the rainfall intensity rather than the overall mean annual rainfall. Vancouver, which has the highest mean annual precipitation among the selected cities, has the lowest demand for LID, which is due to its low rainfall intensity.
Generally, we showed that, if we retain the land cover as it is in these three cities, climate change will cause an increase in demand for LID since the runoff generation potential for each city will increase. With climate change only, urbanization only, and an integrated change of both, the three cities showed similar behavior: an increase in HHI, which indicates an increase in runoff generation potential, as has been reported in previous studies [
64,
65,
66,
67,
68,
69,
70].
However, the standalone effects of climate change and urbanization were different for these cities. Toronto and Montreal were more sensitive to climate change compared with urbanization, and Vancouver was sensitive to both factors. Thus, depending on the rainfall intensity and the extent of urbanization in the study area the dominance of these two factors varies. Which factor is likely to have a greater influence on runoff generation has been reported in previous studies. Some studies found that urbanization likely exerts a greater impact on runoff than climate change [
65,
71,
72,
73], whereas other studies confirmed that climate change impact dominates the urbanization in runoff change [
67,
69,
70]. Our finding is that the key factor is the rainfall intensity. Based on this, climate change dominates urbanization levels wherein the rainfall intensity is high (e.g., Toronto and Montreal) and adversely wherein the rainfall intensity is low (e.g., Vancouver). It is notable that, if the land cover of the study area is already impermeable (such as Toronto and Montreal), the dominance of climate change increases. In this context, the room for further urbanization is limited and climate change is the only factor that can alter the runoff.
In this study, we investigated the effect of poor urbanization by converting pervious land covers to impervious. By poor urbanization, we mean urban development by increasing impervious surfaces without either decreasing imperviousness in other locations or implementing LID. Therefore, for future research, we suggest the study of more city-scale cases such as areas with both high permeability and runoff intensity (which were not included in three case studies) to further investigate the dominance of urbanization and climate change.
In addition, in contrast to the poor urbanization scenarios, a study on smart urban growth [
13] is recommended. From the hydrological point of view, smart growth consists of measures such as preventing urban sprawl in future development (e.g., poor urban planning such as designing wide streets) [
13] as well as using integrated stormwater management strategies such as LID [
74]. Smart growth is related to the early stages of urban planning [
74] and strategies that need to be considered for future development. LID techniques, a component of smart growth, can be a solution for both pre- and post-development conditions, i.e., they can be retrofitted into highly urbanized areas or be designed in the initial planning stages of new developments. Cities similar to Montreal that are already highly urbanized have limited options for new developments wherein LID can be installed; however, LID can be retrofitted into existing areas. Retrofitting LID broadly across the city will help reduce the negative impacts of poor urbanization by increasing the overall permeability of the city. Cities such as Toronto, which are not as highly urbanized and have low permeability of the natural soil, have a high demand for LID. Thus, for this city, smart growth for future development as well as retrofitting existing areas with LID are both viable options. For Vancouver, which has a low demand for LID compared to the other two cities, the actual need for LID should be investigated in more detail using detailed design studies and hydrological modeling. However, similar to the other two cities, smart growth is suggested, since there is demand for LID and the impervious land cover in the city is dominant (61% of the city area).
Overall, the future urban growth (increase in the proportion of impervious surfaces) needs to be limited in order to reduce the runoff generation potential, and, hence, the risk of urban floods. Additionally, where possible, the current impervious land cover should be converted to natural, permeable surfaces. The increase in permeability (through the use of LID techniques) will help reduce runoff generation and offset the impacts of urbanization and climate change impacts.
5. Conclusions
In this study, we investigated the effect of climate change and urbanization on urban runoff generation potential using a geospatial framework for three Canadian cities (Toronto, Montreal, and Vancouver). The analysis was performed using a recently developed geospatial index (called HHI) using publicly available data. Four climate change scenarios (base, 2036, 2066, and 2096) and three urbanization scenarios (base land cover, Scenario 1, and Scenario 2) were developed. The HHI was estimated for the three cities for the 12 integrated climate change and urbanization scenarios.
In our study, we showed that climate change increases the mean HHI of the study area while urbanization raises the frequency of HHI. The extent of these changes varied based on the study area. Those with high rainfall intensity (Toronto and Montreal) showed a more significant increase in mean HHI compared with the study area with low rainfall intensity (Vancouver). In addition, the current impermeableness and room for further development within a city affected the extent of increasing the frequency of HHI.
The results agree with previous findings on the influence of climate change and urbanization on increasing the runoff and hence, the demand for LID. However, the magnitude of the effect of climate change and urbanization on the HHI varied in each city, which is also in agreement with results of previous studies. For example, in cities such as Toronto and Montreal with high rainfall intensity and low permeability, climate change is a dominant factor compared with urbanization. This is different from Vancouver that has low rainfall intensity climate change and urbanization level. In this city, HHI is sensitive to both factors. We also concluded that Toronto and Montreal have a higher demand for LID and this increases significantly with climate change and urbanization. Vancouver has a lower demand for LID and a lower rate of HHI change with the scenarios. The results of this study provide us with an insight into the contribution and the effect of climate and urbanization on the demand for LID.
These results, and the proposed methods, can be used in flood management, urban planning and for the sustainable development of cities. It is notable that, in addition to the rainfall and urbanization, HHI accounts for hydraulic conductivity, depth to the groundwater, and depth to the soil restrictive layer such as bedrock. In this study, we only investigated the effect of climate and urbanization on HHI and demand for LID, whereas modification of those parameters (hydraulic conductivity and depth to groundwater) in the future is possible and should also be studied.
