1. Introduction
Soil salinity is one of the basic limiting factors in food production especially in arid and semi-arid regions since most crops are sensitive to increased salt concentration in the soil solution [
1]. Soil salinization is particularly acute in arid and semi-arid areas with shallow groundwater as well irrigation water of poor quality.
Soil salinity assessment is based on measurement of the electrical conductivity of soil saturated paste extract (EC
e); this has been established as the standard method [
2,
3]. Saline soils are considered to be the soils where the saturated paste extract has EC
e values greater than 4 dS m
−1. However, this method is laborious and time consuming especially in the case of EC
e determination for a large number of soil samples. Additionally, the method appears to be more difficult and requires skills and expertise to obtain saturation point for clay soils.
For these reasons, many researchers have suggested easier methods to determine EC in various soils over water mass ratios extracts instead of determining EC
e. The most widely used soil over water mass ratios, (soil:water), are the 1:1 and the 1:5. The ratio of 1:5 is used for soil salinity assessment (EC
1:5) in Australia and China [
4,
5], while the ratio 1:1 (EC
1:1) is commonly used in the United States [
6]. Therefore, different methods for EC assessment are applied between different regions and organizations.
Many researchers have proposed linear relationships between EC
e and EC
1:1 or EC
1:5 [
7], (
Table 1). However, the coefficients of the linear relationships are different and vary according to the area of interest. These coefficients are affected, among other factors, by the soil texture [
8,
9,
10], the presence of gypsum and calcite in the soil [
3,
11], the chemical composition of the soil solution, the cation exchange capacity, etc. It has been documented that in the case of coarse-textured soils the slopes of the abovementioned linear relationships is greater than those of fine-textured soils [
8].
The equilibration time and the method of preparation and extraction for determining EC
1:1 or EC
1:5 are probably additional factors that have led to the observed differences among various models [
6,
12]. It is worth to know that the equations EC
e = f(EC
1:5) and EC
e = f(EC
1:1) presented in
Table 1 are often compared without taking into account these factors even though the equations have been obtained by different methods and at different ranges of EC
e values. More specific, Aboukila and Norton [
13] and Aboukila and Abdelaty [
14] have used the NRCS method [
15], Khorsandi and Yazdi [
11] have shaken the suspension for 1 h, Sonmez et al. [
10] have used the USDA method [
16], while Visconti et al. [
3] have applied mechanical shake for 24 h (
Table 1). As regards to the EC
e values range, Aboukila and Norton [
13] presented their equation for EC
e values up to 10.26 dS m
−1, while Zhang et al. [
17] and Khorsandi and Yazdi [
11] for EC
e values up to 108 and 170 dS m
−1, respectively (
Table 1). Noted that such extreme EC
e values are related to very specific cases (e.g., dumping of saline water as waste from the oil industry or saline areas for large scale halophyte production). Overall, to obtain the equations EC
e = f(EC
1:5) and EC
e = f(EC
1:1) both different methods have been applied to measure EC
1:5 and EC
1:1 and different ranges of EC
e values.
He et al. [
6] reported that the EC
1:5 was affected by both agitation method and agitation time. Specifically, significant differences existed within three agitation methods when EC
e values ranged between 0.96 and 21.2 dS m
−1. Equilibration times were significantly greater for soils having EC
e < 4 dS m
−1 compared to soils having EC
e > 4 dS m
−1. The agitation method of shaking plus centrifuging showed the greatest values of EC
1:5 while the stirring method showed the smallest ones for the same soil examined. Also, Vanderheynst et al. [
12], conducting an experiment with compost using various dilutions, found that as agitation time increased the EC values increased—especially when agitation time increased from 3 to 15 h. The above results showed the important role of agitation time among the different agitation methods on EC measurement, irrespective of the porous medium (e.g., soil, compost).
Among the various methods widely used—especially in the case of 1:5 ratio—there are the following three methods:
- (i)
Loveday [
18]: the suspension is mechanically shaken for 1 h and then kept at rest for 20 min.
- (ii)
NRCS [
15]: the suspension remains at rest in complete shade for 23 h and then shaken mechanically for 1 h.
- (iii)
USDA [
2]: the suspension is shaken by hand, 4 times, every 0.5 h for 30 s.
The difference between methods (i) and (ii) lies in the different rest times of the suspension, while methods (i) and (ii) differ from (iii) in both the shaking mode and the rest time.
Still now, no comparison has been made among the three abovementioned widely spread EC methods. Also, from international literature, it seems that there is no research work referred on the effect of different methods on the EC
1:1, although different methods have been used on the EC
1:1 measurement [
16,
17].
The objectives of present work are: (i) The comparison of EC values derived from the three most commonly used methods of 1:1 and 1:5 extracts; to investigate whether the differences between these methods are maintained across a range of soil ECe and (ii) the investigation of the relationship between ECe and EC values derived from the three methods.
3. Results and Discussion
3.1. Soil Properties
Samples from Laconia and Argolida are characterized as clay-clay loam soils and from Kos as sandy clay soils. All soil samples presented negligible gypsum content. As regards to CaCO3, samples from Laconia presented a content lower than 2.5%, from Argolida 5–8% and from Kos 8.5–11%. The pH values ranged from 7.69 to 8.06 for soil samples from Laconia and from 7.5 to 7.7 for soil samples from Argolida and Κos.
Additionally, the soil texture analyses of the two soil samples examined separately resulted as follows: (i) soil sample L—clay soil (23.5% sand, 16% silt, 60.5% clay) and (ii) soil sample A—clay loam/loam soil (39% sand, 32% silt, 29% clay). The CaCO3 content was 0.2% and 7.66% and pH values were 7.75 and 7 for sample L and A, respectively.
3.2. Estimation of Soil Salinity
The ECe values ranged from 0.611 to 25.9 dS m−1. It should also be noted that the ECe variation range of the soil samples from Laconia is much lower than that of the other two regions (Argolida and Kos). Specifically, ECe values of the samples from Laconia ranged from 0.611 to 1.664 dS m−1, while in the other two regions they ranged from 2.32 to 25.9 dS m−1. From the measured ECe values, it appears that a relatively wide range in salinity levels was obtained for both comparing the different EC1:5 and EC1:1 methods, as well as evaluating the relationship between the ECe and each of EC1:5 or EC1:1 methods.
As regards to SP all soil samples examined (with exception of the two separated samples) have values greater than 43%, percentage which indicates that the soils are classified in fine textured soils [
20]. More specifically, SP values ranged from 50.5% to 72.5% for soils from Laconia, 52–70% for soils from Argolida and 43–53% for soils from Kos.
3.3. Comparison of 1:1 and 1:5 Soil to Water Extract Electrical Conductivity Methods
In
Table 2 the slope of the linear relationship (y = ax) between 1:5 soil to water extract electrical conductivity methods for EC
e < 3 dS m
−1 and EC
e > 3 dS m
−1 and R
2 are presented.
Similarly, the slope and R
2 of the linear relationship between 1:1 soil to water extract electrical conductivity methods for EC
e < 3 dS m
−1 and EC
e >3 dS m
−1 are presented in
Table 3.
From the results presented in
Table 2 and
Table 3, it is obvious that each of the three methods examined resulted in different values of both EC
1:1 and EC
1:5 when EC
e < 3 dS m
−1. Analysis of variance (ANOVA) showed that the three methods are significantly different at a probability level P = 0.05. Furthermore, the t-test analysis (P = 0.05) showed that the NRCS and Loveday methods as well as the USDA and Loveday methods resulted in significantly different EC
1:5 values, while EC
1:5 values between NRCS and USDA were not significantly different. The mean value with standard deviation for NRCS, USDA and Loveday methods were 0.177 ± 0.029, 0.169 ± 0.029 and 0.151 ± 0.027 dS m
−1, respectively. In the case of 1:1 ratio, the EC values between NRCS and USDA as well as NRCS and Loveday methods were also significantly different (P = 0.05). The mean value with standard deviation for NRCS, USDA and Loveday methods were 0.5 ± 0.070, 0.43 ± 0.100 and 0.423 ± 0.086 dS m
−1, respectively.
The NRCS method resulted in greater EC values compared to the other two methods for both 1:1 and 1:5 ratios, whereas the Loveday method resulted in lower EC values. From these results, it appears that at low values of ECe (ECe < 3 dS m−1) the rest time seems to play an important role since the difference between the NRCS and the Loveday method is only in the duration of rest time. As regards to the NRCS and USDA methods, the slope of the linear regression between the NRCS and USDA at 1:5 ratio is 1.047, while at 1:1 is 1.161.
The EC
1:5 values of the soil sample L (with EC
e = 0.793 dS m
−1 < 3 dS m
−1) obtained by mechanical shaking for 1, 2, 3, 4 and 6 h was approximately 0.142 dS m
−1 while EC
1:5 values for 24 and 48 h were 0.218 and 0.274 dS m
−1, respectively. Practically, after 48 h shaking the EC
1:5 value was approximately doubling. The corresponding EC values obtained by the three methods used were 0.141, 0.127 and 0.158 dS m
−1 for USDA, Loveday and NRCS methods, respectively. Therefore, it appears that the agitation time plays a dominant role to obtain equilibrium since the difference between the NRCS method (EC
1:5 = 0.158 dS m
−1) and the method with 24 h shaking (EC
1:5 = 0.218 dS m
−1) is in the shaking time. These results are similar to those of He et al. [
6] in terms of the long shaking time required to equilibration but differ in the fact that in our experiments did not show differences in EC values obtained by shaking of at least up to 6 h. He et al. [
6] explained that the higher values of EC obtained by the long shaking time method compared to other methods may be due to the fact that the mechanical shaking destroys micro-aggregates, as well as increase dissolution of salts because the dynamic concentration gradient between solid and liquid phases. Also, Vanderheynst et al. [
12] found that differences occur for shaking time greater than a threshold value of 3 h.
In the case of soils with EC
e > 3 dS m
−1 there is no significant differences between agitation methods since all methods gave almost the same results and the slope of the linear relationship is almost 1 (
Table 2 and
Table 3). In addition, it is noted that the R
2 values for soils with EC
e > 3 dS m
−1 are higher for all methods examined, in both 1:5 and 1:1 ratios, compared to R
2 values for EC
e < 3 dS m
−1 (
Table 2 and
Table 3).
The EC1:5 values of the soil sample A (with ECe = 13.8 dS m−1 > 3 dS m−1) obtained by mechanical shaking for 1, 2, 3, 4, 6, 24 and 48 h ranged from 1.683 to 1.751 dS m−1. It is obvious that for soils with ECe > 3 dS m−1 the shaking times required to obtain equilibration are significantly lower compared to soils with ECe < 3 dS m−1
The different behavior depending on the EC
e value shows that the solid and liquid phases is far from considered a simple system where the only process carried out is dissolution and that the concentration of ions is inversely proportional to dilution. Such situations may exist only in sandy or sandy loam soils in semi-arid areas with high salinity [
25]. However, the soils are characterized by a cation exchange capacity value depending on the type and quantity of clay, the presence of slightly soluble minerals but also ion exchanges between solid and liquid phase. In the present experimental work, the existence of a relatively high clay percentage combined with the existence of slightly soluble minerals may be led to different EC values among various methods, especially when EC
e < 3 dS m
−1. This phenomenon may be even more pronounced in the case of clay soils where there are high content of slightly soluble minerals but less pronounced in the coarse-textured soils without slightly soluble minerals.
3.4. Relationship between ECe and 1:5 Soil to Water Extract Electrical Conductivity Methods
In
Table 4, the linear relationships between EC
e and EC
1:5, for all soil samples, determined by the three different methods are presented. Analysis of the results showed that each 1:5 soil to water extract electrical conductivity method is strongly related with EC
e since R
2 values are high (0.953 < R
2 < 0.972) and RMSE are low (1.02 dS m
−1 < RMSE < 1.27 dS m
−1). It also appears that the linear equations showed small differences regardless of the EC
1:5 methods for all soils examined. These data confirm the existence of a strong linear relationship when the range of EC
e is relatively great (
Table 1).
As shown in
Table 4, the relationship EC
e = fEC
1:5 using the USDA method is similar to the corresponding one reported by Kargas et al. [
7], (
Table 1) for Greek soils since both the two equations have almost the same slope (6.61 and 6.53, respectively).
However, analysis of the results for soils with EC
e < 3 dS m
−1 showed that a percentage of 70% of experimental EC
e values were lower than those calculated by the equations presented in
Table 4. For this reason, the data were separated into two ranges based on the threshold value EC
e = 3 dS m
−1 to evaluate whether the relationship EC
e = fEC
1:5 is described by different equations as reported by other researchers [
26,
27].
The slopes of linear equation describing the relation between EC
e and EC
1:5 determined by three different methods, as well as the R
2 and RMSE for all soil examined for EC
e < 3 dS m
−1 and EC
e > 3 dS m
−1, are presented in
Table 5.
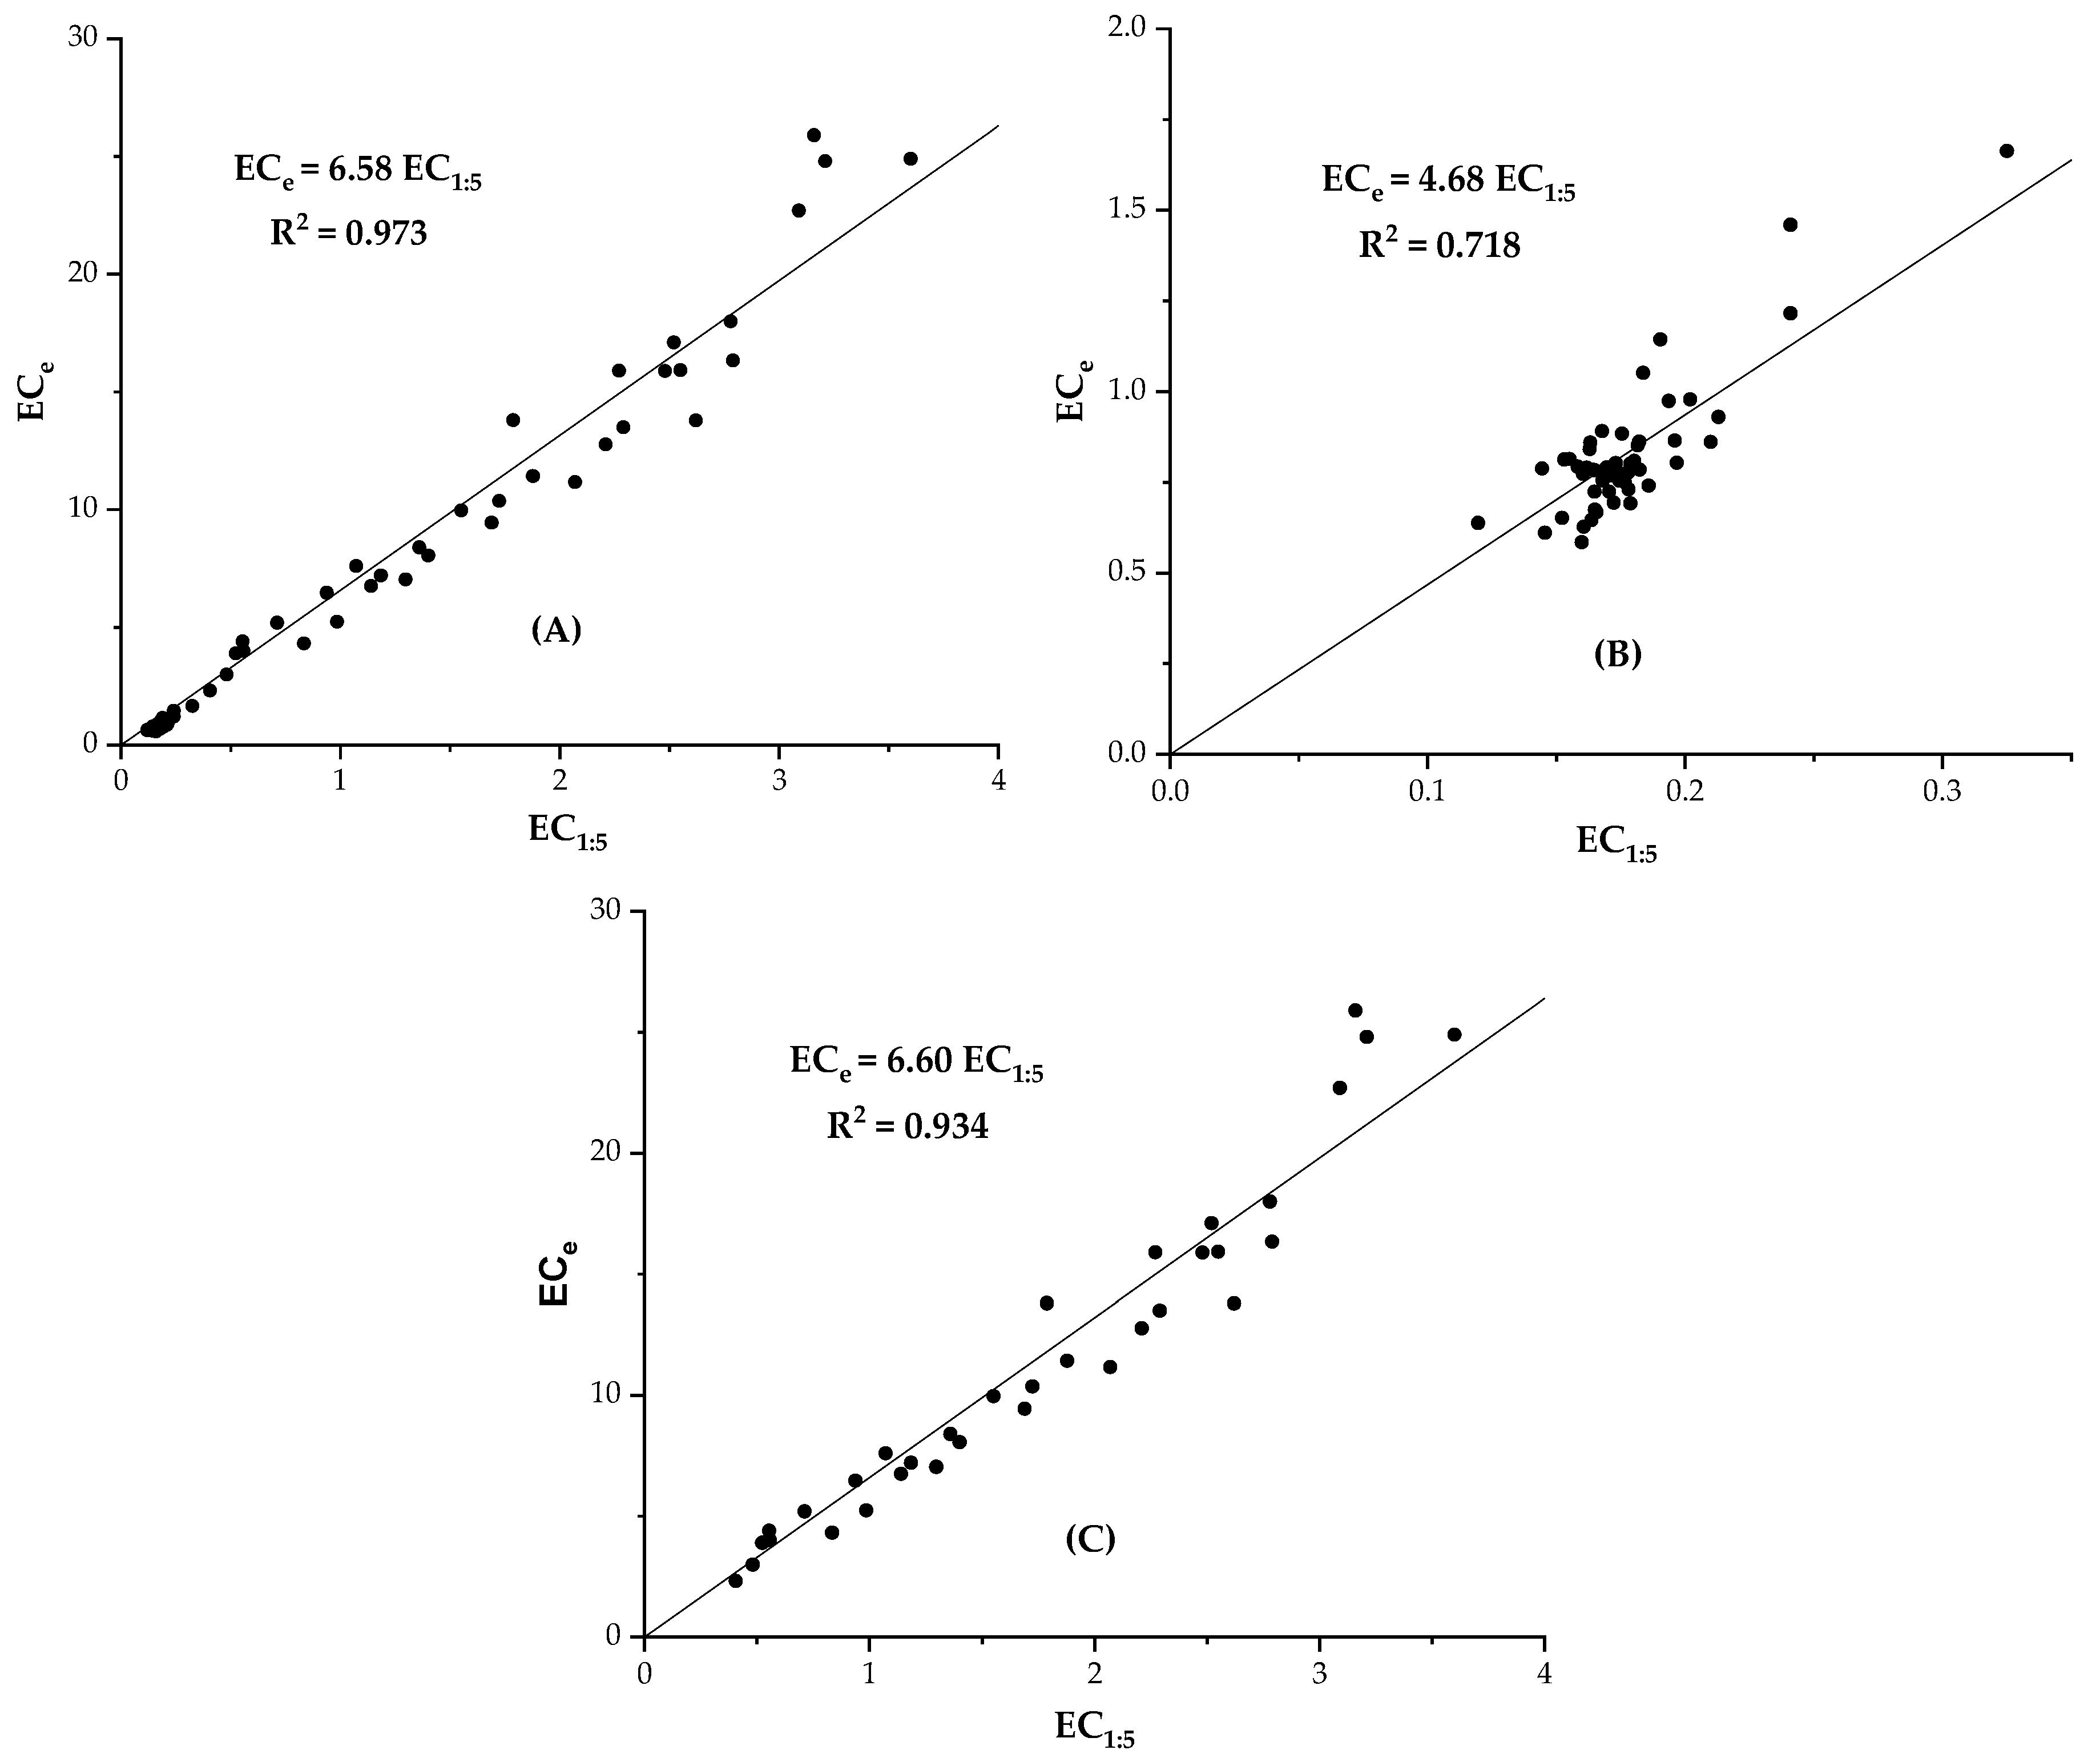
As shown in
Table 5, for soils with EC
e < 3 dS m
−1, the slope of the linear equation between EC
e and EC
1:5 has different value depending on EC
1:5 determination method used with the smallest and the highest values obtained by the NRCS and Loveday method. Also, the values of the slopes of linear relationships, for both EC
e < 3 dS m
−1 and EC
e > 3 dS m
−1, differ significantly from each other since in the case of EC
e < 3 dS m
−1 these values ranged from 4.68 to 5.46, while they ranged from 6.60 to 6.71 in the case of EC
e > 3 dS m
−1. In addition, for EC
e < 3 dS m
−1 R
2 values are lower (0.537 < R
2 < 0.718) than those ones (0.917 < R
2 < 0.942) observed for EC
e > 3 dS m
−1 indicating a strong linear relation between EC
e and each EC
1:5 determination method.
Comparison between the same methods for both EC
e < 3 dS m
−1 and EC
e > 3 dS m
−1 showed a difference between slopes ranging from 18.5% to 28.9%. Thus, in order to compare various equations describing the relationship between EC
e and EC
1:5, both the agitation method of EC
1:5 determination and the range of EC
e for which the equation has been proposed should be taken into account. Specifically, as shown in
Table 5 and
Figure 1, the relationship between EC
e and EC
1:5 determined by the NRCS method has a slope of 4.68 for EC
e < 3 dS m
−1 and 6.60 for EC
e > 3 dS m
−1. The differences among the methods may be even greater if the soil contains gypsum or larger amounts of calcite than those observed in the soil samples examined.
Similar results regarding to the effect of agitation method, the range of EC
e and the gypsum content on equation describing the relationship between EC
e and EC
1:5 have been presented by other researchers [
3,
26,
27].
He et al. [
27] proposed a quadratic equation as a more appropriate equation to describe the relationship between EC
e and EC
1:5 when EC
e values are lower than 4 dS m
−1. The fitting of a quadratic equation to the data of this study for EC
e < 3 dS m
−1 gave R
2 values of 0.74, 0.57 and 0.66 and RMSE values 0.096 (NRCS), 0.124 (USDA) and 0.115 dS m
−1 (Loveday method), respectively. A comparison between these RMSE values and those of the linear relationships presented in
Table 5, showed a significant improvement only in the case of the NRCS method. It should be noted that there is a significant difference in RMSE values presented in
Table 4 compared to RMSE values whether we use the linear equation or quadratic equation to EC
e estimation for EC
e < 3 dS m
−1.
3.5. Relationship between ECe and 1:1 Soil to Water Extract Electrical Conductivity Methods
Table 6 shows the relationship between EC
e and the three methods of determining EC
1:1 for all soil samples examined. The results showed that the relationship is strongly linear in all methods examined (R
2 > 0.986) and RMSE values are low (0.63 < RMSE < 0.74 dS m
−1). The values of both R
2 and RMSE indicate that this linear relationship reliably estimates the EC
e. However, EC
e = fEC
1:1 linear relationships have different f coefficient for each method.
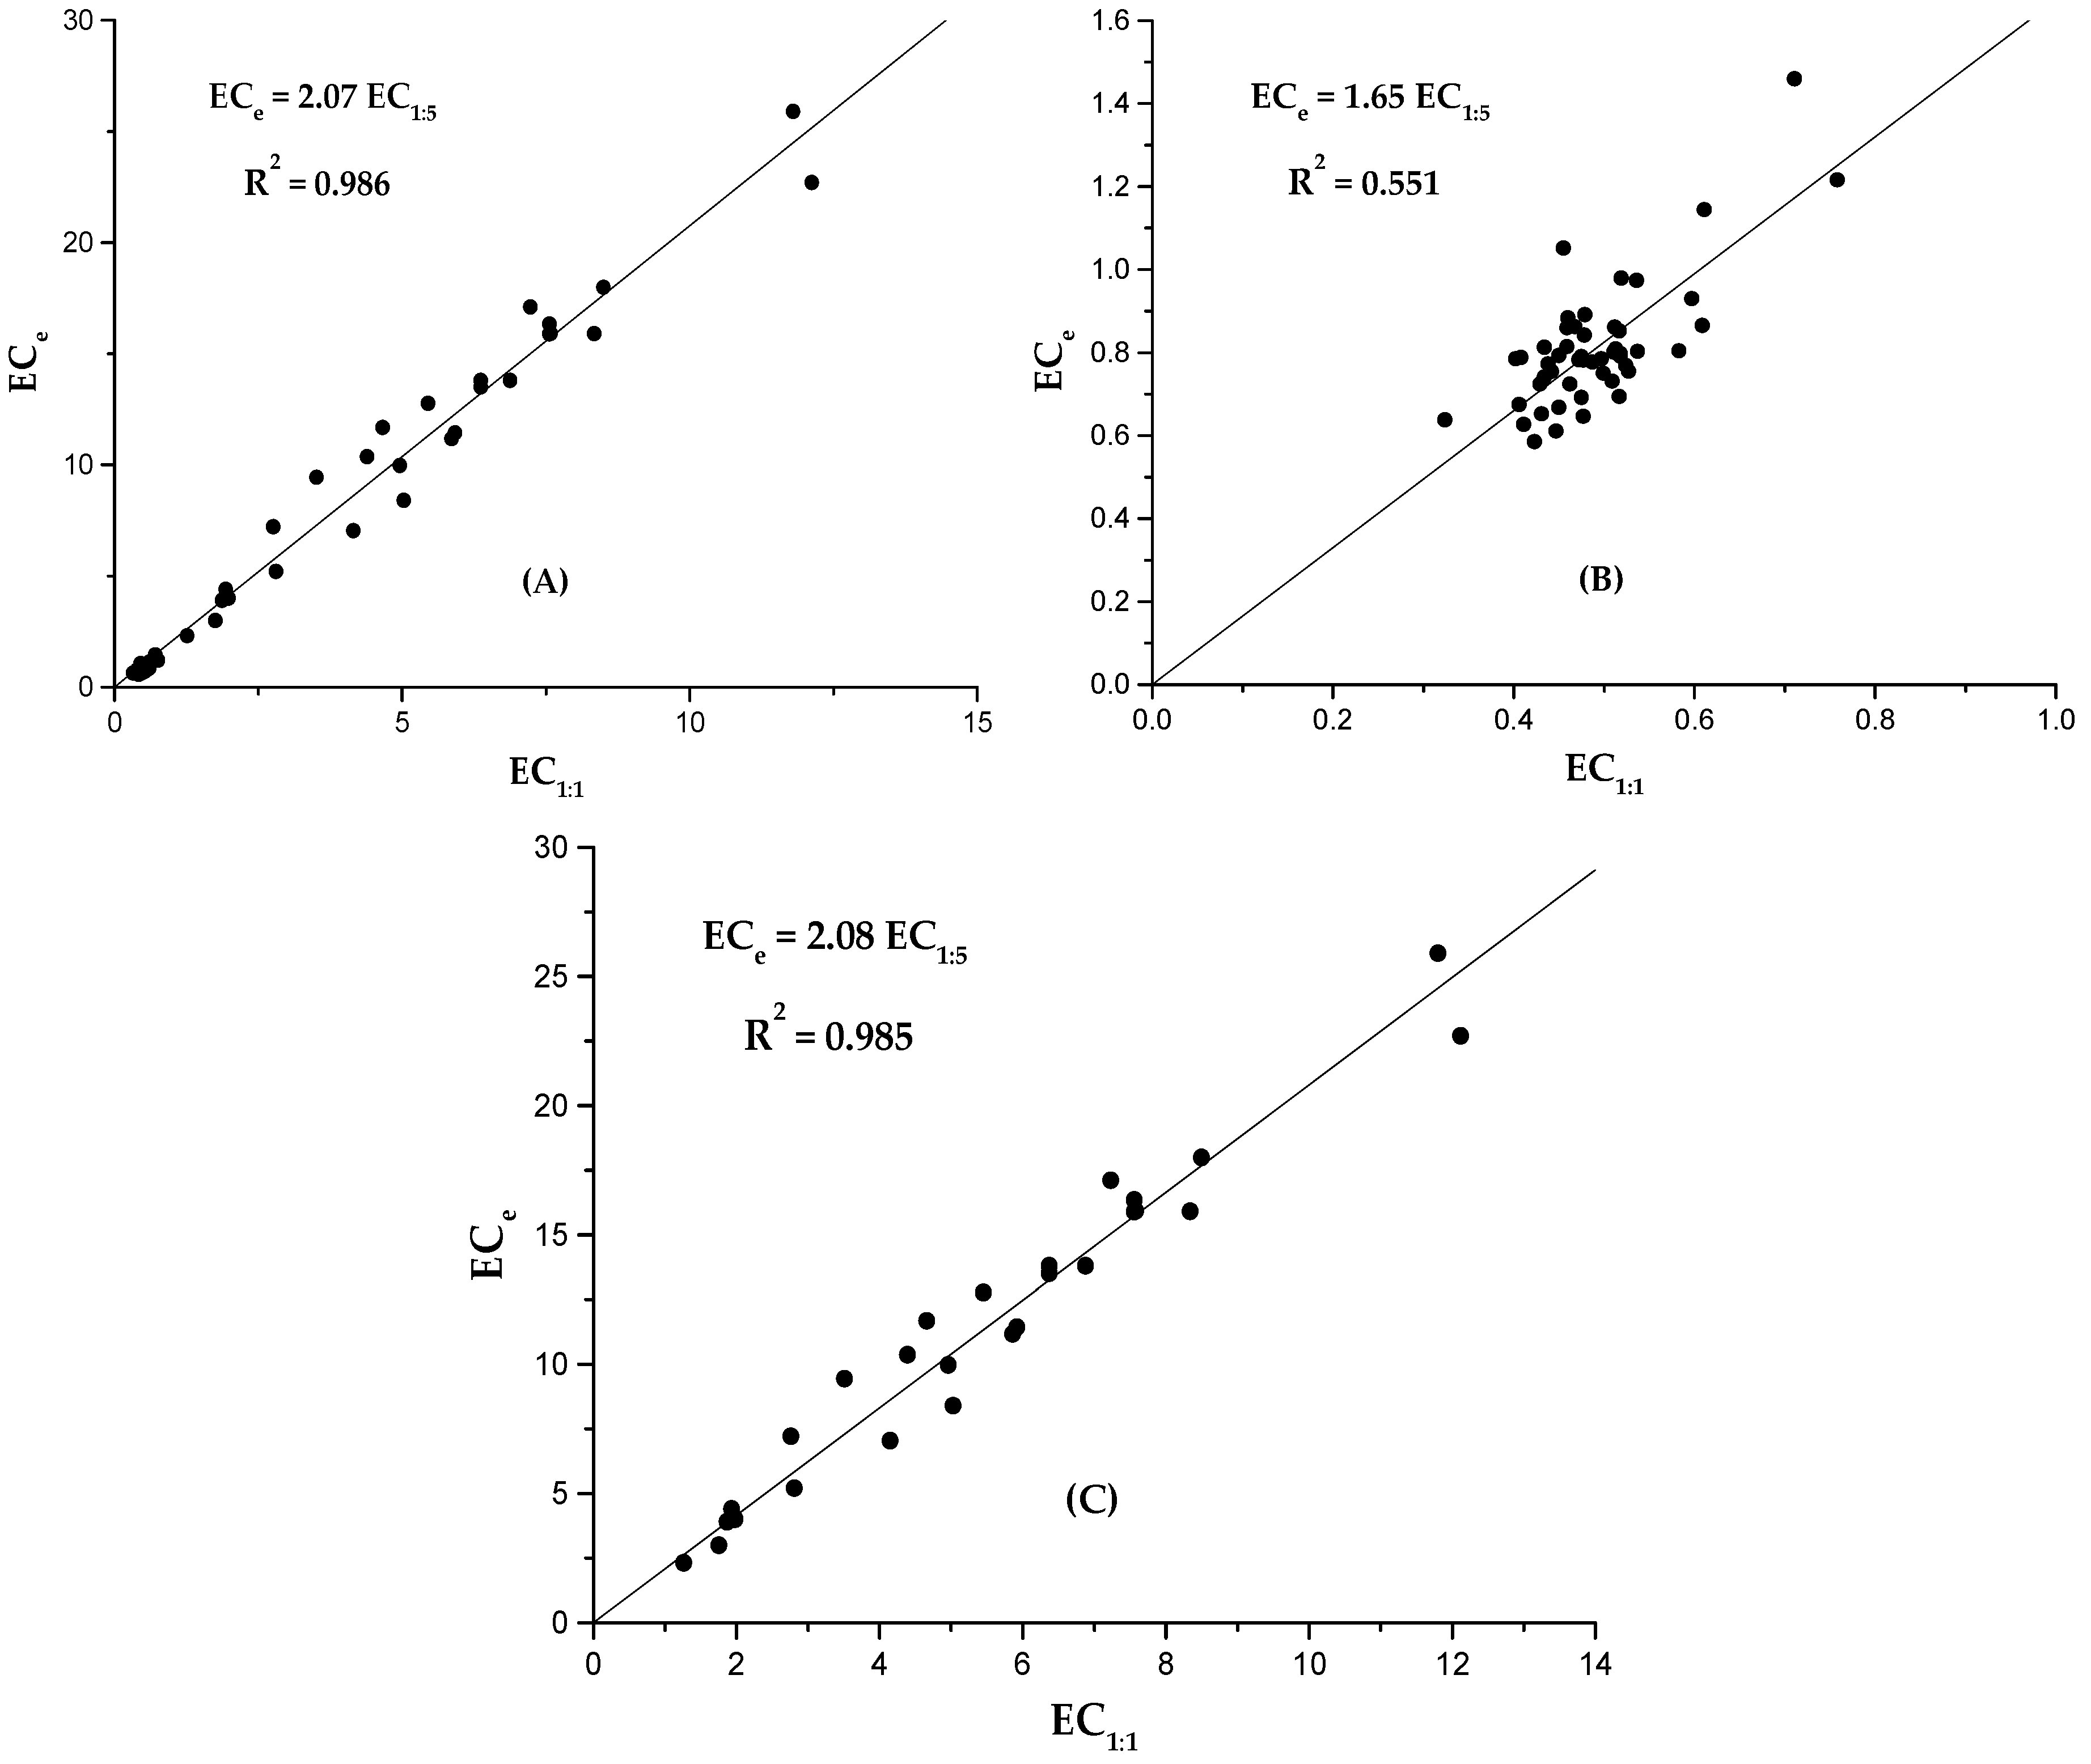
In
Table 7, regression equations describing the relation between EC
e and EC
1:1 determined by three different methods are presented taking into consideration the threshold of EC
e value 3 dS m
−1. The results showed that the same trends were observed for R
2 and RMSE values as in the case of the results of 1:5 ratio presented in
Table 5. As regards to differences observed in the slope of linear relationships between the two areas of EC
e values, a notable difference was observed in the NRCS method since it resulted to a slope 1.65 for EC
e < 3 dS m
−1 and 2.08 for EC
e > 3 dS m
−1. Furthermore, the quadratic equation for the NRCS method, for EC
e < 3 dS m
−1, resulted almost to the same RMSE values (0.099 dS m
−1) with those of linear equation. Therefore, for this method with EC
e <3 dS m
−1 the simple linear equation gave quite reliable results to EC
e estimation. The other two methods showed similar slope values regardless of the EC
e value. In particular, the EC
e-USDA relationship had almost the same slope value regardless of the EC
e.
The relationships between EC
e and EC
1:1 determined by the NRCS method taking into consideration the threshold of EC
e value 3 dS m
−1 are also presented in
Figure 2.
4. Conclusions
The EC1:5 was affected by both agitation method and time, especially for ECe values lower than 3 dS m−1. Generally, the NRCS method resulted in the highest EC values compared to the other two methods examined. The differences among agitation methods are essentially eliminated for ECe values greater than 3 dS m−1. For soil having ECe values lower than 3 dS m−1, equilibration time was very greater than the soils having ECe values above 3 dS m−1. The most appropriate equation for ECe estimation using EC1:5 values for soils having ECe < 3 dS m−1 is a quadratic equation—especially in the case of the NRCS method—while for soils having ECe > 3 dS m−1 is the linear equation. However, if soils have a wide range of salinization levels, the linear model are recommended.
The present study shows that the shaking method and the equilibration time are additional contributing factors to the observed differences of the proposed equations for the ECe estimation by EC1:5. Therefore, in order to select each time, the appropriate method and equilibration time for measuring EC1:5, during laboratory studies, the ECe value of some samples, as well as the soil characteristics (e.g., gypsum and calcium carbonate content) should be examined in advance.
The EC1:1 was affected by ECe values only in the case of the NRCS method where the estimation of the ECe can be conducted by simple but different linear relationships whose slopes depend on ECe values. In the other two methods, the linear relationship ECe = f(EC1:1) was not affected by ECe values.
Overall, it is necessary to describe in detail the method of preparation and extraction for determining EC1:1 or EC1:5 and the range of ECe in order to properly evaluate and compare the proposed equations of ECe = f(EC1:5). Additionally, the study of soils with different characteristics than those of the group of soils examined in this work is needed.


