Study on Landscape Patches Influencing Hillslope Erosion Processes and Flow Hydrodynamics in the Loess Plateau of Western Shanxi Province, China

 ,
, 

Abstract
1. Introduction
2. Materials and Methods
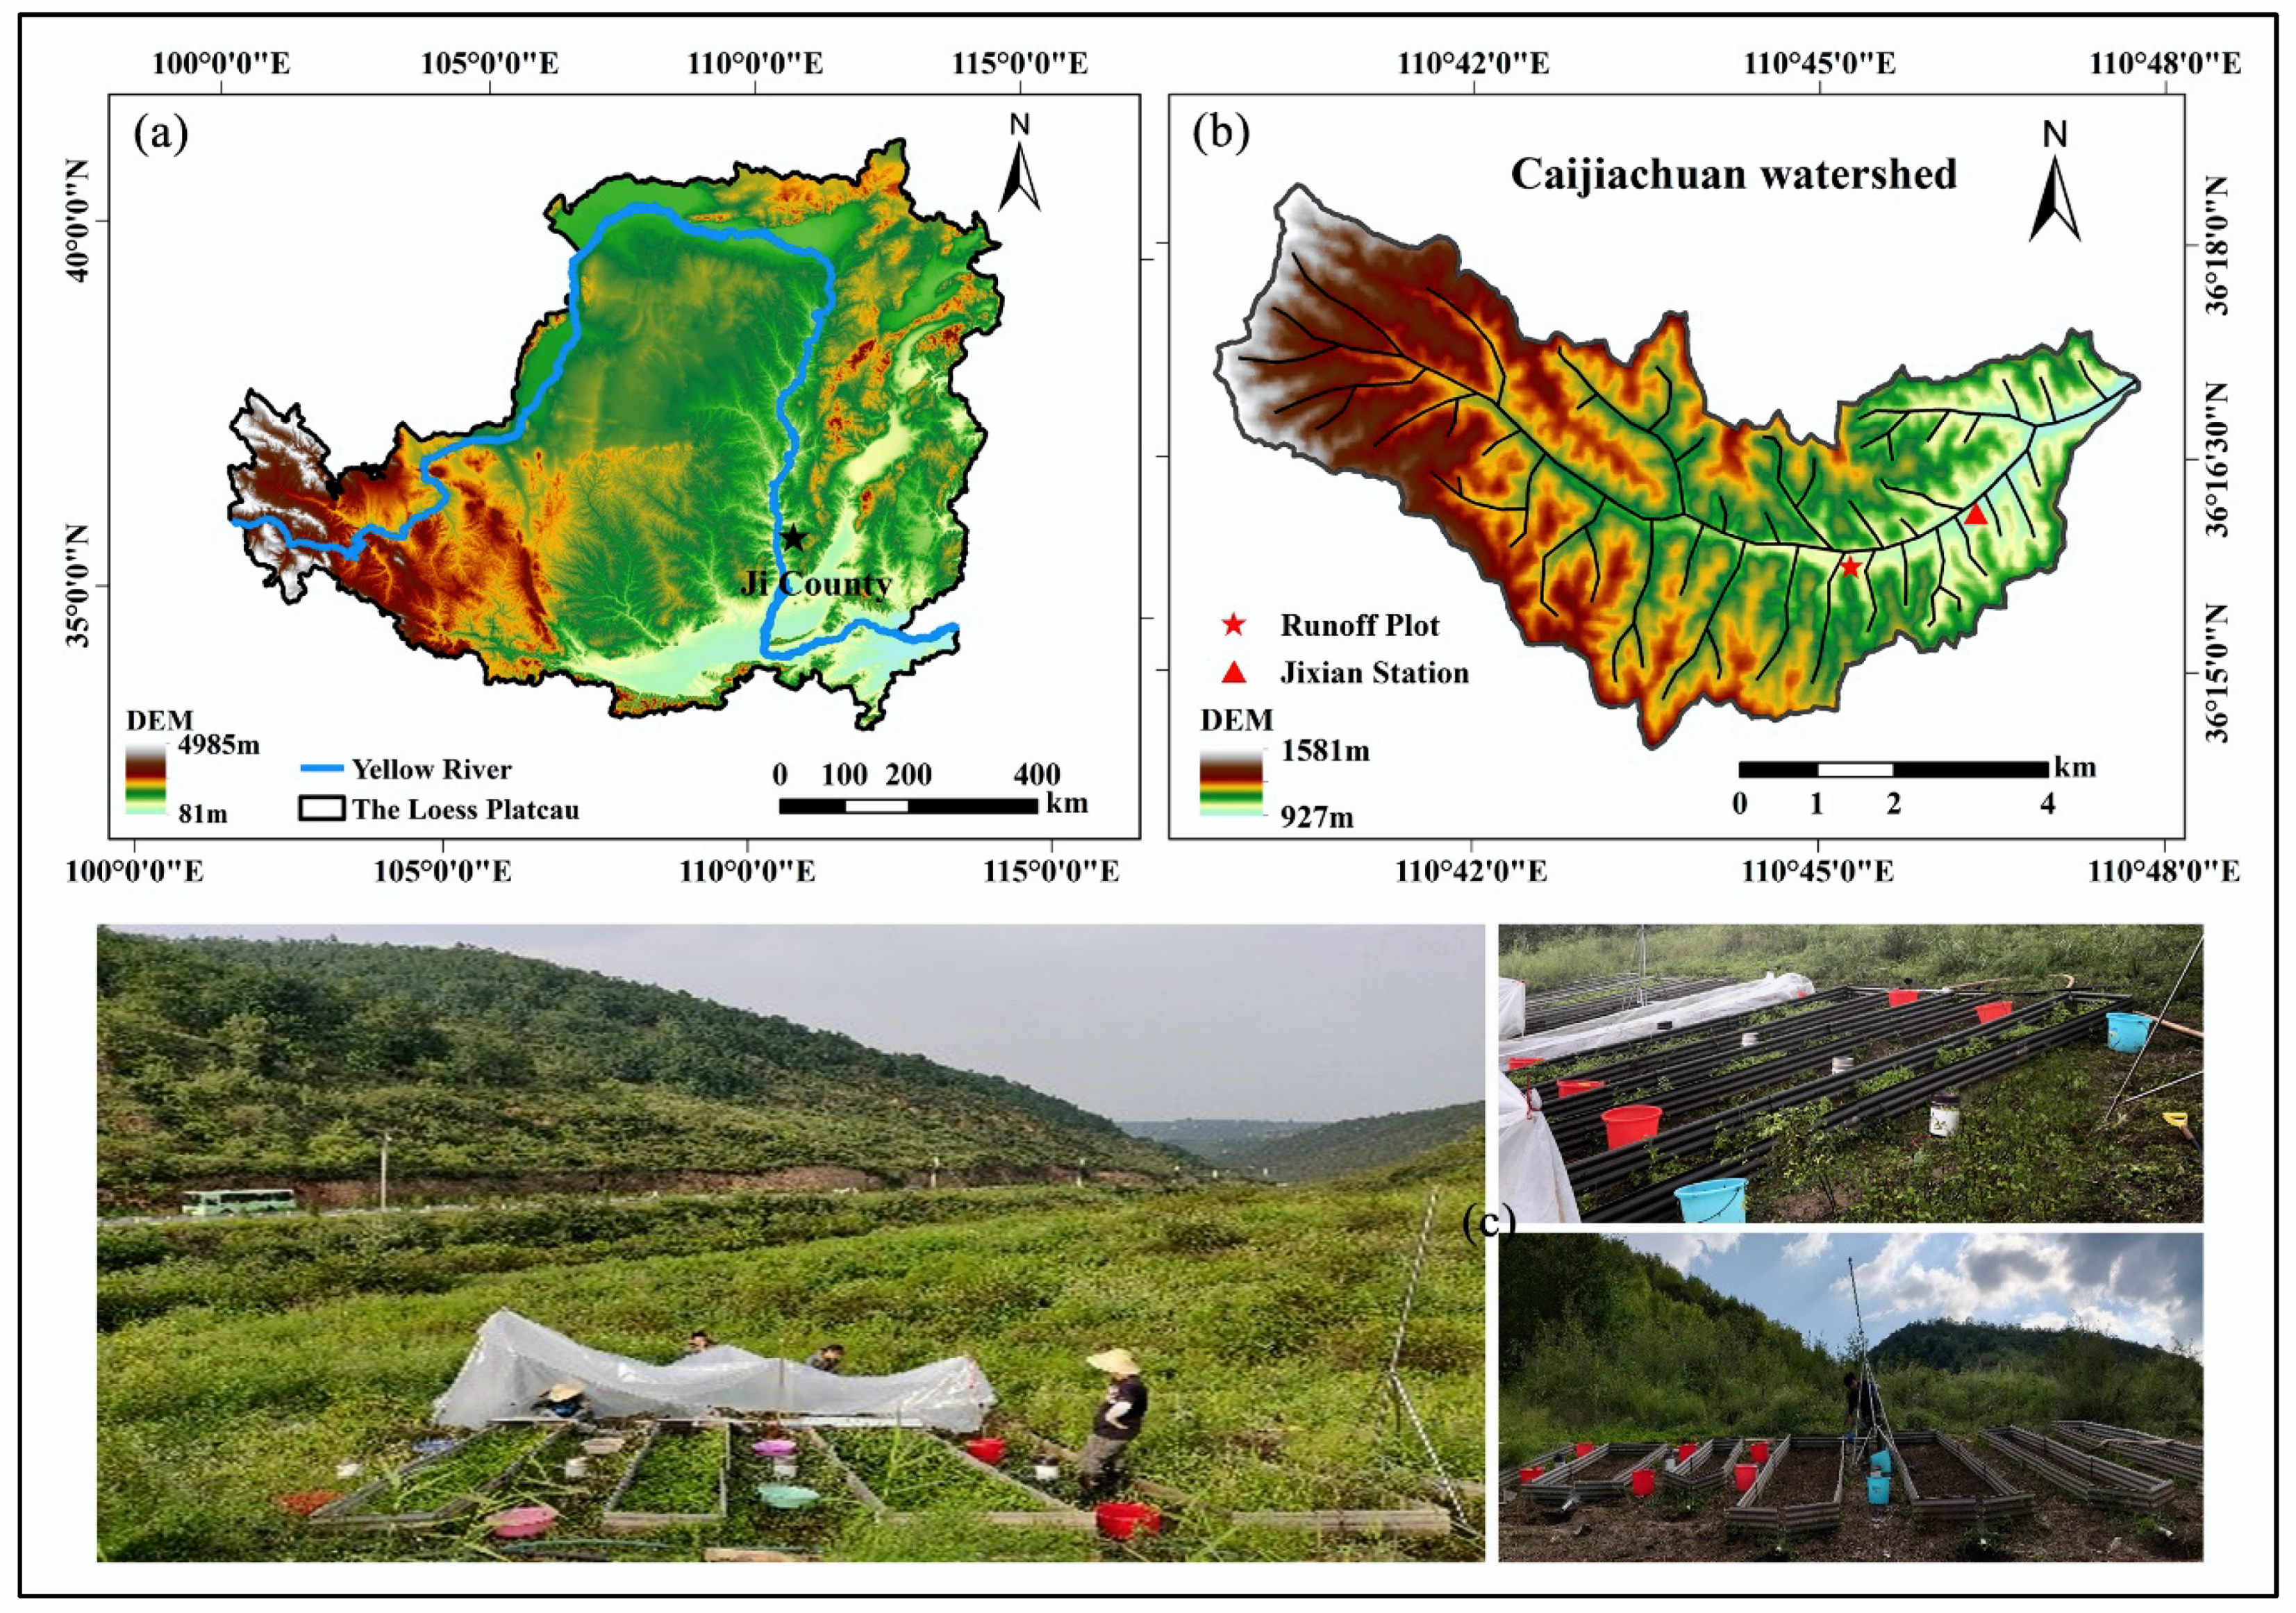
2.1. Study Area
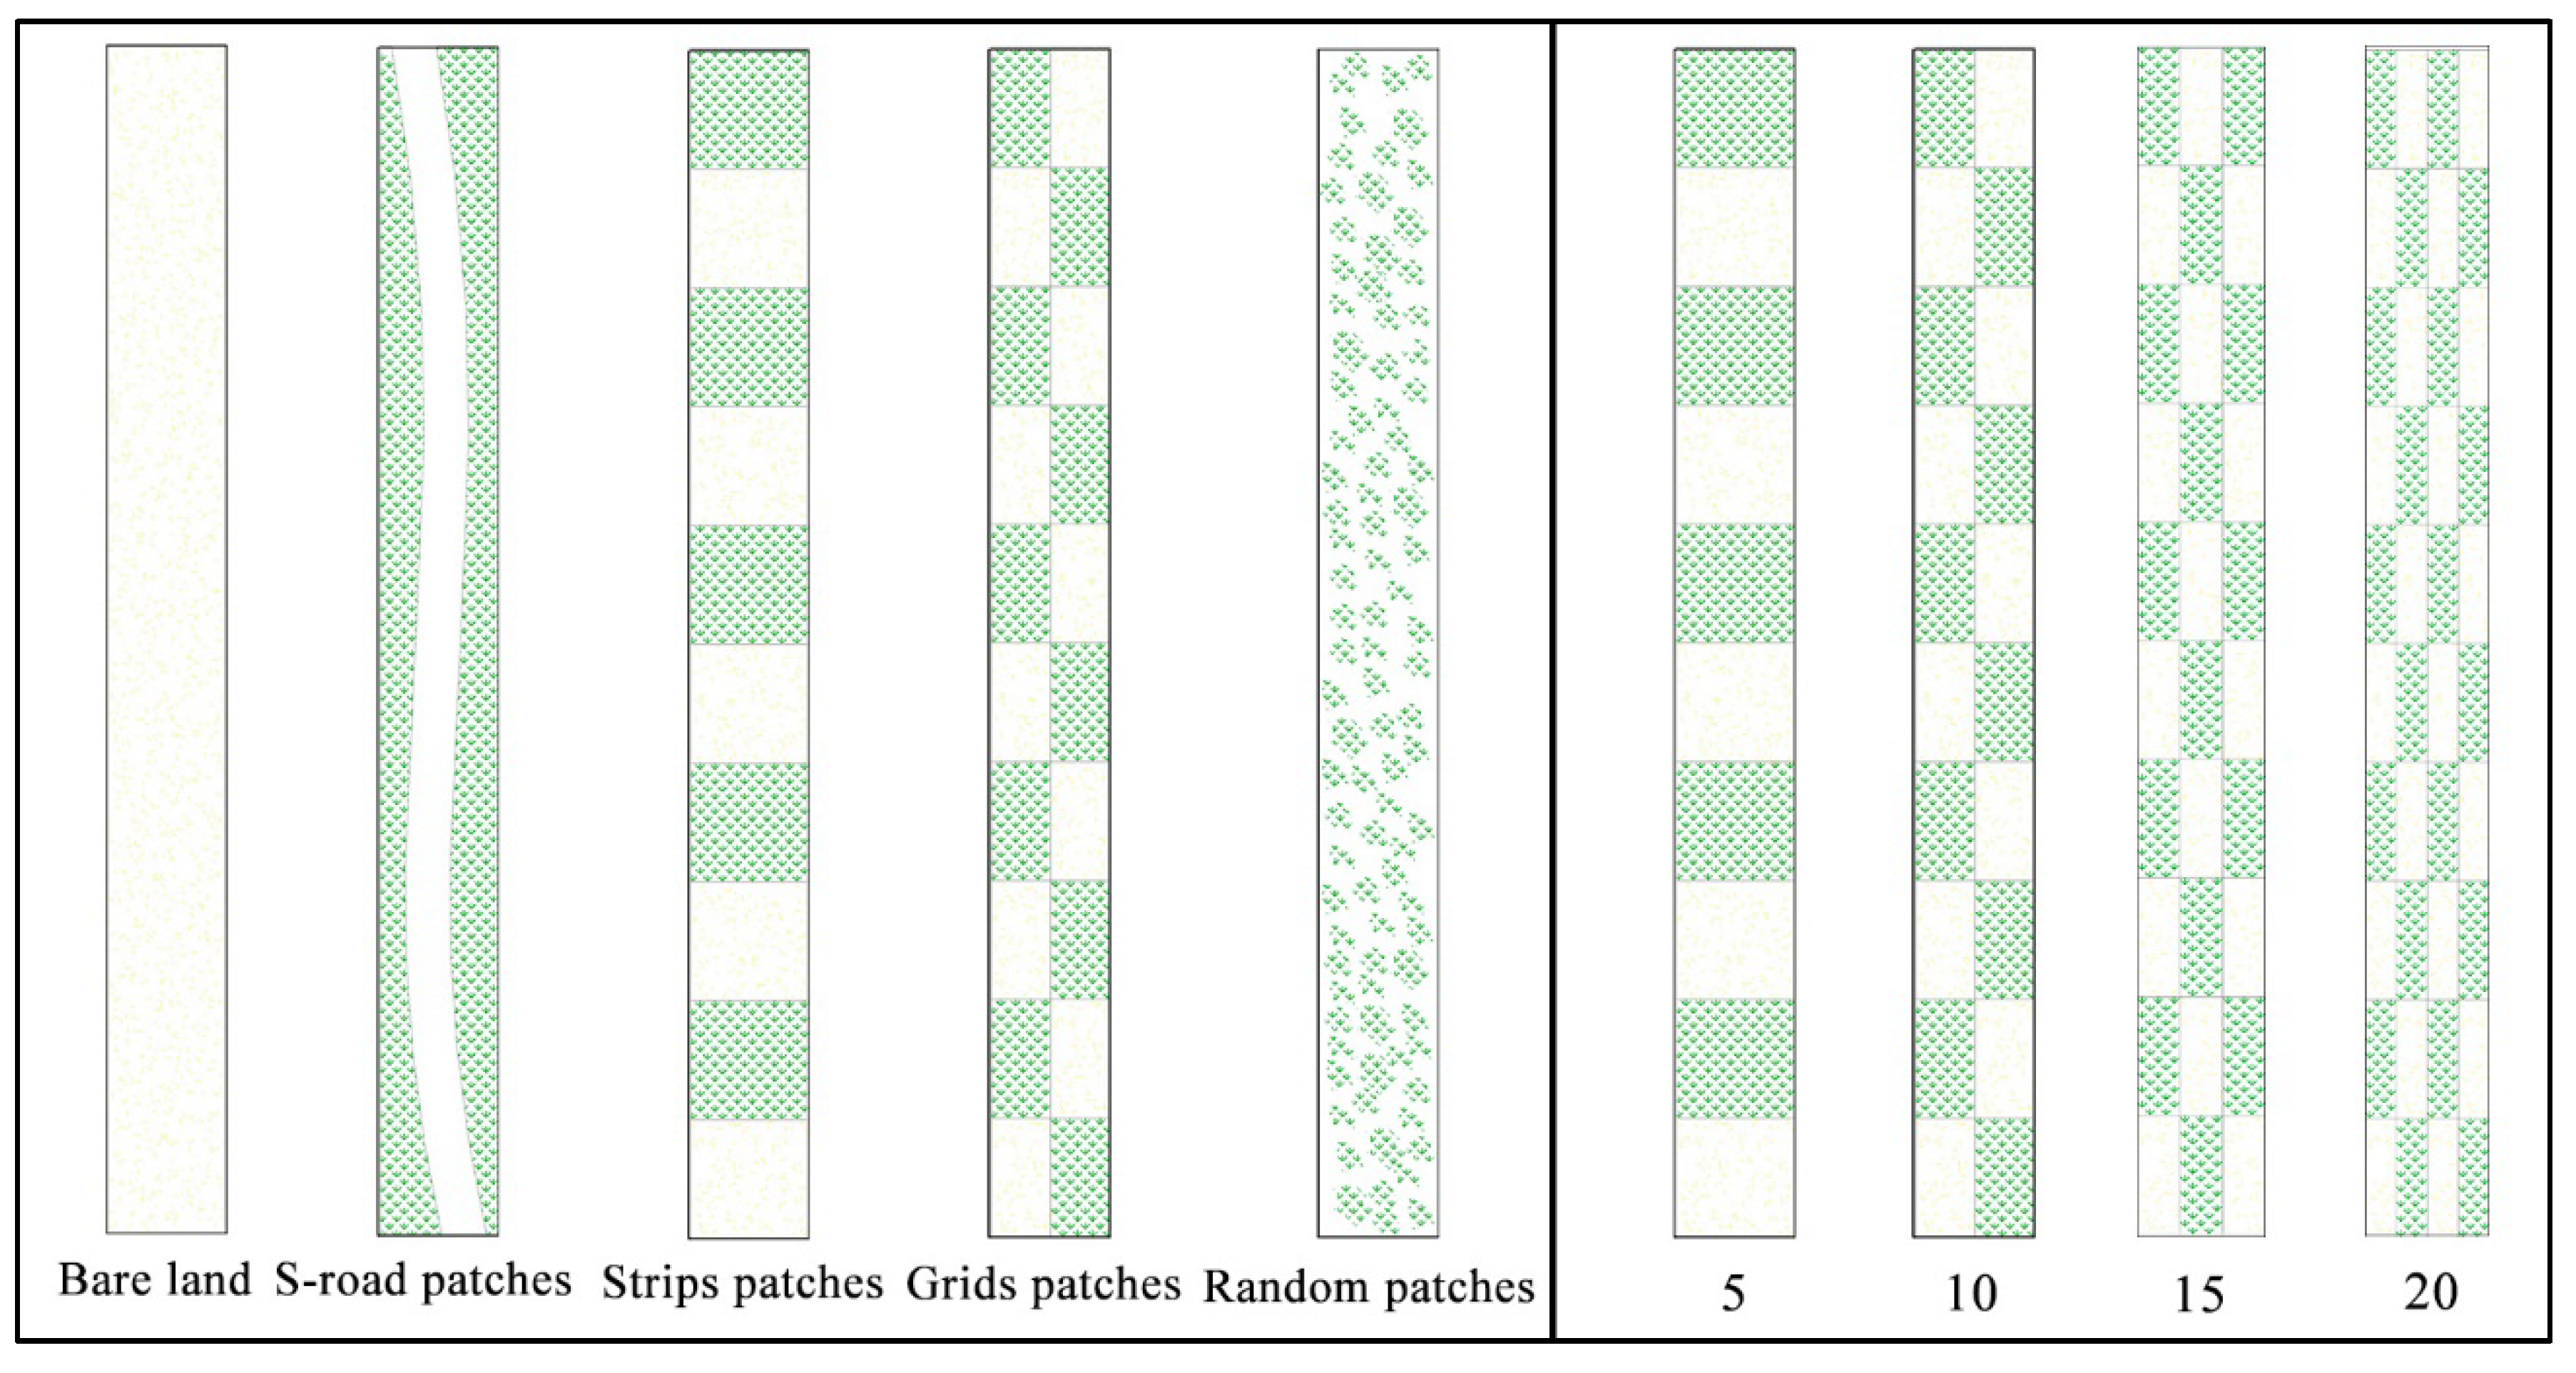
2.2. Experimental Designs
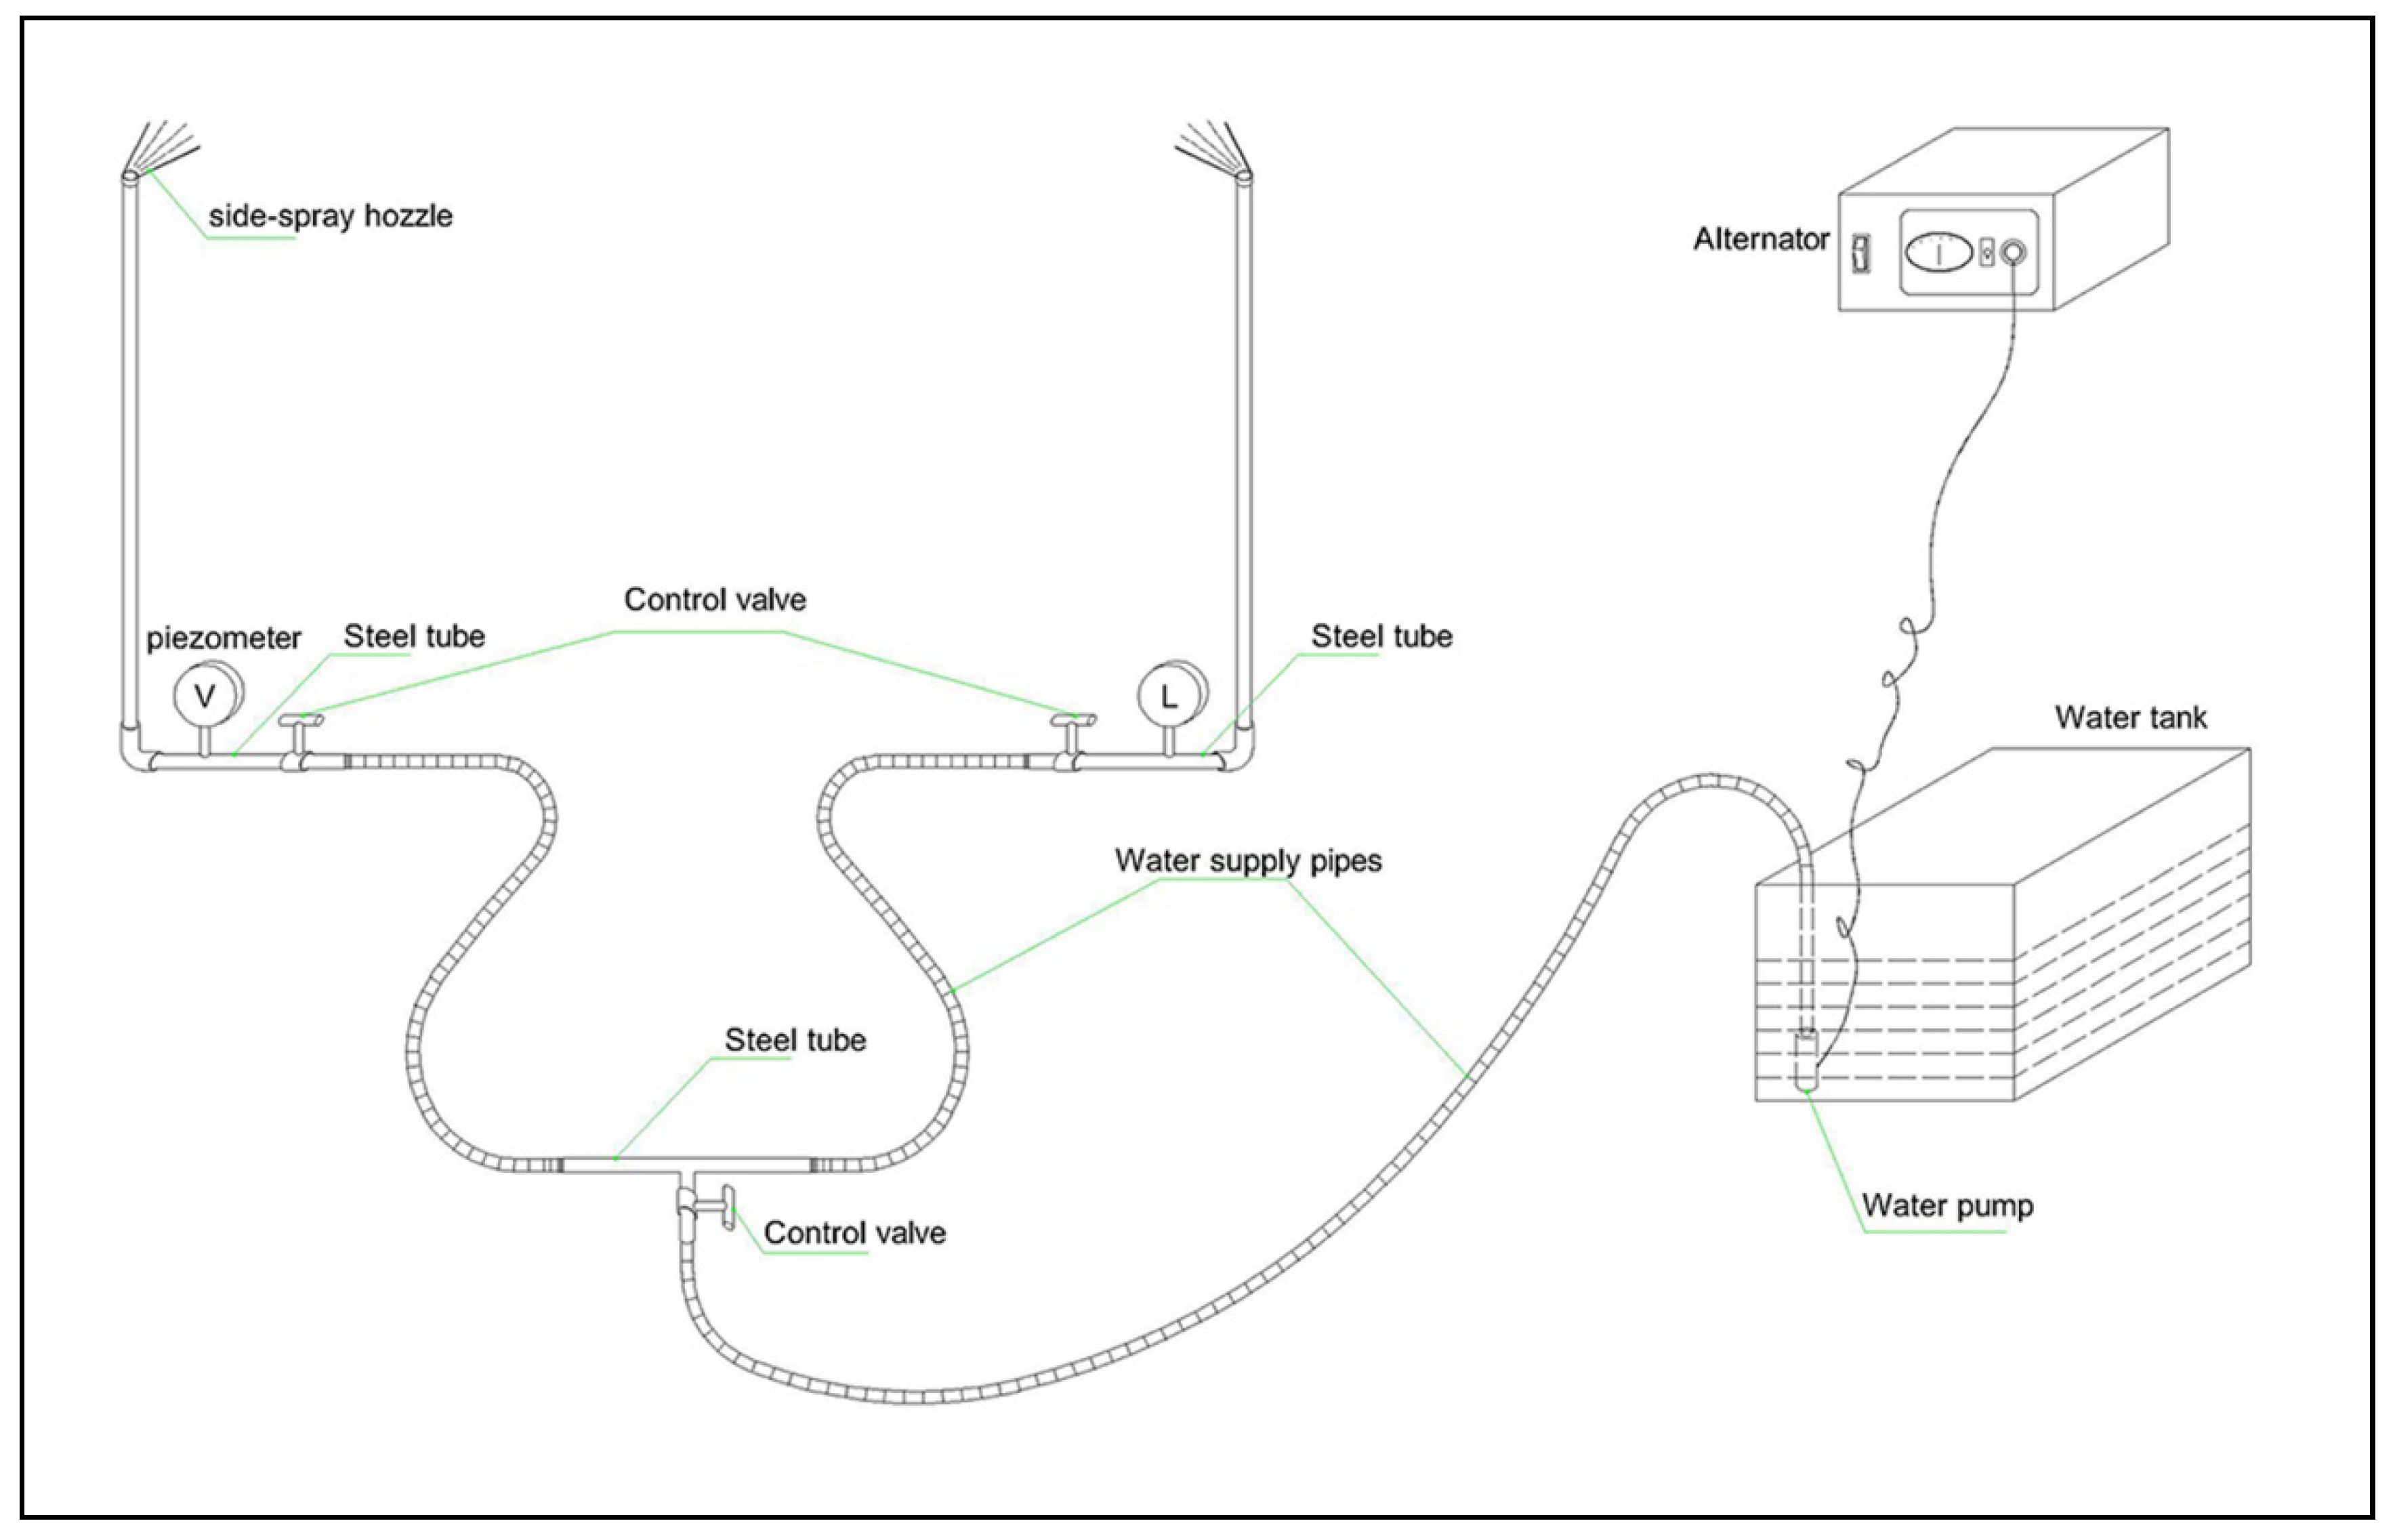
2.3. Experimental Treatments and Measurement
2.4. Data Analysis
3. Results
3.1. Effects of Different Types of Vegetation Patches on Runoff and Sediment Processes and Their Hydrodynamic Characteristics
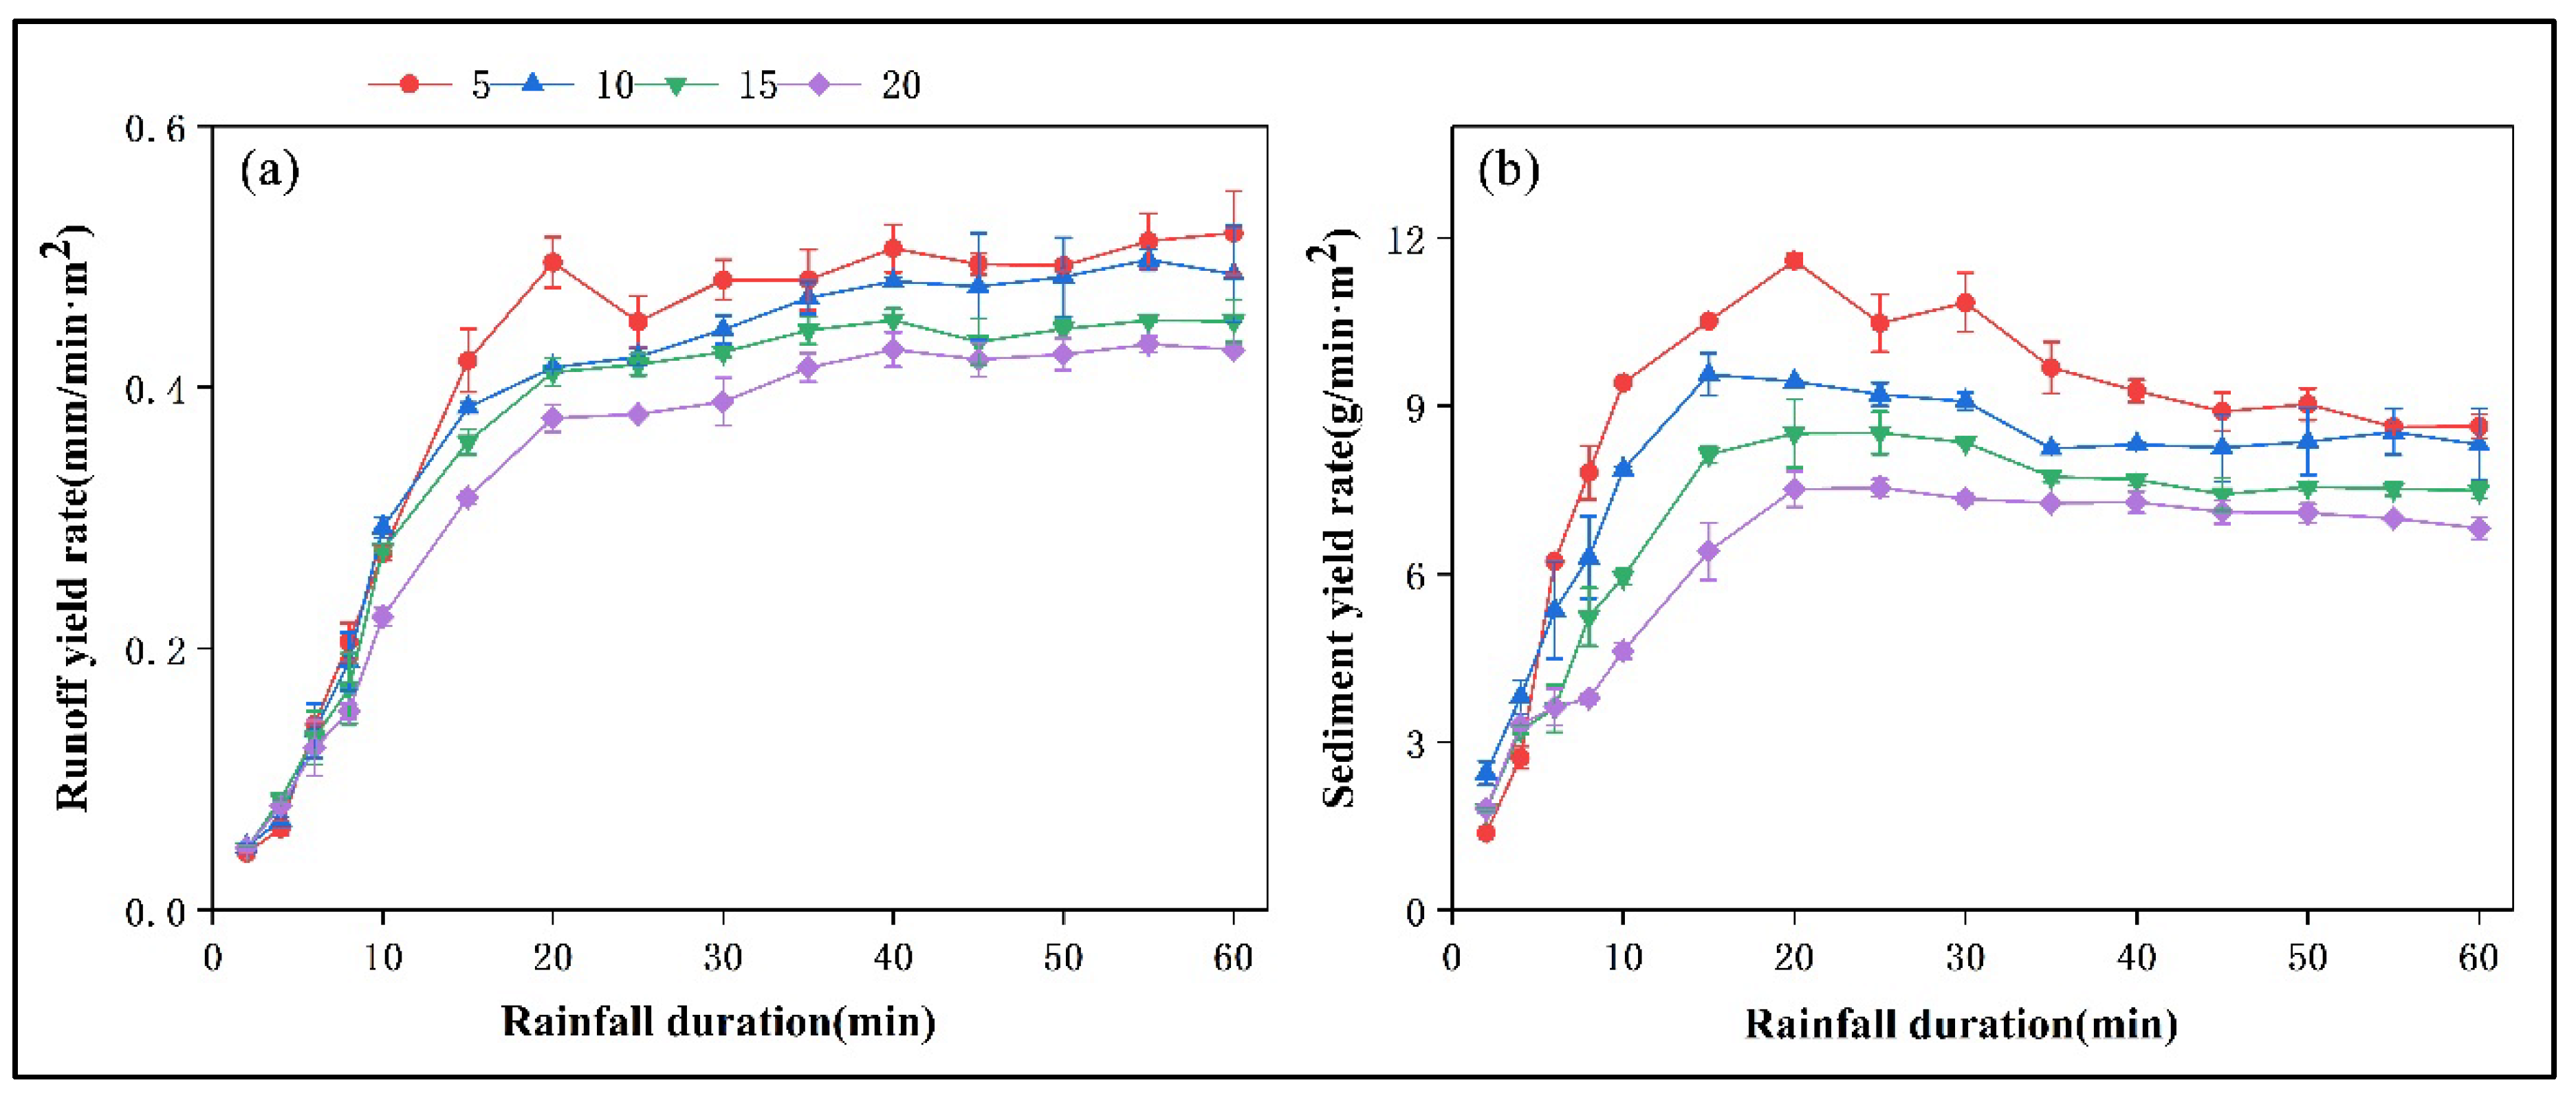
3.2. Effects of the Number of Vegetation Patches on Runoff and Sediment Processes and Their Hydrodynamic Characteristics
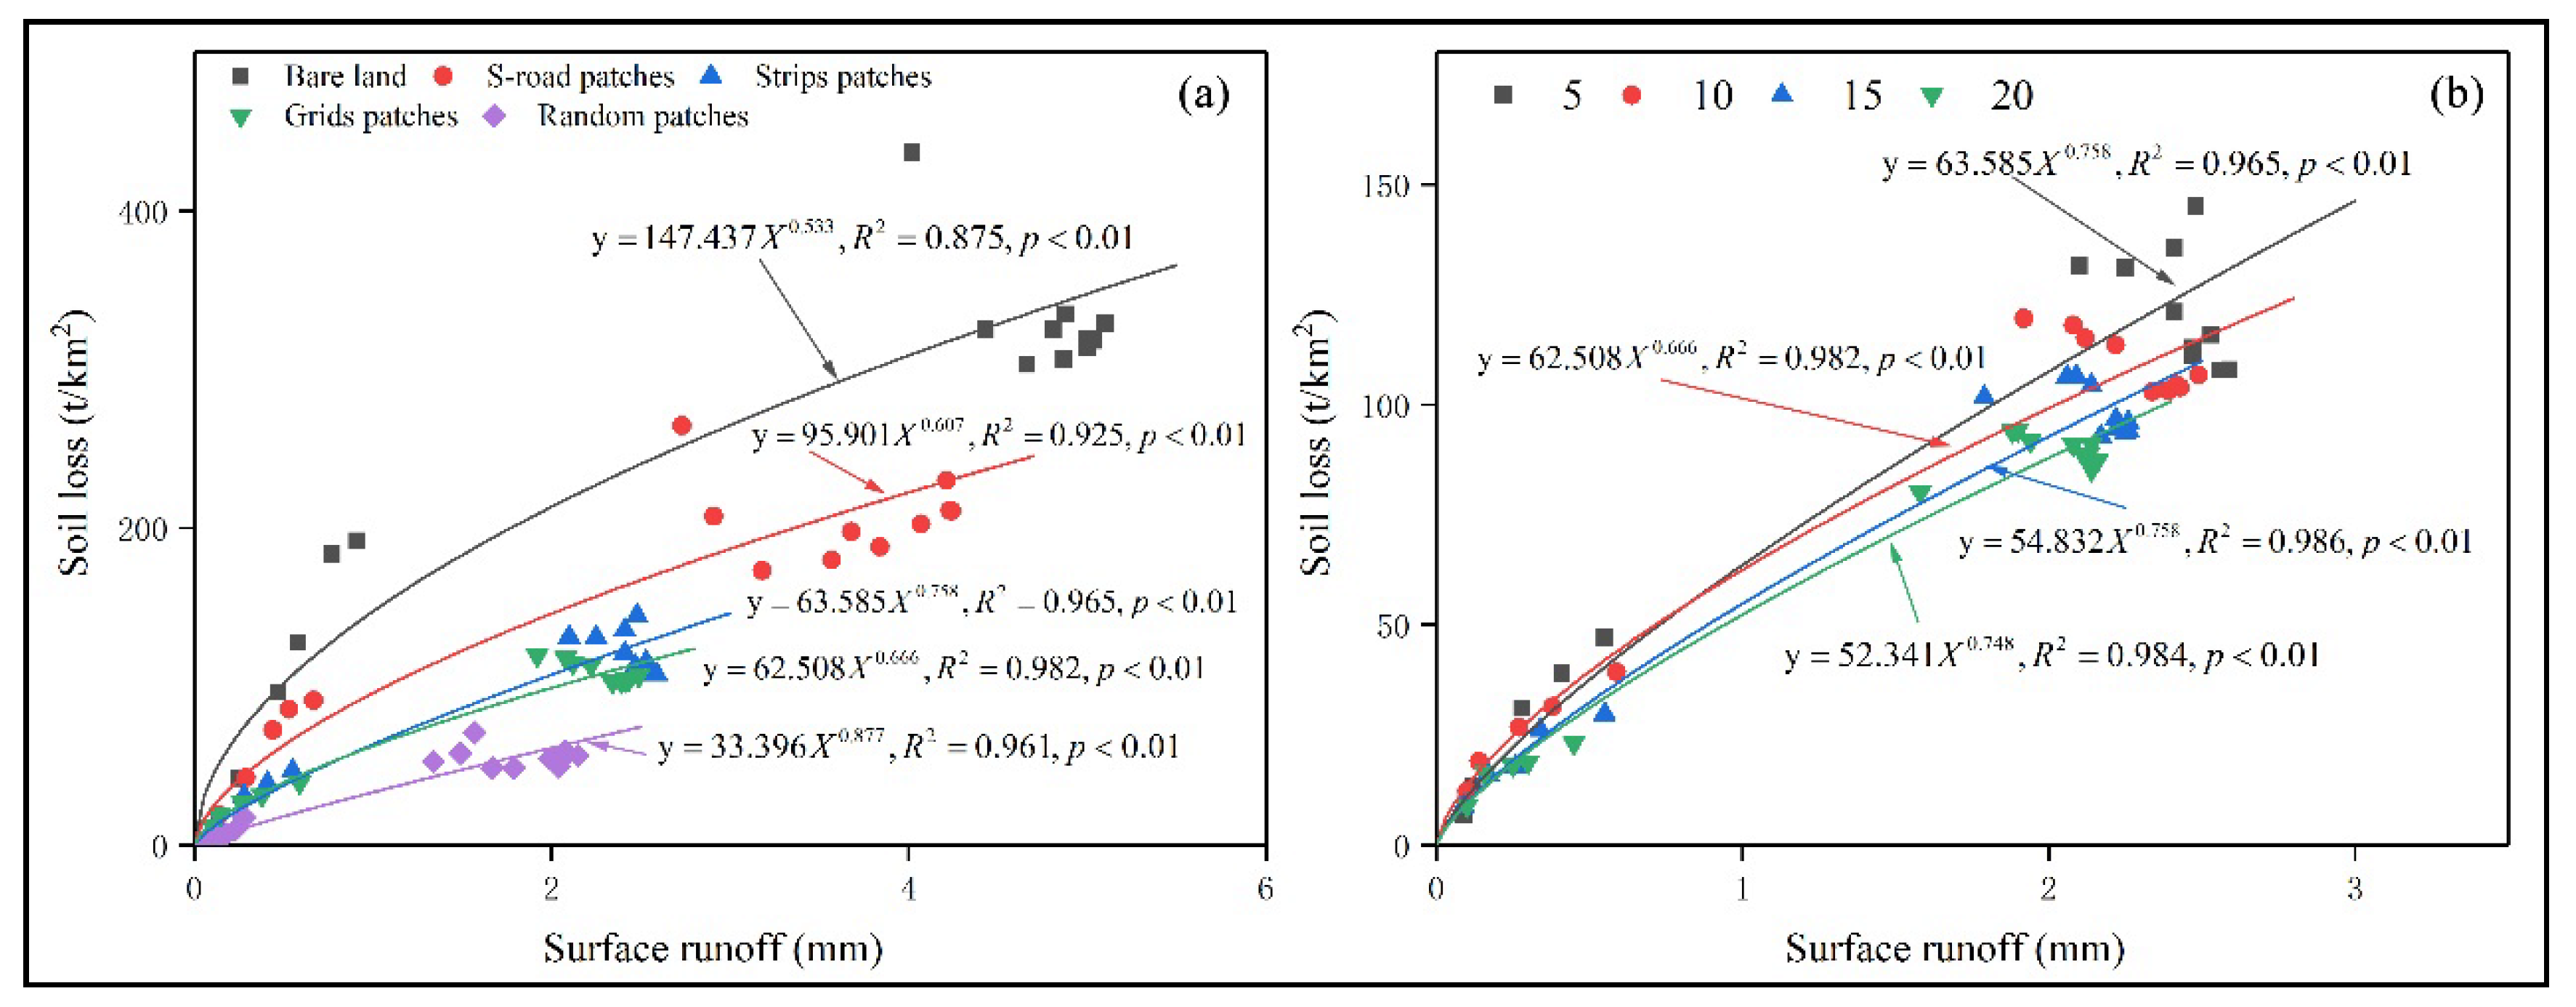
3.3. The Relationship Between Runoff and Soil Loss under Different Patch Types and Quantity
4. Discussion
5. Conclusions
Author Contributions
Funding
Acknowledgments
Conflicts of Interest
References
- Panagos, P.; Standardi, G.; Borrelli, P.; Lugato, E.; Montanarella, L.; Bosello, F. Cost of agricultural productivity loss due to soil erosion in the European Union: From direct cost evaluation approaches to the use of macroeconomic models. Land Degrad. Dev. 2018, 29, 471–484. [Google Scholar] [CrossRef]
- Li, M.; Yao, W.; Ding, W.; Yang, J.; Chen, J. Effect of grass coverage on sediment yield in the hillslope-gully side erosion system. J. Geogr. Sci. 2009, 19, 321–330. [Google Scholar] [CrossRef]
- Yu, Y.; Zhao, W.; Martinez-Murillo, J.F.; Pereira, P. Loess Plateau: From degradation to restoration. Sci. Total Environ. 2020, 738, 140206. [Google Scholar] [CrossRef]
- Wang, S.; Fu, B.; Piao, S.; Lu, Y.; Ciais, P.; Feng, X.; Wang, Y. Reduced sediment transport in the Yellow River due to anthropogenic changes. Nat. Geosci. 2016, 9, 38–41. [Google Scholar] [CrossRef]
- Rodrigo-Comino, J. Five decades of soil erosion research in "terroir". The State-of-the-Art. Earth Sci. Rev. 2018, 179, 436–447. [Google Scholar] [CrossRef]
- Rodrigo-Comino, J.; Martinez-Hernandez, C.; Iserloh, T.; Cerda, A. Contrasted Impact of Land Abandonment on Soil Erosion in Mediterranean Agriculture Fields. Pedosphere 2018, 28, 617–631. [Google Scholar] [CrossRef]
- Zhou, Z.C.; Shangguan, Z.P. The effects of ryegrass roots and shoots on loess erosion under simulated rainfall. Catena 2007, 70, 350–355. [Google Scholar] [CrossRef]
- Liu, W.; Zhang, X.C.; Dang, T.; Zhu, O.; Li, Z.; Wang, J.; Wang, R.; Gao, C. Soil water dynamics and deep soil recharge in a record wet year in the southern Loess Plateau of China. Agric. Water Manag. 2010, 97, 1133–1138. [Google Scholar] [CrossRef]
- Fu, W.; Huang, M.; Gallichand, J.; Shao, M. Optimization of plant coverage in relation to water balance in the Loess Plateau of China. Geoderma 2012, 173, 134–144. [Google Scholar] [CrossRef]
- Zhang, X.; Yu, G.Q.; Li, Z.B.; Li, P. Experimental Study on Slope Runoff, Erosion and Sediment under Different Vegetation Types. Water Resour. Manag. 2014, 28, 2415–2433. [Google Scholar] [CrossRef]
- Zhou, J.; Fu, B.; Gao, G.; Lü, Y.; Liu, Y.; Lü, N.; Wang, S. Effects of precipitation and restoration vegetation on soil erosion in a semi-arid environment in the Loess Plateau, China. Catena 2016, 137, 1–11. [Google Scholar] [CrossRef]
- Zhang, X.; Li, P.; Li, Z.B.; Yu, G.Q.; Li, C. Effects of precipitation and different distributions of grass strips on runoff and sediment in the loess convex hillslope. Catena 2018, 162, 130–140. [Google Scholar] [CrossRef]
- Zhang, X.; Wu, B.; Ling, F.; Zeng, Y.; Yan, N.; Yuan, C. Identification of priority areas for controlling soil erosion. Catena 2010, 83, 76–86. [Google Scholar] [CrossRef]
- Zhao, G.; Mu, X.; Wen, Z.; Wang, F.; Gao, P. Soil erosion, conservation, and eco-environment changes in the loess plateau of China. Land Degrad. Dev. 2013, 24, 499–510. [Google Scholar] [CrossRef]
- Cerda, A.; Lucas Borja, M.E.; Ubeda, X.; Francisco Martinez-Murillo, J.; Keesstra, S. Pinus halepensis M. versus Quercus ilex subsp Rotundifolia L. runoff and soil erosion at pedon scale under natural rainfall in Eastern Spain three decades after a forest fire. Forest Ecol. Manag. 2017, 400, 447–456. [Google Scholar] [CrossRef]
- Cao, S.; Chen, L.; Shankman, D.; Wang, C.; Wang, X.; Zhang, H. Excessive reliance on afforestation in China’s arid and semi-arid regions: Lessons in ecological restoration. Earth Sci. Rev. 2011, 104, 240–245. [Google Scholar] [CrossRef]
- Fu, B.; Chen, L.; Ma, K.; Zhou, H.; Wang, J. The relationships between land use and soil conditions in the hilly area of the loess plateau in northern Shaanxi, China. Catena 2000, 39, 69–78. [Google Scholar] [CrossRef]
- Iogunovic, I.; Telak, L.J.; Pereira, P. Experimental Comparison of Runoff Generation and Initial Soil Erosion Between Vineyards and Croplands of Eastern Croatia: A Case Study. Air Soil Water Res. 2020, 13, 1–9. [Google Scholar] [CrossRef]
- Marques, M.; Ruiz-Colmenero, M.; Bienes, R.; García-Díaz, A.; Sastre, B. Effects of a Permanent Soil Cover on Water Dynamics and Wine Characteristics in a Steep Vineyard in the Central Spain. Air Soil Water Res. 2020, 13, 1–10. [Google Scholar] [CrossRef]
- Shi, Z.; Song, C. Water Erosion Processes: A Historical Review. J. Soil Water Conserv. 2016, 30, 1–10. (In Chinese) [Google Scholar] [CrossRef]
- Fattet, M.; Fu, Y.; Ghestem, M.; Ma, W.; Foulonneau, M.; Nespoulous, J.; Le Bissonnais, Y.; Stokes, A. Effects of vegetation type on soil resistance to erosion: Relationship between aggregate stability and shear strength. Catena 2011, 87, 60–69. [Google Scholar] [CrossRef]
- Chen, H.; Zhang, X.; Abla, M.; Lü, D.; Yan, R.; Ren, Q.; Ren, Z.; Yang, Y.; Zhao, W.; Lin, P.; et al. Effects of vegetation and rainfall types on surface runoff and soil erosion on steep slopes on the Loess Plateau, China. Catena 2018, 170, 141–149. [Google Scholar] [CrossRef]
- Li, C.; Pan, C. The relative importance of different grass components in controlling runoff and erosion on a hillslope under simulated rainfall. J. Hydrol. 2018, 558, 90–103. [Google Scholar] [CrossRef]
- Liu, Y.F.; Liu, Y.; Wu, G.L.; Shi, Z.H. Runoff maintenance and sediment reduction of different grasslands based on simulated rainfall experiments. J. Hydrol. 2019, 572, 329–335. [Google Scholar] [CrossRef]
- Yang, S.; Gao, Z.-L.; Li, Y.-H.; Niu, Y.-B.; Su, Y.; Wang, K. Erosion control of hedgerows under soils affected by disturbed soil accumulation in the slopes of loess plateau, China. Catena 2019, 181. [Google Scholar] [CrossRef]
- Hou, G.; Bi, H.; Huo, Y.; Wei, X.; Zhu, Y.; Wang, X.; Liao, W. Determining the optimal vegetation coverage for controlling soil erosion in Cynodon dactylon grassland in North China. J. Clean Prod. 2020, 244. [Google Scholar] [CrossRef]
- Pan, C.; Ma, L. How the spatial distribution of grass contributes to controlling hillslope erosion. Hydrol Process. 2020, 34, 68–81. [Google Scholar] [CrossRef]
- Shen, M.S.; Zhang, J.J.; Zhang, S.H.; Zhang, H.B.; Sun, R.X.; Zhang, Y.Z. Seasonal variations in the influence of vegetation cover on soil water on the loess hillslope. J. Mt. Sci. 2020, 17, 2148–2160. [Google Scholar] [CrossRef]
- Boer, M.; Puigdefabregas, J. Effects of spatially structured vegetation patterns on hillslope erosion in a semiarid Mediterranean environment: A simulation study. Earth Surf. Proc. Land. 2005, 30, 149–167. [Google Scholar] [CrossRef]
- Bochet, E.; Poesen, J.; Rubio, J.L. Runoff and soil loss under individual plants of a semi-arid Mediterranean shrubland: Influence of plant morphology and rainfall intensity. Earth Surf. Process. Landf. 2006, 31, 536–549. [Google Scholar] [CrossRef]
- Wu, G.L.; Wang, D.; Liu, Y.; Hao, H.M.; Fang, N.F.; Shi, Z.H. Mosaic-pattern vegetation formation and dynamics driven by the water-wind crisscross erosion. J. Hydrol. 2016, 538, 355–362. [Google Scholar] [CrossRef]
- Lu, R.; Liu, Y.F.; Jia, C.; Huang, Z.; Liu, Y.; He, H.; Liu, B.R.; Wang, Z.J.; Zheng, J.; Wu, G.L. Effects of mosaic-pattern shrub patches on runoff and sediment yield in a wind-water erosion crisscross region. Catena 2019, 174, 199–205. [Google Scholar] [CrossRef]
- Zhou, J.; Fu, B.; Yan, D.; Lu, Y.; Wang, S.; Gao, G. Assessing the integrity of soil erosion in different patch covers in semi-arid environment. J. Hydrol. 2019, 571, 71–86. [Google Scholar] [CrossRef]
- Mei, X.; Zhu, Q.; Ma, L.; Zhang, D.; Wang, Y.; Hao, W. Effect of stand origin and slope position on infiltration pattern and preferential flow on a Loess hillslope. Land Degrad. Dev. 2018, 29, 1353–1365. [Google Scholar] [CrossRef]
- Hou, G.; Bi, H.; Wang, N.; Cui, Y.; Ma, X.; Zhao, D.; Wang, S. Optimizing the Stand Density of Robinia pseudoacacia L. Forests of the Loess Plateau, China, Based on Response to Soil Water and Soil Nutrient. Forests 2019, 10, 663. [Google Scholar] [CrossRef]
- Jiao, X.; Liu, G.; Tu, X. Estimat on of water resources carrying capacity for revegetation in the Loess Plateau. J. Hydraul. Eng. 2014, 45, 1344–1351. (In Chinese) [Google Scholar] [CrossRef]
- Wu, Q.; Wang, L.; Wu, F. Tillage-impact on infiltration of the Loess Plateau of China. Acta Agric. Scand. Soil Plant Sci. 2014, 64, 341–349. [Google Scholar] [CrossRef]
- Wang, L.; Dalabay, N.; Lu, P.; Wu, F. Effects of tillage practices and slope on runoff and erosion of soil from the Loess Plateau, China, subjected to simulated rainfall. Soil Till. Res. 2017, 166, 147–156. [Google Scholar] [CrossRef]
- Lin, Q.; Xu, Q.; Wu, F.; Li, T. Effects of wheat in regulating runoff and sediment on different slope gradients and under different rainfall intensities. Catena 2019, 183. [Google Scholar] [CrossRef]
- An, J.; Zheng, F.; Lu, J.; Li, G. Investigating the Role of Raindrop Impact on Hydrodynamic Mechanism of Soil Erosion Under Simulated Rainfall Conditions. Soil Sci. 2012, 177, 517–526. [Google Scholar] [CrossRef]
- Vásquez Méndez, R.; Ventura Ramos, E.; Oleschko, K.; Hernández Sandoval, L.; Parrot, J.F.; Nearing, M.A. Soil erosion and runoff in different vegetation patches from semiarid Central Mexico. Catena 2010, 80, 162–169. [Google Scholar] [CrossRef]
- Krause, S.; Lewandowski, J.; Grimm, N.B.; Hannah, D.M.; Pinay, G.; Mcdonald, K.; Marti, E.; Argerich, A.; Pfister, L.; Klaus, J.; et al. Ecohydrological interfaces as hot spots of ecosystem processes. Water Resour. Res. 2017, 53, 6359–6376. [Google Scholar] [CrossRef]
- Sun, W.; Mu, X.; Gao, P.; Zhao, G.; Li, J.; Zhang, Y.; Chiew, F. Landscape patches influencing hillslope erosion processes and flow hydrodynamics. Geoderma 2019, 353, 391–400. [Google Scholar] [CrossRef]
- Barbosa-Briones, E.; Cardona-Benavides, A.; Reyes-Hernandez, H.; Munoz-Robles, C. Ecohydrological function of vegetation patches in semi-arid shrublands of central Mexico. J. Arid Environ. 2019, 168, 36–45. [Google Scholar] [CrossRef]
- Zhang, Q.; Wang, Z.; Wu, B.; Shen, N.; Liu, J.E. Identifying sediment transport capacity of raindrop-impacted overland flow within transport-limited system of interrill erosion processes on steep loess hillslopes of China. Soil Till. Res. 2018, 184, 109–117. [Google Scholar] [CrossRef]
- Omidvar, E.; Hajizadeh, Z.; Ghasemieh, H. Sediment yield, runoff and hydraulic characteristics in straw and rock fragment covers. Soil Till. Res. 2019, 194, 104324. [Google Scholar] [CrossRef]
- Rodrigo-Comino, J.; Senciales, J.M.; Sillero-Medina, J.A.; Gyasi-Agyei, Y.; Ruiz-Sinoga, J.D.; Ries, J.B. Analysis of Weather-Type-Induced Soil Erosion in Cultivated and Poorly Managed Abandoned Sloping Vineyards in the Axarquía Region (Málaga, Spain). Air Soil Water Res. 2019, 12, 1–11. [Google Scholar] [CrossRef]
- Rodrigo-Comino, J.; Keesstra, S.; Cerdà, A. Soil Erosion as an Environmental Concern in Vineyards: The Case Study of Celler del Roure, Eastern Spain, by Means of Rainfall Simulation Experiments. Beverages 2018, 4, 31. [Google Scholar] [CrossRef]
- Zhang, G.; Liu, G.; Wang, G.; Wang, Y. Effects of patterned Artemisia capillaris on overland flow velocity under simulated rainfall. Hydrol. Process. 2012, 26, 3779–3787. [Google Scholar] [CrossRef]
- Zhang, G.; Liu, G.; Yi, L.; Zhang, P. Effects of patterned Artemisia capillaris on overland flow resistance under varied rainfall intensities in the Loess Plateau of China. J. Hydrol. Hydromech. 2014, 62, 334–342. [Google Scholar] [CrossRef]
- Pan, D.; Gao, X.; Dyck, M.; Song, Y.; Wu, P.; Zhao, X. Dynamics of runoff and sediment trapping performance of vegetative filter strips: Run-on experiments and modeling. Sci. Total Environ. 2017, 593, 54–64. [Google Scholar] [CrossRef] [PubMed]
- Ramos-Scharron, C.E. Land disturbance effects of roads in runoff and sediment production on dry tropical settings. Geoderma 2018, 310, 107–119. [Google Scholar] [CrossRef]
- Xu, X.; Zheng, F.; Qin, C.; Wu, H.; Wilson, G.V. Impact of cornstalk buffer strip on hillslope soil erosion and its hydrodynamic understanding. Catena 2017, 149, 417–425. [Google Scholar] [CrossRef]
- Bautista, S.; Mayor, A.G.; Bourakhouadar, J.; Bellot, J. Plant spatial pattern predicts hillslope semiarid runoff and erosion in a Mediterranean landscape. Ecosystems 2007, 10, 987–998. [Google Scholar] [CrossRef]
- Vannoppen, W.; De Baets, S.; Keeble, J.; Dong, Y.; Poesen, J. How do root and soil characteristics affect the erosion-reducing potential of plant species? Ecol. Eng. 2017, 109, 186–195. [Google Scholar] [CrossRef]
- Wang, B.; Li, P.P.; Huang, C.H.; Liu, G.B.; Yang, Y.F. Effects of root morphological traits on soil detachment for ten herbaceous species in the Loess Plateau. Sci. Total Environ. 2021, 754, 142304. [Google Scholar] [CrossRef]
- Williams, C.J.; Pierson, F.B.; Robichaud, P.R.; Al Hamdan, O.Z.; Boll, J.; Strand, E.K. Structural and functional connectivity as a driver of hillslope erosion following disturbance. Int. J. Wildland Fire. 2016, 25, 306–321. [Google Scholar] [CrossRef]
- Yu, Y.; Wei, W.; Chen, L.; Feng, T.; Daryanto, S. Quantifying the effects of precipitation, vegetation, and land preparation techniques on runoff and soil erosion in a Loess watershed of China. Sci. Total Environ. 2019, 652, 755–764. [Google Scholar] [CrossRef]
- Feng, J.; Wei, W.; Pan, D. Effects of rainfall and terracing-vegetation combinations on water erosion in a loess hilly area, China. J. Environ. Manag. 2020, 261. [Google Scholar] [CrossRef]


| Bulk Density (g cm−3) | Clay (%) | Silt (%) | Sand (%) | Organic C (g kg−1) |
|---|---|---|---|---|
| 1.34 | 2.3 | 52.01 | 45.69 | 14.59 |
| Landscape Types | The Slope Condition of the Plot | Prophase Water Content (%) |
|---|---|---|
| Random patches | Bare patches and vegetation patches were naturally distributed on the slope | 19.5 ± 0.5 |
| Grid patches | Mosaic distribution of bare patches and vegetation patches with dimensions of 0.25 m × 0.5 m | 20.2 ± 0.2 |
| Horizonal path | Mosaic distribution of bare patches and vegetation patches with dimensions of 0.5 m × 0.5 m | 20.1 ± 0.4 |
| S-road path | A sloping road in the middle of the slope, accounting for 50% of the total plot area | 19.6 ± 0.6 |
| Bare land | An absence of vegetation on the slope surface | 19.8 ± 0.4 |
| Matts (15) | Mosaic distribution of bare patches and vegetation patches with dimensions of 0.17 m × 0. 5 m | 19.6 ± 0.4 |
| Matts (20) | Mosaic distribution of bare patches and vegetation patches with dimensions of 0.125 m × 0.5 m | 19.8 ± 0.5 |
| Treatment/ Patches Number | Runoff | Sediment | |||||
|---|---|---|---|---|---|---|---|
| Starting Time (min) | Total Volume (L) | Average Rate (mm/min·m2) | Steady Rate (mm/min·m2) | Total Amount (g) | Sediment Concentration (g/L) | Rate (g/min·m2) | |
| Bare soil | 0.76 ± 0.04 (c) | 126.98 ± 2.32 (a) | 0.737 ± 0.023 (a) | 0.999 ± 0.014 (a) | 3953.17 ± 56.89 (a) | 17.65 ± 0.28 (a) | 26.22 ± 1.33 (a) |
| S-road patches | 0.89 ± 0.03 (c) | 96.85 ± 0.69 (b) | 0.558 ± 0.023 (b) | 0.838 ± 0.027 (b) | 2376.461 ± 0.883 (b) | 13.091 ± 0.443 (b) | 15.17 ± 0.55 (b) |
| Strips patches | 1.89 ± 0.06 (b) | 64.31 ± 1.02 (c) | 0.372 ± 0.014 (c) | 0.504 ± 0.016 (c) | 1357.58 ± 1.27 (c) | 9.09 ± 0.20 (c) | 8.34 ± 0.23 (c) |
| Grids patches | 1.72 ± 0.03 (b) | 60.72 ± 1.55 (c) | 0.353 ± 0.014 (c) | 0.486 ± 0.029 (c) | 1220.16 ± 23.47 (c) | 9.39 ± 0.23 (c) | 7.54 ± 0.35 (c) |
| Random patches | 2.48 ± 0.07 (a) | 47.77 ± 3.28 (d) | 0.273 ± 0.022 (d) | 0.414 ± 0.011 (d) | 598.53 ± 63.35 (d) | 4.85 ± 1.03 (d) | 3.53 ± 0.38 (d) |
| Treatment/Patches Number | Flow Velocity (v, cm/s) | Flow Depth (h, mm) | Reynolds Number (Re) | Froude Number (Fr) | Darcy-Weisbach Resistance (f) | Manning Roughness (n) | Flow Shear Stress (τ, Pa) | Stream Power (W, w/m2) |
|---|---|---|---|---|---|---|---|---|
| Bare soil | 5.66 ± 0.01 (a) | 1.24 ± 0.02 (a) | 70.04 ± 1.28 (a) | 0.54 ± 0.01 (a) | 7.72 ± 0.12 (c) | 0.102 ± 0.001 (c) | 10.20 ± 0.14 (a) | 0.189 ± 0.003 (a) |
| S-road patches | 4.94 ± 0.00 (b) | 1.08 ± 0.00 (b) | 53.23 ± 0.19 (b) | 0.51 ± 0.00 (a) | 8.86 ± 0.03 (c) | 0.106 ± 0.000 (bc) | 7.02 ± 0.01 (b) | 0.144 ± 0.001 (b) |
| Strips patches | 4.02 ± 0.00 (c) | 0.89 ± 0.01 (c) | 35.48 ± 0.56 (c) | 0.46 ± 0.00 (b) | 11.05 ± 0.16 (b) | 0.115 ± 0.001 (b) | 4.92 ± 0.00 (c) | 0.096 ± 0.002 (c) |
| Grids patches | 4.00 ± 0.02 (c) | 0.84 ± 0.03 (c) | 33.50 ± 0.86 (c) | 0.47 ± 0.01 (b) | 10.62 ± 0.41 (b) | 0.112 ± 0.003 (b) | 4.45 ± 0.10 (c) | 0.090 ± 0.002 (c) |
| Random patches | 3.02 ± 0.03 (d) | 0.87 ± 0.05 (c) | 26.35 ± 1.81 (d) | 0.36 ± 0.02 (c) | 19.22 ± 0.73 (a) | 0.150 ± 0.005 (a) | 2.88 ± 0.27 (d) | 0.071 ± 0.005 (d) |
| Patches Number | Runoff | Sediment | |||||
|---|---|---|---|---|---|---|---|
| Starting Time (min) | Total Volume (L) | Average Rate (mm/min·m2) | Steady Rate (mm/min·m2) | Total Amount (g) | Sediment Concentration (g/L) | Rate (g/min·m2) | |
| 5 | 1.89 ± 0.06 (bc) | 64.31 ± 1.02 (a) | 0.372 ± 0.014 (a) | 0.504 ± 0.016 (a) | 1357.58 ± 1.27 (a) | 9.09 ± 0.20 (a) | 8.34 ± 0.23 (a) |
| 10 | 1.72 ± 0.03 (b) | 60.72 ± 1.55 (ab) | 0.353 ± 0.014 (b) | 0.486 ± 0.029 (ab) | 1220.16 ± 23.47 (b) | 9.39 ± 0.23 (a) | 7.54 ± 0.35 (b) |
| 15 | 1.95 ± 0.05 (b) | 57.18 ± 0.46 (bc) | 0.333 ± 0.009 (c) | 0.445 ± 0.011 (ab) | 1085.45 ± 2.75 (c) | 7.71 ± 0.42 (b) | 6.58 ± 0.21 (c) |
| 20 | 2.25 ± 0.07 (a) | 53.30 ± 1.04 (c) | 0.309 ± 0.008 (d) | 0.427 ± 0.009 (b) | 977.69 ± 0.50 (d) | 7.57 ± 0.44 (b) | 5.90 ± 0.17 (d) |
| Treatment/Patches Number | Flow Velocity (v,cm/s) | Flow Depth (h,mm) | Reynolds Number (Re) | Froude Number (Fr) | Darcy-Weisbach Resistance (f) | Manning Roughness (n) | Flow shear Rtress (τ,Pa) | Stream Power (W,w/m2) |
|---|---|---|---|---|---|---|---|---|
| 5 | 4.02 ± 0.00 (a) | 0.89 ± 0.01 (a) | 35.48 ± 0.56 (a) | 0.46 ± 0.00 (a) | 11.05 ± 0.16 (bc) | 0.117 ± 0.0001 (bc) | 2.37 ± 0.04 (a) | 0.096 ± 0.002 (a) |
| 10 | 4.00 ± 0.02 (a) | 0.84 ± 0.03 (a) | 33.50 ± 0.86 (a) | 0.47 ± 0.01 (a) | 10.62 ± 0.41 (c) | 0.114 ± 0.0003 (c) | 2.25 ± 0.07 (b) | 0.090 ± 0.002 (a) |
| 15 | 3.77 ± 0.01 (b) | 0.84 ± 0.01 (a) | 31.54 ± 0.25 (b) | 0.44 ± 0.00 (b) | 11.95 ± 0.23 (b) | 0.121 ± 0.0001 (b) | 2.25 ± 0.03 (c) | 0.085 ± 0.001 (ab) |
| 20 | 3.49 ± 0.00 (c) | 0.85 ± 0.02 (a) | 29.40 ± 0.57 (b) | 0.41 ± 0.00 (c) | 13.99 ± 0.29 (a) | 0.130 ± 0.0002 (a) | 2.27 ± 0.05 (c) | 0.079 ± 0.001 (b) |
| Treatment/Patches Number | Regression Function | R2 | p |
|---|---|---|---|
| Bare land | 0.875 | <0.01 | |
| S-road patches | 0.925 | <0.01 | |
| Strips patches | 0.965 | <0.01 | |
| Grids patches | 0.982 | <0.01 | |
| Random patches | 0.961 | <0.01 | |
| 5 | 0.965 | <0.01 | |
| 10 | 0.982 | <0.01 | |
| 15 | 0.986 | <0.01 | |
| 20 | 0.984 | <0.01 |
Publisher’s Note: MDPI stays neutral with regard to jurisdictional claims in published maps and institutional affiliations. |
© 2020 by the authors. Licensee MDPI, Basel, Switzerland. This article is an open access article distributed under the terms and conditions of the Creative Commons Attribution (CC BY) license (http://creativecommons.org/licenses/by/4.0/).
Share and Cite
Sun, R.; Ma, L.; Zhang, S.; Yu, Y.; Shen, M.; Zhang, H.; Wang, D.; Yang, Y.; Zhang, J.; Zhang, Y.; et al. Study on Landscape Patches Influencing Hillslope Erosion Processes and Flow Hydrodynamics in the Loess Plateau of Western Shanxi Province, China. Water 2020, 12, 3201. https://doi.org/10.3390/w12113201
Sun R, Ma L, Zhang S, Yu Y, Shen M, Zhang H, Wang D, Yang Y, Zhang J, Zhang Y, et al. Study on Landscape Patches Influencing Hillslope Erosion Processes and Flow Hydrodynamics in the Loess Plateau of Western Shanxi Province, China. Water. 2020; 12(11):3201. https://doi.org/10.3390/w12113201
Chicago/Turabian StyleSun, Ruoxiu, Li Ma, Shouhong Zhang, Yang Yu, Mingshuang Shen, Haibo Zhang, Dandan Wang, Yunbin Yang, Jianan Zhang, Yizhou Zhang, and et al. 2020. "Study on Landscape Patches Influencing Hillslope Erosion Processes and Flow Hydrodynamics in the Loess Plateau of Western Shanxi Province, China" Water 12, no. 11: 3201. https://doi.org/10.3390/w12113201
APA StyleSun, R., Ma, L., Zhang, S., Yu, Y., Shen, M., Zhang, H., Wang, D., Yang, Y., Zhang, J., Zhang, Y., & Zhang, J. (2020). Study on Landscape Patches Influencing Hillslope Erosion Processes and Flow Hydrodynamics in the Loess Plateau of Western Shanxi Province, China. Water, 12(11), 3201. https://doi.org/10.3390/w12113201