Article

Wastewater Treatment Plant Assessment by Quantifying the Carbon and Water Footprint

by
Eva Gómez-Llanos
,
Agustín Matías-Sánchez
and
Pablo Durán-Barroso
*
Department of Construction, School of Technology, University of Extremadura, Avda. de la Universidad s/n, 10003 Cáceres, Spain
*
Author to whom correspondence should be addressed.
Water 2020, 12(11), 3204; https://doi.org/10.3390/w12113204
Submission received: 30 September 2020 / Revised: 31 October 2020 / Accepted: 11 November 2020 / Published: 16 November 2020
(This article belongs to the Special Issue New Perspectives on Water and Energy Nexus)

Abstract

:
In the context of efficient and sustainable management of the elements of the urban water cycle as an aim of the Water Framework Directive (WFD), the evaluation of indicators such as the water footprint (WF) and the carbon footprint (CF) in a wastewater treatment plant (WWTP) provides a quantification of the environmental impact, both negative and positive, which implies its exploitation. In this study, in addition to WF and CF quantification, a joint evaluation of both indicators was conducted. Consumption is indicated by the blue water footprint (WFBlue) and emissions by CF. Both are related to the operational grey water footprint (∆WFG,mef) in two ratios, WFR and CFR. In this way, the water consumed and gases emitted are measured according to the reduction range of the pollutant load of the discharge. The results for four WWTPs show operational scenarios for better management in accordance with the WFD.

Graphical Abstract

1. Introduction

Directive 2000/60/EC, known as the Water Framework Directive (WFD), establishes a legal basis for the protection of water bodies in all European Union member states. To this purpose, WFD challenges water resource managers to work on the evaluation and sustainable management of the water cycle, in which wastewater treatment plants (WWTPs) have a crucial role [1]. Sustainability assessment of WWTPs through indicators such as those collected in the environmental footprint family [2] is vital to identify the impact of WWTPs on the environment and to improve the process towards cleaner, and more sustainable production [3]. Footprint assessment methods clearly and easily identify, describe and quantify the complexity of water-related impact associated with wastewater management [4].
The water footprint (WF) and the carbon footprint (CF) are the most commonly used indicators to assess the sustainability of WWTPs [5]. The concept of WF responds to the need for an indicator of freshwater consumption [6]. WF measures the volume of water consumed directly and indirectly to manufacture a product or provide a service [7]. It is a multidimensional indicator with three sub-indicators: blue water footprint (WFBlue) refers to the consumption of surface and groundwater; green water footprint (WFGreen) measures the consumption of rainwater stored in the soil, and grey water footprint (WFGrey) refers to pollution and defines the volume of fresh water needed to assimilate the pollutant load based on the required water quality standards [7]. The Water Footprint Network (WFN) has developed the Water Footprint Assessment (WFA) tool, which is the most widely used methodology for the evaluation of WF [7]. The introduction of the ISO 14046 standard [8] resulted in other methods to evaluate WF based on life cycle assessment (LCA) to quantify potential environmental impacts related to water. In the recently published Available Water Remaining (AWARE) method [9], the water consumption impact indicator helps to assess the water scarcity footprint according to LCA [10]. For its part, CF measures the total amount of greenhouse gas (GHG) emissions, which are directly and indirectly caused by activity and quantified as carbon dioxide equivalent per unit of time [2]. CF is the indicator of the global warming impact category of LCA [11,12]. Both footprints should be considered complementary to each other since each one focuses on different aspects of environmental issues in the evaluation of a service [13].
Chen et al. [5] performed a literature review regarding the application of footprints in WWTPs, with reviews of 27 studies published on CF and WF assessments in WWTPs. This study showed that the main advantage was that footprint quantification requires a small data size and both footprints provide an intuitive common language to highlight specific issues [5,14]. However, some limitations related to WFGrey in terms of the diffusion of pollutants are highlighted in a recent study [15]. Furthermore, stochastic approximations, such as the Monte Carlo method, increase the reliability of this methodology [16].
Regarding CF, it has been pointed out that researchers have not presented substantial modifications to CF evaluations [5]. Consequently, an analysis found that electricity consumption is the main contributor to WFBlue, and nitrous oxide directly to CF [5]. As a future challenge to the evaluation of WWTP footprints, the energy–water–carbon nexus is an emerging research topic in which researchers seek to understand the social, environmental and economic impacts through the supply chains [5].
Regarding the application of WF in WWTPs, a study by Morera et al. [17] was the first to use WFA [7] to evaluate the consumption of water resources in WWTPs. Morera et al. [17] illustrated the utility of WF for assessing the environmental impact and beneficial role of a WWTP in a river. Additionally, as is also indicated in the conclusions, these authors considered the benefits of complementing WFA with other environmental impact assessment methodologies, such as LCA. On the one hand, the definition of the grey water footprint in the WF methodology, which not appear in LCA, provides complementary information on effluent water quality and reduced pollutant efficiency in WWTPs. On the other hand, LCA evaluates the environmental impact (eutrophication, global warming, etc.) of the WWTP operation phase. Gu et al. [18] defined the reduction in grey water footprint indicator. This indicator reflects the purification function of the WWTP, and the reduction in grey water footprint is the minimum volume required in the plant to reduce the concentration of raw water to the output concentration. Gómez-Llanos et al. [19] defined an indicator called the operational grey water footprint, which considers, besides the influent and effluent concentrations from the WWTP, the concentrations established by the corresponding regulations. In this way, the operational grey footprint indicates the safety margin, in terms of virtual freshwater volume, required to assimilate pollutants at the discharge point in compliance with the limits established by the regulations.
Regarding the evaluation of the CF in the field of wastewater treatment, CF quantification through LCA extends the methodology in its application in WWTPs. The existing bibliography is very extensive, on knowledge of the environmental impacts of WWTP operation [20], studies on WWTPs in Galicia (Spain) [21,22], on the search for more environmentally sustainable treatment techniques [23] and on defining the eco-efficiency of wastewater plant management [24], including a review of the state of knowledge [25]. This study detailed the limitations of LCA in WWTPs: the definitions of the functional unit and system limits, the selection of the methodology for evaluating the impact and the procedure for interpreting the results.
An environmental assessment of several indicators independently in a WWTP was carried out by Teodosiu et al. [4] through three methodologies: LCA, environmental impact quantification (EIQ) and WFA. The authors concluded that LCA is limited in analysing how well the discharge complies with regulations, since there is no correlation between its impact values and legal references. The other two methodologies (EIQ and WFA) link environmental impact directly with legal requirements. Regarding WFA, WFGrey is the only indicator considered in their study, and it is defined as a dilution factor [4]. This definition combines the effluent concentration from the WWTP (cef), the maximum concentration allowed (cmax) and the concentration in the receiving environment upstream and downstream of the WWTP (cnat) [4], similar to others studies, such as [15,16].
In contrast, Morera et al.’s [17] study did not consider the upstream concentration of the discharge point (cnat). Gu et al. [18] quantified the reduction in the greywater footprint from the influent (cr) and effluent concentrations of the WWTP. Gómez-Llanos et al. [19] considered the operational grey water footprint in addition to the effluent and influent concentration from the WWTP and the maximum concentration allowed.
The objective of this paper is to develop and apply a joint methodology for the evaluation of WF and CF in four WWTPs located in La Vera (Cáceres, Spain). Previous studies in this regard are scarce, particularly those applied to WWTPs. The WF evaluation is based on the WFA, particularly the operational grey water footprint [19], and CF is estimated as an indicator of global warming in LCA. In this way, we quantify the merged relationships between water quality and the resources necessary for their treatment. The efficiency of this process is evaluated through two new ratios in which the WF and CF are related: the water footprint ratio (WFR) and the carbon footprint ratio (CFR). These ratios, defined in this study, in addition to assessing efficiency, allow comparisons between different plants subjected to various circumstances.
Therefore, this study contributes to the development of the application of footprint assessment methodologies, in this case WF and CF, in a WWTP. The proposed methodology, based on the two ratios, enables quantifying the connection between consumption or impact as defined by the WFBlue and CF, and the operational management margin necessary to comply with the regulations, considering the working concentrations of the WWTP and the values of the receiving environment, both of which are established by the regulations as well as those existing in the receiving water body.

2. Proposed Methodology

As noted above, the assessment of the WF is considered the WFA methodology [7], and CF is evaluated as an indicator of the impact of global warming established in LCA [11,12].
According to both methodologies, it is necessary to define the physical and temporal boundaries of the studied systems and functional unit. As shown in Figure 1, the edges of the supply chain studied include different WWTP processes: the water line, made up of pre-treatment, primary, secondary or biological treatment, and possible tertiary treatment; the sludge line, where primary and secondary sludges are treated, including a possible biogas line. In each step, water is consumed or used, and GHG emissions are produced, either directly or indirectly. Figure 1 shows these consumption and emission sources; for instance, the indirect water consumption associated with energy consumption, which is included in WFBlue or direct GHG emissions produced in biological treatment, which is considered in CF. The functional unit adopted is the volume of treated water during one month of operation.
In the four WWTPs studied, the treatment of wastewater is a conventional biological process (activated sludge), and tertiary treatment is not necessary. The sludge treatment is thickening and involves physical centrifugation, without stabilisation based on aerobic or anaerobic digestion; for instance, the gas line does not exist. The final sludges are applied outside the plants in agricultural parcels.

2.1. Water Footprint Assessment in WWTPs

2.1.1. Blue Water Footprint as a Consumption Indicator

WFBlue, according to the WFA Manual [7], is defined as the volume of freshwater consumed directly and indirectly in all processes of the supply chain of a product or service; that is, the volume of water that is incorporated into the final product or by-products, the water evaporated during the process and the lost flow [7].
In the case of a WWTP, WFBlue for the period of time considered responds to Equation (1):
WF Blue = WF Elect + WF Chem + Volume Sludge + Volume Evap .
where, for the period of time considered (t), WFBlue (m3/t) is the total blue water footprint, WFElect (m3/t) the blue water footprint due to electricity consumption, WFChem (m3/t) the blue water footprint due to the consumption of products derived from the risk of purification, VolumeSludge (m3/t) is the volume of freshwater incorporated into the sludge produced by the operation of the treatment plant and VolumeEvap (m3/t) is the volume of water evaporated in the biological reactors, decanters and storm tanks of the secondary WWTP process.
WFElect was evaluated with the conversion factor of ECOINVENT 3.0 used by Morera et al. [17], Gómez-Llanos et al. [19] and Martínez-Alcalá et al. [26]. A lack of data on chemicals consumed prevented assessment of WFChem. As for the WWTP sludge considered in VolumeSludge, the WFBlue calculated in this by-product is the volume of water embedded in said product; that is, the volume of water present in the extracted sludge when it is dehydrated. In our WWTPs, the dehydration phase was carried out by the centrifugation process, and the percentage of dry matter in the final removed sludge is, on average, 23%. That is, the average percentage of water content of the sludge is 77%. VolumeEvap was estimated based on the Penman–Monteith method, applied to quantify natural evaporation from open water surfaces [27].

2.1.2. Grey Water Footprint as an Efficiency Indicator

In this paper, WFGrey is evaluated based on the WFA and a previous study [19]. Considering WFGrey as dilution factor to express the efficiency of the treatment, the operational grey water footprint, ∆WFG,mef, defined by Gómez-Llanos et al. [19], enables the evaluation of the WTTP operation, according to Equation (2), depending on the value of this operational index:
WF G , mef = Q r c r ( c max c ef ) c max c ef .
where Q r is the volume of treated water in a period of time (volume/time), cr and cef are the concentrations of the respective pollutant measured in the WWTP influent and effluent, respectively (mass/volume), cmax is the concentration of the respective pollutant allowed by the standard (mass/volume) and cnat is the concentration of the respective pollutant measured in the receiving body of water (mass/volume).
As can be seen from Figure 2, for the current scenario, where the concentration of effluent (cef) is lower than the concentration allowed by the standard (cmax), ∆WFG,mef results in a positive value, which indicates a higher limit in WWTP management. In a scenario with equal flow and standard concentration values, an increase in ∆WFG,mef benefits the receiving environment, since the level of required self-purification of biodegradable pollutant discharge is reduced. In the scenario with discharge over the concentration by the standard, ∆WFG,mef is a negative value, which would indicate non-compliance with the legal standard. WWTP managers are interested in rigorous compliance with the discharge requirement, especially if it reduces WFBlue. In this scenario, ∆WFG,mef is null or has positive value close to zero.

2.2. Carbon Footprint Assessment in WWTP

CF is the indicator of the global warming impact category in LCA. CF is measured as CO2 equivalent mass per unit of time. To quantify CF, it is necessary to establish the sources of the GHG emissions and the corresponding conversion factors, which were obtained from the characterisation models developed by other authors. The total CF is the sum of the CF of each emission source, as indicated in Equation (3):
CF =   Em i F i .
where, for the period of time considered (t), CF (kg CO2/t) is the total carbon footprint, Emi (unit/t) is the value of emission source i and Fi (kg CO2/unit) is the conversion factor for emission source i.
In a WWTP, direct emissions are produced especially in secondary treatment. In this biological treatment, the GHGs emitted are methane (CH4) and nitrous oxide (N2O). The estimate of GHGs is quantified based on the proposed methodology by the Intergovernmental Panel on Climate Change [28]. Indirect sources of GHG emissions are the electrical consumption of the plant and the treatment of the sludge obtained. The required data to estimate CF and the references for the considered emission factors are in Table 1.

2.3. Joint Assessment of WF and CF in WWTP

For the joint assessment of the WF and CF, two new relations were defined: the WF ratio (WFR) and the CF ratio (CFR).
The relationship of the blue water footprint with the operational grey water footprint [19] is defined as the water footprint ratio, expressed in Equation (4):
WFR = Δ WF G , mef WF Blue ,   with   Δ WF G , mef > 0
where ∆WFG,mef is operational grey water footprint (m3/time) and WFBlue is blue water footprint (m3/time).
WFR is dimensionless and establishes the relationship of the volume of water consumed directly or indirectly with the purification function in a WWTP. With this ratio, the efficiency with which the plant reduces the wastewater pollutant load is quantified up to the WWTP output parameters based on the water consumption made for it. That is the ratio of the volume of water required to carry out the purification function of the plant.
If the operational grey water footprint indicator is related to the CF, the carbon footprint ratio (CFR) is defined by Equation (5). CFR indicates the purification function in a WWTP concerning the environmental impact in terms of GHG emissions.
CFR = Δ WF G , mef CF ,   with   Δ WF G , mef > 0
where ∆WFG,mef is the operational grey water footprint (m3/time) and CF is the carbon footprint (kg CO2-eq/time), and K is equal to the unit kg CO2-eq per cubic meter and is used so that CFR is dimensionless.
Figure 3 shows a scheme with the variation in the base indicators (∆WFG,mef, WFBlue and CF) of Equations (4) and (5) for the determined period of operation in a WWTP (ORt) and an estimate of the life period. The range of variation of ∆WFG,mef in the life period of the WWTP with proper operation could cover from ∆WFG,mef with a value of zero, with effluent concertation equal to the maximum legal concentration (cef ≈ cmax, ∆WFG,mef ≈ 0), to ∆WFG,mef, with a value of effluent concentration equal to natural concentration (cef ≈ cnat, ∆WFG,mef > 0) for a specific contaminant in the aqueous receiving medium. The variation of the determined life period studied is actually restricted at the interval marked with ORt in Figure 3. Considering WFBlue or CF variation during the lifetime of the WWTP, the range could be defined by unknown upper and lower limits, WFBlue,min and WFBlue,Max, and similarly CFMin and CFMax. This interval would be measured during a specific period of time, ORt in Figure 3.
Throughout the operating life of the WWTP, ∆WFG,mef value a could decrease to zero, with cef equal to cmax, and value b would be the maximum of ∆WFG,mef when cef is similar to cnat. For the CF and WFBlue values, c would reach an unknown minimum value marked by the fixed consumption of the WWTP, and finally, d would be the unknown maximum value of these indicators.
In this way, WFR should be defined for the different scenarios as:
WFR GE = b c , WFR GM = a c   ,   WFR PE = a d   ,   WFR OS = b d
In general, Equation (6) is verified:
WFR PE < WFR GM < WFR OS < WFR GE
CFR would be expressed similarly to Equations (6) and (7).
Therefore, for the particular time under study, as the values obtained are approximately those defined in Equation (6), the operation of the WWTP would be estimated from the environmental and managerial point of view for both the best and worst scenario.
Figure 4 shows a summary of the ∆WFG,mef, WFBlue and CF values corresponding to the descriptions of different scenarios identified.
From the management point of view, the operating scenario is defined as the maximum values of both indicators, WFBlue or CF and ∆WFG,mef, where the necessary measures must be studied and established to reduce the negative impact on the environment indicated by WFBlue and CF with the least damage to the operating range. Operating with low ∆WFG,mef values, even close to zero, would be enough, since the discharge would continue to comply with the regulations. Operating with smaller WFBlue and CF values would be more appropriate. This scenario is defined as the good operating limit for managers.
From an environmental point of view, operating with high ∆WFG,mef values near the limit established by cnat is more beneficial, since WWTP discharge would require less self-purification volume. Operating with smaller WFBlue and CF values would be more appropriate. This limit is the good environmental performance limit (GE).
The poor environmental performance limit is defined with maximum WFBlue and CF values and minimum ∆WFG,mef values. This scenario indicates a negative impact on the environment characterised by WFBlue and CF, and a higher volume of self-purification required by being an adjusted value of ∆WFG,mef.

3. WWTPs Data Inventory

The WF and CF were evaluated in four WWTPs located in the La Vera region, northeast of Extremadura (SW Spain), which serve several municipalities (Table 2). The WWTPs are (1) Aldeanueva de la Vera and Cuacos de Yuste, (2) Arroyomolinos, Pasarón de la Vera and Tejeda de Tiétar, (3) Villanueva de la Vera and Valverde de la Vera and (4) Torremenga.
The four WWTPs were designed for different treatment capacities, specifically different equivalent population (EP) values, as shown in Table 2. The inventory data were extracted from the quarterly reports by their management company. In these reports, daily and monthly data of each WWTP are collected. The temporal boundary was the operational period from January 2014 to December 2016. The assessment was conducted considering the monthly data of the four WWTPs. By way of a summary, Table 2 shows the monthly average of the studied period of treated flow and electricity consumption, and Table 3 shows the average monthly concentrations at the entry and exit of each WWTP.
The maximum concentration (cmax) values for the main pollutants analysed (biochemical oxygen demand at five days (BOD5), total nitrogen (TN) and total phosphorus (TP)) were obtained from Directive 91/271/EEC and its transposition to Spanish legislation in Royal Decree-Law 11/1995. The Royal Decree-Law establishes the standards applicable to urban wastewater treatment and the limit concentrations for BOD5, total nitrogen and total phosphorus, shown in Table 3.

4. Results and Discussion

4.1. WF Assessment

Table 4 shows the average values of WFBlue per cubic metre of treated water for the four WWTPs in the studied period (2014 to 2016). These values represent the freshwater consumed in the operation phase of each WWTP to purify the discharge. As can be seen in Table 4, the four plants had their highest consumption in 2015, as indicated by WFBlue. Torremenga WWTP had its highest WFBlue value in 2015 (1.37 m3·month−1 /m3 on average, as shown in Table 4). On average, Torremenga is the plant with the most water consumption despite being the smallest (933 PE).
The year with the lowest water consumption of all WWTPs was 2016, except Cuacos, where the lowest water consumption was in 2014. The average value for the three studied years for the WWTPs is 0.78 m3 per metre of treated water.
The purification function of plants is defined by the indicator ∆WFG,mef. In general, for the four WWTPs studied and three pollutant parameters analysed, the study scenario was that in which those parameters are above the values established by existing legislation. Figure 5 shows average values of ∆WFG,mef per cubic metre of treated water to three pollutant parameters analysed. In general, TN and TP concentrations show lower values than BOD5 in the three years for the four WWTPs. For example, BOD5 ∆WFG,mef at Cuacos was 9.41 m3 per cubic metre of water treated in 2014, versus to TN and TP with ∆WFG,mef values of 2.42 and 6.62 m3 per cubic metre cubic of water treated, respectively. Therefore, TN and TP concentrations have a more limited reduction margin with regard to the values established by the standard, similar to what was observed by Chen et al. [5].
The highest ∆WFG,mef values for BOD5 were in 2015. Figure 5 also shows that, in general, ∆WFG,mef increased significantly in 2015 in the Cuacos, Tejeda and Villanueva WWTPs. On the other hand, ∆WFG,mef decreased in 2014 in the Tejeda, Villanueva and Torremenga WWTPs, which indicates operations with a lower operational margin.

4.2. CF Assessment

Table 5 shows the results obtained for CF per cubic metre of treated water in the four WWTPs. As can be appreciated, the year with the highest GHG emissions was 2015 for all WWTPs; for example, 0.52 kg CO2/m3 for Cuacos. Tejeda had the lowest CF values in the three years under study.
The average value for the three studied years for the WWTPs is 0.28 kg CO2/m3, similar to that obtained by Lorenzo-Toja et al. [24], who analysed 22 treatment plants in Spain by LCA, getting a value of 0.278 kg CO2 /m3 for plants with biological treatment of active sludge.

4.3. WFR and CFR Analysis

Figure 6 shows 4 of the 24 possible schemes in which ∆WFG,mef (to BOD5, TN and TP), WFBlue and CF were related for the four WWTPs during the period analysed. The selected schemes correspond to assessment of TN and TP pollutants at Cuacos.
As can be seen in Figure 6, the performance of WFR and CFR is similar for TP and TP, respectively. This is a consequence of the similar evolution of annual values of CF and WFBlue. As can be seen in Table 4 and Table 5, both indicators showed similar growth, with a steeper slope for WFBlue, and the CF value is approximately constant. CF and WFBlue have a strong relationship with electricity consumption. Similar to the results reported by Gómez-Llanos et al. [19] and Chen et al. [5], the main factor in WFBlue assessment is electricity consumption. However, the primary emission source in CF assessment of the four WWTPs studied is CH4, with electricity consumption as the second factor, similar to Hospido et al. [22].
Figure 6a,c show the relationships among values of TN ∆WFG,mef and WFBlue and CF, respectively. The scenario of 2014 was from an environmental point of view, not only by lower water consumption as indicated by WFBlue, but also by the highest value of TN ∆WFG,mef. In contrast, 2016 could be considered a beneficial scenario from the business point of view, with a WFBlue value close to the minimum and rigorous compliance with the legal standards. The operational scenario (OS) indicates the reduction in water consumption, as indicated for 2015.
Figure 6b,d indicate the relationships among values of TP ∆WFG,mef and WFBlue and CF, respectively. For this contaminant, 2016 could be considered a beneficial scenario from the business point of view. However, a good environmental scenario is not identified, since the highest TP ∆WFG,mef value was produced with the highest WFBlue and CF value in 2015.
Next, the WFR and CFR values representing the different operating limit scenarios are assessed based on the analysis carried out in Figure 6 for each WWTP. Table 6 shows the rates for each year and WWTP. The highlighted cells with a coloured background show some of the situations of better or worse operation of WWTPs from the environmental or managerial point of view.
As can be seen in Table 6, from an environmental point of view, the values corresponding to proper operation give the highest WFR and CFR values for TN and TP in 2014–2016. There are situations where this scenario has not been identified: WFR and CFR of TP at Cuacos and WFR and CFR of TP and TN at Torremenga. In both cases, the highest value cannot be clearly categorised as an excellent environmental limit, since WFBlue and CF were not near the minimum in 2014. From the management point of view, the cases where the better operation of the WWTP is observed the tendency is to generate intermediate values of WFR and CFR for TN and TP.
Regarding BOD5, the highest value of WFR and CFR are linked to the operational scenario to reduce consumption (OS), and both indicators, WFBlue and CF and ∆WFG,mef, are the maximum values for the period studied. This situation was investigated to evaluate the possibility of decreasing the environmental impact in correlation with the allowed diminution in the operating margin. In the four WWTPs studied, the OS was in 2015.
Poor environmental limit was obtained with the lowest rates of WFR and CFR for TP and TP in the period analysed (Table 6). In cases where the better operation of the WWTP is observed according to the manager, the tendency is the generation of intermediate WFR and CFR values for TN and TP and a minimum BOD5 value (Table 6).

5. Conclusions

A joint evaluation of water and carbon footprint in a municipal wastewater treatment service of highlights the following aspects:
  • The operation and exploitation of WWTPs cause environmental impact, which is quantified by WFBlue, at 0.78 m3 per cubic metre of water treated on average, and CF, at 0.28 kg CO2/m3 for the four WWTPs. However, WWTPs have a positive impact on the environment; the reduction in the pollution load in the discharge as indicated by ∆WFG,mef is better than the strict reduction established by the regulations in the four WWTPs in the period studied.
  • In the four WWTPs, the values of ∆WFG,mef revealed a high operational margin in the elimination of BOD5. Instead, there is a lower operational range of the total nitrogen and total phosphorous pollutant parameters. For example, BOD5 ∆WFG,mef at Cuacos was 9.41 m3 per cubic metre of water treated in 2014, compared to ∆WFG,mef values of 2.42 and 6.62 m3 per cubic metre cubic of water treated for TN and TP, respectively.
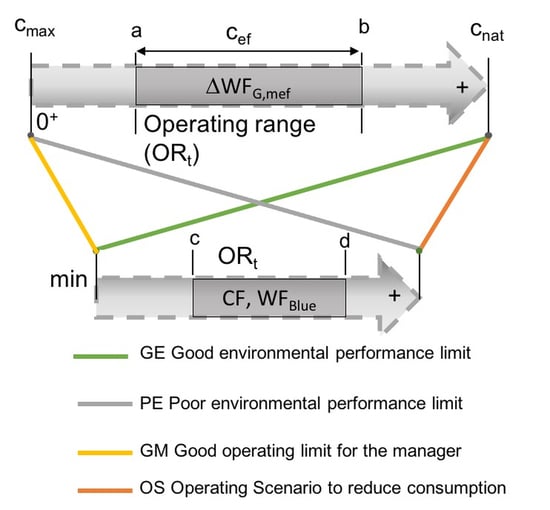
  • The proposed WFR and CFR ratios indicate optimal operational scenarios from an environmental or managerial point of view. The highest values of WFR and CFR for TN and TP belong to the best scenario for the environment. In cases where better operation of the WWTP is observed, according to the manager, the tendency is to generate intermediate values of WFR and CFR for TN and TP.
  • Poor environmental scenarios, taking into account the criteria of managers, show the lowest rates of WFR and CFR for TN and TP in the period of time analysed.
  • Regarding BOD5, the highest WFR and CFR values are found in a scenario where the possibility of decreasing the environmental impact in correlation with the allowed reduction in the operation range was investigated. In the four WWTPs studied, this scenario happened in 2015.
The application limitations of the proposed methodology will be derived mainly from the compilation of the necessary data, as well as from the estimation of the factors associated with the blue water footprint evaluation linked to energy consumption or the calculation of the carbon footprint.
This study, together with previous works, establishes a new framework for multidisciplinary decision-making that combines water use, consumption and environmental impacts. Regarding the evaluation of footprints in a WWTP, the future development of the water footprint, mainly the gray water footprint, plays a relevant role in the study of the implication of a WWTP in the receiving environment and its capacity for self-purification.

Author Contributions

Conceptualisation, E.G.-L. and A.M.-S.; methodology, E.G.-L. and A.M.-S.; formal analysis, E.G.-L. and P.D.-B.; investigation, E.G.-L., resources, P.D.-B.; data curation, P.D.-B.; writing—original draft preparation, E.G.-L., writing—review and editing, P.D.-B. and A.M.-S.; supervision, A.M.-S. All authors have read and agreed to the published version of the manuscript.

Funding

This study was funded by the Government of Extremadura and the European Regional Development Fund, Una manera de hacer Europa, through GR18092 and GR18122 support. The authors would also like to thank the Department of Construction (School of Technology, University of Extremadura) for funding the English review process conducted by MDPI services.

Acknowledgments

The authors acknowledge the data transfer from Ambling Ingeniería y Servicios S.L.

Conflicts of Interest

The authors declare no conflict of interest.

Abbreviations

BOD5Biochemical oxygen demand at five days
cefConcentration of respective pollutant measured in WWTP effluent
cmaxConcentration of respective pollutant allowed by the standard
cnatConcentration of respective pollutant measured in receiving body of water
crConcentration of the respective pollutant measured in WWTP influent
CFCarbon footprint
CFRCarbon footprint ratio
CH4Methane
EPEquivalent population
GEGood environmental performance limit
GHGGreenhouse gas emissions
GMGood managerial performance limit
IPCCIntergovernmental Panel on Climate Change
N2ONitrous oxide
OSOperational Scenario
PEPoor environmental performance limit
QrInfluent volume per unit of time
TNTotal nitrogen
TPTotal phosphorus
VolumeEvapVolume of water evaporated per unit of time
VolumeSludgeVolume of freshwater incorporated into sludge per unit of time
WFWater footprint
WFBlueBlue water footprint
WFElectBlue water footprint due to electricity consumption
WFChemBlue water footprint due to chemical consumption
WFGreenGreen water footprint
WFGreyGrey water footprint
∆WFG,mefOperational grey water footprint
WFDWater framework directive (Directive 2000/60/EC)
WFRWater footprint ratio
WWTPWastewater treatment plant
Cuacos WWTPLocated in Aldeanueva de la Vera and Cuacos de Yuste
Tejeda WWTPLocated in Arroyomolinos, Pasarón de la Vera and Tejeda de Tiétar
Villanueva WWTPLocated in Villanueva de la Vera and Valverde de la Vera
Torremenga WWTPLocated in Torremenga

References

  1. Ansorge, L.; Čejka, E.; Dlabal, J.; Stejskalová, L. Effect of wastewater treatment plants to the reduction of pollution discharged in the Czech part of the Odra river basin. Sci. Rev. Eng. Environ. Sci. 2020, 29, 123–135. [Google Scholar] [CrossRef]
  2. Galli, A.; Wiedmann, T.; Ercin, E.; Knoblauch, D.; Ewing, B.; Giljum, S. Integrating Ecological, Carbon and Water footprint into a “Footprint Family” of indicators: Definition and role in tracking human pressure on the planet. Ecol. Indic. 2012, 16, 100–112. [Google Scholar] [CrossRef]
  3. Guerrini, A.; Romano, G.; Ferretti, S.; Fibbi, D.; Daddi, D. A Performance Measurement Tool Leading Wastewater Treatment Plants toward Economic Efficiency and Sustainability. Sustainability 2016, 8, 1250. [Google Scholar] [CrossRef] [Green Version]
  4. Teodosiu, C.; Barjoveanu, G.; Sluser, B.R.; Popa, S.A.E.; Trofin, O. Environmental assessment of municipal wastewater discharges: A comparative study of evaluation methods. Int. J. Life Cycle Assess. 2016, 21, 395–411. [Google Scholar] [CrossRef]
  5. Chen, K.-H.; Wang, H.-C.; Han, J.-L.; Liu, W.-Z.; Cheng, H.-Y.; Liang, B.; Wang, A.-J. The application of footprints for assessing the sustainability of wastewater treatment plants: A review. J. Clean. Prod. 2020, 277, 124053. [Google Scholar] [CrossRef]
  6. Hoekstra, A.Y. Virtual Water Trade. Proceedings of the International Expert Meeting on Virtual Water Trade; Value of Water; IHE: Delft, The Netherlands, 2003. [Google Scholar]
  7. Hoekstra, A.Y.; Chapagain, A.K.; Aldaya, M.M.; Mekonnen, M.M. The Water Footprint Assessment Manual: Setting the Global Standard; Earthscan: London, UK, 2011. [Google Scholar]
  8. AENOR UNE-EN ISO 14046. Gestión ambiental. Huella de agua. Principios, requisitos y directrices; AENOR: Madrid, Spain, 2015. [Google Scholar]
  9. Ansorge, L.; Beránková, T. LCA Water Footprint Aware Characterization Factor Based on Local Specific Conditions. Eur. J. Sustain. Dev. 2017, 6, 13–20. [Google Scholar] [CrossRef]
  10. Boulay, A.-M.; Lenoir, L.; Manzardo, A. Bridging the Data Gap in the Water Scarcity Footprint by Using Crop-Specific AWARE Factors. Water 2019, 11, 2634. [Google Scholar] [CrossRef] [Green Version]
  11. AENOR UNE-EN ISO 14040. Gestión ambiental. Análisis ciclo de vida. Principios y marco de referencia; AENOR: Madrid, Spain, 2006. [Google Scholar]
  12. AENOR UNE-EN ISO 14044. Gestión ambiental. Análisis ciclo de vida. Requisitos y directrices; AENOR: Madrid, Spain, 2006. [Google Scholar]
  13. Boulay, A.-M.; Hoekstra, A.Y.; Vionnet, S. Complementarities of Water-Focused Life Cycle Assessment and Water Footprint Assessment. Environ. Sci. Technol. 2013, 47, 11926–11927. [Google Scholar] [CrossRef]
  14. Zhang, G.P.; Hoekstra, A.Y.; Mathews, R. Water Footprint Assessment (WFA) for better water governance and sustainable development. Water Resour. Ind. 2013, 1, 1–6. [Google Scholar] [CrossRef] [Green Version]
  15. Li, H.; Liu, G.; Yang, Z. Improved gray water footprint calculation method based on a mass-balance model and on fuzzy synthetic evaluation. J. Clean. Prod. 2019, 219, 377–390. [Google Scholar] [CrossRef]
  16. Romeiko, X.X. Comprehensive water footprint assessment of conventional and four alternative resource recovery based wastewater service options. Resour. Conserv. Recycl. 2019, 151, 104458. [Google Scholar] [CrossRef]
  17. Morera, S.; Corominas, L.; Poch, M.; Aldaya, M.; Comas, J. Water footprint assessment in wastewater treatment plants. J. Clean. Prod. 2016, 112, 4741–4748. [Google Scholar] [CrossRef] [Green Version]
  18. Gu, Y.; Dong, Y.-N.; Wang, H.; Keller, A.; Xu, J.; Chiramba, T.; Li, F. Quantification of the water, energy and carbon footprints of wastewater treatment plants in China considering a water–energy nexus perspective. Ecol. Indic. 2016, 60, 402–409. [Google Scholar] [CrossRef] [Green Version]
  19. Gómez-Llanos, E.; Durán-Barroso, P.; Matías-Sánchez, A. Management effectiveness assessment in wastewater treatment plants through a new water footprint indicator. J. Clean. Prod. 2018, 198, 463–471. [Google Scholar] [CrossRef]
  20. Risch, E.; Loubet, P.; Núñez, M.; Roux, P. How environmentally significant is water consumption during wastewater treatment?: Application of recent developments in LCA to WWT technologies used at 3 contrasted geographical locations. Water Res. 2014, 57, 20–30. [Google Scholar] [CrossRef]
  21. Hospido, A.; Moreira, M.T.; Fernández-Couto, M.; Feijoo, G. Environmental performance of a municipal wastewater treatment plant. Int. J. Life Cycle Assess. 2004, 9, 261–271. [Google Scholar] [CrossRef]
  22. Hospido, A.; Moreira, M.T.; Feijoo, G. A comparison of municipal wastewater treatment plants for big centres of population in Galicia (Spain). Int. J. Life Cycle Assess. 2007, 13, 57–64. [Google Scholar] [CrossRef]
  23. De Benedetto, L.; Klemeš, J. The Environmental Performance Strategy Map: An integrated LCA approach to support the strategic decision-making process. J. Clean. Prod. 2009, 17, 900–906. [Google Scholar] [CrossRef]
  24. Lorenzo-Toja, Y.; Vázquez-Rowe, I.; Amores, M.J.; Termes-Rifé, M.; Marín-Navarro, D.; Moreira, M.T.; Feijoo, G. Benchmarking wastewater treatment plants under an eco-efficiency perspective. Sci. Total. Environ. 2016, 468–479. [Google Scholar] [CrossRef]
  25. Corominas, L.; Foley, J.; Guest, J.S.; Hospido, A.; Larsen, H.F.; Morera, S.; Shaw, A.R. Life cycle assessment applied to wastewater treatment: State of the art. Water Res. 2013, 47, 5480–5492. [Google Scholar] [CrossRef]
  26. Martínez-Alcalá, I.; Pellicer-Martínez, F.; Fernández-López, C. Pharmaceutical grey water footprint: Accounting, influence of wastewater treatment plants and implications of the reuse. Water Res. 2018, 135, 278–287. [Google Scholar] [CrossRef] [PubMed]
  27. Penman, H.L. Natural evaporation from open water, bare soil and grass. In Proceedings of the Proceedings of the Royal Society of London A: Mathematical, Physical and Engineering Sciences; The Royal Society: London, UK, 1948; Volume 193, pp. 120–145. [Google Scholar]
  28. IPCC. Directrices del IPCC de 2006 para los Inventarios Nacionales de Gases de Efecto Invernadero. Desechos; IGES: Hayama, Japón, 2016; Volume 5, ISBN 92-9169-320-0.
  29. Ministerio para Transición Ecológica y el Reto Demográfico. Factores de emisión registro de huella de carbono, compensación y proyectos de absorción de dióxido de carbono; Ministerio para Transición Ecológica y el Reto Demográfico: Madrid, Spain, 2020.
  30. Ecoinvent. Available online: https://www.ecoinvent.org/ (accessed on 18 October 2020).
  31. Parravicini, V.; Svardal, K.; Krampe, J. Greenhouse Gas Emissions from Wastewater Treatment Plants. Energy Procedia 2016, 97, 246–253. [Google Scholar] [CrossRef] [Green Version]
Figure 1. Scheme of supply chain of wastewater treatment plant (WWTP) for assessment of water footprint (WF) and carbon footprint (CF). Where GHG is greenhouse gas emissions.
Water 12 03204 g001
Figure 2. Operational grey water footprint (∆WFG,mef) scenario.
Water 12 03204 g002
Figure 3. Variation of indicators ∆WFG,mef, WFBlue and CF in operating range of a WWTP during a specific time interval (t) with a, b are the minimum and maximum values of ∆WFG,mef in this period, respectively, and c and d the maximum and minimum values of WFBlue or CF in the same period. Where cef is the concentration of effluent of a determined pollutant, cmax is the concentration allowed by the standard and cnat is the concentration of respective pollutant measured in receiving body of water. Possible operational limits of WWTP in time t and for its life period, where GE, good environmental performance limit; GM, good manager performance limit; OS, operational scenario to reduce consumption; PE, poor environmental performance limit.
Water 12 03204 g003
Figure 4. ∆WFG,mef, WFBlue and CF values corresponding to descriptions of different scenarios identified. GE, good environmental performance limit; GM, good manager performance limit; OS, operational scenario to reduce consumption; PE, poor environmental performance limit.
Water 12 03204 g004
Figure 5. Average values of ∆WFG,mef per cubic metre of treated water to BOD5, TN and TP in 2014, 2015 and 2016 at four WWTPs: (a) Cuacos, (b) Tejeda, (c) Villanueva and (d) Torremenga.
Water 12 03204 g005
Figure 6. Relationships among average values per cubic metre of treated water for WFBlue or CF and ∆WFG,mef in 2014, 2015 and 2016 at Cuacos WWTP. GE, good environmental performance limit; GM, good manager performance limit; OS, operational scenario to reduce consumption; PE, poor environmental performance limit. (a) TN ∆WFG,mef vs. WFBlue, (b) TP ∆WFG,mef vs. WFBlue, (c) TN ∆WFG,mef vs. CF, (d) TP ∆WFG,mef vs. CF.
Water 12 03204 g006
Table 1. Data to evaluate carbon footprint. BOD5, biochemical oxygen demand at five days; TN, total nitrogen.
Emission SourceNecessary DataReferences
Direct
CH4BOD5 (mg/L)
Wastewater volume (m3)
Intergovernmental Panel on Climate Change (IPCC) [28]
N2OTN (mg/L)
Wastewater volume (m3)
Intergovernmental Panel on Climate Change (IPCC) [28]
Indirect
Electricity consumptionPower consumption
(kWh/month)
Spanish Ministry for the Ecological Transition and the Demographic Challenge, 2014 [29]
Sludge treatmentSludge mass (kg)
Transport (km)
Type of treatment: Agriculture
ECOINVENT 3.0 (2014) [30] from Parrivicini et al. [31]
Table 2. Equivalent population (EP) and average monthly treated flow and electricity consumption of four WWTPs.
WWTPLocationEquivalent Population (EP)Qr (m3/month)Electricity Consumption (kW/month)
Cuacos40°06′00.8″ N 5°42′56.9″ W828259,877.3920,641.61
Tejeda40°00′35.9″ N 5°52′17.2″ W598836,367.987342.04
Villanueva40°06′32.9″ N 5°27′42.5″ W844249,964.339662.43
Torremenga40°02′30.8″ N 5°46′21.8″ W93312,975.244194.36
Table 3. Average monthly affluent and effluent concentration of four WWTPs. BOD5, biochemical oxygen demand at five days; TN, total nitrogen; TP total phosphorus.
WWTPcr (mg/L)cef (mg/L)
BOD5TNTPBOD5TNTP
Cuacos217.349.83.69.59.70.74
Tejeda106.023.92.18.27.50.98
Villanueva161.024.03.06.09.01.00
Torremenga103.624.42.89.47.40.87
cmax (mg/L)
BOD5TNTP
25152
Table 4. Average monthly values of WFBlue per cubic metre of treated water, 2014–2016.
WWTPWFBlue/Q (m3/m3)
201420152016
Cuacos0.881.170.97
Tejeda0.570.680.51
Villanueva0.550.680.48
Torremenga0.891.370.67
Table 5. Carbon footprint values per cubic metre of treated water.
WWTPCF/Q (kg CO2/m3)
201420152016
Cuacos0.330.520.33
Tejeda0.190.240.22
Villanueva0.240.310.25
Torremenga0.260.290.22
Table 6. Annual average values of WFR and CFR for four WWTPs, 2014–2016. Good environmental performance limit (GE) is indicated by green cells, good manager performance limit (GM) by yellow cells, operational scenario to reduce consumption (OS) by orange cells, and poor environmental performance limit (PE) by grey cells. The values represented in Figure 6 have been written in red.
CuacosWFRTejedaWFR
BOD5TNTPBOD5TNTP
201410.752.767.5620147.738.586.12
201534.101.777.05201522.972.690.54
201613.811.724.62201621.513.212.15
CuacosCFRTejedaCFR
BOD5TNTPBOD5TNTP
201428.697.3820.18201422.8125.3318.08
201577.094.0115.95201564.697.571.51
201644.105.4914.74201649.667.414.96
VillanuevaWFRTorremengaWFR
BOD5TNTPBOD5TNTP
20144.375.506.6020144.464.353.90
201531.402.063.7320157.532.860.80
201628.153.554.52201614.172.721.88
VillanuevaCFRTorremengaCFR
BOD5TNTPBOD5TPTP
20149.7412.2814.7120146.196.045.41
201569.374.568.25201513.645.181.45
201655.286.978.88201620.063.862.66
Publisher’s Note: MDPI stays neutral with regard to jurisdictional claims in published maps and institutional affiliations.

