Article

Hydrodynamic-Based Numerical Assessment of Flood Risk of Tamuín City, Mexico, by Tampaón River: A Forecast Considering Climate Change

by
Clemente Rodríguez-Cuevas
1,†,
Hermann Rocha-Escalante
1,†,
Carlos Couder-Castañeda
2,†,
Isaac Medina
2,† and
Jorge J. Hernández-Gómez
2,*,†
1
Facultad de Ingeniería, Universidad Autónoma de San Luis Potosí, 78300 San Luis, San Luis Potosí, Mexico
2
Centro de Desarrollo Aeroespacial, Instituto Politénico Nacional, 06000 Ejido del Centro, Ciudad de México, Mexico
*
Author to whom correspondence should be addressed.
These authors contributed equally to this work.
Water 2019, 11(9), 1867; https://doi.org/10.3390/w11091867
Submission received: 17 June 2019 / Revised: 3 September 2019 / Accepted: 4 September 2019 / Published: 8 September 2019
(This article belongs to the Special Issue Flood Modelling: Regional Flood Estimation and GIS Based Techniques)

Abstract

:
Climate change has unchained several natural extreme phenomena, including a major frequency and intensity of flooding episodes. From these, the ones of greatest importance are those which endanger human settlements as well as socioeconomic activities. This is the case of Tamuín city, settled in the shore of Tampaón River, in Mexico. In this work, we performed a detailed numerical modelling of the hydrodynamics of the zone, considering in situ topographic and bathymetric data as well as hydrodynamic parameters. Severe rainfall scenarios were simulated in order to determine the zones which are prone to flooding, as well as the potential periods of time between the beginning of the rainfall up to the flooding, considering the potential effects of climate change in the precipitation rate. The outcome of this research will help local governments undertake preventive actions to reinforce the identified risky zones, thus providing an adequate protection of rural and urban zones, as well as their inhabitants and their economical activities from current and future floods, considering potential climate change effects.
PACS:
91.50.Ga; 92.70.-j; 92.70.Ly; 92.40.-t; 92.40.Fb; 92.40.Cy; 92.40.Ea

1. Introduction

Since the 1950s, Global Warming (GW) has proven to be driving a Climate Change (CC) with severe present and future consequences for mankind as well as for nature itself [1]. Global warming is defined as the rise of the global mean temperature of air over land and ocean [1], which affects the whole Earth’s ecosystems. Undoubtedly, this temperature rise is the result of the modification of Earth’s global energy balance, increasing the total global heat of the planet [2]. CC has unchained a very intense research activity since the second half of 20th century. Furthermore, in the last two decades, a very important branch of such investigation has focused in providing projections or predictions of the global mean temperature behaviour in diverse scenarios. Modelling has had a major role in these predictions. One of the most clearly affected of Earth’s systems due to CC is the planet’s hydrology. Much research on the impact of CC in large water bodies has been performed, at both the oceanic level [3,4,5,6,7] and for inland surface waters (lakes, lagoons, estuaries, wetlands, etc.) [8,9,10,11,12,13,14,15,16,17,18,19,20,21,22], groundwaters [23,24,25,26,27,28], etc. Of particular interest from the human point of view are rivers, due to their typical extensions and their importance in socio-economics. CC has had an intense effect in river dynamics.
To assess such effects, hydrological processes in diverse regional and local river setups have been simulated in recent studies using various hydrological models, by considering different representative concentration pathways (RCPs) of the Fifth Assessment Report (AR5) of The Intergovernmental Panel on Climate Change (IPCC) and distinct future study periods. Bekele et al. [29] downscaled 20 Global Circulation Models (GCMs) and used the SWAT hydrological model under RCP4.5 and RCP8.5 over the study periods of 2050s and 2080s, and found moderate to severe increments in rainfall, temperature, runoff and extreme peak flows for the Keleta watershed in the Awash River Basin, Ethiopia. In [30], the authors studied the water quantity and quality in the Boise River Watershed considering climate variability coming from the GCMs and land use and land cover change, with the outcome showing a more seasonal variability of streamflow and water quality, including sediment, N , and P during summer and early fall over the next several decades. In other study, future discharges in the upper Jordan River were simulated by Givati et al. [31] with the GR6J daily hydrological model and considering an ensemble of regional climate models. They found a decreasing trend in precipitation, which reflects an increase in potential evaporation and a decrease in streamflow volumes in the considered river. In another paper, the flow of the Volta River in Sub-Saharan Africa was simulated with an Integrated Catchment Model (INCA) considering three downscaled GCMs of the 2050s and 2090s under RCP8.5. The outcome shows increments in peak flows and duration of streamflow during the monsoon months, which allow assessing regional socio-economic changes [32]. In [33], biogeochemical and hydrological models were coupled to assess the impacts of CC in coastal eutrophication potential in the Seine River basin, considering the BC-CORDEX projections of precipitation and temperature for RCP4.5 and RCP8.5. The results show more intense extreme streamflow, which results in the degradation of water quality for RCP8.5. Su et al. [34] simulated the upper Yangtze River basin hydrological response in future mid-century and end-century periods with respect to a baseline period (1981–2010), and they projected streamflows using four hydrological models driven by climate projections from five CMs under four RCPs. In [35], Dlamini et al. assessed the potential impacts of CC on the streamflow of Bernam River Basin using ten GCMs under RCP4.5, RCP6.0 and RCP8.5, with the SWAT hydrological model. The projections show an increase in future temperature; rainfall is predicted to change with clear variations between wet and dry seasons; and streamflow is shown to follow the rainfall pattern. Gelfan et al. [36] evaluated the impacts of CC on the hydrological regime of the Lena and Mackenzie Rivers basins for three 30-year periods using an ensemble of five GCMs and four RCPs with ECOMAG and HYPE hydrological models, finding that the basins react with a multi-year delay to changes in RCP2.6, as well as that the projections’ variability is caused by GCMs and RCPs uncertainties. In other work, the Assiniboine River watershed is studied through the SWAT-PDLD model to successfully predict nutrient and sediment export in a cold climate, considering a seasonally varying soil erodibility factor, and the model shows that both filter strips and cover crops decrease sediment, phosphorous, and nitrogen export, while conservation tillage increases phosphorous export [37]. In [38], the authors examined the impacts of future changes in climate and land use on streamflow, nitrate and ammonium in the Kor River Basin, using RCP2.6 and RCP8.5 scenarios in the future period (2020–2049) with INCA-Nitrogen model. The results indicate that CC will increase streamflows and decrease nitrate and ammonium concentrations in summer and autumn; land use changes would have a little impact on streamflows but a significant impact on water quality; and, under combined scenarios, larger seasonal changes in streamflows and mixed changes of nitrate and ammonium concentrations are predicted.
Rivers are particularly prone to flood. Lately, extreme episodes of floods around rivers have occurred, which have been triggered by the effects of global warming in the natural hydrological cycles, according to experts. In this field, in [39], the authors examined projections of CC on discharge and inundation extent in the Amazon basin using MGB-IPH regional hydrological model with one-dimensional river hydraulic and water storage simulation in floodplains for the period 2070–2099 from five GCMs, finding increased mean and maximum river discharges in the northwest while decreased ones in eastern basins. Patrick et al. [40] obtained the 100- and 500-year future flood maps as two-dimensional delineation of potential flood extent in New York City, identifying three different zones: areas that shall certainly flood, areas that shall not, and areas that might flood depending on sea level rise projections through the 21st century. Arnell and Gosling [41] assessed the implication of CC for global river flood risk by region, based on the estimation of flood frequency relationships at a grid resolution of 0.5° × 0.5°, using a global hydrological model with climate scenarios derived from 21 climate models, together with projections of future population for 2050. The outcome shows a strong regional variability (Asia being more affected), and considerable variability between climate models with a range in increased exposure of 31–450 million people and 59–430 thousand km 2 of cropland, with a change in flood risk varying between −9 and +376 over the risk in 2050 in the absence of CC. Another work performs global future river flood risk projections that separate the impacts of CC and socio-economic development, based on an ensemble of climate model outputs, socio-economic scenarios, and a hydrologic river flood model combined with socio-economic impact models [42], and finds that, globally, absolute damage may increase by up to a factor of 20 by the end of the century without action, with Southeast Asian countries facing a severe increase in flood risk as consequence of CC, while African countries facing a strong increase in risk mainly due to socio-economic change.
The generalised predicted increment in global flooding risk due to CC all around the world has raised the major concern of scientists as well as policy- and decision-makers on how to mitigate the effects of CC in floods of water bodies, particularly of those near human settlements. With respect to the minimisation of the impact of CC in river flooding, Francesch-Huidobro et al. [43] examined the nature of visions, strategies, plans and programmes implemented by the cities of Hong Kong, Guangzhou and Rotterdam, which are highly exposed to flooding because they are located in river deltas. The work by Alfieri et al. [44] is devoted to evaluating adaptation strategies to limit the impact of river flooding on population and assets at European scale, under a high-end global warming scenario over the time range 1976–2100. The results show that expected damage and population affected by river floods can be compensated through different configurations of adaptation measures, which should favour measures targeted at reducing the impacts of floods, rather than trying to avoid them. In [45], the authors evaluated the impact of CC and a high urbanisation rate in Addis Ababa through SWAT, and found 10% and 25% increases in peak flows due to these two factors, respectively. In [46], a tracing of the application at municipal level of the Safety Plan for 100 mm/h-Rainfall, a scheme for preventing and mitigating inundation caused by extremely heavy, short-term rainfall established by the Japanese central government, is performed. Prospects of how a safety plan should be implemented in an urban watershed are discussed. The authors of [47] developed the Coastal City Flood Vulnerability Index (CCFVI), based on exposure, susceptibility and resilience to coastal flooding, to link theoretical flood vulnerability concepts and the day-to-day decision-making process. They then applied it to nine different cities under both current and CC conditions, demonstrating it to be an effective tool to obtain a broad overview of flood vulnerability in these conditions, with regard hydro-geological, socio-economic and politico-administrative components. Jeffers [48] evaluated policy- and decision-making responses to flood hazards heavily based in physical exposure protection and largely neglecting socio-economic vulnerability, and found them to be ineffective in facilitating effective adaptation to floods and loses. Bleck et al. [49] described the adaptation of flood protection with respect to CC and global sea level rise of the State and City of Bremen, in the General Plan for Coastal Protection-Lower Saxony/Bremen. It outlines administrative aspects as well as special technical requirements for harbour operation, recreational use and urban architecture, among others. In [50], the authors reviewed the evidence about the combined impacts of urbanisation and climate on urban flooding and water quality of inland catchments of the United Kingdom, and assessed its utility for setting environmental legislation and managing the urban water environment. Medium-high confidence evidence show an increase in pluvial and fluvial flood risk, and further reduction in water quality caused by point source pollution and altered flow regimes. On the other side, identified factors that limit the utility of such evidence for managing the urban environment are CC projection uncertainty and suitability, lack of sub-daily projections for storm rainfall, complexity in managing and modelling the urban environment, and lack of probable national-scale future urban land-use projections. In addition, Ek et al. [51] presented the different landscapes along Sweden and considered both fluvial and pluvial floods which are extreme but with low probability and have relatively small, but significant in financial terms, risks, respectively. This analysis considers that, as result of CC: floods are expected to occur with increased frequency in Sweden; the expected temperature rise in Scandinavian countries is expected to be greater than the global average; and precipitation is expected to increase mainly in the north and in the southwest, while the southeast part of the country will face increased periods of drought.
The case of study in this work is located in the Huasteca Potosina region, in northeastern Mexico, with a surface of about 11,000 km 2 . This region stands out for the abundance of water and biodiversity resources [52,53,54,55,56,57,58], it possesses mainly tropical rainforest, semi-tropical and sub-humid tropical climates [52,54,59] and it has sparse and small populations dedicated mainly to agricultural and cattle farming [60,61,62]. These rural societies, formed by an important percentage of indigenous people organised in communal lands (ejidos) [63], have undergone in the last two decades very important ecological transformations by human activity due to the implementation of regional development projects [62,64]. The land-cover and land-use changes in the region show a greater fragility of the natural vegetation and the agricultural areas with respect to hydrometeorological phenomena and plagues [64], which threaten local activities. This fragility is expected to be dramatically increased by CC. Nevertheless, mainly due to the lack of large human settlements and of industrial activities, this region has gone unnoticed by scientists and by federal government, thus there is very little knowledge of the current and future impacts of CC in the hydrological processes of the region. A particular case of interest within Huasteca Potosina is Tamuín city, settled at the borders of Tampaón River. This small city, inhabited by about 38,000 dwellers, stands out for being prone to flooding for several centuries, according to historical records. In 2003, an early study by Hudson and Colditz [65] measured that the flood extent in Tamuín valley can reach up to 77.3% of the total surface of the valley (207.9 km). Thus, it is mandatory for a study to be performed to accurately model flood risk considering potential effects of CC in local hydrological processes and be able to undertake the necessary actions to protect the lives and socio-economics of the local population.
In this work, we performed an assessment of the flooding risk of Tamuín city, through a parallel self-made hydrodynamic model previously validated in diverse studies [66,67,68,69,70] and carefully calibrated with field measurements, with the idea of having full control of processes, methods and precision provided by owning the code. Streamflow of Tampaón River in wet and dry seasons was simulated according to historical records. The results coincide with measurements with a Nash–Sutcliffe efficiency of 0.57 [71] and were compared to the predicted streamflow considering the regional effects of CC. To take into account CC, we considered projected precipitations for mid-century (2046–2065) periods obtained with the ensemble of climate models participating in the Coupled Model Intercomparison Project Phase 5 (CMIP5) [72] under the stabilisation global warming (RCP4.5) scenario [73], provided in IPCC AR5 [74]. This article is organised as follows. In Section 2, we present a detailed characterisation of the region under study. In Section 3, we expose the methodology applied, including field measurements and hydrological conditions, as well as the calibration of the model. The results of the flooding of adjacent lands without and with considering of CC effects are presented in Section 4. In Section 5, the conclusions of this study are presented as well as some final important remarks. Finally, the applied hydrodynamics and the numerical implementation of the model can be consulted in Appendix A and Appendix B.

2. Region Under Study

As previously mentioned, the region under study is the Tamuín municipality, which has suffered serious flooding episodes during about 500 years according to the available records.

2.1. Location

The region under study is located in a section of Tampaón River which passes through Tamuín municipality in the state of San Luis Potosí, México. It lies southeast of the Eastern Mexican Belt, and it consists of a coastal plane. The limits of the studied zone are between 21°46′ and 22°24′ N latitude, as well as between 98°24′ and 98°27′ W longitude (see Figure 1).
The zone under study is embedded in the Huasteca region, in San Luis Potosí state, Mexico, with an altitude of 30 masl, and it belongs to RH-26 Pánuco hydrographic basin [75,76]. Important water bodies in this basin are Los Patitos, Tansey, Brasil, San José del Limón, Palmas Cortadas and Mirador lagoons.
Tampaón River crosses Tamuín city, and it later joins the Moctezuma River 4 km downstream after the city, to form Pánuco River, which is one of the five main rivers of Mexico ending at the Gulf of Mexico [65,75].

2.2. Evolution of the Region

Tamuín is a human settlement dating from the pre-Columbian time, where the Huastec civilisation flourished due to the welfare that the fertile lands provided by the waters of Tampaón River. In the south (Figure 1), the location of Tamtoc archaeological site can be observed surrounded by a portion of Tampaón River; it dates from 900 A.D., and is estimated to have fallen about 1100 A.D. [77]. Afterwards, the Huastec culture moved a bit to the northeast, and, by the 15th century, they founded Tamohi settlement at the right shore of the river (see Figure 1) [78,79].
At the time of the Spanish conquest, the village of Tamuín was settled about 2 km to the north of Tamohi archaeological site (see Figure 1). Over time, it became clear that this location was not a good choice because the zone is very prone to flooding, destroying economic activities such as agricultural and cattle raising, as well as households and human lives. Although several historic events have changed the political limits of Tamuín, it was not until 1892 that the village was refounded in its actual location (on the north shore of Tampaón River, see Figure 1), in part to diminish the flooding risk.
Nonetheless, in 1955, Tamuín village suffered an intense flooding, which remained for more than three weeks, a consequence of Gladys and Hilda hurricanes, which also destroyed the only road connecting the village. Although the shore was raised, unexpected floods still happen in the town, which have become more frequent and more intense due to CC.
Nowadays, Tamuín has important natural resources and a population of almost 38,000, most of whom are native and Mestee, as well as a multi-faceted economy [80]. Ninety per cent of the local economic activities are tourism, farming and cattle raising. Along water bodies such as Tampaón River, which is under study, fishing and commerce are also important economic activities. These activities have changed the hydrographic features of the rivers, modifying its hydrology and its water quality [81].

2.3. Hydrodynamics

Of the two weather stations within RH-26 Pánuco hydrographic basin, data from 24,139 Tamuín DGE station were used because it has been under operation for the last 35 years. The referred station is located at the coordinates −98.81194444444439, 22.0769444444444,48 (see Figure 1), and it registers on a daily basis three meteorological parameters: precipitation (rainfall volumes, [mm]), evaporation [mm] and temperature [°C].
To estimate the flow in the reach of the river under consideration (see Figure 3), we used the equivalent TUH (Triangular Unit Hydrograph) method to compute the Curve Number (CN) [82,83]. These methods, developed by the USBR (United States Bureau of Reclamation) and the SCS (Soil Conservation Service), allow estimating flow rates by dripping for different return periods ( T r ), which can be observed in Table 1, while a TUH for a return period of 20 years is shown in Figure 2.

2.4. Climate

Weather is warm during most part of the year, ranging from cool to cold between November and February. According to Tamuín DGE station, the minimum registered temperature is 17 °C, the maximum is 34.6 °C, and the average is 25.4 °C.
Annual average precipitation according to the station is 1007.5 mm, but for the whole hydrologic basin is 1427.53 mm, according to the Thiessen polygon method [82]. While the dry season begins on 19 April on average, the wet season usually starts on 8 August [60].

3. Methodology

The methodology herein presented consists in the development of a hydrodynamic numerical model to simulate the hydrodynamical behaviour of the section of Tampaón River under study in the presence of periods of high precipitation, in both current and intensified by CC conditions [84,85]. Along this section, we describe the performed measurement campaigns in order to obtain reliable hydrodynamic data (flow rate, surface elevation and flow speed), as well as the implementation and calibration of the method along with the particular setup of the numerical model for the case of study. The making of the model, from the governing equations up to the numerical solution strategy are discussed in Appendix A and Appendix B.

3.1. Field Measurement Investigation

In situ measurements were performed on the first day of the wet and dry seasons according to Section 2.4. Both data about the seasonal variation of Tampaón River levels and the hydrodynamic behaviour of the flow, e.g. the flow rate, were acquired.
Hydrodynamic measurements were obtained through an ADCP RiverRay device, which works based on Doppler effect. This device was carefully fastened to a Hydroboard, specifically designed for its stability in water. Data were recorded in real time, along the GPS position where such data was taken.

3.1.1. Transects

To obtain hydrodynamic data, two kinds of transects in the river were performed.
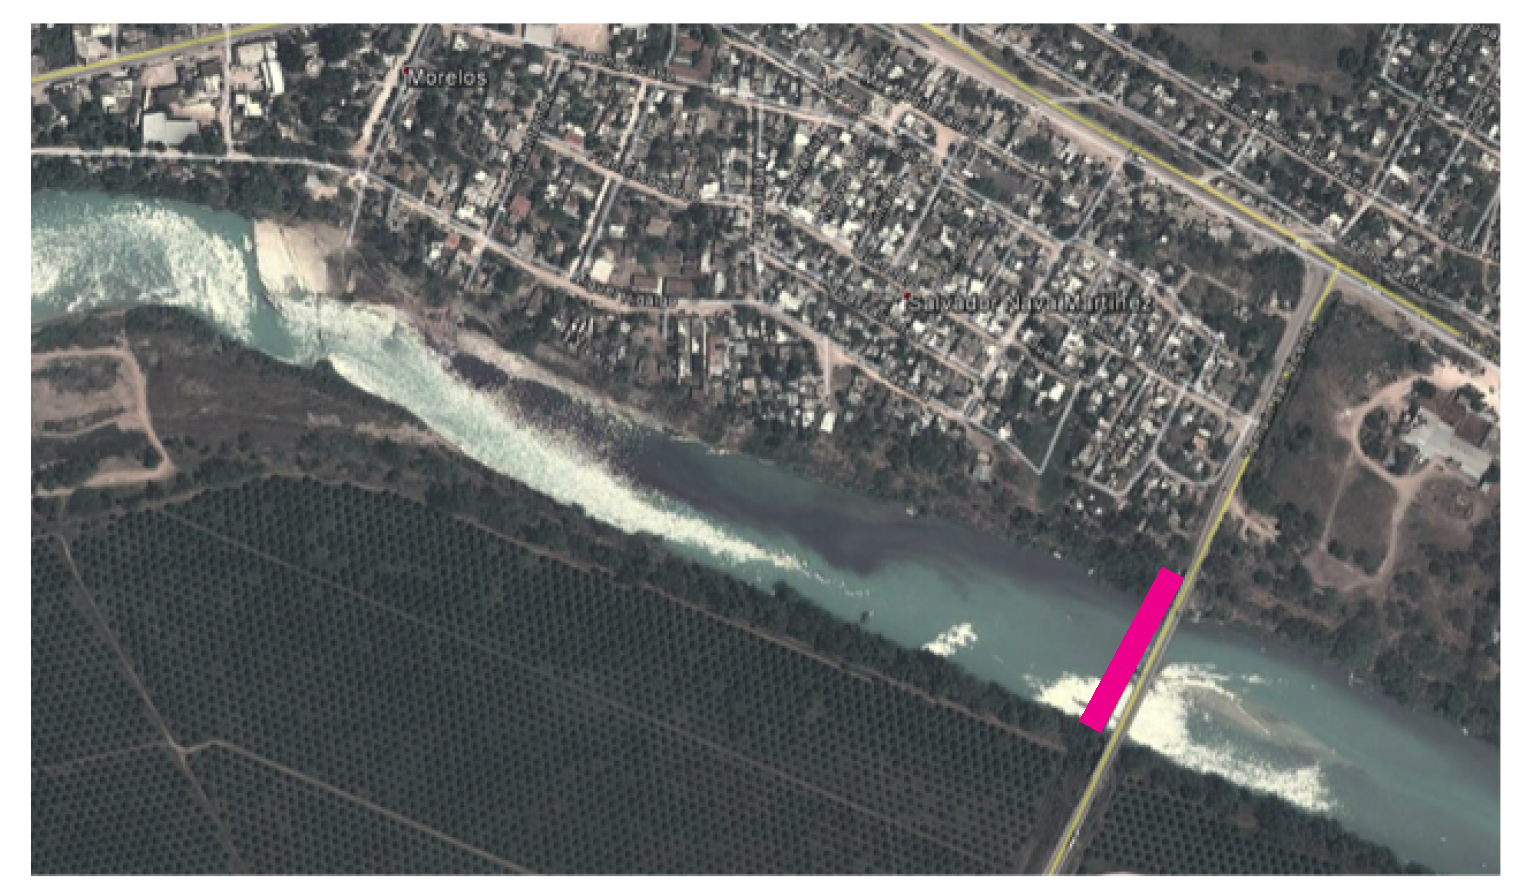
First, to measure the flow rate of the river, a control section of the river was selected. Then, the first transect consisted in crossing the river perpendicularly (see Figure 3).
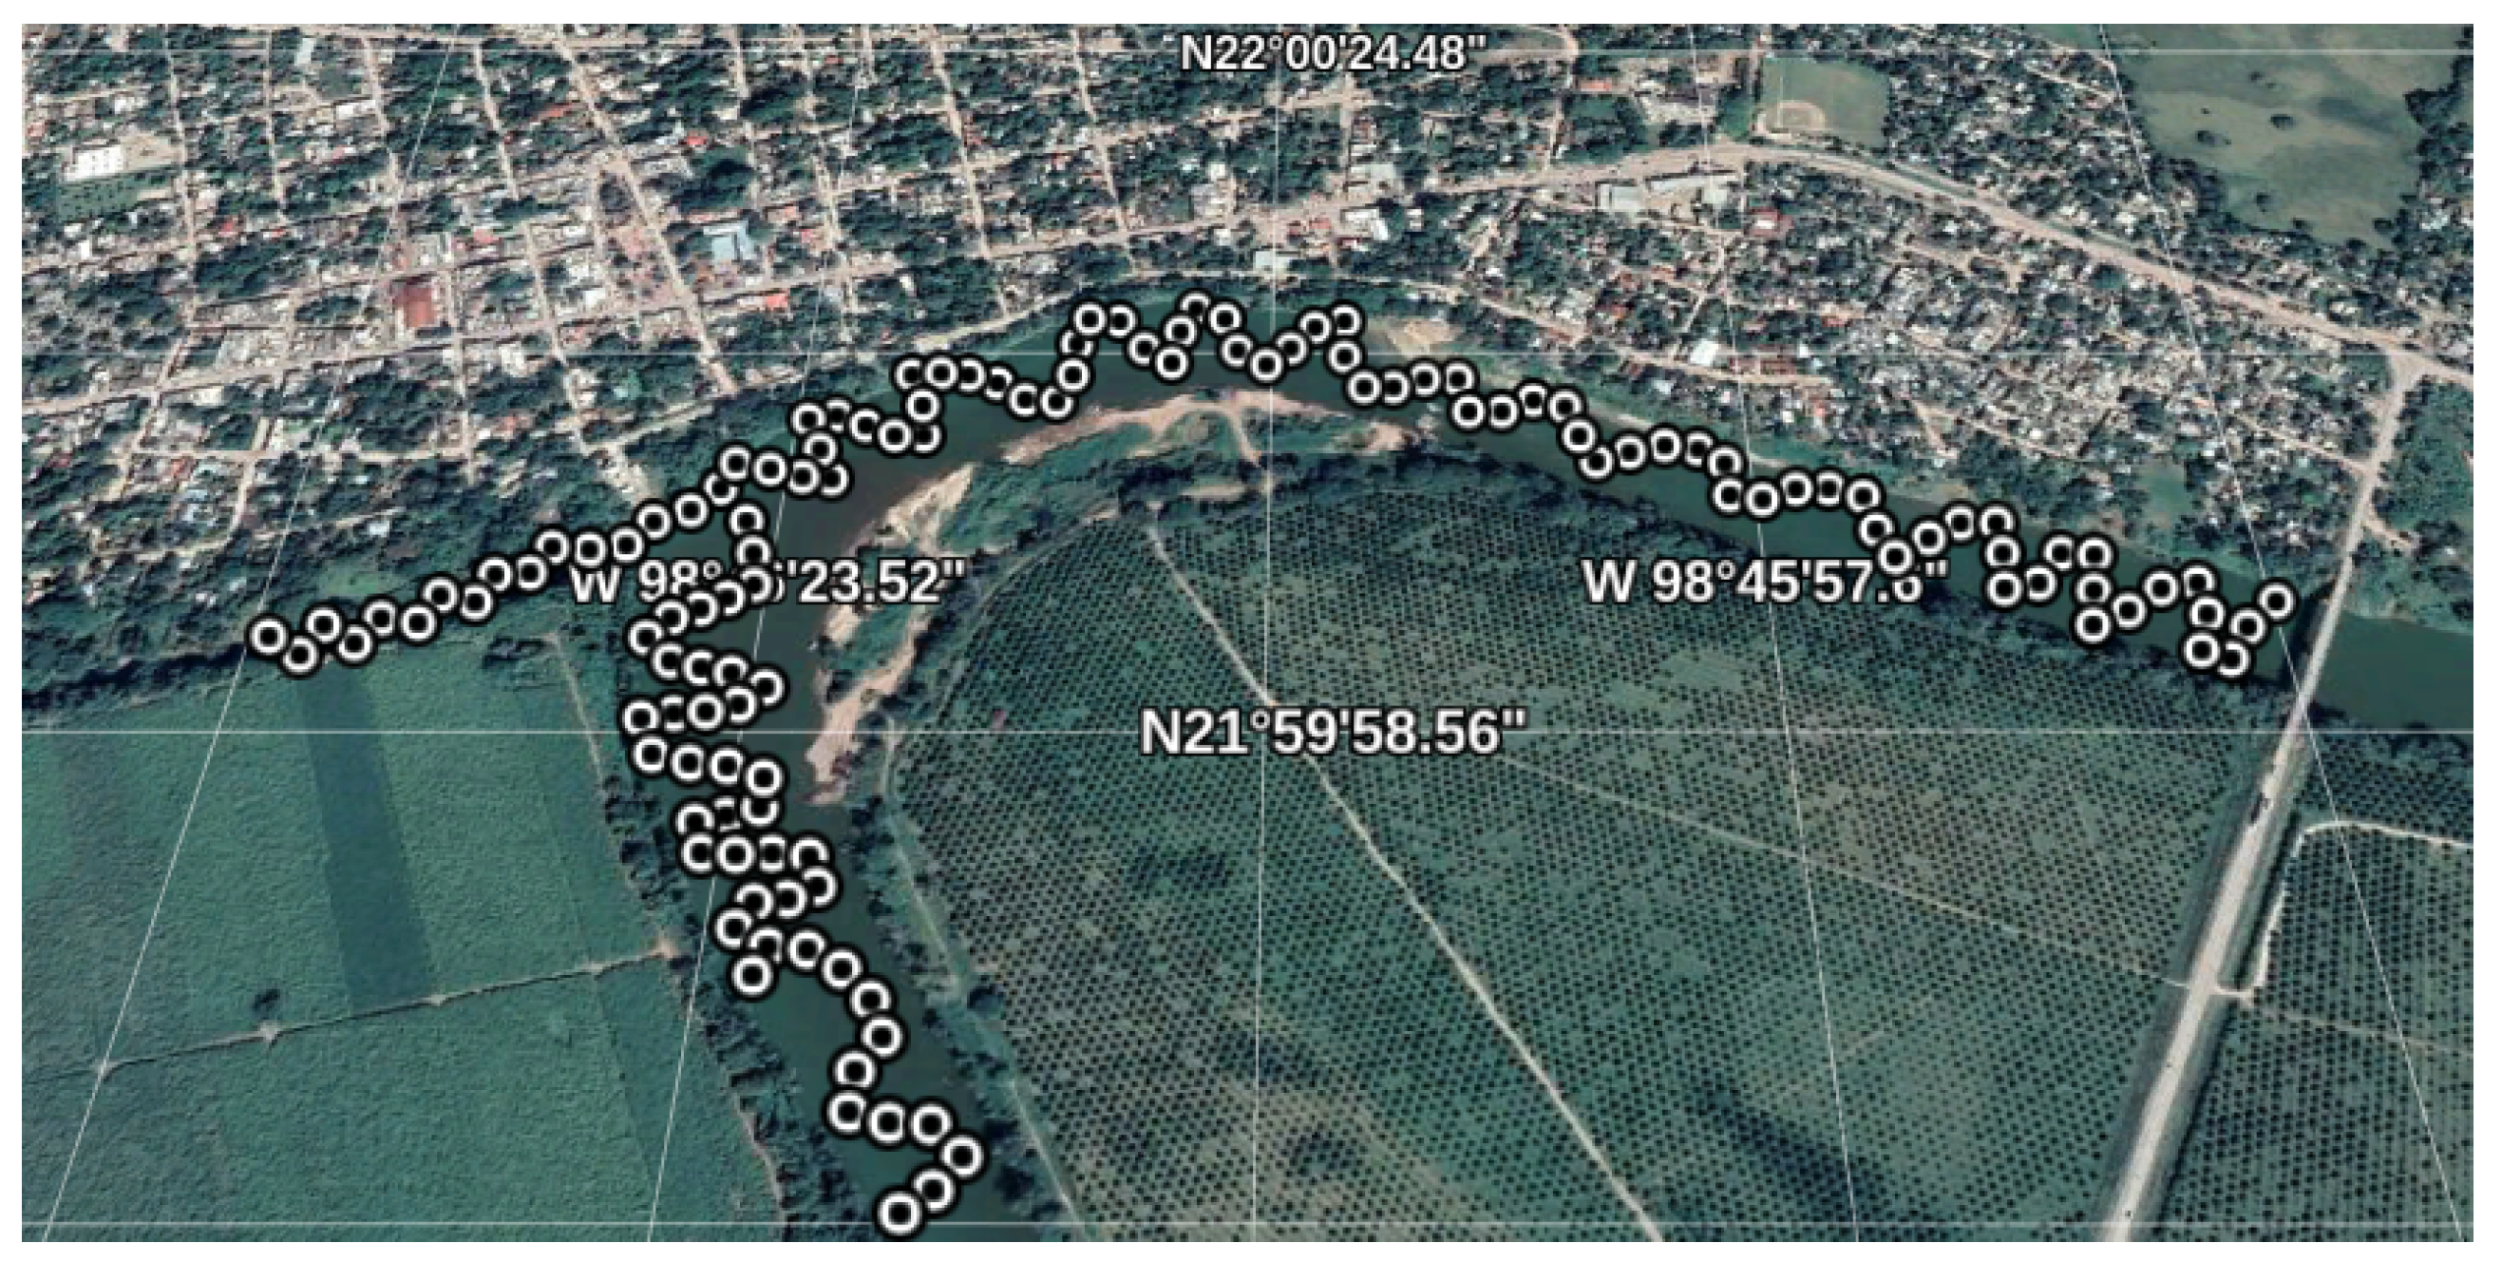
On the other side, to obtain the value of the water surface as well as flow velocities, the second transect was designed so to cross the river all across the section under study in zigzag, as shown in Figure 4.

3.1.2. Bathymetry

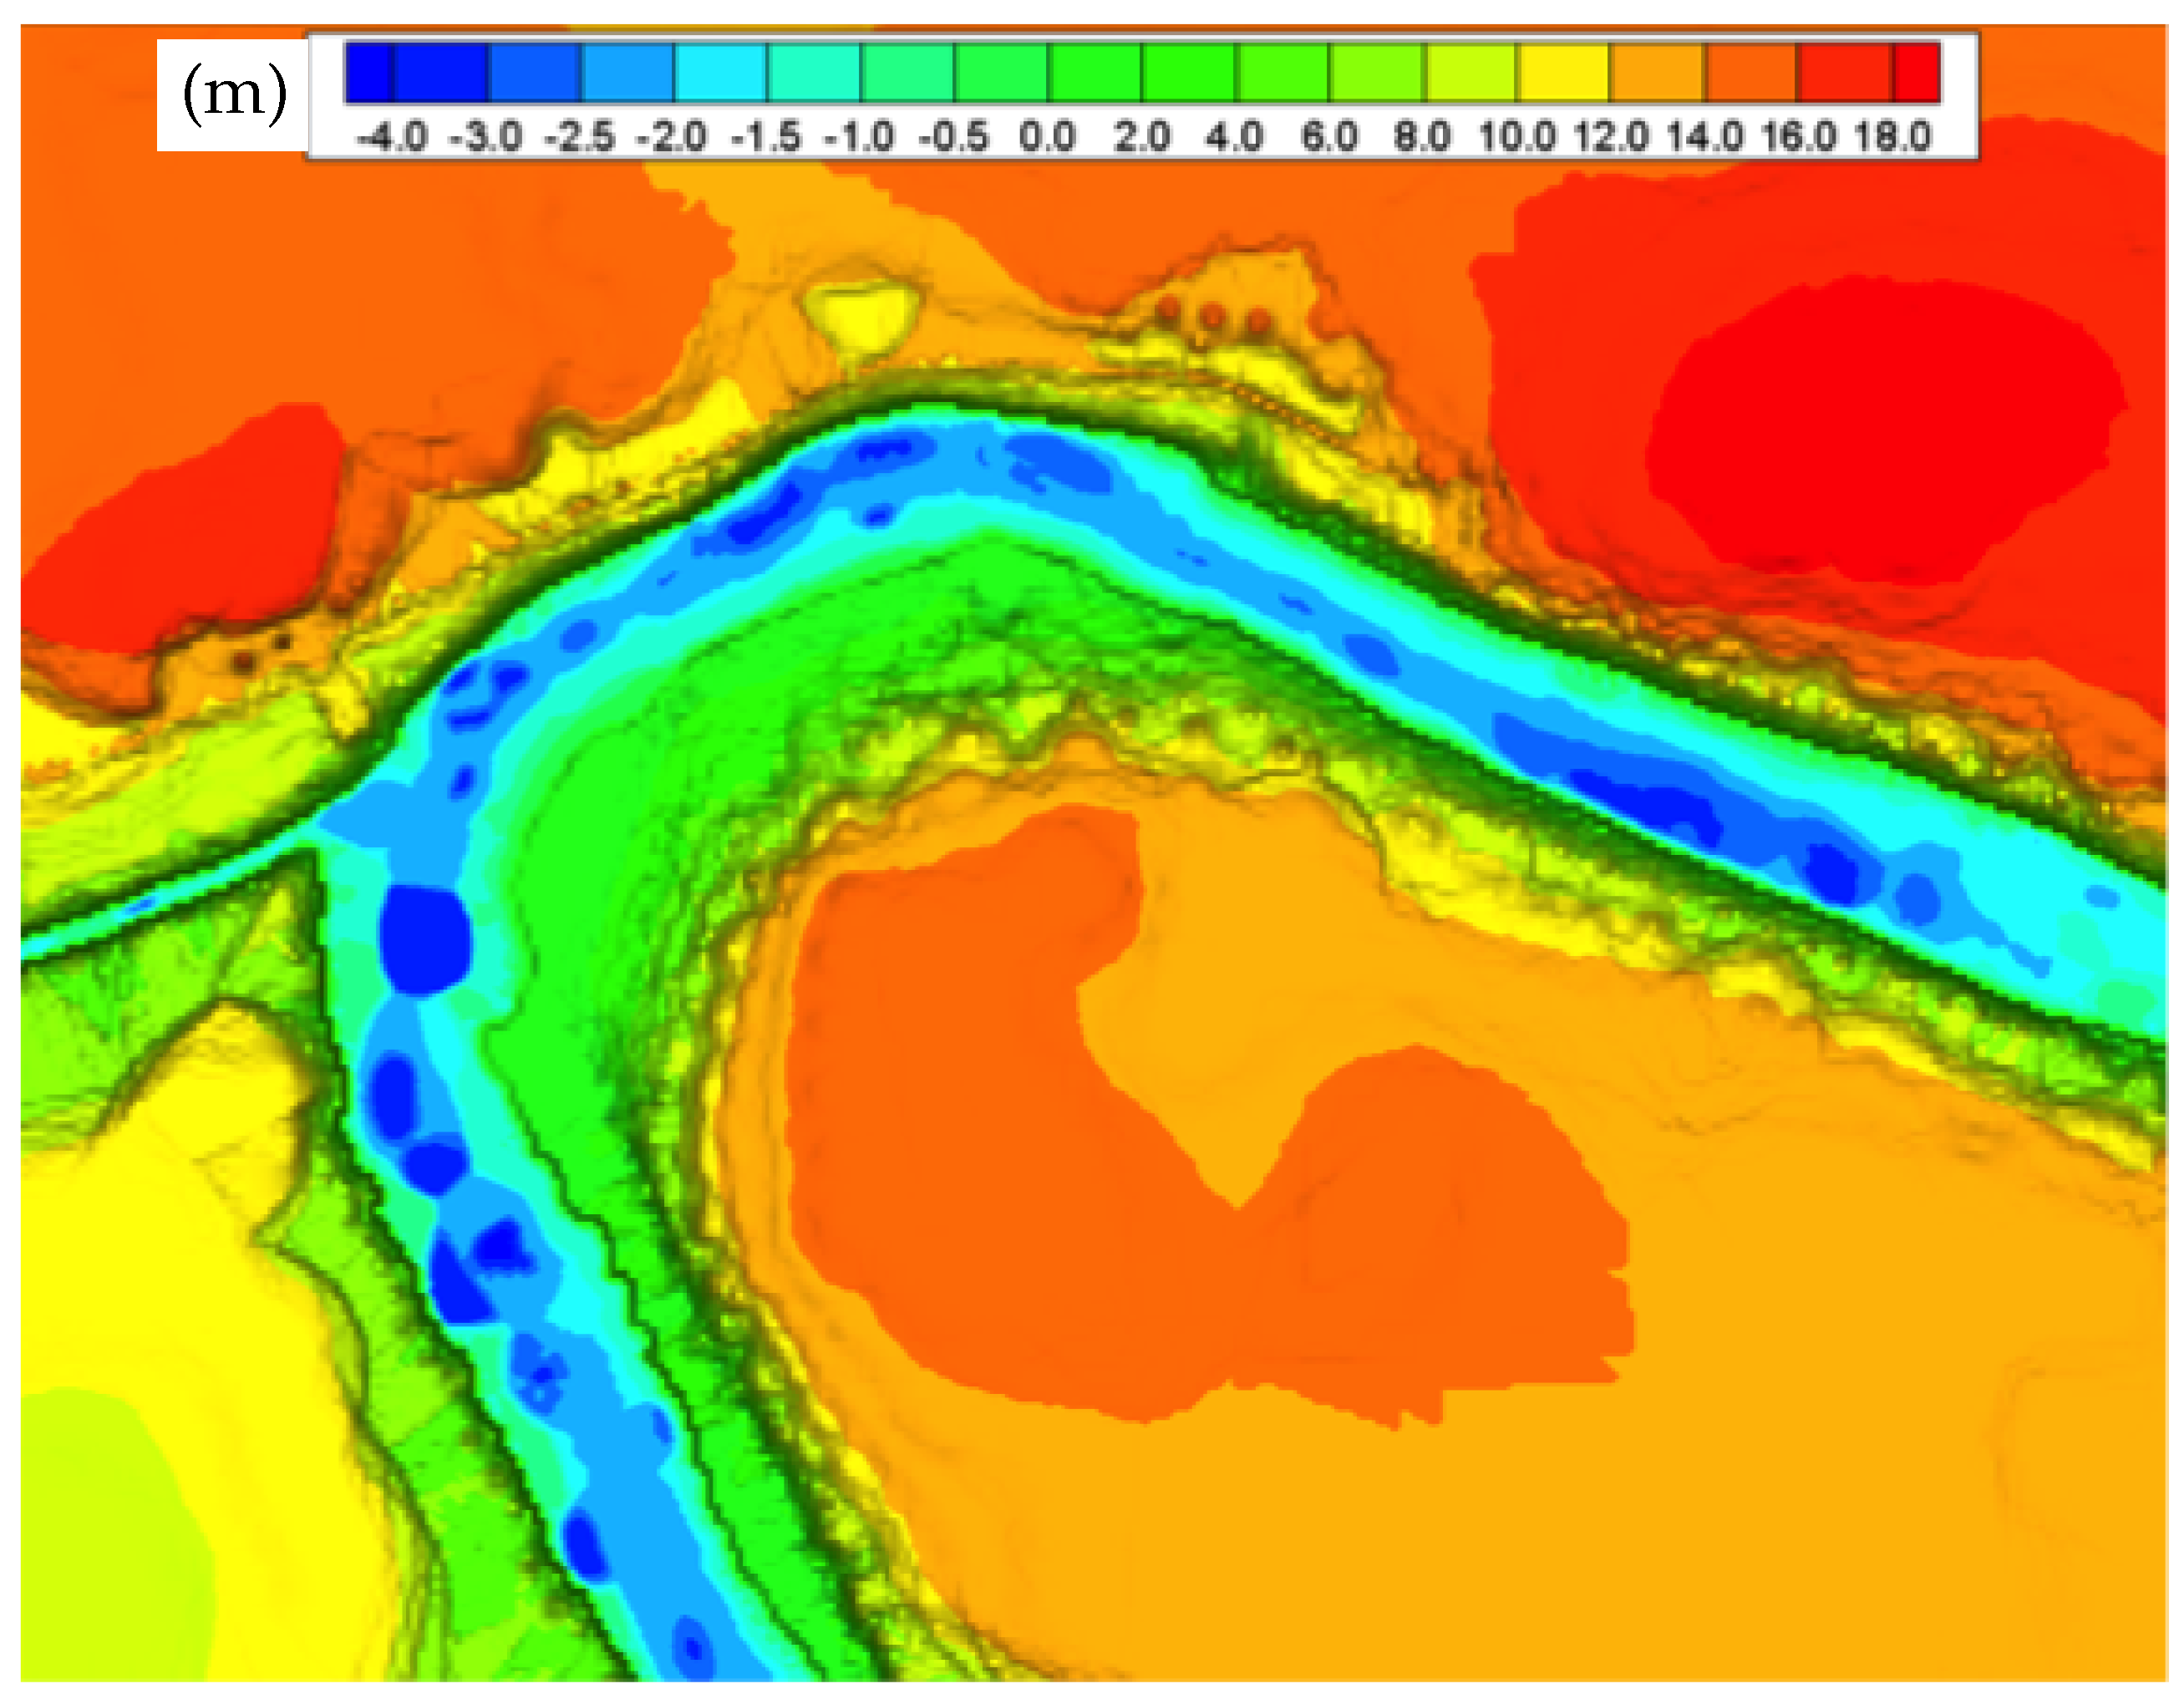
To obtain the bathymetry, measurement campaign data were processed as follows: surface elevation data obtained in the second transect were used to generate a digital map of geo-referenced isobates. Figure 5 shows these isobates along with level curves of nearby zones with the aid of a topographic survey as well as with previously existent maps.

3.1.3. Flow Velocity

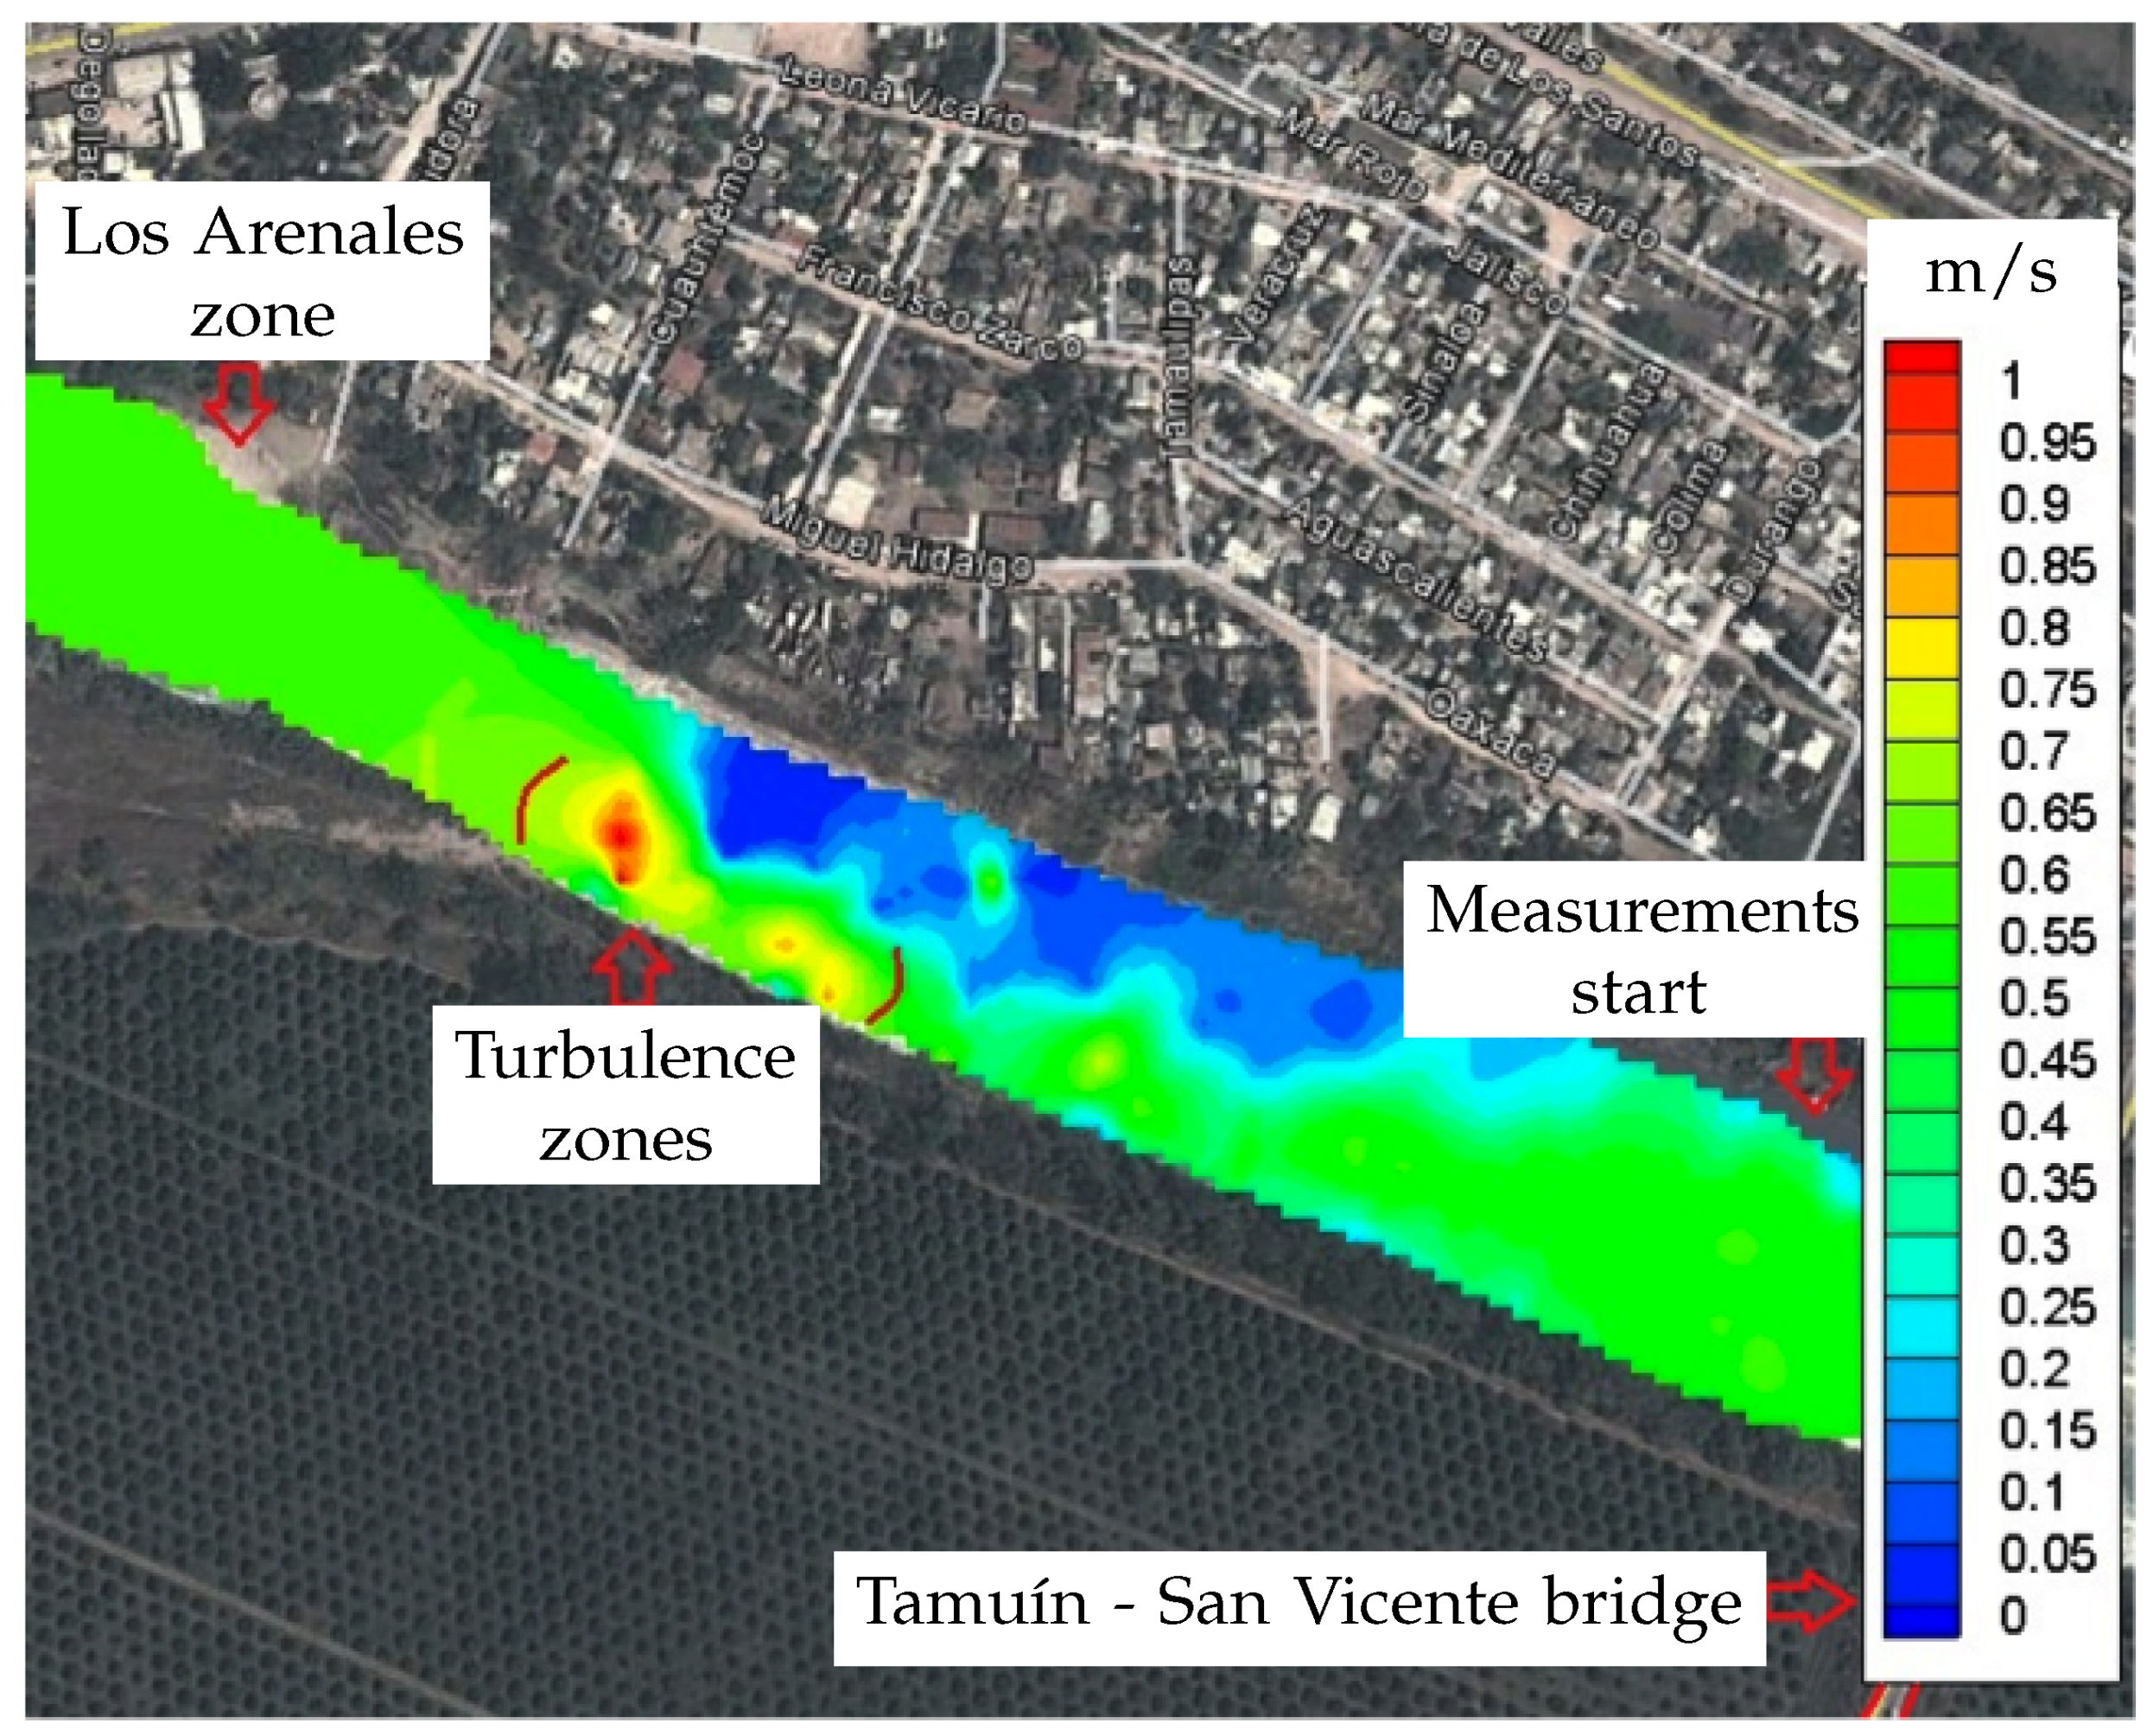
The flow velocity is another hydrodynamic parameter of importance for numerical simulations. To obtain it in the region under study, data from the second transect were processed through WinRiver II software [86]. The obtained flow velocity can be observed in Figure 6.
As shown in Figure 6, the (measured) riverbed of Tampaón River in such section presents very low speeds (0.05–0.2 m/s), which is consistent with the lower depths of this regions according to the obtained bathymetry. This makes this reach of the river the most secure for navigation while the most insecure for rising river levels, which represents a great threat for the population living above the river’s border in this section.
In the same figure, at the other border of the river, higher flow speeds can be observed, with peaks of almost 1 m/s. On the other side, a turbulence zone is identified and located between (22.002083° N, −98.767435°) and (22.001364° N, −98.765955°), which is dangerous for navigation (even for measurement campaigns). Nevertheless, historically, this zone is less prone to overflows. Furthermore, in the lower border of the river, there is no population, because it consists of a zone currently dedicated to agricultural activities (see Figure 6).

3.1.4. Flow Rates

To estimate the flow rate crossing the control section (see Figure 3), data from the first transect were used. For the dry season, a flow rate of 36.39 m 3 /s was obtained, while, for the wet season, it corresponded to 86.08 m 3 /s (see Figure 7).
The set of equations used for the development of the hydrodynamic model, as well as the implemented numerical solution strategies are presented in Appendix A and Appendix B, respectively. The reader interested in those details as well as with the software implementation is directed to those appendices.

3.2. Boundary Conditions

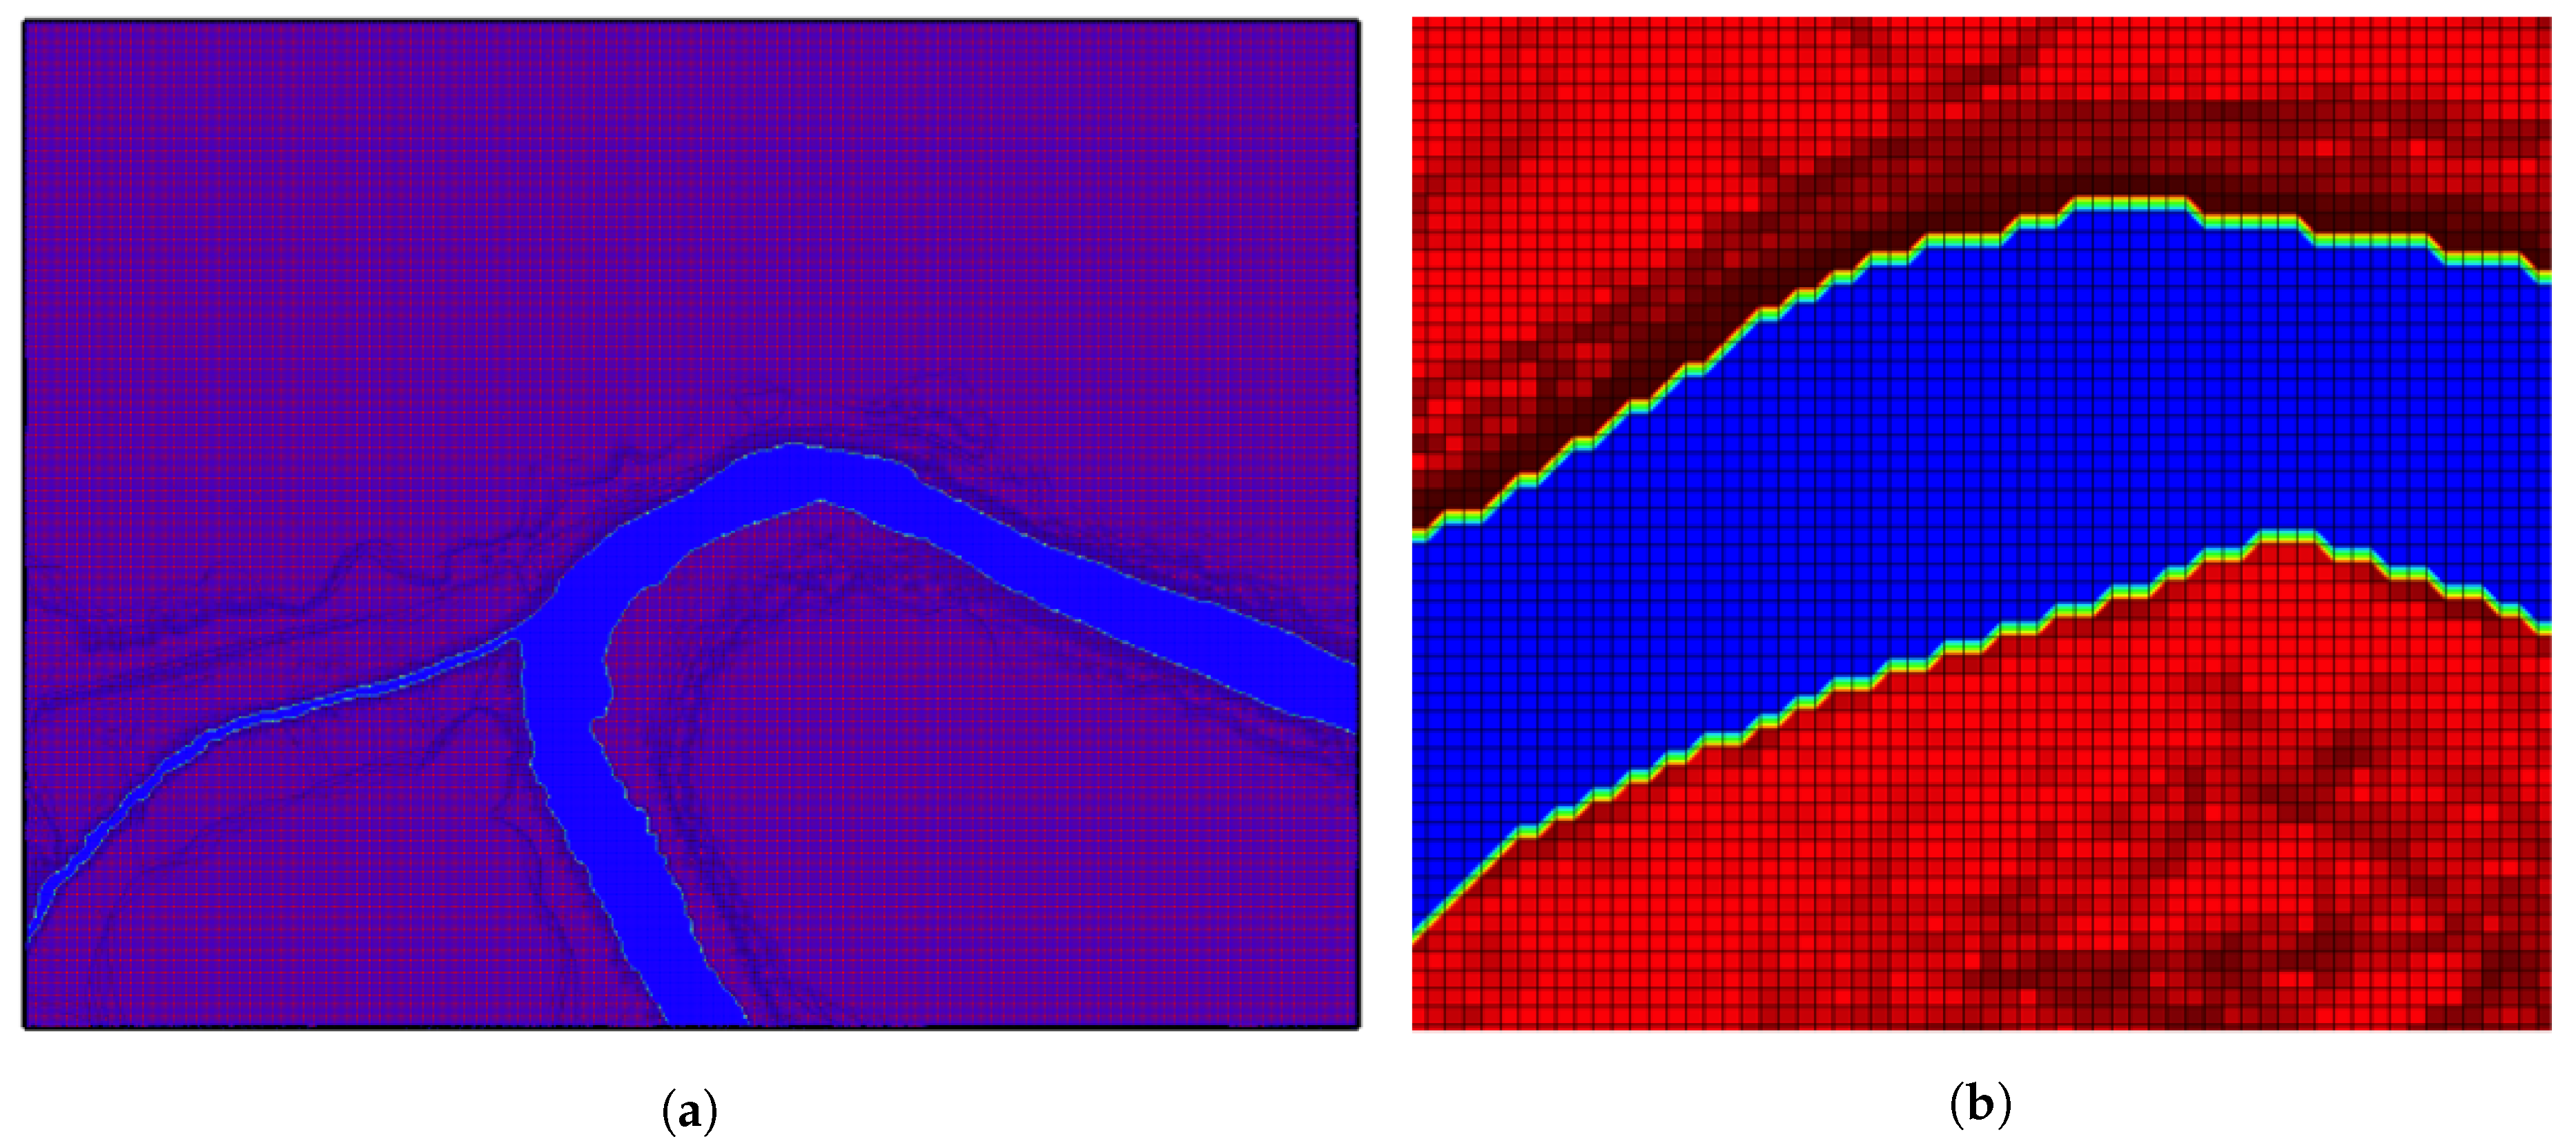
River’s hydrological flow, Q = 86.082 m 3 /s, was considered constant, thus Dirichlet boundary conditions were used (see Figure 8). The outflow boundary condition is of Neumann’s type, U / η = 0 (see Figure 8). For dry cells, a non-slipping condition was applied, imposing a normal velocity of zero.

3.3. Calibration Approach

The calibration phase consisted in the iteration of introducing parameters and initial data to the code for the model to be executed, and comparing the results with those observed/measured in the zone. This process was repeated until the model matched the required error. If there was a considerable discrepancy between modelled and observed data, initial data of the model were modified and the process was iterated. Calibration ended when the difference between modelled and observed data was below the value of the expected error. For this case, the parameters to calibrate were the flow speeds.
For a correct calibration, Chezy coefficients in the field measured speeds were modified until finding their adequate values for this ground, in order to yield to a more precise comparison between modelled and observed speeds. The calibrated Chezy coefficient was 55.30. The friction coefficients were determined by processing satellite images.
To corroborate the quality of the bathymetry, it was compared with a previous one taken by the government agency INEGI [80]. Moreover, the bathymetry obtained for this study was of much higher resolution than the official one.
Figure 9 shows the computed flow velocities. These velocities must be compared with the measured ones, shown in Figure 6.
The error between measured and calculated values of flow speed for calibration purposes were performed in the points of the spatial mesh (see Figure 6). For the zone called “Los Arenales”, 704 m upstream of the Tamuín–San Vicente bridge, the error corresponds to 14.9% (see Figure 6 and Figure 9). Within the turbulence zone, the lower riverbed, 537 m upstream of Tamuín–San Vicente bridge, the experimental error is 8.09% (see Figure 6). Within the upper riverbed, 246 m upstream of Tamuín–San Vicente bridge, the error is 6.74% (see Figure 6).

3.4. Future Precipitations in the Zone Under Study

To assess flood risk in the zone for future rainfall events driven by CC, the considered projected precipitations for the next decades are those reported by IPCC [74]. The difference in the 20-year return value of annual precipitation extremes of the 2046–2065 period with respect to the 1986–2005 baseline period for the region under study was 10%. This result was obtained in the ensemble of climate models participating in the Coupled Model Intercomparison Project Phase 5 (CMIP5) [72], for the RCP4.5 scenario, which stabilises radiative forcing at 4.5 Wm 2 in the year 2100 without ever exceeding that value. RCP4.5 includes long-term, global emissions of greenhouse gases, short-lived species, and land-use/land-cover in a global economic framework [73].
To perform comparable simulations between the numerical flood in the zone considering both historical and projected precipitations, the 20-year return values in Table 1 were corrected by considering an increment of 12% in the precipitations, i.e., considering a 2% above the IPCC projected value (10%) as a security factor. Considering this is a small alluvial valley [76], the precipitation values were transformed to peak flows using the TUH method [82].

3.5. Numerical Experiments

To better assess the potential influence of CC in the flood risk in the next decades in the region under study, we performed two numerical experiments: the first by feeding the numerical model with historical data of the 20-year return values in Table 1, and the second one considering these values with the mentioned correction, in order to find a critical maximum expected precipitation for the next 50 years.
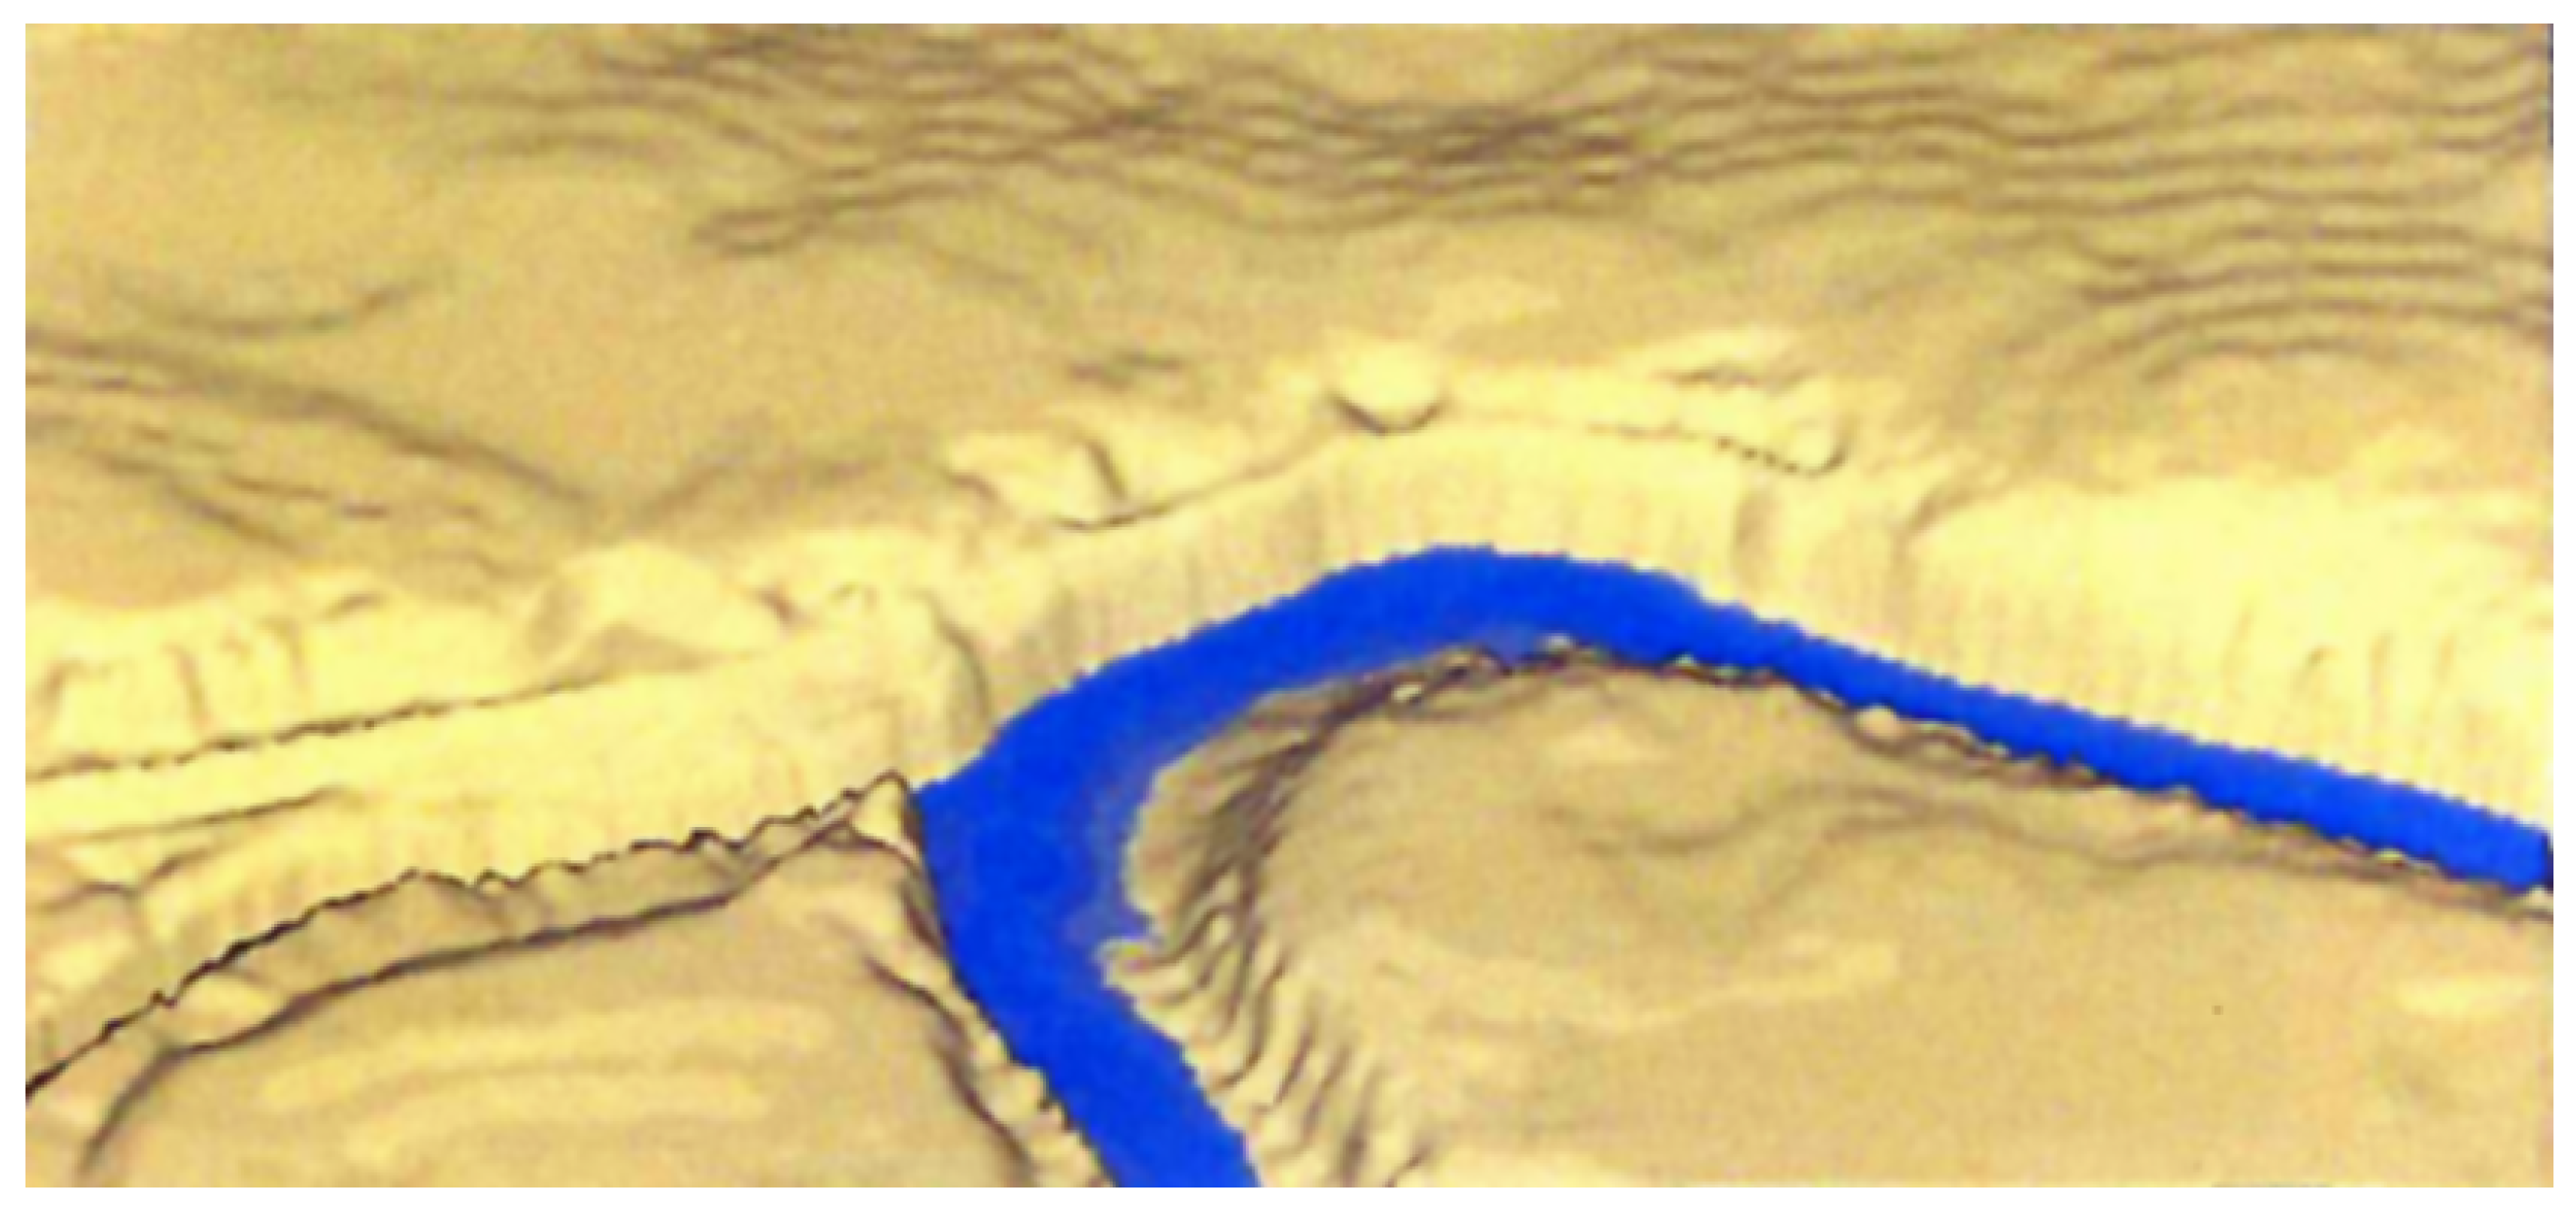
For the two performed numerical experiments, the initial level of the river was taken as the one measured in the second measurement campaign, as shown in Figure 10, where a 3D view of the surrounding topography can also be observed. The experiments were performed in the wet season to work with extreme flooding events.
The numerical experiments were performed as follows:
  • A first simulation was set up with historical data with a 20-year return value.
  • The time at which the cross section of Tamuín city settled in the lower part of topography (Figure 5) was fully flooded was recorded.
  • A second simulation was set up with the projected streamflows under CC.
  • The time at which the second simulation achieved the flood level of the first experiment was recorded.
  • Comparison between flooding times was performed.
Please note that the flooding times were obtained numerically by integrating the total discharge within the domain.

4. Results

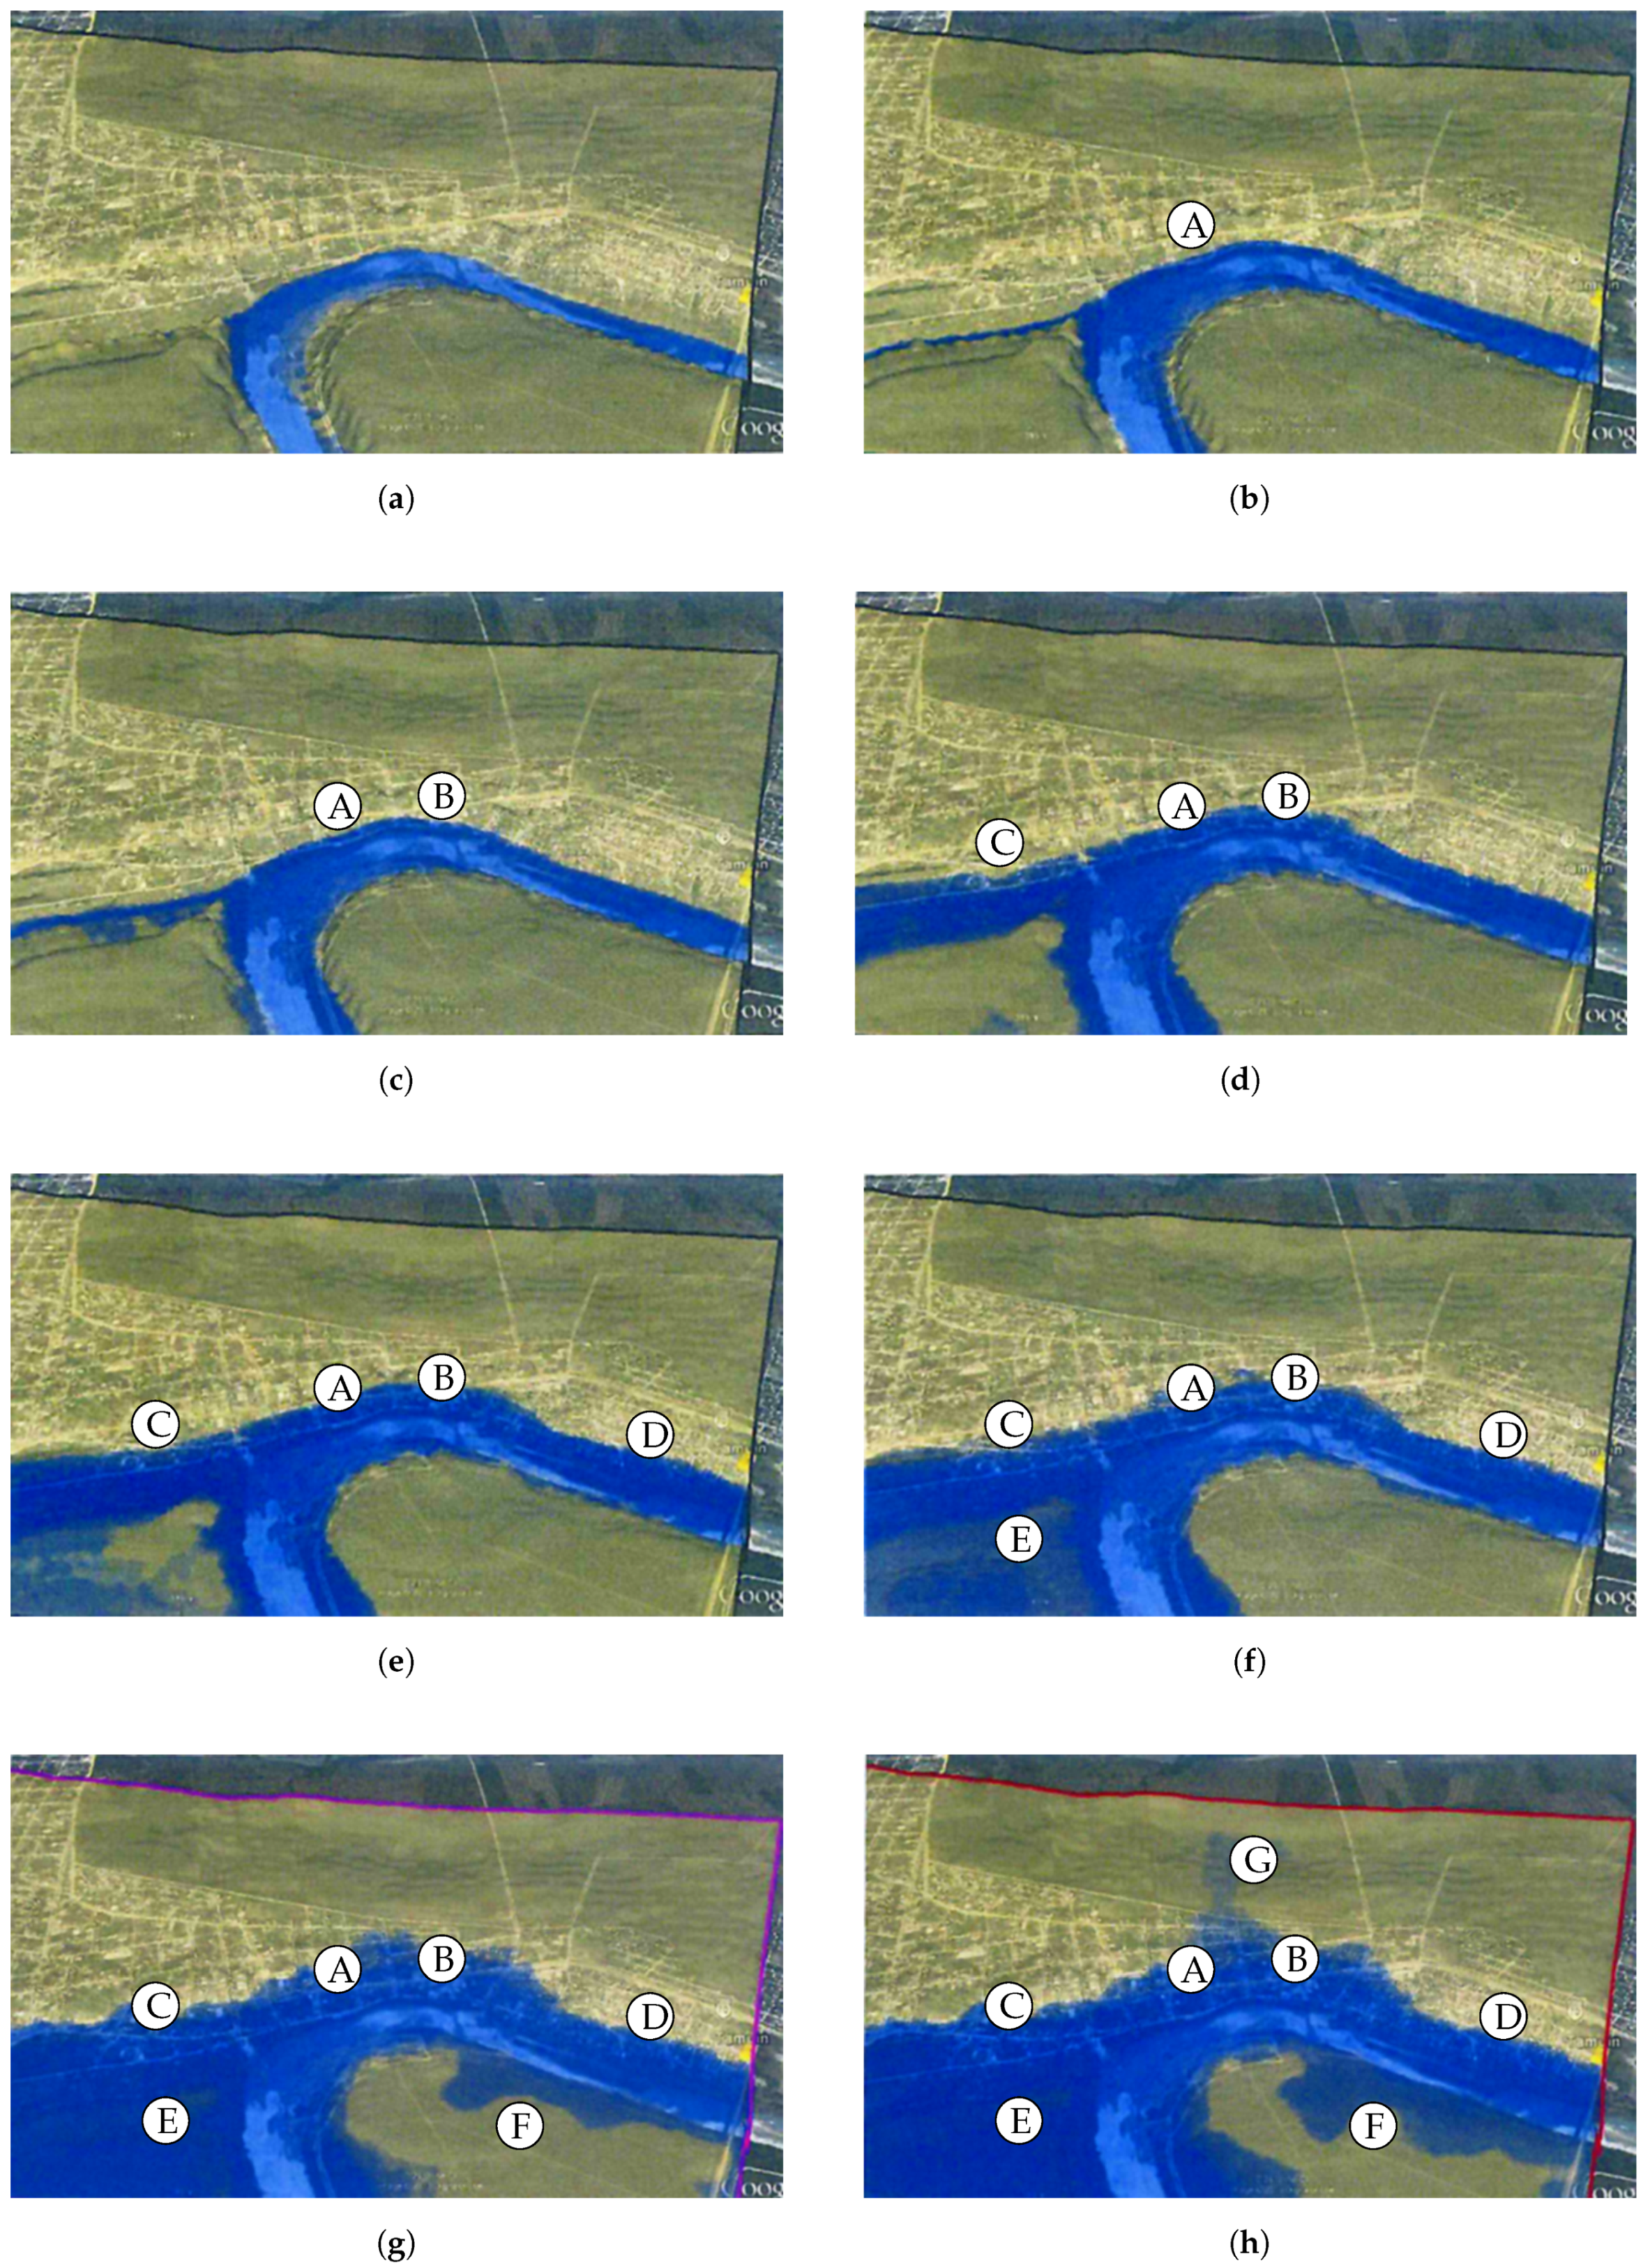
Figure 11 shows representative snapshots of the flooding process of the region under study with the rainfall setups aforementioned. The eight presented snapshots were selected according to the flooding of critical zones previously identified by the local government, and they are labelled in the screenshots as (A)–(G) according to the sequence in which they subsequently flood.
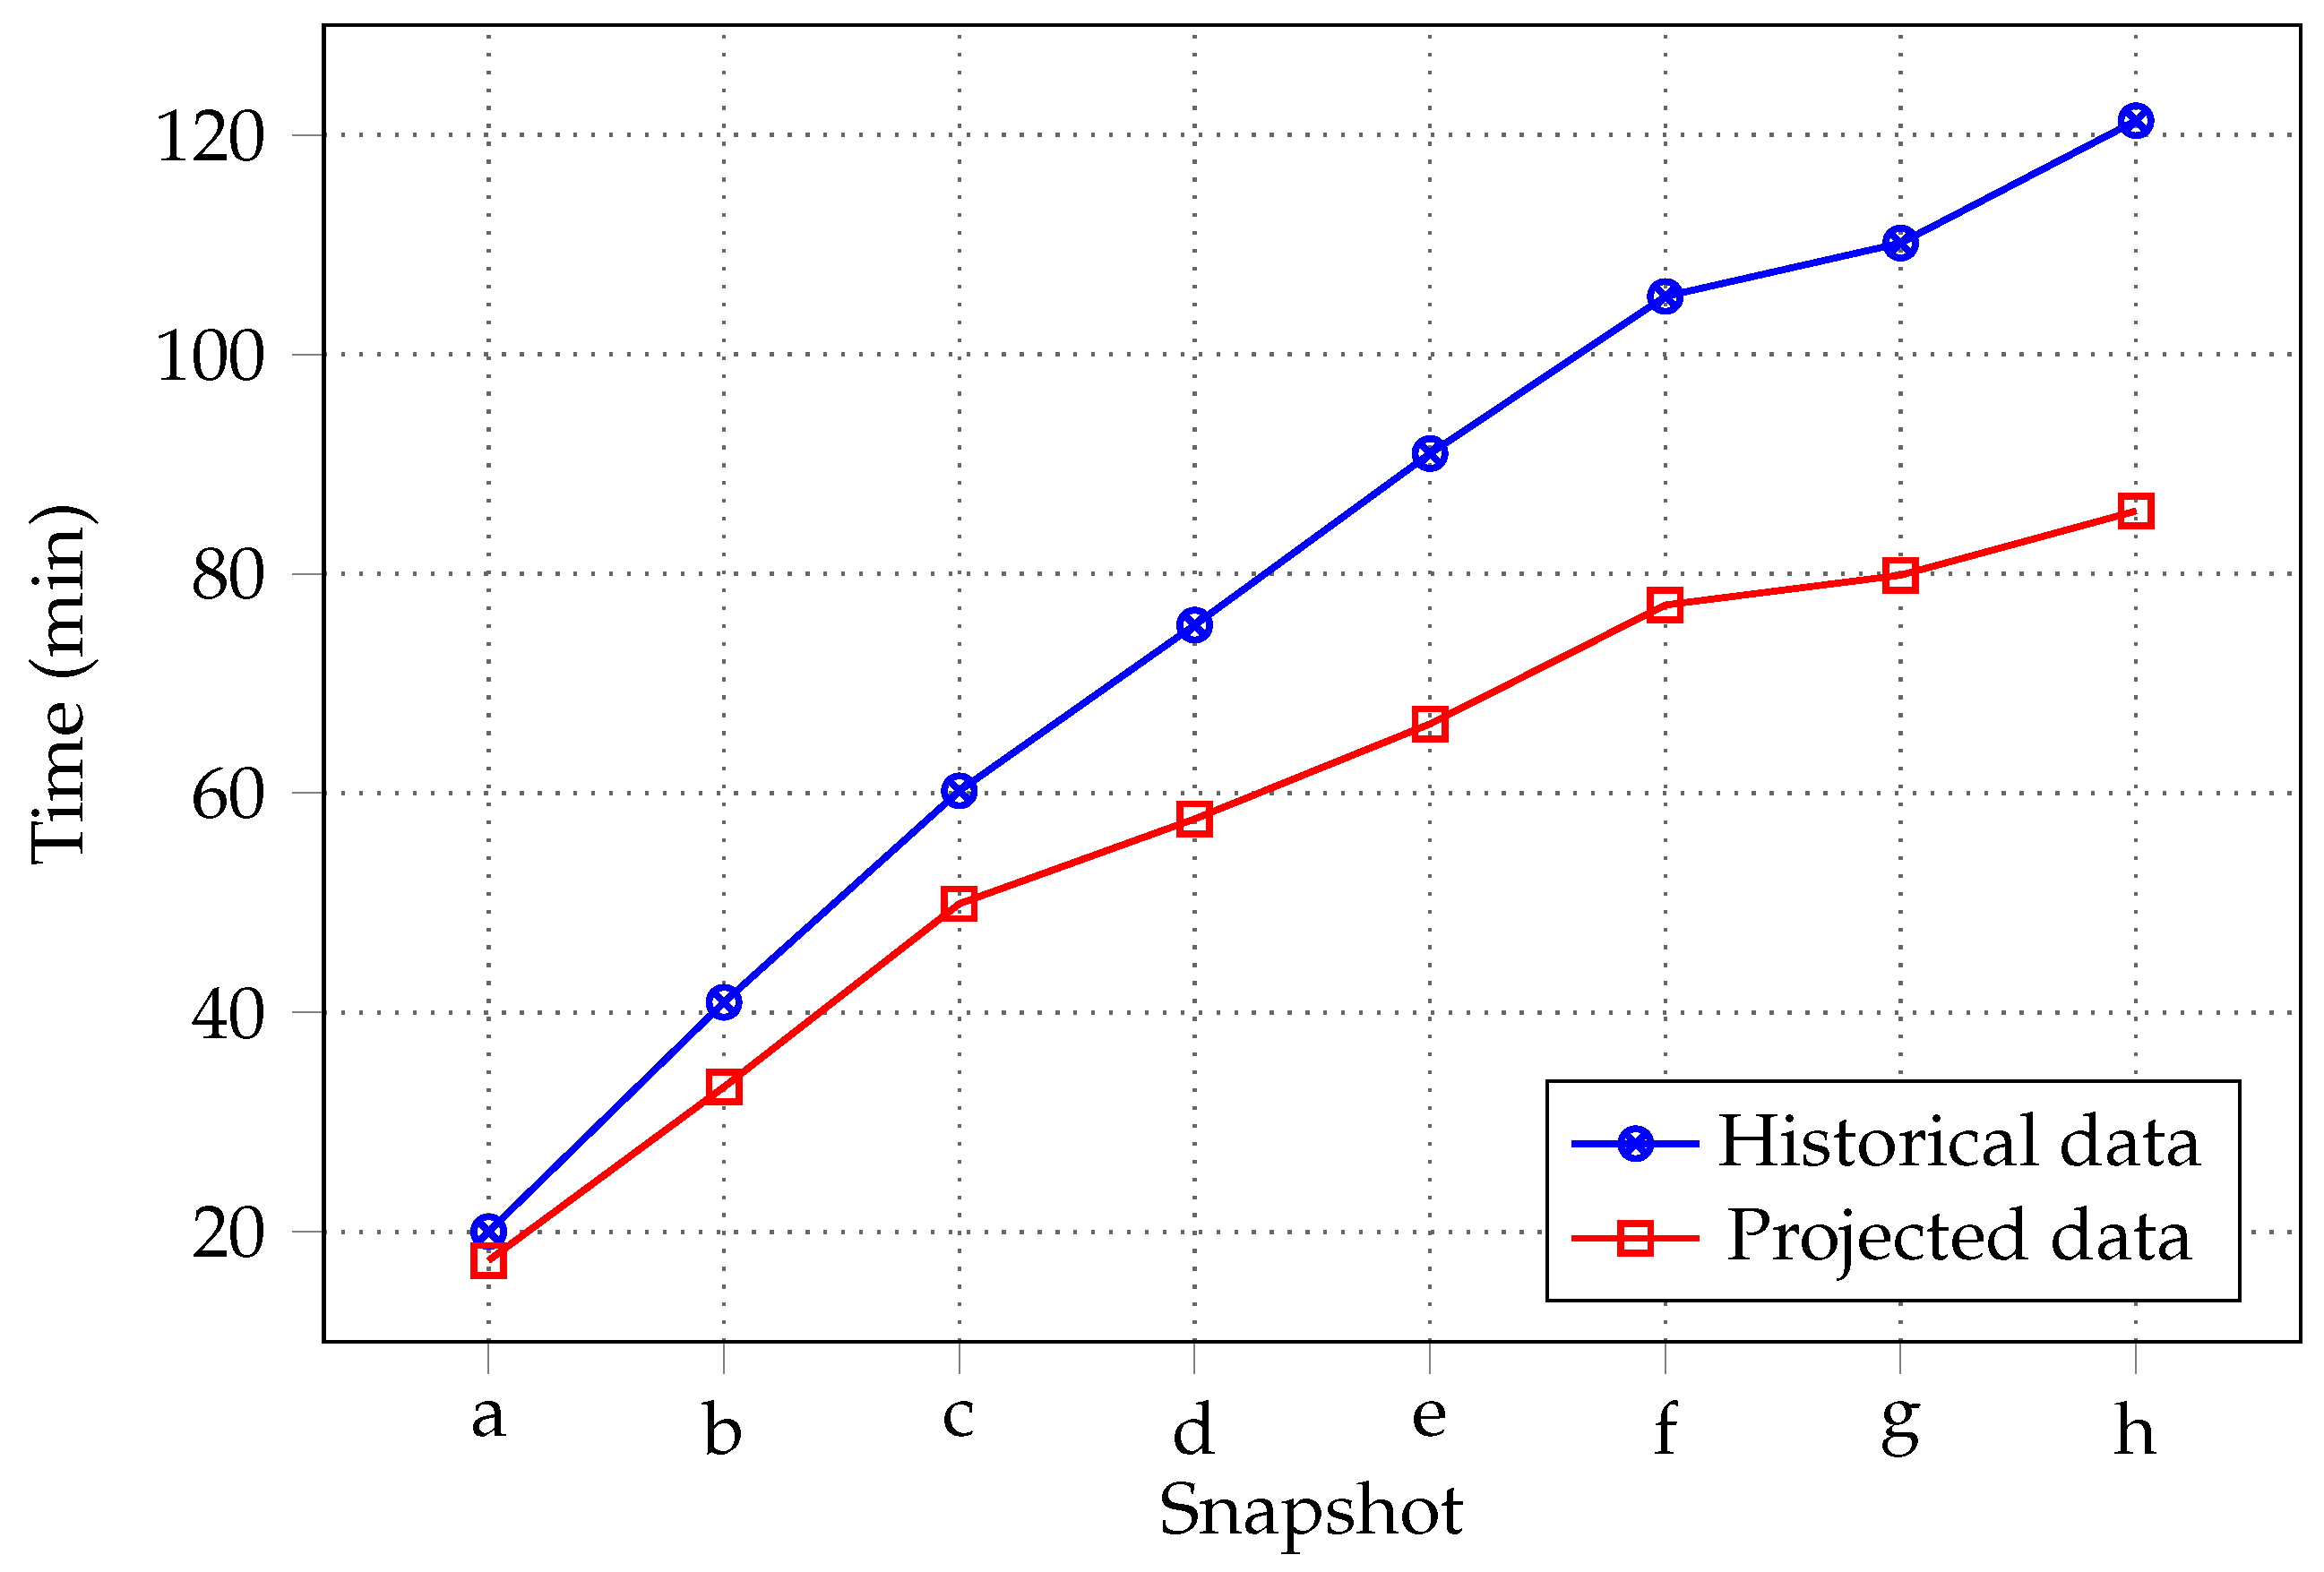
The time at which each flooding state (snapshot) was obtained for both numerical experiments (with historical data and with CC projected precipitations) is shown in Figure 12.

5. Discussion

The identification of the zones prone to flooding, (A)–(G) with respect to time, is fundamental for Tamuín city to perform a critical route map to perform the necessary civil work to safeguard population. This route map is long-term due to the budget limitations of such a small municipality.
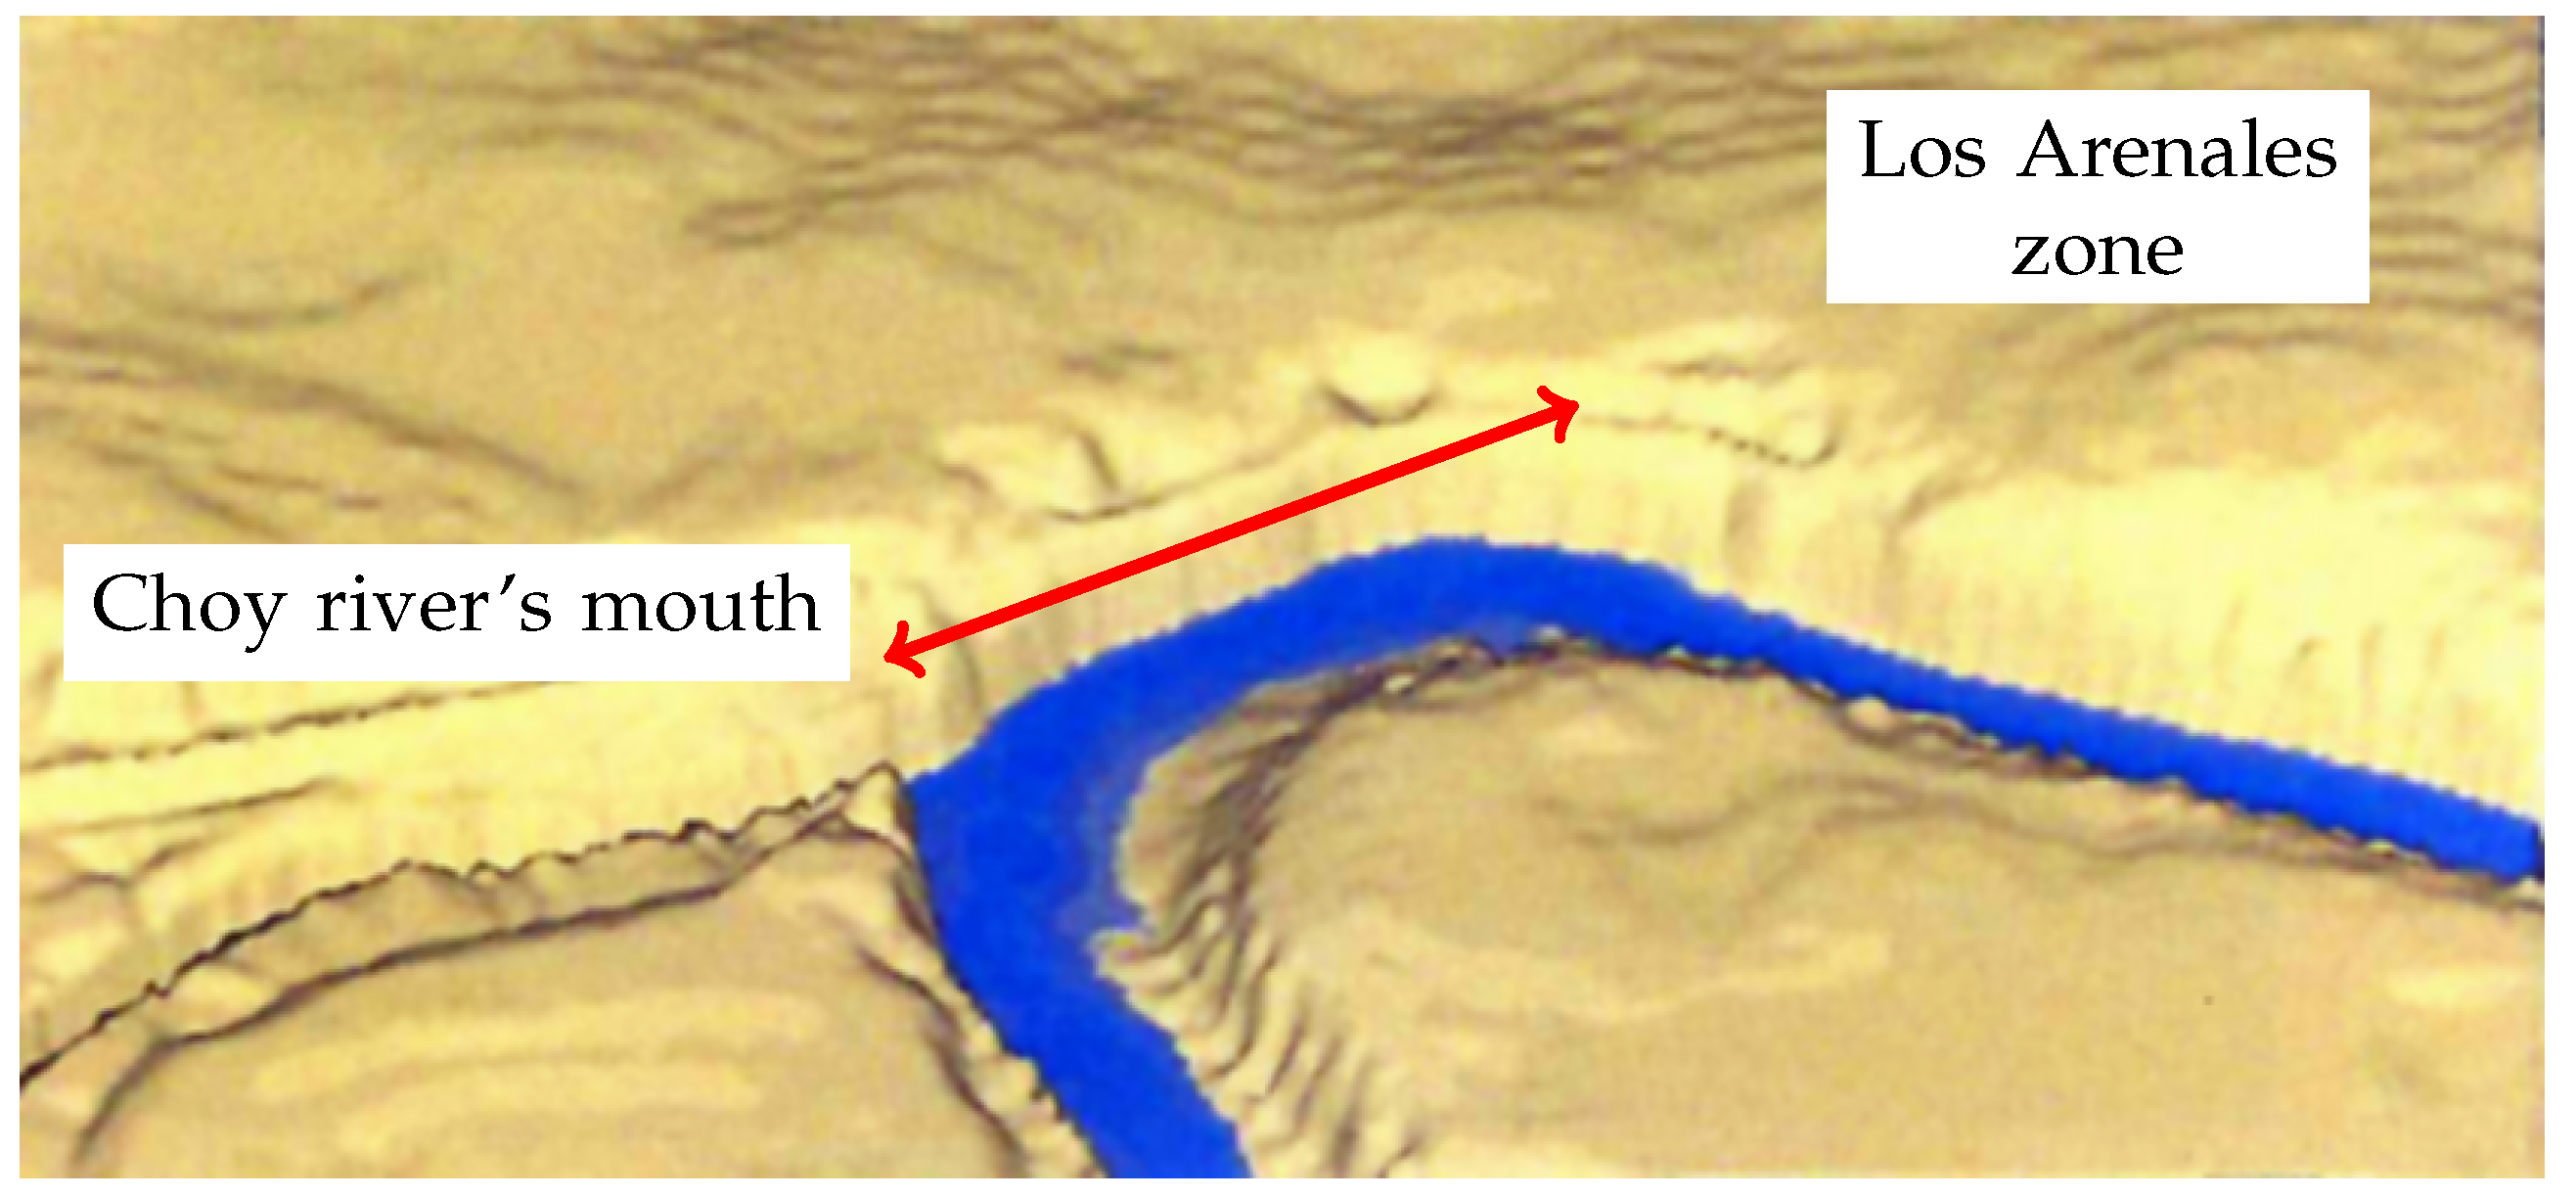
As is well known, adaptation plans only based on rising flood protections have the effect of reducing the frequency of small floods and exposing society to less-frequent but catastrophic floods and potentially long recovery processes [44]. In this sense, and with the idea of reducing the frequency of small floods in Zones (A) and (B), the first action undertaken by local government is to erect a gabion-based wall to protect Zone (A), from the beginning of the Choy River mouth up to the beginning of Los Arenales zone (see Figure 13), which is being built at the time of writing this manuscript.
To create greater resilience to flooding in Zones (B)–(D), public areas are being transformed into flood-resilient urban parks [87]. For extreme flooding episodes, in Zones (F) and (G), which are dedicated to agriculture and cattle farming, the idea is to augment the hydraulic capacity of the main river channels with the installation of meanders, in combination with the installation of dredging stations at the end of these [88].
With respect to the simulated times at which certain flooding stages were obtained for both precipitation scenarios, it can be observed that, in the natural conditions (before any civil work), the south shore of Tamuín city (Figure 11d) gets flooded in approximately 75 min considering an extreme rainfall episode from the historical 20-year return period. Nevertheless, this time is reduced by 23.46% with precipitations taking into account CC projections up to about 57 min.
In the most extreme considered rainfall scenario, the flooding in Figure 11h would occur in about 121 min according to historical precipitation values, while, considering the projections of rainfall intensified by CC, this scenario would be reached in about 86 min, that is, 29.33% faster.
These simulated flooding times are actually being considered by local authorities in order to redesign civil protection plans so they can evacuate inhabitants in enough time in the case of disaster. As for the inhabitants, a plan to induce actions of self-protection is under construction [89].

6. Conclusions

In this paper, we develop a hydrodynamics-based flooding model taking into account the bathymetry and surrounding topography to assess the flood risk of Tamuín city, Mexico, due to Tampaón River in both historical and climate change projected precipitation scenarios. To achieve realistic hydrodynamics, a horizontal mixing length model for turbulence, as well as shear stresses due to wind and bottom are considered.
Simulations allowed identifying the zones prone to flooding according to different rainfall periods, in both scenarios. Severe flooding episodes are expected to occur between 25% and 30% more quickly considering an increment tendency of 12% for the 20-year return values expected by CMPI5 CC modelling under an RCP4.5 radiative scenario. These results show an important regional increasing trend in the future local precipitations, which contrasts with that recently reported by Ishak and Rahman [90], Ishak et al. [91], who found regional decreasing trends in annual maximum floods in Australia. Results also allow projecting policies to increase Tamuín city resilience to flood, as well as to better draw local civil protection plans.
Finally, it is important to recall that Tamuín municipality is enclosed in a very rural environment, far from large urban settlements. In this sense, this study sets a precedent in the study of the impact of CC in the northeast part of Mexico, in the challenging arena that constitutes the triangle of climatic conditions that join in this zone: the humid mild weather in the east due to the presence of the Gulf of México (in Tamaulipas and Veracruz states), the very dry and desert one in the north (in Nuevo León and Coahuila states), and the steppe weather in the west in the mid zone of San Luis Potosí (in the Eastern Mountain Range, or Sierra Madre Oriental in Spanish). As no previous studies of the effects of CC in this zone exist (to the knowledge of the authors), we expect this work to be a cornerstone to build a robust knowledge of the local impacts of CC so as to be able to protect both nature and human lives, as this geographical region is characterised by a very rich biodiversity, and it is estimated to be inhabited by more than 5 million people.

Future Work

The next step is to widen this study by performing the simulations considering the whole Huasteca Potosina region, which has an approximate area of 32,000 km 2 , to extend the results for them to be useful to a larger population. Another path is to consider long term projections of rainfall for the late century (2080–2100).

Author Contributions

Conceptualisation, C.R.-C.; methodology, I.M.; software, C.C.-C.; validation, C.R.-C.; formal analysis, C.R.-C. and J.J.H.-G.; investigation, I.M.; resources, H.R.-E.; data curation, H.R.-E.; writing—original draft preparation, J.J.H.-G. and C.C.-C.; visualisation, C.C.-C.; supervision, C.R.-C.; project administration, H.R.-E.; funding acquisition, C.C.-C., I.M. and J.J.H.-G.; and writing—-review and editing, J.J.H.-G.

Funding

This research was funded by Secretaría de Investigación y Posgrado, Instituto Politécnico Nacional grant numbers 20195343, 20190136 and 20195634. The APC was funded by Universidad Autónoma de San Luis Potosí.

Acknowledgments

Authors acknowledge EDI grant by Secretaría de Investigación y Posgrado, Instituto Politécnico Nacional, as well as Facultad de Ingeniería, Universidad Autónoma de San Luis Potosí for the facilities to develop this investigation.

Conflicts of Interest

The authors declare no conflict of interest. The funders had no role in the design of the study; in the collection, analyses, or interpretation of data; in the writing of the manuscript, or in the decision to publish the results.

Appendix A. Hydrodynamics

Appendix A.1. Hydrodynamic Equations

The system equations used to calculate the velocity fields are the Reynolds-averaged Navier–Stokes equations for shallow-water flows [70], which are:
U t + U U x + V U y = g η x + ν T H 2 U x 2 + 2 U y 2 τ x b H + τ x w H ,
V t + U V x + V V y = g η y + ν T H 2 V x 2 + 2 V y 2 τ y b H + τ y w H ,
where U and V are the depth-averaged velocity components in x and y directions, respectively (m/s); g is the gravity’s acceleration (m/s 2 ); η represents the free surface elevation (m); ν T H is the horizontal eddy viscosity (m 2 /s); H is the water depth (m); τ x w and τ y w are the wind shear stress terms in x and y directions, respectively; and τ x b and τ y b are the corresponding x and y direction bottom shear stresses. Shear stresses units are m 2 /s 2 .
To compute the free surface elevation ( η ), we integrate the continuity equation over the water depth. After applying a kinematic condition at the free surface, we have
η t = H U x H V y .
To obtain realistic modelling, a model of turbulence has been introduced to simulate mechanical dispersion phenomenon. A mixing-length model for turbulence is applied [70], which contributes to the horizontal eddy viscosity as:
ν T H = l h 4 2 U x 2 + 2 V y 2 + V x + U y 2 ,
where l h = β l v is the horizontal mixing length (m), β is a dimensionless constant, and l v (m) is defined as:
l v = { κ ( η z b ) if ( η z b ) < α λ z b if ( η z b ) > α ,
where z b is bathymetry (m), and α = λ η κ , λ and κ are dimensionless constants (the later is the von Kármán constant). It must be remarked that this turbulence model was the one that best fitted the measured values of the four mixing-length models that were tested for this study.
On the other side, wind shear stress terms in Equations (A1) and (A2) are given by:
τ x w = C w ρ w ω x ω x ,
τ y w = C w ρ w ω y ω y ,
where ρ w is air density (kg/m 3 ); ω x and ω y are the wind speeds measured 10 m above the ground level in x and y directions, respectively; and C w is the wind drag coefficient given by the Garrat formulation C w = ( 0.75 + 0.067 ω 10 ) / 1000 , where ω 10 is the magnitude of the wind speed 10 m above the ground level (m/s).
Finally, the bottom shear stress terms in x and y directions are computed as:
τ x b = g U 2 + V 2 C z 2 U ,
τ y b = g U 2 + V 2 C z 2 V ,
where C z is the Chezy coefficient. This hydrodynamic model has been calibrated according to Casulli and Cheng [92], and has been tested in [67,68,70,93].

Appendix B. Numerical Solution Strategy
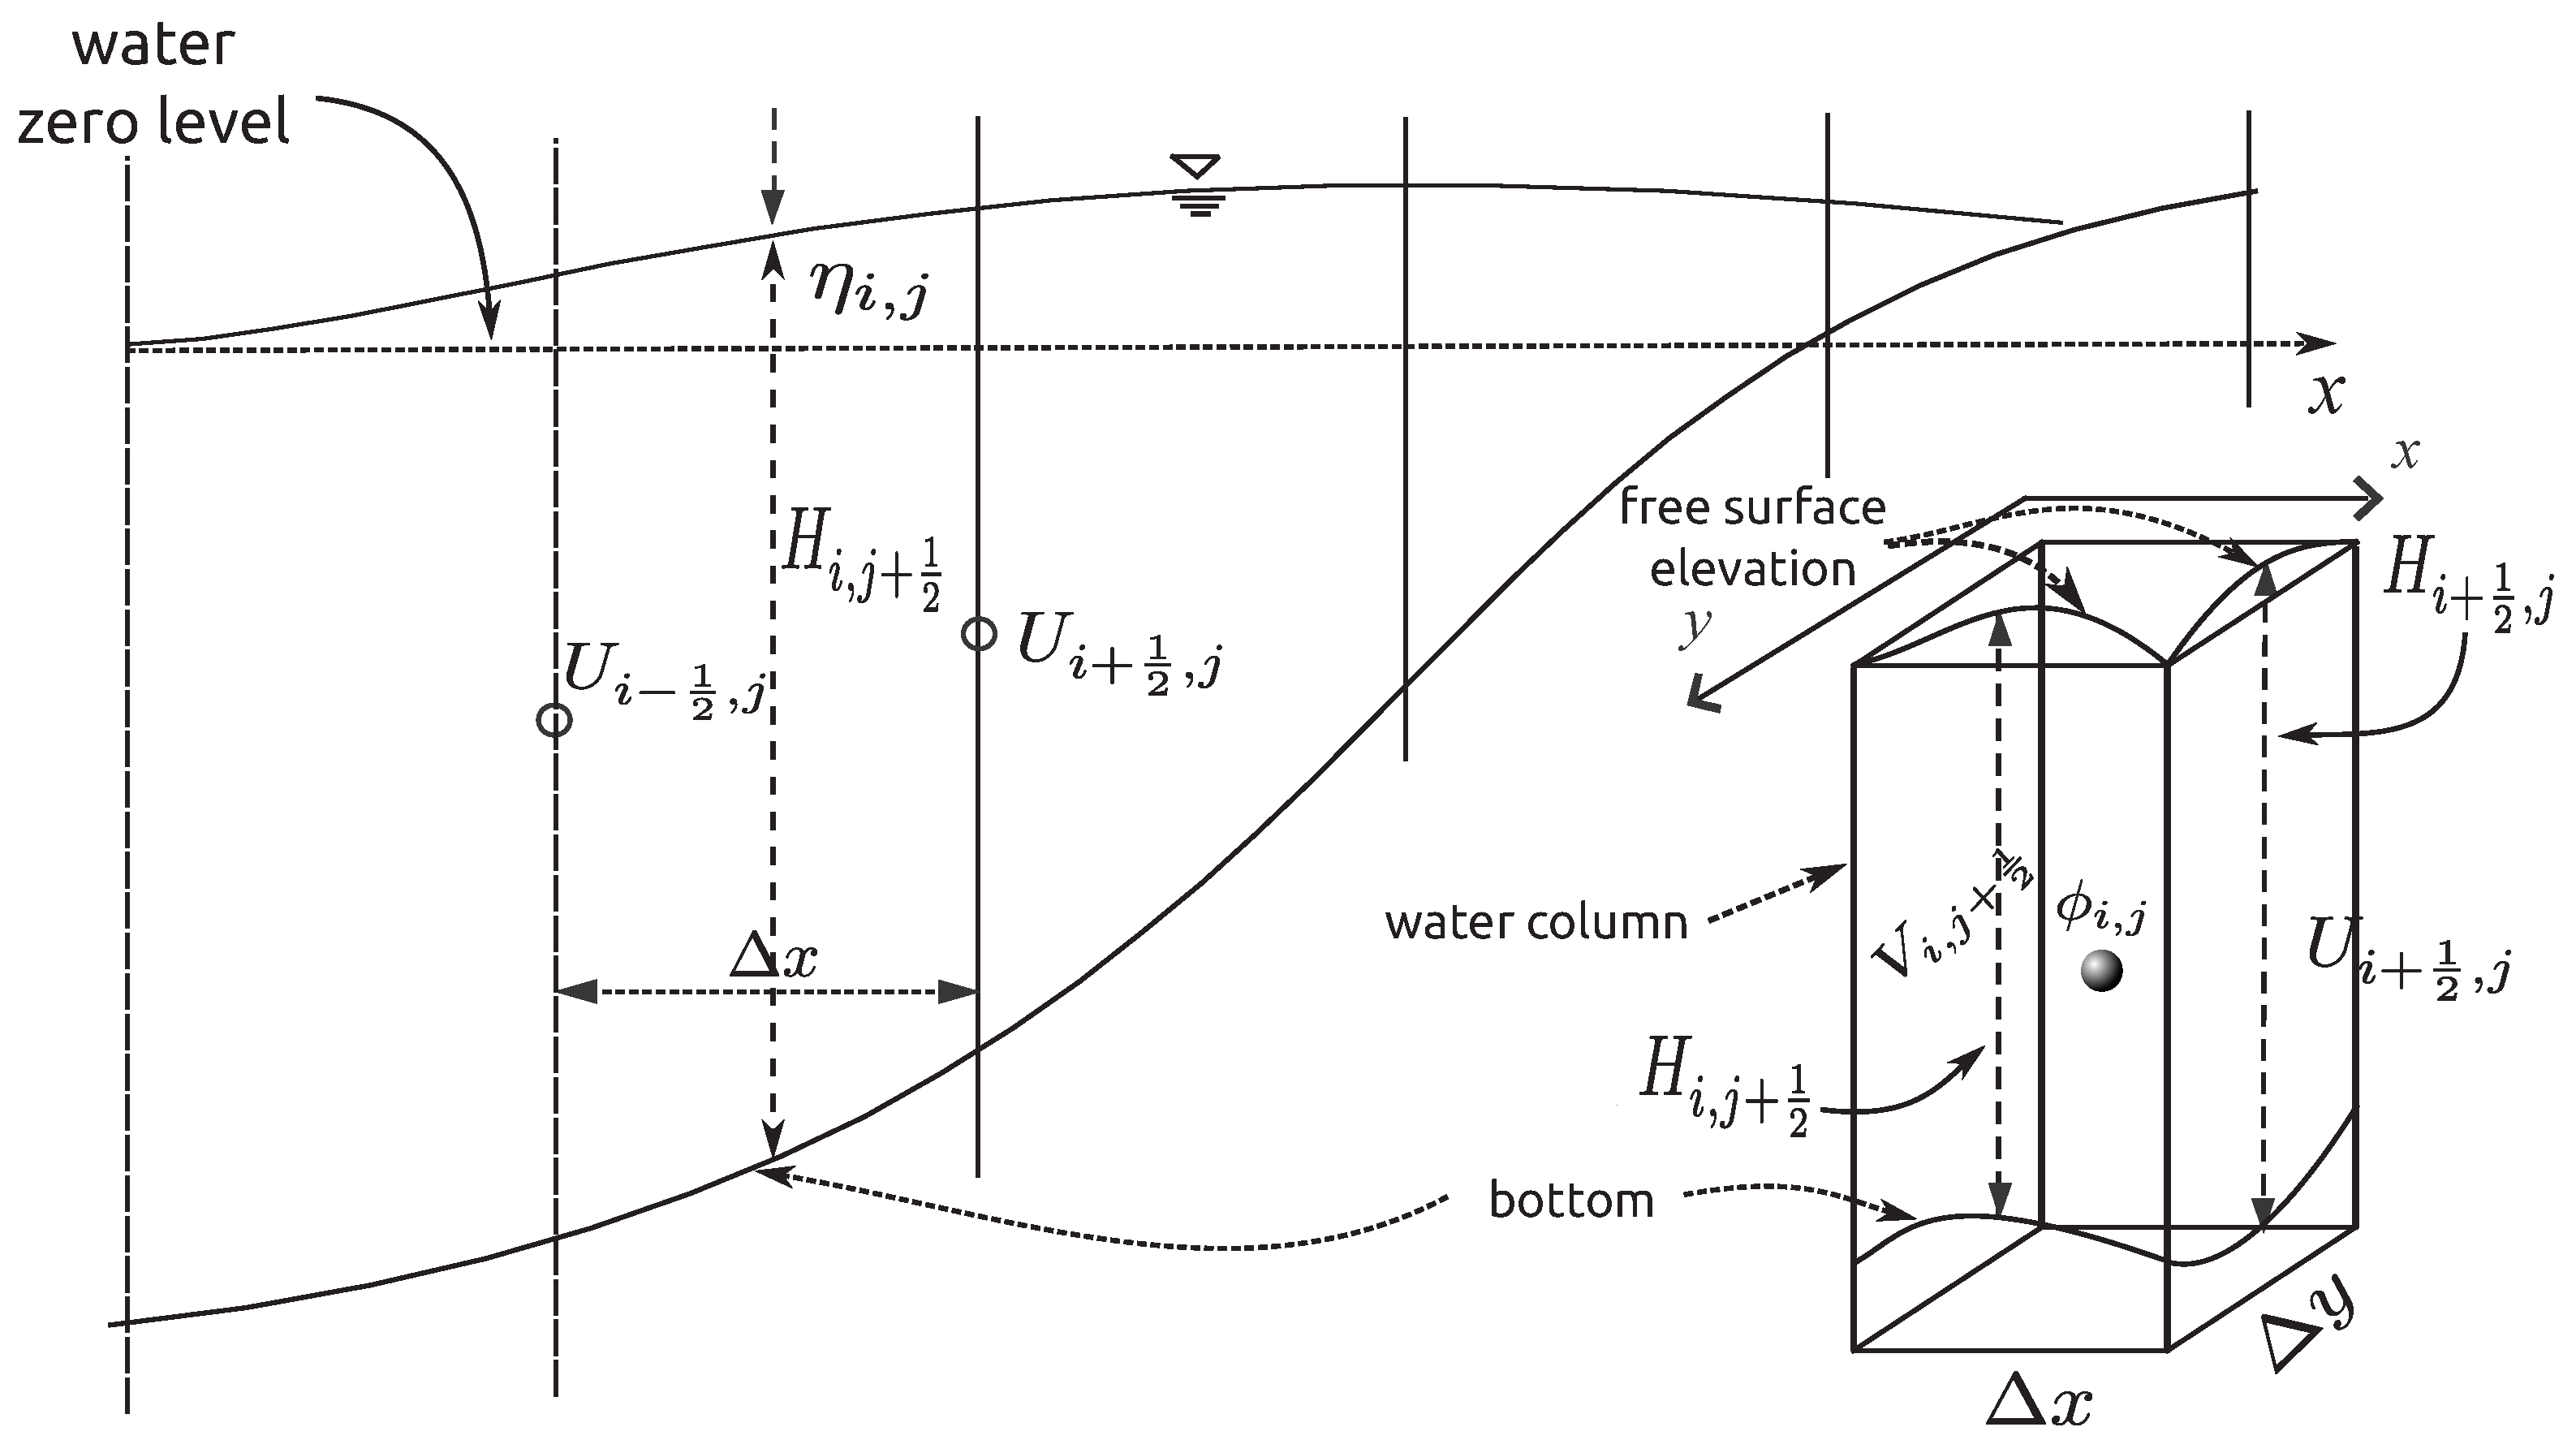
To solve the coupled PDEs system posed in the previous section, a second-order finite difference formulation in both time and space is used. The solution scheme adapts the semi-implicit Eulerian–Lagrangian scheme by Casulli and Cheng [92], treating the advection and diffusion terms differently. While the solution of the non-linear advection terms of Equations (A1) and (A2) is found with a Lagrangian formulation through the characteristics method, diffusion terms are treated in a Eulerian manner through the Adams–Bashforth scheme.
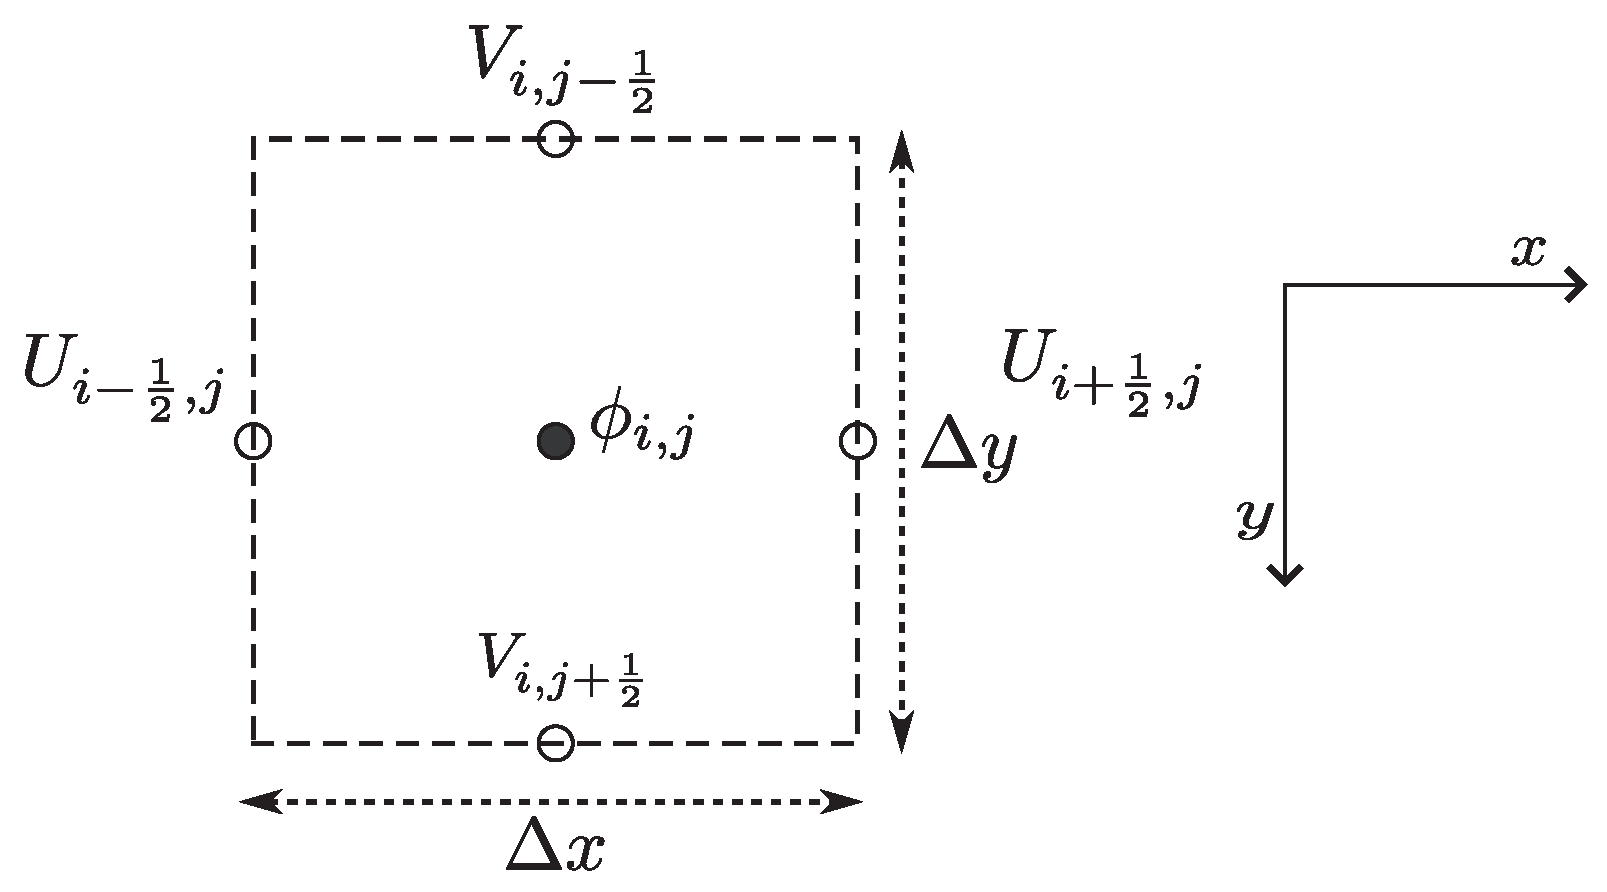
A two-dimensional staggered mesh for the numerical computations is used (Figure A1 and Figure A2). The centre of the cell (black dot) represents free surface elevation ( φ i , j ), while circles on the faces of the cell represent the velocity components U and V. As the model’s spatial resolution has a direct impact in assessing the impact of CC on flooding [94], we have set the mesh resolution to 5 m.
Figure A1. Vertical mesh arrangement.
Water 11 01867 g0a1
Figure A2. Discretization Cell (top view).
Water 11 01867 g0a2
In Figure A1, H i + 1 2 , j is the water depth at ( i + 1 2 , j ) , where the U velocity component is evaluated, and H i , j + 1 2 is the water depth at point ( i , j + 1 2 ) , where the V velocity component is evaluated.
The solution of the system of Equations (A1)–(A3) is given through a linear systems as follows:
U i + 1 / 2 , j n + 1 = F U i + 1 / 2 , j n g Δ t Δ x η i + 1 , j n + 1 η i , j n + 1 + Δ t H i + 1 / 2 , j n τ x ω Δ t H i + 1 / 2 , j n τ x b ,
V i , j + 1 / 2 n + 1 = F V i , j + 1 / 2 n g Δ t Δ y η i , j + 1 n + 1 η i , j n + 1 + Δ t H i , j + 1 / 2 n τ y ω Δ t H i , j + 1 / 2 n τ y b ,
η i , j n + 1 = η i , j n Δ t Δ x H i + 1 / 2 , j U i + 1 / 2 , j n + 1 H i 1 / 2 , j U i 1 / 2 , j n + 1 Δ t Δ y H i , j + 1 / 2 U i , j + 1 / 2 n + 1 H i , j 1 / 2 U i , j 1 / 2 n + 1 ,
where F U and F V join the advective and the turbulent diffusion terms as:
F U i + 1 / 2 , j n = U i + 1 / 2 , j n + ν T H Δ t U i + 3 / 2 , j n 2 U i + 1 / 2 , j n + U i 1 / 2 , j n Δ x 2 + U i + 1 / 2 , j + 1 n 2 U i + 1 / 2 , j n + U i + 1 / 2 , j 1 n Δ y 2 ,
F V i , j + 1 / 2 n = V i , j + 1 / 2 n + ν T H Δ t V i + 1 , j + 1 / 2 n 2 V i , j + 1 / 2 n + V i 1 , j + 1 / 2 n Δ x 2 + V i , j + 3 / 2 n 2 V i , j + 1 / 2 n + V i , j 1 / 2 n Δ y 2 ,
where U n and V n are the explicit velocity components, computed at time n using the characteristics method as:
U i + 1 / 2 , j n = U i + 1 / 2 a , j b n = 1 p 1 q U i + 1 / 2 l , j m n + q U i + 1 / 2 l , j m 1 n + p 1 q U i + 1 / 2 l 1 , j m n + q U i + 1 / 2 l 1 , j m 1 n
where a and b are the Courant numbers in x and y directions, respectively, from which l and m are the integer parts, and p and q the decimal parts.
The present numerical model has been validated and applied in different studies, each of which has consisted in controlled experiments and real free surface flows in rivers, lakes, lagoons, estuaries and nearshore waters. The numerical model was initially validated by León et al. [66] to study the dispersion of saline plumes in coastal zones. It was also used to predict the thermal plume dispersion of the Laguna Verde Nuclear Power Plant, located in Mexico [67]. Barrios-Piña et al. [68] used the code to probe a new turbulence model for flow through vegetation. On the other side, Torres-Bejarano et al. [69] recently used it to assess pollution distribution in an estuarine ecosystem. Turbulence models attached to the hydrodynamic model were tested by Rodriguez-Cuevas et al. [70], where several turbulence models were coded to predict wakes around conic islands, and the results showed good agreement with the measurements experiments.

Software

For the sake of efficiency, the algorithm was coded in Fortran®, and it was parallelised through the OpenMP paradigm. The model (bathymetry and topography) were an input of the Fortran code and they were coded as CSV text files. The succeeding results were visualised with TecPlot®.

References

  1. Interngubernamental Panel on Climate Change. IPCC: Working Group I Contribution to the IPCC Fifth Assessment Report, Climate Change 2013: The Physical Science Basis. IPCC. AR5; Interngubernamental Panel on Climate Change: Paris, France, 2014. [Google Scholar]
  2. Suarez Gallareta, E.; Hernández Gómez, J.J.; Cetzal Balam, G.; Orozco del Castillo, M.; Moreno Sabido, M.; Silva Aguilera, R.A. Sistema Híbrido Basado en Redes Neuronales Artificiales y Descomposición Modal Empírica para la Evaluación de la Interrelación entre la Irradiancia Solar Total y el Calentamiento Global. Res. Comput. Sci. 2018, 147, 319–332. [Google Scholar]
  3. Dong, B.; Sutton, R.T.; Shaffrey, L.; Klingaman, N.P. Attribution of forced decadal climate change in coupled and uncoupled ocean—Atmosphere model experiments. J. Clim. 2017, 30, 6203–6223. [Google Scholar] [CrossRef]
  4. Kay, J.E.; Wall, C.; Yettella, V.; Medeiros, B.; Hannay, C.; Caldwell, P.; Bitz, C. Global climate impacts of fixing the Southern Ocean shortwave radiation bias in the Community Earth System Model (CESM). J. Clim. 2016, 29, 4617–4636. [Google Scholar] [CrossRef]
  5. Saba, V.S.; Griffies, S.M.; Anderson, W.G.; Winton, M.; Alexander, M.A.; Delworth, T.L.; Hare, J.A.; Harrison, M.J.; Rosati, A.; Vecchi, G.A.; et al. Enhanced warming of the Northwest Atlantic Ocean under climate change. J. Geophys. Res. Ocean. 2016, 121, 118–132. [Google Scholar] [CrossRef]
  6. Tang, Q.; Oki, T. Terrestrial Water Cycle and Climate Change: Natural and Human-Induced Impacts; John Wiley & Sons: Hoboken, NJ, USA, 2016. [Google Scholar]
  7. Tian, H.; Yang, Q.; Najjar, R.G.; Ren, W.; Friedrichs, M.A.; Hopkinson, C.S.; Pan, S. Anthropogenic and climatic influences on carbon fluxes from eastern North America to the Atlantic Ocean: A process-based modeling study. J. Geophys. Res. Biogeosci. 2015, 120, 757–772. [Google Scholar] [CrossRef]
  8. Xia, X.; Wu, Q.; Mou, X.; Lai, Y. Potential impacts of climate change on the water quality of different water bodies. J. Environ. Inform. 2015, 25, 85–98. [Google Scholar] [CrossRef]
  9. Schwefel, R.; Gaudard, A.; Wüest, A.; Bouffard, D. Effects of climate change on deepwater oxygen and winter mixing in a deep lake (Lake Geneva): Comparing observational findings and modeling. Water Resour. Res. 2016, 52, 8811–8826. [Google Scholar] [CrossRef]
  10. Hetherington, A.L.; Schneider, R.L.; Rudstam, L.G.; Gal, G.; DeGaetano, A.T.; Walter, M.T. Modeling climate change impacts on the thermal dynamics of polymictic Oneida Lake, New York, United States. Ecol. Model. 2015, 300, 1–11. [Google Scholar] [CrossRef]
  11. Butcher, J.B.; Nover, D.; Johnson, T.E.; Clark, C.M. Sensitivity of lake thermal and mixing dynamics to climate change. Clim. Chang. 2015, 129, 295–305. [Google Scholar] [CrossRef] [Green Version]
  12. Cousino, L.K.; Becker, R.H.; Zmijewski, K.A. Modeling the effects of climate change on water, sediment, and nutrient yields from the Maumee River watershed. J. Hydrol. Reg. Stud. 2015, 4, 762–775. [Google Scholar] [CrossRef]
  13. Mohammed, I.N.; Bomblies, A.; Wemple, B.C. The use of CMIP5 data to simulate climate change impacts on flow regime within the Lake Champlain Basin. J. Hydrol. Reg. Stud. 2015, 3, 160–186. [Google Scholar] [CrossRef] [Green Version]
  14. Stefanova, A.; Krysanova, V.; Hesse, C.; Lillebø, A.I. Climate change impact assessment on water inflow to a coastal lagoon: the Ria de Aveiro watershed, Portugal. Hydrol. Sci. J. 2015, 60, 929–948. [Google Scholar] [CrossRef]
  15. Hesse, C.; Krysanova, V.; Stefanova, A.; Bielecka, M.; Domnin, D.A. Assessment of climate change impacts on water quantity and quality of the multi-river Vistula Lagoon catchment. Hydrol. Sci. J. 2015, 60, 890–911. [Google Scholar] [CrossRef]
  16. Robins, P.E.; Skov, M.W.; Lewis, M.J.; Gimenez, L.; Davies, A.G.; Malham, S.K.; Neill, S.P.; McDonald, J.E.; Whitton, T.A.; Jackson, S.E.; et al. Impact of climate change on UK estuaries: A review of past trends and potential projections. Estuar. Coast. Shelf Sci. 2016, 169, 119–135. [Google Scholar] [CrossRef] [Green Version]
  17. Yang, Z.; Wang, T.; Voisin, N.; Copping, A. Estuarine response to river flow and sea-level rise under future climate change and human development. Estuar. Coast. Shelf Sci. 2015, 156, 19–30. [Google Scholar] [CrossRef]
  18. Sohma, A.; Shibuki, H.; Nakajima, F.; Kubo, A.; Kuwae, T. Modeling a coastal ecosystem to estimate climate change mitigation and a model demonstration in Tokyo Bay. Ecol. Model. 2018, 384, 261–289. [Google Scholar] [CrossRef]
  19. Miller, N. California climate change, hydrologic response, and flood forecasting. In Urban Flood Management; CRC Press: Boca Raton, FL, USA, 2018; pp. 143–156. [Google Scholar]
  20. Alamdari, N. Modeling Climate Change Impacts on the Effectiveness of Stormwater Control Measures in Urban Watersheds. Ph.D. Thesis, Virginia Tech, Blacksburg, VA, USA, 2018. [Google Scholar]
  21. Moor, H.; Hylander, K.; Norberg, J. Predicting climate change effects on wetland ecosystem services using species distribution modeling and plant functional traits. Ambio 2015, 44, 113–126. [Google Scholar] [CrossRef] [Green Version]
  22. Lee, S.Y.; Ryan, M.E.; Hamlet, A.F.; Palen, W.J.; Lawler, J.J.; Halabisky, M. Projecting the hydrologic impacts of climate change on montane wetlands. PLoS ONE 2015, 10, e0136385. [Google Scholar] [CrossRef] [PubMed]
  23. Havril, T.; Tóth, Á.; Molson, J.W.; Galsa, A.; Mádl-Szőnyi, J. Impacts of predicted climate change on groundwater flow systems: Can wetlands disappear due to recharge reduction? J. Hydrol. 2018, 563, 1169–1180. [Google Scholar] [CrossRef] [Green Version]
  24. Huang, L.; Zeng, G.; Liang, J.; Hua, S.; Yuan, Y.; Li, X.; Dong, H.; Liu, J.; Nie, S.; Liu, J. Combined impacts of land use and climate change in the modeling of future groundwater vulnerability. J. Hydrol. Eng. 2017, 22, 05017007. [Google Scholar] [CrossRef]
  25. Gemitzi, A.; Ajami, H.; Richnow, H.H. Developing empirical monthly groundwater recharge equations based on modeling and remote sensing data–Modeling future groundwater recharge to predict potential climate change impacts. J. Hydrol. 2017, 546, 1–13. [Google Scholar] [CrossRef]
  26. Aslam, R.A.; Shrestha, S.; Pandey, V.P. Groundwater vulnerability to climate change: a review of the assessment methodology. Sci. Total. Environ. 2018, 612, 853–875. [Google Scholar] [CrossRef] [PubMed]
  27. Kumar, C. Impact of climate change on groundwater resources. In Handbook of Research on Climate Change Impact on Health and Environmental Sustainability; IGI Global: Hershey, PA, USA, 2016; pp. 196–221. [Google Scholar]
  28. Meixner, T.; Manning, A.H.; Stonestrom, D.A.; Allen, D.M.; Ajami, H.; Blasch, K.W.; Brookfield, A.E.; Castro, C.L.; Clark, J.F.; Gochis, D.J.; et al. Implications of projected climate change for groundwater recharge in the western United States. J. Hydrol. 2016, 534, 124–138. [Google Scholar] [CrossRef] [Green Version]
  29. Bekele, D.; Alamirew, T.; Kebede, A.; Zeleke, G.; Melesse, A.M. Modeling climate change impact on the Hydrology of Keleta watershed in the Awash River basin, Ethiopia. Environ. Model. Assess. 2019, 24, 95–107. [Google Scholar] [CrossRef]
  30. Kim, J.; Ryu, J.H. Modeling Hydrological and Environmental Consequences of Climate Change and Urbanization in the Boise River Watershed, Idaho. J. Am. Water Resour. Assoc. 2019, 55, 133–153. [Google Scholar] [CrossRef]
  31. Givati, A.; Thirel, G.; Rosenfeld, D.; Paz, D. Climate change impacts on streamflow at the upper Jordan River based on an ensemble of regional climate models. J. Hydrol. Reg. Stud. 2019, 21, 92–109. [Google Scholar] [CrossRef]
  32. Jin, L.; Whitehead, P.G.; Addo, K.A.; Amisigo, B.; Macadam, I.; Janes, T.; Crossman, J.; Nicholls, R.J.; McCartney, M.; Rodda, H.J. Modeling future flows of the Volta River system: Impacts of climate change and socio-economic changes. Sci. Total. Environ. 2018, 637, 1069–1080. [Google Scholar] [CrossRef] [PubMed]
  33. Raimonet, M.; Thieu, V.; Silvestre, M.; Oudin, L.; Rabouille, C.; Vautard, R.; Garnier, J. Landward perspective of coastal eutrophication potential under future climate change: the Seine River case (France). Front. Mar. Sci. 2018, 5, 136. [Google Scholar] [CrossRef]
  34. Su, B.; Huang, J.; Zeng, X.; Gao, C.; Jiang, T. Impacts of climate change on streamflow in the upper Yangtze River basin. Clim. Chang. 2017, 141, 533–546. [Google Scholar] [CrossRef]
  35. Dlamini, N.S.; Kamal, M.R.; Soom, M.A.B.M.; Mohd, M.S.F.b.; Abdullah, A.F.B.; Hin, L.S. Modeling potential impacts of climate change on streamflow using projections of the 5th assessment report for the Bernam River Basin, Malaysia. Water 2017, 9, 226. [Google Scholar] [CrossRef]
  36. Gelfan, A.; Gustafsson, D.; Motovilov, Y.; Arheimer, B.; Kalugin, A.; Krylenko, I.; Lavrenov, A. Climate change impact on the water regime of two great Arctic rivers: modeling and uncertainty issues. Clim. Chang. 2017, 141, 499–515. [Google Scholar] [CrossRef]
  37. Mekonnen, B.A.; Mazurek, K.A.; Putz, G. Modeling of nutrient export and effects of management practices in a cold-climate prairie watershed: Assiniboine River watershed, Canada. Agric. Water Manag. 2017, 180, 235–251. [Google Scholar] [CrossRef]
  38. Vaighan, A.A.; Talebbeydokhti, N.; Bavani, A.M.; Whitehead, P. Modeling impacts of climate and land use change on streamflow, nitrate, and ammonium in the Kor River, southwest of Iran. J. Water Clim. Chang. 2018. [Google Scholar] [CrossRef]
  39. Sorribas, M.V.; Paiva, R.C.; Melack, J.M.; Bravo, J.M.; Jones, C.; Carvalho, L.; Beighley, E.; Forsberg, B.; Costa, M.H. Projections of climate change effects on discharge and inundation in the Amazon basin. Clim. Chang. 2016, 136, 555–570. [Google Scholar] [CrossRef]
  40. Patrick, L.; Solecki, W.; Jacob, K.; Kunreuther, H.; Nordenson, G. New york city panel on climate change 2015 report chapter 3: Static coastal flood mapping. Ann. New York Acad. Sci. 2015, 1336, 45–55. [Google Scholar] [CrossRef] [PubMed]
  41. Arnell, N.W.; Gosling, S.N. The impacts of climate change on river flood risk at the global scale. Clim. Chang. 2016, 134, 387–401. [Google Scholar] [CrossRef]
  42. Winsemius, H.C.; Aerts, J.C.; van Beek, L.P.; Bierkens, M.F.; Bouwman, A.; Jongman, B.; Kwadijk, J.C.; Ligtvoet, W.; Lucas, P.L.; Van Vuuren, D.P.; et al. Global drivers of future river flood risk. Nat. Clim. Chang. 2016, 6, 381. [Google Scholar] [CrossRef]
  43. Francesch-Huidobro, M.; Dabrowski, M.; Tai, Y.; Chan, F.; Stead, D. Governance challenges of flood-prone delta cities: Integrating flood risk management and climate change in spatial planning. Prog. Plan. 2017, 114, 1–27. [Google Scholar] [CrossRef]
  44. Alfieri, L.; Feyen, L.; Di Baldassarre, G. Increasing flood risk under climate change: A pan-European assessment of the benefits of four adaptation strategies. Clim. Chang. 2016, 136, 507–521. [Google Scholar] [CrossRef]
  45. Birhanu, D.; Kim, H.; Jang, C.; Park, S. Flood Risk and Vulnerability of Addis Ababa City Due to Climate Change and Urbanization. Procedia Eng. 2016, 154, 696–702. [Google Scholar] [CrossRef] [Green Version]
  46. Yamashita, S.; Matsuda, S.; Watanabe, R.; Shimatani, Y.; Moriyama, T.; Hayashi, H.; Iyooka, H.; Hamada, T.; Yamashita, T.; Kakudo, K.; et al. A registration system for preventing/mitigating urban flood disasters as one way to smartly adapt to climate change in Japanese cities. Int. Rev. Spat. Plan. Sustain. Dev. 2016, 4, 18–29. [Google Scholar] [CrossRef]
  47. Balica, S.; Wright, N.; van der Meulen, F. A flood vulnerability index for coastal cities and its use in assessing climate change impacts. Nat. Hazards 2012, 64, 73–105. [Google Scholar] [CrossRef] [Green Version]
  48. Jeffers, J. The Cork City flood of November 2009: Lessons for flood risk management and climate change adaptation at the urban scale. Irish Geogr. 2011, 44, 61–80. [Google Scholar] [CrossRef]
  49. Bleck, M.; Krebs, H.; Scholz, A.; Spekker, H. Flood protection in the Federal State and the city of Bremen by adjustment of climate changes [Hochwasserschutz im Land Bremen Anpassung an Prognostizierte Klimaveränderungen]. Bautechnik 2009, 86, 470–479. [Google Scholar] [CrossRef]
  50. Miller, J.D.; Hutchins, M. The impacts of urbanisation and climate change on urban flooding and urban water quality: A review of the evidence concerning the United Kingdom. J. Hydrol. Reg. Stud. 2017, 12, 345–362. [Google Scholar] [CrossRef] [Green Version]
  51. Ek, K.; Goytia, S.; Pettersson, M.; Spegel, E. Analysing and Evaluating Flood Risk Governance in Sweden: Adaptation to Climate Change? STAR-FLOOD Consortium: Oxfordshire, UK, 2016. [Google Scholar]
  52. Álvarez, B.; Santacruz De León, G.; Ramos Leal, J.; Morán Ramírez, A. Water poverty index in subtropical Zones: The case of Huasteca Potosina, Mexico. Rev. Int. Contam. Ambient. 2015, 31, 173–184. [Google Scholar]
  53. Morán-Ramírez, J.; Ramos-Leal, J.; López-Álvarez, B.; Lozada, S.; León, G.D. Hydrogeochemical behavior of underground flow in fractured karstic aquifers, using inverse modeling: The Huasteca Potosina case [Comportamiento hidrogeoquímico de flujos subterráneos en acuíferos cársticos fracturados, aplicando modelación inversa: Caso huasteca potosina]. Bol. Soc. Geol. Mex. 2013, 65, 71–82. [Google Scholar]
  54. Valenzuela, R.; Raymundo, T.; Cifuentes, J.; Castillo, G.; Amalfi, M.; Decock, C. Two undescribed species of Phylloporia from Mexico based on morphological and phylogenetic evidence. Mycol. Prog. 2011, 10, 341–349. [Google Scholar] [CrossRef]
  55. González Soriano, E.; Noguera, F.; Oñate Ocaña, L. A biodiversity hotspot for odonates in mexico: The huasteca potosina, san luis potosí. Odonatologica 2011, 40, 179–190. [Google Scholar]
  56. Carmona Jimenez, J.; Montejano Zurita, C. Phycological characterization of springs in the lower Panuco Basin, Mexico [Caracterizacion ficologica en manantiales de la cuenca baja del sistema hidrologico del Panuco, Mexico]. Bol. Soc. Bot. Mex. 1993, 53, 21–41. [Google Scholar]
  57. Josabad Alonso-Castro, A.; Jose Maldonado-Miranda, J.; Zarate-Martinez, A.; Jacobo-Salcedo, M.; Fernández-Galicia, C.; Alejandro Figueroa-Zuñiga, L.; Abel Rios-Reyes, N.; Angel De León-Rubio, M.; Andrés Medellín-Castillo, N.; Reyes-Munguia, A.; et al. Medicinal plants used in the Huasteca Potosina, México. J. Ethnopharmacol. 2012, 143, 292–298. [Google Scholar] [CrossRef] [PubMed]
  58. Elliott, W. Cave Biodiversity and Ecology of the Sierra de El Abra Region; Academic Press: San Diego, CA, USA, 2015; pp. 59–76. [Google Scholar]
  59. Santiago-Figueroa, I.; Lara-Bueno, A.; González-Garduño, R.; López-Arellano, M.; de la Rosa-Arana, J.; Maldonado-Simán, E. Anthelmintic resistance in hair sheep farms in a sub-humid tropical climate, in the Huasteca Potosina, Mexico. Vet. Parasitol. Reg. Stud. Rep. 2019, 17. [Google Scholar] [CrossRef] [PubMed]
  60. Vieyra-Alberto, R.; Domínguez-Vara, I.; Olmos-Oropeza, G.; Martínez-Montoya, J.; Borquez-Gastelum, J.; Palacio-Nuñez, J.; de la Fuente, J.; Morales-Almaráz, E. Mineral profile and interrelationship in water, forage and blood serum of beef cattle during two seasons in the Huasteca Potosina, México [Perfil e interrelación mineral en Agua, forraje y suero sanguíneo de bovinos durante dos Épocas en la huasteca potosina, México]. Agrociencia 2013, 47, 121–133. [Google Scholar]
  61. Hernández, H.; Robledo, M.; Rivera, J.; Vázquez, I. Land cover and land use change in the Pujal-Coy project area, San Luis Potosí, Mexico, 1973–2000 [Cambios en la cubierta vegetal y uso del suelo en el área del proyecto Pujal-Coy, San Luis Potosí, México, 1973–2000]. Investig. Geogr. 2006, 59, 26–42. [Google Scholar]
  62. Hernández, H.; Robledo, M.; Rivera, J.; Martínez, J. Spatial configuration of land-use/land-cover in the Pujal-Coy project area, Huasteca Potosina Region, Mexico. Ambio 2008, 37, 381–389. [Google Scholar] [CrossRef] [PubMed]
  63. Tiedje, K. Gender and ethnic identity in rural grassroots development: An outlook from the Huasteca Potosina, Mexico. Urban Anthropol. 2002, 31, 261–316. [Google Scholar]
  64. Granados-Ramírez, R.; Galindo-Mendoza, M.; Contreras-Servin, C.; Hernández-Cerda, M.; Valdez-Madero, G. Monitoring land cover and land use using NOAA-AVHRR data in the Husteca Potosina, Mexico. Geocarto Int. 2008, 23, 273–285. [Google Scholar] [CrossRef]
  65. Hudson, P.; Colditz, R. Flood delineation in a large and complex alluvial valley, lower Pánuco basin, Mexico. J. Hydrol. 2003, 280, 229–245. [Google Scholar] [CrossRef]
  66. León, H.; Piña, H.; Cuevas, C.; Castañeda, C. Baroclinic mathematical modeling of fresh water plumes in the interaction river-sea. Int. J. Numer. Anal. Model. 2005, 2, 1–14. [Google Scholar]
  67. Ramírez-León, H.; Couder-Castañeda, C.; Herrera-Díaz, I.; Barrios-Piña, H. Numerical modeling of the thermal discharge of the Laguna Verde power station [Modelación numérica de la descarga térmica de la Central Nucleoeléctrica Laguna Verde]. Rev. Int. Metod. Numer. Para Calc. Diseno Ing. 2013, 29, 114–121. [Google Scholar]
  68. Barrios-Piña, H.; Ramírez-León, H.; Rodríguez-Cuevas, C.; Couder-Castañeda, C. Multilayer numerical modeling of flows through vegetation using a mixing-length turbulence model. Water 2014, 6, 2084–2103. [Google Scholar] [CrossRef]
  69. Torres-Bejarano, F.; Couder-Castañeda, C.; Ramírez-León, H.; Hernández-Gómez, J.; Rodríguez-Cuevas, C.; Herrera-Díaz, I.; Barrios-Piña, H. Numerical Modelling of Heavy Metal Dynamics in a River-Lagoon System. Math. Probl. Eng. 2019, 2019. [Google Scholar] [CrossRef]
  70. Rodriguez-Cuevas, C.; Couder-Castañeda, C.; Flores-Mendez, E.; Herrera-Díaz, I.; Cisneros-Almazan, R. Modelling shallow water wakes using a hybrid turbulence model. J. Appl. Math. 2014, 2014, 714031. [Google Scholar] [CrossRef]
  71. Horritt, M. Parameterisation, validation and uncertainty analysis of CFD models of fluvial and flood hydraulics in the natural environment. In Computational Fluid Dynamics: Applications in Environmental Hydraulics; John Wiley and Sons: Hoboken, NJ, USA, 2005; pp. 193–213. [Google Scholar]
  72. Kharin, V.V.; Zwiers, F.; Zhang, X.; Wehner, M. Changes in temperature and precipitation extremes in the CMIP5 ensemble. Clim. Chang. 2013, 119, 345–357. [Google Scholar] [CrossRef]
  73. Thomson, A.M.; Calvin, K.V.; Smith, S.J.; Kyle, G.P.; Volke, A.; Patel, P.; Delgado-Arias, S.; Bond-Lamberty, B.; Wise, M.A.; Clarke, L.E.; et al. RCP4.5: A pathway for stabilization of radiative forcing by 2100. Clim. Chang. 2011, 109, 77. [Google Scholar] [CrossRef]
  74. Romero-Lankao, P.; Smith, J.; Davidson, D.; Diffenbaugh, N.; Kinney, P.; Kirshen, P.; Kovacs, P.; Ruiz, L.V. North America. In Climate Change 2014: Impacts, Adaptation, and Vulnerability. Part B: Regional Aspects. Contribution of Working Group II to the Fifth Assessment Report of the Intergovernmental Panel on Climate Change; Barros, V., Field, C., Dokken, D., Mastrandrea, M., Mach, K., Bilir, T., Chatterjee, M., Ebi, K., Estrada, Y., Genova, R., et al., Eds.; Cambridge University Press: Cambridge, UK, 2004; Chapter 26; pp. 1439–1498. [Google Scholar]
  75. Comisión Nacional del Agua. Plan Nacional Hídrico 2007–2012. Available online: http://www.conagua.gob.mx/CONAGUA07/Contenido/Documentos/PNH_05-08.pdf (accessed on 15 April 2019).
  76. Hudson, P. Event sequence and sediment exhaustion in the lower Panuco Basin, Mexico. Catena 2003, 52, 57–76. [Google Scholar] [CrossRef]
  77. Melgar, E.; Solís, R.; Ruvalcaba, J. Technological and material characterization of lapidary artifacts from Tamtoc Archaeological Site, Mexico. Mater. Res. Soc. Symp. Proc. 2012, 1374, 103–114. [Google Scholar] [CrossRef]
  78. Zaragoza Ocaña, D. La arquitectura de Tamohi. Arqueología 2007, 2007, 71–92. [Google Scholar]
  79. Zaragoza Ocaña, D. Tamohi, su Pintura Mural; Serie Museo de la Cultura Huasteca; Gobierno del Estado de Tamaulipas, Secretaría de Educación, Cultura y Deporte, Instituto Tamaulipeco para la Cultura y las Artes, Gobierno Municipal; CONACULTA/Instituto Nacional de Antropología e Historia: Mexico City, Mexico, 2003.
  80. INEGI. Instituto Nacional de Estadística y Geografía; INEGI: Mexico City, Mexico, 2010. [Google Scholar]
  81. Comisión Estatal de Derechos Humanos, San Luis Potosí. Informe CEDH-INEGI Economía: Tamuín, San Luis Potosí. Available online: http://www.cedhslp.org.mx/Docs_old/Informe_CEDH/TAMUIN/inegi.pdf (accessed on 13 January 2019).
  82. Bedient, P.; Huber, W.; Vieux, B. Hydrology and Floodplain Analysis; Prentice Hall: Englewood Cliffs, NJ, USA, 2008. [Google Scholar]
  83. US Bureau of Reclamation. Design of Small Dams; U.S. Department of the Interior, Bureau of Reclamation: Washington, DC, USA, 1987.
  84. Velázquez, J.; Troin, M.; Caya, D. Hydrological modeling of the Tampaón River in the context of climate change. Tecnol. Cienc. Agua 2015, 6, 17–30. [Google Scholar]
  85. Moreno-Mata, A.; Villasís-Keever, R.; Morató, J. Climatic Change, Management of Water Rain and Flood Risk in the Metropolitan Area of San Luis Potosí, México. In Urban Resilience for Risk and Adaptation Governance: Theory and Practice; Brunetta, G., Caldarice, O., Tollin, N., Rosas-Casals, M., Morató, J., Eds.; Springer International Publishing: Cham, Switzerland, 2019; pp. 175–206. [Google Scholar]
  86. Teledyne Rd Instruments. WinRiver II User’s Guide; Teledyne Rd Instruments: Poway, CA, USA, 2007. [Google Scholar]
  87. Le, T.; Devisch, O.; Trinh, T. Flood-resilient urban parks: Toward a framework. Area 2019. [Google Scholar] [CrossRef]
  88. Alvarez, J.; Lira, M. Flood control in the plain rivers. Proc. IAHR Int. Symp. River Mech. 1973, 2, 303–314. [Google Scholar]
  89. Garrote, J.; Bernal, N.; Díez-Herrero, A.; Martins, L.; Bodoque, J. Civil engineering works versus self-protection measures for the mitigation of floods economic risk. A case study from a new classification criterion for cost-benefit analysis. Int. J. Disaster Risk Reduct. 2019, 37. [Google Scholar] [CrossRef]
  90. Ishak, E.; Rahman, A. Examination of Changes in Flood Data in Australia. Water 2019, 11, 1734. [Google Scholar] [CrossRef]
  91. Ishak, E.H.; Rahman, A.; Westra, S.; Sharma, A.; Kuczera, G. Evaluating the non-stationarity of Australian annual maximum flood. J. Hydrol. 2013, 494, 134–145. [Google Scholar] [CrossRef]
  92. Casulli, V.; Cheng, R.T. Semi-implicit finite difference methods for three dimentional shallow water flow. Int. J. Numer. Methods Fluids. 1992, 15, 629–648. [Google Scholar] [CrossRef]
  93. León, H.R.; Cuevas, C.R.; Díaz, E.H. Multilayer hydrodynamic models and their application to sediment transport in estuaries. In Current Trends in High Performance Computing and Its Applications; Springer: Berlin/Heidelbergpp, Germany, 2005; pp. 59–70. [Google Scholar]
  94. Booij, M.J. Impact of climate change on river flooding assessed with different spatial model resolutions. J. Hydrol. 2005, 303, 176–198. [Google Scholar] [CrossRef]
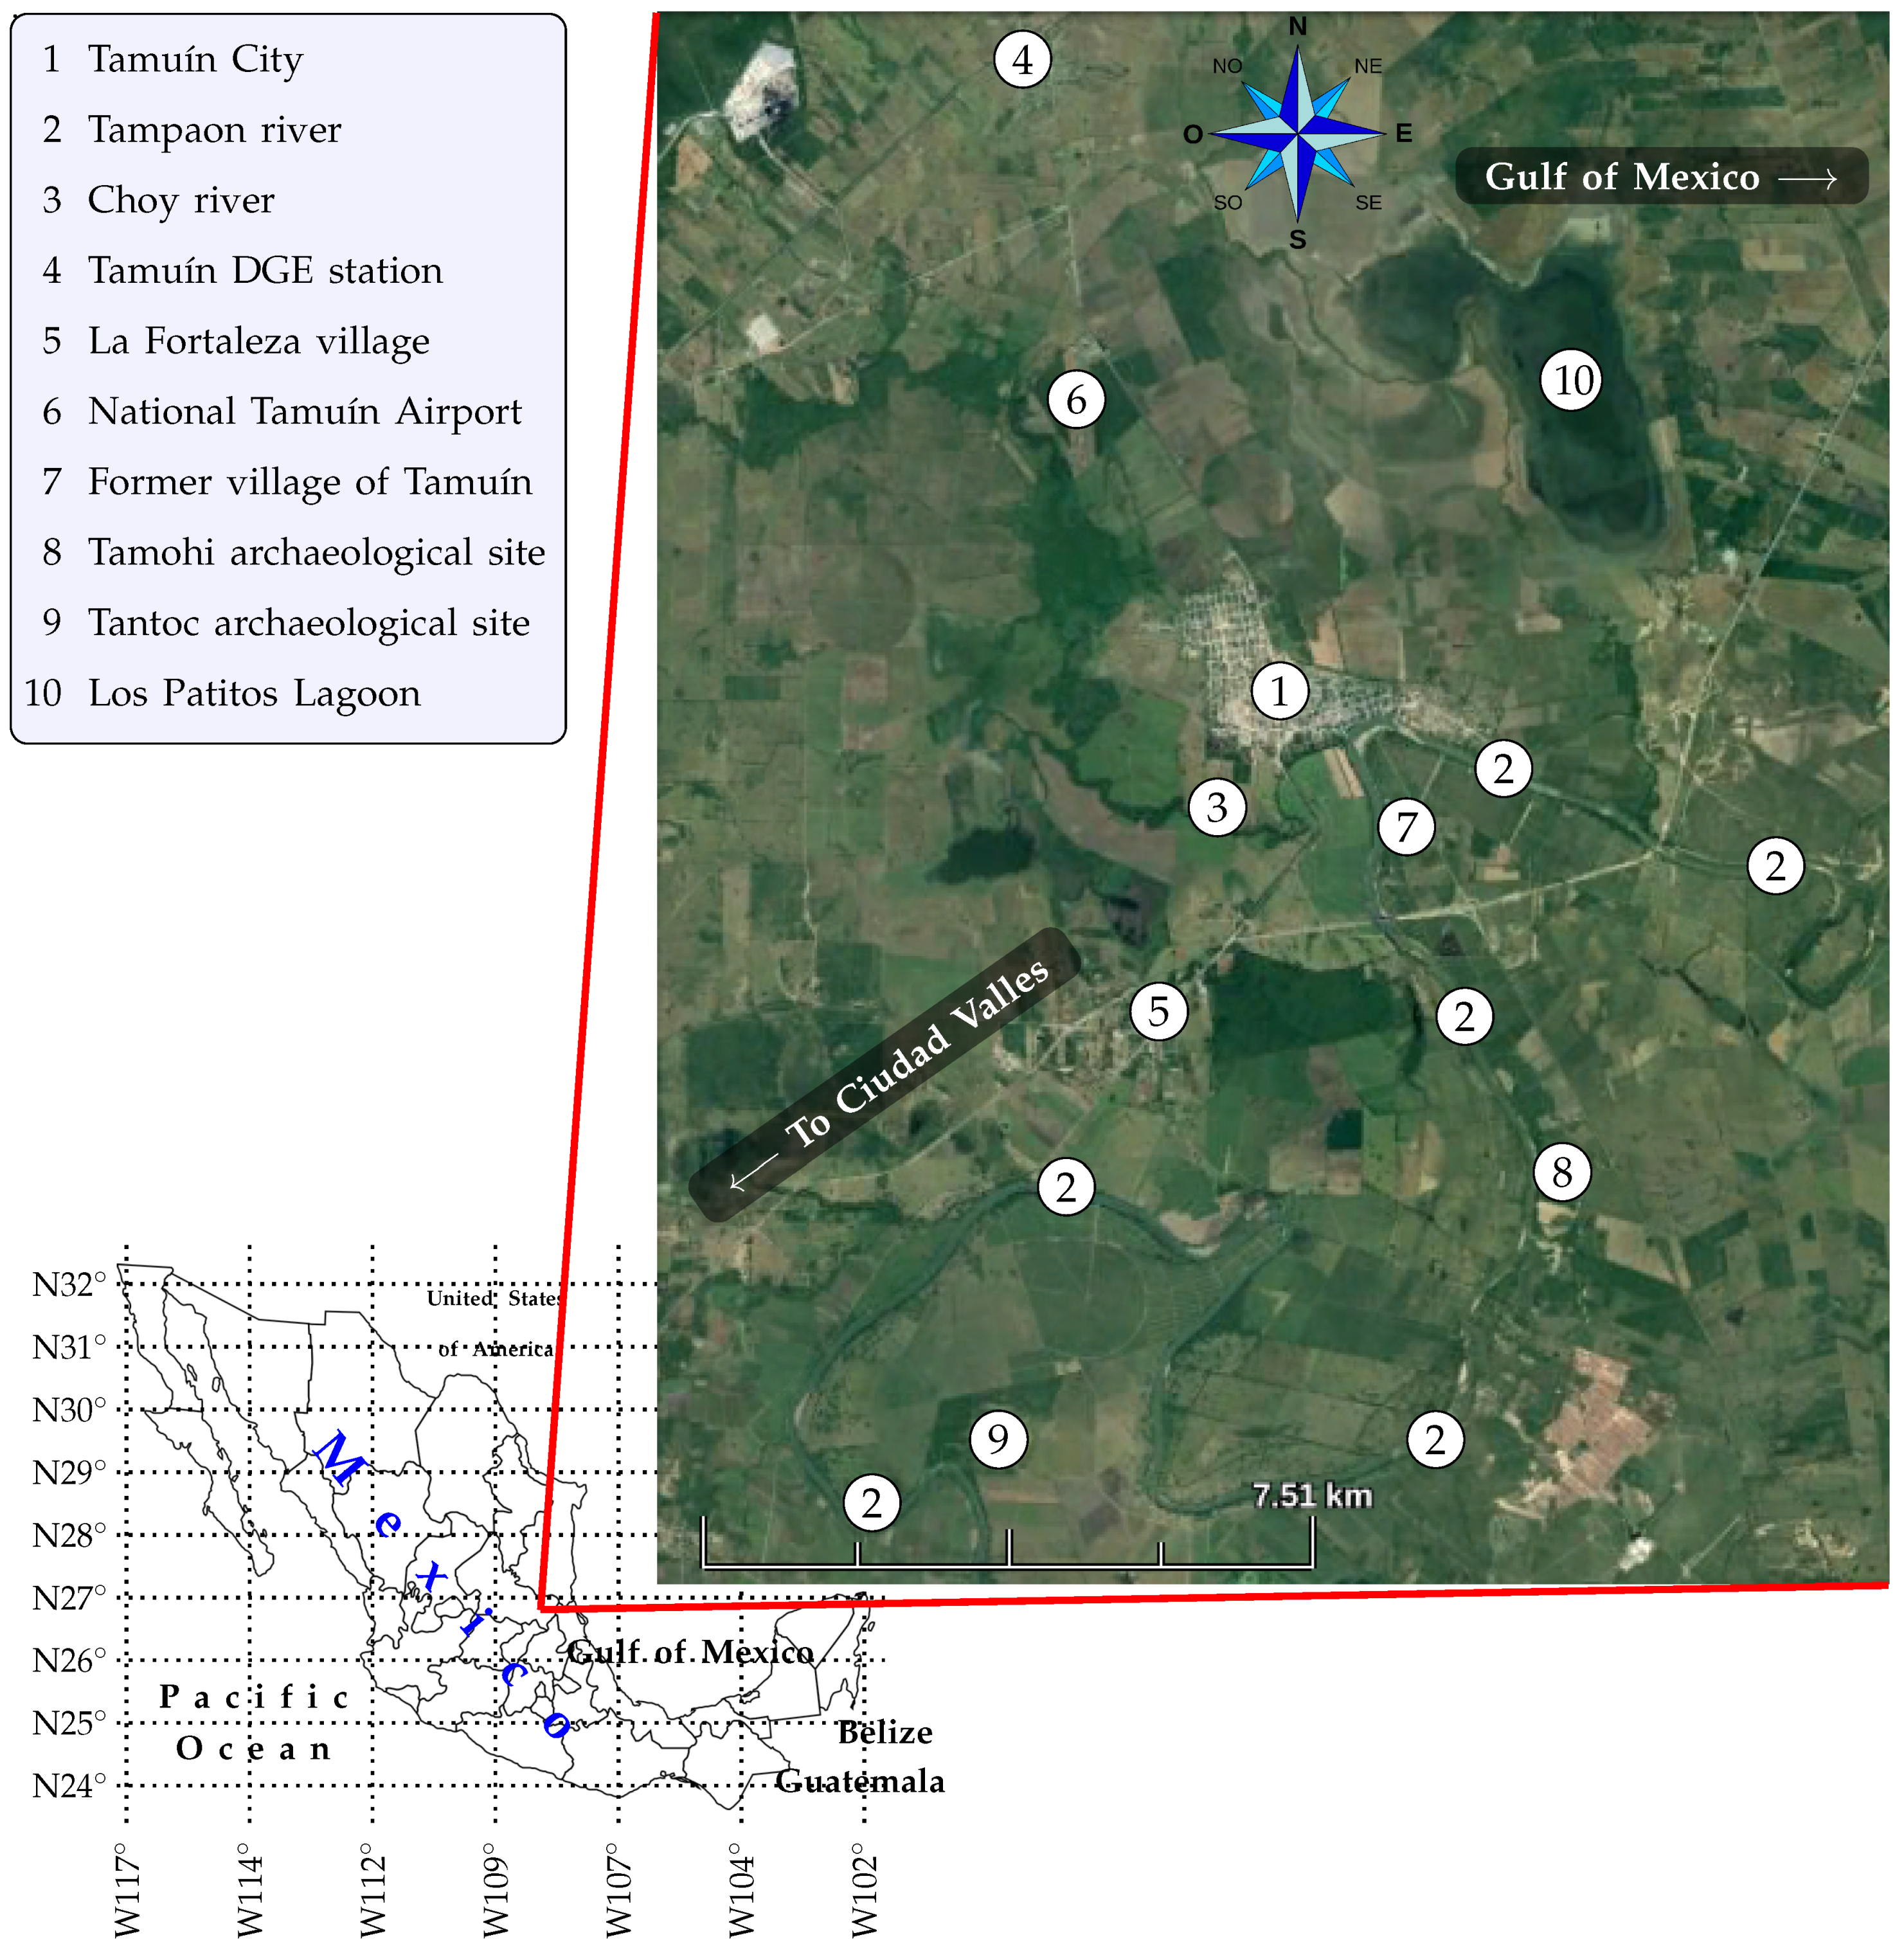
Figure 1. Location of the region under study.
Water 11 01867 g001
Figure 2. Triangular Unit Hydrograph (TUH) for a return period of T r = 20 years.
Water 11 01867 g002
Figure 3. First transect and location of control section.
Water 11 01867 g003
Figure 4. Second transect trajectory. The trajectory was depicted by some selected points taken by the ADCP system to ease its visualisation.
Water 11 01867 g004
Figure 5. Topography and bathymetry of the region under study of Tampaón River.
Water 11 01867 g005
Figure 6. Magnitude of the measured water flow velocities.
Water 11 01867 g006
Figure 7. Magnitude of the flow velocity, referenced to the bathymetry (m/s).
Water 11 01867 g007
Figure 8. Space discretisation and boundaries location: (a) blue, wet cells; purple, dry cells; and (b) zoom.
Water 11 01867 g008
Figure 9. Calculated speeds in the straight section of the mid section of the river.
Water 11 01867 g009
Figure 10. River level at the second measurement campaign (t = 0).
Water 11 01867 g010
Figure 11. Snapshots for simulated flooding for both historical and CC-projected rainfall scenarios. (A)–(G) correspond to the first to seventh zones in risk of flood with respect to rainfall time. This zones are identified prioritising the urban zones. (a) corresponds to the initial condition before the simulation starts, while (bh) are subsequent flooding stages during the simulations. (h) represents the worst flooding obtained within this framework.
Water 11 01867 g011
Figure 12. Simulation times for the eight snapshots shown in Figure 11. The blue (circle) line represents the flooding time obtained by simulating the flow rate in an intense rainfall event using historical data (20-year return values), and the red (square) line represents these values intensified by 12% due to potential effects of CC.
Water 11 01867 g012
Figure 13. First region to be protected by civil work around Zone (A) (see Figure 11).
Water 11 01867 g013
Table 1. Dripping flow rates for different return periods T r .
T r (Years)Flow Rate (m 3 /s)
2762.71
51525.43
103813.57
204066.10
254194.92
504461.87
1004652.55