Abstract
This study used the Source Loading and Management Model for Windows (WinSLAMM) to develop a set of calibrated hydrologic models for three types of regional permeable pavements—porous concrete pavement (PCP), permeable interlocking concrete pavement (PICP), and interlocking block pavement with gravel (IBPG). The objective was to assess the hydrologic performance of permeable pavements, including the runoff depth, peak discharge, percentage increment in runoff reduction of pavements as a function of rainfall depth, development area, and base aggregate porosity, respectively. The permeable pavements were monitored over a wide range of rainfall events in the semi-arid Lower Rio Grande Valley of South Texas. Data regarding rainfall intensities, source characterizations, runoff coefficients, and pavement design were initialized as WinSLAMM input. Validation results showed that the calibrated models could over or under-predict runoff reduction within a 30% error range. PCP and IBPG were very effective and could be capable of handling storms as large as 50-year frequency over a 24-h time period. The modeling results showed that PCP might require a 50–60% lesser footprint area as compared to PICP and IBPG, respectively. Additionally, PCP might be able to store 30% additional runoff if the porosity of base aggregates was increased by 40%.
1. Introduction
The uncontrolled discharge of urban runoff is one of the most common sources of pollution in the Arroyo Colorado, a river that extends for 90 miles through the heart of the Lower Rio Grande Valley (LRGV), from near Mission, Texas, TX, USA, eastward to the Laguna Madre [1,2,3]. Due to rapid urbanization and industrialization, impervious concrete or asphalt surfaces are adversely replacing the existing permeable land cover in the Arroyo Colorado Watershed (1800 km2) [3,4]. A significant portion of the total imperviousness of the area is fueled by traditional practices of commercial, institutional, residential, and industrial development within different cities of the LRGV [5]. Local governments are adopting strict drainage design policies in LRGV cities to control flooding in commercial parking lots. Based on the existing drainage policy in McAllen, TX, USA, stormwater runoff generated from new commercial development is generally required to retain stormwater on-site for a 50-year frequency storm event to be released into a receiving system at a pre-developed rate for a 10-year frequency storm event. One conventional approach to meet this discharge goal is the construction of a detention pond with a large footprint area [6]. However, such an approach can create aesthetic, safety, operational, and maintenance issues in the long term [7]. Permeable pavement is one of the most widely-accepted Low-Impact Development (LID) eco-technologies being used over the last few decades for on-site stormwater infiltration [8,9]. With the use of innovative permeable pavement design, a huge volume of runoff can be infiltrated and stored within its aggregate reservoir [9]. However, careful planning in the design and implementation of permeable pavements is important to consistently meet the discharge goals within the development boundaries.
Over several decades, permeable pavement research has been carried out to assess its hydrologic performance through extensive field-based studies [10,11,12]. Further studies were recommended to investigate the performance of permeable pavement systems over time through continuous data support [9]. In the pursuit of accuracy in data acquisition, field complexity, time, and budget are some major constraints [13]. Accurate flow measurement through instrumentation might be costly but invaluable over the long term for model calibration [13,14]. Moreover, the longevity of the field equipment was also a concern due to natural corrosion, debris accumulation, vandalism, and other potential problems [14]. However, sparse but accurate data collection is always better than no information in terms of stormwater monitoring [13]. For stormwater management purposes, the calibrated modeled results might be useful where there are few or no monitoring data based on relevant input variables, such as total rainfall, rainfall duration, drainage area, and land use [13,15,16]. Previous test results have shown that infiltration, retention, and evaporation phenomena within a permeable pavement system are generally influenced by several critical factors, such as the particle size distribution and properties of base aggregates, climatic conditions, surface clogging, maintenance, antecedent moisture contents, and soil type [17,18,19]. Previously, hydrologic models of LID green infrastructure were limited to a specific country or state. However, more studies focusing on the calibration of stormwater best management practice (BMP) models from a regional context are very necessary [20]. Despite achieving some favorable outcomes from different installation types, region-specific variation in the hydrologic performance of permeable pavements has been noted due to varying soil conditions, rainfall patterns, and temperature [9,21,22]. For example, storm intensity and frequency in coastal areas of the northwest are typically low, whereas intense and frequent storm events are often observed with extended periods of sub-freezing weather in northeast coastal regions. These two opposite storm patterns can mask the evidence of reduced infiltration or exfiltration of runoff from some permeable pavements [21]. The LRGV has semi-arid climatic regions, where summers are hot and humid (24–35 °C) for most of the year but with the possibility of severe tropical storms due to the currents of the Mexican Gulf Coast. In winter, the weather is cooler and drier (2–17 °C) with very rare to no snowfall or freezing rain [23]. This emergent dissimilar climatic pattern in the LRGV supports the evidence for the necessity of region-specific modeling permeable pavement systems for assessing runoff patterns and contributions to the watershed. Thus, there is a clear need for the creation of a comprehensive and robust modeling tool that can predict the hydrologic behavior of permeable pavements for small interconnected urban areas in the LRGV and similar regions. Gathering accurate field data was the first priority in calibrating these models for their future application within the watershed boundary [6]. In addition, the model’s algorithm might require verification for an improved understanding of the effect of permeable pavement design values on the hydrologic performance of the new construction [24].
The selection of effective modeling tools can be challenging due to the underlying mechanisms of runoff reduction from different control practices [25]. Previously, the Environmental Protection Agency (EPA) Storm Water Management Model (SWMM) was found to adequately achieve several performance objectives for BMPs without underdrains [24]. One study demonstrated an approach to modify the source code of the SWMM model to account for different mechanisms (e.g., degradation of the infiltration capacity) within permeable pavement systems [26]. Personal Computer SWMM for Permeable Pavements (PCSWMMPP) has been used with some success in the past; it was developed specifically for the hydrologic and hydraulic design of permeable pavements [27]. A calibrated permeable pavement model was developed using a Storm Water Management Model Erwin with validation using 15 events, which also showed a reasonable prediction of outflow from permeable pavements [28]. Another study has shown the application of SWMM5-LID (a module of SWMM software specific for LID practices) in the development of calibrated and validated permeable pavement models for two different climatic regions: Birkdale, New Zealand, and North Carolina, USA [29]. A unit process model was developed for simulating infiltration and exfiltration impacts within a specific permeable pavement system in one project [30]. In another case, a mathematical model was developed for different types of permeable pavements based on the field data that predicted outflow hydrographs with a coefficient of determination (R2) ranging from 0.762–0.907 and root mean square error (RMSE) ranging from 13.78–17.83% [31]. The essence of the EPA SWMM model was again achieved while investigating the peak reduction through minimizing the effective impervious area by land-use conversion with a green roof and permeable pavements [32]. However, substantial training or watershed modeling skill is required while accessing SWMM for most applications. Furthermore, SWMM subroutines were not so adequate for the improved delineation of land-use management, especially when there were specific practices for vegetation enhancement or infiltration. One interesting study observed the influence of drainage area and rainfall (1 mm clogging for each 6 mm of rainfall depth) on the progression of surface clogging [33]. A previously developed regression model from a laboratory investigation was able to assess physical clogging in permeable pavements, which estimated the clogging activity as a function of runoff volume and flow rate [34,35]. Another study developed an artificial neural network for prediction clogging, which concluded that certain factors, such as peak rainfall intensities over 5 min, and both previous and cumulative rainfall magnitude, are highly influential in forecasting the hydrologic performance of permeable pavements [35,36]. However, most models are not complete enough to factor in the complexities of maintenance activities, such as street sweeping or vacuuming, on the performance of permeable pavements [37].
The Source Load Analysis and Management Model (SLAMM) has been previously used as a quick planning tool in different stormwater projects and extensively reviewed by LID researchers for over 40 years [38,39]. The Source Loading and Management Model for Windows (WinSLAMM) is a unique Stormwater Quantity and Quality Planning Tool that has the ability to evaluate stormwater controls based on actual field data and design values. WinSLAMM is highly advanced with several LID subroutines, and the model algorithm was first developed in the Visual Basic platform. The software package comes with standardized files for different hydrologic and water quality parameters. Some of these files were developed from studies done in Milwaukee and Toronto [39]. Those studies have used the original National Urban Runoff Program (NURP) database, which had been continuously updated through an extensive and zone-specific field monitoring program of rainfall, runoff, and pollutant loading for different land uses across the United States since 1979 [39,40]. WinSLAMM has been recommended in the past to characterize the pre-developed and post-developed hydrologic assessment (with or without stormwater control practices) of a site based on small to medium storm hydrology and particulate wash-off from multiple drainage sources [38,41]. WinSLAMM application predictions have been proven reasonable for the continuous simulation of a wide range of rainfall magnitudes within mixed land uses of different surface and soil conditions and the implementation of multiple control practices [39,40,42]. WinSLAMM delineations and characterizations of drainage were found to be flexible with user-friendly graphics, enhancing the model adaptability to planners and regulators [40,43,44]. The WinSLAMM permeable pavement subroutine can account for maintenance activities (e.g., manual cleaning, clogging, etc.) in its algorithm. Furthermore, the model algorithm can perform stochastic analysis that allows for uncertainty in model input parameters by using built-in Monte Carlo components [20,43]. WinSLAMM outputs are flexible in terms of integration with transport models, watershed-scale models, and Geographic Information System (GIS) platforms [20,45,46]. WinSLAMM also uses separate algorithms for the cost analysis (e.g., capital, present, annualized, land, and maintenance) of a specific control practice [20].
Under the Texas Commission on Environmental Quality (TCEQ) 319 Non-Point Source (NPS) Program, several permeable pavement designs were monitored over a multi-year time period to assess their runoff reduction potentials in the semi-arid climatic regions of the LRGV. The objective of this study was to (1) calibrate and validate the WinSLAMM model for three different types of permeable pavement design in the LRGV, (2) predict local runoff reduction behavior over a wide range of rainfall magnitudes, (3) replicate these pavement models with varying installation sizes for predicting peak discharge reduction in varying commercial development sizes, (4) and investigate the model relevancy for the design improvement of monitored permeable pavement systems.
2. Methods
The following three types of permeable pavement were monitored and studied (Figure 1) at different parking lots in LRGV sites and modeled using WinSLAMM along with calibration and validation. Table 1 shows a summary of the site-specific characteristics and flow-monitoring events at the three different monitoring locations. The three pavements are:
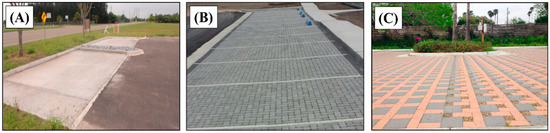
Figure 1.
Three types of monitored permeable pavements in different parking lots at Lower Rio Grande Valley (LRGV) sites. From the left: (A) Porous Concrete Pavement (PCP), (B) Permeable Interlocking Concrete Pavement (PICP), and (C) Interlocking Block Pavement with Gravel (IBPG).

Table 1.
Summary of site characteristics and flow monitoring events at the outfall of the monitored permeable pavements. COB: City of Brownsville, CCDD#1: Cameron County Drainage District #1 Cascade Park, COLF: City of La Feria.
- City of Brownsville (COB)—porous concrete pavement (PCP)
- City of La Feria (COLF)—permeable interlocking concrete pavement (PICP)
- Cameron County Drainage District #1 Cascade Park (CCDD#1)—interlocking block pavement with gravel (IBPG).
2.1. Field and Laboratory Data Preparation
Initially, the total inflow volume onto the permeable pavements was calculated by summing up the direct rainfall volume onto the pavement surface and the runoff contributed from surrounding drainage sources. Direct rainfall volume was calculated from the rain gauge (Teledyne ISCO 674—Tripping bucket type) data multiplied by the surface area of permeable pavements. The outflow volume was calculated for each significant rainfall event from the raw flow rate data retrieved from the flow meter (Teledyne ISCO Signature flow meter). Later, the total volume of reduced runoff was calculated by taking the difference between the inflow and outflow volume. Since the monitored surface area was not the same for all the pavements, it was recommended to convert all the performance indicator parameters to a normalized unit. Therefore, the depth of runoff reduction (ΔR) was calculated to evaluate the performance between different permeable pavements. The following Equation (1) has been used to calculate the depth of runoff reduction from the surface of permeable pavements:
where Vi = total inflow volume (m3), V0 = total outflow volume (m3) and Ap = area of permeable pavement (m2).
The surface infiltration rate of different types of monitored permeable pavements was measured using a double-ring infiltrometer (outer diameter: 60 cm, inner diameter: 30 cm). The porosity of the pavement materials, including the porous concrete aggregates, American Society for Testing and Materials (ASTM)-standardized #8 aggregate for the bedding layer, #57 for the base layer, #2 for the sub-base layer, and compacted limestone, were all measured in the laboratory following the ASTM C830-00 Standard Test Method.
2.2. Model Development
A separate site-specific rainfall file (.RAN) was developed for the model for each type of monitored pavement. For the first simulation, the default runoff coefficient file (.rsvx) was selected, which had been calibrated and standardized for the central US region. Similarly, the pollutant probability distribution (.ppdx) and Particulate Solids Concentration (.pscx) files were selected from the default calibrated files for the same US zone. Since all our monitored sites are located in urban centers, the street delivery (.std) file was selected for the urban land-use pattern of the site. The particle size distribution and peak-to-average ratio files (.csv) were selected from the database of Nationwide Urban Runoff Program (NURP).
The WinSLAMM flow algorithm emphasizes runoff routing and infiltration for relatively small urban or suburban areas to large geographic areas [40,41,47]. The entire characterization of the potential for treatment (including source, control mechanism, and outfall) was described through a flow routing schematic that was incorporated into the model. The schematic below was drawn using the land-use, conduits, junctions, outfall, and permeable pavement subroutines, as shown in Figure 2. The data regarding source area characterizations within a designated land use, drainage connectivity, and pollutants information were entered into the model [20].
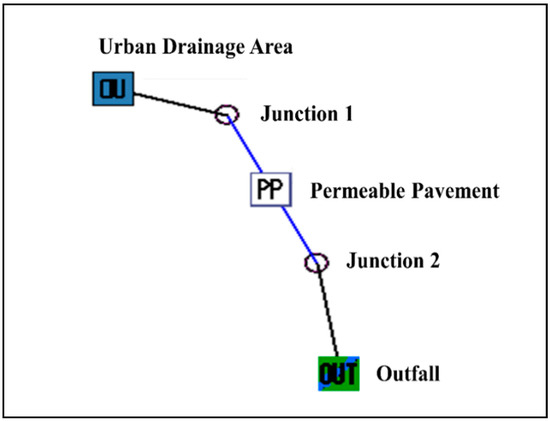
Figure 2.
Delineation of flow routing schematic (including land use, conduits, junctions, outfall, and permeable pavement subroutine) for incorporation into the Source Loading and Management Model for Windows (WinSLAMM).
The assembled data files regarding the pavement design were entered into the model. The “as-built” thickness, porosity of each layer, underdrain information, subgrade seepage rate, paver infiltration rate, and other design properties were assimilated and entered as permeable pavement design input parameters. All the significant as-built design values of pavements were input based on the final design sheets provided by the BMP contractors. The seepage rates of subgrade soils of the three different sites were obtained from the geotechnical investigation reports provided by the lead engineers. Table 2 summarizes the WinSLAMM model input parameters for the design and implementation of permeable pavements in this study. After initializing all the parameters, WinSLAMM generates an as-built cross-sectional schematic of the permeable pavement systems, as shown in Figure 3.
Table 2.
Initialization of WinSLAMM model input for permeable pavements subroutine for three different designs.
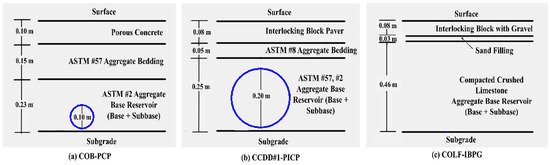
Figure 3.
As-built cross-sectional schematics of the three different permeable pavement systems monitored in the LRGV. From the left: (a) City of Brownsville (COB)-Porous Concrete Pavement (PCP), (b) Cameron County Drainage District#1 (CCDD#1)-Permeable Interlocking Concrete Pavement (PICP), (c) City of La Feria (COLF)-Interlocking Block Pavement with Gravel (IBPG).
2.3. Initial Model Simulation
The recommended strategy was to initially start with the default model input files for the central US region for the first simulation [48]. WinSLAMM defines the runoff coefficient (Rv) as the ratio of runoff depth to total rainfall depth [49]. These Rv values vary with respect to rainfall magnitudes and source area types to satisfy the runoff loss calculation. The default runoff coefficient file (.rsvx) was used initially to simulate the runoff volume (m3) for each rainfall event. The WinSLAMM algorithm then uses the Rational Method to calculate the runoff volume. During the simulation, Rv values are interpolated from the RSVx file and multiplied by the corresponding source area and rainfall depth to calculate the runoff volume for each rainfall event, as shown by the following Equation (2):
where V = runoff volume (ft3), R = depth of precipitation (in), A = source area (acres), and F = unit conversion factor.
During the simulation with the permeable pavement subroutines, the program uses a separate algorithm for the permeable pavement to deduct the stored runoff volume from the total inflow (run-on) volume to calculate the runoff volume. However, WinSLAMM requires local calibration and validation with actual field data to predict the most accurate results by redefining Rv values from the RSVx file [41,48].
The model-simulated runoff volume reduction was later converted to runoff reduction depth (mm). Initially, observed runoff reductions were plotted against rainfall depths to examine the actual performance behavior. The observed runoff reductions were best-fitted with a second-order polynomial trend line. Later, results from the first simulation were plotted against observed results and compared graphically and statistically. The goodness of fit between both results was statistically justified through determining the Coefficient of Determination (R2), Nash–Sutcliffe Efficiency (NSE), and Root Mean Square Error (RMSE). Furthermore, the p-value for supporting the correlation was reported through a regression hypothesis test [50,51,52]. The following Equations (3)–(5) were used to calculate statistical parameters to assess the correlation between observed and model-simulated results:
where, n = number of observations, xi = model-simulated runoff reduction for a particular rainfall event (i) (mm), and yi = observed runoff reduction for a particular rainfall event (i) (mm).
If any significant deviations in simulated runoff reductions versus observed reductions were encountered, the model was recalibrated as mentioned below to improve the simulation for the observed behavior.
2.4. Model Calibration and Validation
Based on the WinSLAMM Calibration Manual, the model was calibrated by adjusting the standardized Rv values of pervious surfaces for the central US zone [48]. The adjustment was continued until it met the calibration criteria, such that:
- (i)
- The overlapping of the model-simulated runoff reduction-rainfall trend line with the observed runoff reduction trend line appears optimal.
- (ii)
- A higher or acceptable value of (R2 > 0.8) and NSE (close to 1) corresponded with a perfect match of model-simulated results to the observed data. However, this criterion may vary depending upon the quality of the observed data [53].
- (iii)
- A lower RMSE (<30%) resulted in model-simulated outcomes [54].
- (iv)
- A p-value less than 0.05 or within a 95% confidence interval boundary better supports the regression correlation between observed and model-predicted results [55].
The results from calibrated permeable pavement models were validated with a separate observed rainfall-runoff dataset. An expected error range while validating stormwater models is usually set to ±30% [54,56]. Model prediction error (%) was calculated by the following equation:
3. Results and Discussion
This study presents WinSLAMM calibration and validation results for three different types of permeable pavements in terms of runoff reduction for three LRGV installations. Furthermore, the application of a modeled pavement predicting hydrologic behavior (outflow volume and peak discharge) was graphically and analytically examined over a range of rainfall magnitudes, sizes of commercial developments, pavement footprints, and sensitive design parameters.
3.1. Model Calibration and Validation Results
While the first simulation most often did not meet the calibration criteria, the default runoff coefficient (Rv) values were then adjusted to bring statistical discrepancies within the acceptable range. Table 3 shows the initial and adjusted Rv values for all three permeable pavements datasets.
Table 3.
Initial and calibrated runoff coefficient values used for pervious surfaces of permeable pavements.
In Figure 4, the WinSLAMM simulated runoff reduction values were plotted for both observed and simulated values for all three permeable pavements after calibration, and their statistical correlation was determined through the regression hypothesis test.
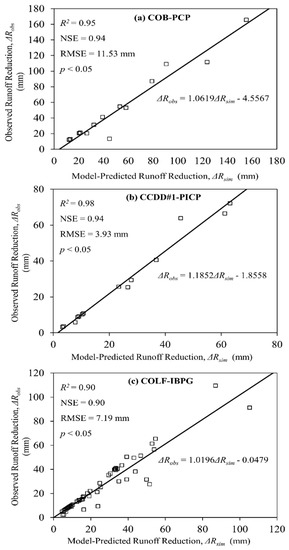
Figure 4.
Observed versus WinSLAMM simulated runoff reduction plots for the calibration of all three types of permeable pavements, (a) City of Brownsville (COB)-Porous Concrete Pavement (PCP), (b) Cameron County Drainage District#1 (CCDD#1)-Permeable Interlocking Concrete Pavement (PICP), and (c) City of La Feria (COLF)-Interlocking Block Pavement with Gravel (IBPG).
Figure 4a demonstrates the calibration of the City of Brownsville (COB)-porous concrete pavement (PCP) model, which considered observed runoff reduction values from 14 significant rainfall events (Table S1) from September 2014 to November 2014. Apparently, this initial simulation using the default program values achieved a reasonable fit to the observed data with a higher coefficient of determination (R2 = 0.94). These outputs also demonstrate a lesser degree of error (RMSE = 11.53 mm), which is almost 21% of the simulated mean. In addition, the regression hypothesis test indicated a meaningful (p < 0.05) insight into the correlation between observed data and initial simulation. Therefore, the COB-PCP model was not subjected to further calibration trials. A total of 14 significant rainfall events (Table S2) were considered from August 2014 to February 2015 for the simulation and calibration of the Cameron County Drainage District #1 (CCDD#1)-permeable interlocking concrete pavement (PICP) model. However, the first simulation was not adequate (R2 = 0.37) to support the correlation between observed and predicted runoff reductions. This discrepancy was assessed and reduced by decreasing the default Rv values for the pervious surface of the pavement by 45% to fit the simulated results very close to the observed behavior, as shown in Figure 4b. After calibration, the regression achieved an R2 of 0.98 with 16% variation (RMSE = 3.93 mm) based on the average modeled results. Also, the regression hypothesis test results also indicated this degree of correlation to be statistically significant (p < 0.05).
A total of 56 significant rainfall-runoff events (Table S3) were considered from May 2014 to March 2016 for the model simulation and calibration of the City of La Feria (COLF)-interlocking block pavement with gravel (IBPG) model. Initially, the simulated results were determined to be somewhat close (R2 = 0.88) to the observed behavior. Although the statistical test supports the results from initial simulations to be significant (p < 0.05) as well, the default Rv values underwent further modification to improve the effectiveness of the developed model in predicting outflow results. Figure 4c shows a better regression between the observed and simulated results from COLF-IBPG after multiplying the default Rv values by 15.5 just for the pervious sandy soil beneath the pavements sub-base layer (as IBPG ultimately allows subgrade infiltration to minimize surface runoff). The soil below in this installation was exceptionally loose and sandy. Accordingly, the calibration achieved an R2-value of 0.90 and minimized the standard error (RMSE = 7.19 mm) between the observed and simulated results, which was likely to be less than ±30% error on average. However, this degree of correlation was found to be the maximum for the quality of data achieved from the COLF-IBPG site.
All the calibrated permeable pavement models were validated with a separate observed dataset of rainfall-runoff reduction events, as shown in Table 4. This validation dataset was developed by randomly picking up a different degree of rainfall depths (low, medium, and high in depth), which were not previously used for the calibration runs.
Table 4.
Validation results of calibrated WinSLAMM models for three different types of monitored permeable pavements under the LRGV low-impact development (LID) implementation project.
The WinSLAMM calibration manual recommends the model accuracy to be ±25% on average [48]. The calibrated COB-PCP model was validated with a dataset of two additional rainfall events. The validation results showed that the COB-PCP model over-predicted runoff reductions by 24 ± 4% more than the observed values. The CCCD#1-PICP model was validated with four separate rainfall-runoff events. The validation results mostly under-predicted the runoff reduction by 12 ± 2%. The COLF#1-IBPG model was validated with six separate rainfall-runoff events, which mostly over-predicted the runoff reduction by 15 ± 8%. Overall, the validation results were considered to be adequate to justify the applicability of these types of permeable pavement models in the future runoff assessment of other drainage sites within LRGV.
3.2. WinSLAMM Application in Hydrologic Performance Assessment
3.2.1. Runoff Reduction over Varying Rainfall Depths
Figure 5 demonstrates the runoff reduction behavior of permeable pavements for a wide range of rainfall magnitudes within the monitoring timeframe. Based on this project’s Quality Assurance Project Plan (QAPP) for field monitoring, rainfall events greater than 1.0 mm were found to be adequate to detect a significant amount of measurable runoff from the surface of the permeable pavements. In Figure 5, scattered diamonds represent observed runoff reduction values for different rainfall events, whereas the solid curvilinear trendline represents the WinSLAMM-simulated runoff reduction pattern over the monitoring timeframe. Based on the actual rainfall-runoff relationship, the pattern of runoff reduction with respect to rainfall depth was not expected to be linear. Previous studies observed that the outflow volume followed a curvilinear trend as rainfall magnitude increased [57]. The WinSLAMM-simulated runoff reduction behavior in this project was found to be consistent with the observed rainfall-runoff reduction relationships and best fitted to the observed values using a second-order polynomial regression trend line (concave down) for all permeable pavements.
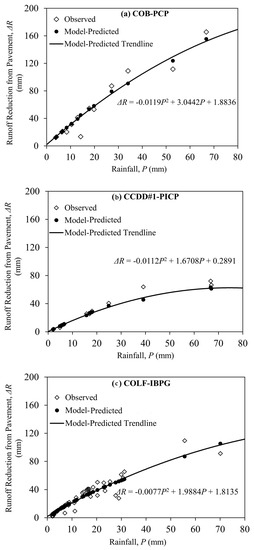
Figure 5.
Plot demonstrating the runoff reduction behavior of permeable pavements as a function of observed rainfall magnitudes within the monitoring timeframe. (a) City of Brownsville (COB)-Porous Concrete Pavement (PCP), (b) Cameron County Drainage District#1 (CCDD#1)-Permeable Interlocking Concrete Pavement (PICP), and (c) City of La Feria (COLF)-Interlocking Block Pavement with Gravel (IBPG).
The highest and lowest rainfall depths recorded were 67 mm and 3.81 mm at the COB-PCP station, respectively, as shown in Figure 5a. The observed results show that the existing PCP footprint (37.16 m2) reduced almost 54 mm of the surface runoff on average, which was generated from 20 mm of rainfall and occurred over 89.77 m2 of the drainage area. It demonstrates that more than 94% of the variation of observed results can be explained using the rainfall depths as the most important variable. The trendline of initial simulation results appeared to be very similar to the observed trendline. The modeled runoff reduction equation suggested that the COB-PCP performance might possibly start declining at rainfall depths above 172 mm, and shows a negligible runoff reduction above 256 mm.
As shown in Figure 5b, the highest and lowest rainfall depths recorded were 67 and 2 mm, respectively, at the CCDD#1-PICP station. The existing PICP design was adequate in reducing 27 mm of runoff from 20 mm of rainfall on average. Rainfall occurred within 619.17 m2 of the drainage area, which followed an increasing trend as the depth increased. However, the results from the initial simulation (not shown in the figure) appeared to be lower than observed for most rainfall events. Apparently, this is an indication of the more improved regional performance of the CCDD#1-PICP, as compared to its global performance throughout the central US as a study area. Our polynomial calibration equation describes a consistently increasing runoff reduction trend up to a rainfall depth of 61 mm. After that, the performance follows a sharp decline as rainfall depth increases, and it eventually poses zero runoff reduction for very large events at a rainfall depth of 149 mm.
According to Figure 5c, the highest and lowest rainfall depths were recorded at 70 mm and 2.03 mm at the COLF-IBPG station. The existing IBPG design collected runoff within 789.03 m2 of the drainage area, and showed somewhat better performance (25 mm of runoff reduction from 13 mm of rainfall on average) over PICP, perhaps because of its improved infiltration rate by the underlying pea gravel. However, the initial simulation showed a lower runoff reduction for IBPG, as compared to the observed values. The calibration equation suggests a gradual decline in runoff reduction performance from the COLF-IBPG surface at rainfall depths above 130 mm. The equation calculates zero runoff reduction for large events at depths above 258 mm.
Both the observed and model-simulated results showed an increasing runoff reduction trend with respect to rainfall depth. Overall, the calibrated permeable pavement models should be considered acceptable for the future prediction of runoff reduction behavior over a wide range of rainfall events in this region. All the outlier events can be explained by an unexpectedly triggered high or low runoff volume, either due to the antecedent long-term wet/dry period or suspected blockage into the overflow discharge pipe. Overall, the modeled results suggested that existing PCP and IBPG designs should be capable of handling rainfall events up to 260 mm in depth in most cases. This value appears to be a little less than an equivalent rainfall event of 50-year frequency and 24-h duration (300-mm depth in total) for the LRGV region. Although the PCP had improved runoff reduction performance over the other two installations, our assessment was site-specific thus far, which covered only a certain area of impervious cover applications. Since the runoff reduction behavior of stormwater control practices largely depends on the drainage site characteristics, it is important to examine the performance of permeable pavements in a broader picture for different sizes of commercial developments and pavement installations.
3.2.2. Peak Discharge over Varying Impervious Drainage Areas and Pavement Installation Sizes
A WinSLAMM baseline simulation can be defined as the execution of the model with no control practices within the designated land use. In this study, pre-development and post-development conditions were simulated in the model by describing the land surface to be 10% and 100% impervious, respectively. Based on a thorough examination of the regional soil characteristics, it was concluded that the LRGV soils were mostly composed of sandy clay loam [58]. In this part of the modeling, all the pervious surfaces were characterized as silty soil (a designation very close in characteristics to the sandy clay loam in terms of infiltration).
In Figure 6, the plot shows a pattern of peak runoff discharge behavior from a 50-year frequency and a 24-h rainfall event as a function of the size of commercial development and pavement installation areas. This figure clearly demonstrates a reduction in peak discharge with respect to the pavement’s size increment within the designated boundary of commercial development.
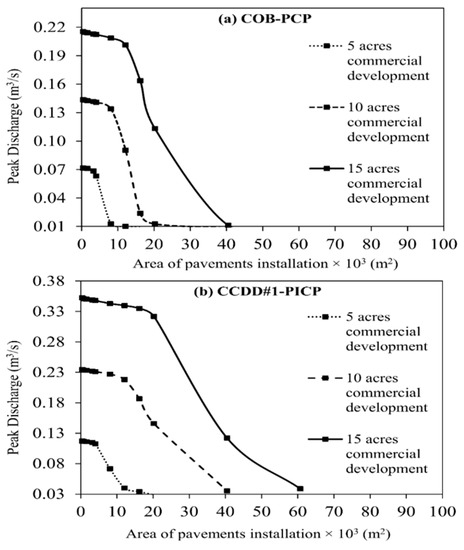
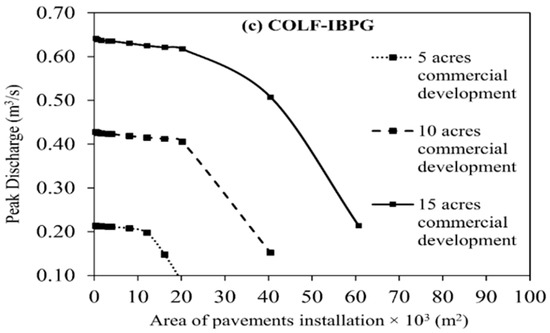
Figure 6.
Plot demonstrating peak discharge behavior from a 50-year 24-h rainfall event as a function of the size of commercial development and pavement installation areas. (a) City of Brownsville (COB)-Porous Concrete Pavement (PCP), (b) Cameron County Drainage District#1 (CCDD#1)-Permeable Interlocking Concrete Pavement (PICP), and (c) City of La Feria (COLF)-Interlocking Block Pavement with Gravel (IBPG).
The WinSLAMM model predicts a notable amount of peak discharge reduction when the PCP footprint is more than 50% of the total commercial development. On the other hand, the PICP shows an improved peak reduction when it covers more than 40% of the total development size. Thus, it may require a lesser PCP footprint than PICP area to generate the same amount of peak discharge at the outfall. The existing IBPG design has little impact on the run-on contribution from the impervious drainage cover. More likely, the design is suitable to mostly retain the direct rainfall volume on its surface and store it in its base reservoir. Accordingly, our model-simulated results were harmonious to the fact that it might require the same area of the IBPG footprint as the total development to meet a certain peak runoff discharge goal.
In Table 5, the simulated baseline peak discharge from a 50-year frequency and a 24-h rainfall event are shown for 5, 10, and 15 acres of commercial development at the post-development condition. This process was repeated for a 10-year frequency and 24-h rainfall event at the pre-development condition as well. From Figure 6, the required footprints of permeable pavements to meet the 10-year storm discharge goal were determined for all the pavements and are shown in Table 5. The simulated results indicate that it would require a PCP footprint of almost 50% and 60% lower than PICP and IBPG, respectively, to meet the same 10-year storm discharge target.
Table 5.
Assessment of PCP installation size requirements to meet a 10-year storm event discharge goal for 5, 10, and 15 acres of commercial development.
3.2.3. Runoff Reduction with Varying Sensitive Design Parameters
The WinSLAMM-calibrated permeable pavement models were also investigated to account for probable design improvements through the modification of base-level storage characteristics. However, no change in runoff was observed when dimensional and non-dimensional design parameters (e.g., initial infiltration rate, storage thickness, underdrain size, and porosity) were altered in a step-wise proportion in the permeable pavement subroutine. Eventually, the model was found to only be significantly sensitive to the porosity of base aggregates. Figure 7 describes the predicted increase in runoff reduction for all the permeable pavements with respect to change in porosity.
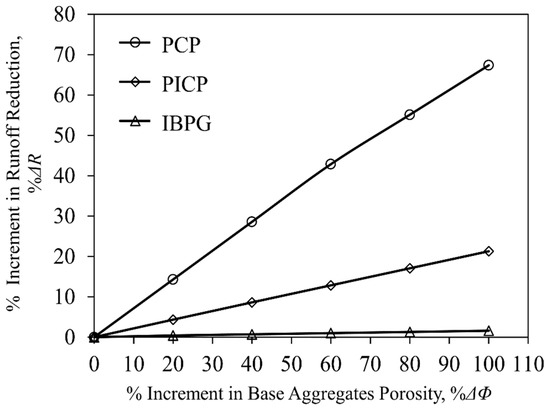
Figure 7.
Plot demonstrating the increase in runoff reduction behavior as a function of change in the porosity of base aggregates.
In our monitored permeable pavements, the base layer was constructed with open-graded angular aggregates (#57 aggregate or crushed limestone) with 35% (approximately) porosity. The model suggested that the existing PCP design might be able to store 30% additional runoff if the porosity of base aggregates was increased by 40%. The application of round-graded #4 aggregates might be a choice instead of angular aggregates to significantly improve the porosity. On the other hand, PICP might add a little more runoff reduction (10%) after the same degree of an increase in base level porosity. However, IBPG showed a negligible improvement in the runoff with respect to porosity increases.
As a field-scale model, WinSLAMM might not be such a suitable tool for design sensitivity analysis. Overall, WinSLAMM is closer to a planning tool, and may not be appropriate to study the underlying runoff reduction mechanisms through each of its significant design components. It is possible that the algorithm is not adequate to explain the performance of pavements as a function of initial infiltration rate, storage depth, or underdrain size; however, improvements in the model algorithms could be achieved with additional data collection and model parameter calibration.
4. Conclusions
The overall objective of this study was achieved including the reasonable calibration, validation, and application of the design and performance implementation of three different permeable pavements in a broad aspect. Our validation results showed that these models might over or under-predict runoff reduction within an acceptable error range. These calibrated models were proven to be statistically reasonable in predicting LRGV regional runoff over the long term. Overall, these models can add value in accomplishing future runoff predictive work for LRGV green infrastructure and watershed management. The model-simulated runoff reduction behavior was determined to be consistent with the observed rainfall-runoff relationship when fitted with a second-order polynomial regression trendline. The following are highlights of some of the important findings of this study.
- The model calibration equations (correlating simulated runoff reduction and rainfall depth) appear to be helpful in predicting surface runoff reduction from permeable pavements over a wide range of rainfall events.
- The model calibration runs suggested that PCP and IBPG designs might be capable of handling rainfall events as large as a 50-year frequency event over a 24-h time period in the semi-arid climatic region of the LRGV, depending on the pavement designs and field conditions. However, the PCP installation showed the optimal runoff reduction when compared to the other monitored types of pavements.
- The PCP performance was also evaluated over a broad range for different sizes of commercial developments in the LRGV region. The model-simulated results suggested that it should require a comparatively smaller PCP footprint within a commercial development than other types to achieve the same amount of discharge goal.
- The existing PCP design was highly sensitive to its base aggregate porosity. Higher storage of infiltrated runoff could be achieved if conventional angular aggregates were replaced with crushed stone or similar #4 aggregates with higher porosity during PCP construction.
As a field-scale model, WinSLAMM might not be a complete enough analytical tool for the design sensitivity analysis of permeable pavements to some extent. In fact, its algorithm was not found appropriate to explain the sensitivity of the behavior of pavements as a function of initial infiltration rate, depth of base materials, and other factors. However, additional data could be collected, and these factors need to be studied by using more complete mathematical or computer models that account for more advanced algorithms for permeable pavement subroutines in simulating runoff. However, this study mainly focused on the hydrologic performance of three different types of permeable pavement designs in the LRGV region. Other factors such as water quality, pavement compaction strength, and durability should also be taken into consideration during the selection of appropriate permeable pavement types for this region.
Overall, these permeable pavement models might be reasonable to be applied to other LRGV sites to simulate a similar runoff reduction trend. The piece of information achieved in this study should assist LRGV planners, stakeholders, and stormwater task force partners in the planning, design, and implementation of permeable pavements at future development sites. Outcomes from this study can be incorporated into the enhancement of property development options and values with innovative permeable pavements in the LRGV region.
Supplementary Materials
The following are available online at https://www.mdpi.com/2073-4441/11/9/1865/s1, Table S1: Field-observed and WinSLAMM model-predicted runoff reduction results for the City Brownsville (COB) - Porous Concrete Pavement (PCP) for different rainfall events, Table S2: Field-observed and WinSLAMM model-predicted runoff reduction results for the Cameron County Drainage District#1 (CCDD#1)—Permeable Interlocking Concrete Pavement (PICP) for different rainfall events, Table S3: Field-observed and WinSLAMM model-predicted runoff reduction results for the City of La Feria (COLF) – Interlocking Block Pavement with Gravel (IBPG) for different rainfall events.
Author Contributions
Conceptualization, T.A., K.D.J.; Methodology, T.A., K.D.J.; Formal Analysis, T.A.; Investigation, T.A., A.M., J.C.B.-C.; Supervision, K.D.J., J.C.B.-C.; Writing—Original Draft Preparation, T.A. and A.M.; Writing—Review and Editing, T.A., A.M., K.D.J., J.C.B.-C., J.G.
Funding
Funding for this research was provided by the Texas Commission on Environmental Quality (Project Contract# 582-13-30049) and financed through grants from the U.S. Environmental Protection Agency (Federal ID# 99614617).
Acknowledgments
The authors would like to thank TCEQ NPS Project Manager Tim Cawthon for his support and contribution in data quality assurance. The authors also would like to thank Brandon Dalton from C.C. Lynch & Associates Inc. for his guidance in troubleshooting of LID research equipment and Mohammed Elansary for Linux AWK scripting support facilitating the preparation of calibration files.
Conflicts of Interest
The authors declare no conflict of interest.
References
- Kannan, N.; Jeong, J.; Srinivasan, R. Hydrologic Modeling of a Canal-Irrigated Agricultural Watershed with Irrigation Best Management Practices: Case Study. J. Hydrol. Eng. 2011, 16, 746–757. [Google Scholar] [CrossRef]
- Kannan, N. SWAT Modeling of the Arroyo Colorado Watershed; Texas Water Resources Institute: College Station, TX, USA, 2012. [Google Scholar]
- Hernandez, E.A.; Uddameri, V. An assessment of optimal waste load allocation and assimilation characteristics in the Arroyo Colorado River watershed, TX along the US–Mexico border. Clean Technol. Environ. Policy 2013, 15, 617–631. [Google Scholar] [CrossRef]
- Raines, T.H.; Miranda, R.M. Simulation of Flow and Water Quality of the Arroyo Colorado, Texas; USGS: Austin, TX, USA, 2002.
- A.C.W.P. A Watershed Protection Plan for the Arroyo Colorado—Phase I; A Report of the Arroyo Colorado Watershed Partnership and Texas Sea Grant; 2007; pp. 31–59. [Google Scholar]
- Flores, J.; Benavides, J.A.; Cawthon, T. Update to the Arroyo Colorado Watershed Protection Plan; Texas Water Resources Institute: College Station, TX, USA, 2017. [Google Scholar]
- USEPA. Stormwater Technology Fact Sheet-Wet Detention Ponds. Available online: https://nepis.epa.gov/Exe/ZyPDF.cgi/200044D0.PDF?Dockey=200044D0.PDF (accessed on 18 September 2018).
- Hunt, W.F. Working with Regulators to Change Permeable Pavements Acceptance. In Proceedings of the American Society of Civil Engineers Low Impact Development, Buenos Aires, Argentina, 11–14 April 2010; pp. 1270–1280. [Google Scholar]
- Drake, J.A.P.; Bradford, A.; Marsalek, J. Review of environmental performance of permeable pavement systems: State of the knowledge. Water Qual. Res. J. 2013, 48, 203–222. [Google Scholar] [CrossRef]
- Pratt, C.J.; Mantle, J.D.G.; Schofield, P.A. UK research into the performance of permeable pavement, reservoir structures in controlling stormwater discharge quantity and quality. Water Sci. Technol. 1995, 32, 63–69. [Google Scholar] [CrossRef]
- Collins, K.A.; Hunt, W.F.; Hathaway, J.M. Hydrologic Comparison of Four Types of Permeable Pavement and Standard Asphalt in Eastern North Carolina. J. Hydrol. Eng. 2008, 13, 1146–1157. [Google Scholar] [CrossRef]
- Huang, J.; Valeo, C.; He, J.; Chu, A. Three Types of Permeable Pavements in Cold Climates: Hydraulic and Environmental Performance. J. Environ. Eng. 2016, 142, 04016025. [Google Scholar] [CrossRef]
- Barbosa, A.E.; Fernandes, J.N.; David, L.M. Key issues for sustainable urban stormwater management. Spec. Issue Stormwater Urban Areas 2012, 46, 6787–6798. [Google Scholar] [CrossRef] [PubMed]
- Church, P.E.; Granato, G.E.; Owens, D.W. Basic Requirements for Collecting, Documenting, and Reporting Precipitation and Stormwater-Flow Measurements; USDOT; USGS: Austin, TX, USA, 2003; pp. 47–49.
- Chow, M.F.; Yusop, Z.; Mohamed, M. Quality and first flush analysis of stormwater runoff from a tropical commercial catchment. Water Sci. Technol. 2011, 63, 1211–1216. [Google Scholar] [CrossRef]
- Brezonik, P.L.; Stadelmann, T.H. Analysis and predictive models of stormwater runoff volumes, loads, and pollutant concentrations from watersheds in the Twin Cities metropolitan area, Minnesota, USA. Water Res. 2002, 36, 1743–1757. [Google Scholar] [CrossRef]
- Dietz, M.E. Low Impact Development Practices: A Review of Current Research and Recommendations for Future Directions. Water. Air Soil Pollut. 2007, 186, 351–363. [Google Scholar] [CrossRef]
- Scholz, M.; Grabowiecki, P. Review of permeable pavement systems. Build. Environ. 2007, 42, 3830–3836. [Google Scholar] [CrossRef]
- Lucke, T.; Beecham, S. Field investigation of clogging in a permeable pavement system. Build. Res. Inf. 2011, 39, 603–615. [Google Scholar] [CrossRef]
- Jayasooriya, V.M.; Ng, A.W.M. Tools for Modeling of Stormwater Management and Economics of Green Infrastructure Practices: A Review. Water. Air Soil Pollut. 2014, 225, 2055. [Google Scholar] [CrossRef]
- Brattebo, B.O.; Booth, D.B. Long-term stormwater quantity and quality performance of permeable pavement systems. Water Res. 2003, 37, 4369–4376. [Google Scholar] [CrossRef]
- Bean, E.Z.; Hunt, W.F.; Bidelspach, D.A. Evaluation of Four Permeable Pavement Sites in Eastern North Carolina for Runoff Reduction and Water Quality Impacts. J. Irrig. Drain. Eng. 2007, 133, 583–592. [Google Scholar] [CrossRef]
- NOAA. National Weather Service Forecast Office, Brownsville, TX. Available online: https://w2.weather.gov/climate/xmacis.php?wfo=bro (accessed on 29 August 2018).
- Zhang, S.; Guo, Y. SWMM Simulation of the Storm Water Volume Control Performance of Permeable Pavement Systems. J. Hydrol. Eng. 2014, 20, 06014010. [Google Scholar] [CrossRef]
- Hamid, R.; Tsihrintzis, V.A.; Fuentes, H.R. Model Validation for Runoff Pollution from Urban Watersheds; ASCE: Reston, VA, USA, 1995; pp. 141–144. [Google Scholar]
- Kipkie, C.W.; James, W. Feasibility of a permeable pavement option in SWMM for long-term continuous modeling. Appl. Model. Urban Water Syst. 2000, 8, 303–324. [Google Scholar] [CrossRef]
- James, W.R.C.; James, W.; Langsdorff, H.V. Stormwater management model for environmental design of permeable pavement. Models Appl. Urban Water Syst. 2001, 9, 423. [Google Scholar] [CrossRef]
- Schlüter, W.; Jefferies, C. Modelling the outflow from a porous pavement. Urban Water 2002, 4, 245–253. [Google Scholar] [CrossRef]
- Hohaia, N.; Fassman, E.; Hunt, W.F.; Collins, K.A. Hydraulic and Hydrologic Modelling of Permeable Pavement. In World Environmental and Water Resources Congress 2011; ASCE Press: Reston, Virginia, USA, 2011; ISBN 978-0-7844-1173-5. [Google Scholar]
- Lee, J.G.; Borst, M.; Brown, R.A.; Rossman, L.; Simon, M.A. Modeling the Hydrologic Processes of a Permeable Pavement System. J. Hydrol. Eng. 2015, 20, 04014070. [Google Scholar] [CrossRef]
- Huang, J.; He, J.; Valeo, C.; Chu, A. Temporal evolution modeling of hydraulic and water quality performance of permeable pavements. J. Hydrol. 2016, 533, 15–27. [Google Scholar] [CrossRef]
- Palla, A.; Gnecco, I. Hydrologic modeling of Low Impact Development systems at the urban catchment scale. J. Hydrol. 2015, 528, 361–368. [Google Scholar] [CrossRef]
- Razzaghmanesh, M.; Borst, M. Investigation clogging dynamic of permeable pavement systems using embedded sensors. J. Hydrol. 2018, 557, 887–896. [Google Scholar] [CrossRef]
- Yong, C.F.; McCarthy, D.T.; Deletic, A. Predicting physical clogging of porous and permeable pavements. J. Hydrol. 2013, 481, 48–55. [Google Scholar] [CrossRef]
- Razzaghmanesh, M.; Beecham, S. A Review of Permeable Pavement Clogging Investigations and Recommended Maintenance Regimes. Water 2018, 10, 337. [Google Scholar] [CrossRef]
- Radfar, A.; Doan Rockaway, T. Clogging Prediction of Permeable Pavement. J. Irrig. Drain. Eng. 2016, 142, 04015069. [Google Scholar] [CrossRef]
- USEPA. Handbook for Developing Watershed Plans to Restore and Protect Our Waters. Available online: https://www.epa.gov/sites/production/files/2015-09/documents/2008_04_18_nps_watershed_handbook_handbook-2.pdf (accessed on 25 August 2018).
- PV & Associates. WinSLAMM (Version 10.0). Available online: http://www.winslamm.com/docs/01%20WinSLAMM%20v%2010.0%20User’s%20Guide%20-%20Introduction.pdf (accessed on 30 September 2018).
- Velásquez, R.A. Application of WinSLAMM to Evaluate the Effect of Green Infrastructure Implementation in Northern Utah. Ph.D. Thesis, Utah State University, Logan, UT, USA, 2018; Volume 7405. [Google Scholar]
- Hurley, S.E.; Forman, R.T.T. Stormwater ponds and biofilters for large urban sites: Modeled arrangements that achieve the phosphorus reduction target for Boston’s Charles River, USA. Ecol. Eng. 2011, 37, 850–863. [Google Scholar] [CrossRef]
- Zellner, M.; Massey, D.; Minor, E.; Gonzalez-Meler, M. Exploring the effects of green infrastructure placement on neighborhood-level flooding via spatially explicit simulations. Comput. Environ. Urban Syst. 2016, 59, 116–128. [Google Scholar] [CrossRef]
- Pitt, R. Small storm hydrology and why it is important for the design of stormwater control practices. Adv. Model. Manag. Stormwater Impacts 1999, 7, 61–91. [Google Scholar] [CrossRef]
- Pitt, R.; Voorhees, J. SLAMM, the source loading and management model. Wet Weather Flow Urban Watershed Technol. Manag. 2002, 1, 103–139. [Google Scholar]
- Pitt, R.; Voorhees, J. Green infrastructure performance modeling with WinSLAMM. In Proceedings of the 9th EWRI Water and Environment Congress, Kansas City, MO, USA, 17–21 May 2009; ASCE: Reston, VA, USA, 2009. [Google Scholar]
- Pitt, R. Module 4: Stormwater Controls and WinSLAMM. Available online: http://unix.eng.ua.edu/~rpitt/Class/International%20urban%20water%20systems/WinSLAMM%20and%20stormwater%20controls%20Feb%2018%202006.htm (accessed on 19 September 2018).
- Pitt, R.; Voorhees, J. WinSLAMM and low impact development. In Proceedings of the Putting the LID on Stormwater Management LID Conference, College Park, Maryland, September 2004; Civil Engineering, University of Alabama: College Park, MD, USA, 2004; p. 13. [Google Scholar]
- Eaton, T.T. Approach and case-study of green infrastructure screening analysis for urban stormwater control. J. Environ. Manag. 2018, 209, 495–504. [Google Scholar] [CrossRef] [PubMed]
- Pitt, R. Calibration of WinSLAMM. Available online: http://winslamm.com/docs/WinSLAMM%20calibration%20Sept%2024%202008.pdf (accessed on 21 September 2018).
- Mahmoud, A.; Alam, T.; Yeasir, A.; Rahman, M.; Sanchez, A.; Guerrero, J.; Jones, K.D. Evaluation of field-scale stormwater bioretention structure flow and pollutant load reductions in a semi-arid coastal climate. Ecol. Eng. X 2019, 1, 100007. [Google Scholar] [CrossRef]
- Mourad, M.; Bertrand-Krajewski, J.-L.; Chebbo, G. Calibration and validation of multiple regression models for stormwater quality prediction: Data partitioning, effect of dataset size and characteristics. Water Sci. Technol. 2005, 52, 45–52. [Google Scholar] [CrossRef] [PubMed][Green Version]
- Wong, T.H.F.; Fletcher, T.D.; Duncan, H.P.; Jenkins, G.A. Modelling urban stormwater treatment—A unified approach. Ecol. Eng. 2006, 27, 58–70. [Google Scholar] [CrossRef]
- Pradhan-Salike, I.; Pokharel, J.R. Impact of Urbanization and Climate Change on Urban Flooding: A case of the Kathmandu Valley. J. Nat. Resour. Dev. 2017, 7, 56–66. [Google Scholar] [CrossRef]
- Dotto, C.B.S.; Mannina, G.; Kleidorfer, M.; Vezzaro, L.; Henrichs, M.; McCarthy, D.T.; Freni, G.; Rauch, W.; Deletic, A. Comparison of different uncertainty techniques in urban stormwater quantity and quality modelling. Water Res. 2012, 46, 2545–2558. [Google Scholar] [CrossRef] [PubMed]
- Dotto, C.B.S.; Kleidorfer, M.; Deletic, A.; Rauch, W.; McCarthy, D.T. Impacts of measured data uncertainty on urban stormwater models. J. Hydrol. 2014, 508, 28–42. [Google Scholar] [CrossRef]
- Haddad, K.; Egodawatta, P.; Rahman, A.; Goonetilleke, A. Uncertainty analysis of pollutant build-up modelling based on a Bayesian weighted least squares approach. Sci. Total Environ. 2013, 449, 410–417. [Google Scholar] [CrossRef] [PubMed][Green Version]
- Chow, M.F.; Yusop, Z.; Toriman, M.E. Modelling runoff quantity and quality in tropical urban catchments using Storm Water Management Model. Int. J. Environ. Sci. Technol. 2012, 9, 737–748. [Google Scholar] [CrossRef]
- Jasrotia, A.S.; Singh, R. Modeling runoff and soil erosion in a catchment area, using the GIS, in the Himalayan region, India. Environ. Geol. 2006, 51, 29–37. [Google Scholar] [CrossRef]
- USDA-NRCS. Soil Survey Area Map of Hidalgo, Willacy, and Cameron County in Texas. Available online: https://websoilsurvey.sc.egov.usda.gov/App/WebSoilSurvey.aspx (accessed on 26 September 2018).


© 2019 by the authors. Licensee MDPI, Basel, Switzerland. This article is an open access article distributed under the terms and conditions of the Creative Commons Attribution (CC BY) license (http://creativecommons.org/licenses/by/4.0/).