Spatial Variability of Soil Physical and Hydraulic Properties in a Durum Wheat Field: An Assessment by the BEST-Procedure


Abstract
1. Introduction
2. Materials and Methods
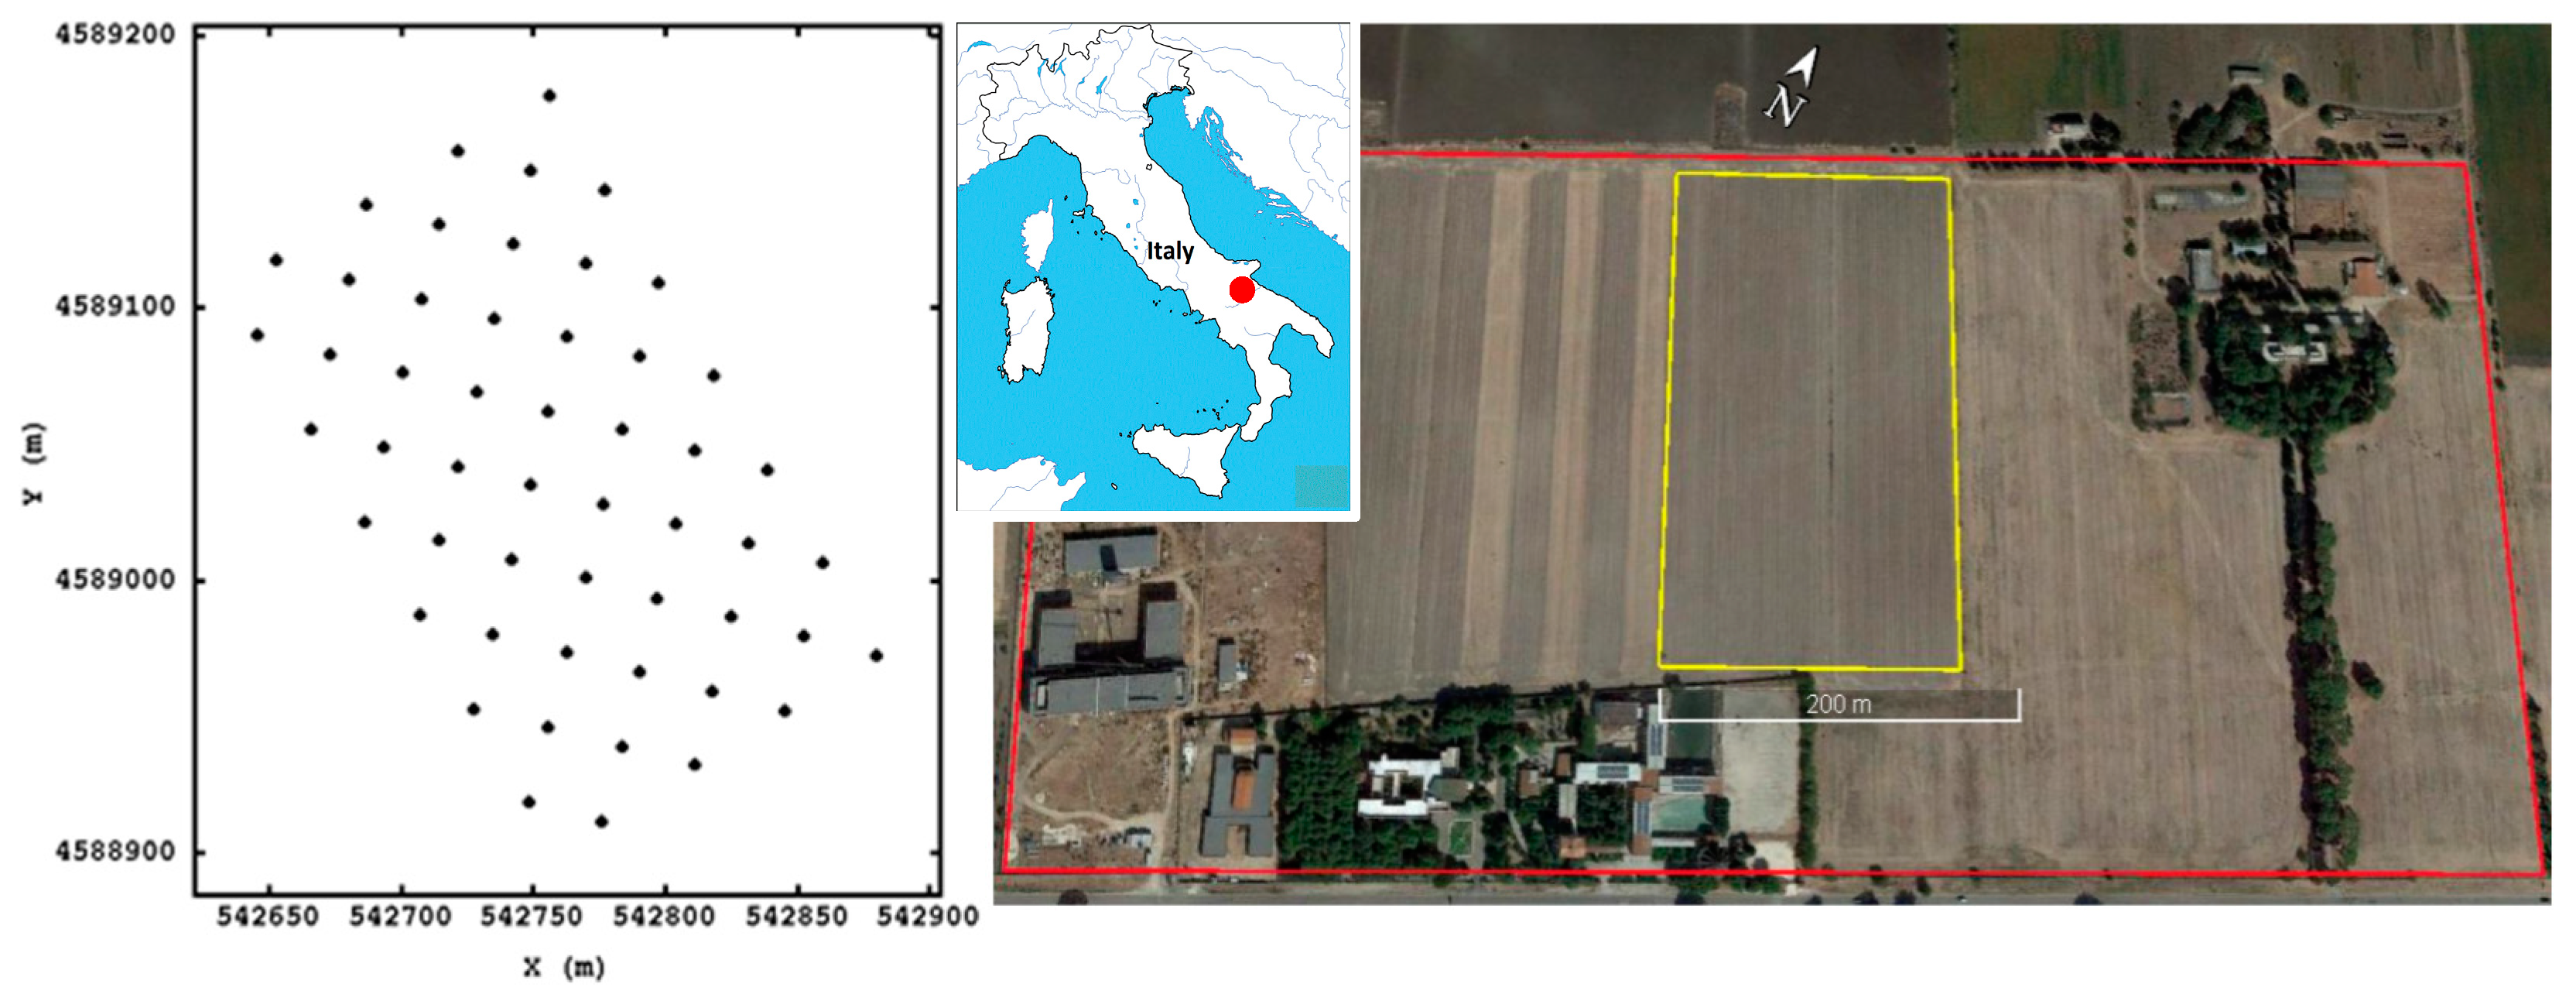
2.1. Study Area
2.2. Lab and Field Measurements
2.3. Physical and Hydraulic Soil Properties
2.4. Data Analysis
2.4.1. Preliminary Statistical Analysis
2.4.2. Correlation and Spatial Analysis
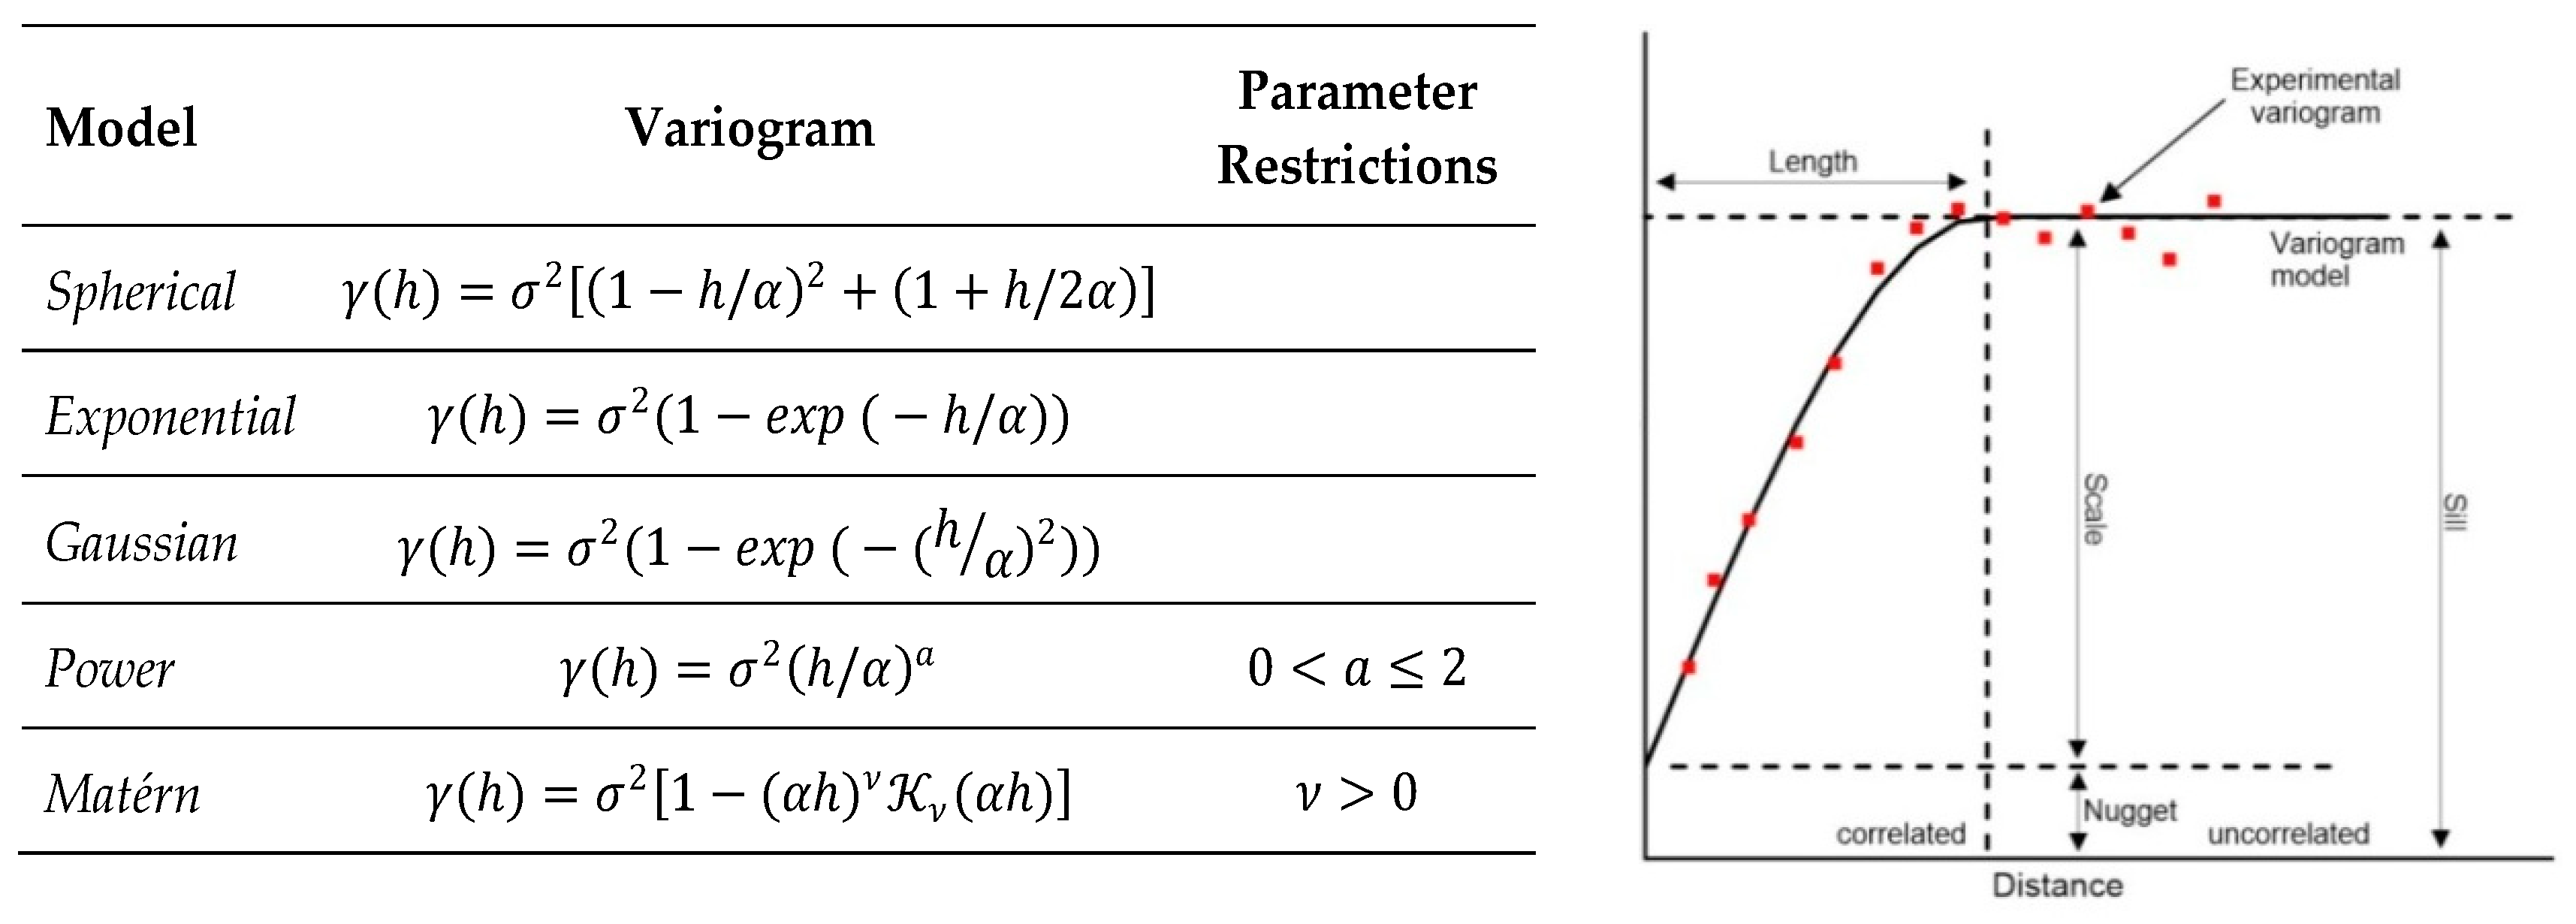
2.4.3. Geostatistical Analysis
Variography
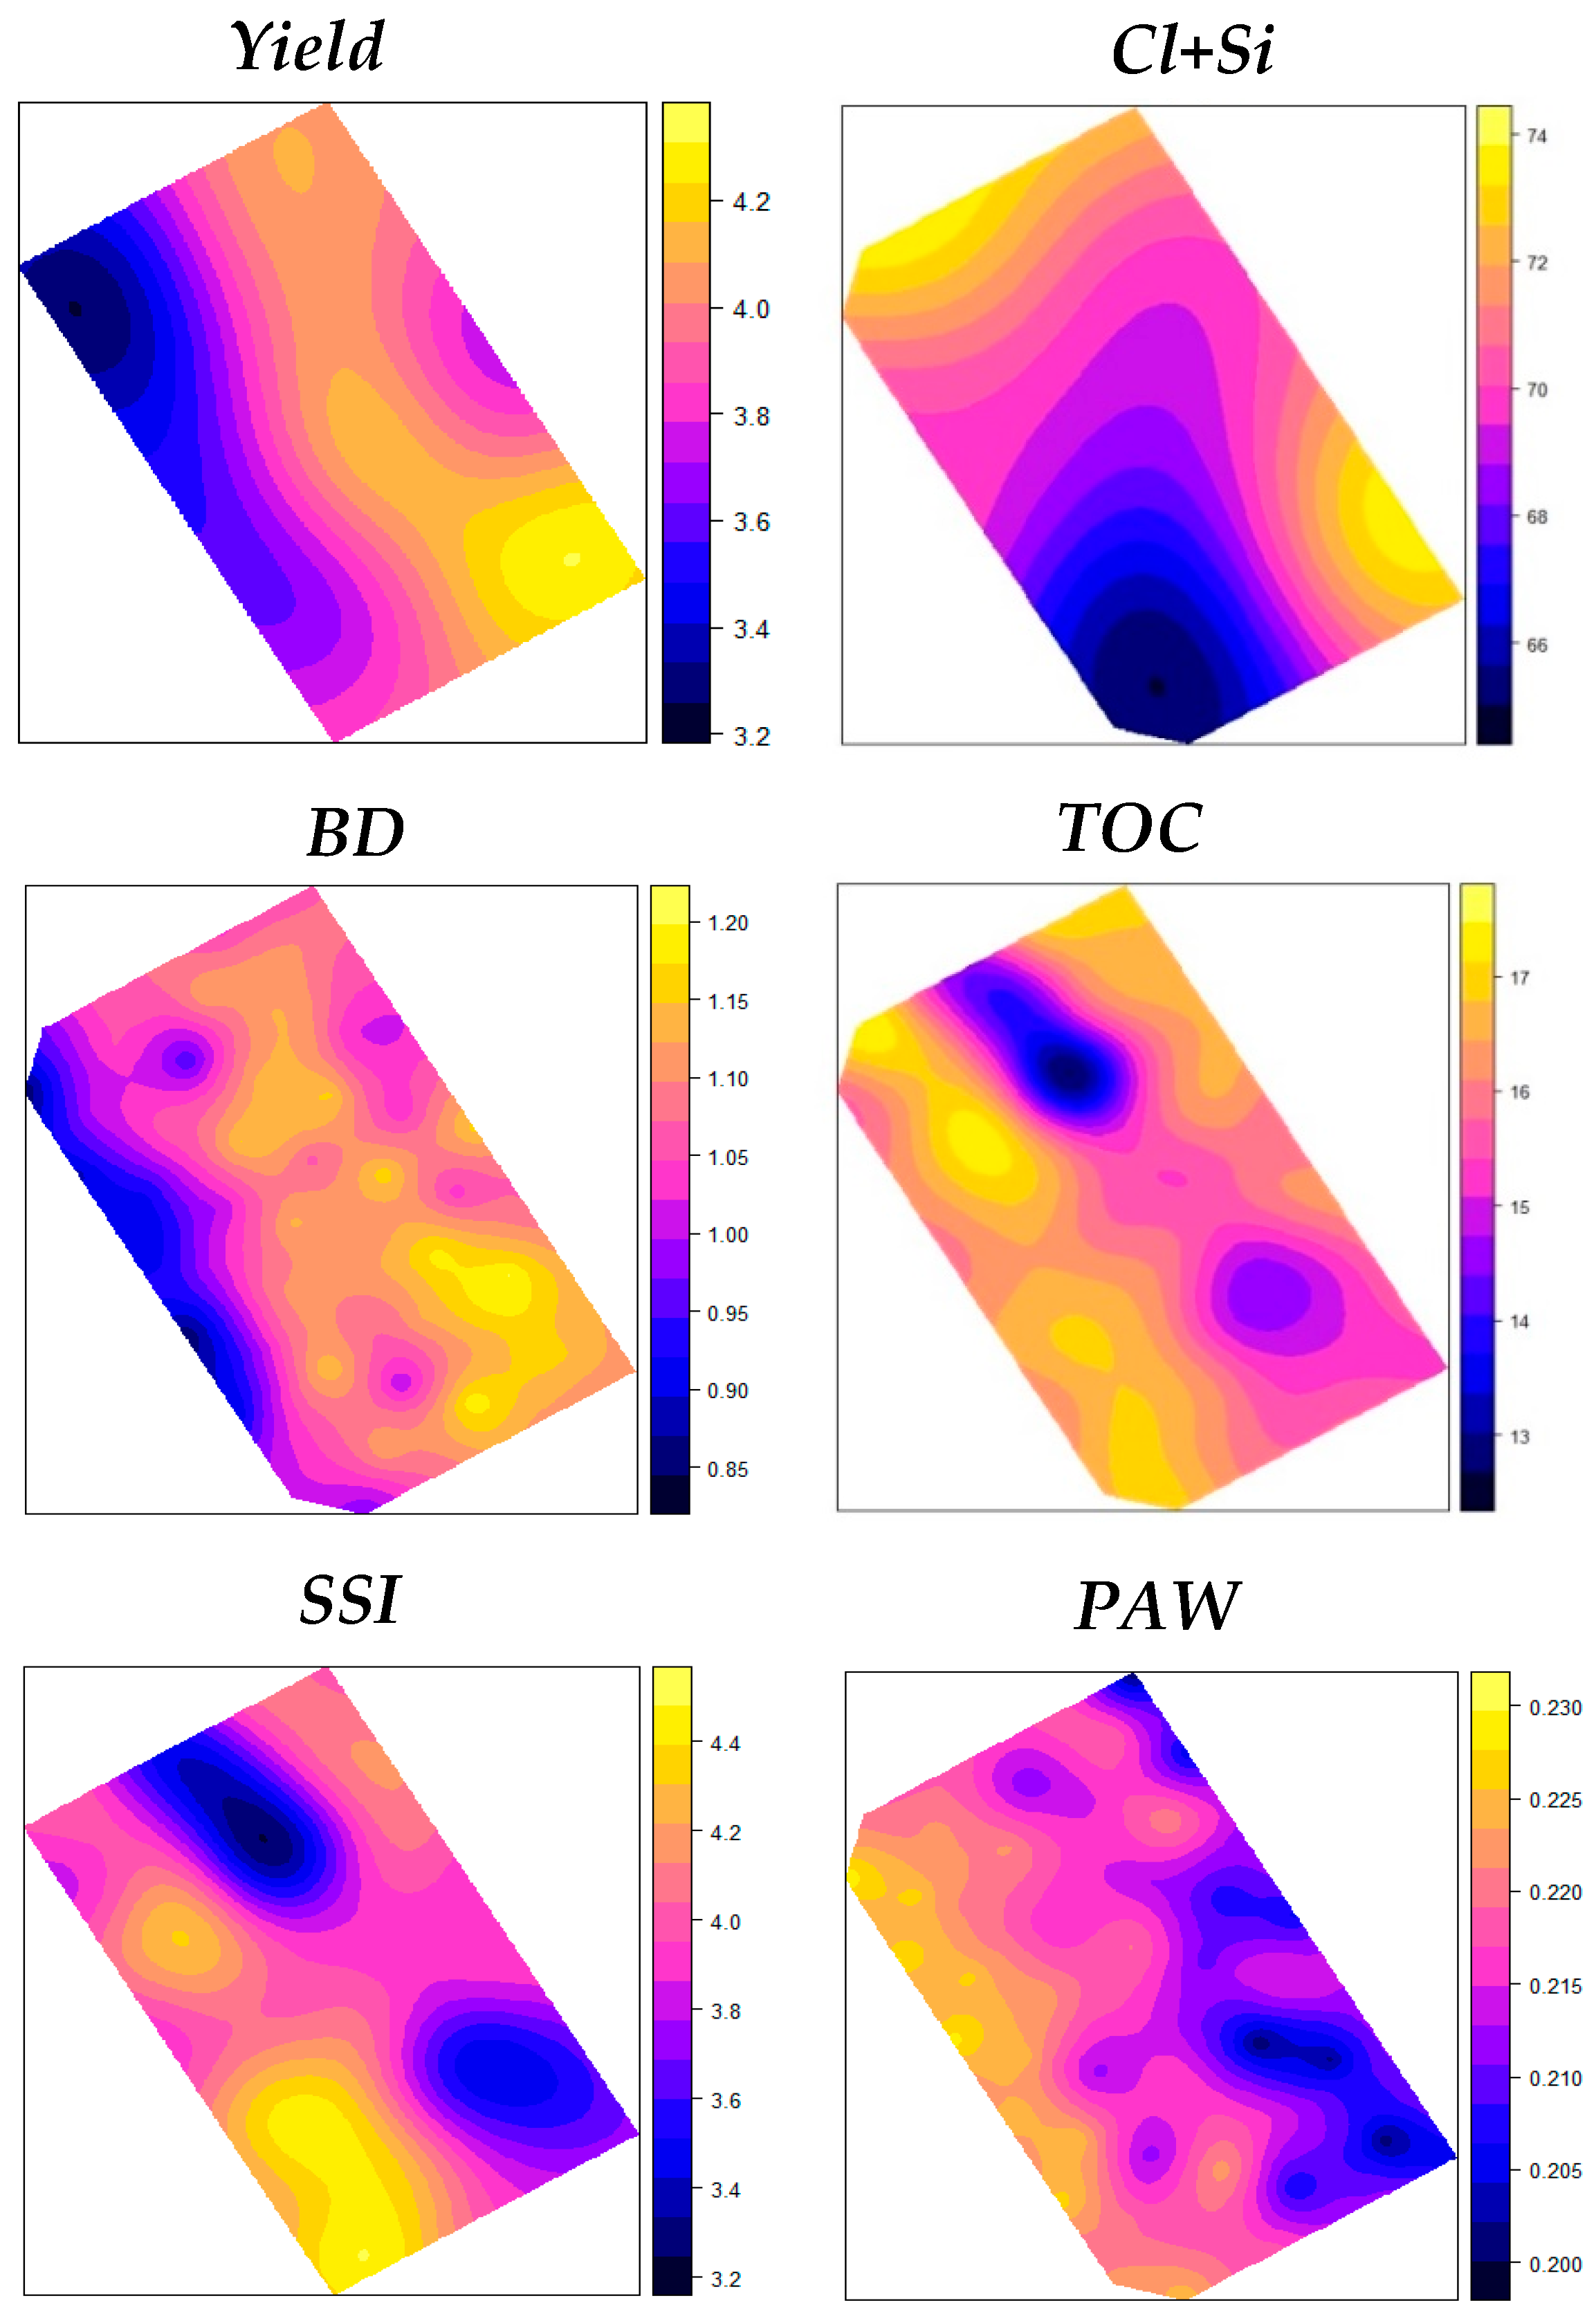
Spatial Interpolation
2.4.4. Cross-Correlogram
3. Results
3.1. Preliminary Statistical Analysis
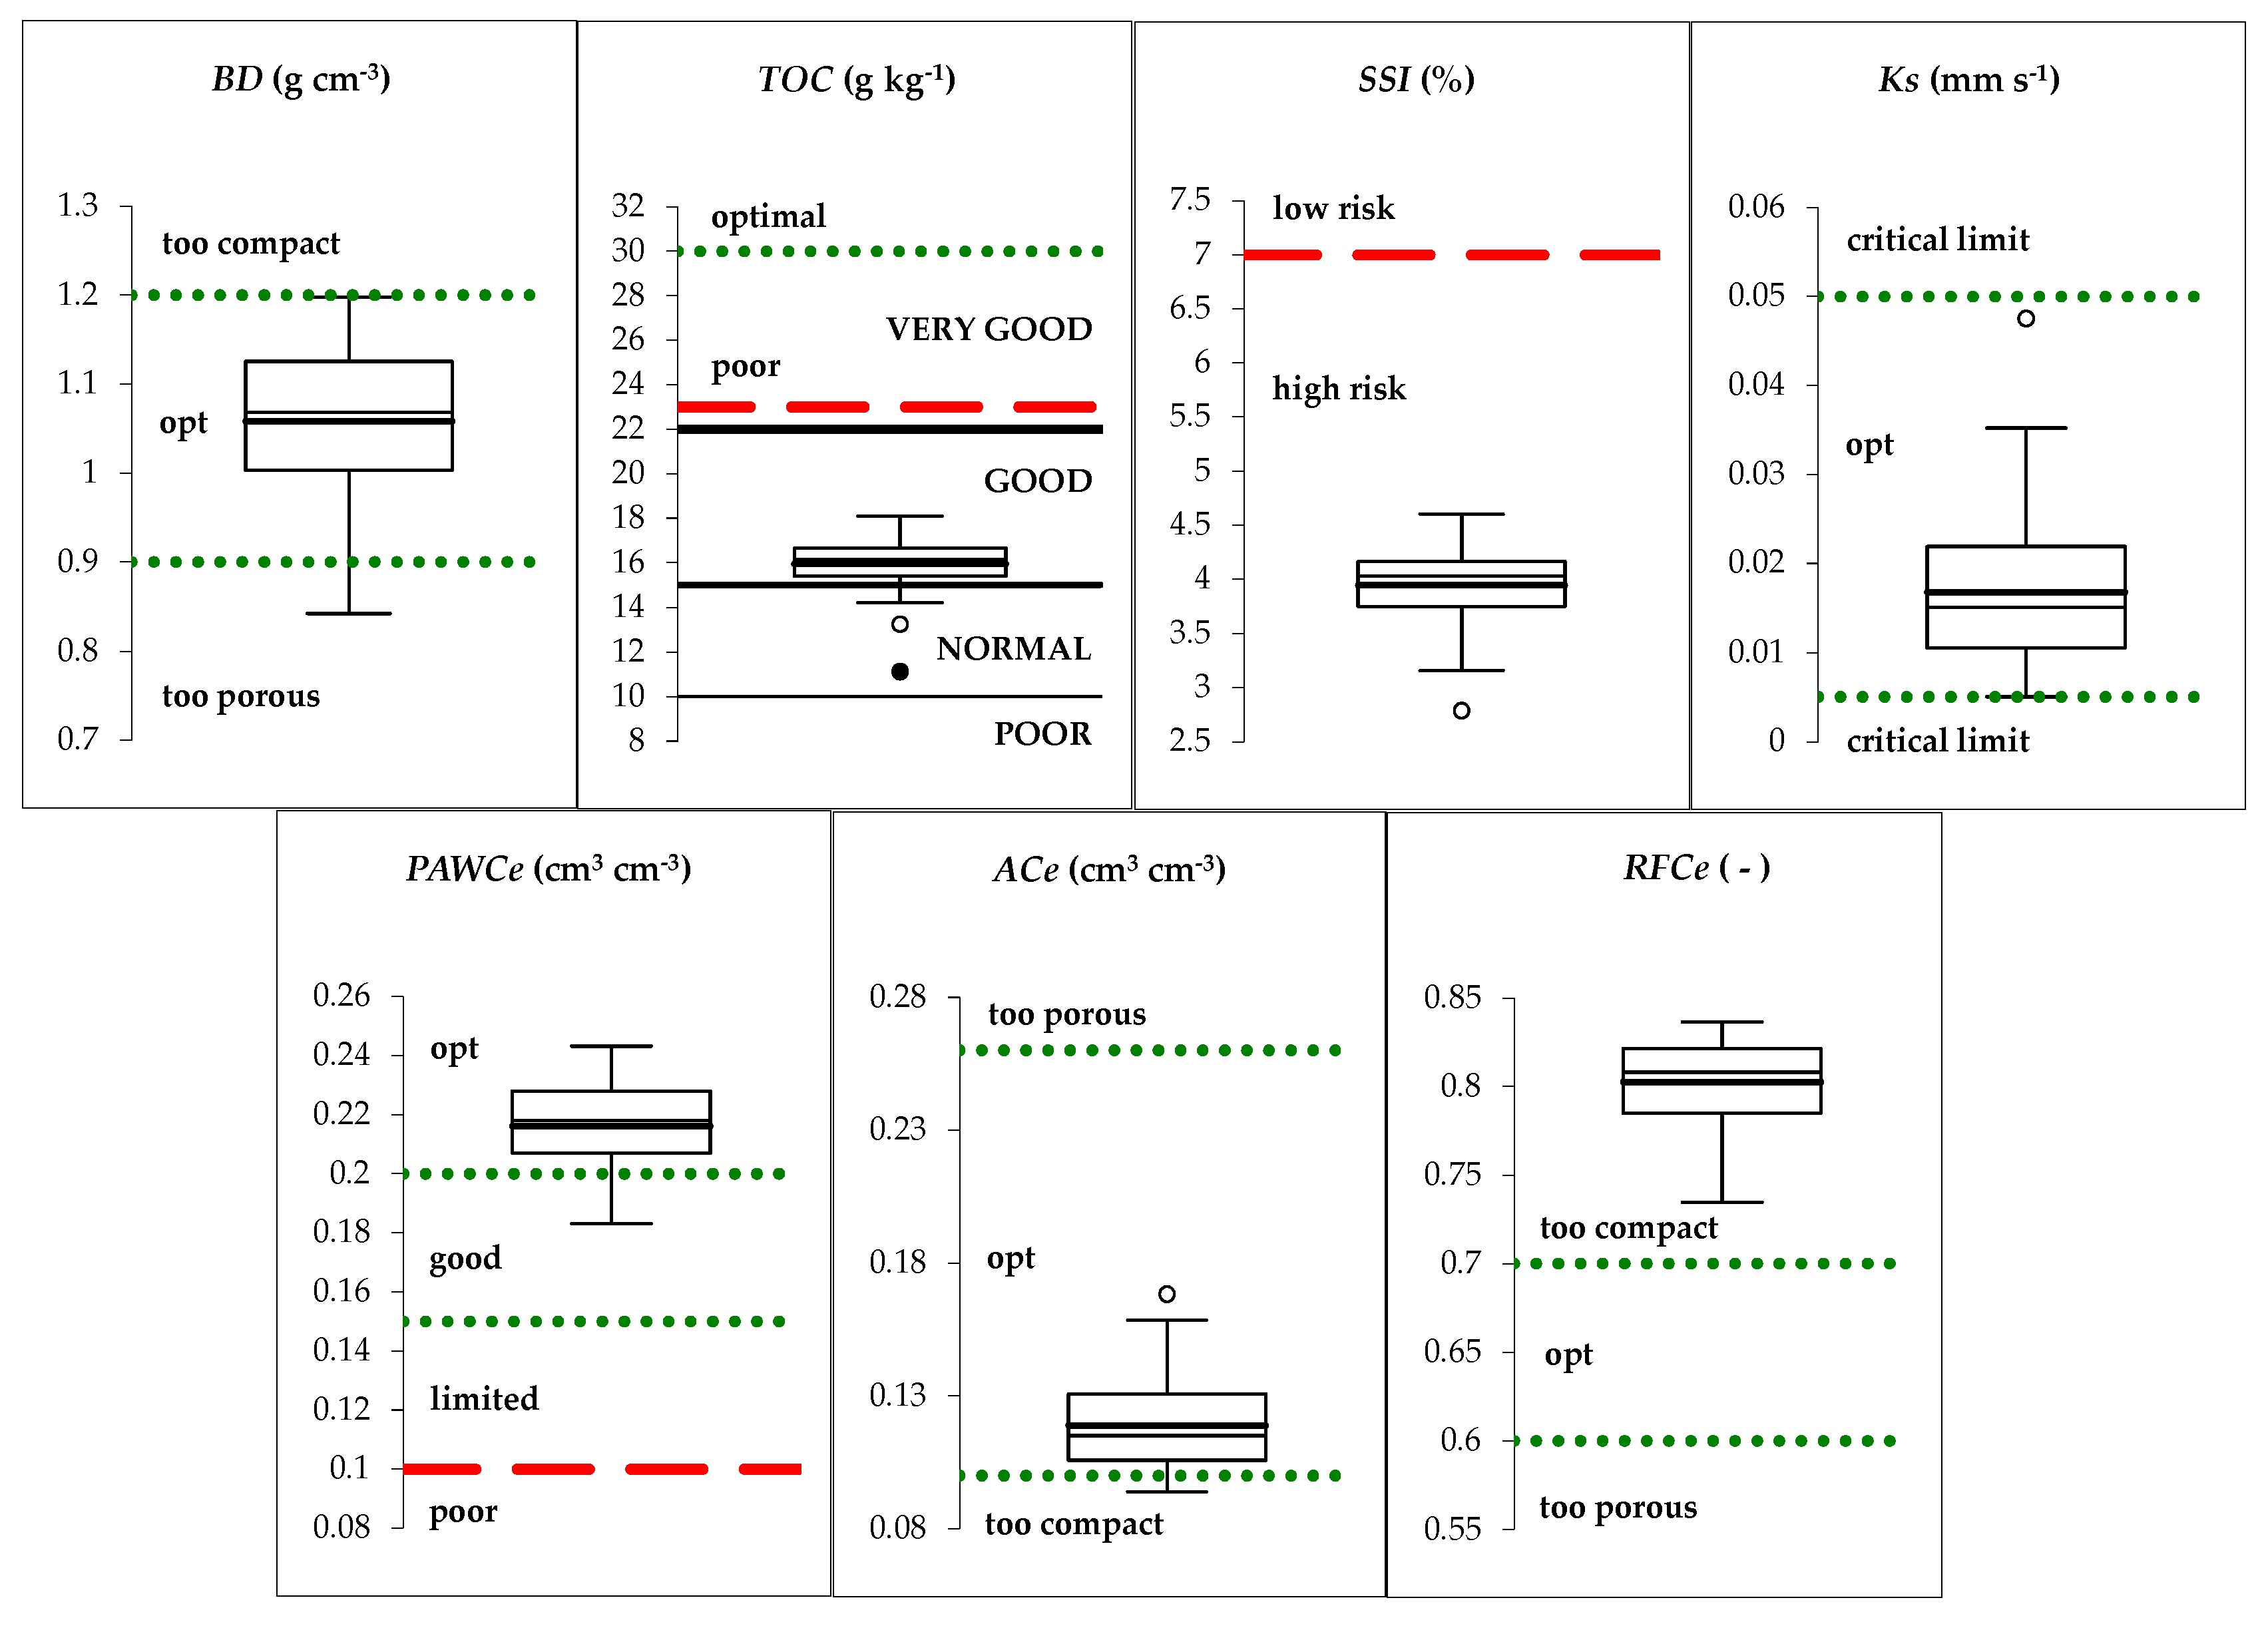
3.2. Physical and Hydraulic Soil Properties
3.3. Correlation and Spatial Analysis
4. Discussion
5. Conclusions
Author Contributions
Funding
Acknowledgments
Conflicts of Interest
References
- Bagarello, V.; Baiamonte, G.; Castellini, M.; Di Prima, S.; Iovino, M. A comparison between the single ring pressure infiltrometer and simplified falling head techniques. Hydrol. Process. 2014, 28, 4843–4853. [Google Scholar] [CrossRef]
- Alletto, L.; Coquet, Y. Temporal and spatial variability of soil bulk density and near-saturated hydraulic conductivity under two contrasted tillage management systems. Geoderma 2009, 152, 85–94. [Google Scholar] [CrossRef]
- Keller, T.; Stutter, J.A.; Nissen, K.; Rydberg, T. Using field measurement of saturated soil hydraulic conductivity to detect low-yielding zones in three Swedish fields. Soil Tillage Res. 2012, 124, 68–77. [Google Scholar] [CrossRef]
- Pinheiro, E.A.R.; de Jong van Lier, Q.; Šimůnek, J. The role of soil hydraulic properties in crop water use efficiency: A process-based analysis for some Brazilian scenarios. Agric. Syst. 2019, 173, 364–377. [Google Scholar] [CrossRef]
- Ventrella, D.; Charfeddine, M.; Giglio, L.; Castellini, M. Application of DSSAT models for an agronomic adaptation strategy under climate change in Southern Italy: Optimum sowing and transplanting time for winter durum wheat and tomato. Ital. J. Agron. 2012, 7, 109–115. [Google Scholar] [CrossRef]
- Reynolds, W.D.; Drury, C.F.; Tan, C.S.; Fox, C.A.; Yang, X.M. Use of indicators and pore volume-function characteristics to quantify soil physical quality. Geoderma 2009, 152, 252–263. [Google Scholar] [CrossRef]
- Castellini, M.; Stellacci, A.M.; Barca, E.; Iovino, M. Application of multivariate analysis techniques for selecting soil physical quality indicators: A case study in long-term field experiments in Apulia (southern Italy). Soil Sci. Soc. Am. J. 2019, 83, 707–720. [Google Scholar] [CrossRef]
- Castellini, M.; Fornaro, F.; Garofalo, P.; Giglio, L.; Rinaldi, M.; Ventrella, D.; Vitti, C.; Vonella, A.V. Effects of No-Tillage and Conventional Tillage on Physical and Hydraulic Properties of Fine Textured Soils under Winter Wheat. Water 2019, 11, 484. [Google Scholar] [CrossRef]
- Bagarello, V.; Iovino, M.; Elrick, D. A simplified falling-head technique for rapid determination of field-saturated hydraulic conductivity. Soil Sci. Soc. Am. J. 2004, 68, 66–73. [Google Scholar] [CrossRef]
- Blackmore, S.; Godwin, R.J.; Fountas, S. The analysis of spatial and temporal trends in yield map data over six years. Biosyst. Eng. 2003, 84, 455–466. [Google Scholar] [CrossRef]
- Hakojärvi, M.; Hautala, M.; Ristolainen, A.; Alakukku, L. Yield variation of spring cereals in relation to selected soil physical properties in three clay soil fields. Eur. J. Argon. 2013, 49, 1–11. [Google Scholar] [CrossRef]
- Garofalo, P.; Ventrella, D.; Kersebaum, K.C.; Gobin, A.; Trnka, M.; Giglio, L.; Dubrovský, M.; Castellini, M. Water footprint of winter wheat under climate change: Trends and uncertainties associated to the ensemble of crop models. Sci. Total Environ. 2019, 658, 1186–1208. [Google Scholar] [CrossRef]
- Fernández-Gálvez, J.; Pollacco, J.A.P.; Lassabatere, L.; Angulo-Jaramillo, R.; Carrick, S. A general Beerkan Estimation of Soil Transfer parameters method predicting hydraulic parameters of any unimodal water retention and hydraulic conductivity curves: Application to the Kosugi soil hydraulic model without using particle size distribution data. Adv. Water Resour. 2019, 129, 118–130. [Google Scholar] [CrossRef]
- Castellini, M.; Iovino, M. Pedotransfer functions for estimating soil water retention curve of Sicilian soils. Arch. Agron. Soil Sci. 2019, 65, 1401–1416. [Google Scholar] [CrossRef]
- Zhang, X.; Zhu, J.; Wendroth, O.; Matocha, C.; Edwards, D. Effect of Macroporosity on Pedotransfer Function Estimates at the Field Scale. Vadose Zone J. 2019, 18, 180151. [Google Scholar] [CrossRef]
- Burke, W.; Gabriels, D.; Bouma, J. Soil Structure Assessment; Balkema: Rotterdam, The Netherlands, 1986. [Google Scholar]
- Dane, J.H.; Hopmans, J.W. Water retention and storage: Laboratory. In Methods of Soil Analysis, Part 4, Physical Methods; Dane, J.H., Topp, G.C., Eds.; SSSA: Madison, WI, USA, 2002; pp. 688–692. [Google Scholar]
- Wind, G.P. Capillary conductivity data estimated by a simple method. In Water in the Unsaturated Zone: Proceedings of Wageningen Syposium, June 1966; Rijtema, P.E., Wassink, H., Eds.; IASAH: Gentbrugge, Belgium, 1968; Volume 1, pp. 181–191. [Google Scholar]
- Hosseini, S.M.M.M.; Ganjian, N.; Pisheh, Y.P. Estimation of the water retention curve for unsaturated clay. Can. J. Soil Sci. 2011, 91, 543–549. [Google Scholar] [CrossRef]
- Rustanto, A.; Booij, M.J.; Wösten, H.; Hoekstra, A.Y. Application and recalibration of soil water retention pedotransfer functions in a tropical upstream catchment: Case study in Bengawan Solo, Indonesia. J. Hydrol. Hydromech. 2017, 65, 307–320. [Google Scholar] [CrossRef]
- Lozano-Baez, S.E.; Cooper, M.; Ferraz, S.F.B.; Ribeiro Rodrigues, R.; Pirastru, M.; Di Prima, S. Previous land use affects the recovery of soil hydraulic properties after forest restoration. Water 2018, 10, 453. [Google Scholar] [CrossRef]
- Di Prima, S.; Castellini, M.; Abou Najm, M.R.; Stewart, R.D.; Angulo-Jaramillo, R.; Winiarski, T.; Lassabatere, L. Experimental Assessment of a New Comprehensive Model for Single Ring Infiltration Data. J. Hydrol. 2019, 573, 937–951. [Google Scholar] [CrossRef]
- Lassabatère, L.; Angulo-Jaramillo, R.; Ugalde, J.M.S.; Cuenca, R.; Braud, I.; Haverkamp, R. Beerkan estimation of soil transfer parameters through infiltration experiments: BEST. Soil Sci. Soc. Am. J. 2006, 70, 521–532. [Google Scholar] [CrossRef]
- Bagarello, V.; Castellini, M.; Di Prima, S.; Iovino, M. Soil hydraulic properties determined by infiltration experiments and different heights of water pouring. Geoderma 2014, 213, 492–501. [Google Scholar] [CrossRef]
- Alagna, V.; Bagarello, V.; Di Prima, S.; Guaitoli, F.; Iovino, M.; Keesstra, S.; Cerdà, A. Using Beerkan experiments to estimate hydraulic conductivity of a crusted loamy soil in a Mediterranean vineyard. J. Hydrol. Hydromech. 2019, 67, 191–200. [Google Scholar] [CrossRef]
- Di Prima, S.; Rodrigo-Comino, J.; Novara, A.; Iovino, M.; Pirastru, M.; Keesstra, S.; Cerda, A. Assessing soil physical quality of citrus orchards under tillage, herbicide and organic managements. Pedosphere 2018, 28, 463–477. [Google Scholar] [CrossRef]
- Castellini, M.; Iovino, M.; Pirastru, M.; Niedda, M.; Bagarello, V. Use of BEST procedure to assess soil physical quality in the Baratz Lake catchment (Sardinia, Italy). Soil Sci. Soc. Am. J. 2016, 80, 742–755. [Google Scholar] [CrossRef]
- Khaledian, M.R.; Shabanpour, M.; Alinia, H. Saturated hydraulic conductivity variation in a small garden under drip irrigation. Geosyst. Eng. 2016, 19, 266–274. [Google Scholar] [CrossRef]
- Mubarak, I.; Angulo-Jaramillo, R.; Mailhol, J.C.; Ruelle, P.; Khaledian, M.; Vauclin, M. Spatial analysis of soil surface hydraulic properties: Is infiltration method dependent? Agric. Water Manag. 2010, 97, 1517–1526. [Google Scholar] [CrossRef]
- Lassabatère, L.; Di Prima, S.; Angulo-Jaramillo, R.; Keesstra, S.; Salesa, D. Beerkan multi-runs for characterizing water infiltration and spatial variability of soil hydraulic properties across scales. Hydrol. Sci. J. 2019. [Google Scholar] [CrossRef]
- Cavallo, G.; De Benedetto, D.; Castrignanò, A.; Quarto, R.; Vonella, A.V.; Buttafuoco, G. Use of geophysical data for assessing 3D soil variation in a durum wheat field and their association with crop yield. Biosyst. Eng. 2016, 152, 28–40. [Google Scholar] [CrossRef]
- De Benedetto, D.; Castrignanò, A.; Rinaldi, M.; Ruggieri, S.; Santoro, F.; Figorito, B.; Gualano, S.; Diacono, M.; Tamborrino, R. An approach for delineating homogeneous zones by using multi-sensor data. Geoderma 2013, 199, 117–127. [Google Scholar] [CrossRef]
- Barca, E.; De Benedetto, D.; Stellacci, A.M. Contribution of EMI and GPR proximal sensing data in soil water content assessment by using linear mixed effects models and geostatistical approaches. Geoderma 2019, 343, 280–293. [Google Scholar] [CrossRef]
- Ventrella, D.; Stellacci, A.M.; Castrignanò, A.; Charfeddine, M.; Castellini, M. Effects of crop residue management on winter durum wheat productivity in a long term experiment in Southern Italy. Eur. J. Agron. 2016, 77, 188–198. [Google Scholar] [CrossRef]
- Campi, P.; Mastrorilli, M.; Stellacci, A.M.; Modugno, F.; Palumbo, A.D. Increasing the effective use of water in green asparagus through deficit irrigation strategies. Agric. Water Manag. 2019, 217, 119–130. [Google Scholar] [CrossRef]
- Myers, D.E. Interpolation and estimation with spatially located data. Chemom. Intell. Lab. Syst. 1991, 11, 209–228. [Google Scholar] [CrossRef]
- Bagarello, V.; Di Prima, S.; Iovino, M. Comparing alternative algorithms to analyze the Beerkan infiltration experiment. Soil Sci. Soc. Am. J. 2014, 78, 724–736. [Google Scholar] [CrossRef]
- Gee, G.W.; Bauder, J. Particle-size Analysis, In Methods of Soil Analysis, Part 1, 2nd ed.; American Society of Agronomy/Soil Science Society of America: Madison, WI, USA, 1986. [Google Scholar]
- Vitti, C.; Stellacci, A.M.; Leogrande, R.; Mastrangelo, M.; Cazzato, E.; Ventrella, D. Assessment of organic carbon in soils: A comparison between the Springer–Klee wet digestion and the dry combustion methods in Mediterranean soils (Southern Italy). Catena 2016, 137, 113–119. [Google Scholar] [CrossRef]
- Castellini, M.; Di Prima, S.; Iovino, M. An assessment of the BEST procedure to estimate the soil water retention curve: A comparison with the evaporation method. Geoderma 2018, 320, 82–94. [Google Scholar] [CrossRef]
- Reynolds, W.D.; Drury, C.F.; Yang, X.M.; Fox, C.A.; Tan, C.S.; Zhang, T.Q. Land management effects on the near-surface physical quality of a clay loam soil. Soil Tillage Res. 2007, 96, 316–330. [Google Scholar] [CrossRef]
- Dexter, A.R. Soil physical quality. Part I. Theory, effects of soil texture, density, and organic matter, and effects on root growth. Geoderma 2004, 120, 201–214. [Google Scholar] [CrossRef]
- Pieri, C.J.M.G. Fertility of soils: A Future for Farming in the West African Savannah. In Fertility of Soils: A Future for Farming in the West African Savannah; Springer: Berlin, Germany, 1992; p. 558. [Google Scholar]
- Sequi, P.; De Nobili, M., VII. Carbonio organico. In Metodi di Analisi Chimica del Suolo. Ministero per le Politiche Agricole e Forestali, Osservatorio Nazionale Pedologico e per la Qualità del Suolo; Violante, P., Ed.; Franco Angeli Editore: Milano, Italy, 2000. [Google Scholar]
- Castellini, M.; Pirastru, M.; Niedda, M.; Ventrella, D. Comparing physical quality of tilled and no-tilled soils in an almond orchard in southern Italy. Ital. J. Agron. 2013, 8, 149–157. [Google Scholar] [CrossRef]
- Reynolds, W.D.; Drury, C.F.; Yang, X.M.; Tan, C.S.; Yang, J.Y. Impacts of 48 years of consistent cropping, fertilization and land management on the physical quality of a clay loam soil. Can. J. Soil Sci. 2014, 94, 403–419. [Google Scholar] [CrossRef]
- Barca, E.; Bruno, E.; Bruno, D.E.; Passarella, G. GTest: A software tool for graphical assessment of empirical distributions’ Gaussianity. Environ. Monit. Assess. 2016, 188, 138. [Google Scholar] [CrossRef]
- Moran, P.A.P. Notes on continuous stochastic phenomena. Biometrika 1950, 37, 17–23. [Google Scholar] [CrossRef]
- Rura, M.J.; Griffith, D.A. Spatial Statistics in SAS. In Handbook of Applied Spatial Analysis; Fischer, M., Getis, A., Eds.; Springer: Berlin/Heidelberg, 2010. [Google Scholar]
- Barca, E.; Porcu, E.; Bruno, D.; Passarella, G. An automated decision support system for aided assessment of variogram models. Environ. Model. Softw. 2017, 87, 72–83. [Google Scholar] [CrossRef]
- Ribeiro, P.J., Jr.; Diggle, P.J. geoR: A package for geostatistical analysis. R News 2001, 1/2, 14–18. [Google Scholar]
- Vieira, S.R.; Hatfield, T.L.; Nielsen, D.R.; Biggar, J.W. Geostatistical theory and application to variability of some agronomical properties. Hilgardia Berkeley. 1983, 51, 1–75. [Google Scholar] [CrossRef]
- Isaaks, E.H.; Srivastava, R.M. An Introduction to Applied Geostatistics; Oxford University press: New York, NY, USA, 1989. [Google Scholar]
- Stein, A.; Brouwer, J.; Bouma, J. Methods for comparing spatial variability patterns of millet yield and soil data. Soil Sci. Soc. Am. J. 1997, 61, 861–870. [Google Scholar] [CrossRef]
- Barca, E.; Passarella, G. Spatial evaluation of the risk of groundwater quality degradation. A comparison between disjunctive kriging and geostatistical simulation. Environ. Monit. Assess. 2008, 137, 261–273. [Google Scholar] [CrossRef]
- Cambardella, C.A.; Moorman, T.B.; Novak, J.M.; Parkin, T.B.; Karlen, D.L.; Turco, R.F.; Konopka, A.E. Field-scale variability of soil properties in central Iova soils. Soil Sci. Soc. Am. J. 1994, 58, 1501–1511. [Google Scholar] [CrossRef]
- Hoshino, A.; Tamura, K.; Fujimaki, H.; Asano, M.; Ose, K.; Higashi, T. Effects of crop abandonment and grazing exclusion on available soil water and other soil properties in a semi-arid Mongolian grassland. Soil Tillage Res. 2009, 105, 228–235. [Google Scholar] [CrossRef]
- Iovino, M.; Castellini, M.; Bagarello, V.; Giordano, G. Using static and dynamic indicators to evaluate soil physical quality in a Sicilian area. Land Degrad. Dev. 2016, 27, 200–210. [Google Scholar] [CrossRef]
- Topp, G.C.; Reynolds, W.D.; Cook, F.J.; Kirby, J.M.; Carter, M.R. Physical attributes of soil quality. In Soil Quality for Crop Production and EcosystemHealth; Developments in Soil Science, volume 25; Gregorich, E.G., Carter, M.R., Eds.; Elsevier: New York, NY, USA, 1997; pp. 21–58. [Google Scholar]
- Reynolds, W.D.; Yang, X.M.; Drury, C.F.; Zhang, T.Q.; Tan, C.S. Effects of selected conditioners and tillage on the physical quality of a clay loam soil. Can. J. Soil Sci. 2003, 83, 318–393. [Google Scholar] [CrossRef]
- Agnese, C.; Bagarello, V.; Baiamonte, G.; Iovino, M. Comparing physical quality of forest and pasture soils in a Sicilian Watershed. Soil Sci. Soc. Am. J. 2011, 75, 1958. [Google Scholar] [CrossRef]
- Cullotta, S.; Bagarello, V.; Baiamonte, G.; Gugliuzza, G.; Iovino, M.; La Mela Veca, D.S.; Maetzke, F.; Palmeri, V.; Sferlazza, S. Comparing Different Methods to Determine Soil Physical Quality in a Mediterranean Forest and Pasture Land. Soil Sci. Soc. Am. J. 2016, 80, 1038–1056. [Google Scholar] [CrossRef]
- Ventrella, D.; Virzì, N.; Intrigliolo, F.; Palumbo, M.; Cambrea, M.; Platania, A.; Sciacca, F.; Licciardello, S.; Troccoli, A.; Russo, M.; et al. Environmental effectiveness of GAECcross-compliance standard 2.1 ‘Maintaining the level of soil organic matter through management of stubble and crop residues’ and economic evaluation of the competitiveness gap for farmers. Ital. J. Agron. 2015, 10, 697. [Google Scholar]
- Reynolds, W.D.; Drury, C.F.; Yang, X.M.; Tan, C.S. Optimal soil physical quality inferred through structural regression and parameter interactions. Geoderma 2008, 146, 466–474. [Google Scholar] [CrossRef]
- Castellini, M.; Niedda, M.; Pirastru, M.; Ventrella, D. Temporal changes of soil physical quality under two residue management systems. Soil Use Manag. 2014, 30, 423–434. [Google Scholar] [CrossRef]
- Ferrara, R.M.; Mazza, G.; Muschitiello, C.; Castellini, M.; Stellacci, A.M.; Navarro, A.; Lagomarsino, A.; Vitti, C.; Rossi, R.; Rana, G. Short-term effects of conversion to no-tillage on respiration and chemical-physical properties of the soil: A case study in a wheat cropping system in semi-dry environment. Ital. J. Agrometeorol. 2017, 1, 47–58. [Google Scholar]
- Bagarello, V.; Di Stefano, C.; Ferro, V.; Iovino, M.; Sgroi, A. Physical and hydraulic characterization of a clay soil at the plot scale. J. Hydrol. 2010, 387, 54–64. [Google Scholar] [CrossRef]
- Dexter, A.R. Advances in characterization of soil structure. Soil Tillage Res. 1988, 11, 199–238. [Google Scholar] [CrossRef]


| Variable | n | Mean | st.dev. | Median | Range | Skewness | Kurtosis |
|---|---|---|---|---|---|---|---|
| Yield (t ha−1) | 52 | 3.86 | 0.77 | 3.84 | 3.86 | 0.38 | 0.18 |
| BD (g cm−3) | 52 | 1.06 | 0.09 | 1.07 | 0.36 | −0.65 | −0.32 |
| RFCe (-) | 52 | 0.80 | 0.02 | 0.81 | 0.10 | −0.81 | 0.04 |
| ACe (cm3 cm−3) | 52 | 0.12 | 0.02 | 0.12 | 0.07 | 0.75 | −0.12 |
| PAWCe (cm3 cm−3) | 52 | 0.22 | 0.02 | 0.22 | 0.06 | −0.33 | −0.79 |
| Ks (mm s−1) | 52 | 0.02 | 0.01 | 0.02 | 0.04 | 1.15 | 1.71 |
| TOC (g kg−1) | 52 | 15.95 | 1.16 | 16.14 | 6.97 | −1.48 | 4.12 |
| Cl + Si (g 100g−1) | 52 | 69.86 | 3.02 | 70.32 | 11.81 | −0.27 | −0.71 |
| SSI (%) | 52 | 3.94 | 0.36 | 4.03 | 1.81 | −0.69 | 0.77 |
| Variable | K-S (D) | p-Value |
|---|---|---|
| Yield (t ha−1) | 0.08656 | >0.1500 |
| BD (g cm−3) | 0.098441 | >0.1500 |
| RFCe (-) | 0.114814 | 0.0860 |
| ACe (cm3 cm−3) | 0.129142 | 0.0291 |
| PAWCe (cm3 cm−3) | 0.081048 | >0.1500 |
| Ks (mm s−1) | 0.133452 | 0.0209 |
| TOC (g kg−1) | 0.103982 | >0.1500 |
| Cl + Si (g 100g−1) | 0.099201 | >0.1500 |
| SSI (%) | 0.106077 | 0.1484 |
| Yield | BD | RFCe | ACe | PAWCe | Ks | TOC | Cl + Si | SSI | |
|---|---|---|---|---|---|---|---|---|---|
| Moran I | 0.2194 * | 0.3920 ** | −0.2232 | −0.0394 | 0.4564 ** | 0.0121 | 0.2055 * | 0.5889 ** | 0.4474 ** |
| p-value | 0.0312 | 0.0007 | 0.9435 | 0.5610 | 0.0001 | 0.4007 | 0.0331 | 0.001 | 0.0001 |
| Yield | BD | RFCe | ACe | PAWCe | Ks | TOC | Cl + Si | SSI | |
|---|---|---|---|---|---|---|---|---|---|
| Nugget | 0.48 | 0 | 0.00061 | 0.00028 | 0 | 6.59 × 10⁻⁵ | 0.395 | 3.099 | 0.036 |
| Partial sill | 0.151 | 0.006 | 0.00011 | 0.00131 | 0.00012 | 6.55 × 10⁻⁶ | 1.102 | 8.298 | 0.101 |
| Nugget to sill ratio | 0.761 | − | 0.847 | − | − | 0.910 | 0.264 | 0.272 | 0.263 |
| Range | 62 | 40.0 | 286.9 | 772.5 | 60.0 | 98.2 | 29.7 | 89.3 | 39.9 |
| Model | Mat (k = 10) | Sph | Mat (k = 10) | Mat (k = 10) | Sph | Mat (k = 0.05) | Mat (k = 5) | Mat (k = 10) | Mat (k = 10) |
| Pred. vs. obs. (r) | 0.31 | 0.46 | − | − | 0.49 | − | 0.42 | 0.74 | 0.63 |
| 0 m | 25 m | 50 m | 75 m | 100 m | |
|---|---|---|---|---|---|
| SSI vs. PAWCe | 0.3805 | 0.2683 | 0.1448 | 0.0007 | −0.0968 |
| SSI vs. BD | −0.3825 | −0.2554 | −0.1249 | 0.0443 | 0.1092 |
| SSI vs. Yield | −0.2582 | −0.1791 | −0.0329 | 0.0667 | 0.0591 |
| SSI vs. TOC | 0.8078 | 0.3554 | 0.0194 | −0.1031 | −0.0846 |
| SSI vs. Cl + Si | −0.6202 | −0.4288 | −0.2312 | −0.0173 | 0.1248 |
| SSI vs. RFCe | −0.0168 | −0.0341 | −0.0546 | 0.0017 | 0.0465 |
| 0 m | 25 m | 50 m | 75 m | 100 m | |
|---|---|---|---|---|---|
| BD vs. PAWCe | −0.7051 | −0.4559 | −0.2974 | 0.1381 | 0.0361 |
| BD vs. SSI | −0.3825 | −0.2554 | −0.1249 | 0.0443 | 0.1092 |
| BD vs. Yield | 0.4219 | 0.3488 | 0.1937 | 0.0023 | −0.0536 |
| BD vs. TOC | −0.3924 | −0.2814 | −0.1355 | 0.0524 | 0.1030 |
| BD vs. Cl + Si | 0.1466 | 0.0650 | 0.0358 | −0.0016 | −0.0507 |
| BD vs. RFCe | 0.4643 | 0.3974 | 0.2894 | 0.0953 | −0.0848 |
| Plant Species | Agro-Environmental Management | Soil Texture | TOC (g kg−1) | |
|---|---|---|---|---|
| Castellini et al. [65] | durum wheat | burning of stubble and straw | clay | 14.6−16.3 |
| durum wheat | incorporation of stubble and straw | clay | 15.6−17.1 | |
| Iovino et al. [57] | vetch in annual rotation with durum wheat | shallow tillage (about 10–15 cm) | clay | 8.9−7.1 |
| degraded olive orchard | shallow tillage (10 cm) | silty clay | 5.3−5.7 | |
| re-established grassland | undisturbed with moderate pasture | clay | 6.5−25.9 | |
| eucalyptus plantation | undisturbed with moderate pasture | clay | 6.5−9.5 | |
| Castellini et al. [26] | holm oak forest | − | sandy loam | 29 |
| branched asphodel grassland | − | sandy loam | 36 | |
| high maquis | − | sandy loam | 50 | |
| false yellowhead grassland | − | sandy loam | 15 | |
| Ferrara et al. [66] | durum wheat | conventional tillage | silty clay | 13.8 |
| durum wheat | no-tillage | silty clay | 16.7 | |
| Castellini et al. [39] | corn | fertilized with sewage | sand | 10.4 |
| durum wheat | conventional tillage | silty loam | 15.7 | |
| citrus groves | - | sandy loam | 22.6 | |
| citrus groves | - | sandy loam | 11.6 |
© 2019 by the authors. Licensee MDPI, Basel, Switzerland. This article is an open access article distributed under the terms and conditions of the Creative Commons Attribution (CC BY) license (http://creativecommons.org/licenses/by/4.0/).
Share and Cite
Castellini, M.; Stellacci, A.M.; Tomaiuolo, M.; Barca, E. Spatial Variability of Soil Physical and Hydraulic Properties in a Durum Wheat Field: An Assessment by the BEST-Procedure. Water 2019, 11, 1434. https://doi.org/10.3390/w11071434
Castellini M, Stellacci AM, Tomaiuolo M, Barca E. Spatial Variability of Soil Physical and Hydraulic Properties in a Durum Wheat Field: An Assessment by the BEST-Procedure. Water. 2019; 11(7):1434. https://doi.org/10.3390/w11071434
Chicago/Turabian StyleCastellini, Mirko, Anna Maria Stellacci, Matteo Tomaiuolo, and Emanuele Barca. 2019. "Spatial Variability of Soil Physical and Hydraulic Properties in a Durum Wheat Field: An Assessment by the BEST-Procedure" Water 11, no. 7: 1434. https://doi.org/10.3390/w11071434
APA StyleCastellini, M., Stellacci, A. M., Tomaiuolo, M., & Barca, E. (2019). Spatial Variability of Soil Physical and Hydraulic Properties in a Durum Wheat Field: An Assessment by the BEST-Procedure. Water, 11(7), 1434. https://doi.org/10.3390/w11071434