Dam Effects on Downstream Riparian Wetlands: The Nenjiang River, Northeast China


Abstract
1. Introduction
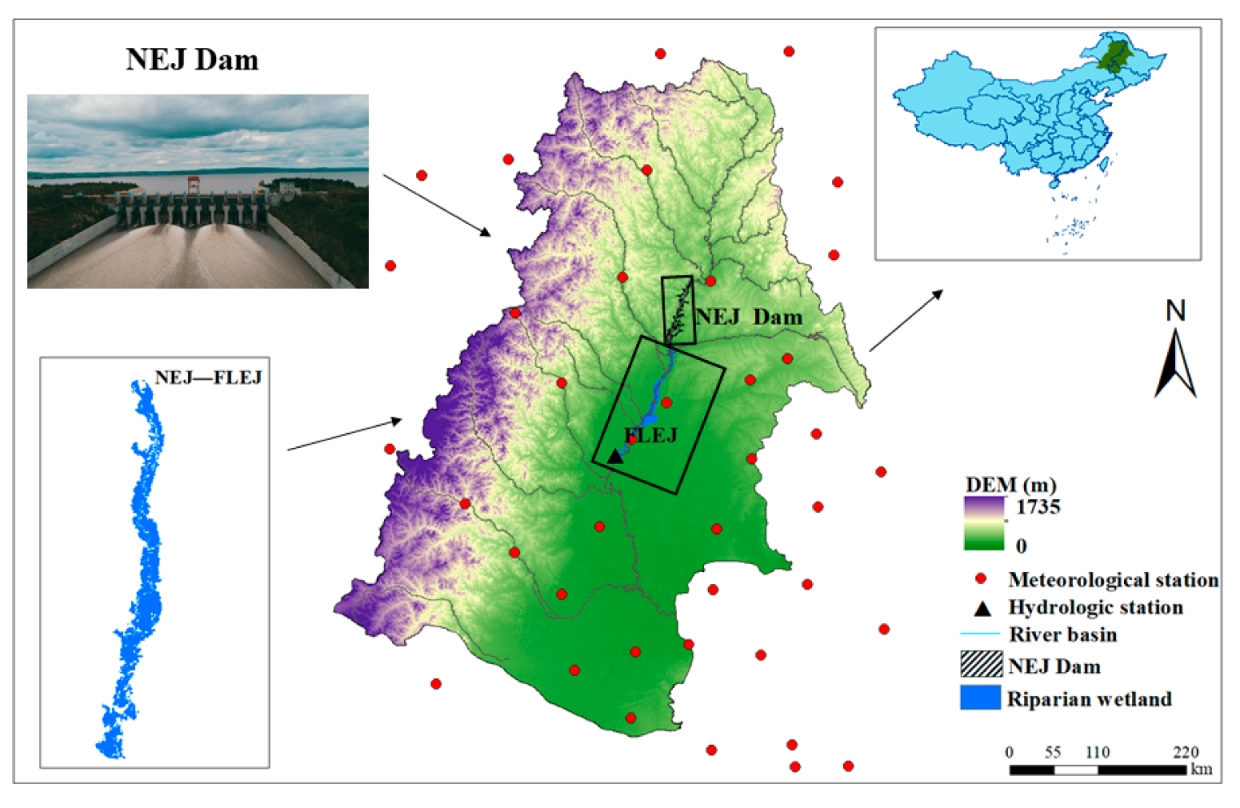
2. Study Area
3. Methods
3.1. Data Collection
3.2. Break Point Determination Time Series Division
3.3. Removal of Latent Impacts of Climate Change on Hydrological Process
3.4. Indicators and Range of Hydrologic Alteration
3.5. Quantifying Relationship of Riparian Wetland Change with Hydrologic Alteration
4. Results
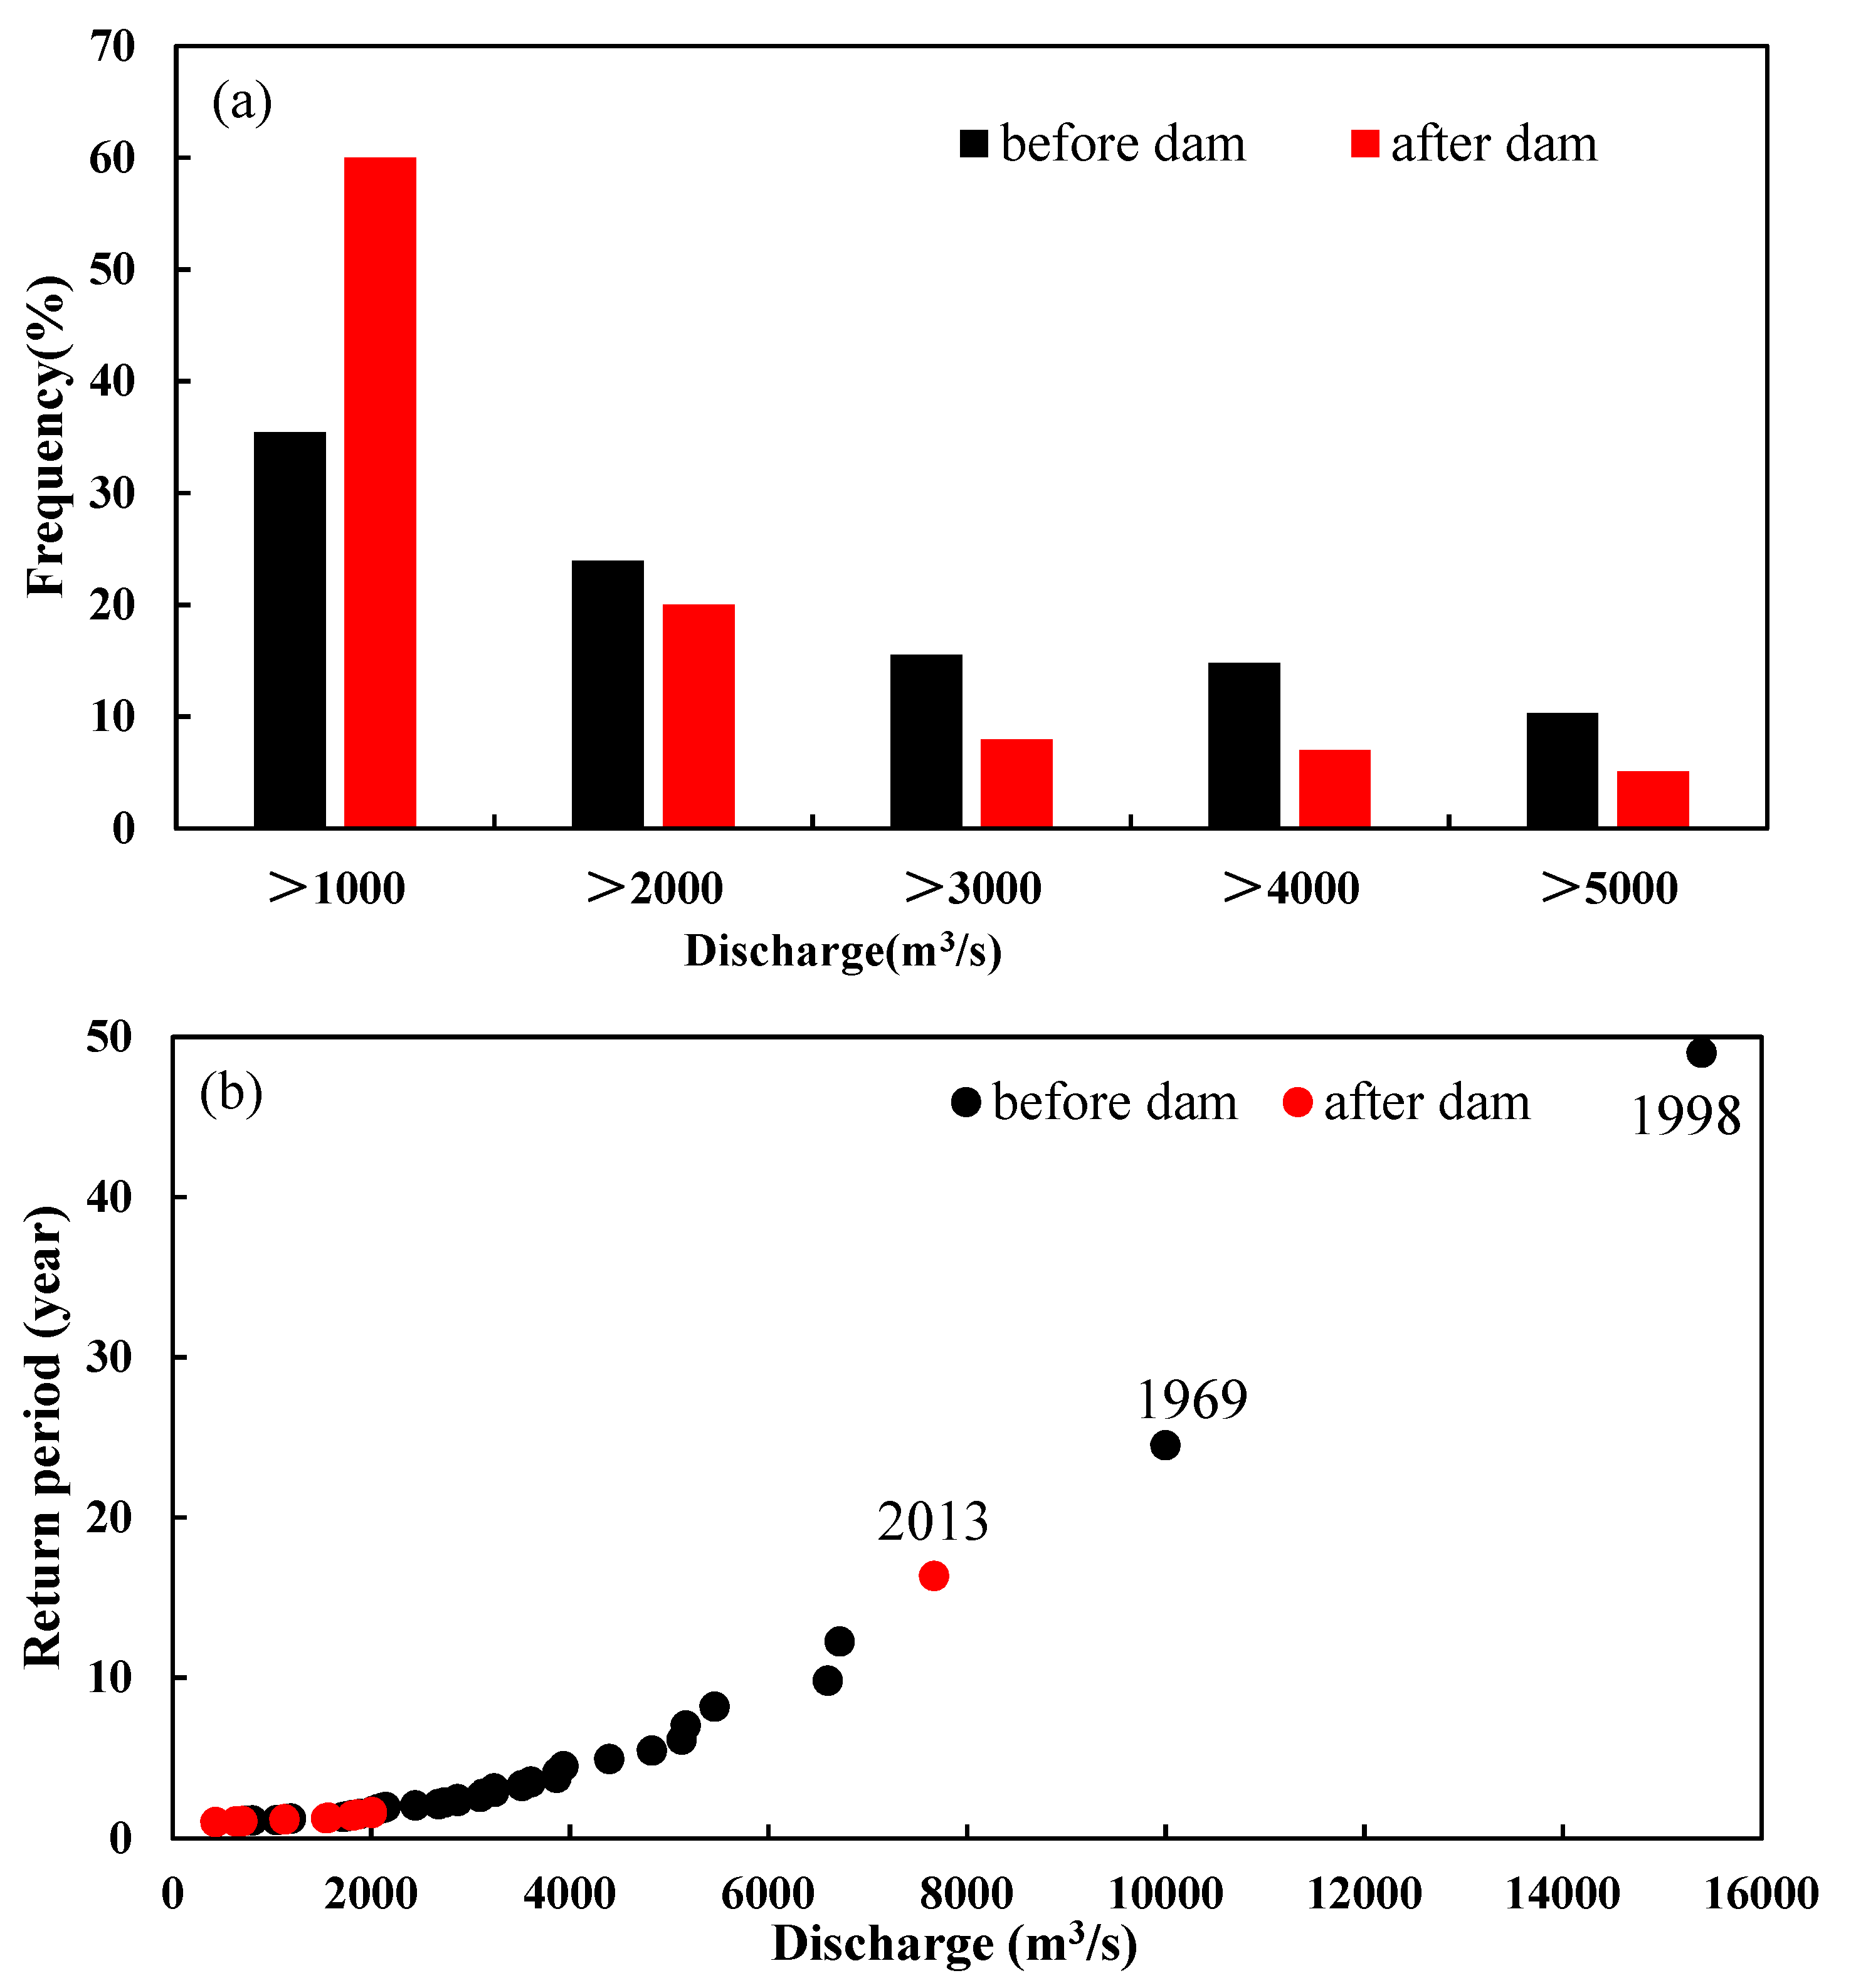
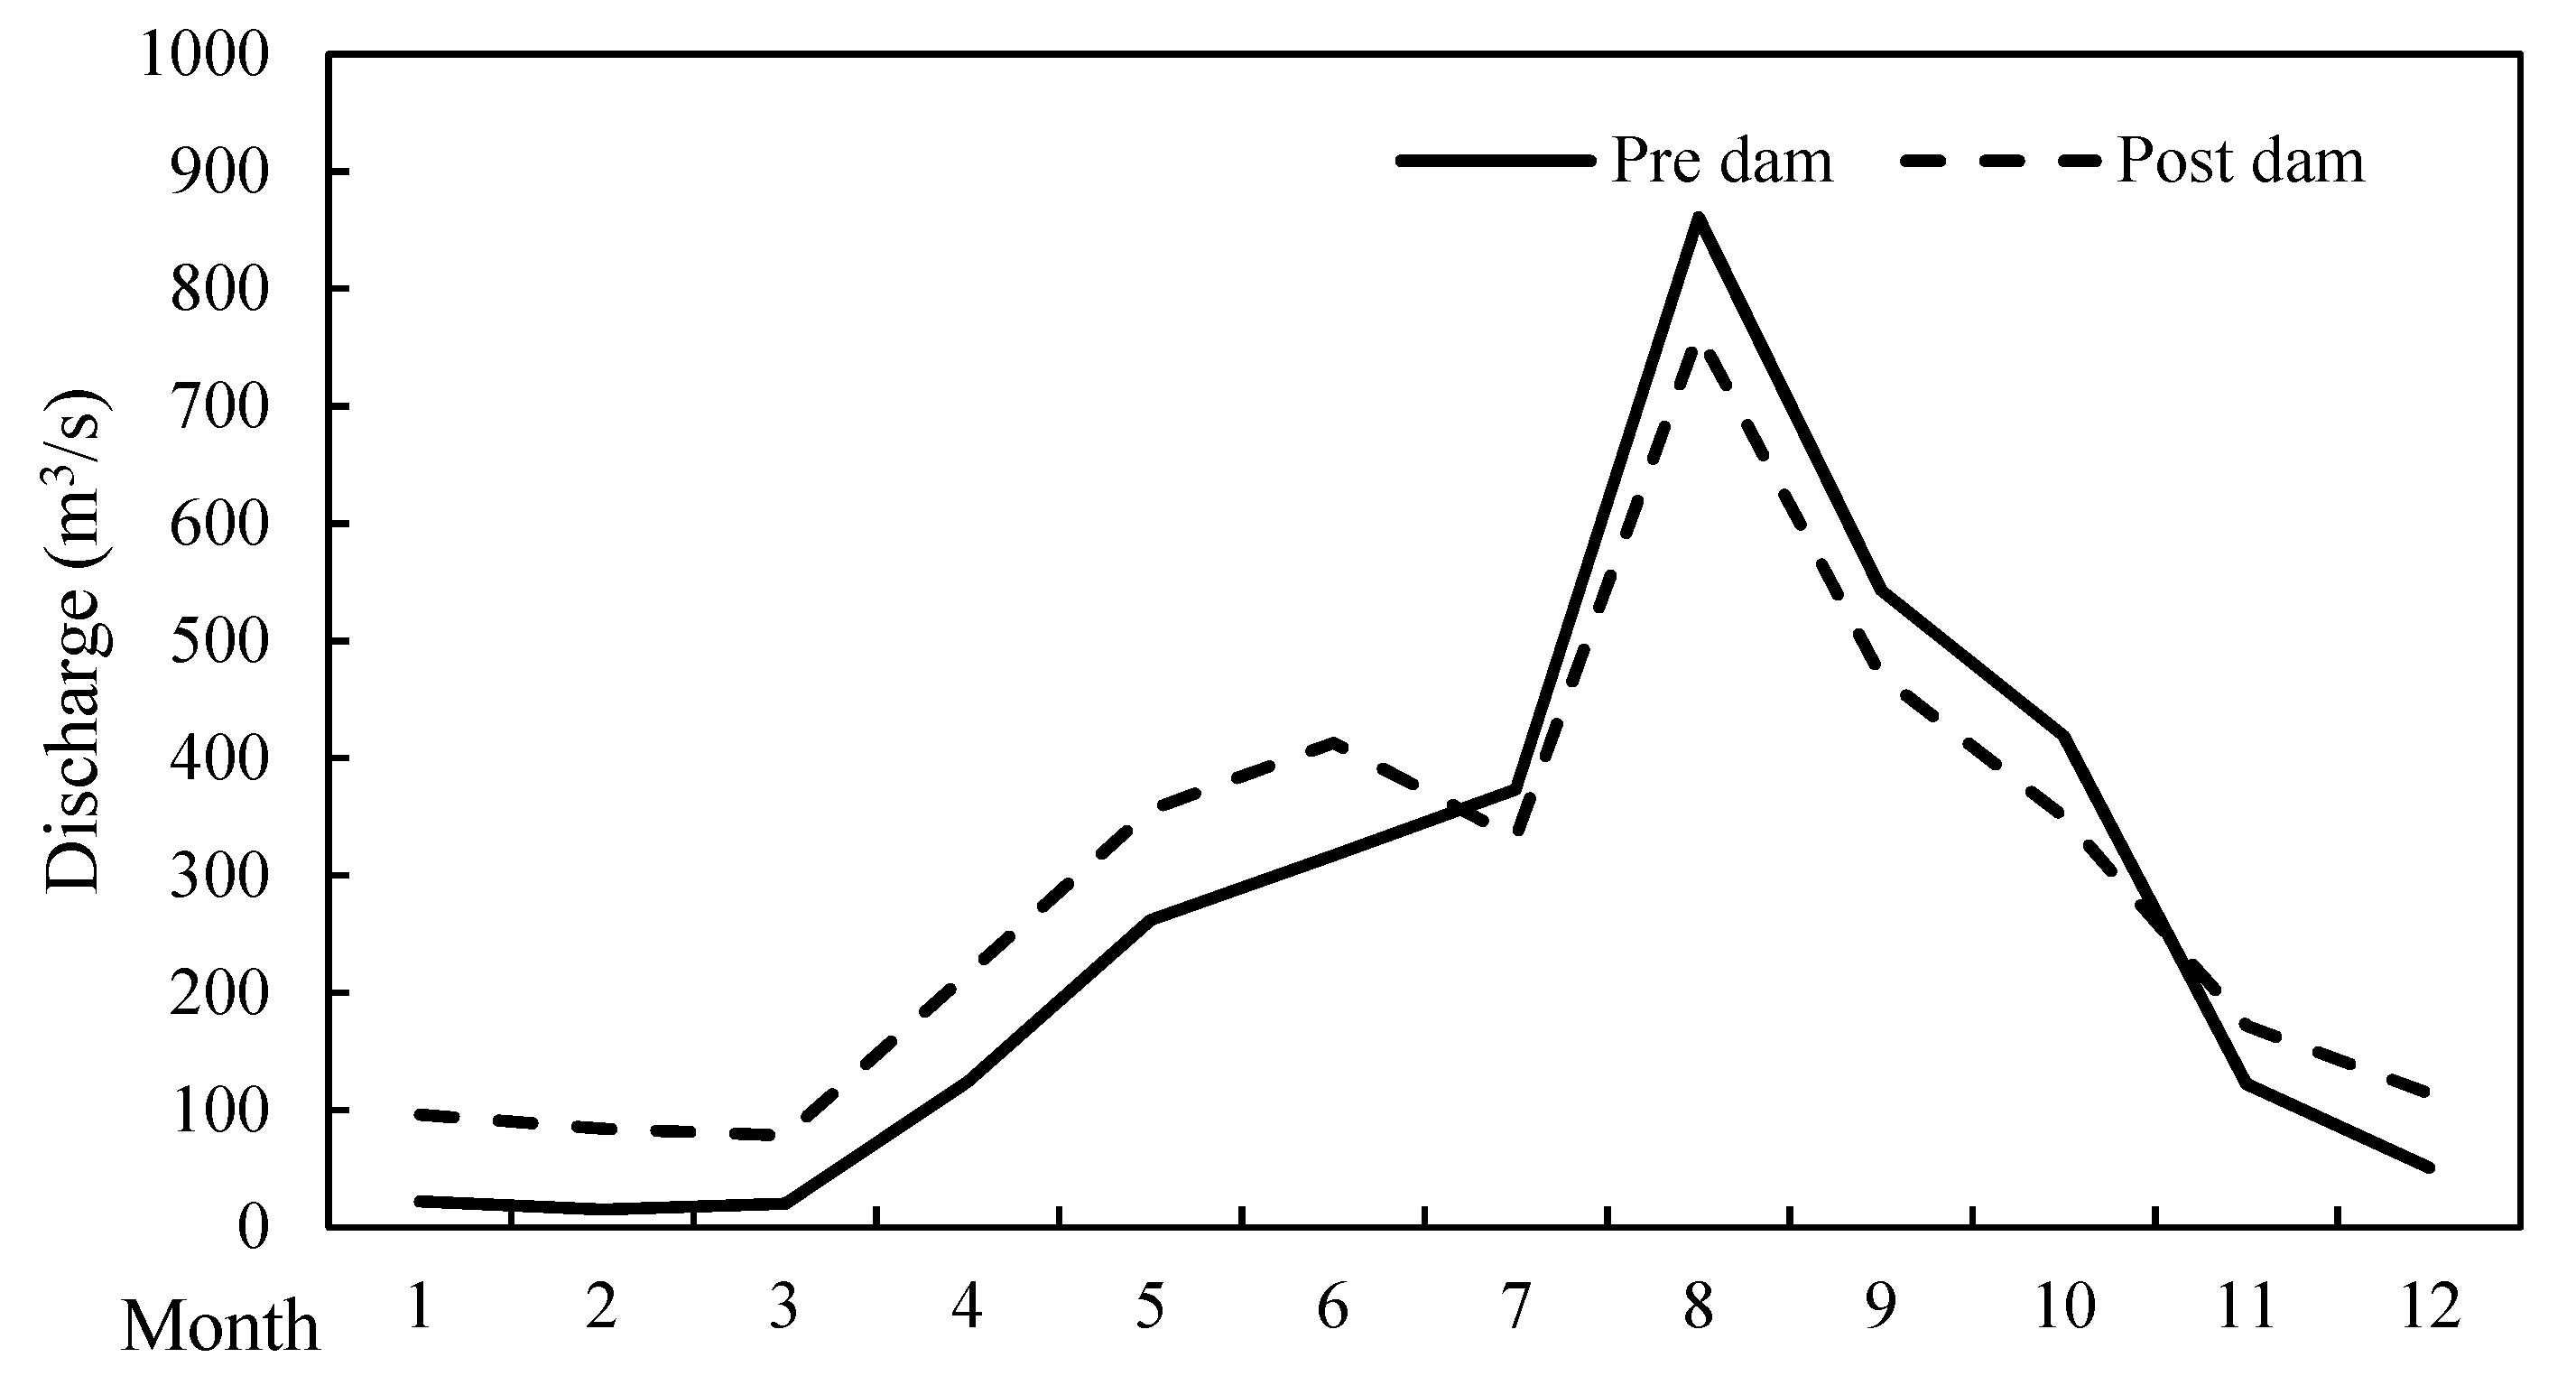
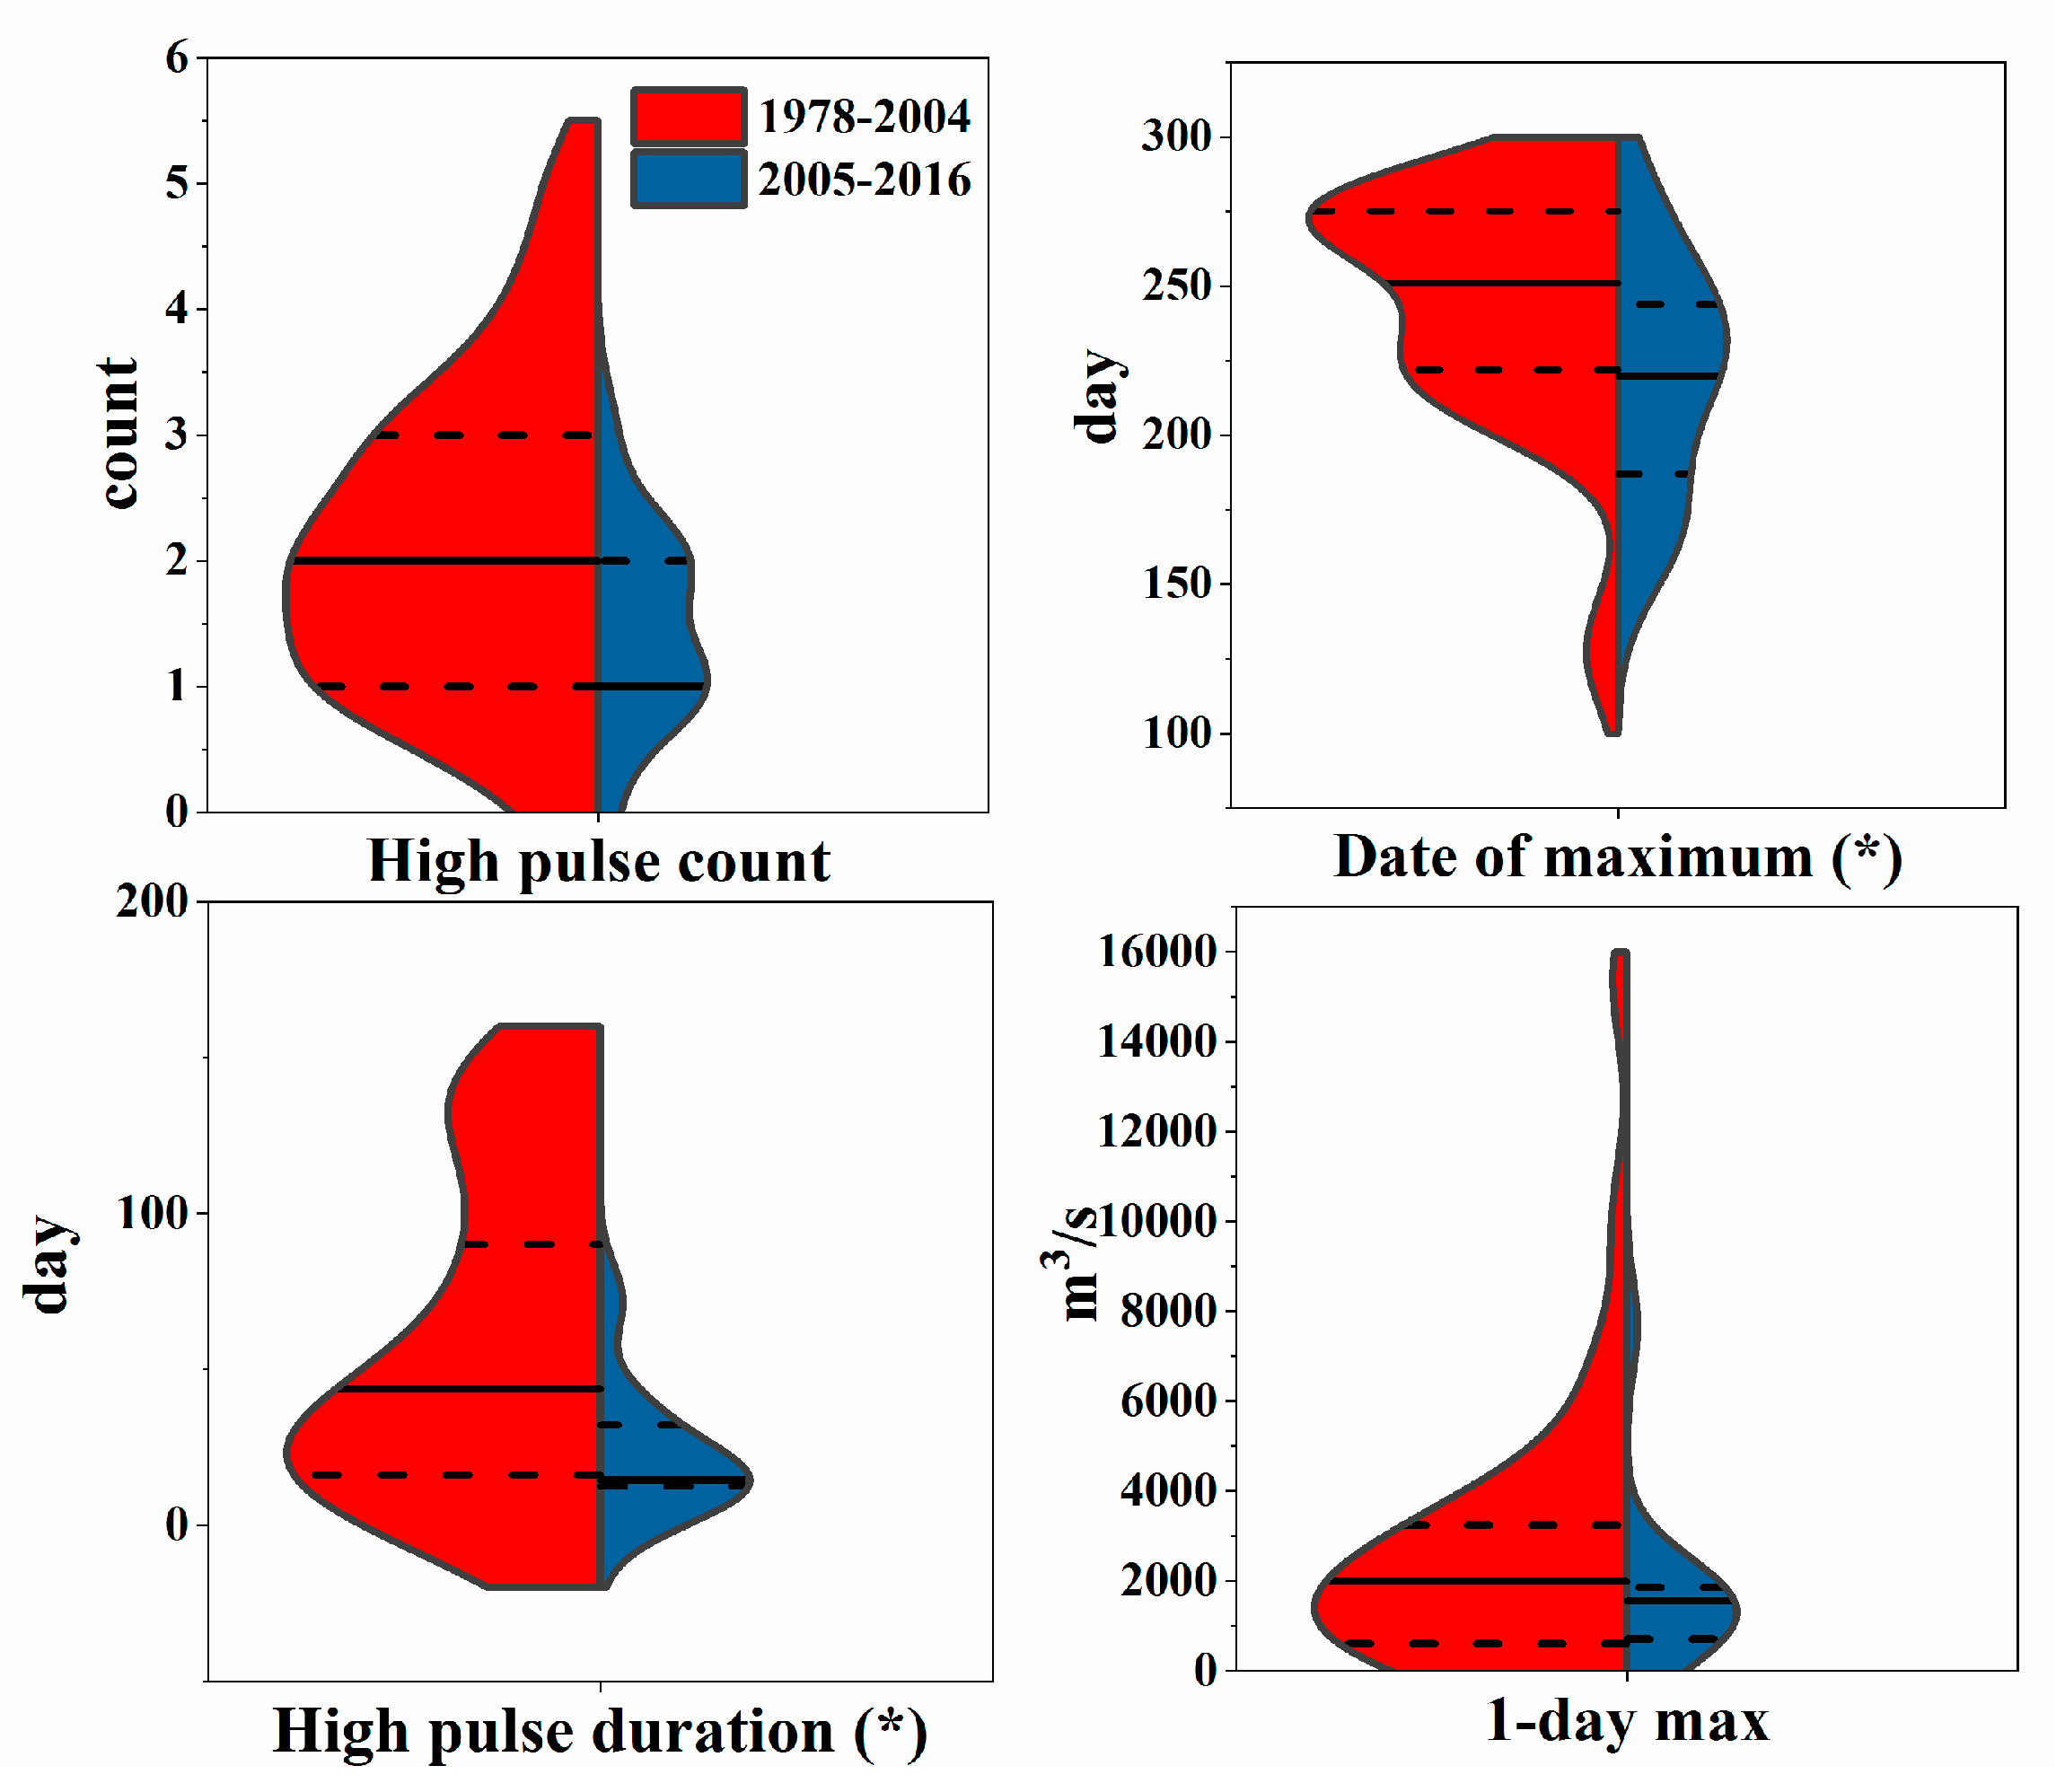
4.1. The Alteration of Hydrological Regime Downstream of the Dam
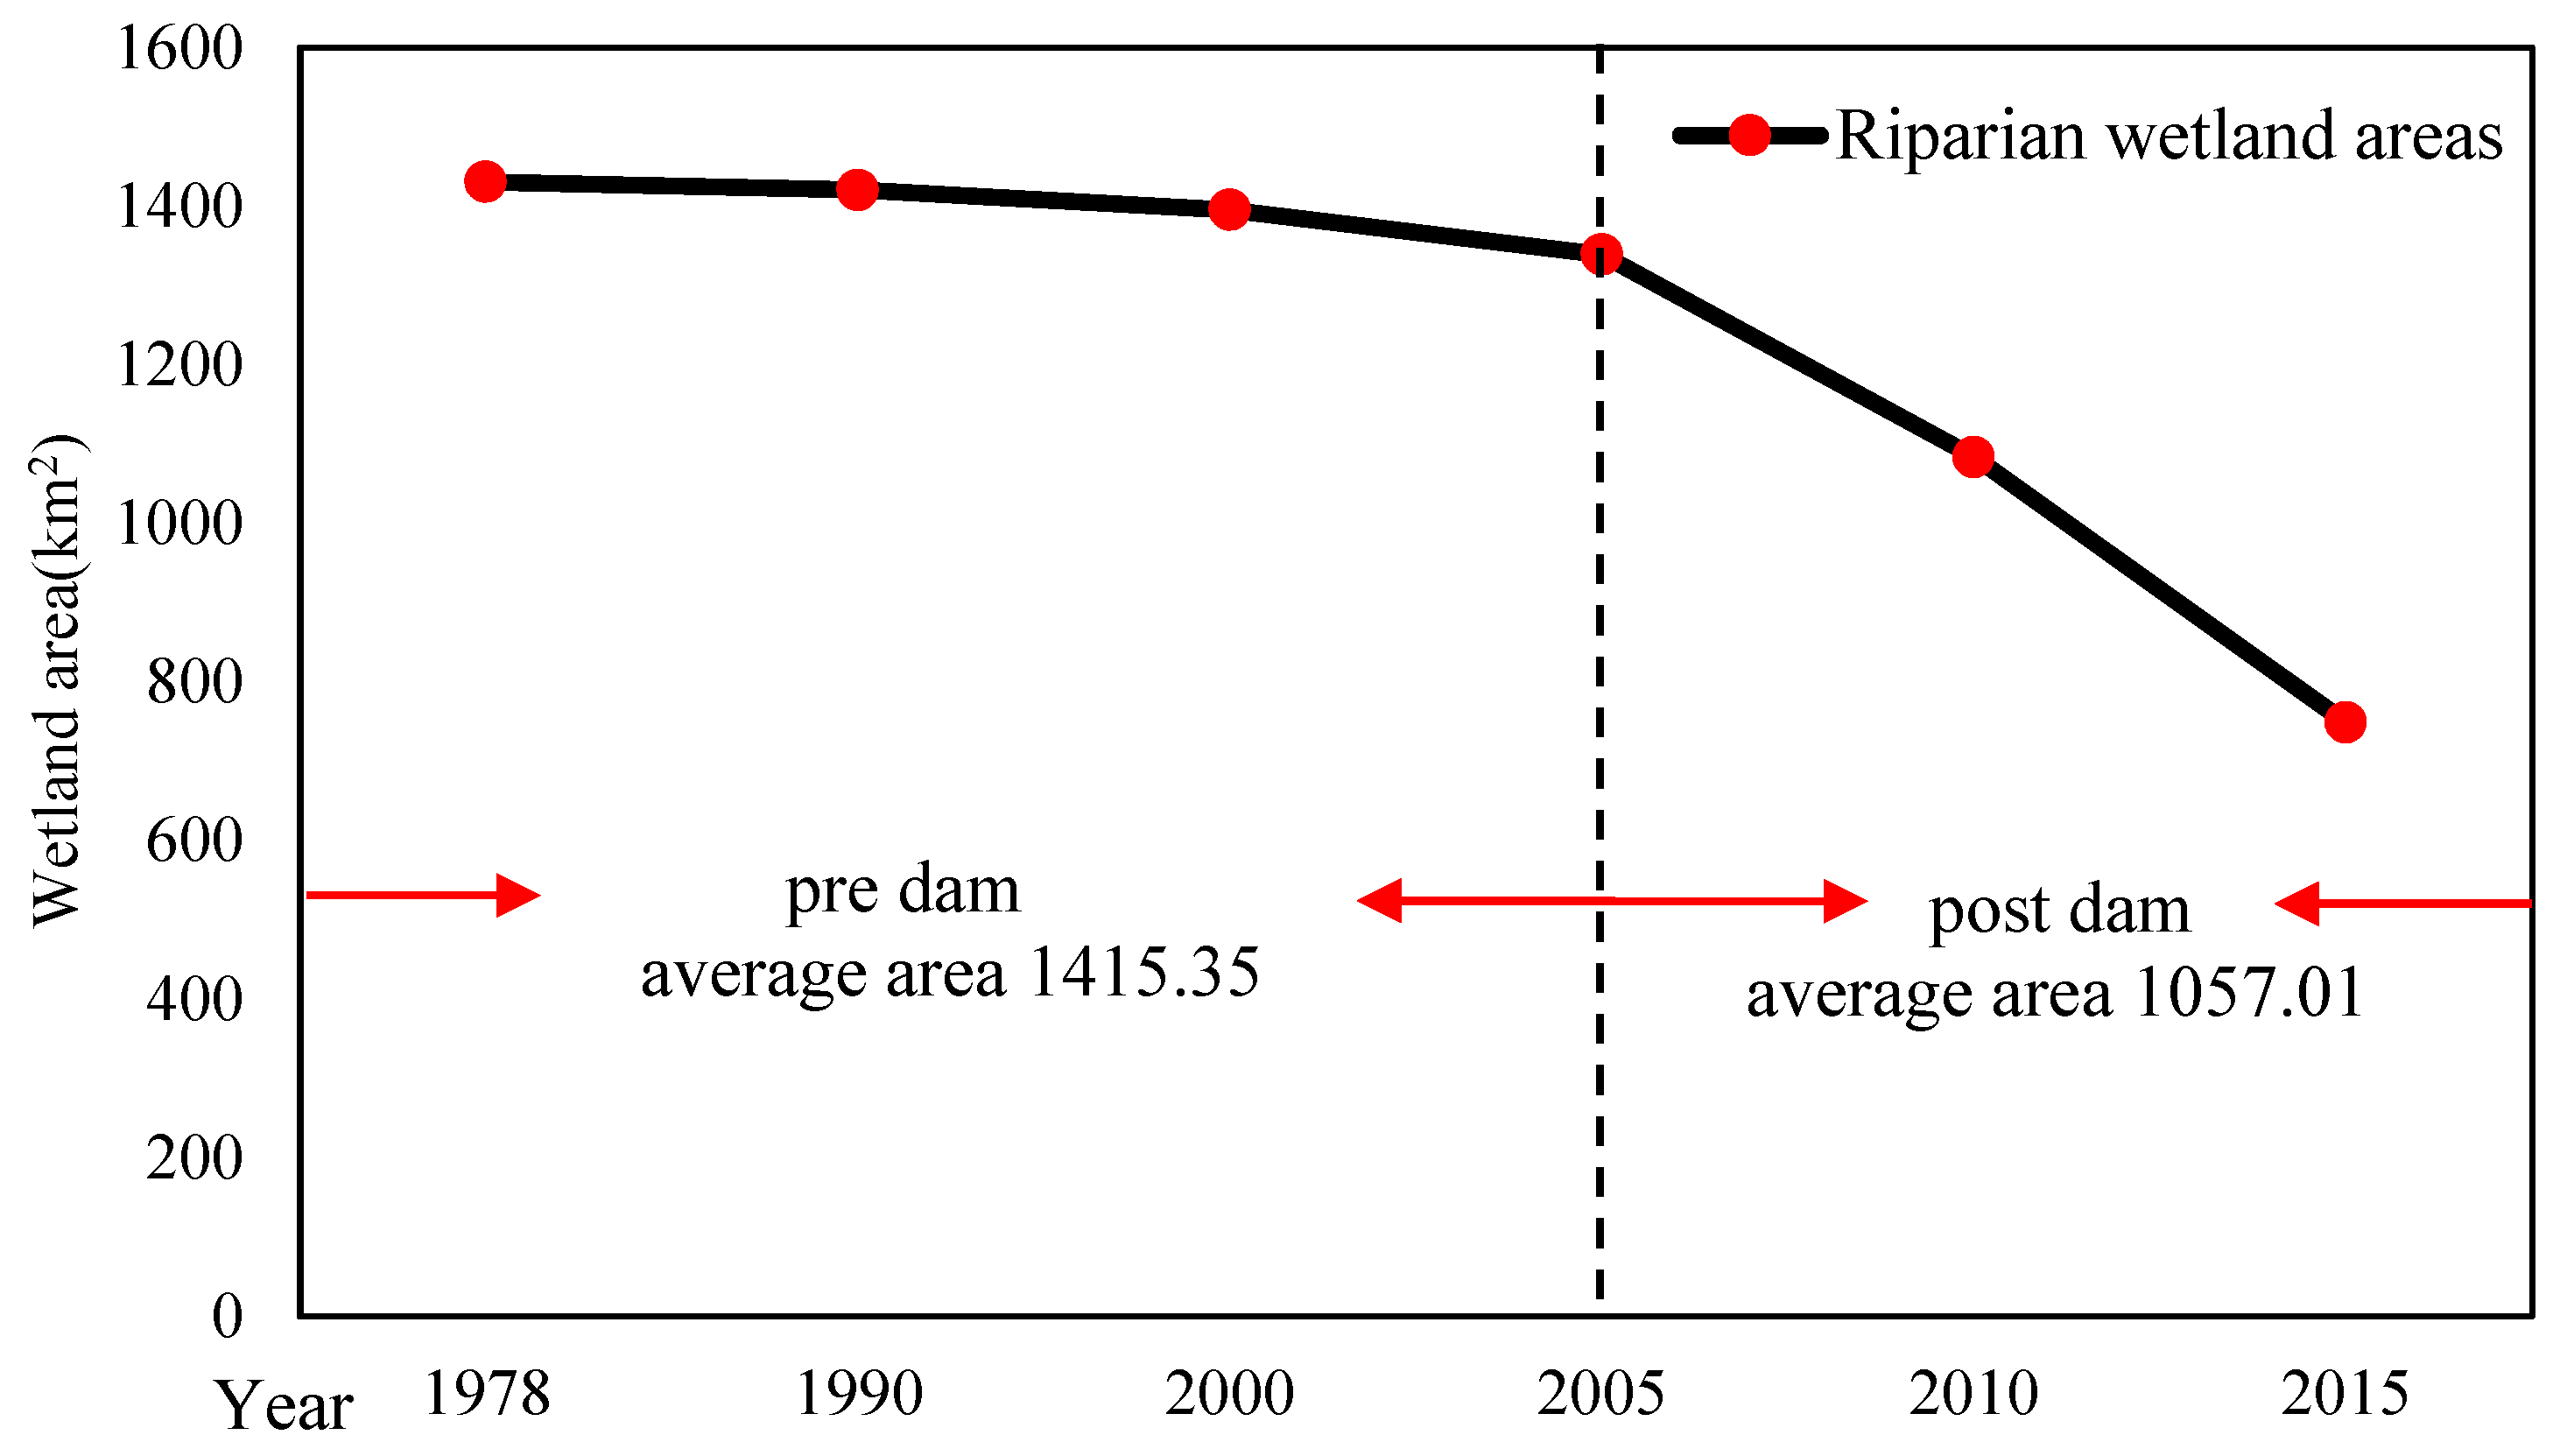
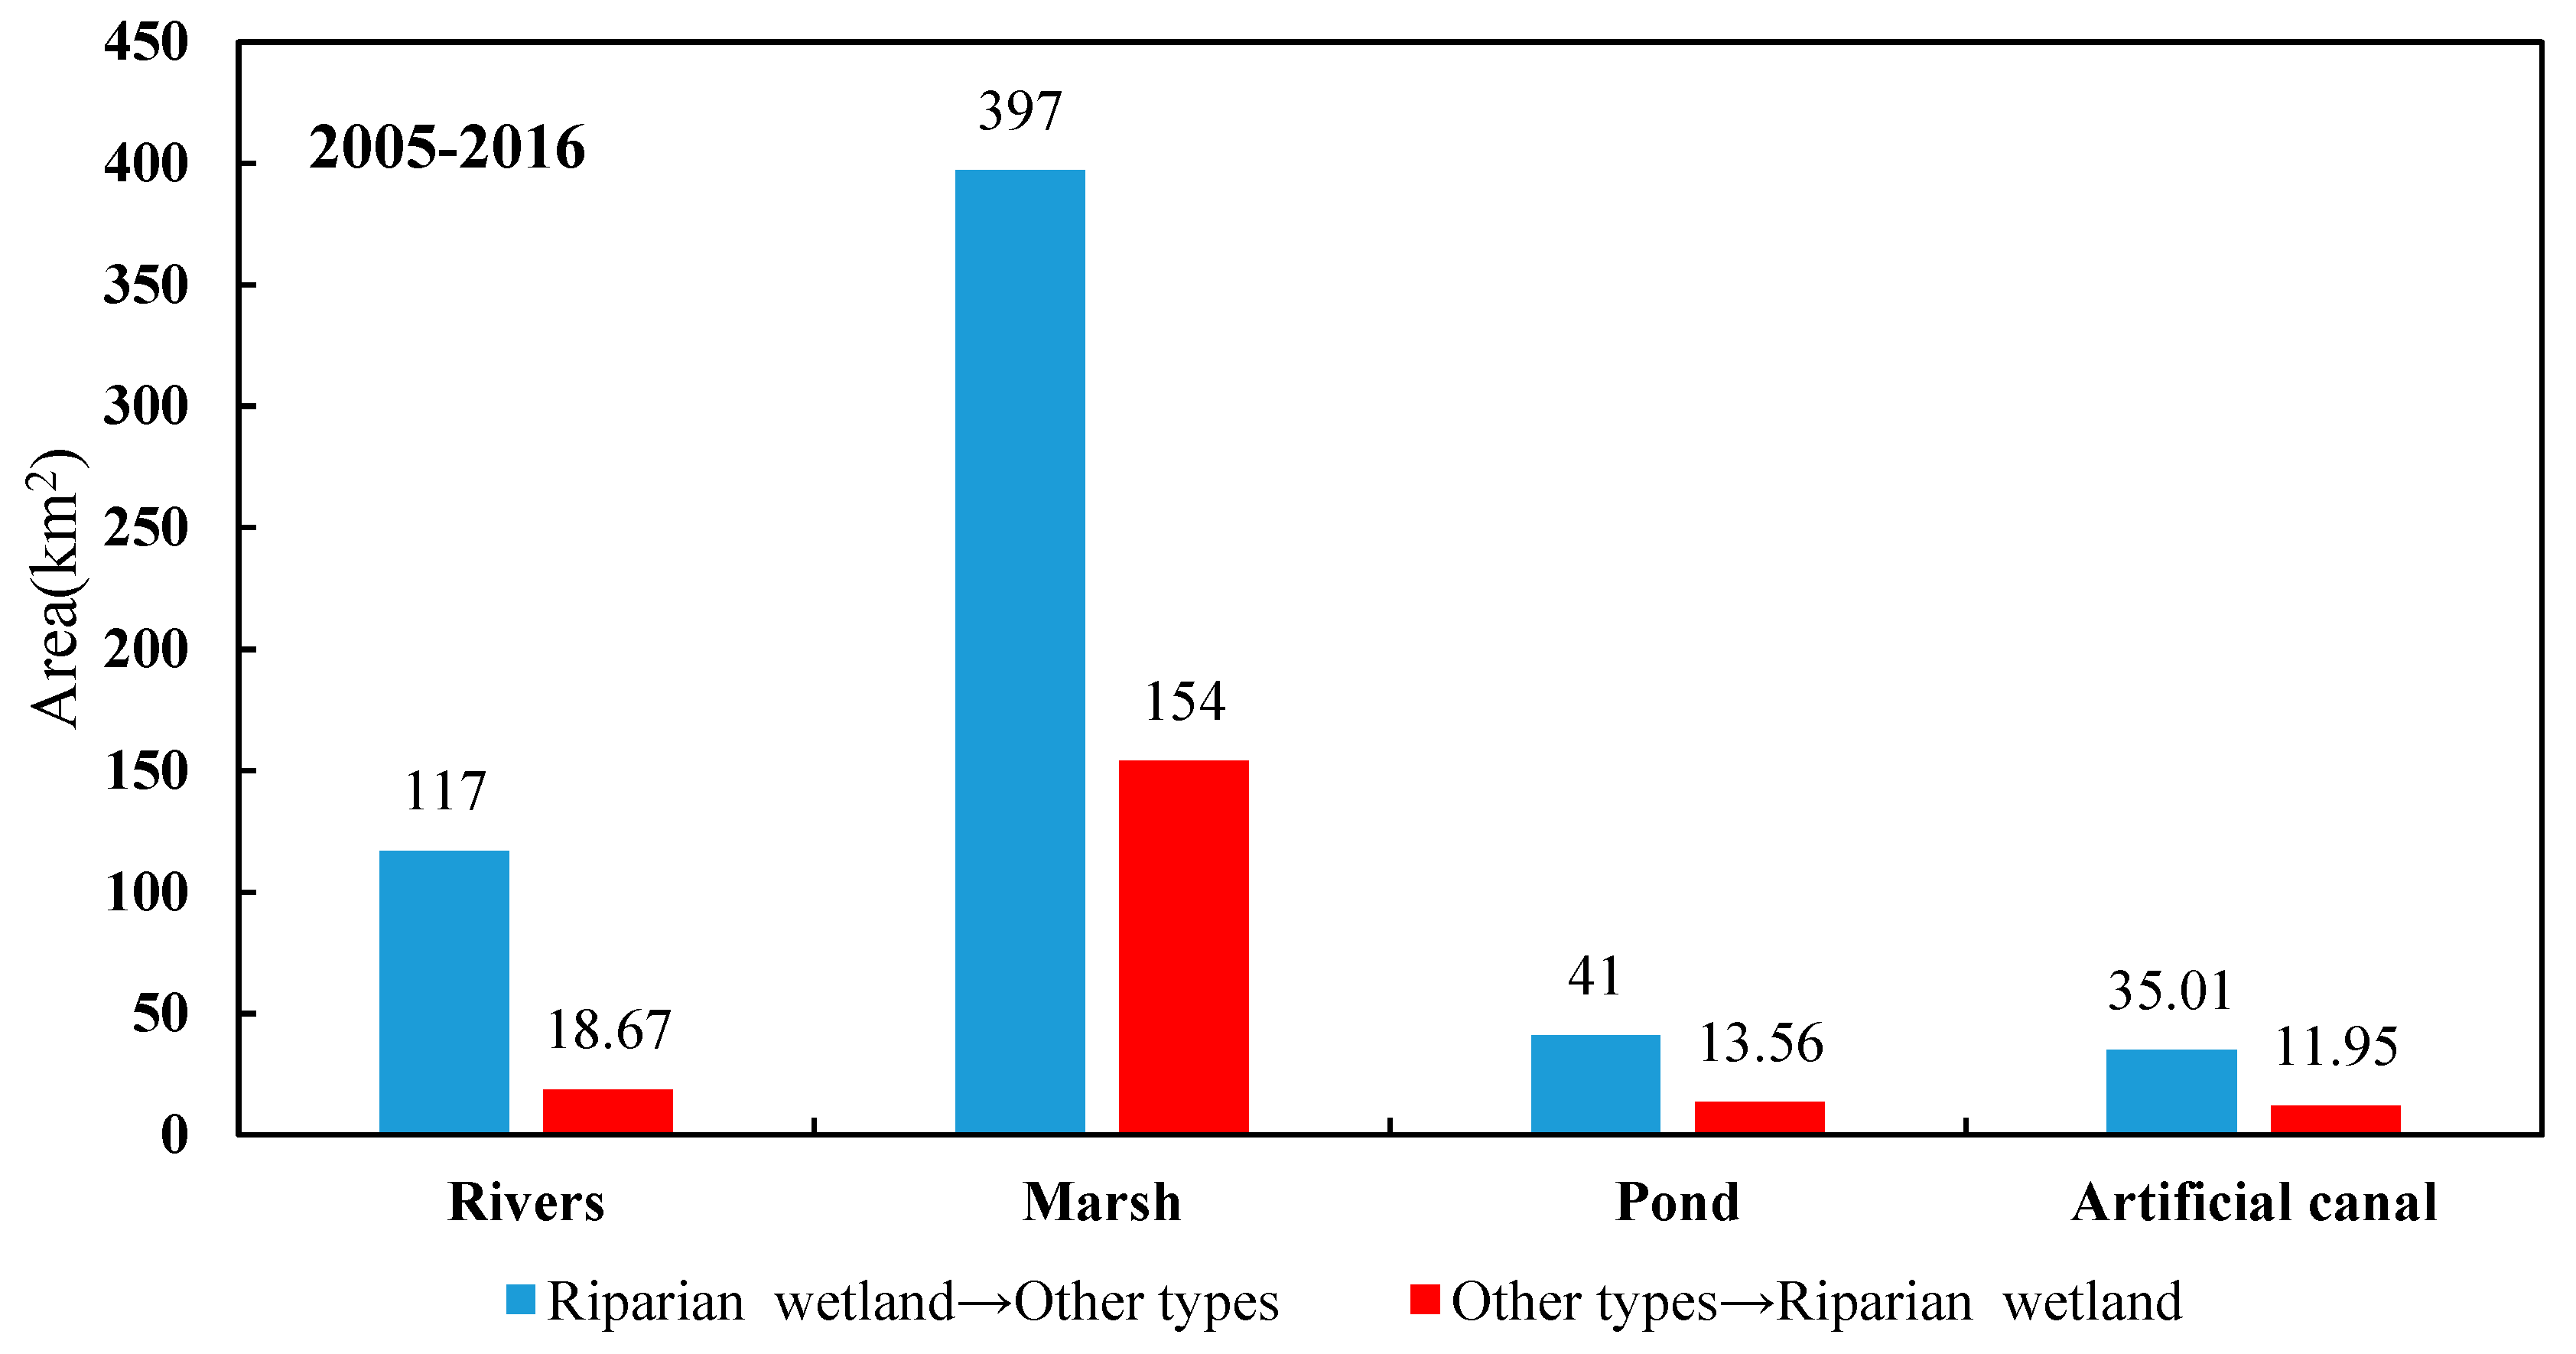
4.2. Riparian Wetland Loss after Dam Construction
4.3. Relation of Riparian Wetland Loss with Hydrological Indicators
+ 1.15× 1-day maximum + 7.08× date of maximum
5. Discussion
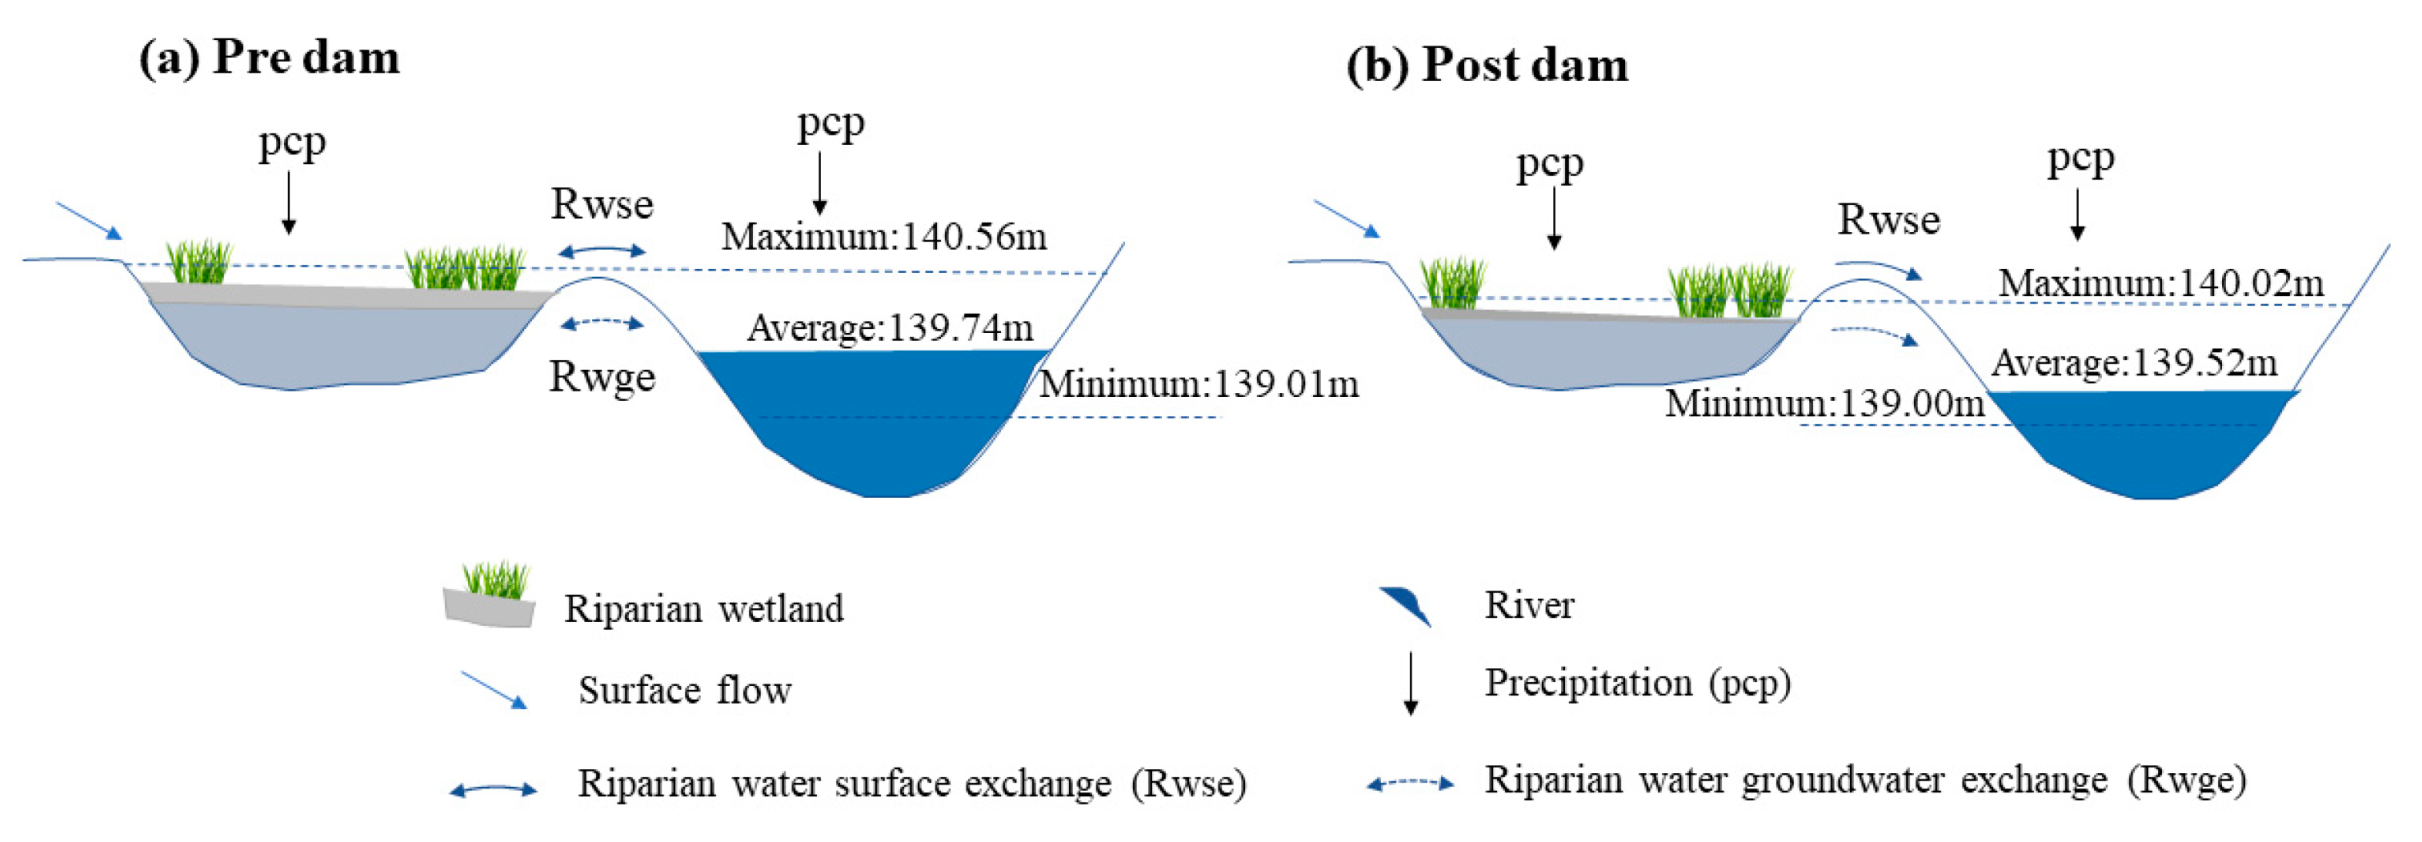
5.1. Hydrological Alterations Caused by Dam Construction
5.2. Spatiotemporal Dynamics of Riparian Wetlands Downstream of Dam
5.3. Major Hydrological Indicators Reflecting Downstream Riparian Wetland Loss
6. Conclusions
Author Contributions
Funding
Acknowledgments
Conflicts of Interest
References
- Graf, W.L. Dam nation: A geographic census of American dams and their large-scale hydrologic impacts. Water Resour. Res. 1999, 35, 1305–1311. [Google Scholar] [CrossRef]
- Graf, W.L. Downstream hydrologic and geomorphic effects of large dams on American rivers. Geomorphology 2006, 79, 336–360. [Google Scholar] [CrossRef]
- Magilligana, F.J.; Nislow, K.H. Changes in hydrologic regime by dams. Geomorphology 2005, 71, 61–78. [Google Scholar] [CrossRef]
- López-Moreno, J.I.; Vicente-Serrano, S.M.; Beguería, S.; García-Ruiz, J.M.; Portela, M.M.; Almeida, A.B. Dam effects on droughts magnitude and duration in a transboundary basin: The Lower River Tagus, Spain and Portugal. Water Resour. Res. 2009, 45. [Google Scholar] [CrossRef]
- Wang, D.; Zhang, S.H.; Wang, G.L.; Han, Q.Q.; Huang, G.X.; Wang, H.; Liu, Y.; Zhang, Y.P. Quantitative Assessment of the Influences of Three Gorges Dam on the Water Level of Poyang Lake, China. Water 2019, 11, 1519. [Google Scholar] [CrossRef]
- Naiman, R.J.; Décamps, H. The ecology of interfaces: The riparian zone. Annu. Rev. Ecol. Syst. 1997, 28, 621–658. [Google Scholar] [CrossRef]
- Magilligan, F.J.; Nislow, K.H. Long-term changes in regional hydrologic regime following impoundment in a humid-climate watershed. J. Am. Water Resour. Assoc. 2001, 37, 1551–1569. [Google Scholar] [CrossRef]
- Dudgeon, D.; Arthington, A.H.; Gessner, M.O.; Kawabata, Z.I.; Knowler, D.J.; Leveque, C.; Naiman, R.J.; Prieur-Richard, A.H.; Soto, D.; Stiassny, M.L.J.; et al. Freshwater biodiversity: Importance, threats, status and conservation challenges. Biol. Rev. 2006, 81, 163–182. [Google Scholar] [CrossRef] [PubMed]
- Dynesius, M.; Nilsson, C. Fragmentation and flow regulation of river systemsin the northern third of the world. Science 1994, 66, 753–762. [Google Scholar] [CrossRef] [PubMed]
- Junk, W.J.; Bayley, P.B.; Sparks, R.E. The flood pulse concept in river-floodplain systems. Can. Spec. Publ. Fish. Aquat. Sci. 1989, 106, 110–127. [Google Scholar]
- Morris, M.R.; Stanford, J.A. Floodplain succession and soil nitrogen accumulation on a salmon river in southwestern Kamchatka. Ecol. Monogr. 2011, 81, 43–61. [Google Scholar] [CrossRef][Green Version]
- Kunz, M.J.; Anselmetti, F.S.; Wuest, A.; Wehrli, B.; Vollenweider, A.; Thuringn, S.; Senn, D.B. Sediment accumulation and carbon, nitrogen, and phosphorus deposition in the large tropical reservoir Lake Kariba (Zambia/Zimbabwe). J. Geophys. Res. Biogeosci. 2011, 116. [Google Scholar] [CrossRef]
- Adair, E.C.; Binkley, D.; Andersen, D.C. Patterns of nitrogen accumulation and cycling in riparian floodplain ecosystems along the Green and Yampa rivers. Oecologia 2004, 139, 108–116. [Google Scholar] [CrossRef] [PubMed]
- Mallik, A.U.; Richardson, J.S. Riparian vegetation change in upstream and downstream reaches of three temperate rivers dammed for hydroelectric generation in British Columbia, Canada. Ecol. Eng. 2009, 35, 810–819. [Google Scholar] [CrossRef]
- Johnson, W.C. Adjustment of riparian vegetation to river regulation in the great plains, USA. Wetlands 1998, 18, 608–618. [Google Scholar] [CrossRef]
- Nilsson, C.; Kajsa, B. Alterations of riparian ecosystems caused by river regulation: Dam operations have caused global-scale ecological changes in riparian ecosystems. How to protect river environments and human needs of rivers remains one of the most important questions of our time. BioScience 2000, 50, 783–792. [Google Scholar]
- Bunn, S.E.; Arthington, A.H. Basic principles and ecological consequences of altered flow regimes for aquatic biodiversity. Environ. Manag. 2002, 30, 492–507. [Google Scholar] [CrossRef]
- Evenson, G.R.; Golden, H.E.; Lane, C.R. Depressional Wetlands Affect Watershed Hydrological, Biogeochemical, and Ecological Functions. Ecol. Appl. 2018, 28, 53–66. [Google Scholar] [CrossRef] [PubMed]
- Mei, X.; Van Gelder, P.H.A.J.M.; Dai, Z.; Tang, Z. Impact of dams on flood occurrence of selected rivers in the United States. Front. Earth Sci. 2017, 11, 268–282. [Google Scholar] [CrossRef]
- Bernal, B.; Mitsch, W.J. A comparison of soil carbon pools and profiles in wetlands in Costa Rica and Ohio. Ecol. Eng. 2008, 34, 311–323. [Google Scholar] [CrossRef]
- Hu, Y.; Wang, L.; Tang, Y.; Li, Y.; Chen, J.; Xi, X.; Sun, Y. Variability in soil microbial community and activity between coastal and riparian wetlands in the Yangtze River estuary—Potential impacts on carbon sequestration. Soil. Biol. Biochem. 2014, 70, 221–228. [Google Scholar] [CrossRef]
- Mitsch, W.J.; Gosselink, J.G. The value of wetlands: Importance of scale and landscape setting. Ecol. Econ. 2000, 35, 25–33. [Google Scholar] [CrossRef]
- Fossey, M.; Rousseau, A.N. Assessing the long-term hydrological services provided by wetlands under changing climate conditions: A case study approach of a Canadian watershed. J. Hydrol. 2016, 10, 1287–1302. [Google Scholar] [CrossRef]
- Zedler, J.B.; Kercher, S. Wetland resources: Status, trends, ecosystem services, and restorability. Annu. Rev. Environ. Resour. 2005, 30, 39–74. [Google Scholar] [CrossRef]
- Talukdar, S.; Pal, S. Impact of dam on inundation regime of flood plain wetland of punarbhaba river basin of barind tract of Indo-Bangladesh. Int. Soil Water Conserv. Res. 2017, 5, 109–121. [Google Scholar] [CrossRef]
- Mcmanamay, R.A. Quantifying and generalizing hydrologic responses to dam regulation using a statistical modeling approach. J. Hydrol. 2014, 519, 1278–1296. [Google Scholar] [CrossRef]
- Baker, D.W.; Bledsoe, B.P.; Albano, C.M.; Poff, N.L. Downstream effects of diversion dams on sediment and hydraulic conditions of Rocky Mountain streams. River Res. 2011, 27, 88–401. [Google Scholar] [CrossRef]
- Gao, Y.; Vogel, R.M.; Kroll, C.N.; Poff, N.L.; Olden, J.D. Development of representative indicators of hydrologic alteration. J. Hydrol. 2009, 374, 136–147. [Google Scholar] [CrossRef]
- Graf, W.L. Geomorphology and American dams: The scientific, social, and economic context. Geomorphology 2005, 71, 3–26. [Google Scholar] [CrossRef]
- Arthur, R.; Dana, M.; Kevin, E. Identifying indicators and quantifying large-scale effects of dams on fishes. Ecol. Indic. 2016, 61, 646–657. [Google Scholar]
- Pal, S.; Saha, T.K. Identifying dam-induced wetland changes using an inundation frequency approach: The case of the Atreyee River basin of Indo-Bangladesh. Ecohydrol. Hydrobiol. 2018, 18, 66–81. [Google Scholar] [CrossRef]
- Natoli, L.; Luci, G.; Mennillo, E.; Adeogun, A.O.; Arukwe, A. Assessing the effects of Awba dam sediment (Nigeria) on the steroidogenesis of H295R cells using different extraction methods. Sci. Total Environ. 2019, 650, 121–131. [Google Scholar] [CrossRef] [PubMed]
- Conkle, J.L.; Gan, J.; Anderson, M.A. Degradation and sorption of commonly detected PPCPs in wetland sediments under aerobic and anaerobic conditions. J. Soils Sediments 2012, 12, 1164–1173. [Google Scholar] [CrossRef]
- Zhang, X.; Cao, W.H.; Guo, Q.C. Effects of landuse change on surface runoff and sediment yield at different watershed scales on the Loess Plateau. Int. J. Sediment Res. 2010, 25, 283–293. [Google Scholar] [CrossRef]
- Li, S.N.; Wang, G.X.; Deng, W.; Hu, Y.M.; Hu, W.W. Influence of hydrology process on wetland landscape pattern: A case study in the Yellow River Delta. Ecol. Eng. 2009, 35, 1719–1726. [Google Scholar] [CrossRef]
- Sun, K.; Zhang, J.; Yong, H.; Liu, J. FPCANet: Fisher discrimination for Principal Component Analysis Network. Knowl. Based Syst. 2019, 166, 108–117. [Google Scholar] [CrossRef]
- Yang, Y.; Zhang, M.; Zhu, L.; Liu, W.; Han, J.; Yang, Y. Influence of large reservoir operation on water-levels and flows in reaches below dam: Case study of the Three Gorges Reservoir. Sci. Rep. 2017, 7, 15640. [Google Scholar] [CrossRef] [PubMed]
- Gao, F.; Li, H.; Jiang, X.H. Water use law of the main irrigational areas in the Yellow River. J. Irrig. Drain. 2004, 23, 21–24. [Google Scholar]
- Meng, B.; Liu, J.L.; Bao, K.; Sun, B. Water fluxes of Nenjiang River Basin with ecological network analysis: Conflict and coordination between agricultural development and wetland restoration. J. Clean. Prod. 2019, 213, 933–943. [Google Scholar] [CrossRef]
- Wei, G.; Tych, W.; Beven, K.; He, B.; Ning, F.; Zhou, H. Nierji reservoir flood forecasting based on a Data-Based Mechanistic methodology. J. Hydrol. 2018, 567, 227–237. [Google Scholar] [CrossRef]
- Xing, L.; Niu, Z.; Xu, P.; Li, D. Wetlands classification and assessment of Ramsar sites in China based on time series Moderate Resolution Imaging Spectroradiometer (MODIS) imagery. Mar. Freshw. Res. 2018, 69, 658–668. [Google Scholar] [CrossRef]
- Niu, Z.G.; Zhang, H.Y.; Wang, X.W.; Yao, W.B.; Zhou, D.M.; Zhao, K.Y.; Yang, J. Changes of wetland types in China from 1978 to 2008. Chin. Sci. Bull. 2012, 57, 1400–1411. [Google Scholar] [CrossRef]
- Dixon, M.J.R.; Loh, J.; Davidson, N.C.; Beltrame, C.; Freeman, R.; Walpole, M. Tracking global change in ecosystem area: The Wetland Extent Trends index. Biol. Conserv. 2016, 193, 27–35. [Google Scholar] [CrossRef]
- Hamed, K.H.; Rao, A.R. A Modified Mann-Kendall Trend Test for Autocorrelated Data. J. Hydrol. 1998, 204, 182–196. [Google Scholar] [CrossRef]
- Yang, T.; Zhang, Q.; Chen, Y.Q.D.; Tao, X.; Xu, C.Y.; Chen, X. A spatial assessment of hydrologic alteration caused by dam construction in the middle and lower Yellow River, China. Hydrol. Process. 2008, 22, 3829–3843. [Google Scholar] [CrossRef]
- Chen, Y.Q.D.; Yang, T.; Xu, C.Y.; Zhang, Q.; Chen, X.; Hao, Z.C. Hydrologic alteration along the Middle and Upper East River (Dongjiang) basin, South China: A visually enhanced mining on the results of RVA method. Stoch. Environ. Res. Risk. A 2010, 24, 9–18. [Google Scholar] [CrossRef]
- Zhao, Q.; Liu, S.; Deng, L.; Dong, S.; Yang, Z.; Yang, J. Landscape change and hydrologic alteration associated with dam construction. Int. J. Appl. Earth. Obs. 2012, 16, 17–26. [Google Scholar] [CrossRef]
- Richter, B.; Baumgartner, J.; Wigington, R.; Braun, D. How much water does a river need. Freshw. Biol. 1997, 37, 231–249. [Google Scholar] [CrossRef]
- Richter, B.D.; Baumgartner, J.V.; Braun, D.P.; Powell, J. A spatial assessment of hydrologic alteration within a river network. Regul. Rivers Res. Manag. Int. J. Devoted River Res. Manag. 1998, 14, 329–340. [Google Scholar] [CrossRef]
- Richter, B.D.; Baumgartner, J.V.; Powell, J.; Braun, D.P. A method for assessing hydrologic alteration within ecosystems. Conserv. Biol. 1996, 10, 1163–1174. [Google Scholar] [CrossRef]
- Maingi, J.K.; Marsh, S.E. Quantifying hydrologic impacts following dam construction along the Tana River, Kenya. J. Arid. Environ. 2002, 50, 53–79. [Google Scholar] [CrossRef]
- Arabzadeh, R.; Kholoosim, M.; Bazrafshan, J. Regional hydrological drought monitoring using principal components analysis. J. Irrig. Drain. 2016, 142, 1943–4774. [Google Scholar] [CrossRef]
- Olsen, R.L.; Chappell, R.W.; Loftis, J.C. Water quality sample collection, data treatment and results presentation for principal components analysis--literature review and Illinois River Watershed case study. Water Res. 2012, 46, 3110–3122. [Google Scholar] [CrossRef] [PubMed]
- Matteau, M.; Assani, A.A.; Mesfioui, M. Application of multivariate statistical analysis methods to the dam hydrologic impact studies. J. Hydrol. 2009, 371, 120–128. [Google Scholar] [CrossRef]
- Zhang, Z.Y.; Huang, Y.L.; Huang, J.L. Hydrologic alteration associated with dam construction in a medium-sized coastal watershed of southeast China. Water 2016, 8, 317. [Google Scholar] [CrossRef]
- Swades, P. Impact of Water Diversion on Hydrological Regime of Atreyee River of Indo-Bangladesh. Int. J. River Basin Manag. 2016, 14, 1–42. [Google Scholar]
- Pal, S.; Talukdar, S. Application of frequency ratio and logistic regression models for assessing physical wetland vulnerability in Punarbhaba river basin of Indo-Bangladesh. Hum. Ecol. Risk Assess. Int. J. 2018, 24, 1–21. [Google Scholar] [CrossRef]
- Karim, F.; Kinsey-Henderson, A.; Wallace, J.; Arthington, A.H.; Pearson, R.G. Modelling wetland connectivity during overbank flooding in a tropical floodplain in north Queensland, Australia. Hydrol. Process. 2012, 26, 2710–2723. [Google Scholar] [CrossRef]
- Keesstra, S.D. Impact of natural reforestation on floodplain sedimentation in the Dragonja basin, SW Slovenia. Earth Surf. Process. Landf. 2007, 32, 49–65. [Google Scholar] [CrossRef]
- Zhang, Z.; Huang, Y.; Xu, C.Y.; Chen, X.; Moss, E.M.; Jin, Q.; Bailey, A.M. Analysis of Poyang Lake water balance and its indication of river–lake interaction. SpringerPlus. 2016, 5, 1555. [Google Scholar] [CrossRef]
- Keesstra, S.D.; Huissteden, J.V.; Vandenberghe, J. Evolution of the morphology of the river Dragonja (SW Slovenia) due to land-use changes. Geomorphology 2005, 69, 191–207. [Google Scholar] [CrossRef]
- Ablat, X. Application of Landsat derived indices and hydrological alteration matrices to quantify the response of floodplain wetlands to river hydrology in arid regions based on different dam operation strategies. Sci. Total Environ. 2019, 232, 1–44. [Google Scholar] [CrossRef]
- Boulton, A.J.; Rolls, R.J.; Jaeger, K.L. Chapter 2.3—Hydrological Connectivity in Intermittent Rivers and Ephemeral Streams. In Intermittent Rivers and Ephemeral Streams; Academic Press: Cambridge, MA, USA, 2017; pp. 79–108. [Google Scholar]
- Capon, S.J. Flood variability and spatial variation in plant community composition and structure on a large arid floodplain. J. Arid Environ. 2005, 60, 283–302. [Google Scholar] [CrossRef]


| Parameter Group | Regime Features | Hydrologic Parameters |
|---|---|---|
| 1. Magnitude of monthly median discharge | Magnitude, timing | Median discharge for each calendar month |
| 2. Magnitude of annual extreme flows | Magnitude, duration | Annual minimum 1-day medians |
| Annual minimum 3-day medians | ||
| Annual minimum 7-day medians | ||
| Annual minimum 30-day medians | ||
| Annual minimum 90-day medians | ||
| Annual maximum 1-day medians | ||
| Annual maximum 3-day medians | ||
| Annual maximum 7-day medians | ||
| Annual maximum 30-day medians | ||
| Annual maximum 90-day medians | ||
| Number of zero-flow days | ||
| Base flow (7-day minimum discharge divided by median discharge for year) | ||
| 3. Duration of annual extreme flows | Timing | Julian date of each annual one-day maximum discharge |
| Julian date of each annual one-day minimum discharge | ||
| 4. Frequency and duration of the high and low pulses | Magnitude, frequency | Number of high pulses for each year |
| Number of low pulses for each year | ||
| Medians duration of high pulses for each year | ||
| Medians duration of low pulses for each year | ||
| 5. Rate of change and frequency | Frequency, rate of change | Number of rises |
| Number of falls | ||
| Number of flow reversals |
| River Stage Records Type | Season | River Stage Records(m) | Gap | % of Gap | CV in % | ||
|---|---|---|---|---|---|---|---|
| Before Dam Construction | After Dam Construction | Before Dam Construction | After Dam Construction | ||||
| Average | Pre monsoon | 139.74 | 139.52 | 0.22 | 0.16 | 0.39 | 0.22 |
| Post monsoon | 139.58 | 139.11 | 0.47 (*) | 0.34 | 0.31 | 0.44 | |
| Maximum | Pre monsoon | 140.56 | 140.02 | 0.54 | 0.38 | 0.77 | 0.32 |
| Post monsoon | 140.45 | 140.02 | 0.43 (*) | 0.31 | 0.59 | 0.37 | |
| Minimum | Pre monsoon | 139.01 | 139.00 | 0.01 | 0.01 | 0.21 | 0.20 |
| Post monsoon | 139.00 | 137.95 | 1.05 | 0.76 | 0.28 | 1.46 | |
| Indicators | Pre-Impact Period | Post-Impact Period | Hydrologic Alteration | ||
|---|---|---|---|---|---|
| Monthly Median Discharge | Median (m3·s−1) | Coeff. of Dispersion | Median (m3·s−1) | Coeff. of Dispersion | (%) |
| January | 22 | 6.46 | 96 | 0.62 | 87 (H) |
| February | 15 | 10.51 | 84 | 0.82 | 87 (H) |
| March | 20 | 9.11 | 78 | 0.81 | 87 (H) |
| April | 124 | 1.53 | 216 | 1.18 | 34 (L) |
| May | 262 | 1.12 | 356 | 1.31 | 24 (L) |
| June | 317 | 0.99 | 413 | 2.09 | 48 (M) |
| July | 373 | 1.40 | 332 | 1.29 | 73 (M) |
| August | 861 | 2.04 | 762 | 1.25 | 73 (M) |
| September | 543 | 1.15 | 470 | 1.66 | 97 (H) |
| October | 419 | 0.78 | 350 | 1.09 | 73 (M) |
| November | 122 | 1.05 | 172 | 1.19 | 34 (L) |
| December | 51 | 2.49 | 114 | 0.75 | 60 (M) |
| Magnitude of annual extreme flows (m3∙s−1) | |||||
| 1-day minimum | 13 | 8.15 | 60 | 0.86 | 75 (H) |
| 3-day minimum | 13 | 8.12 | 66 | 0.82 | 87 (H) |
| 7-day minimum | 13 | 8.10 | 71 | 0.75 | 87 (H) |
| 30-day minimum | 14 | 7.69 | 76 | 0.78 | 87 (H) |
| 90-day minimum | 21 | 6.63 | 86 | 0.73 | 87 (H) |
| 1-day maximum | 2245 | 1.41 | 1570 | 0.80 | 87 (H) |
| 3-day maximum | 2142 | 1.40 | 1557 | 0.83 | 87 (H) |
| 7-day maximum | 1977 | 1.38 | 1517 | 0.83 | 87 (H) |
| 30-day maximum | 1531 | 1.43 | 1222 | 0.79 | 87 (H) |
| 90-day maximum | 945 | 1.10 | 788.2 | 0.92 | 75 (H) |
| Number of zero days | 0 | 0 | 0 | 0 | 0 |
| Base flow index | 0.02 | 13.75 | 0.18 | 0.91 | 73(L) |
| Duration of annual extreme flows | |||||
| Date of minimum | 58 | 0.39 | 41 | 0.10 | 75 (H) |
| Date of maximum | 234 | 0.15 | 220 | 0.17 | 87 (H) |
| Frequency and duration of the high and low pulses | |||||
| Low pulse count | 3 | 1 | 1 | 0 | 100 (H) |
| Low pulse duration | 16 | 0.21 | 2 | 8.18 | 100 (H) |
| High pulse count | 4 | 2.00 | 1 | 1.50 | 100 (H) |
| High pulse duration | 55 | 1.70 | 7 | 1.50 | 100 (H) |
| Rate of change and frequency of flow | |||||
| Rise rate | 12 | 1.54 | 7 | 1.63 | 6 (L) |
| Fall rate | −8 | −1.79 | −8 | −1.08 | 57 (M) |
| Number of reversals | 29 | 1.41 | 72 | 0.29 | 100 (H) |
© 2019 by the authors. Licensee MDPI, Basel, Switzerland. This article is an open access article distributed under the terms and conditions of the Creative Commons Attribution (CC BY) license (http://creativecommons.org/licenses/by/4.0/).
Share and Cite
Zheng, Y.; Zhang, G.; Wu, Y.; Xu, Y.J.; Dai, C. Dam Effects on Downstream Riparian Wetlands: The Nenjiang River, Northeast China. Water 2019, 11, 2038. https://doi.org/10.3390/w11102038
Zheng Y, Zhang G, Wu Y, Xu YJ, Dai C. Dam Effects on Downstream Riparian Wetlands: The Nenjiang River, Northeast China. Water. 2019; 11(10):2038. https://doi.org/10.3390/w11102038
Chicago/Turabian StyleZheng, Yuexin, Guangxin Zhang, Yanfeng Wu, Y. Jun Xu, and Changlei Dai. 2019. "Dam Effects on Downstream Riparian Wetlands: The Nenjiang River, Northeast China" Water 11, no. 10: 2038. https://doi.org/10.3390/w11102038
APA StyleZheng, Y., Zhang, G., Wu, Y., Xu, Y. J., & Dai, C. (2019). Dam Effects on Downstream Riparian Wetlands: The Nenjiang River, Northeast China. Water, 11(10), 2038. https://doi.org/10.3390/w11102038