Article

Cold Waves in Poznań (Poland) and Thermal Conditions in the City during Selected Cold Waves

Department of Climatology, Adam Mickiewicz University in Poznań, B. Krygowskiego 10, 61–680 Poznań, Poland
*
Author to whom correspondence should be addressed.
Atmosphere 2018, 9(6), 208; https://doi.org/10.3390/atmos9060208
Submission received: 27 April 2018 / Revised: 24 May 2018 / Accepted: 25 May 2018 / Published: 28 May 2018
(This article belongs to the Special Issue Impacts of Climate Change on Human Health)

Abstract

:
The objective of the paper was to characterize the occurrence of cold days and cold waves in Poznań in the years 1966/67–2015/16, as well as to characterize thermal conditions in the city during selected cold waves in the years 2008/09–2015/16. The study was based on daily data on maximum and minimum air temperature for station Poznań-Ławica from the years 1966/67–2015/16 and daily air temperature values from eight measurement points located in the territory of the city in different types of land use from the years 2008/08–2015/16. In addition, to characterize thermal conditions during selected days forming cold waves, satellite images were used, on the basis of which the land surface temperature (LST) was calculated. A cold day was defined as a day with daily maximum temperature (Tmax) below the value of 5th annual percentile of Tmax, and a cold wave was defined as at least five consecutive cold days. The study showed an increase in Tmax in winter, which translated to a decrease in the number of cold days over the last 50 years, although the changes were not statistically significant. Thermal conditions in the city showed high variability in the winter season and during the analyzed cold waves.

1. Introduction

The currently observed climate warming is unquestionable and evident among others through an increase in mean global air temperature [1]. The result is a decrease in the number of cold days and cold waves, although the changes are not as intensive as in the case of an increase in the frequency of hot days in the summer period. Current research conducted in Poland also points to a decrease in the number of cold days [2,3,4], although more evident changes are observed in the case of frequency of occurrence of days with strong frosts [5,6]. Despite the observed changes, during numerous winter seasons, several-day periods with very low air temperature have been recorded in Poland in recent years, for example in January 2016 and 2017 and February 2018 [7,8,9].
The meteorological conditions of the city and suburban areas are considerably different because of transformation of the environment. Due to a small contribution of natural plant surfaces, numerous vertical surfaces, as well as human activity, substantial amounts of heat are accumulated within the city during the day. They are then released to the atmosphere causing their slower cooling than in the surrounding areas [10]. Therefore, air temperature in the city is usually higher than in suburban areas.
In recent years, teledetection data have been applied in research on thermal conditions in urban areas increasingly frequently. An example of such research can be the analysis of relations between surface temperature and air temperature in the central part of Japan [11]. Voogt and Oke [12] emphasized that the urban heat island observed from thermal remote sensing data is the surface urban heat island (SUHI). Analyses of the urban heat island based on teledetection data have been conducted among others in Brno [13], Kraków [14], Madrid [15], and Poznań [16]. Moreover, satellite teledetection data are increasingly frequently used for the analysis of lake surface temperature [17,18] and dates of the beginning of the vegetative season [19].
The study of the temperature field in urban areas at a resolution of 30 × 30 m allows distinguishing part of the city exposed to very high [20] and low values of air temperature. These thermal conditions are the cause of thermal stress both in the summer and winter seasons. In this study, the obtained maps allow to compare the different types of land cover according to Urban Atlas in terms of their thermal conditions. This paper constitutes a continuation of research on thermal conditions in the city during extreme air temperatures [20]. In the context of forecasts of the UN [21] showing an increase in the number of population living in cities, it is desirable to thoroughly investigate thermal conditions in the city both in the case of high and low temperatures. Taking this into consideration, the objective of the paper is:
  • characteristics of occurrence of cold days and cold waves in Poznań in the years 1966/67–2015/16;
  • characteristics of occurrence of cold days and cold waves in the city in the years 2008/09–2015/16;
  • analysis of thermal conditions in the city during selected days of cold waves based on satellite images.

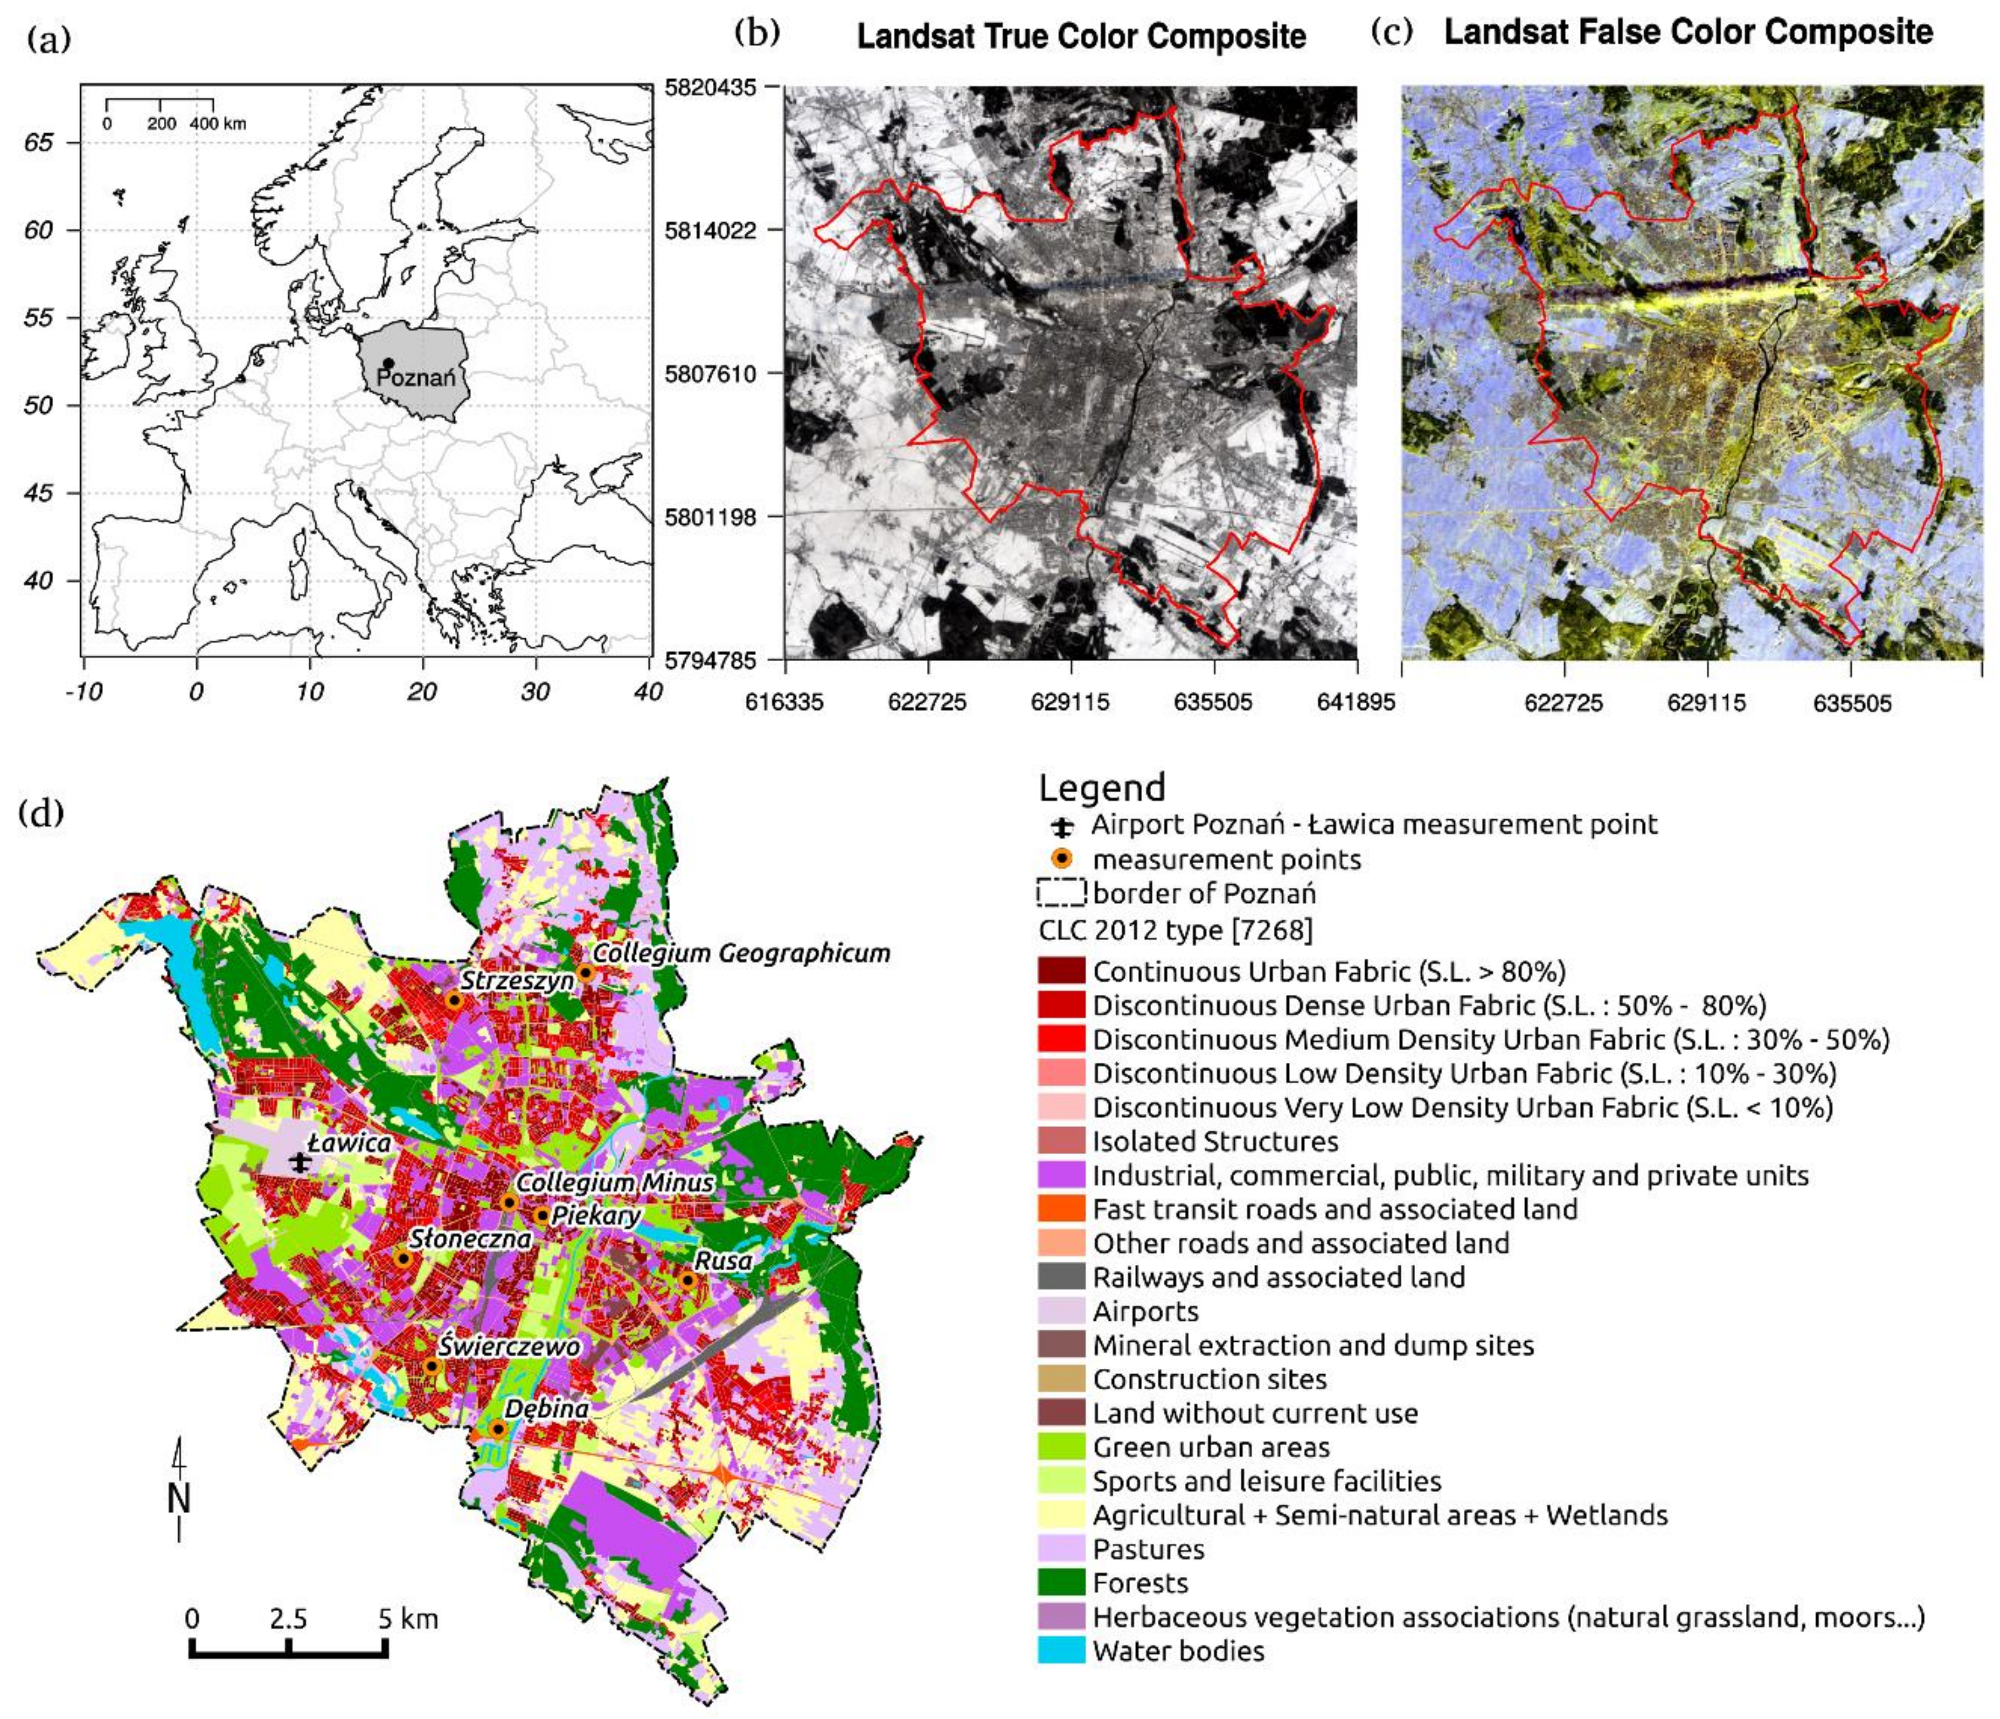
2. Research Area, Data and Methods

The study area is the city of Poznań. It is the largest city in the Wielkopolskie Voivodship, inhabited by 545.7 thousand people. In terms of the size of population, Poznań is the fifth city in Poland, and eighth in terms of surface area. The city is in three physiographic mesoregions, namely: Poznańskie Lakeland, Wrzesińska Plain, and Poznański Warta River Gorge. The three areas are parts of the Wielkopolskie Lakeland [22,23].
The paper is based on two sets of data concerning air temperature. The first set covered daily maximum (Tmax) and minimum (Tmin) air temperature values for the station in Poznań (Poznań-Ławica) from the multi-annual period 1966–2016 provided by the Institute of Meteorology and Water Management–National Research Institute. The second data set includes daily air temperature values from the years 2008–2016 for eight measurement points located in Poznań in different types of land use (Table 1, Figure 1). The data were obtained from the resources of the Department of Climatology of the University of Adam Mickiewicz in Poznań. At the one of the measurement points, namely Collegium Geographicum, season 2008/2009 was excluded from the analysis due to the lack of a complete sequence of data.
The first data set provided the basis for the calculation of mean Tmax for particular winter seasons (December–February). Cold days and cold waves were also identified. Then, for the aforementioned characteristics, the direction of changes and statistical significance of such changes was determined. This involved the application of a non-parametric Mann-Kendall test, detecting a trend in time series. The strength of tendencies of characteristics was determined based on the non-parametric Sen’s method [24]. Next, based on threshold values from station Poznań-Ławica, cold days were designated at all measurement points in the years 2008/09–2015/16.
A cold day was defined as a day with maximum daily air temperature below 5th annual percentile of Tmax (from 1966–2015), and a cold wave as a continuous sequence of at least five such days.
For detailed determination of thermal conditions in the city, land surface temperature (LST) was calculated with the application of two satellite images registered during days included in a cold wave. The analysis of satellite images is intended to illustrate the differentiation of thermal conditions of the city at a resolution of 30 × 30 m. The used images were registered by satellite LANDSAT-5 TM on 9 February 2010 and 21 February 2011 at 9:34 UTC. A sample of a thermal image showing the study area in shades of grey is presented in Figure 1b (darker pixels refer to colder objects and brighter ones to warmer objects). Figure 1c is much easier to interpret by the human eye. It can be obtained by mixing three infrared bands in RGB composite (Red = 6 band, Green = 5 band, Blue = 4 band). In this image, the interpretation is easier and more intuitive because warmer objects are in yellow, the coldest in dark grey, blue, and violet. Figure 1c clearly shows the trail of smoke and its shadow covering some of the pixels that were masked before any calculations.
The calculation of basic LST statistics for each type of land use required applying a layer with information on the range of each of the types on the LST raster map for the purpose of reading the LST value for overlapping pixels. Due to this, the Urban Atlas [25] vector layer was rasterized to a raster layer with a size of a pixel corresponding to a surface of 10 × 10 m in the field. Moreover, due to the presence of a smoke streak and the shadow of the streak coming out of the chimney of the heat and power plant Karolin right outside the eastern boundary of Poznań, some of the pixels were masked before performing the calculations.
A detailed description of the performed calculations and used methods and tools was presented in a paper concerning thermal conditions in the city during selected heat waves [20].
The last stage of work involved the determination of weather conditions based on weather forecast from Daily Meteorological Bulletin of the Institute of Meteorology and Water management—National Research Institute. The presented weather maps were obtained from websites of Met Office.

3. Results

3.1. Tmax in the Winter Season in the Years 1966/67–2015/16 (Poznań-Ławica)

The average Tmax in winter (December-February) in the years 1966/67-2015/16 in Poznań amounted to 2.3 °C. The lowest average Tmax was recorded in the season 1969/70. It amounted to −2.8 °C (Figure 2). Equally cold seasons occurred in the years 1984/85, 1995/96, 1978/79, 1986/87, as well as 2009/10 and 2010/11. The highest average Tmax, amounting to 6.0 °C, was recorded in seasons 1989/90 and 2006/07. Moreover, warm winters with an average considerably above norm occurred in the years 1997/98, 2015/16, 1988/89, 1974/75, and 2007/08. Standard deviation for the given multi-annual period amounted to 2.2 °C. An increase in Tmax at a level of 0.36 °C was recorded in the analyzed years, although the changes were not statistically significant.

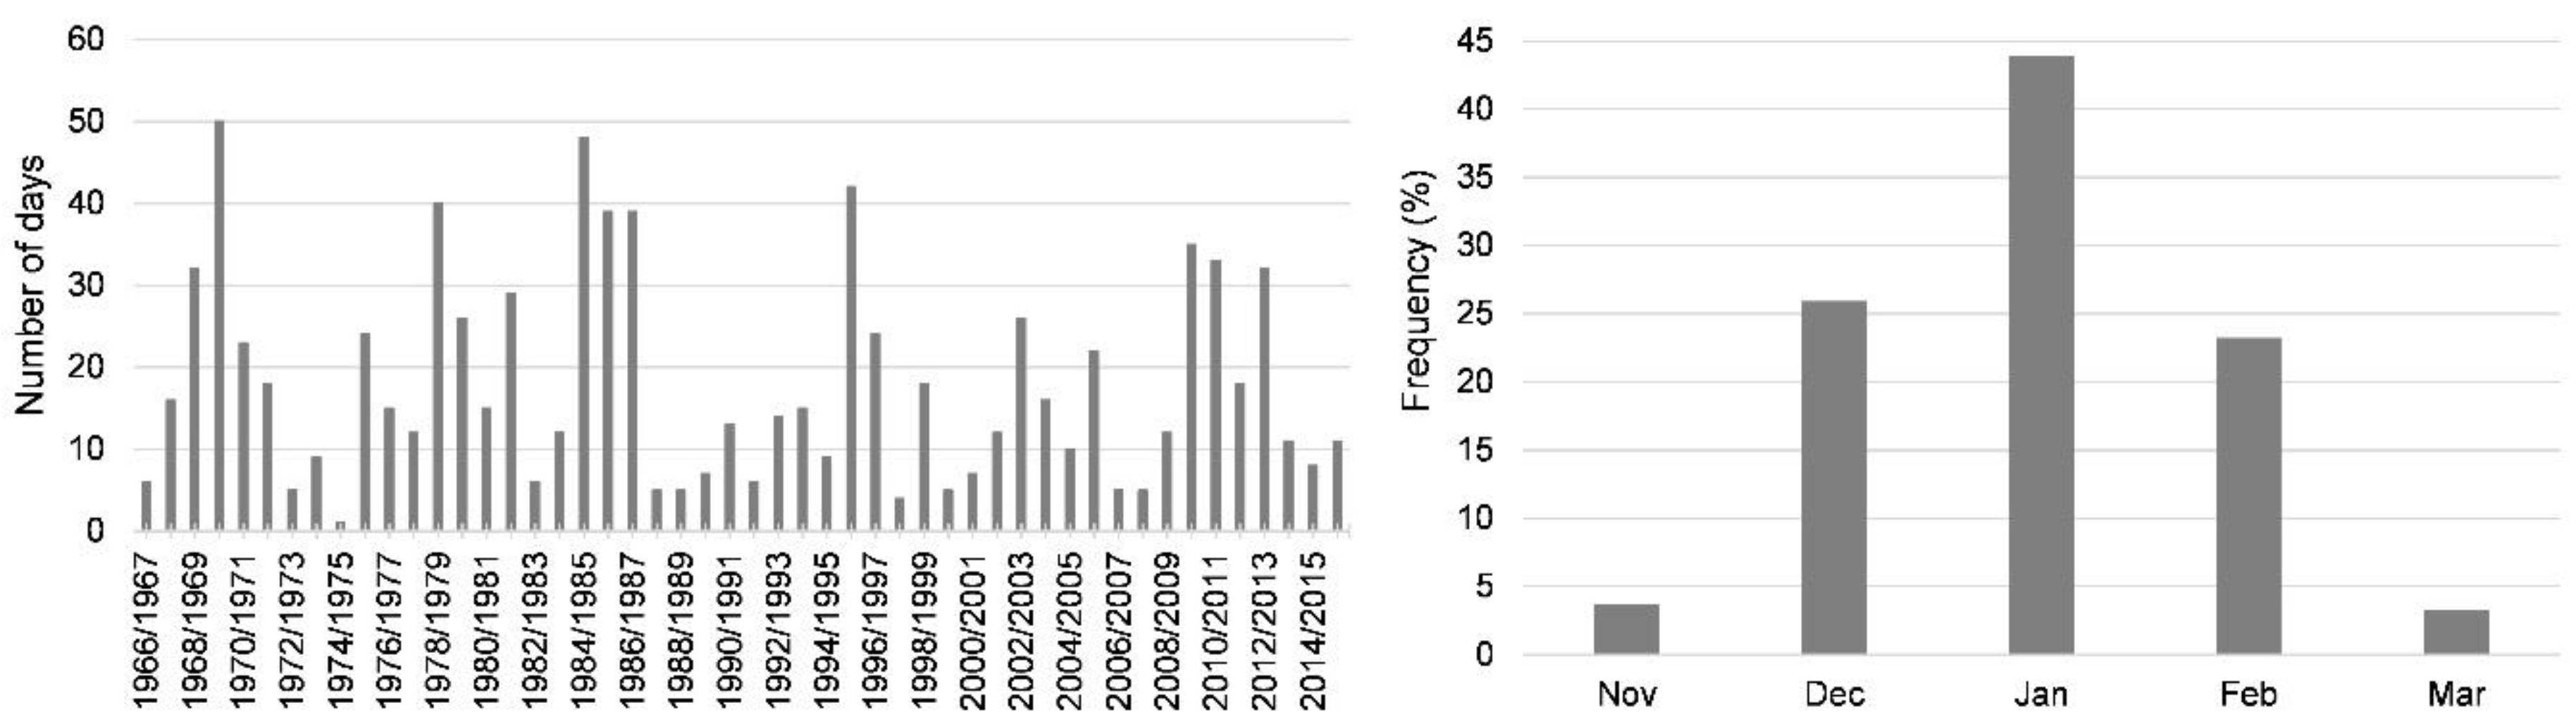
3.2. Cold Days and Cold Waves in the Years 1966–2015 (Poznań-Ławica)

Cold days (i.e., days with a maximum temperature below −1.6 °C) in Poznań occurred for 18 days in a year on average. In particular seasons, their number was largely variable, as suggested by the value of standard deviation amounting to 12.6. The number of cold days changes from 1 day (1974/75) to 50 days (1969/70) (Figure 3). A decrease in the number of cold days was recorded in the analyzed period, although the changes were not statistically significant. The analyzed days occurred from November to March, although their highest number was recorded from December to February with a maximum in January (43.9% of all recorded days). The first cold day was observed the earliest on 4 November 1980, and the latest on 23 March 2013. According to the above data, the potential period of occurrence of cold days in Poznań amounted to 140 days.
A total of 59 cold waves were observed in the analyzed multi-annual period. They lasted for a total of 551 days (Table 2). The lowest number of cold waves was recorded in the years 1996/97–2005/06 (8 cases), and the highest in the years 1976/77–1985/86 (16 cases). Waves of 5 and 7 days were the most frequent, respectively 14 and 12. The longest cold wave occurred in winter 1984/85 and lasted for 27 days from 26 December to 21 January. An equally long cold wave was recorded in the season 1996/97. It lasted for 24 days (from 20 December to 12 January). The average length of cold waves in the analyzed multi-annual period amounted to 9.3 day, and in particular decades it varied from 7.9 (1986/87–1995/96) to 10 days (1996/97–2005/06). Cold waves occurred from November to March and were the most frequent in January (52.5% of all waves). The earliest cold wave in the analyzed multi-annual period was observed in 1993, from 19 to 23 November, and the latest from 1 to 7 March 1987.
The average Tmax during the analyzed cold waves amounted to −5.5 °C, and Tmin −11.5 °C. The lowest average Tmax and Tmin was recorded during the cold wave in 1987 (7–22.01). They amounted to −10.6 °C and −18.3 °C, respectively. The highest average Tmax and Tmin were recorded during the wave in 1978. They equaled −2.9 °C and −5.5 °C, respectively. During the longest cold wave, i.e., a wave lasting from 26 December 1984 to 21 January 1985, the average Tmax amounted to −7.0 °C, and average Tmin −12.8 °C.

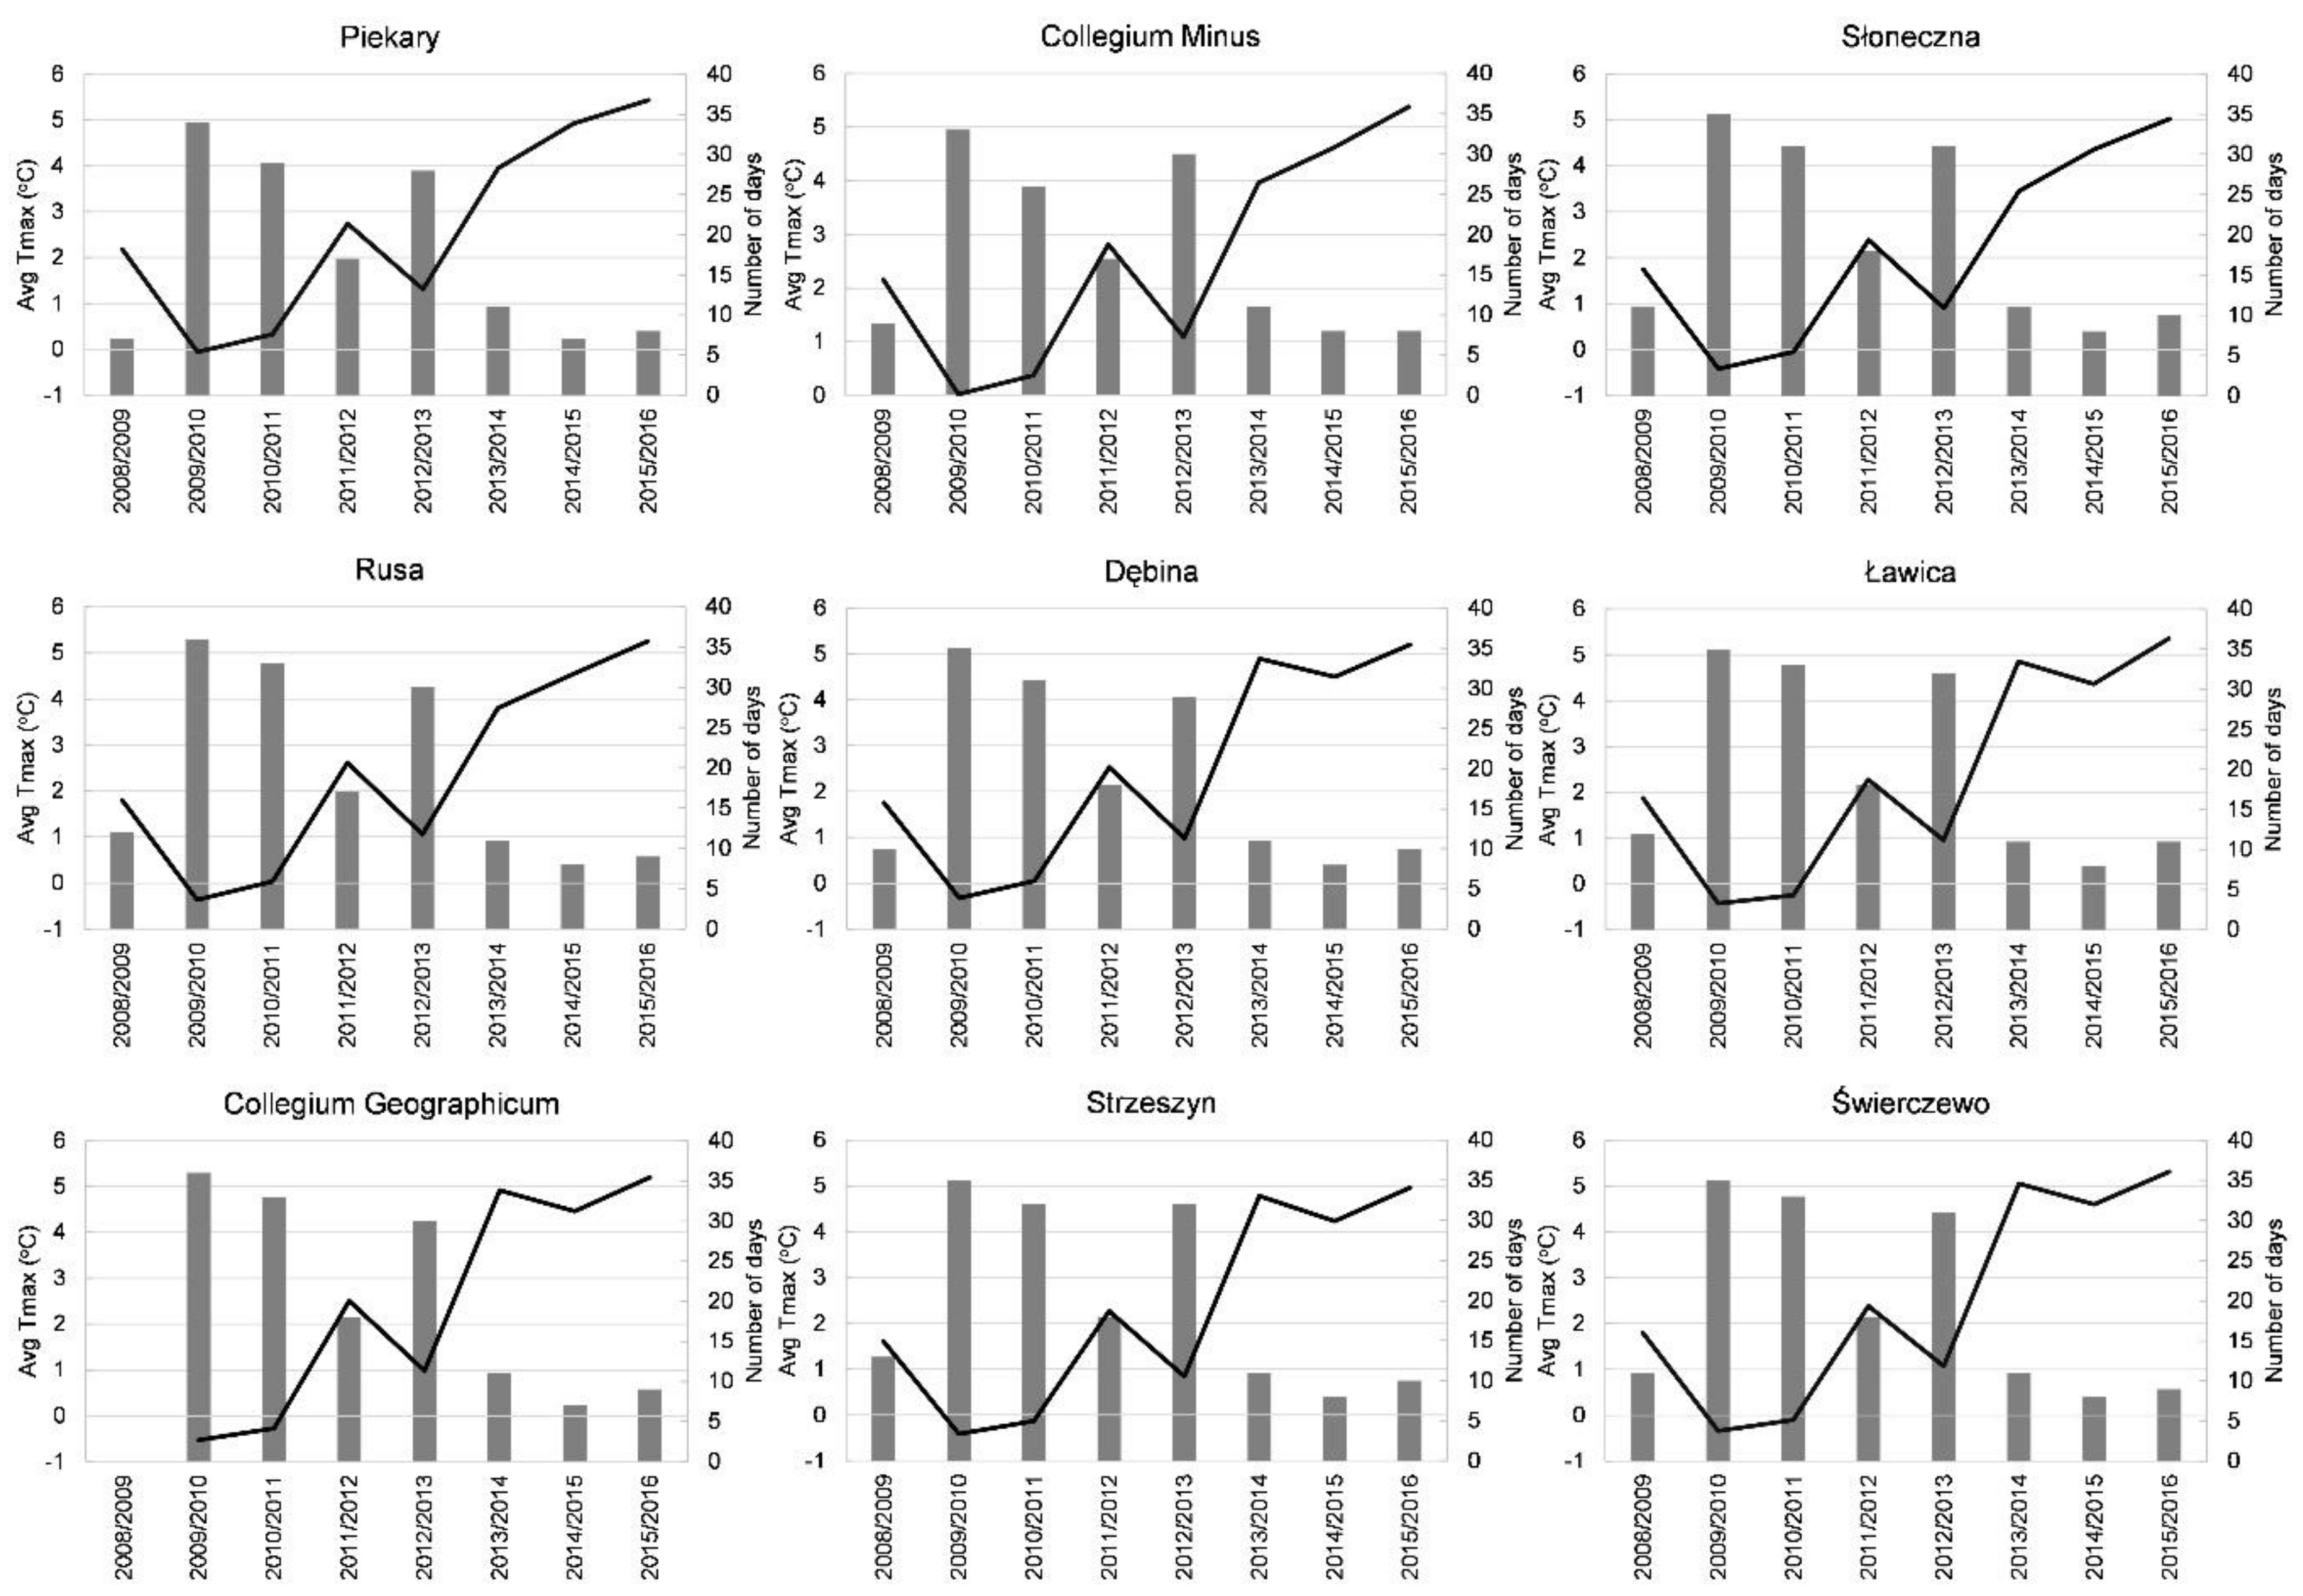
3.3. Tmax and Cold Days in the City in the Years 2008/09–2015/16

In the years 2008/09–2015/16 in the winter season, the average Tmax in the city varied from 2.2 °C in Słoneczna to 2.6 °C in Collegium Minus and Piekary. In all measurement points, the coolest season occurred in winter 2009/10, and the average Tmax ranged from −0.5 °C in Collegium Geographicum to 0.0 °C in Collegium Minus (Figure 4). An equally cold winter occurred in 2010/11. The warmest season was observed in winter 2015/16, when the average Tmax varied from 5.0 °C in Słoneczna and Strzeszyn to 5.4 °C in Collegium Minus, Piekary, and Ławica.
The total number of cold days in the city ranged from 141 days in Piekary and 142 days in Collegium Minus to 160 days in Ławica. The highest number of such days was recorded during the coldest seasons, i.e., in winter 2009/10 (Figure 4). Their number varied from 33 in Collegium Minus to 36 days in Rusa and Collegium Geographicum. Cold days occurred equally frequently in winter 2010/11. They were recorded the most seldom in season 2014/15, when their number varied from 7 to 8 days. In the warmest season, from 8 cold days were recorded in Collegium Minus and Piekary to 11 cold days in Ławica.

3.4. Cold Waves of 2010 and 2011

3.4.1. Tmax in the Cold Waves

The cold wave in the entire area of the city began on 7 and lasted until 11 February (Figure 5a). The average Tmax during the wave ranged from −4.3 °C in Collegium Geographicum to −3.3 °C in Collegium Minus and −3.5 °C in Piekary. In most of measurement points, the lowest Tmax was recorded on 9 February. It varied from −5.2 °C in Collegium Geographicum and Słoneczna to −3.3 °C in Collegium Minus.
The beginning and ending of the second analyzed cold wave was variable over the area of the city. It began the earliest in Collegium Geographicum and in Rusa and Słonecznej—on 14 February, one day later in Ławica, Strzeszyn, and Świerczew, and on the subsequent day in Dębina (Figure 5b). In Collegium Minus and Piekary, the beginning of the wave was recorded only on 19 February. The discussed cold wave ended on 26 February, and one day earlier in Collegium Minus. The lowest Tmax over the entire area of the city was recorded on 22 February. It varied from −9.4 °C in Ławica to −6.7 °C in Collegium Minus.

3.4.2. Daily air temperature on 9 February 2010 and 21 February 2011

On 9 February, the daily course of air temperature throughout the city was approximate (Figure 6a). The lowest air temperature was observed at 6–7:30 UTC, and the highest at 12–14:30 UTC. Minimum temperature in Poznań ranged from −15.8 °C in Collegium Geographicum to −11.1 °C in Słoneczna, and maximum from −5.2 °C in Collegium Geographicum and Słoneczna to −3.3 °C in Collegium Minus. During the day, differences in air temperature between particular measurement points were considerably lower than in night-morning hours. The smallest differences (approximately 1.1 °C) occurred around midnight, and the highest in morning hours with a maximum at 6:30 UTC (5.0 °C). During the analyzed day, air temperature amplitude varied from 5.9 °C in Słoneczna to 11.0 °C in Strzeszyn.
On 21 February 2011, similarly as on 9 February 2010, the daily course of air temperature was approximate in all measurement points (Figure 6b). The lowest temperature was observed at 6:30–7:30 UTC, and the highest at 12–13:30 UTC. Minimum temperature ranged from −16.7 °C in Ławica to −14.6 °C in Piekary, and maximum from −8.2 °C in Collegium Geographicum to −5.6 °C in Collegium Minus. The smallest differences in air temperature between particular points were observed in morning hours with the minimum at 8:30 UTC (1.1 °C), and the highest in evening hours with a maximum at 19 UTC (4.3 °C). The daily air temperature amplitude in particular points ranged from 7.5 °C in Słoneczna to 9.3 °C in Collegium Minus.

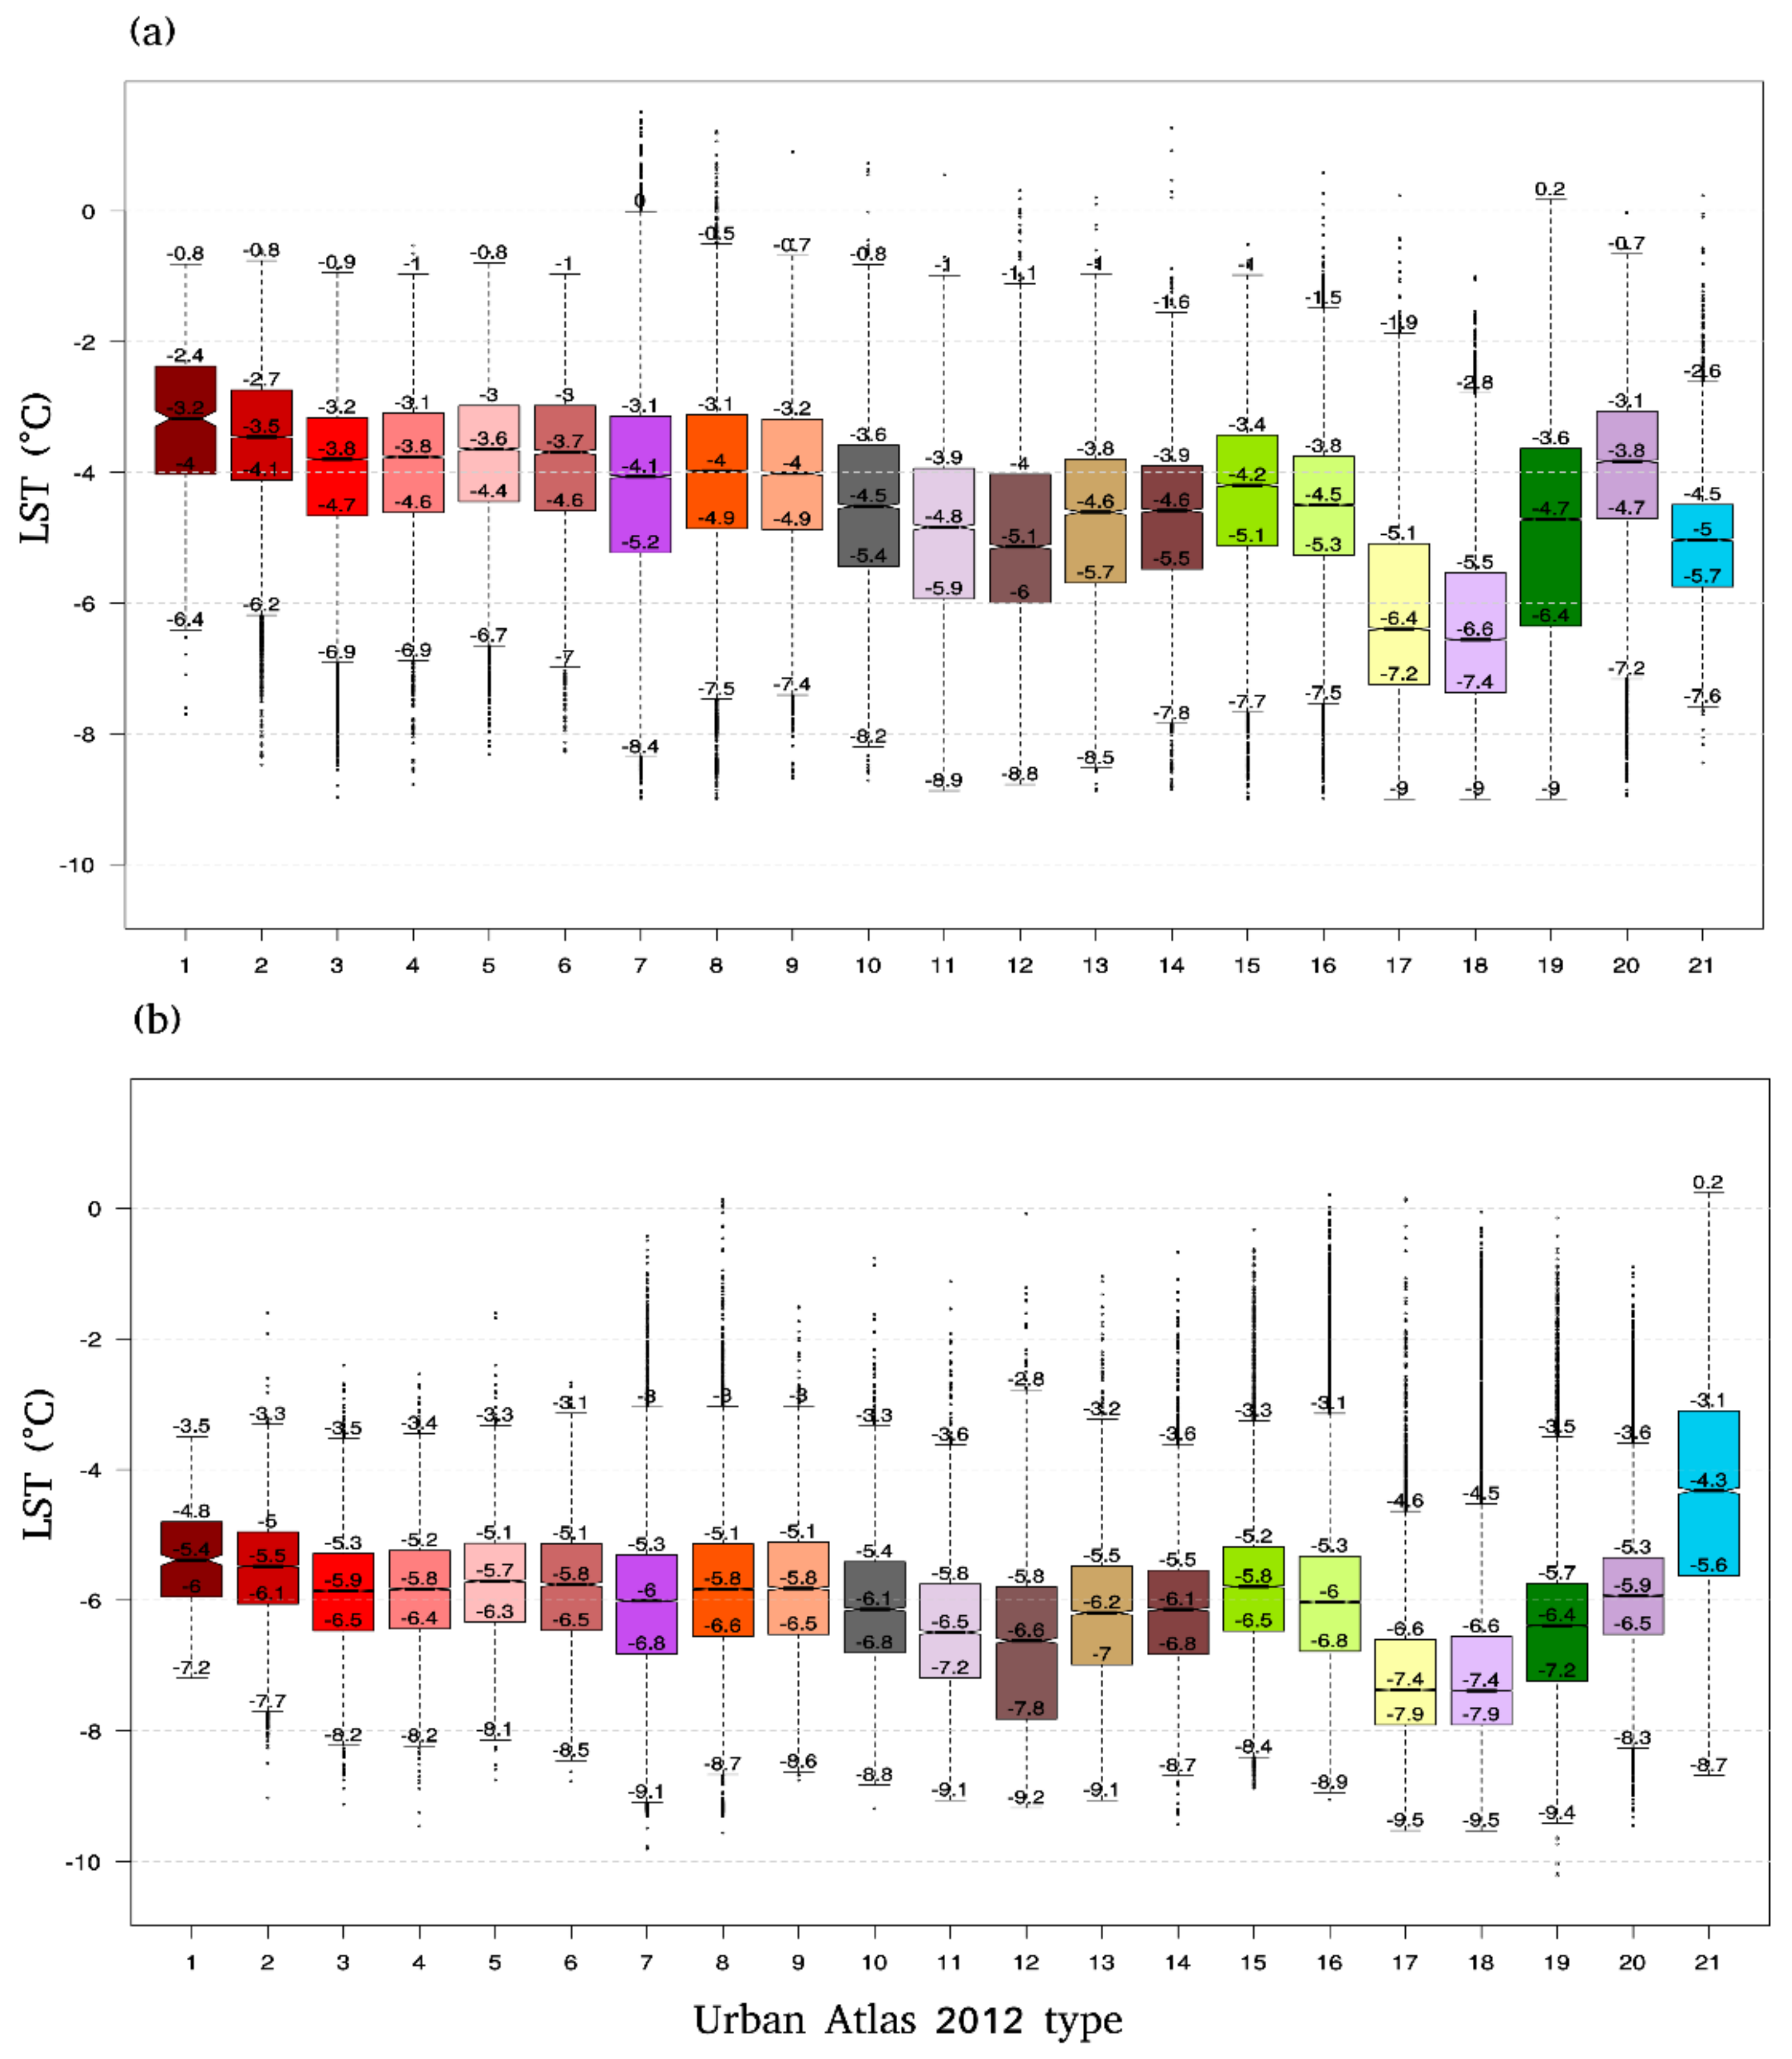
3.4.3. Land Surface Temperature and Land Use

On 9 February 2010 at 9:34 UTC over the study area, considerably high variability of the value of the LST field occurred because of variable land cover and land use (Figure 7a). The highest values of the LST median (−3.2 °C) are characteristic of continuous urban fabric and discontinuous dense urban fabric (−3.5 °C). For both types of land use, statistically significant medians are different from the medians calculated for all the remaining types, directly suggesting evident distinctiveness of the LST field in the areas. The lowest values of the LST median occur in the following areas: agricultural + semi-natural areas and wetlands as well as pastures (−6.4 °C, −6.6 °C, respectively) (Figure 8a).
21 February 2011 was cooler than the day described above. Similarly, as previously, the highest values of the LST median (excluding water areas) occurred in urbanized areas to the greatest degree, i.e., continuous urban fabric (−5.4 °C) and discontinuous dense urban fabric (−5.5 °C) (Figure 7b). Also, in this case, LST medians were statistically significantly different from medians for the remaining types of land use. The lowest values of the LST median (−7.4 °C) occurred in the following areas: agricultural + semi-natural areas, wetlands, and pastures (Figure 8b). On that day, a higher value of the LST median (−4.3 °C) over water areas in comparison to medians in the remaining types of land use draws attention. The comparison of values of medians for water areas from 21 February 2011 and 9 February 2010 shows a slight difference in LST (0.7 °C), whereas for the remaining types of land use the differences are considerably higher and amount to almost 2.0 °C. The direct cause of such a situation is presumably substantially higher heat capacity of water areas in comparison to land areas and their resulting slower response to changes in air temperature.

3.4.4. Weather situation on 9 February 2010 and 21 February 2011

On 9 February, Poland remained under the influence of a retreating high from over Russia, gradually replaced by a low from over Scandinavia (Figure 9a). Old polar-marine air flew in over Poland. On that day, the weather was cloudy with clear spells and local clearings. Maximum temperature varied from −7.0 °C in the east and center of the country to −1.0 °C on the coast. The wind was weak, from eastern directions. In Poznań, the wind was north and north-east, and its average daily speed was 6.8 km/h.
On 21 February, Poland remained within the range of an extensive high pressure system with the center over Russia, providing for advection of arctic air masses (Figure 9b). Over a major part of the country, the weather was cloudy or slightly cloudy, the cloudiness grew to moderate only locally. Maximum temperature varied from approximately −12.0 °C in north-east to −4.0 °C on the coast. The wind was weak, northern, and north-eastern. In Poznań, the wind was north and north-east, and its average daily speed was 9.4 km/h.

4. Discussion and Summary

The study showed an increase in Tmax in the winter season, although the recorded changes were not statistically significant. Earlier studies also determined the lack of statistically significant changes in air temperature in winter in many regions of Poland [26,27], simultaneously pointing to the strongest warming in spring and summer [4,26,27]. The consequence of the observed warming is a decrease in the number of cold days and cold waves. A similar direction of changes in Poland and Central Europe was also pointed out by other authors [4,28,29,30,31]. In the studied years, cold waves of 5 and 7 days occurred the most frequently. The longest cold wave lasted for 27 days and occurred in winter 1984/85. The aforementioned wave also occurred in other regions of the country and was similarly included to the longest among others in south-east Poland [32].
The analysis of point measurements in the city showed high differentiation of thermal conditions in winter and during the analyzed cold waves. In particular measurement points, for the analyzed cold days, the differences varied from 1.1 to 5.0 °C. A similar range of differences was also observed during selected hot days, with a maximum of 5.2 °C [20]. The coldest areas include semi-natural urban green areas, sports and recreation areas, as well as forests and fallow arable land. The warmest areas include strongly transformed areas, i.e., areas of continuous urban fabric and discontinuous dense urban fabric and industrial areas.
Research on the differentiation of urban conditions during a cold wave by means of satellite images showed a considerable effect of particular urban structures on LST. On both days, irrespective of the average air temperature for each of them, the effect of the type of land on LST was very similar, as suggested by the structure and proportions of LST for each type of land. Considerably higher and statistically significantly different values of the median as well as values of the lower and upper quartile of LST concern the direct city center, i.e., areas of continuous urban fabric and discontinuous dense urban fabric with density according to the Urban Atlas at a level of 30–80%. The warming effect of the city on LST is also evident in areas with a lower density of urban fabric. In this case, very similar and evidently distinctive values of statistics of LST temperatures occurred on the first of the analyzed days (warmer) in the categories of discontinuous urban fabric (medium, low, and very low). On this day, another group probably affecting LST includes areas of industrial fast transit and other roads with associated land. The remaining types of land use have a considerably lower effect on LST in the city, and the lowest effect concerns types marked as pastures and agricultural, semi-natural areas and wetlands. On the second of the analyzed days (cooler), statistics of LST values show a similar effect of particular types of land use except for lower importance of areas of discontinuous urban fabric (medium, low and very low), as suggested by the equalization of values of LST statistics with values for industrial fast transit and other roads with associated land. On both days, the smallest range of difference of LST medians for water areas draws attention. It suggests a considerably higher inertia of their response to changes in air temperature. An approximate distribution of the coldest and warmest areas in the city was presented by Majkowska et al. [16] analyzing the urban heat island in Poznań, and Walawender [14] analysing the urban heat island in Kraków based on satellite images. According to the expectations and earlier results of urban climate research, areas with a higher density of buildings (a greater number of inhabitants and thus more released anthropogenic heat) are usually warmer than other areas with a lower density of buildings.
Differences in air temperature between particular points are largely determined by weather conditions. During cloudless and windless weather, natural surfaces are cooled faster than artificial ones [10]. This results in higher variability of air temperature in the city.

Author Contributions

A.M.T. has inspired and carried out the research as well as prepared the manuscript. M.P. developed satellite images and complemented the description of the results. L.K. assisted with the results and discussion.

Acknowledgments

This work was supported by the Polish National Science Centre under grant number: UMO–2017/24/C/ST10/00109.

Conflicts of Interest

The authors declare no conflict of interest.

References

  1. IPCC. Climate Change 2013: The Physical Science Basis. Contribution of Working Group I to the Fifth Assessment Report of the Intergovernmental Panel in Climate Change; Cambridge University Press: Cambridge, UK, 2013. [Google Scholar]
  2. Matuszko, D.; Piotrowicz, K. Long-term variability of meteotropic situations in Kraków. Przegląd Geograficzny 2012, 84, 413–422. [Google Scholar]
  3. Tomczyk, A.M. Impact of macro-scale circulation types on the occurrence of frosty days in Poland. Bull. Geogr. Phys. Geogr. Ser. 2015, 9, 55–65. [Google Scholar]
  4. Owczarek, M.; Filipiak, J. Contemporary changes of thermal conditions in Poland, 1951–2015. Bull. Geogr. Phys. Geogr. Ser. 2016, 10, 31–50. [Google Scholar]
  5. Bielec-Bąkowska, Z.; Łupikasza, E. Frosty, freezing and severe freezing days and their synoptic implications in Małopolska, southern Poland, 1951–2000. Bull. Geogr. Phys. Geogr. Ser. 2009, 1, 39–62. [Google Scholar]
  6. Bielec-Bąkowska, Z.; Piotrowicz, K. Extreme temperatures in Poland 1951–2006. Pr. Geograficzne 2013, 132, 59–98. [Google Scholar]
  7. Informacja Tygodniowa, Zagrożenia—Skutki—Ocena; Rządowe Centrum Bezpieczeństwa; 2016. Available online: http://rcb.gov.pl/wp-content/uploads/BIULETYN-ANALITYCZNY-nr-14.pdf (accessed on 15 January 2018).
  8. Informacja Tygodniowa, Zagrożenia—Skutki—Ocena; Rządowe Centrum Bezpieczeństwa; 2017. Available online: http://rcb.gov.pl/wp-content/uploads/BIULETYN-ANALITYCZNY-nr-18.pdf (accessed on 15 January 2018).
  9. Ostrzeżenia Meteorologiczne. Available online: http://www.pogodynka.pl/ostrzezenia (accessed on 27 Frebuary 2018).
  10. Błażejczyk, K.; Kuchcik, M.; Milewski, P.; Dudek, W.; Kręcisz, B.; Błażejczyk, A.; Szmyd, J.; Degórska, B.; Pałczyński, C. Urban Heat Island in Warsaw—Climatic and Urban Conditionings; Wyd. Akademickie SEDNO Warszawa: Warsaw, Poland, 2014; p. 177. ISBN 978-83-7963-018-9. [Google Scholar]
  11. Kawashima, S.; Ishida, T.; Minomura, M.; Miwa, T. Relations between surface temperature and air temperature on a local scale during winter nights. J. Appl. Meteorol. Climatol. 2000, 39, 1570–1579. [Google Scholar]
  12. Voogt, J.A.; Oke, T.R. Thermal remote sensing of urban climates. Remote Sens. Environ. 2003, 86, 370–384. [Google Scholar]
  13. Dobrovolny, P. The surface urban heat island in the city of Brno (Czech Republic) derived from land surface temperatures and selected reasons for its spatial variability. Theor. Appl. Climatol. 2013, 112, 89–98. [Google Scholar]
  14. Walawender, J. Application of LANDSAT satellite data and GIS techniques for estimation of thermal conditions in urban area (using an example of Krakow agglomeration). Pr. Geograficzne 2009, 122, 81–98. [Google Scholar]
  15. Fabrizi, R.; De Santis, A.; Gomez, A. Satellite and ground-based sensors for the urban heat island analysis in the city of Madrid. Urban Remote Sens. Event 2011, 349–352. [Google Scholar]
  16. Majkowska, A.; Kolendowicz, L.; Półrolniczak, M.; Hauke, J.; Czernecki, B. The urban heat island in the city of Poznań as derived from Landsat 5 TM. Theor. Appl. Climatol. 2017, 128, 769–783. [Google Scholar] [CrossRef]
  17. Politi, E.; Cutler, M.E.J.; Rowan, J.S. Using the NOAA advanced very highresolution radiometer to characterize temporal and spatial trends in water temperature of large European lakes. Remote Sens. Environ. 2012, 126, 1–11. [Google Scholar] [CrossRef] [Green Version]
  18. Ptak, M.; Choiński, A.; Piekarczyk, J.; Pryłowski, T. Applying Landsat Satellite Thermal Images in the Analysis of Polish Lake Temperatures. Pol. J. Environ. Stud. 2017, 26, 2159–2165. [Google Scholar] [CrossRef]
  19. Bartoszek, K.; Siłuch, M.; Bednarczyk, P. Characteristics of the onset of the growing season in Poland based on the application of remotely sensed data in the context of weather conditions and land cover types. Eur. J. Remote Sens. 2015, 48, 327–344. [Google Scholar] [CrossRef]
  20. Półrolniczak, M.; Tomczyk, A.M.; Kolendowicz, L. Thermal Conditions in the City of Poznań (Poland) during Selected Heat Waves. Atmosphere 2018, 9, 11. [Google Scholar] [CrossRef]
  21. United Nations. World Population Prospects 2017. Available online: https://esa.un.org/unpd/wpp/Publications/Files/WPP2017_KeyFindings.pdf (accessed on 5 November 2017).
  22. Główny Urząd Statystyczny. Rocznik Statystyczny Rzeczypospolitej Polskiej 2015. Available online: https://stat.gov.pl/ (accessed on 5 November 2017).
  23. Kondracki, J. Regional Geography of Poland; Wydawnictwo Naukowe PWN: Warszawa, Poland, 2002; p. 441. [Google Scholar]
  24. Salmi, T.; Maiittii, A.; Anttila, P.; Ruoho-Airola, T.; Amnel, T. Detecting Trends of Annual Values of Atmospheric Pollutants by the Mann-Kendall Test and Sen’s Slope Estimates—The Excel Template Application MAKESENS; Publications on Air Quality No. 31; Finnish Meteorological Institute: Helsinki, Finland, 2002; pp. 1–35.
  25. Urban Atlas 2012. Available online: https://www.eea.europa.eu/data-and-maps/data/urban-atlas (accessed on 5 December 2017).
  26. Michalska, B. Tendencies of air temperature changes in Poland. Prace Stud. Geograficzne 2011, 47, 67–75. [Google Scholar]
  27. Wójcik, R.; Miętus, M. Some features of long-term variability in air temperature in Poland (1951–2010). Przegląd Geograficzny 2014, 86, 339–364. [Google Scholar]
  28. Wibig, J.; Podstawczyńska, A.; Rzepa, M.; Piotrowski, P. Heatwaves in Poland—Frequency, trends and relationships with atmospheric circulation. Geogr. Pol. 2009, 82, 33–46. [Google Scholar] [CrossRef]
  29. Lhotka, O.; Kyselý, J. Characterizing joint effects of spatial extent, temperature magnitude and duration of heat waves and cold spells over Central Europe. Int. J. Climatol. 2015, 35, 1232–1244. [Google Scholar] [CrossRef]
  30. Spinoni, J.; Lakatos, M.; Szentimrey, T.; Bihari, Z.; Szalai, S.; Vogt, J.; Antofie, T. Heat and cold waves trends in the Carpathian Region from 1961 to 2010. Int. J. Climatol. 2015, 35, 4197–4209. [Google Scholar] [CrossRef]
  31. Migała, K.; Urban, G.; Tomczyński, K. Long-term air temperature variation in the Karkonosze mountains according to atmospheric circulation. Theor. Appl. Climatol. 2016, 125, 337–351. [Google Scholar] [CrossRef]
  32. Krzyżewska, A.; Wereski, S. Heat waves and frost waves in selected Polish stations against bioclimatic regions background (2000–2010). Przegląd Geofizyczny 2014, 1–2, 9–109. [Google Scholar]
Figure 1. Location of Poznań (a) as well as Landsat 5 (thermal) 8-bit greyscale image of the study area (b) and image composite of three infrared bands of the ETM+ radiometer RGB = 654 (c) (acquisition date: 9 January 2010) and location of measurement points against type of land use (d) (Urban Atlas 2012).
Atmosphere 09 00208 g001
Figure 2. Course of the average Tmax in the winter season with long-term average value in Poznań-Ławica in the years 1966–2015.
Atmosphere 09 00208 g002
Figure 3. Number of cold days in the period 1966/67–2015/16 and the frequency of occurrence of cold days in months.
Atmosphere 09 00208 g003
Figure 4. Average Tmax (black solid line) in the winter season and number of cold days (grey bars) in 2008/09–2015/16 in Poznań.
Atmosphere 09 00208 g004
Figure 5. Tmax during the cold wave of 7–11 February 2010 (a) and 14–26 February 2011 (b).
Atmosphere 09 00208 g005
Figure 6. Daily course of air temperature in Poznań on 9 February 2010 (a) and 21 February 2011 (b).
Atmosphere 09 00208 g006
Figure 7. Land surface temperature pattern in Poznań ((a)—9 February 2010, (b)—21 February 2011).
Atmosphere 09 00208 g007
Figure 8. Statistic of land surface temperature in Poznań ((a)—9 February 2010, (b)—21 February 2011) based on Landsat images according to Urban Atlas 2012 types (colors and order of types according to legend in Figure 1). On the boxplot, the middle values denote medians, the box extends to the Q1 (first quartile) and Q3 (third quartile), and the whiskers show the range (99.3%): the upper whisker shows Q3 + 1.5 × IQR (the interquartile range), the lower shows Q1 − 1.5 × IQR. The notches extend to ±1.58 IQR/sqrt(n) and the dots represent outlier.
Atmosphere 09 00208 g008
Figure 9. Synoptic maps on 9 February 2010 (a) and 21 February 2011 (b). Source: Met Office.
Atmosphere 09 00208 g009
Table 1. Location and characteristics of measurement points in Poznań.
No.LocationLatitude (N)Longitude (E)Distance from the City Center–Piekary (km)/DirectionLand Cover
1.Piekary52°24′19.96″16°55′3960″0.0/-Industrial, commercial, public, military, and private units
2.Collegium Minus52°24′31.13″16°54′53.22″0.9/WIndustrial, commercial, public, military, and private units
3.Słoneczna52°23′40.27″16°52′29.69″3.9/WGreen urban areas
4.Rusa52°23′29.65″16°59′0.75″4.0/SEDiscontinuous Dense Urban Fabric
5.Dębina52°21′19.88″16°54′46.14″5.7/SGreen urban areas
6.Ławica52°24′59.46″16°50′4.71″6.9/WAirports
7.Collegium Geographicum52°27′46.80″16°56′28.92″6.7/NIndustrial, commercial, public, military, and private units
8.Strzeszyn52°27′15.14″16°50′50.79″7.7/NWDiscontinuous Dense Urban Fabric
9.Świerczewo52°22′11.90″16°53′56.11″4.5/SContinuous urban fabric
Table 2. Characteristics of cold waves in the period 1966/67–2015/16 in Poznań-Ławica.
YearsNumber of Cold WavesTotal Duration of Cold Waves (Days)Average Length (Days)Average Tmax (°C)Average Tmin (°C)
1966/67–1975/76121139.4−5.6−11.8
1976/77–1985/86161589.9−5.0−11.4
1986/87–1995/9611877.9−5.5−11.9
1996/97–2005/0688010.0−5.5−11.2
2006/07–2015/16121139.4−5.7−11.4
1966/67–2015/16595519.3−5.5−11.5

