Non-Monotonic Dependencies of Cloud Microphysics and Precipitation on Aerosol Loading in Deep Convective Clouds: A Case Study Using the WRF Model with Bin Microphysics


Abstract
1. Introduction
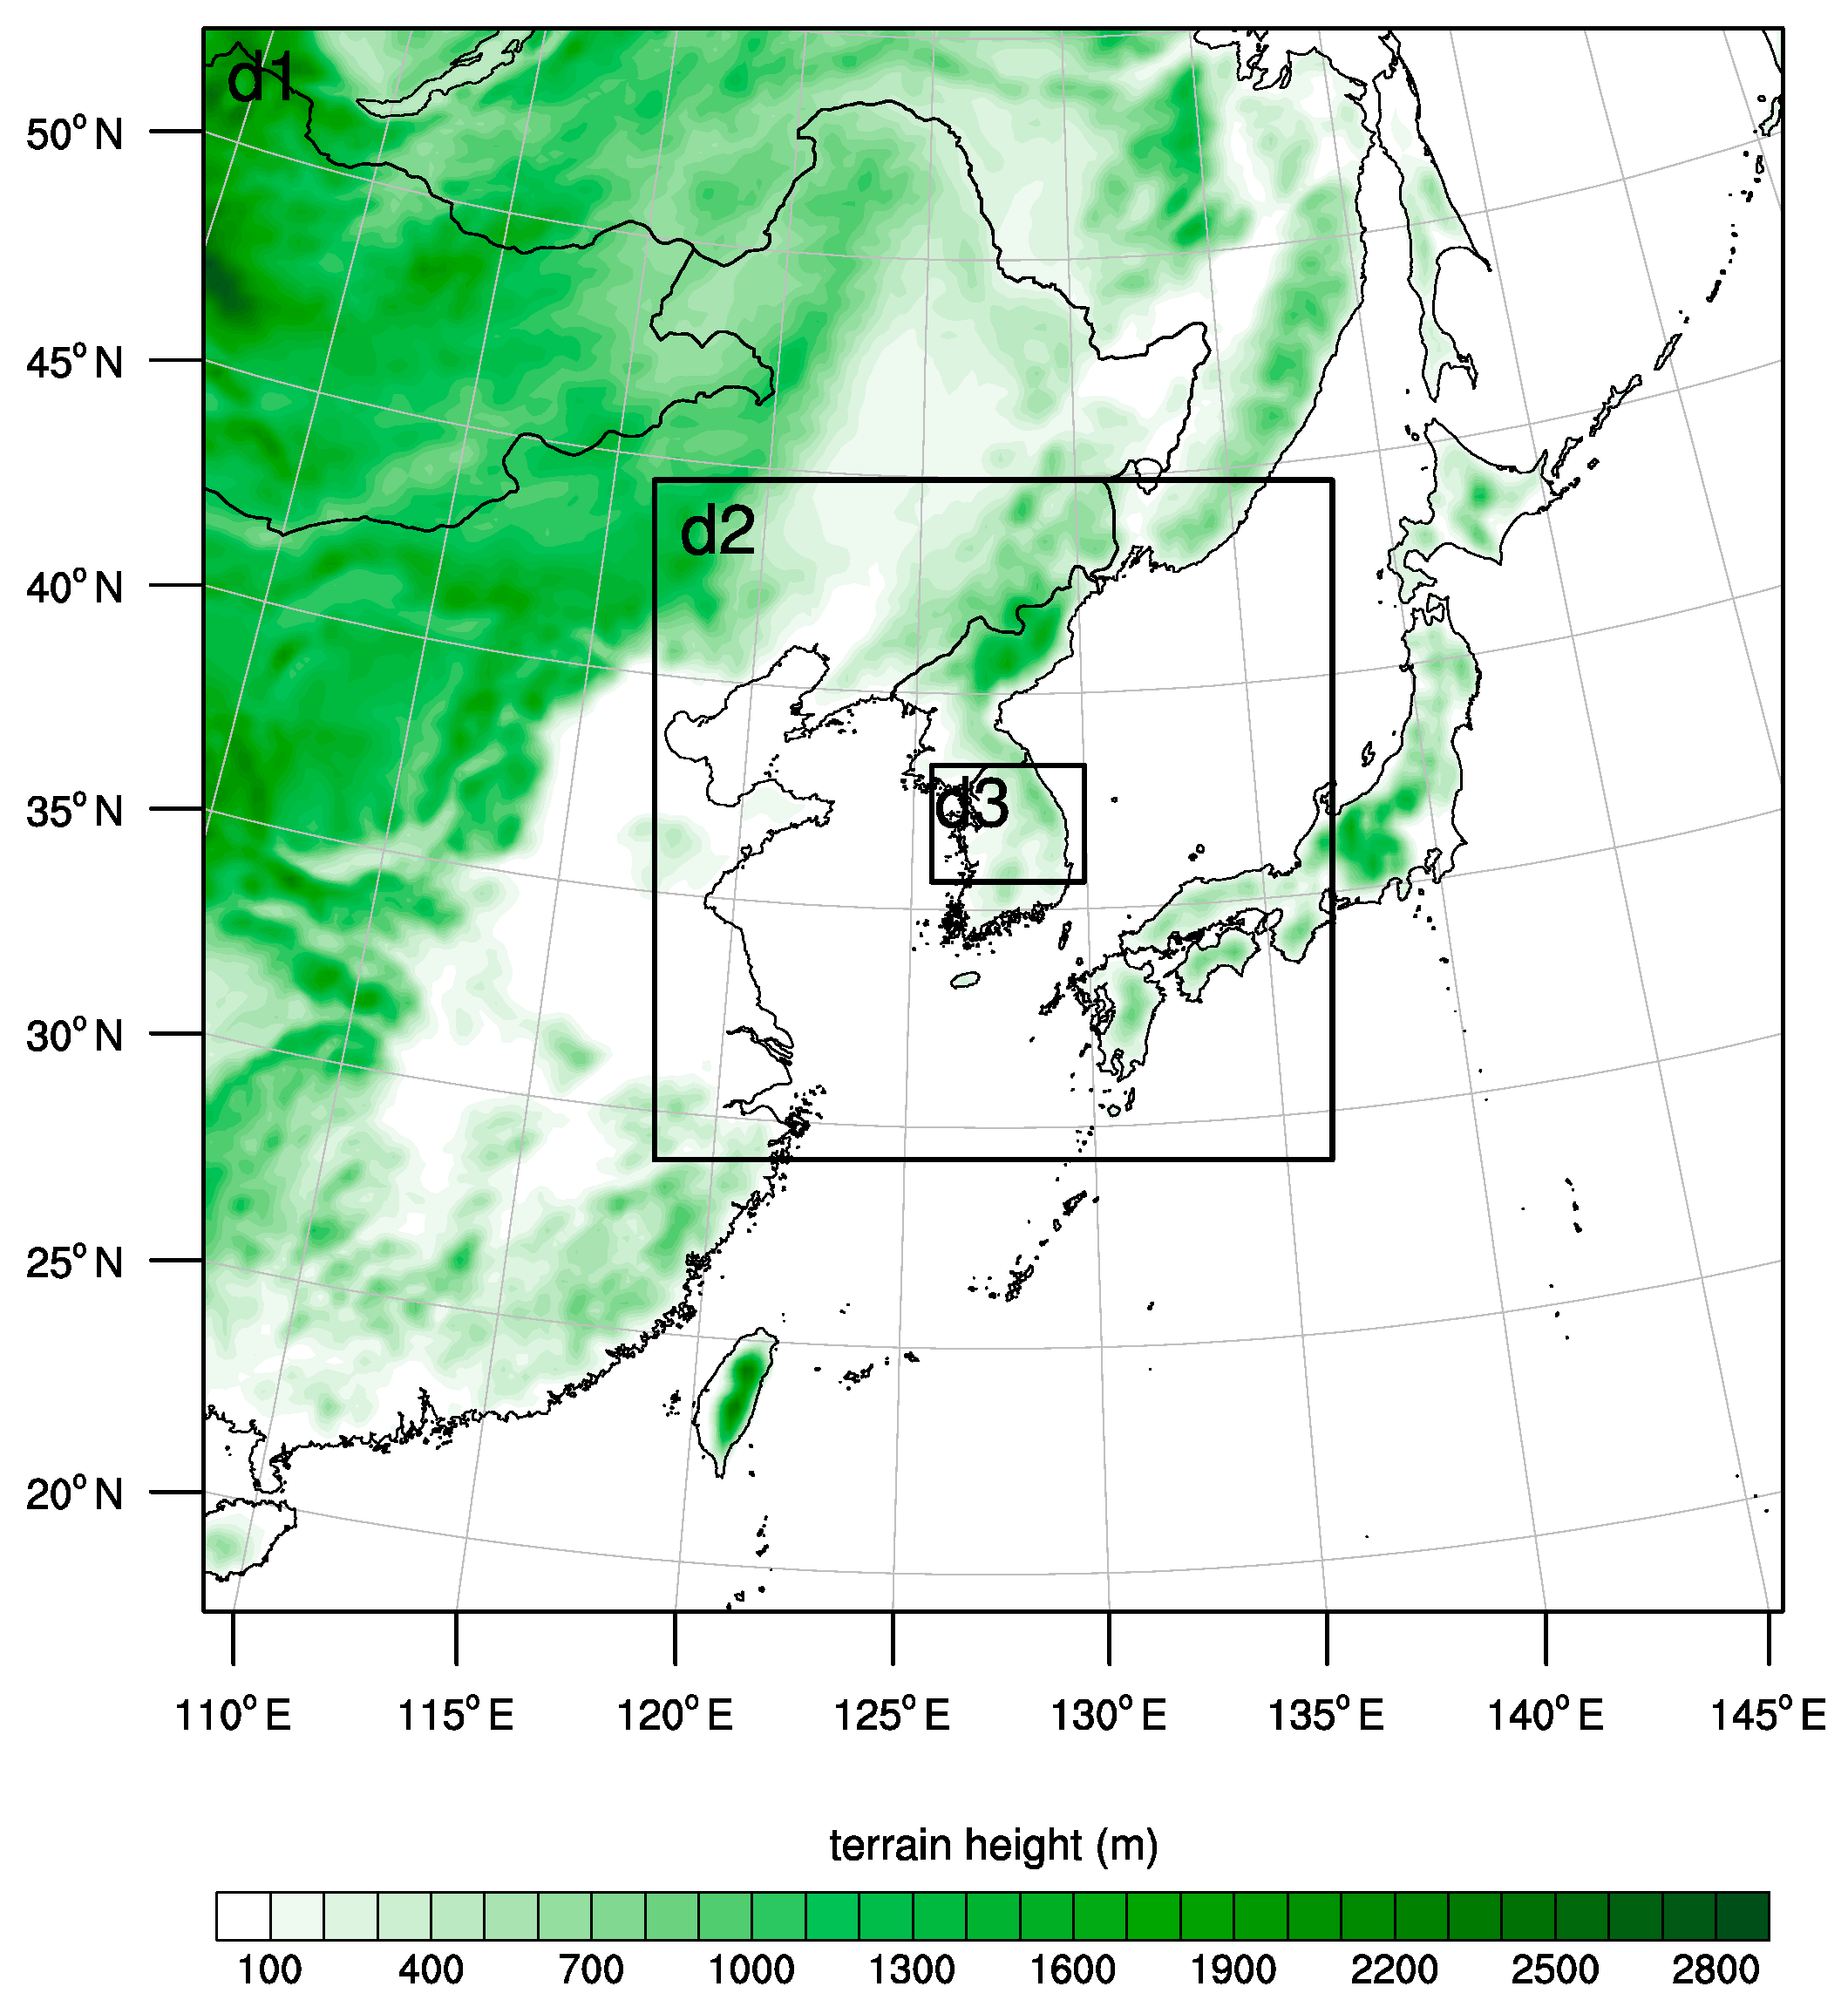
2. Case Description and Experimental Setup
3. Results
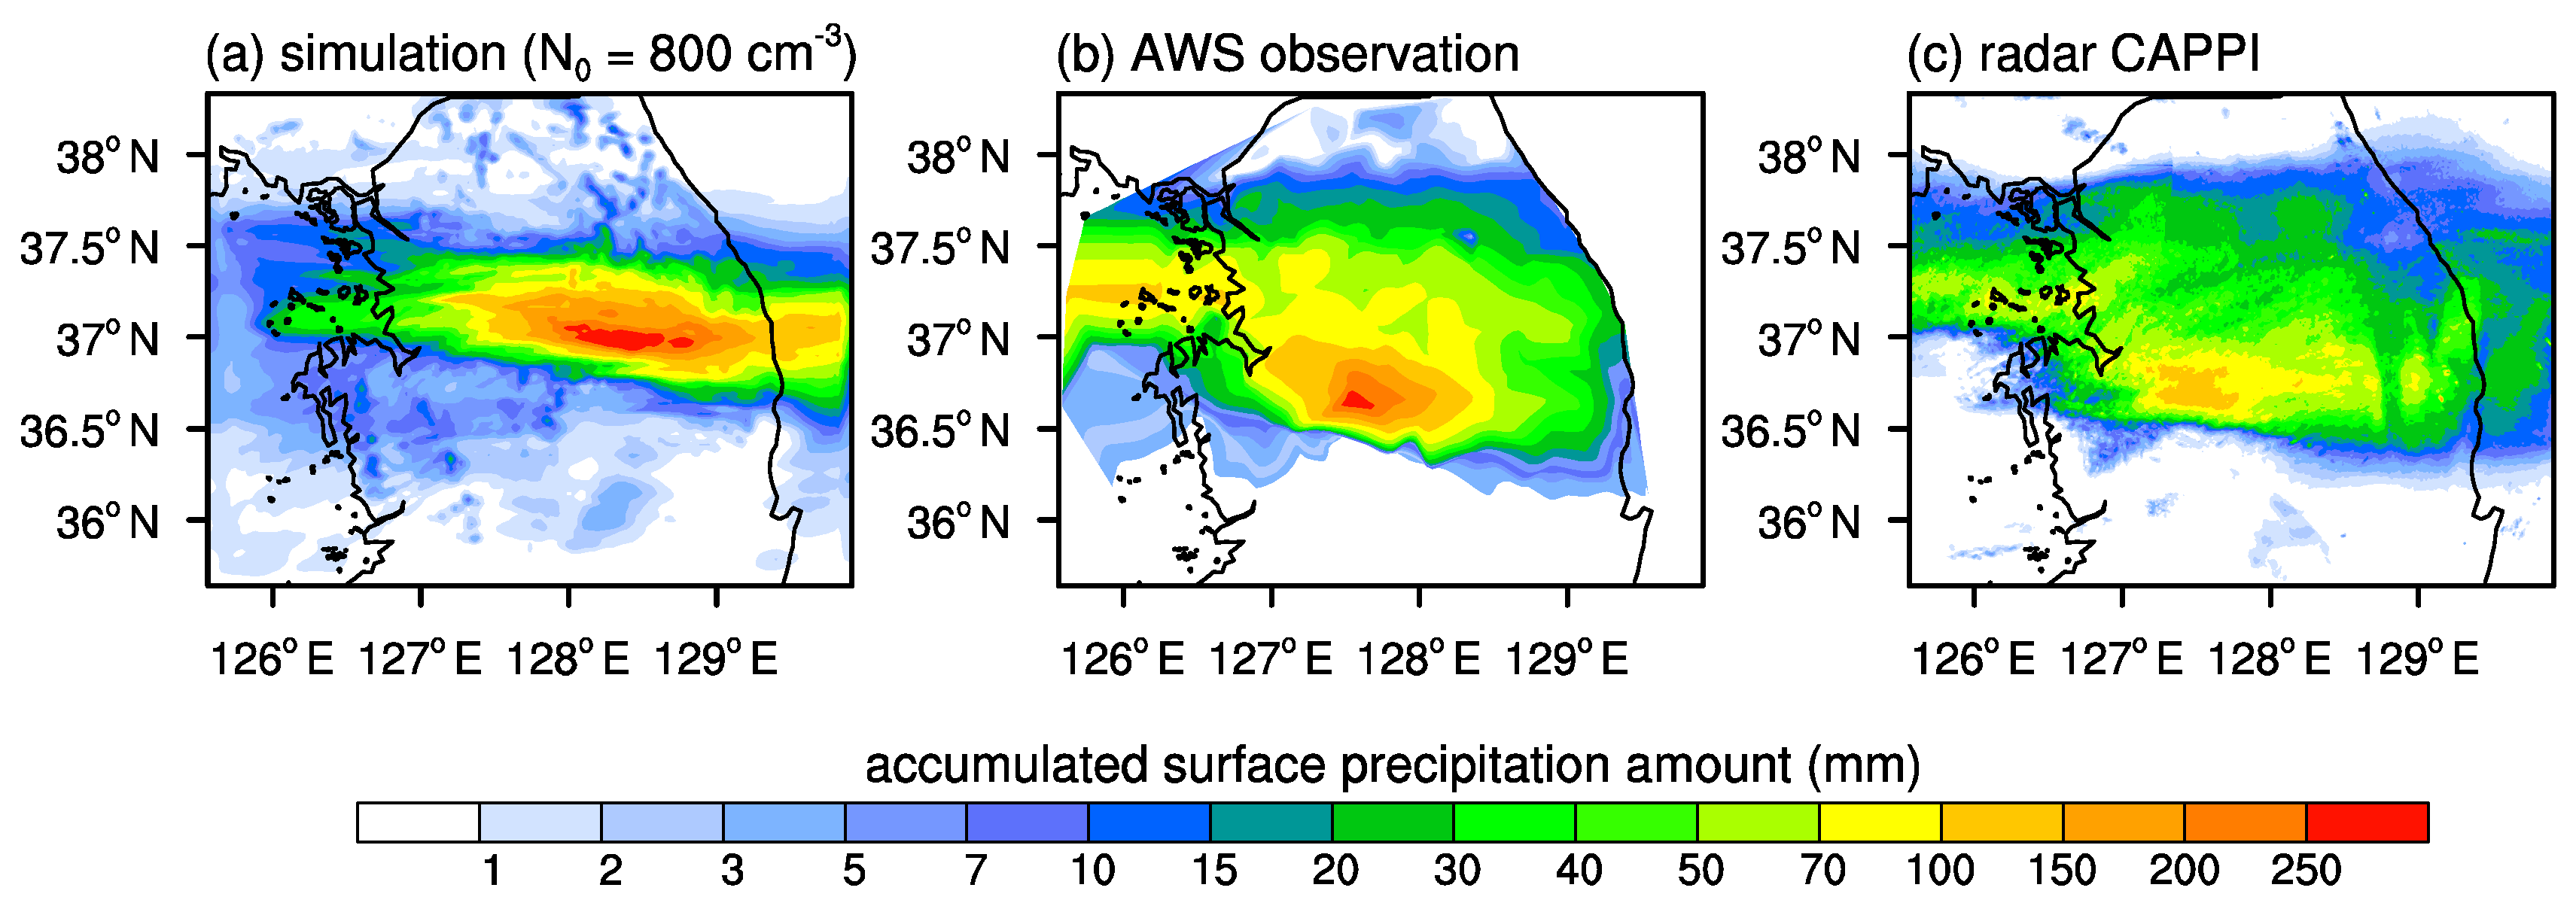
3.1. Validation
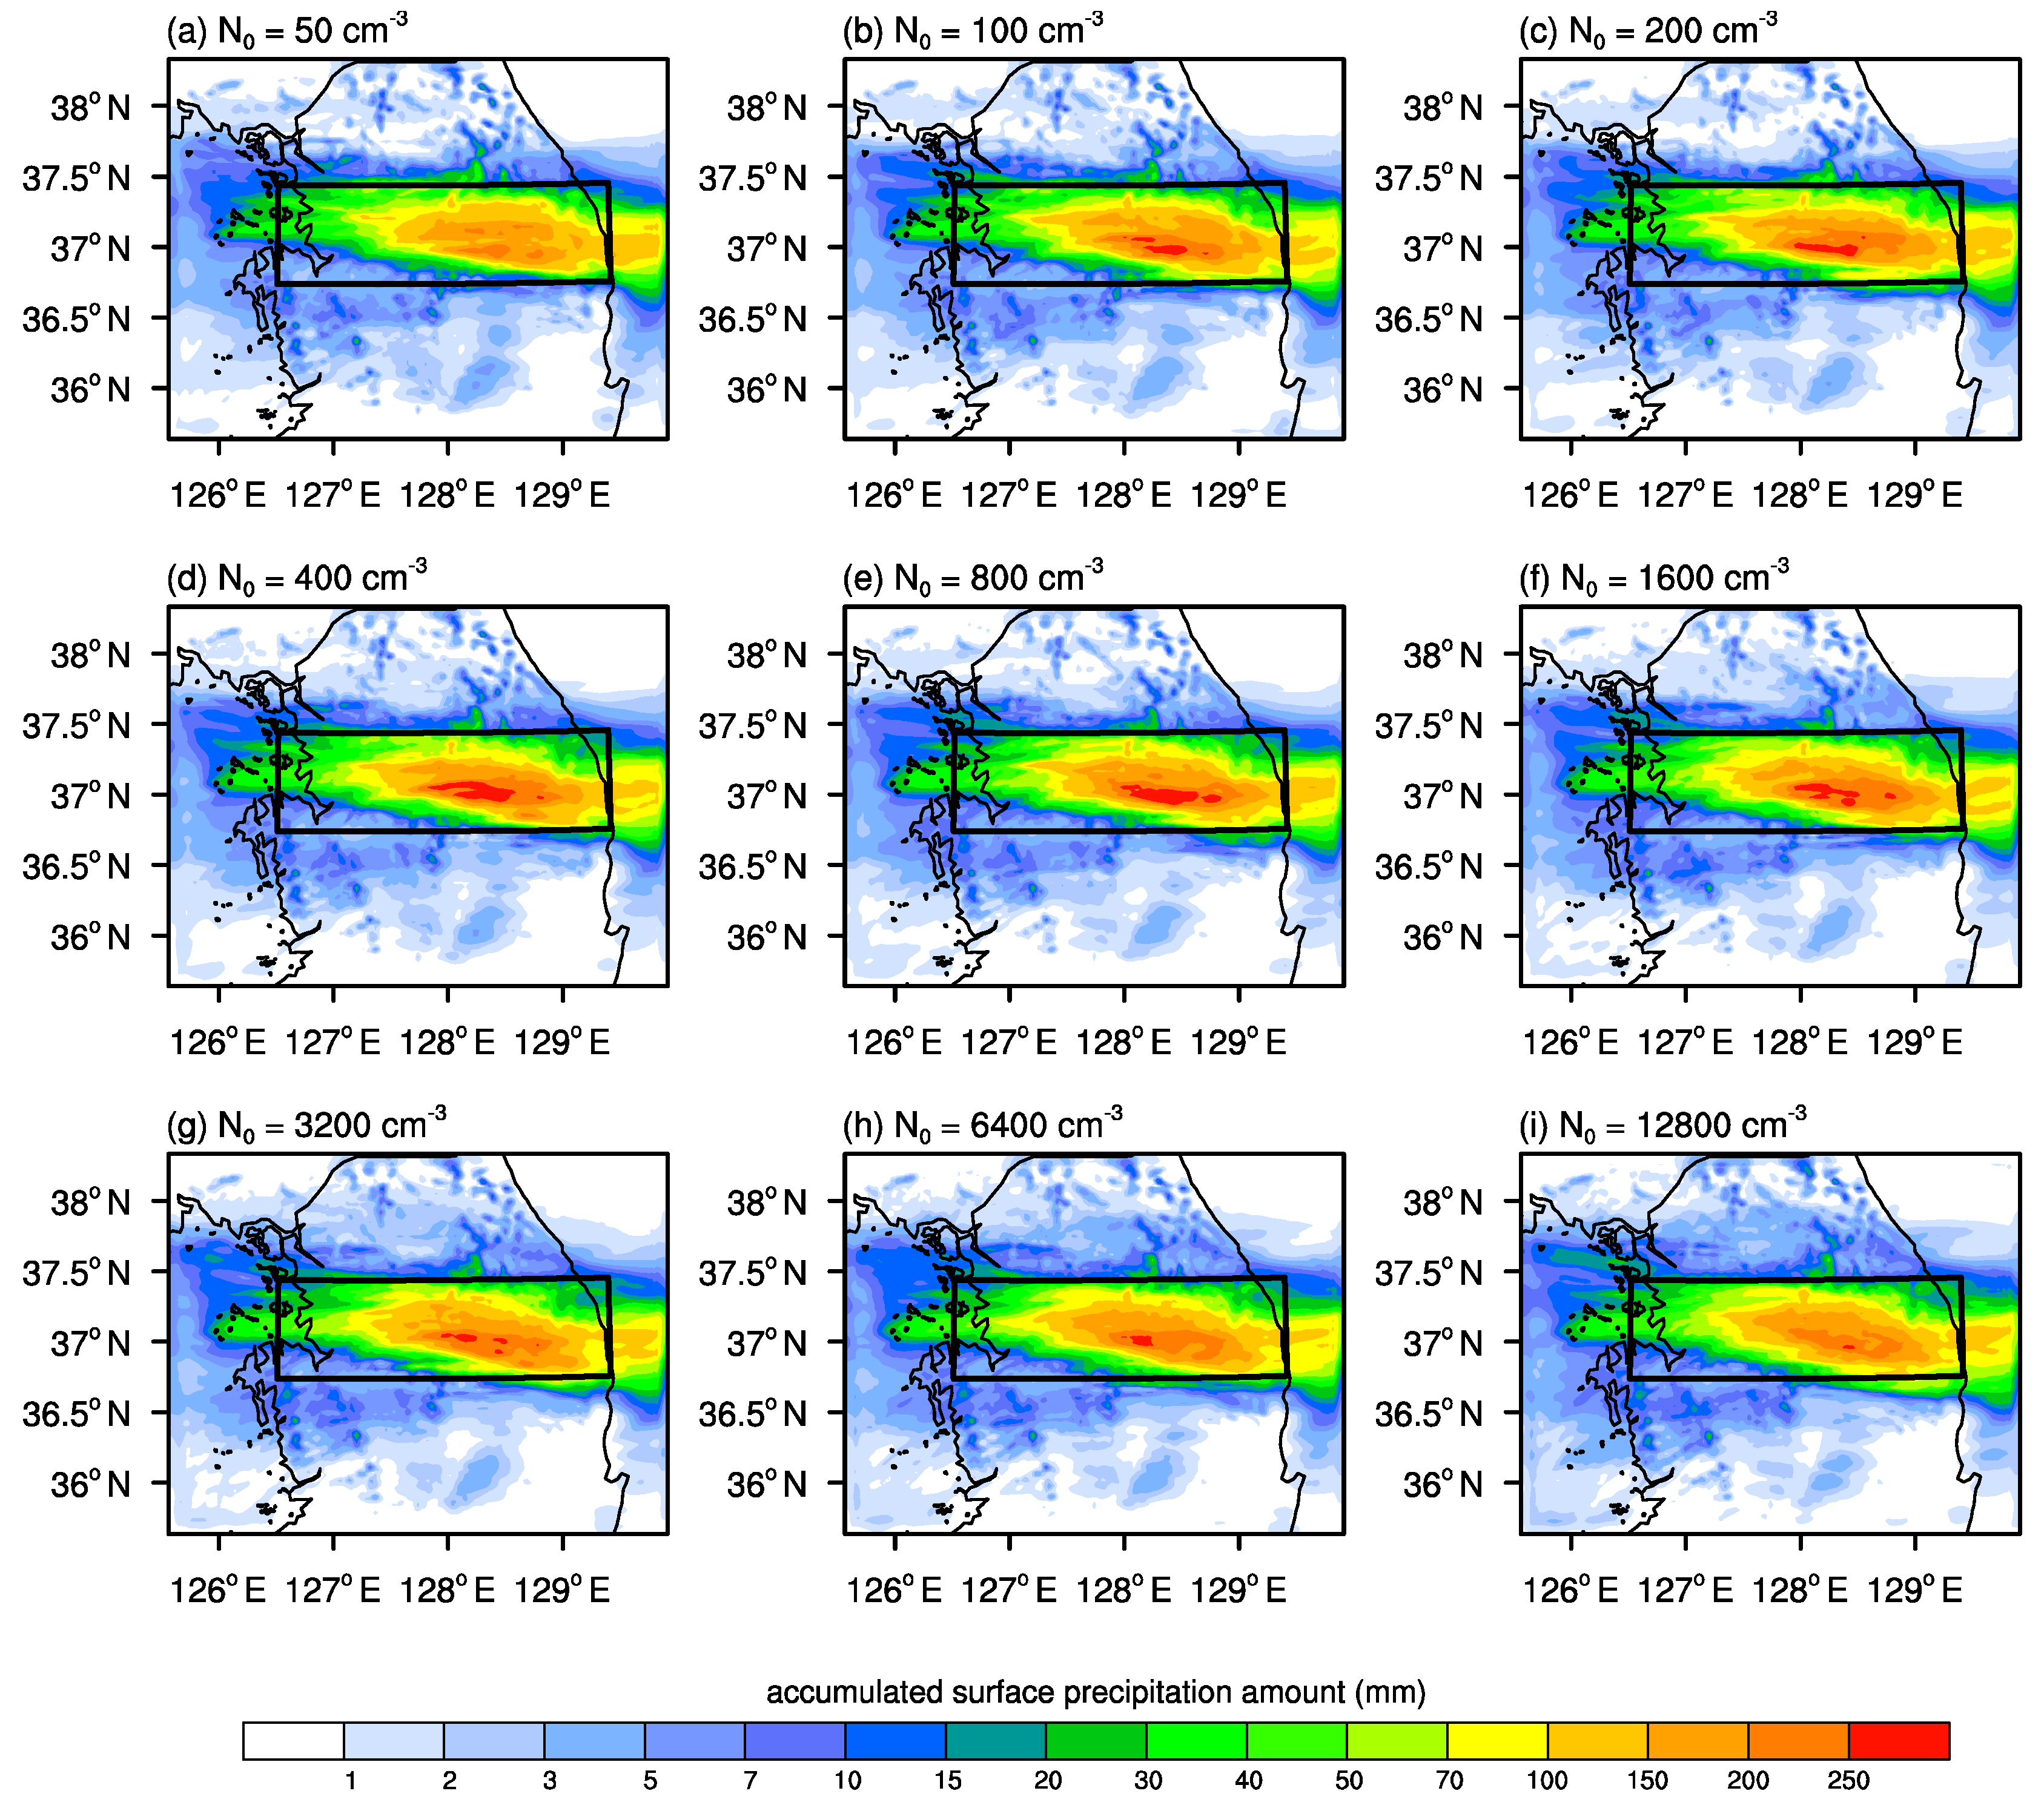
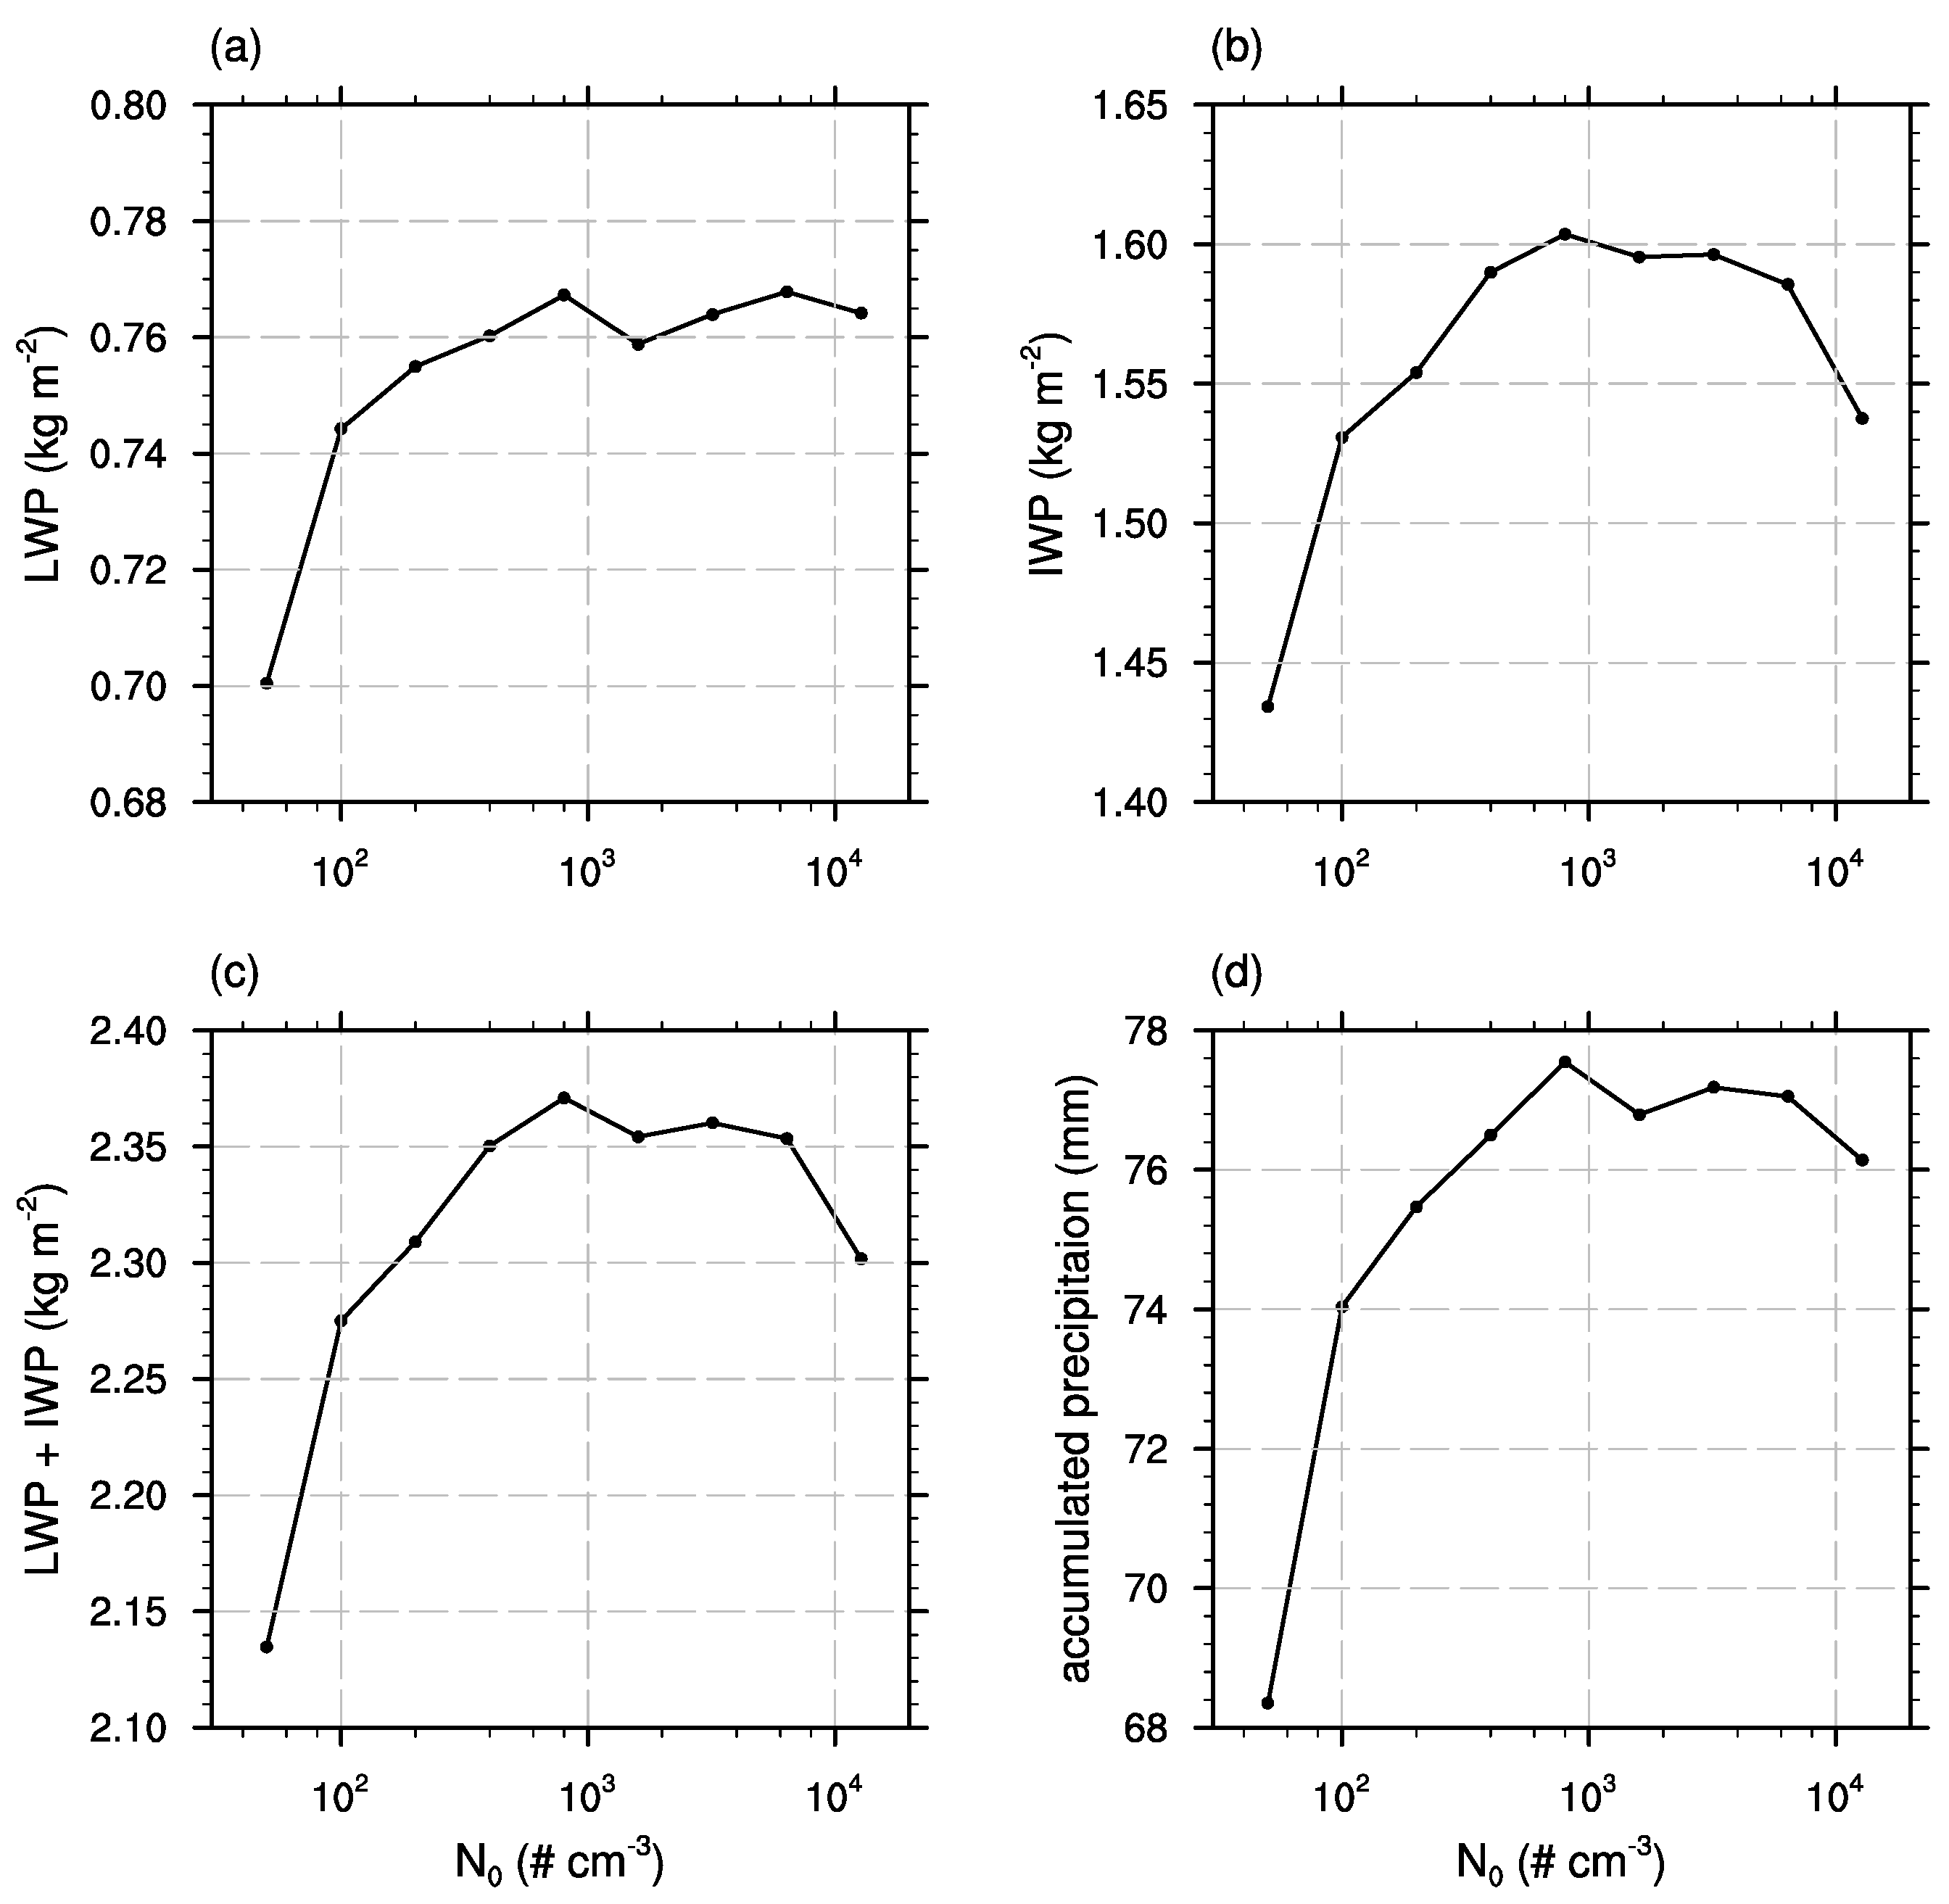
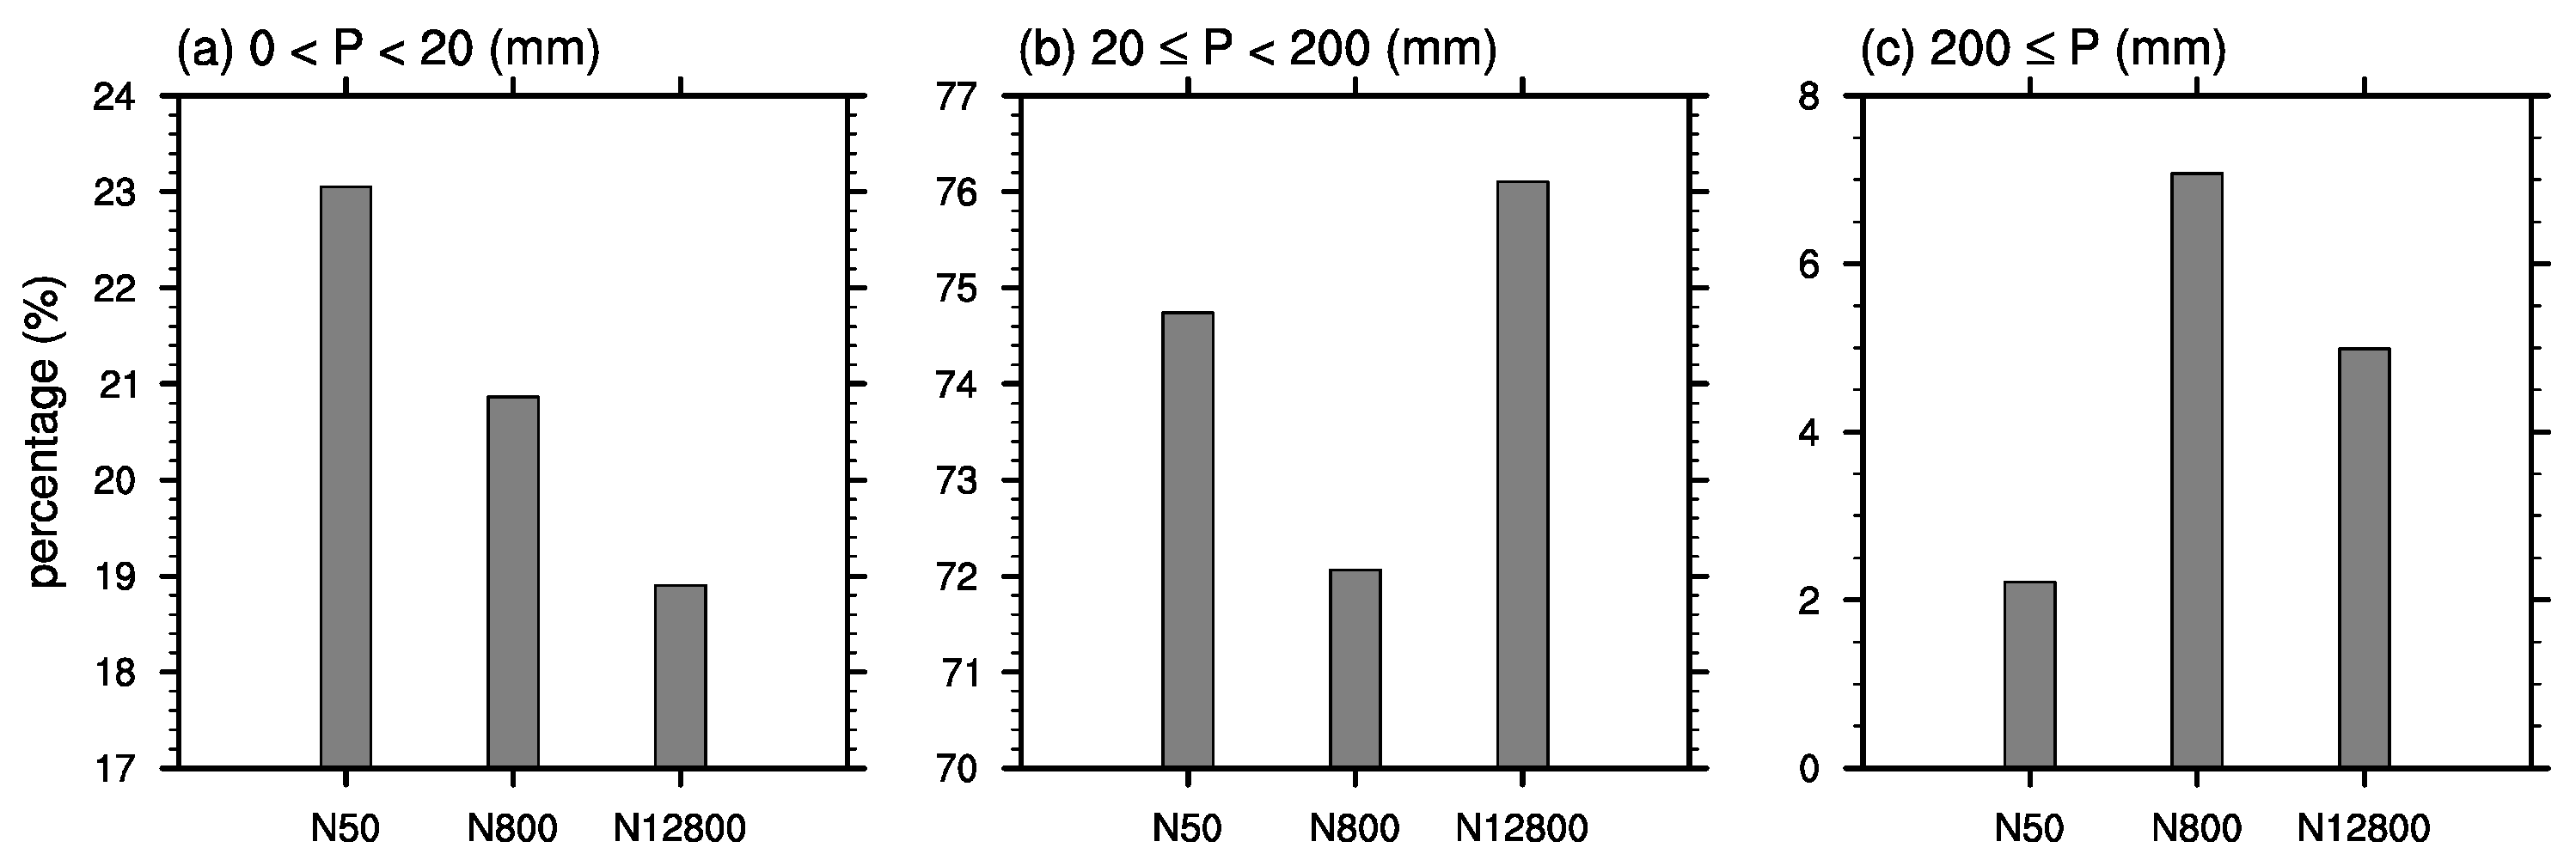
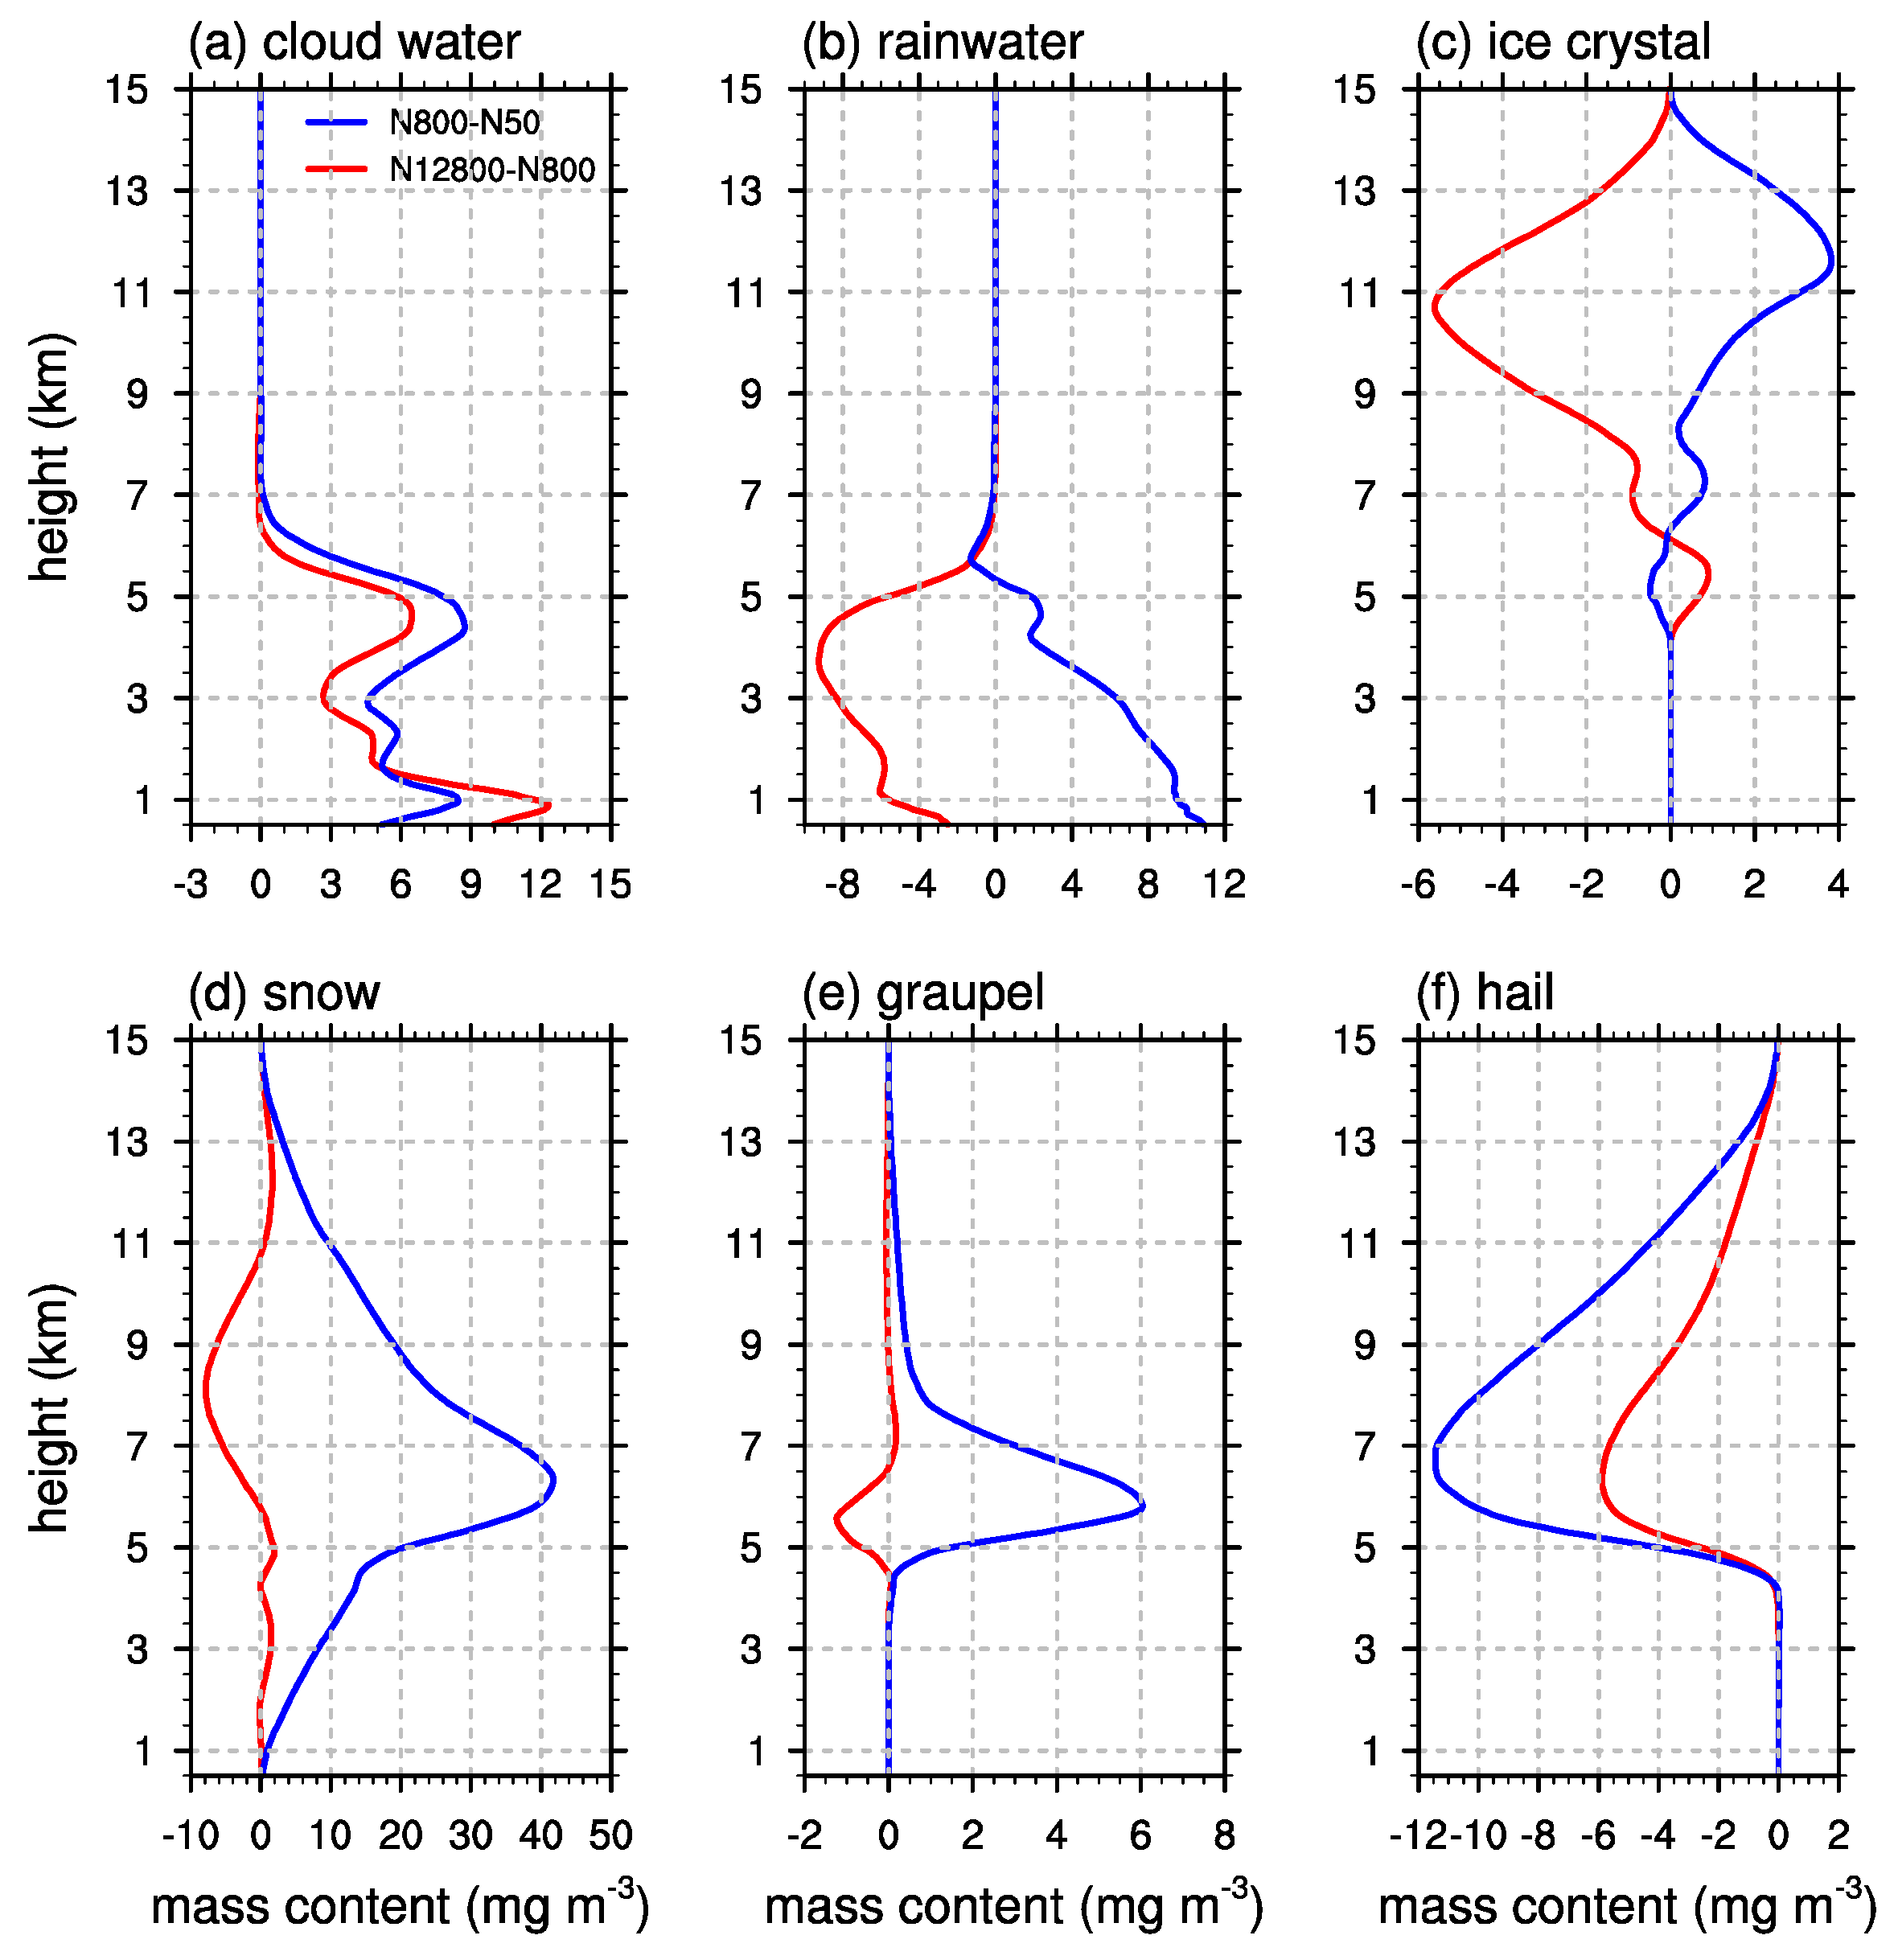
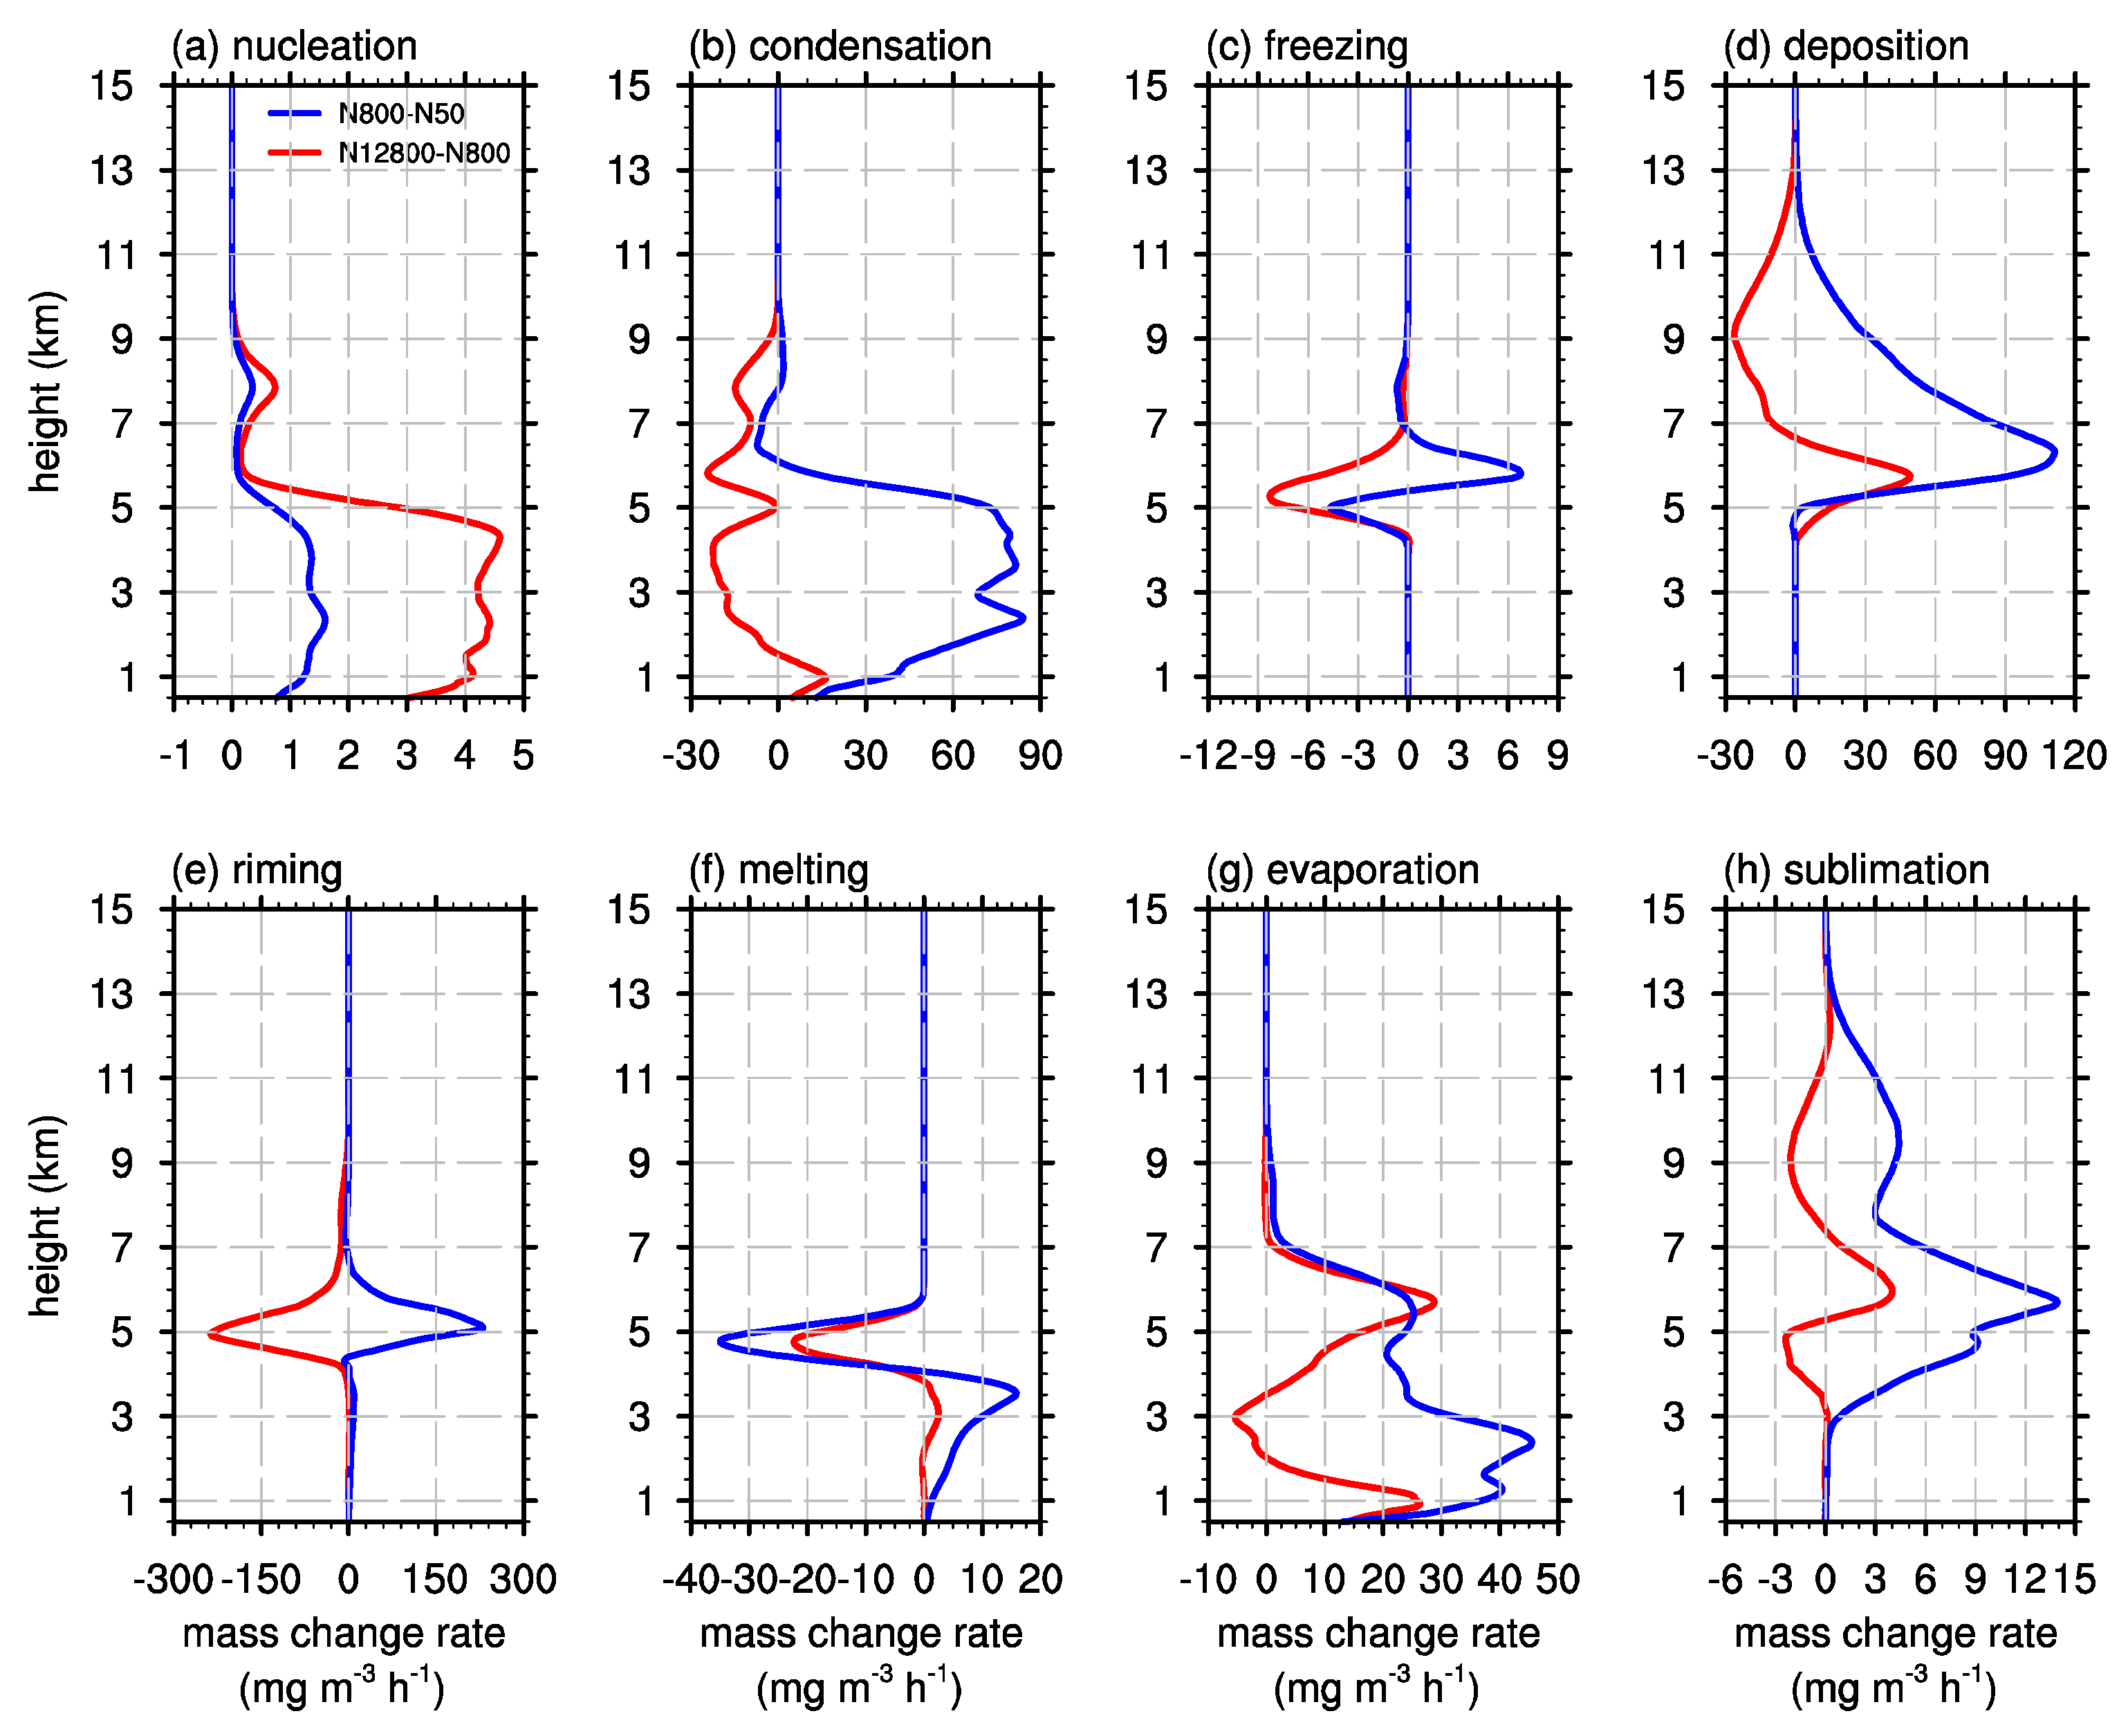
3.2. Cloud Microphysics and Precipitation
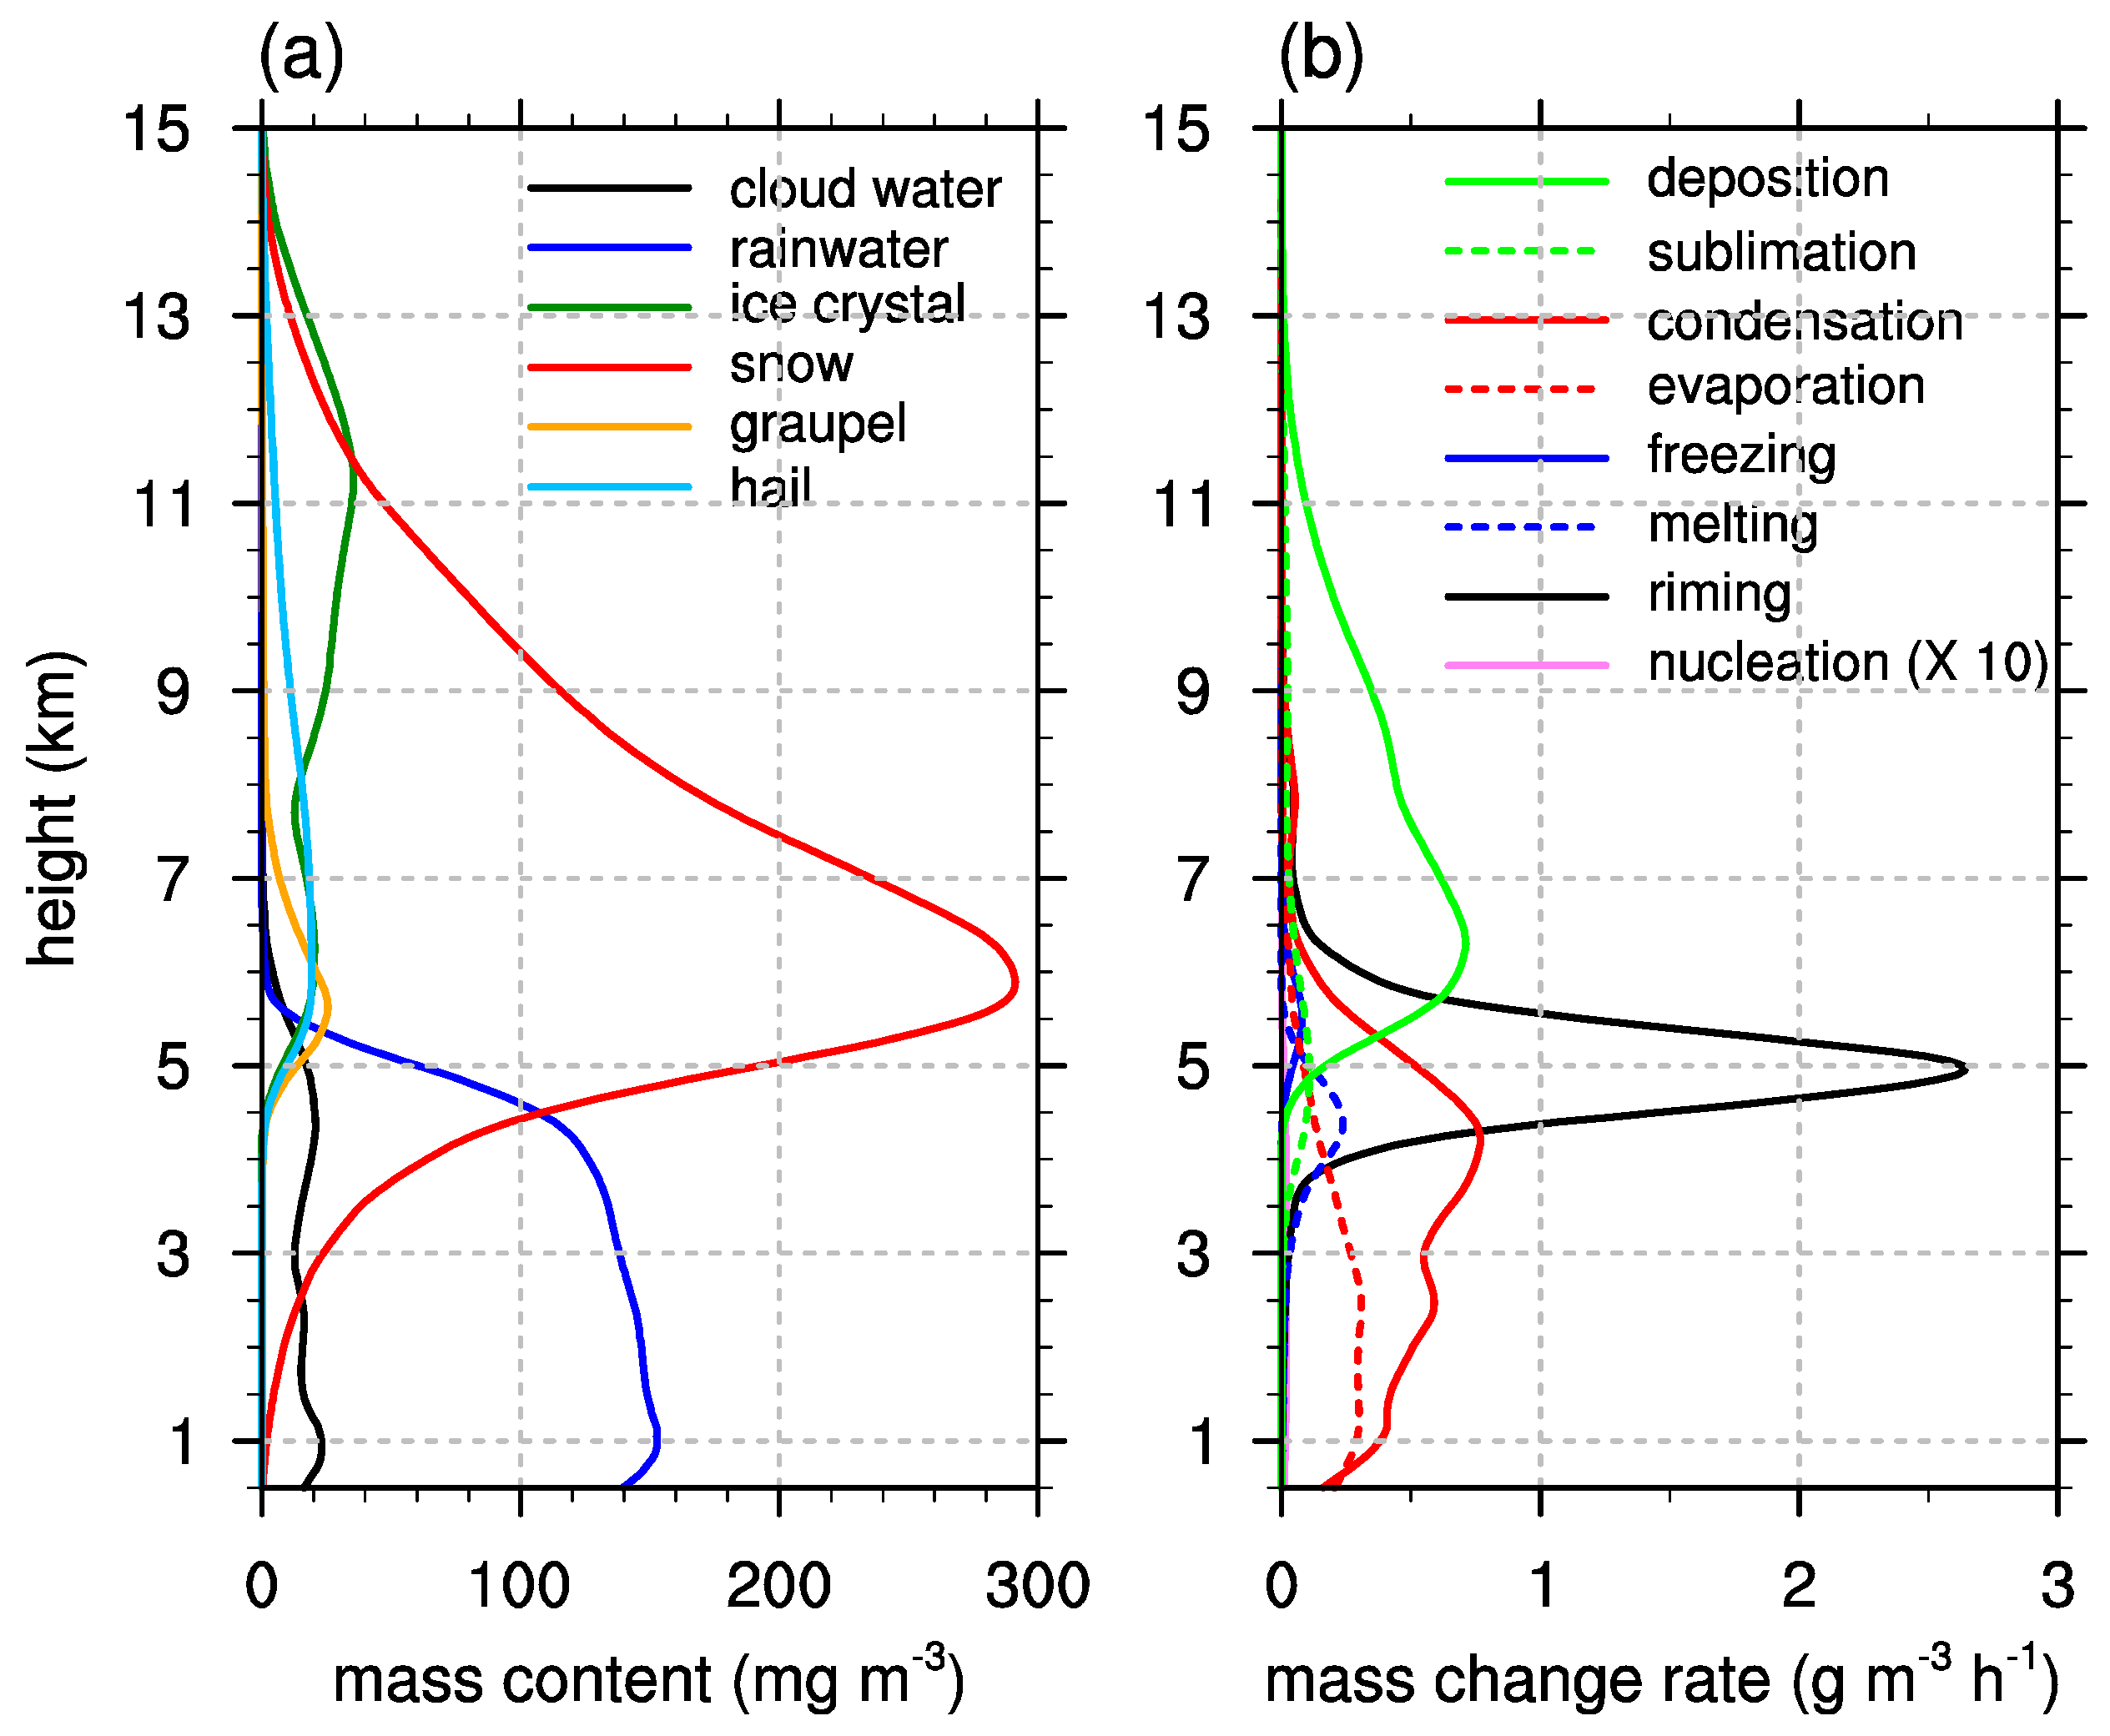
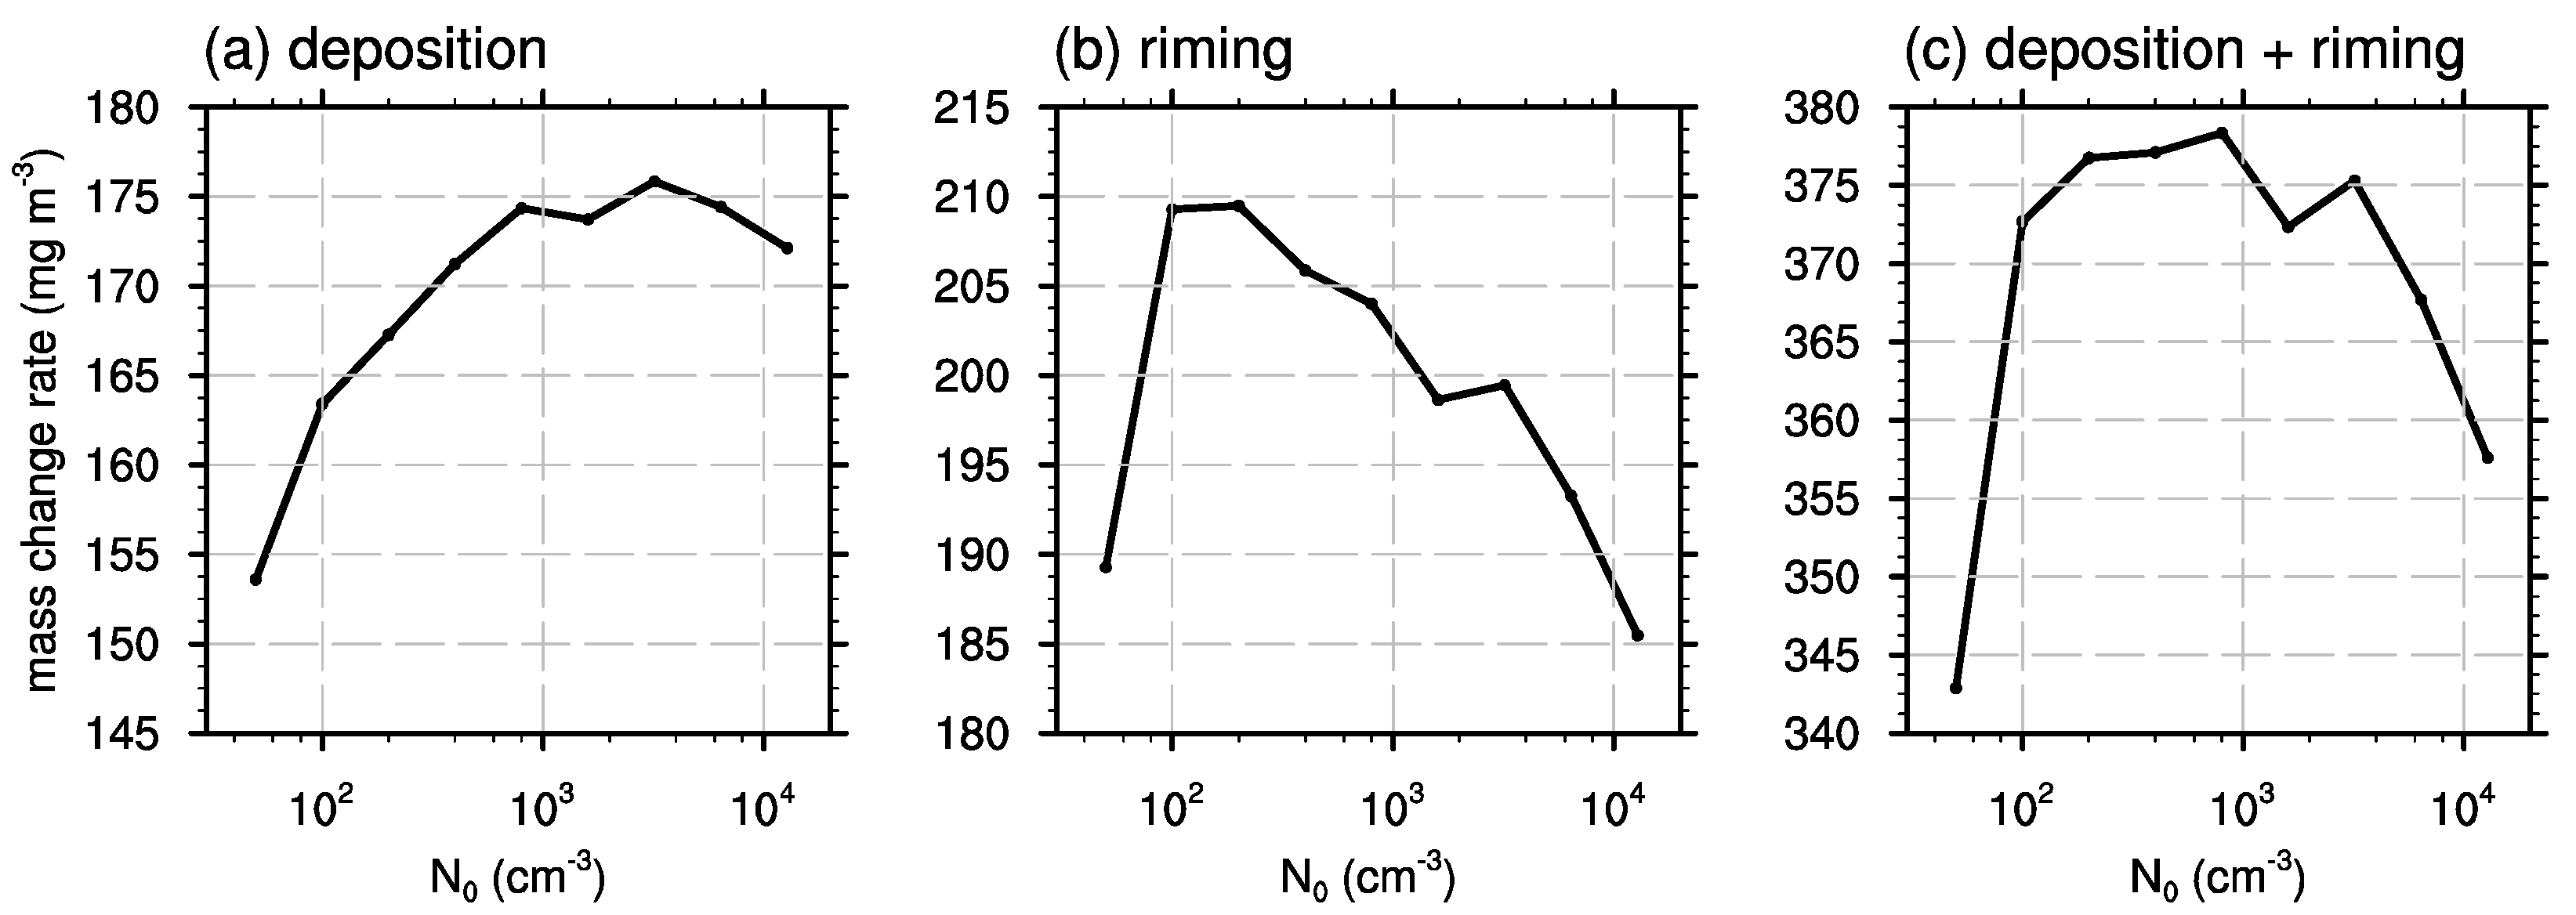
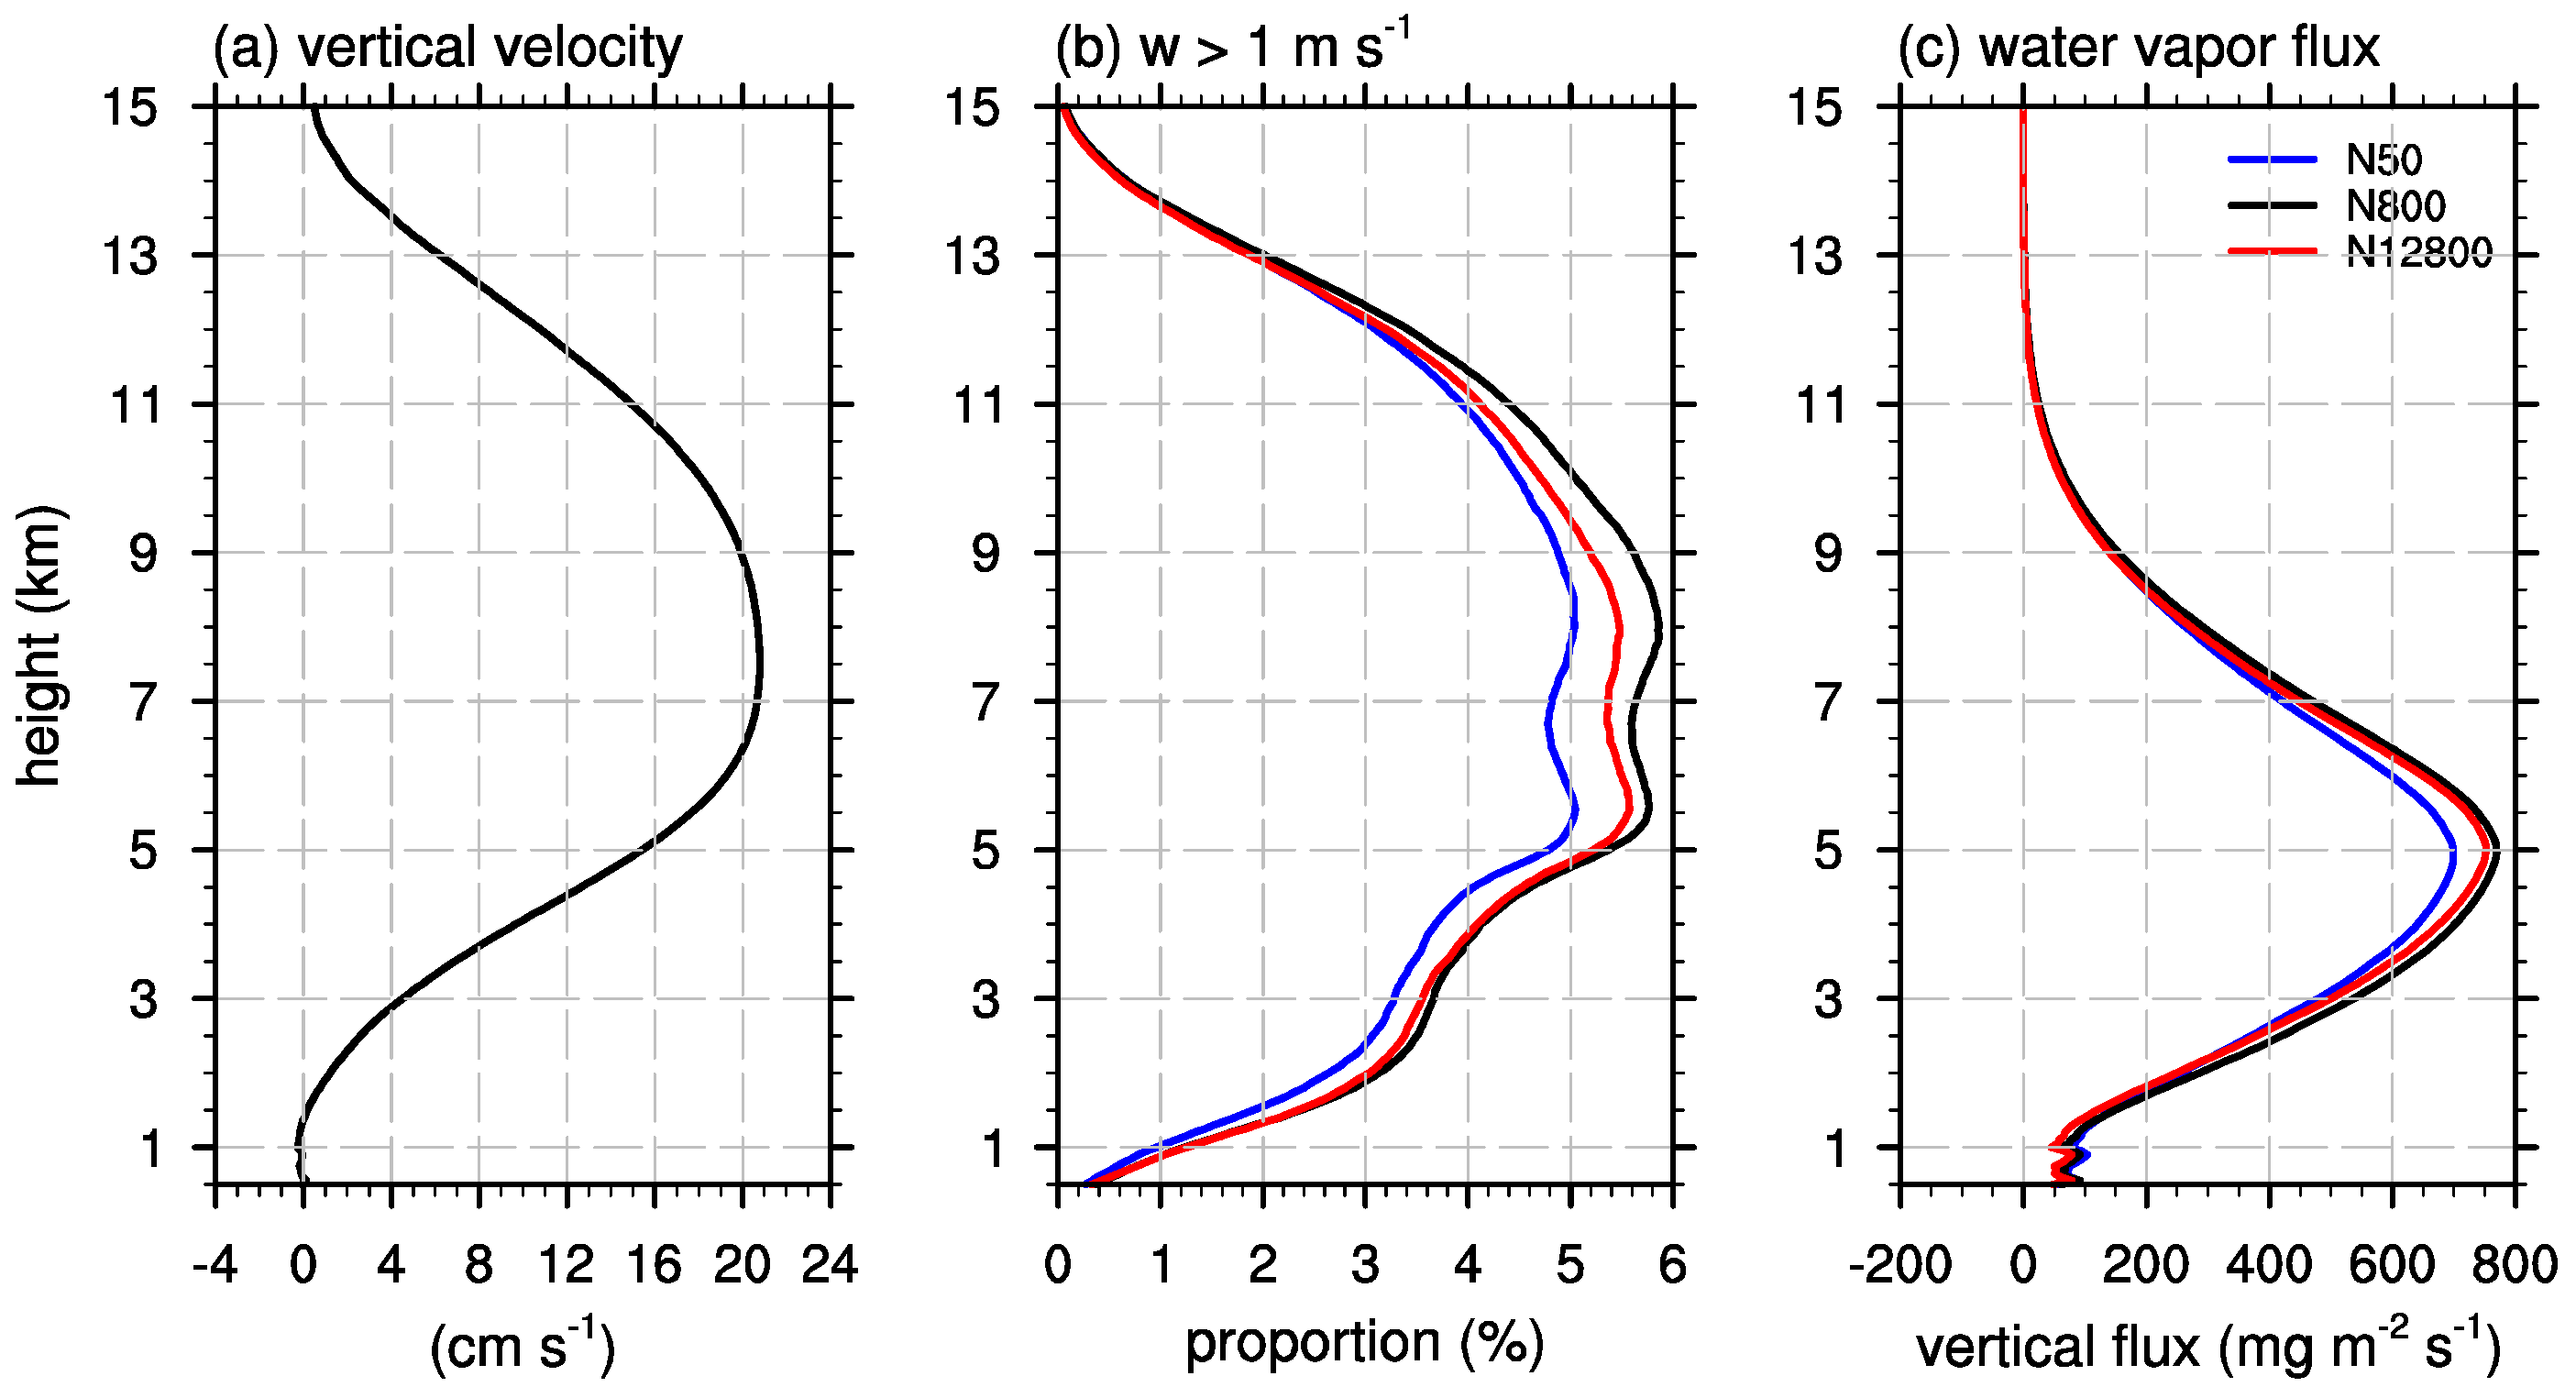
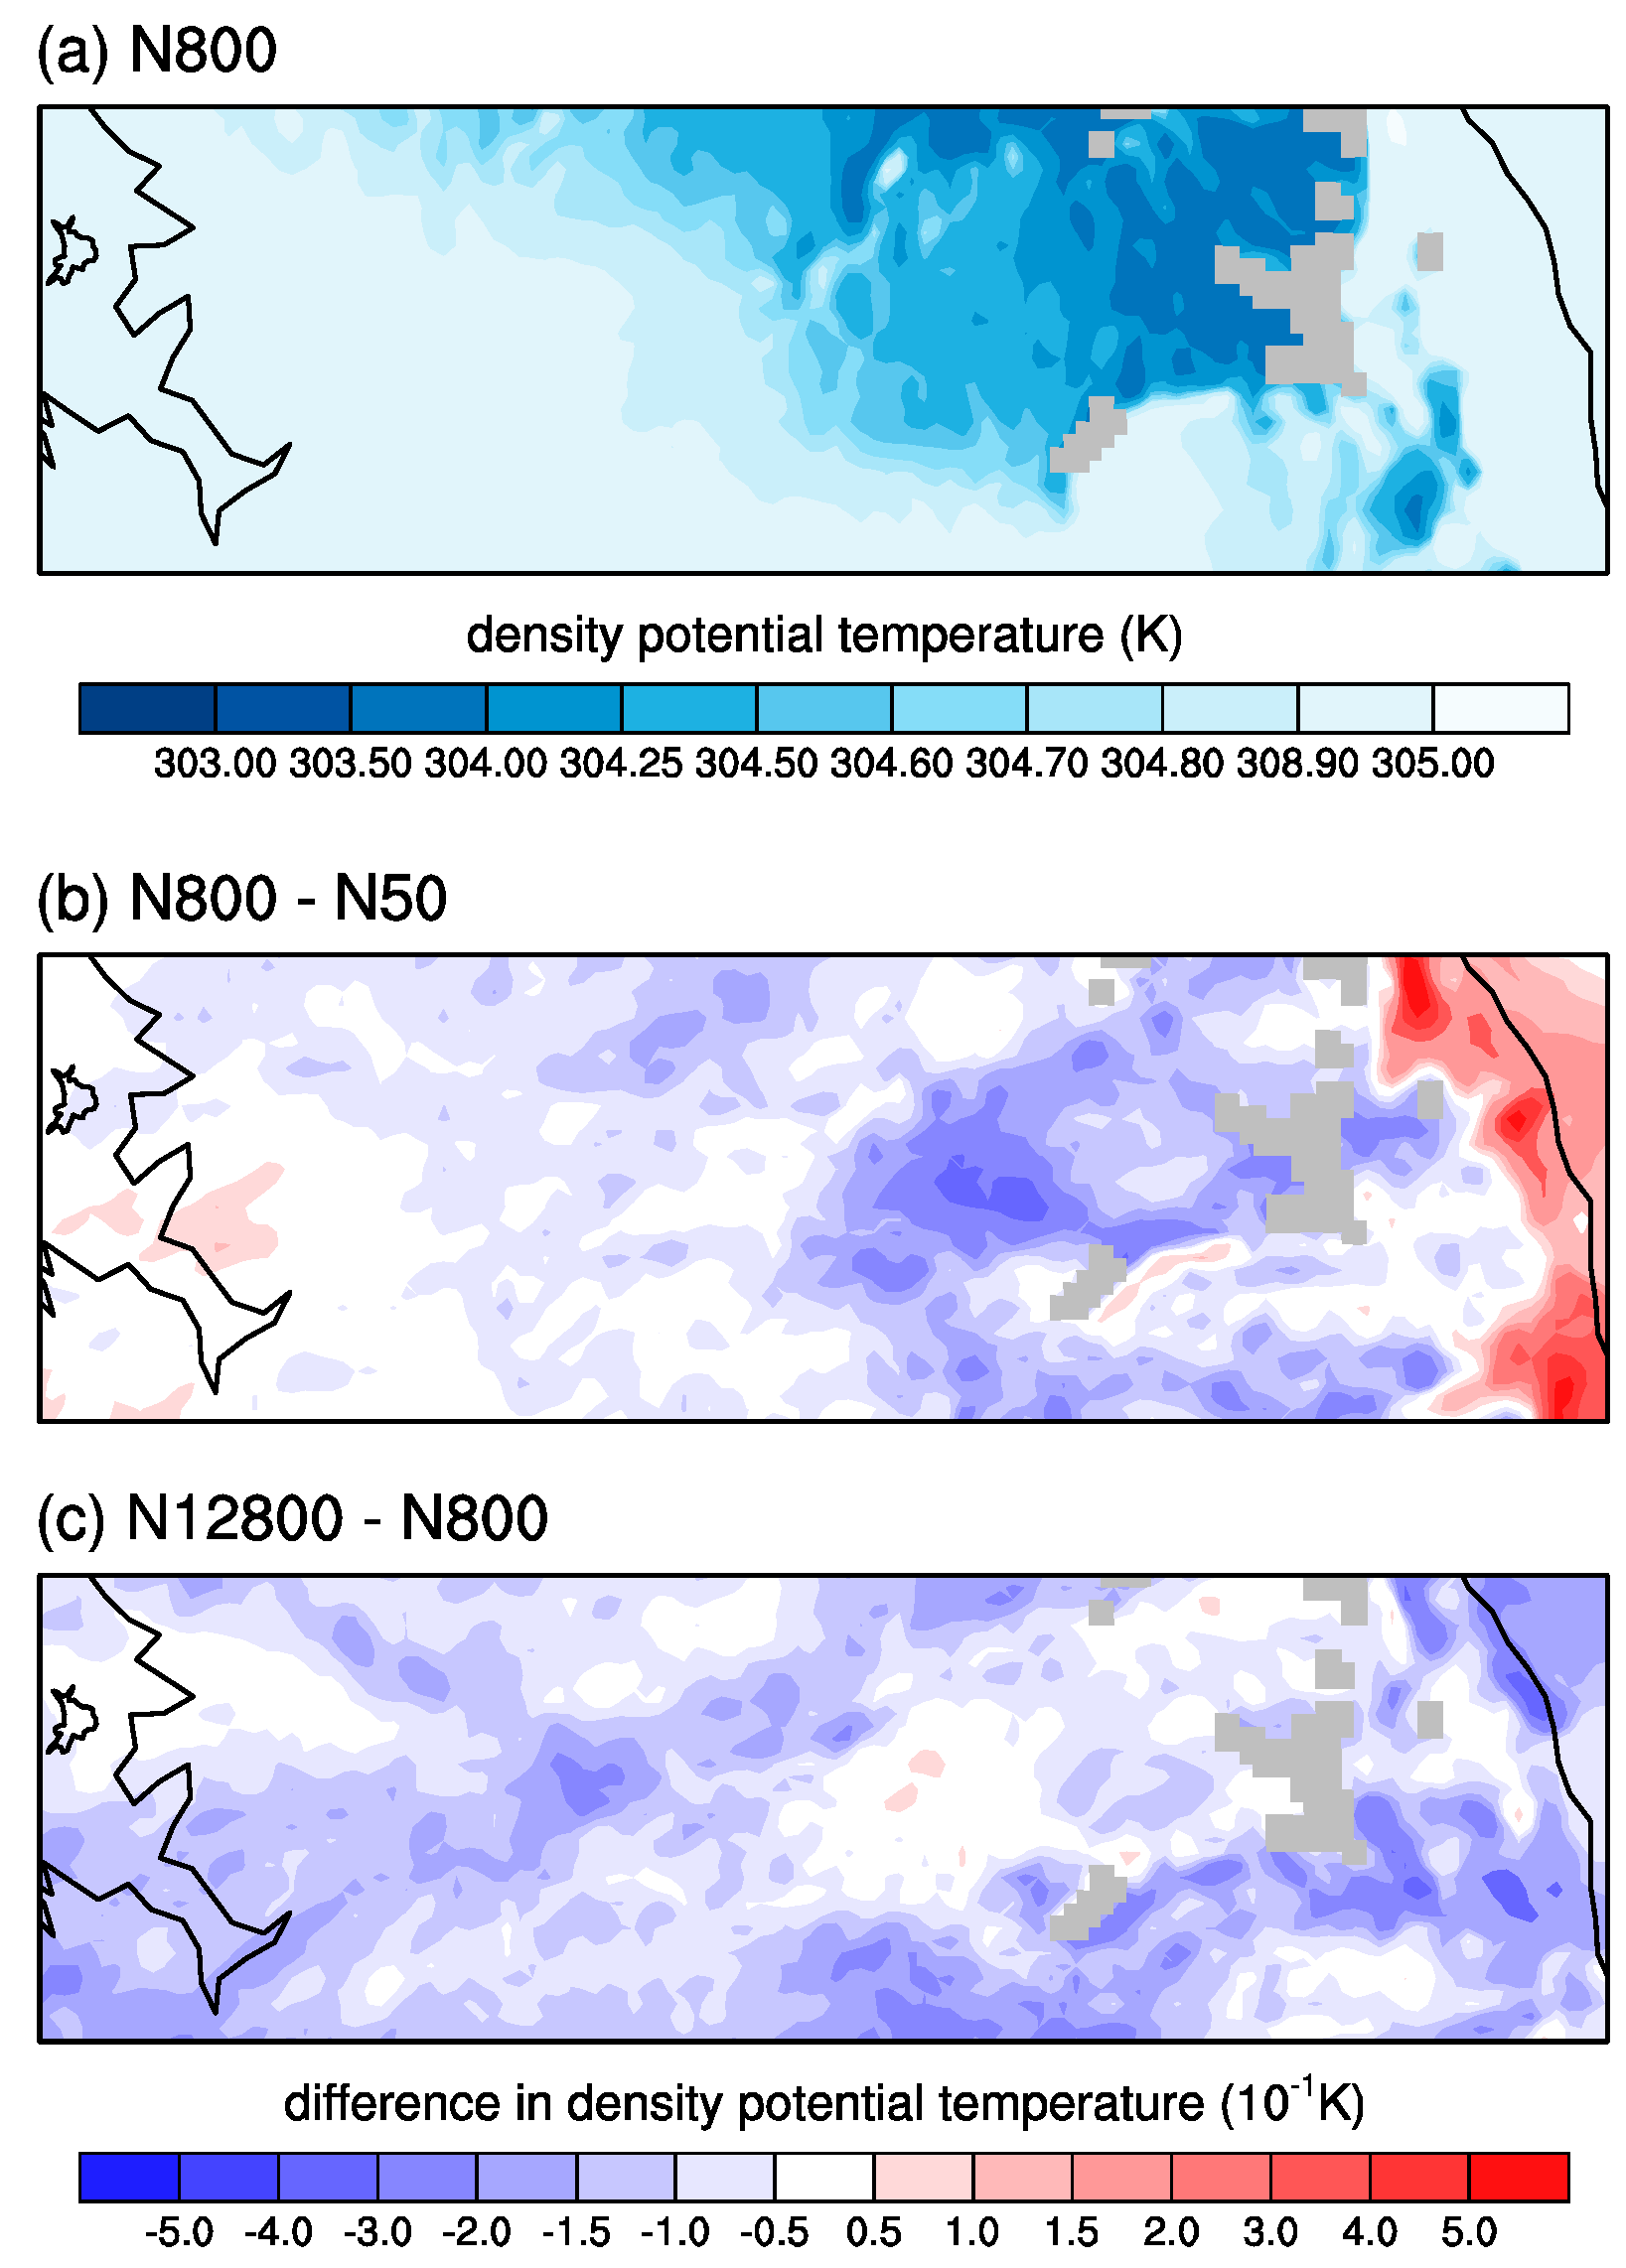
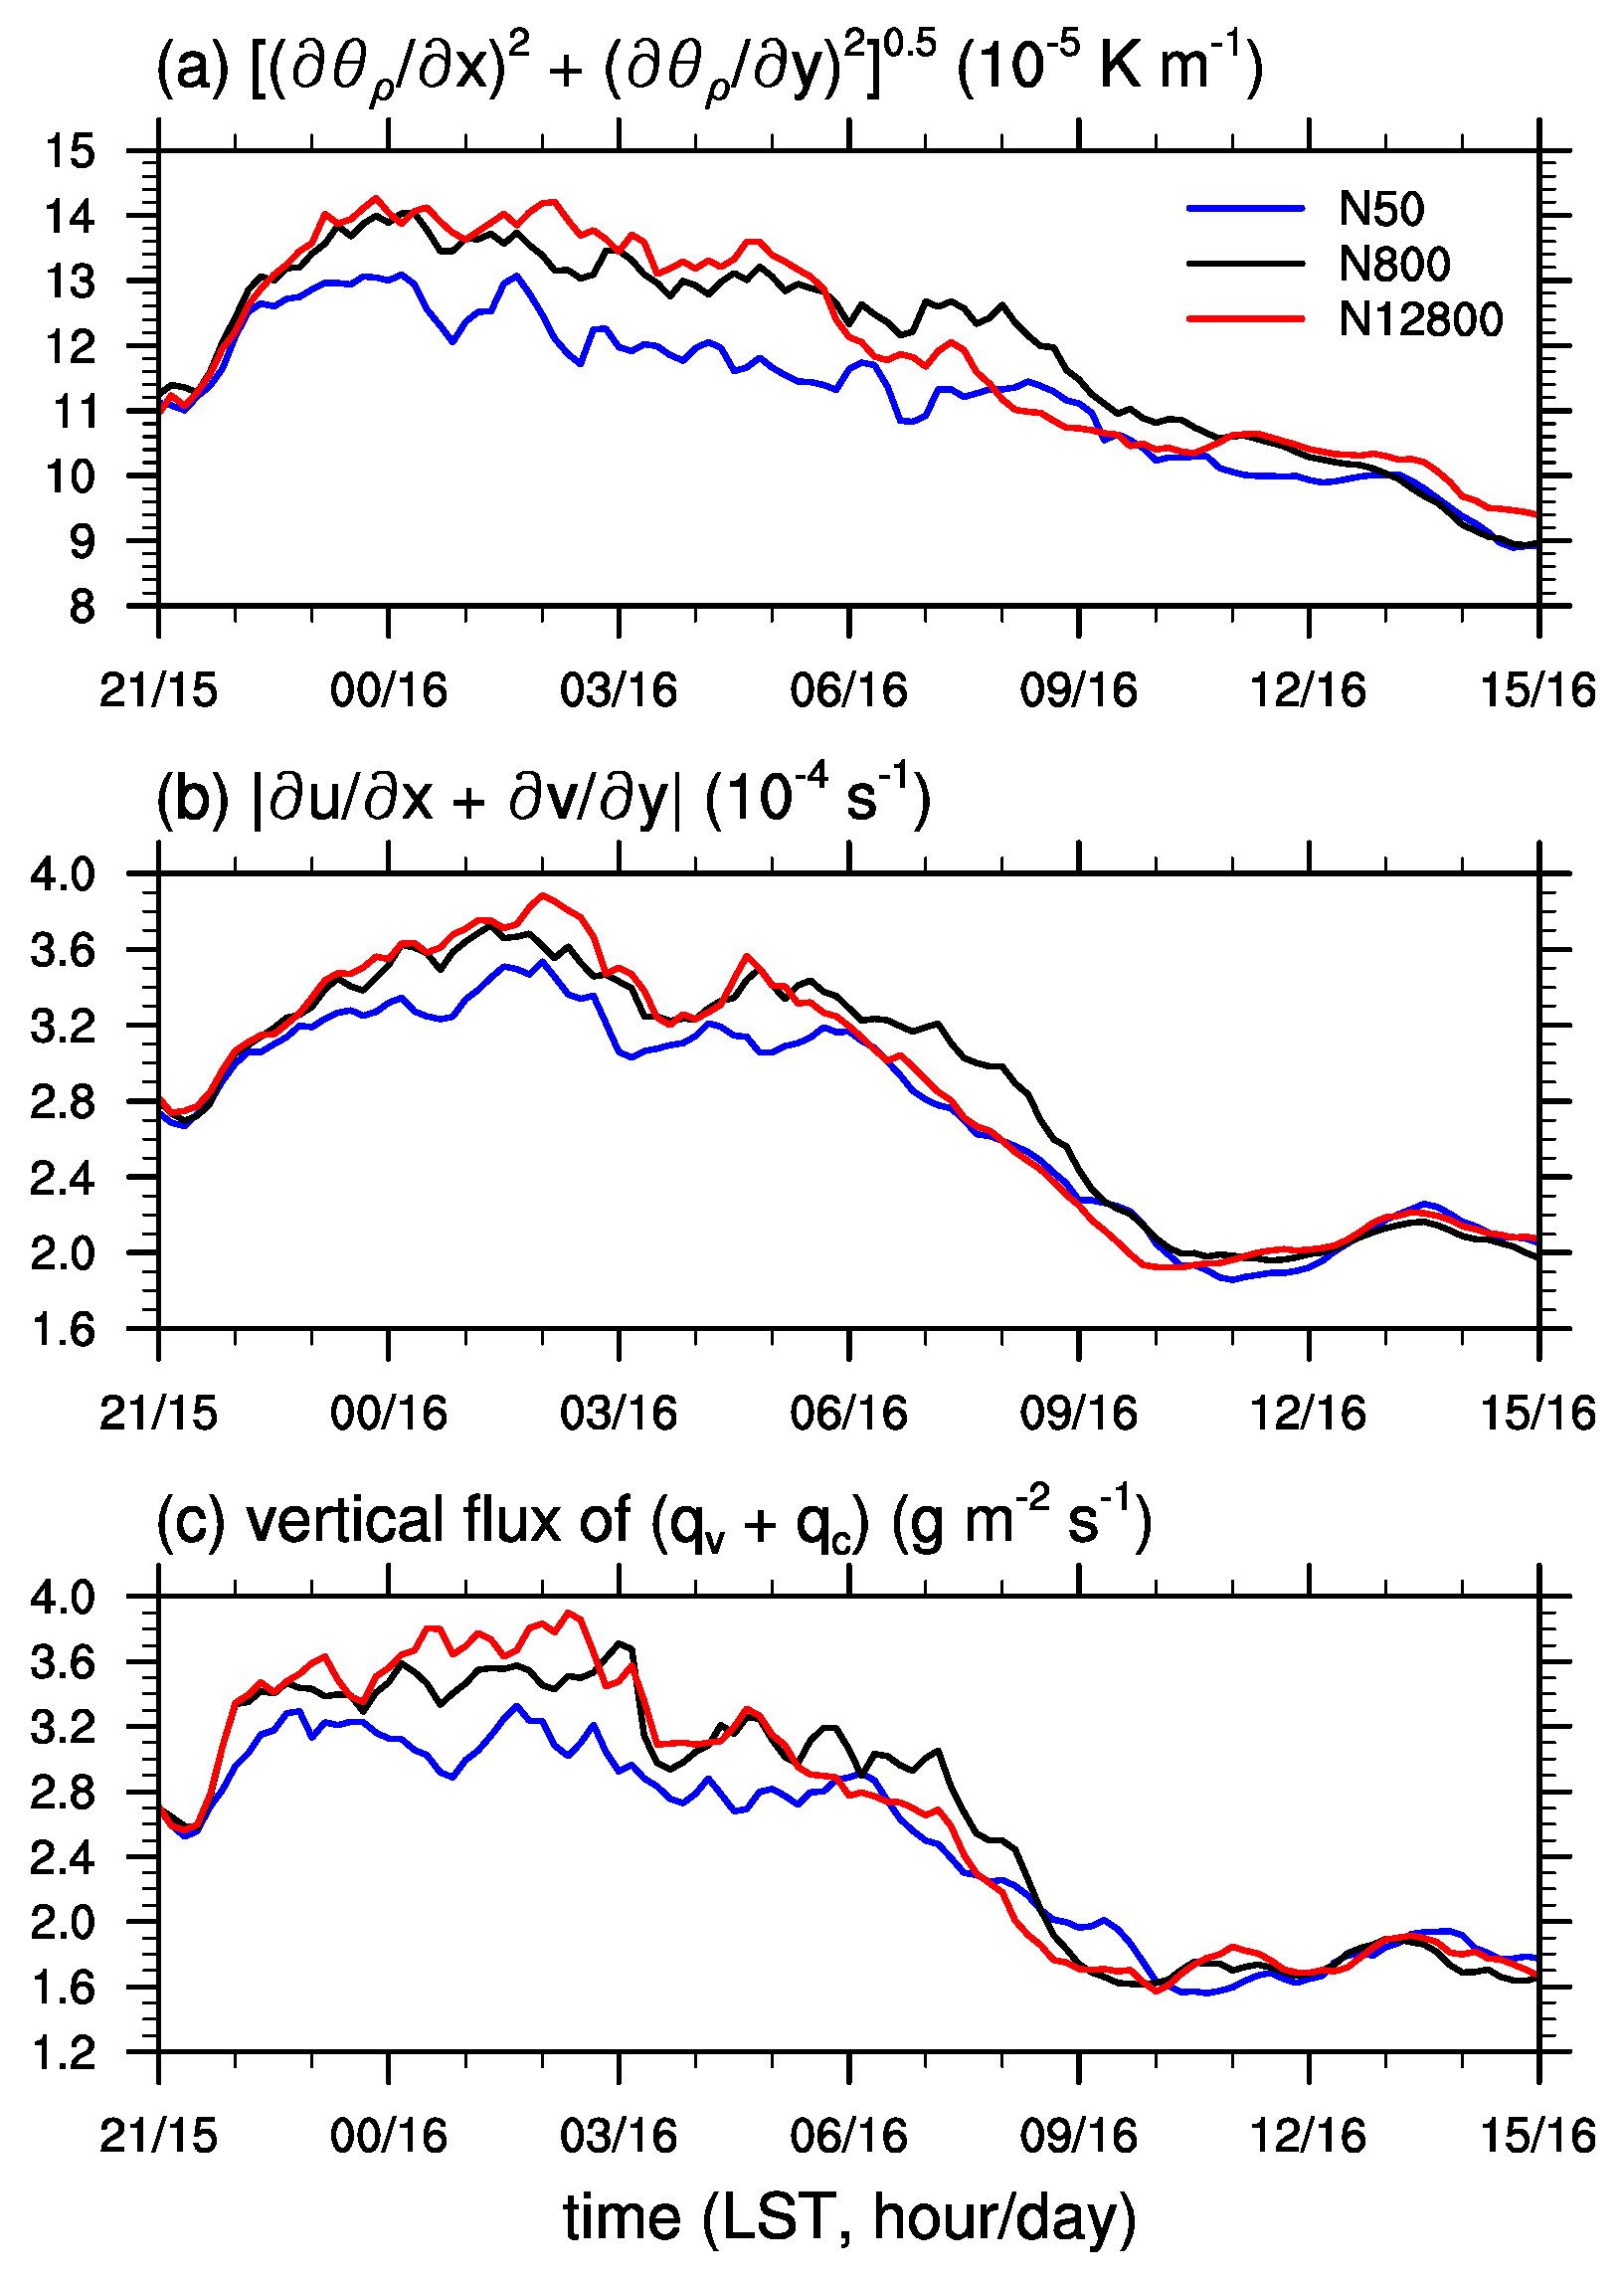
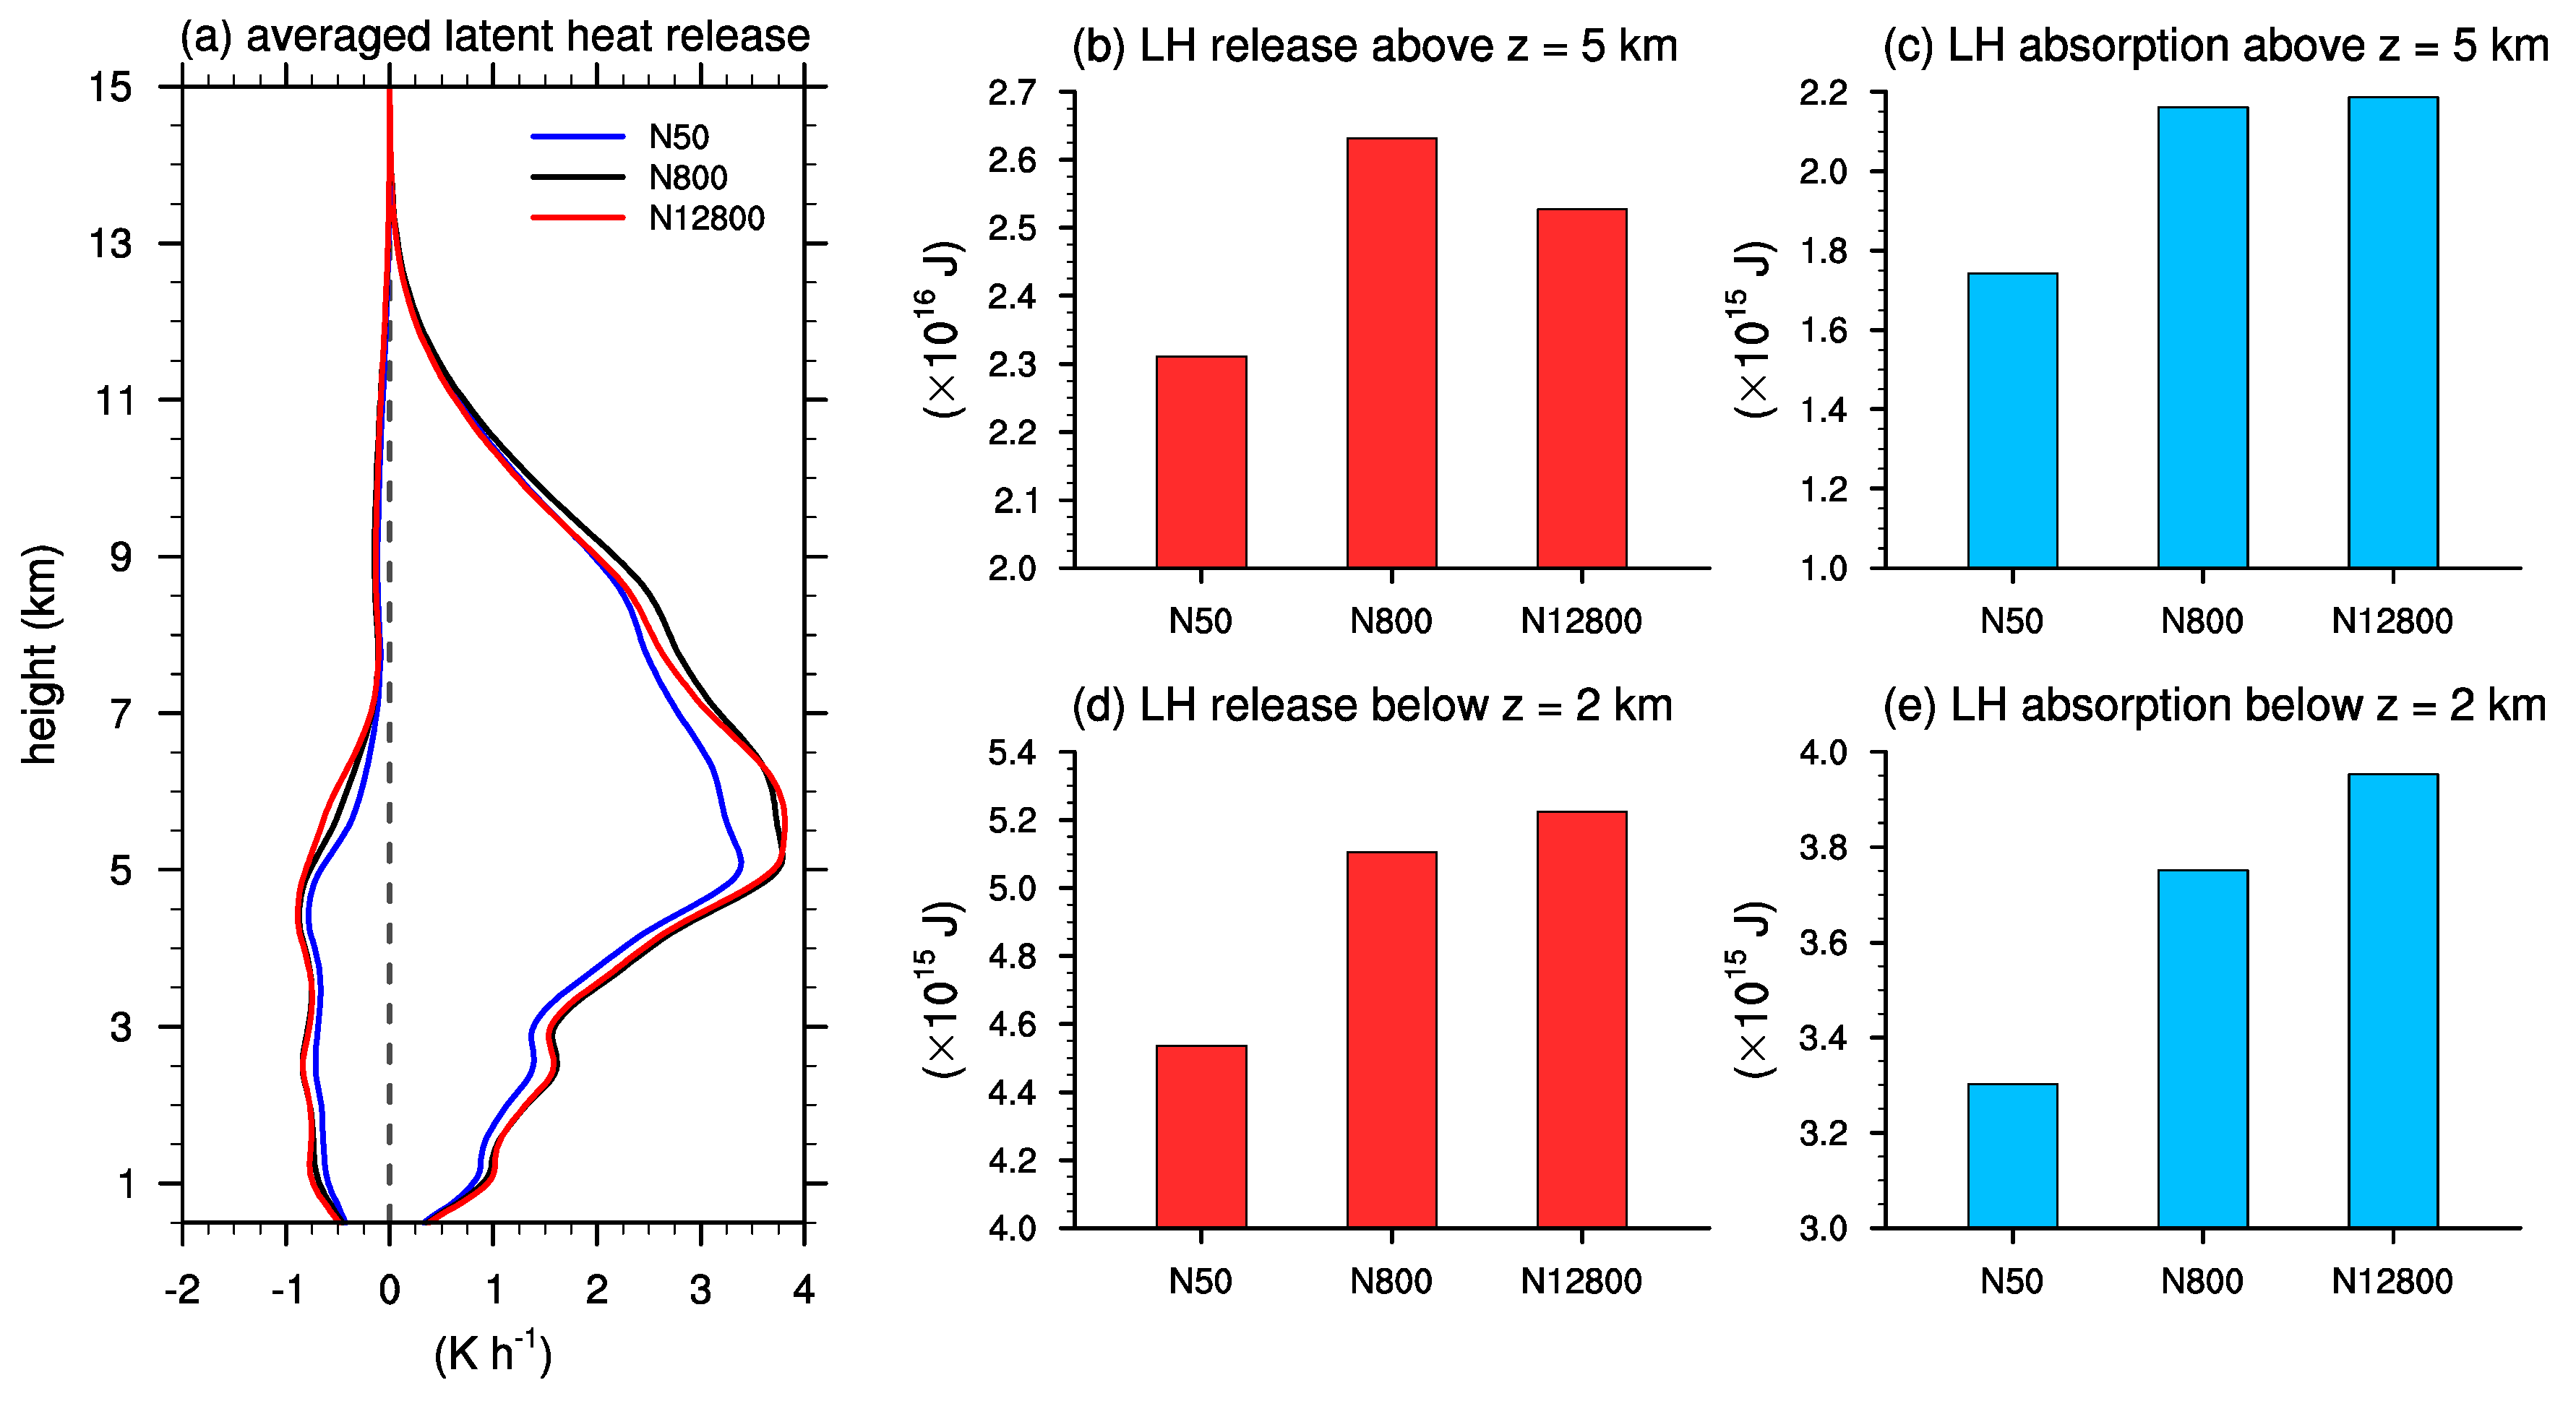
3.3. Microphysics-Dynamics Feedback
4. Summary and Discussion
Author Contributions
Funding
Acknowledgments
Conflicts of Interest
References
- Khain, A.; Rosenfeld, D.; Pokrovsky, A. Aerosol impact on the dynamics and microphysics of deep convective clouds. Q. J. R. Meteorol. Soc. 2005, 131, 2639–2663. [Google Scholar] [CrossRef]
- Lynn, B.H.; Khain, A.P.; Dudhia, J.; Rosenfeld, D.; Pokrovsky, A.; Seifert, A. Spectral (bin) microphysics coupled with a mesoscale model (MM5). Part II: Simulation of a CaPE rain event with a squall line. Mon. Weather Rev. 2005, 133, 59–71. [Google Scholar] [CrossRef]
- Tao, W.K.; Li, X.W. The relationship between latent heating, vertical velocity, and precipitation processes: The impact of aerosols on precipitation in organized deep convective systems. J. Geophys. Res. Atmos. 2016, 121, 6299–6320. [Google Scholar] [CrossRef]
- Khain, A.; Lynn, B.; Dudhia, J. Aerosol effects on intensity of landfalling hurricanes as seen from simulations with the WRF model with spectral bin microphysics. J. Atmos. Sci. 2010, 67, 365–384. [Google Scholar] [CrossRef]
- Lynn, B.H.; Khain, A.P.; Bao, J.W.; Michelson, S.A.; Yuan, T.; Kelman, G.; Rosenfeld, D.; Shpund, J.; Benmoshe, N. The sensitivity of hurricane Irene to aerosols and ocean coupling: Simulations with WRF spectral bin microphysics. J. Atmos. Sci. 2016, 73, 467–486. [Google Scholar] [CrossRef]
- Qu, Y.; Chen, B.J.; Ming, J.; Lynn, B.H.; Yang, M.J. Aerosol impacts on the structure, intensity, and precipitation of the landfalling typhoon Saomai (2006). J. Geophys. Res. Atmos. 2017, 122, 11825–11842. [Google Scholar] [CrossRef]
- Ilotoviz, E.; Khain, A.P.; Benmoshe, N.; Phillips, V.T.J.; Ryzhkov, A.V. Effect of aerosols on freezing drops, hail, and precipitation in a midlatitude storm. J. Atmos. Sci. 2016, 73, 109–144. [Google Scholar] [CrossRef]
- Khain, A.; Rosenfeld, D.; Pokrovsky, A.; Blahak, U.; Ryzhkov, A. The role of CCN in precipitation and hail in a mid-latitude storm as seen in simulations using a spectral (bin) microphysics model in a 2D dynamic frame. Atmos. Res. 2011, 99, 129–146. [Google Scholar] [CrossRef]
- Intergovernmental Panel on Climate Change. Climate Change 2007: The Physical Science Basis; IPCC WGI Fourth Assessment Report; Cambridge University Press: Cambridge, UK, 2007. [Google Scholar]
- Fan, J.; Zhang, R.; Li, G.; Tao, W.K. Effects of aerosols and relative humidity on cumulus clouds. J. Geophys. Res. 2007, 112, D14024. [Google Scholar] [CrossRef]
- Fan, J.; Wang, Y.; Rosenfeld, D.; Liu, X.H. Review of aerosol–cloud interactions: Mechanisms, significance, and challenges. J. Atmos. Sci. 2016, 73, 4221–4252. [Google Scholar] [CrossRef]
- Khain, A.; BenMoshe, N.; Pokrovsky, A. Factors determining the impact of aerosols on surface precipitation from clouds: An attempt at classification. J. Atmos. Sci. 2008, 65, 1721–1748. [Google Scholar] [CrossRef]
- Khain, A.; Lynn, B. Simulation of a supercell storm in clean and dirty atmosphere using weather research and forecast model with spectral bin microphysics. J. Geophys. Res. 2009, 114, D19209. [Google Scholar] [CrossRef]
- Andreae, M.O.; Rosenfeld, D.; Artaxo, P.; Costa, A.; Frank, G.; Longo, K.; Silva-Dias, M. Smoking rain clouds over the Amazon. Science 2004, 303, 1337–1342. [Google Scholar] [CrossRef] [PubMed]
- Cheng, C.T.; Wang, W.C.; Chen, J.-P. A modelling study of aerosol impacts on cloud microphysics and radiative properties. Q. J. R. Meteorol. Soc. 2007, 133, 283–297. [Google Scholar] [CrossRef]
- Rosenfeld, D. TRMM observed first direct evidence of smoke from forest fires inhibiting rainfall. Geophys. Res. Lett. 1999, 26, 3105–3108. [Google Scholar] [CrossRef]
- Rosenfeld, D.; Lohmann, U.; Raga, G.B.; O’Dowd, C.D.; Kulmala, M.; Fuzzi, S.; Reissell, A.; Andreae, M.O. Flood or drought: How do aerosols affect precipitation? Science 2008, 321, 1309–1313. [Google Scholar] [CrossRef] [PubMed]
- Lee, S.S.; Donner, L.J.; Phillips, V.T.J.; Ming, Y. Examination of aerosol effects on precipitation in deep convective clouds during the 1997 ARM summer experiment. Q. J. R. Meteorol. Soc. 2008, 134, 1201–1220. [Google Scholar] [CrossRef]
- O’Halloran, T.L.; Fuentes, J.D.; Tao, W.K.; Li, X. Sensitivity of convection to observed variation in aerosol size distributions and composition at a rural site in the southeastern United states. J. Atmos. Chem. 2015, 72, 441–454. [Google Scholar] [CrossRef]
- Fan, J.; Yuan, T.L.; Comstock, J.M.; Ghan, S.; Khain, A.P.; Leung, L.R.; Li, Z.Q.; Martins, V.J.; Ovchinnikov, M. Dominant role by vertical wind shear in regulating aerosol effects on deep convective clouds. J. Geophys. Res. Atmos. 2009, 114, D22206. [Google Scholar] [CrossRef]
- Xue, L.L.; Teller, A.; Rasmussen, R.; Geresdi, I.; Pan, Z.T.; Liu, X.D. Effects of aerosol solubility and regeneration on mixed-phase orographic clouds and precipitation. J. Atmos. Sci. 2012, 69, 1994–2010. [Google Scholar] [CrossRef]
- Fan, J.; Leung, L.R.; Li, Z.Q.; Morrison, H.; Chen, H.B.; Zhou, Y.Q.; Qian, Y.; Wang, Y. Aerosol impacts on clouds and precipitation in eastern China: Results from bin and bulk microphysics. J. Geophys. Res. 2012, 117, D00K36. [Google Scholar] [CrossRef]
- Li, Z.Q.; Niu, F.; Fan, J.; Liu, Y.G.; Rosenfeld, D.; Ding, Y. Long-term impacts of aerosols on the vertical development of clouds and precipitation. Nat. Geosci. 2011, 4, 888–894. [Google Scholar] [CrossRef]
- Fan, J.; Rosenfeld, D.; Ding, Y.; Leung, L.R.; Li, Z. Potential aerosol indirect effects on atmospheric circulation and radiative forcing through deep convection. Geophys. Res. Lett. 2012, 39, L09806. [Google Scholar] [CrossRef]
- Lebo, Z.J.; Seinfeld, J.H. Theoretical basis for convective invigoration due to increased aerosol concentration. Atmos. Chem. Phys. 2011, 11, 5407–5429. [Google Scholar] [CrossRef]
- Lebo, Z.J.; Morrison, H.; Seinfeld, J.H. Are simulated aerosol-induced effects on deep convective clouds strongly dependent on saturation adjustment? Atmos. Chem. Phys. 2012, 12, 9941–9964. [Google Scholar] [CrossRef]
- Iguchi, T.; Nakajima, T.; Khain, A.P.; Saito, K.; Takemura, T.; Suzuki, K. Modeling the influence of aerosols on cloud microphysical properties in the east Asia region using a mesoscale model coupled with a bin-based cloud microphysics scheme. J. Geophys. Res. 2008, 113, D14215. [Google Scholar] [CrossRef]
- Khain, A.P.; Beheng, K.D.; Heymsfield, A.; Korolev, A.; Krichak, S.; Levin, Z.; Pinsky, M.; Phillips, V.; Prabhakaran, T.; Teller, A.; et al. Representation of microphysical processes in cloud-resolving models: Spectral (bin) microphysics versus bulk parameterization. Rev. Geophys. 2015, 53, 247–322. [Google Scholar] [CrossRef]
- Alizadeh-Choobari, O.; Gharaylou, M. Aerosol impacts on radiative and microphysical properties of clouds and precipitation formation. Atmos. Res. 2017, 185, 53–64. [Google Scholar] [CrossRef]
- Li, G.; Wang, Y.; Zhang, R. Implementation of a two-moment bulk microphysics scheme to the WRF model to investigate aerosol-cloud interaction. J. Geophys. Res. 2008, 113, D15211. [Google Scholar] [CrossRef]
- Connolly, P.J.; Choularton, T.W.; Gallagher, M.W.; Bower, K.N.; Flynn, M.J.; Whiteway, J.A. Cloud-resolving simulations of intense tropical Hector thunderstorms: Implications for aerosol–cloud interactions. Q. J. R. Meteorol. Soc. 2006, 132, 3079–3106. [Google Scholar] [CrossRef]
- Lohmann, U.; Feichter, J. Global indirect aerosol effects: A review. Atmos. Chem. Phys. 2005, 5, 715–737. [Google Scholar] [CrossRef]
- Phillips, V.T.J.; Donner, L.J. Cloud microphysics, radiation and vertical velocities in two- and three-dimensional simulations of deep convection. Q. J. R. Meteorol. Soc. 2006, 132, 3011–3033. [Google Scholar] [CrossRef]
- NCEP GDAS/FNL 0.25-Degree Global Tropospheric Analyses and Forecast Grids. Available online: https://doi.org/10.5065/D65Q4T4Z (accessed on 16 August 2017).
- Skamarock, W.C.; Klemp, J.B.; Dudhia, J.; Gill, D.O.; Barker, D.M.; Duda, M.G.; Huang, X.Y.; Wang, W.; Powers, J.G. A Description of the Advanced Research WRF Version 3; Mesoscale and Microscale Meteorology Division in National Center for Atmospheric Research: Boulder, CO, USA, 2008. [Google Scholar]
- Lee, H.; Baik, J.J. Effects of turbulence-induced collision enhancement on heavy precipitation: The 21 September 2010 case over the Korean Peninsula. J. Geophys. Res. Atmos. 2016, 121, 12319–12342. [Google Scholar] [CrossRef]
- Lkhamjav, J.; Lee, H.; Jeon, Y.L.; Baik, J.-J. Examination of an improved quasi-stochastic model for the collisional growth of drops. J. Geophys. Res. Atmos. 2017, 122, 1713–1724. [Google Scholar] [CrossRef]
- Biggs, E.K. The formation of atmospheric ice crystals by the freezing of droplets. Q. J. R. Meteorol. Soc. 1953, 79, 510–519. [Google Scholar] [CrossRef]
- Meyers, M.P.; DeMott, P.J.; Cotton, W.R. New primary ice-nucleation parameterization in an explicit cloud model. J. Appl. Meteorol. 1992, 31, 708–721. [Google Scholar] [CrossRef]
- Phillips, V.T.J.; Pokrovsky, A.; Khain, A. The influence of time-dependent melting on the dynamics and precipitation production in maritime and continental storm clouds. J. Atmos. Sci. 2007, 64, 338–359. [Google Scholar] [CrossRef]
- Hong, S.-Y.; Noh, Y.; Dudhia, J. A new vertical diffusion package with an explicit treatment of entrainment processes. Mon. Weather Rev. 2006, 134, 2318–2341. [Google Scholar] [CrossRef]
- Dudhia, J. Numerical study of convection observed during the winter monsoon experiment using a mesoscale two-dimensional model. J. Atmos. Sci. 1989, 46, 3077–3107. [Google Scholar] [CrossRef]
- Mlawer, E.J.; Taubman, S.J.; Brown, P.D.; Iacono, M.J.; Clough, S.A. Radiative transfer for inhomogeneous atmospheres: RRTM, a validated correlated-k model for the longwave. J. Geophys. Res. 1997, 102, 16663–16682. [Google Scholar] [CrossRef]
- Tewari, M.; Chen, F.; Wang, W.; Dudhia, J.; LeMone, M.; Mitchell, K.; Ek, M.; Gayno, G.; Wegiel, J.; Cuenca, R. Implementation and verification of the unified NOAH land surface model in the WRF model. In Proceedings of the 20th Conference on Weather Analysis and Forecasting, Washington, DC, USA, 10–15 January 2004; In Proceedings of the 16th Conference on Numerical Weather Prediction, American Meteorological Society, Seattle, WA, USA, 10–15 January 2004. [Google Scholar]
- Kain, J.S. The Kain-Fritsch convective parameterization: An update. J. Appl. Meteorol. 2004, 43, 170–181. [Google Scholar] [CrossRef]
- Twomey, S. The nuclei of natural cloud formation part II: The supersaturation in natural clouds and the variation of cloud droplet concentration. Pure Appl. Geophys. 1959, 43, 243–249. [Google Scholar] [CrossRef]
- Köhler, H. The nucleus in and the growth of hygroscopic droplets. Trans. Faraday Soc. 1936, 32, 1152–1161. [Google Scholar] [CrossRef]
- Khain, A.P.; Ovtchinnikov, M.; Pinsky, M.; Pokrovsky, A.; Krugliak, H. Notes on the state-of-the-art numerical modeling of cloud microphysics. Atmos. Res. 2000, 55, 159–224. [Google Scholar] [CrossRef]
- Lee, H.; Baik, J.-J.; Han, J.-Y. Effects of turbulence on mixed-phase deep convective clouds under different basic-state winds and aerosol concentrations. J. Geophys. Res. Atmos. 2014, 119, 13506–13525. [Google Scholar] [CrossRef]
- Clark, T.L. A study in cloud phase parameterization using the gamma distribution. J. Atmos. Sci. 1974, 31, 142–155. [Google Scholar] [CrossRef]
- Ackerman, A.S.; Kirkpatrick, M.P.; Stevens, D.E.; Toon, O.B. The impact of humidity above stratiform clouds on indirect aerosol climate forcing. Nature 2004, 432, 1014–1017. [Google Scholar] [CrossRef] [PubMed]
- Rémillard, J.; Fridlind, A.M.; Ackerman, A.S.; Tselioudis, G.; Kollias, P.; Mechem, D.B.; Chandler, H.E.; Luke, E.; Wood, R.; Witte, M.K.; et al. Use of cloud radar Doppler spectra to evaluate stratocumulus drizzle size distributions in large-eddy simulations with size-resolved microphysics. J. Appl. Meteorol. Climatol. 2017, 56, 3263–3283. [Google Scholar] [CrossRef]
- Jiang, Q.; Wang, S. Aerosol replenishment and cloud morphology: A VOCALS example. J. Atmos. Sci. 2014, 71, 300–311. [Google Scholar] [CrossRef]
- Gayatri, K.; Patade, S.; Prabha, T.V. Aerosol–cloud interaction in deep convective clouds over the Indian peninsula using spectral (bin) microphysics. J. Atmos. Sci. 2017, 74, 3145–3166. [Google Scholar] [CrossRef]
- Park, S.Y.; Lee, H.J.; Kang, J.E.; Lee, T.; Kim, C.H. Aerosol radiative effects on mesoscale cloud–precipitation variables over Northeast Asia during the MAPS-Seoul 2015 campaign. Atmos. Environ. 2018, 172, 109–123. [Google Scholar] [CrossRef]
- Qian, Y.; Giorgi, F. Regional climatic effects of anthropogenic aerosols? The case of Southwestern China. Geophys. Res. Lett. 2000, 27, 3521–3524. [Google Scholar] [CrossRef]
- Wang, F.; Chen, Y.; Meng, X.; Fu, J.; Wang, B. The contribution of anthropogenic sources to the aerosols over East China Sea. Atmos. Environ. 2016, 127, 22–33. [Google Scholar] [CrossRef]
- Schmale, J.; Henning, S.; Decesari, S.; Henzing, B.; Keskinen, H.; Sellegri, K.; Ovadnevaite, J.; Pöhlker, M.L.; Brito, J.; Bougiatioti, A.; et al. Long-term cloud condensation nuclei number concentration, particle number size distribution and chemical composition measurements at regionally representative observatories. Atmos. Chem. Phys. 2018, 18, 2853–2881. [Google Scholar] [CrossRef]
- Chen, Q.; Koren, I.; Altaratz, O.; Heiblum, R.H.; Dagan, G.; Pinto, L. How do changes in warm-phase microphysics affect deep convective clouds? Atmos. Chem. Phys. 2017, 17, 9585–9598. [Google Scholar] [CrossRef]
- Kaufman, Y.J.; Nakajima, T. Effect of Amazon smoke on cloud microphysics and albedo-analysis from satellite imagery. J. Appl. Meteorol. 1993, 32, 729–744. [Google Scholar] [CrossRef]
- Ramanathan, V.; Crutzen, P.J.; Kiehl, J.T.; Rosenfeld, D. Aerosols, climate, and the hydrological cycle. Science 2001, 294, 2119–2124. [Google Scholar] [CrossRef] [PubMed]
- Rosenfeld, D.; Lensky, I.M. Satellite-based insights into precipitation formation processes in continental and maritime convective clouds. Bull. Am. Meteorol. Soc. 1998, 79, 2457–2476. [Google Scholar] [CrossRef]
- Cui, Z.; Davies, S.; Carslaw, K.S.; Blyth, A.M. The response of precipitation to aerosol through riming and melting in deep convective clouds. Atmos. Chem. Phys. 2011, 11, 3495–3510. [Google Scholar] [CrossRef]
- Dagan, G.; Koren, I.; Altaratz, O.; Heiblum, R.H. Time-dependent, non-monotonic response of warm convective cloud fields to changes in aerosol loading. Atmos. Chem. Phys. 2017, 17, 7435–7444. [Google Scholar] [CrossRef]
- Emanuel, K.A. Atmospheric Convection; Oxford University Press: New York, NY, USA; Oxford, UK, 1994. [Google Scholar]
- Grant, L.D.; van den Heever, S.C. Cold pool and precipitation responses to aerosol loading: Modulation by dry layers. J. Atmos. Sci. 2015, 72, 1398–1408. [Google Scholar] [CrossRef]
- Fan, J.; Rosenfeld, D.; Yang, Y.; Zhao, C.; Leung, L.R.; Li, Z.Q. Substantial contribution of anthropogenic air pollution to catastrophic floods in Southwest China. Geophys. Res. Lett. 2015, 42, 6066–6075. [Google Scholar] [CrossRef]


| Domain 1 | Domain 2 | Domain 3 | |
|---|---|---|---|
| horizontal grid size (km) | 18 | 6 | 2 |
| horizontal grid number | 218 × 218 | 280 × 280 | 190 × 145 |
| vertical grid number | 39 | ||
| time step (s) | 54 | 18 | 6 |
| planetary boundary layer | Yonsei University Scheme [41] | ||
| shortwave radiation | Dudhia scheme [42] | ||
| longwave radiation | Rapid radiative transfer model [43] | ||
| land surface | Unified Noah land surface model [44] | ||
| subgrid-scale cumulus | Kain–Fritsch scheme [45] | none | |
| microphysics | Bin microphysics [36] | ||
| initial/boundary conditions | NCEP FNL 0.25 degree analysis [34] | ||
© 2018 by the authors. Licensee MDPI, Basel, Switzerland. This article is an open access article distributed under the terms and conditions of the Creative Commons Attribution (CC BY) license (http://creativecommons.org/licenses/by/4.0/).
Share and Cite
Jeon, Y.-L.; Moon, S.; Lee, H.; Baik, J.-J.; Lkhamjav, J. Non-Monotonic Dependencies of Cloud Microphysics and Precipitation on Aerosol Loading in Deep Convective Clouds: A Case Study Using the WRF Model with Bin Microphysics. Atmosphere 2018, 9, 434. https://doi.org/10.3390/atmos9110434
Jeon Y-L, Moon S, Lee H, Baik J-J, Lkhamjav J. Non-Monotonic Dependencies of Cloud Microphysics and Precipitation on Aerosol Loading in Deep Convective Clouds: A Case Study Using the WRF Model with Bin Microphysics. Atmosphere. 2018; 9(11):434. https://doi.org/10.3390/atmos9110434
Chicago/Turabian StyleJeon, Ye-Lim, Sungju Moon, Hyunho Lee, Jong-Jin Baik, and Jambajamts Lkhamjav. 2018. "Non-Monotonic Dependencies of Cloud Microphysics and Precipitation on Aerosol Loading in Deep Convective Clouds: A Case Study Using the WRF Model with Bin Microphysics" Atmosphere 9, no. 11: 434. https://doi.org/10.3390/atmos9110434
APA StyleJeon, Y.-L., Moon, S., Lee, H., Baik, J.-J., & Lkhamjav, J. (2018). Non-Monotonic Dependencies of Cloud Microphysics and Precipitation on Aerosol Loading in Deep Convective Clouds: A Case Study Using the WRF Model with Bin Microphysics. Atmosphere, 9(11), 434. https://doi.org/10.3390/atmos9110434