Article

Multi-Technique Characterization of Atmospheric Aerosol Particles from the Coastal Area of Jeddah, Saudi Arabia: Morphology, Surface Chemistry, and Mineralogy


by
Fahed A. Aloufi
and
Riyadh F. Halawani
*
Department of Environment, Faculty of Environmental Sciences, King Abdulaziz University, Jeddah 21589, Saudi Arabia
*
Author to whom correspondence should be addressed.
Atmosphere 2026, 17(9), 830; https://doi.org/10.3390/atmos17090830
Submission received: 13 June 2026 / Revised: 5 August 2026 / Accepted: 12 August 2026 / Published: 26 August 2026
(This article belongs to the Section Aerosols)

Abstract

This study reports a combined morphological, surface chemical, and mineralogical characterization of fine particulate matter (PM2.5) collected at three coastal sites—Northern (Abhour), Middle (Alhamraa), and Southern (Alkhomra)—in Jeddah, Saudi Arabia, during the summer (15 June–15 September 2017). The work complements a companion trace-element study of the same campaign by adding scanning electron microscopy (SEM), energy-dispersive X-ray spectroscopy (EDS/EDX mapping), X-ray photoelectron spectroscopy (XPS), and X-ray diffraction (XRD), thereby linking bulk concentrations to particle morphology, surface oxidation state, and crystalline phase. Mean PM2.5 concentrations were 22.2, 18.9, and 14.2 µg m−3 at the North, Middle, and South sites, respectively. Because samples were collected on borosilicate glass-fibre filters, the SEM images are dominated by the intrinsic fibrous matrix of the substrate; the collected aerosol is resolved as discrete sub-micrometre particles and agglomerates decorating the fibres, and the morphological interpretation is framed accordingly. XPS confirmed that surface metals (Fe, Al, Ca, and traces of Pb, Cu, Zn) occur predominantly in oxidized states, with the Middle urban site showing the strongest Fe and Pb signals. XRD identified quartz, calcite, gypsum, hematite/magnetite, and aluminum oxides, with additional Pb and Cu phases at the Middle and South sites. Principal component analysis (PCA) resolved four sources—mixed marine–crustal, terrigenous/industrial (Fe–Ti–Mn), oil combustion and shipping (V–Ni–Cu), and combustion/legacy-traffic (Pb–Zn)—consistent with prior Jeddah and Red Sea studies. The integrated approach provides surface-speciation and mineralogical details not available from bulk elemental analysis alone and establishes baseline information relevant to source management and health-risk assessment in arid coastal cities.

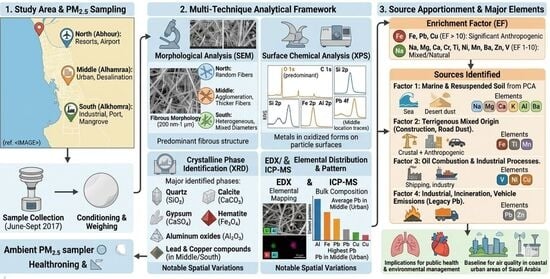
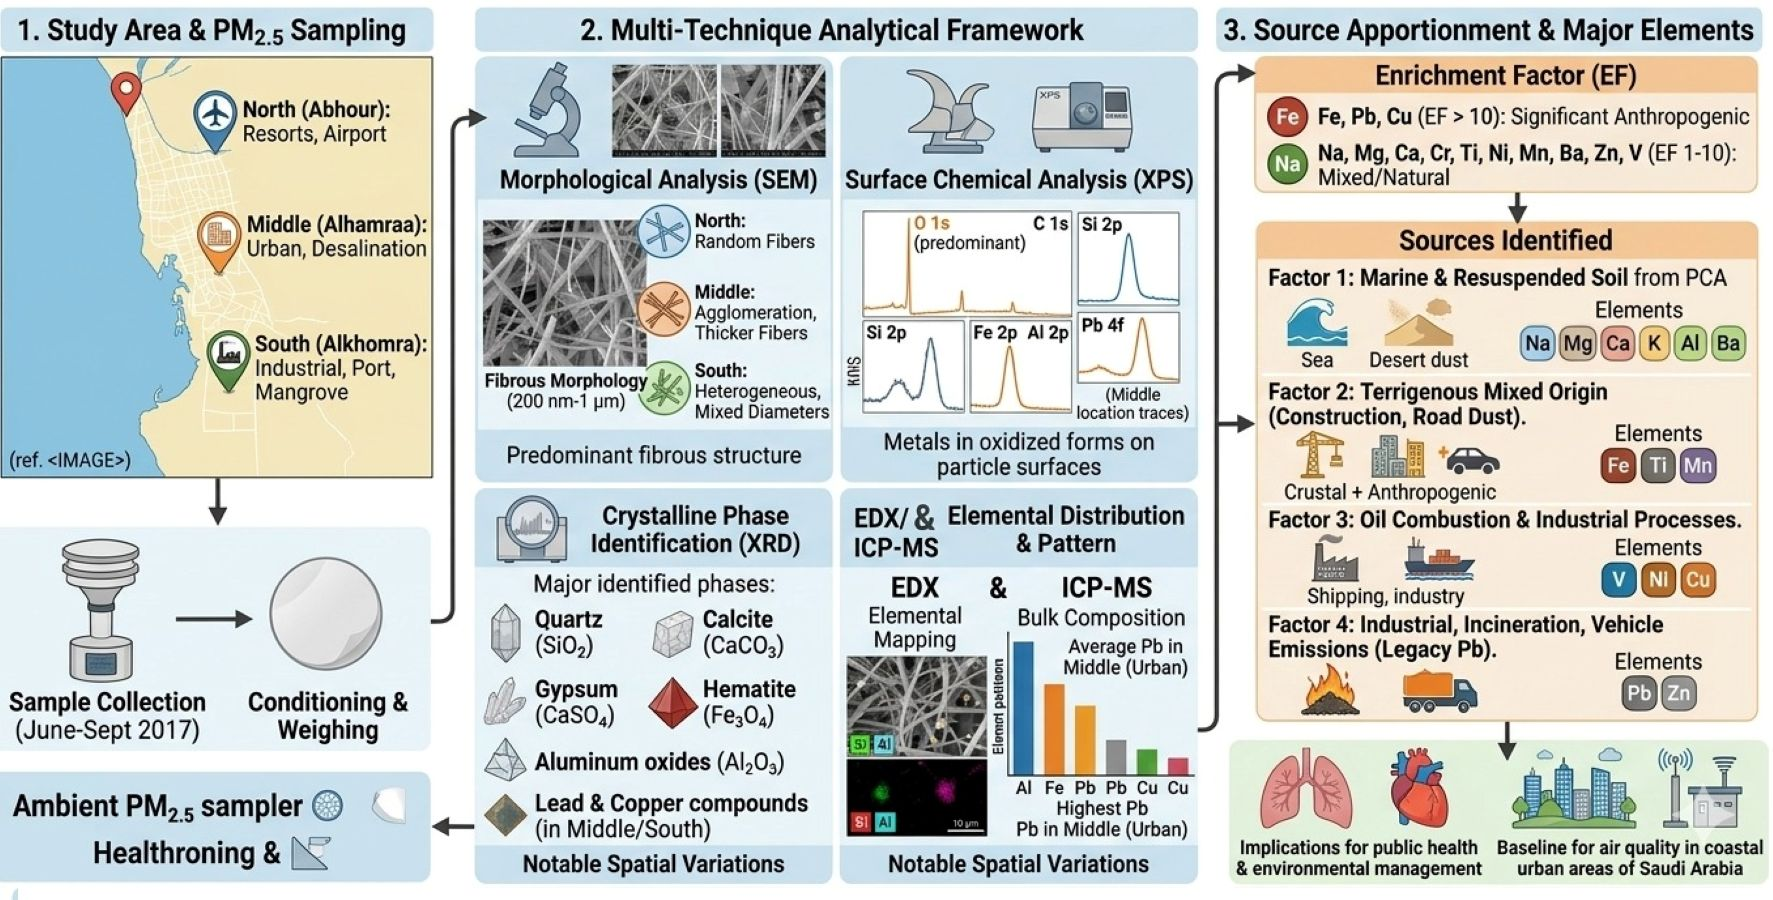
Graphical Abstract

1. Introduction

Atmospheric fine particulate matter (PM2.5; aerodynamic diameter ≤ 2.5 µm) is among the most consequential global environmental health hazards, capable of penetrating deep into the respiratory tract and entering the circulation, where it is associated with cardiovascular disease, respiratory illness, and increased all-cause mortality [1,2,3,4]. Its toxicity is governed not only by mass concentration but by chemical composition: transition and heavy metals such as Fe, Cu, V, Ni, Pb, and Zn promote the generation of reactive oxygen species and oxidative stress, and their bioavailability depends strongly on their surface oxidation state rather than their bulk abundance [3,4,5]. In rapidly urbanizing arid coastal regions, the problem is compounded by the superposition of marine aerosol, mineral dust transported from surrounding deserts, shipping and port emissions, oil combustion, and dense vehicular traffic [6,7,8,9]. Jeddah, the second-largest city of Saudi Arabia and a major Red Sea port, exemplifies these pressures: it hosts a large seaport, an international airport, seawater-desalination facilities, an industrial city, and heavy road traffic, while lying downwind of recurrent dust outbreaks [6,10,11,12]. Regional measurements have repeatedly documented PM2.5 levels well above the World Health Organization guideline, with a dominant contribution from heavy-oil combustion and resuspended soil [6,7,10].
A substantial body of work has now characterized PM in western Saudi Arabia and comparable arid coastal cities. In Jeddah, Khodeir et al. [6] reported summer PM2.5 of 28.4 µg m−3 and resolved five sources dominated by heavy-oil combustion (≈69% of mass) and resuspended soil; Lim et al. [10] confirmed residual-oil burning as the leading PM2.5 source (≈63%) using absolute principal component analysis and back trajectories; and Harrison et al. [13] and Nayebare et al. [14] linked the resulting metal burden to elevated health risk and cardiopulmonary morbidity. Comparable factor structures—oil combustion (V, Ni), crustal/soil (Al, Fe, Si, Ca), traffic (Pb, Br), and mixed industrial sources—have been reported for Rabigh [7], Makkah [8,15], and Riyadh [16], and in dedicated dust-storm studies [11]. Recent contributions in this journal have applied positive matrix factorization, enrichment factors, and back-trajectory analysis to Jeddah and Makkah PM [9,15] and to heavy-metal source attribution and health-risk assessment elsewhere [17,18,19,20], establishing the methodological context for the present work. Most of these studies, however, rely on bulk elemental quantification (ICP-MS, XRF) and statistical receptor modelling; they describe “what” and “how much,” but provide limited direct information on particle morphology, surface chemical state, or crystalline phase—properties that control reactivity, bioavailability, and, ultimately, toxicity [5,21].
The present study addresses this gap. It builds directly on a companion investigation of the same 2017 coastal campaign, which quantified fifteen trace metals by ICP-MS and apportioned sources by enrichment factors and PCA [22], by adding a complementary suite of surface- and solid-state probes: SEM for morphology, EDS/EDX mapping for microscale elemental distribution, XPS for surface oxidation state, and XRD for crystalline-phase identification. The combined application of these techniques—demonstrated previously for urban–industrial aerosols by González et al. [21]—yields information that bulk analysis alone cannot: it reveals the chemical form in which metals reside at particle surfaces, the mineralogy of the carrier particles, and the spatial association of elements at the micrometre scale. Accordingly, the objectives are to (i) characterize the morphology and microscale elemental distribution of PM2.5 at three coastal Jeddah sites; (ii) determine the surface oxidation states and crystalline phases of the constituent metals; and (iii) interpret these properties in light of the source apportionment established for the same dataset, thereby providing a more mechanistic basis for air-quality management and health-risk assessment in arid coastal urban environments.

2. Materials and Methods

2.1. Study Area and Sampling Locations

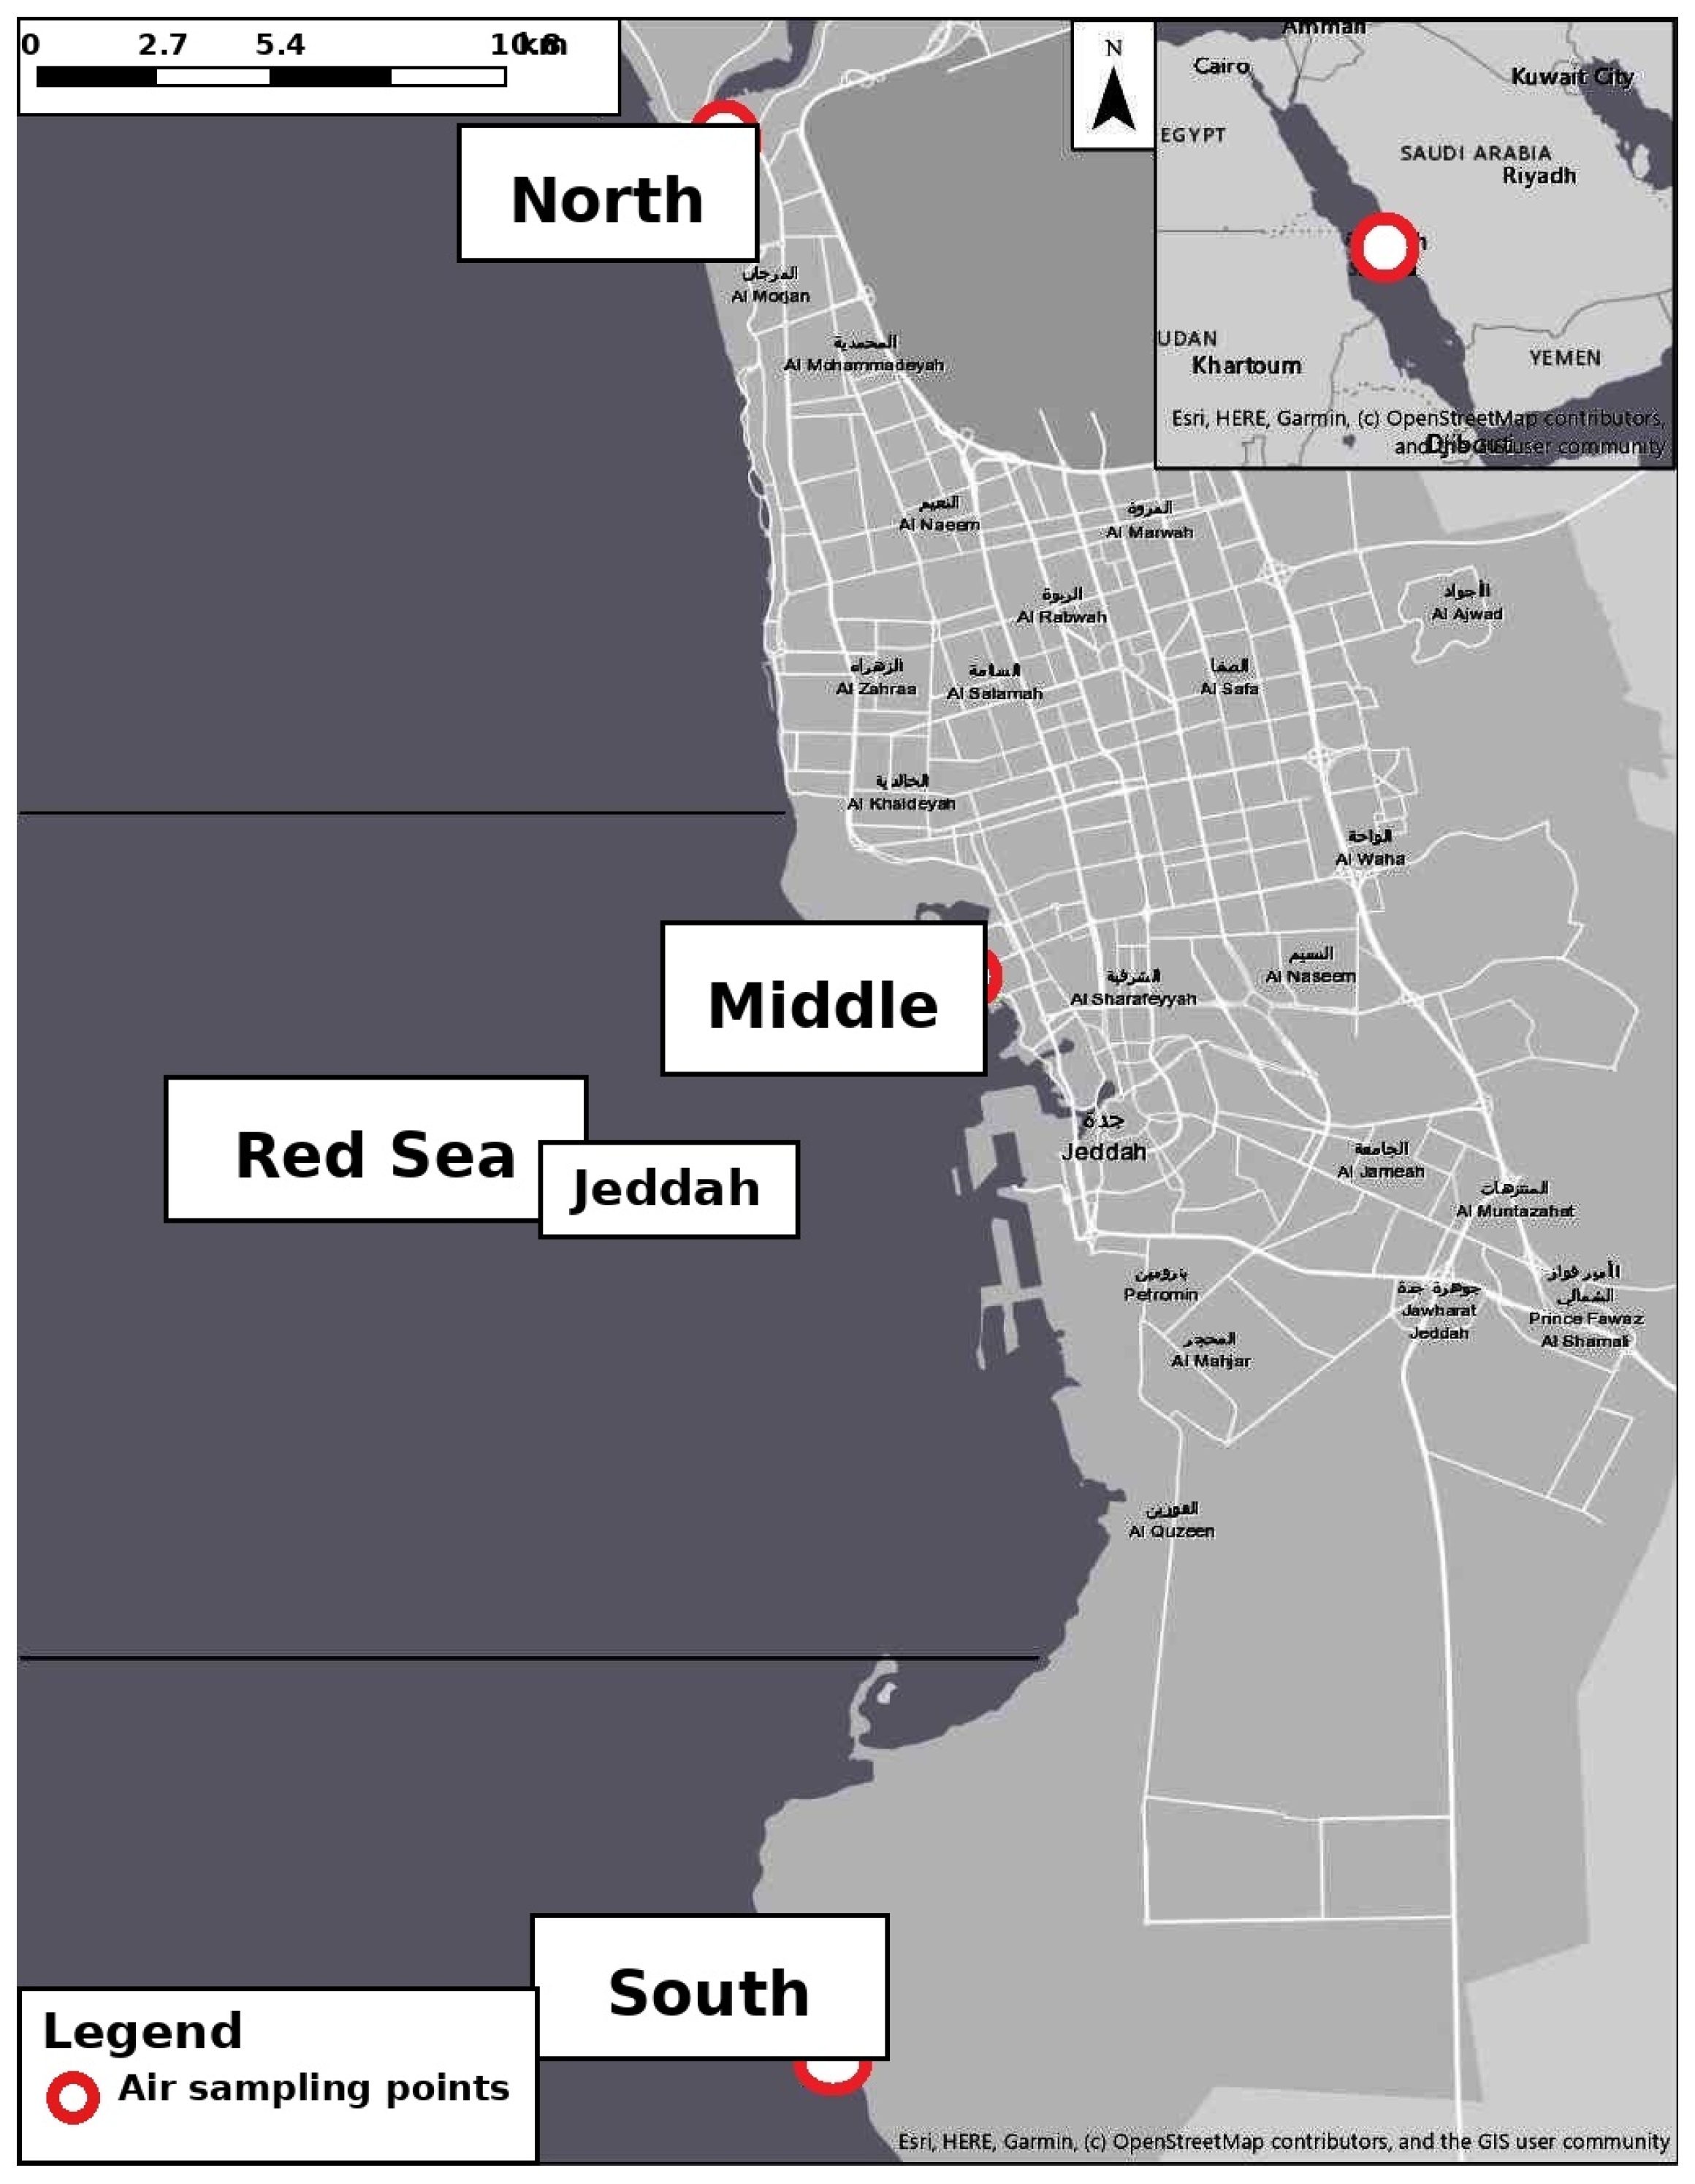
The study was conducted in Jeddah, on the eastern shore of the Red Sea. Three rooftop sites were selected to represent contrasting coastal microenvironments (Figure 1; Table 1). The North site (Abhour) lies near resort areas, the semi-enclosed Sharm Abhour lagoon, and King Abdulaziz International Airport; the Middle site (Alhamraa) is in the dense downtown core near the main fish market, the principal desalination plant, and a major fountain; and the South site (Alkhomra) is near the harbour, Jeddah’s Industrial City, and a mangrove area. The configuration captures airport and recreational influences (North), the high-traffic commercial centre (Middle), and port/industrial emissions (South).

2.2. Sample Collection and Sampling Period

PM2.5 was collected over a three-month summer campaign from 15 June to 15 September 2017 using a high-volume ambient sampler (Tisch Environmental TE-6070-PM2.5; Tisch Environmental Inc., Village of Cleves, OH, USA) fitted with a mass-flow controller, on 8″ × 10″ borosilicate glass-fibre filters. Each sampling run lasted 24 h, with two samples collected weekly at each site. Filters were conditioned in a desiccator at room temperature for 24 h and weighed on a microbalance before and after sampling; field-blank filters were processed and weighed identically to monitor contamination and gravimetric drift. After gravimetric analysis each filter was halved for separate analyses. Elemental extraction followed U.S. EPA Method IO-3.5: a filter portion was placed in a 50 mL tube with 10 mL of 16% HCl/6% HNO3, heated at 95 ± 5 °C for ≥30 min, cooled, made to volume, and filtered prior to analysis.
Glass-fibre filters were selected because the primary campaign endpoints were high-volume gravimetric mass determination and bulk trace-metal analysis by EPA Method IO-3.5; their high flow capacity, low pressure drop, and suitability for hot-acid extraction support those endpoints [23,24,25]. They are not optimal for quantitative single-particle SEM morphology, so the microscopy in this study is interpreted qualitatively and with explicit substrate controls (Section 2.5). This substrate-aware interpretation follows recent individual-particle practice in work by Li and co-workers, where particle features are separated from the collection substrate before classification [26,27,28].
The summer window was selected deliberately. June–September coincides with the peak of the regional summer Shamal regime, whose climatological onset is at the end of May and which persists through mid-August, and is the season of greatest mineral-dust transport, highest temperatures, and most intense photochemical processing over the Red Sea coast [11,29,30]. It therefore captures the period of maximum aerosol loading and atmospheric processing. The corollary is that the dataset represents a single high-temperature season; seasonal contrasts (e.g., winter Shamal events, dust-storm episodes) are outside its scope, a limitation noted in Section 2.5 and the Conclusions.

2.3. Analytical Methods

2.3.1. Scanning Electron Microscopy (SEM)

Particle morphology was examined with a Nova NanoSEM 450 (FEI [now Thermo Fisher Scientific], Hillsboro, OR, USA). Filter pieces were mounted on aluminum stubs with carbon tape and sputter-coated with gold. Imaging used 10–15 kV accelerating voltage at the working distances stated in each micrograph. Multiple fields were surveyed per sample, and field-blank (unexposed) filters were imaged under identical conditions to identify features attributable to the substrate (Section 2.5).

2.3.2. Energy-Dispersive X-Ray Spectroscopy (EDS/EDX)

Elemental composition and microscale distribution were obtained by EDS coupled to the SEM, operated under the same conditions with acquisition times sufficient for reliable identification and semi-quantitative (atomic-%) analysis. Elemental maps were acquired for representative fields at each site.

2.3.3. X-Ray Photoelectron Spectroscopy (XPS)

Surface composition and oxidation states were probed by XPS. Survey spectra (0–1400 eV) were recorded with monochromatic Al Kα radiation (hν = 1486.6 eV) under ultra-high vacuum (<10−8 torr), using 160 eV pass energy for surveys and 20 eV for high-resolution scans. The binding-energy scale was referenced to adventitious C 1s at 284.8 eV. Peak fitting used standard analysis software.

2.3.4. X-Ray Diffraction (XRD)

Crystalline phases were identified with Cu Kα radiation over 2θ = 10–80° (step 0.02°, 1 s per step). Phases were assigned by comparison with the International Centre for Diffraction Data (ICDD) database.

2.3.5. Inductively Coupled Plasma–Mass Spectrometry (ICP-MS)

Acid-extracted samples were analyzed by ICP-MS for Al, Ba, Cr, Cu, Mn, Ni, Pb, V, Zn, Fe, Ti, Ca, Mg, K, and Na. The full concentration dataset and its primary source apportionment are reported in the companion study [22]; the values used here for interpretation and for the enrichment factor and PCA analyses are drawn from that dataset.

2.4. Data Analysis

2.4.1. Enrichment Factor Analysis

To separate crustal from anthropogenic contributions, enrichment factors (EF) were computed as EF = (Cx/CAl)PM/(Cx/CAl)crust, with Al as the reference element and upper-continental-crust abundances taken from Taylor and McLennan and McLennan [31,32]. EF values below ~10 indicate predominantly crustal origin and values above 10 indicate significant anthropogenic enrichment, following the convention used in regional studies [6,7,8,11,15]. The use of a global crustal reference rather than local Red Sea coastal soil is a recognized source of EF uncertainty [15] and is noted as a limitation.

2.4.2. Principal Component Analysis

Sources were identified by PCA (IBM SPSS Statistics) and applied to the elemental concentrations from all three sites, with Varimax rotation and components retained for eigenvalues > 1. Loadings > 0.6 were treated as significant. The resulting factors are interpreted in Section 3.7 against published regional source profiles. The analysis comprised n = 44 PM2.5 samples and p = 15 elemental variables from the companion campaign [22]. Because the dataset covers one summer season, PCA is used as exploratory receptor evidence rather than standalone proof of source contributions; this is consistent with recent multivariate PM2.5 studies that emphasize transparent statistical reporting and seasonal constraints [33,34].

2.5. Methodological Considerations and Limitations of Glass-Fibre Substrates

Because samples were collected on borosilicate glass-fibre filters, the morphological and microanalytical results require careful interpretation. Glass-fibre filters consist of a dense, randomly oriented mat of borosilicate fibres, typically 0.2–2 µm in diameter, whose dimensions overlap those of fibrous and chain-agglomerated aerosols; their mineral matrix also has a very high intrinsic ash content, contributing strong Si, and lesser Al, Ca, Na, and B signals to EDS spectra [24,25]. Such substrates are therefore considered unsuitable for automated single-particle SEM/EDS analysis, for which flat polycarbonate (Nuclepore) or PTFE membranes are recommended because pattern-recognition routines can separate particles from the smooth background [23,24,25,35]. In the present work, this has two consequences that we make explicit. First, the pervasive fibrous network seen in all SEM images (Section 3.1) is dominated by the filter substrate itself rather than by collected fibrous particles; the deposited PM2.5 is resolved as the discrete sub-micrometre particles and agglomerates that decorate, bridge, and coat the fibres. Second, the very high and uniform Si recorded in EDS maps and semi-quantitative spectra largely reflects the borosilicate matrix and cannot be attributed solely to airborne silicate minerals. To constrain these effects, field-blank filters were imaged and analyzed under identical conditions; features and elements common to blanks and samples were treated as substrate-derived, and the morphological discussion below is confined to particulate matter superimposed on the fibres. Future morphological campaigns should employ polycarbonate or PTFE membranes to enable unambiguous single-particle characterization [23,24,25,35]. The XPS, XRD, and ICP-MS results, which interrogate surface chemistry, bulk crystallinity, and total elemental content rather than individual-particle shape, are far less affected by the substrate and provide the principal basis for the compositional conclusions. Recent individual-particle studies associated with Weijun Li commonly collect particles on TEM/SEM-suitable substrates such as carbon-film grids or flat membranes and explicitly separate particle signals from substrate or grid background before classification [26,27,28]. Compared with that approach, the present glass-fibre dataset is less suitable for quantitative shape classification; therefore, no particle counts, size distributions, or automated type fractions are reported. SEM evidence is used only for qualitative comparison of deposits superimposed on the fibres, while compositional inference is anchored in XPS, XRD, ICP-MS, enrichment factors, and PCA.

3. Results and Discussion

3.1. Morphological Characterization

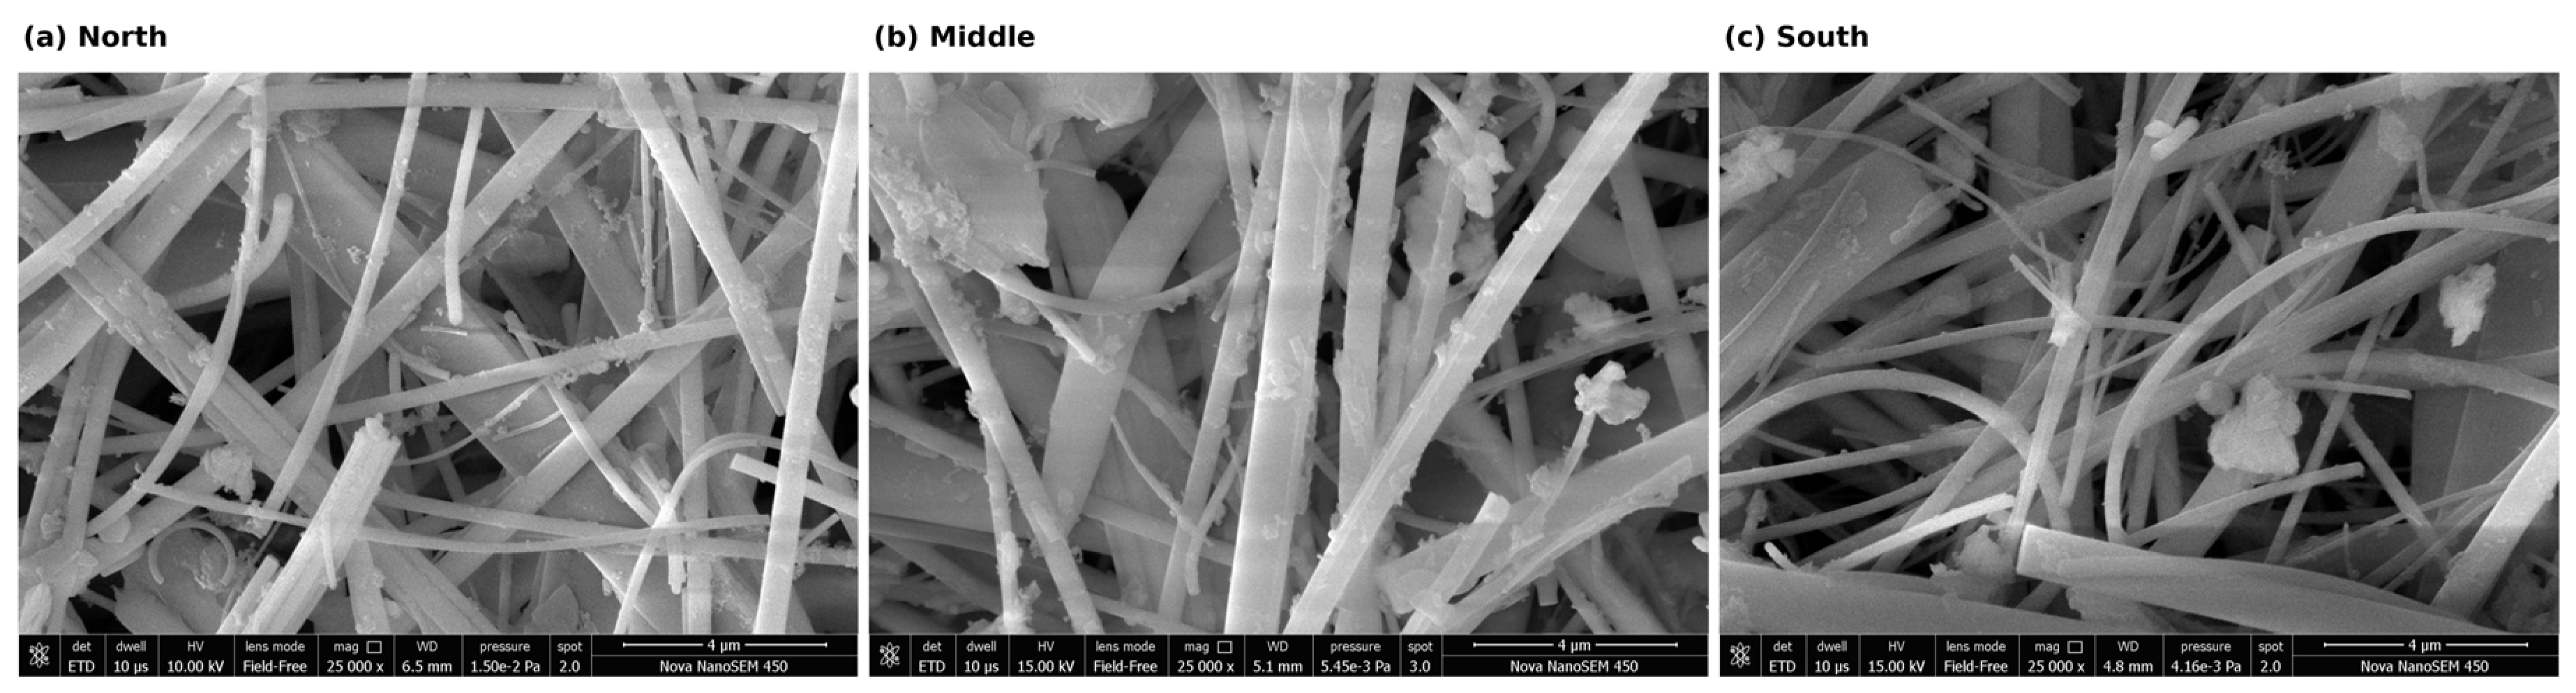
SEM images of samples from the three sites are shown in the composite Figure 2. In every field the image is dominated by a dense, randomly oriented network of smooth fibres 0.2–1 µm in diameter. As discussed in Section 2.5 and confirmed against field blanks, this network is the borosilicate glass-fibre filter substrate rather than collected fibrous aerosol; the interpretation below therefore concerns the discrete particulate matter superimposed on the fibres.
At the North site (Figure 2a), the deposited material is sparse: isolated nodular particles and small agglomerates (tens to a few hundred nanometres) are distributed along the fibres, consistent with the lowest local emission density among the three settings and with the relatively clean marine air discussed in Section 3.3.
Samples from the Middle site (Figure 2b) carry visibly greater particulate loading: agglomerated deposits coat and bridge the fibres more extensively, and the fibres appear rougher and thicker where coated. This is consistent with the dense urban setting and with the higher metal surface signals recorded by XPS for this site (Section 3.2).
The South site (Figure 2c) shows the most heterogeneous deposits, with compact non-fibrous grains interspersed among the substrate fibres. This diversity is compatible with the mix of industrial, port, and marine influences expected near the Industrial City. We emphasize that, because of the substrate limitation, these morphological observations are qualitative and comparative; quantitative single-particle shape statistics would require collection on membrane filters [23,24,25,35].

3.2. Surface Chemical Composition (XPS)

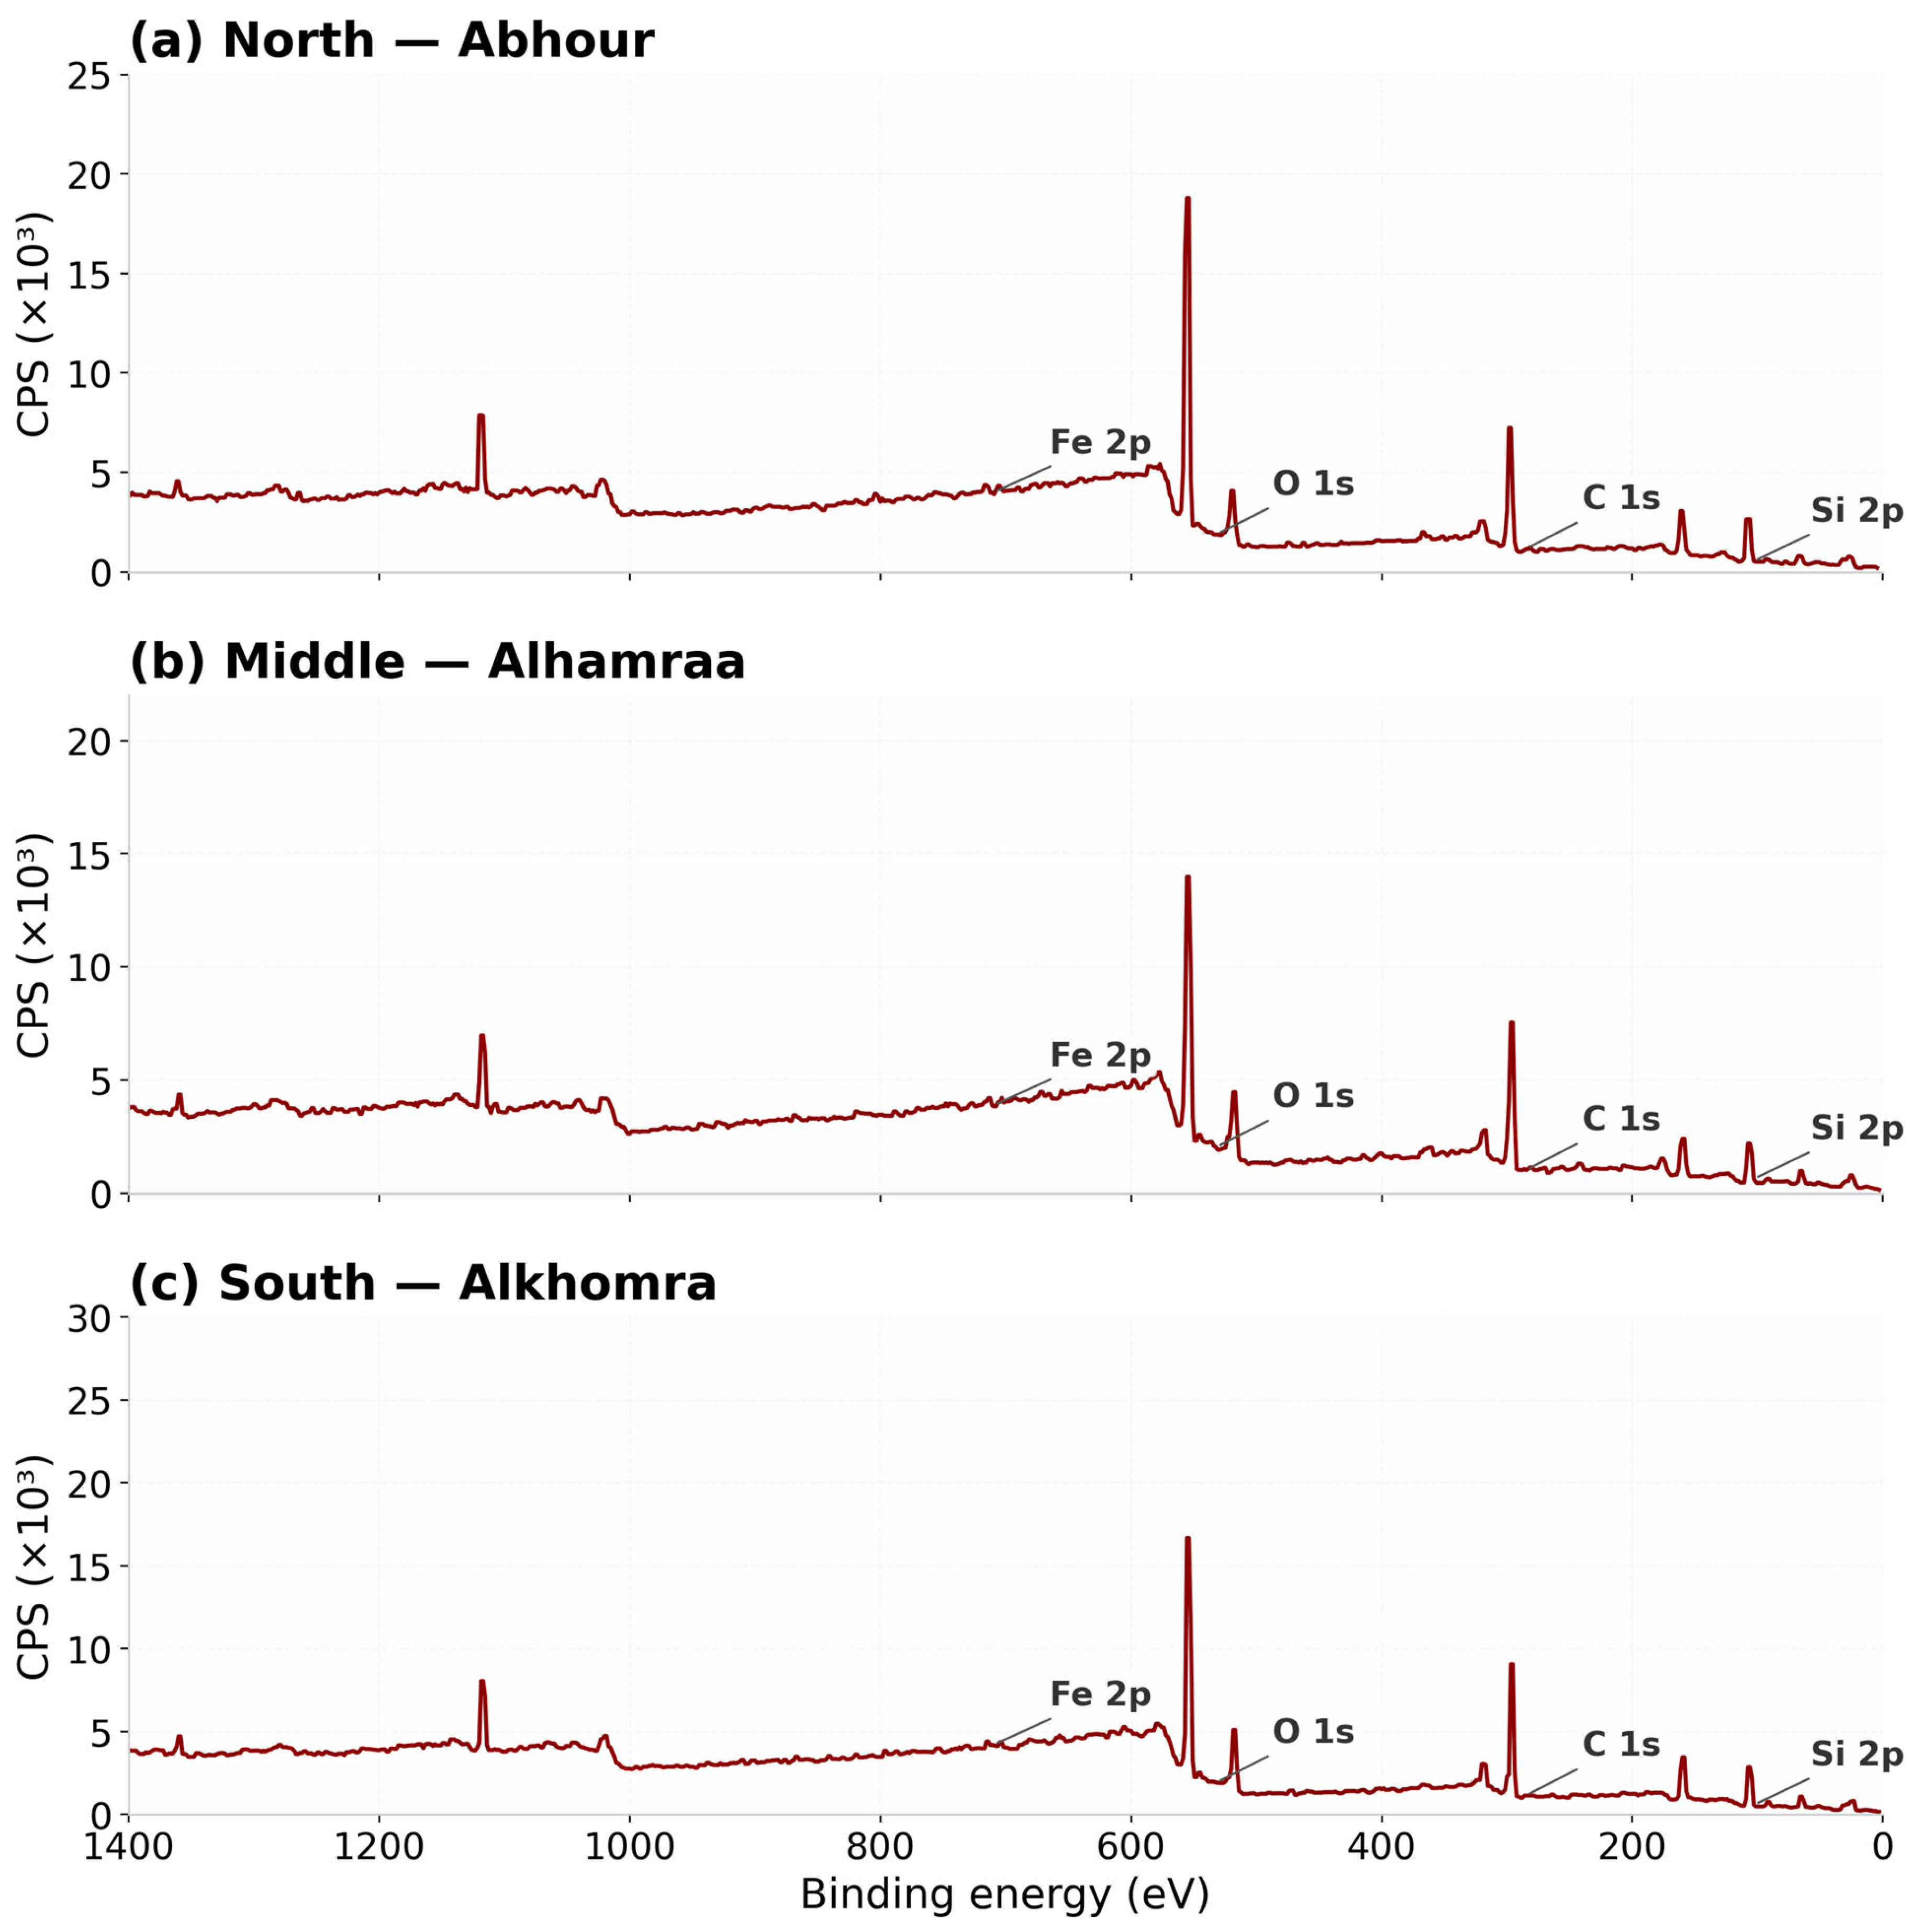
XPS survey spectra for the three sites are shown in the merged Figure 3. All three are qualitatively similar, with the most intense feature at 532 eV (O 1s), confirming that oxygen-bearing species—oxides, carbonates, sulfates, and silicates—dominate the particle surfaces. Strong C 1s (285 eV) and Si 2p (~103 eV) signals accompany it; the C 1s arises from both organic carbon and carbonates, while part of the Si 2p originates from the borosilicate substrate (Section 2.5) in addition to airborne silicates.
Metal features—Fe 2p (710 eV), Al 2p (74 eV), Ca 2p (347 eV), and traces of Pb 4f (138 eV), Cu 2p (933 eV), and Zn 2p (1022 eV)—vary systematically among sites. The Middle-site spectrum (Figure 3b) shows the strongest Fe and Pb signals and the highest O 1s/C 1s ratio, indicating both greater metal loading and a more oxidized surface, consistent with intense anthropogenic input and atmospheric oxidative processing in the urban core. Binding-energy positions are consistent with metals present as oxides and oxyhydroxides rather than in elemental form. This surface speciation is environmentally significant: oxidized metal surfaces are more soluble and reactive in biological fluids than metallic forms, so the dominance of oxidized Fe, Pb, and Cu at the particle surface bears directly on bioavailability and oxidative-stress potential [4,5,21]. Surface oxidation state of this kind is not accessible from the bulk ICP-MS data and represents specific added value of the present multi-technique approach.

3.3. Bulk Elemental Composition and Spatial Variation

The ICP-MS dataset for this campaign [22] gives the mean trace-element abundance sequence Al > Fe > Pb > Cu > Na > V > Zn > Ba > Ti > Mn > Ni > Ca > Cr > Mg > K, with Al (781.1 ng m−3) and Fe (413.2 ng m−3) being the most abundant, followed by Pb (57.8 ng m−3) and Cu (54.9 ng m−3). The predominance of Al and Fe is consistent with a crustal/soil-derived base load typical of the region [6,7,11], while the elevated Pb and Cu pointing to substantial anthropogenic input. Mean PM2.5 mass concentrations and selected element concentrations by site are summarized in Table 2.
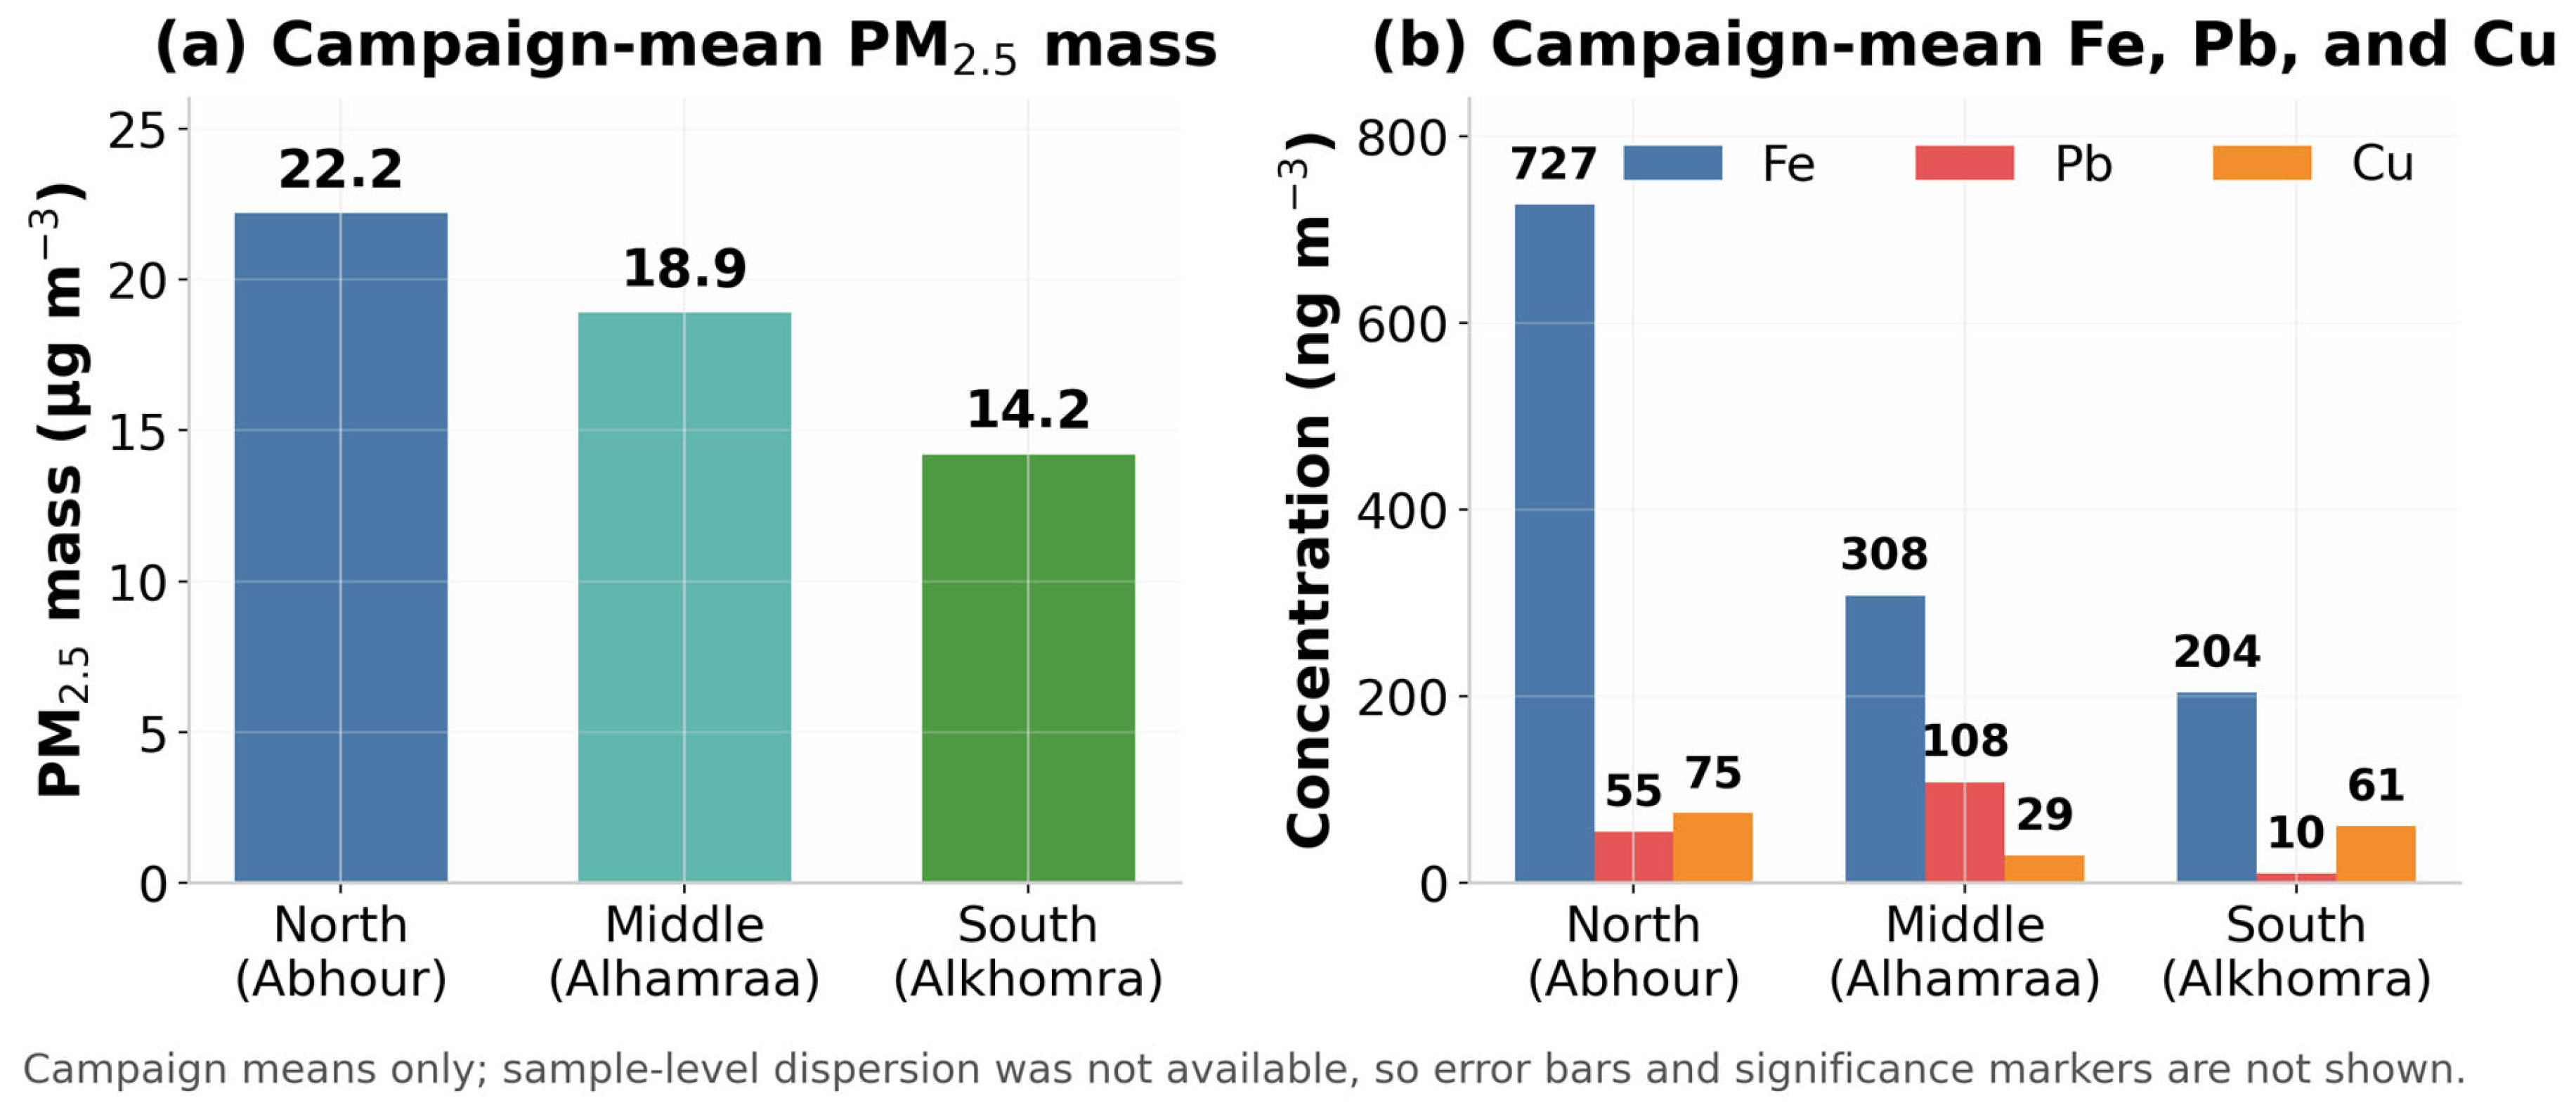
PM2.5 mass decreased from North (22.2 µg m−3) to Middle (18.9 µg m−3) to South (14.2 µg m−3). One plausible contributor to the lowest mass at the South site, despite its industrial proximity, is the prevailing summer wind regime; however, this mechanism cannot be established from the present dataset alone. Along the central Red Sea coast, the summer atmosphere is governed by the north–northwesterly Shamal and a strong daytime onshore sea breeze [29,30]. Under such a regime, the southern, most seaward site would be expected to receive greater dilution by marine air and to lie upwind of much of the urban plume during daytime sampling, whereas the northern site integrates airport and recreational-area emissions. Because no on-site meteorological measurements or air-mass back-trajectory analyses were performed, this interpretation is a climatologically informed hypothesis rather than direct evidence; future campaigns should pair sampling with wind measurements and HYSPLIT trajectories to test it.
Element-specific spatial patterns reinforce this picture. Pb was highest at the Middle site (108.2 ng m−3) and lowest at the South site (10.2 ng m−3), an order-of-magnitude urban-centre enrichment attributable to dense traffic, resuspension of road dust, and persistent legacy Pb: although leaded gasoline was withdrawn in Saudi Arabia in 2001, residual Pb in fuel and accumulated roadside soil continue to supply the urban atmosphere [10,36]. Cu was highest at the North site (75.0 ng m−3), consistent with construction and maintenance activity in the resort area and with brake-wear contributions on local roads [35,37]. Fe was markedly higher at the North site (727.0 ng m−3) than at the Middle (308.1) or South (204.4) sites, indicating a local Fe source—plausibly construction, soil disturbance, or airport-related activity—superimposed on the regional crustal background [6,7].

3.4. Enrichment Factor Analysis

Enrichment factors (Table 3) distinguish crustal from anthropogenic elements. Pb and Cu showed EF > 20, unambiguously anthropogenic and consistent with traffic, industrial, and combustion sources; Fe also exceeded the EF ≈ 10 threshold, indicating an anthropogenic increment over its crustal base. Na showed moderate enrichment (EF ≈ 8), interpreted here as a mixed marine–crustal signal: although Na is the classical sea-salt tracer [31], regional studies have shown that in this arid coastal setting Na and Ca also have a substantial crustal component [11,22]. V and Zn (EF ≈ 5–7) reflect oil combustion and traffic/industrial inputs, respectively, while K, Mg, Ca, Cr, Ti, Ni, Mn, and Ba (EF 1–10) are predominantly crustal with minor anthropogenic contributions [6,7,15]. The EF pattern—strong Pb–Cu enrichment, moderate V–Zn enrichment, and crustal Al–Fe–Ti–Mn base—closely matches that reported for Jeddah, Rabigh, and Makkah [6,7,8,15].

3.5. Crystalline-Phase Identification (XRD)

XRD revealed a crystalline assemblage shared by all three sites: quartz (SiO2), calcite (CaCO3), gypsum (CaSO4·2H2O), hematite (Fe2O3), magnetite (Fe3O4), and aluminum oxides (Al2O3). Quartz, calcite, and the aluminum oxides reflect the crustal/soil component of the aerosol, while gypsum is consistent with secondary sulfate formation and with marine and industrial sulfur sources. Samples from the Middle and South sites additionally showed lead phases (PbO, PbSO4), copper oxides (CuO, Cu2O), and mixed metal silicates. The detection of crystalline Pb and Cu phases specifically at the urban-centre and industrial/port sites corroborates the elevated Pb and Cu concentrations measured there (Section 3.3) and the metal features seen by XPS, and the predominance of oxide and sulfate phases is fully consistent with the oxidized surface speciation inferred from XPS [5,21]. The presence of hematite and magnetite, rather than metallic Fe, likewise supports an oxidized, atmospherically processed Fe burden.

3.6. Microscale Elemental Distribution (EDX Mapping)

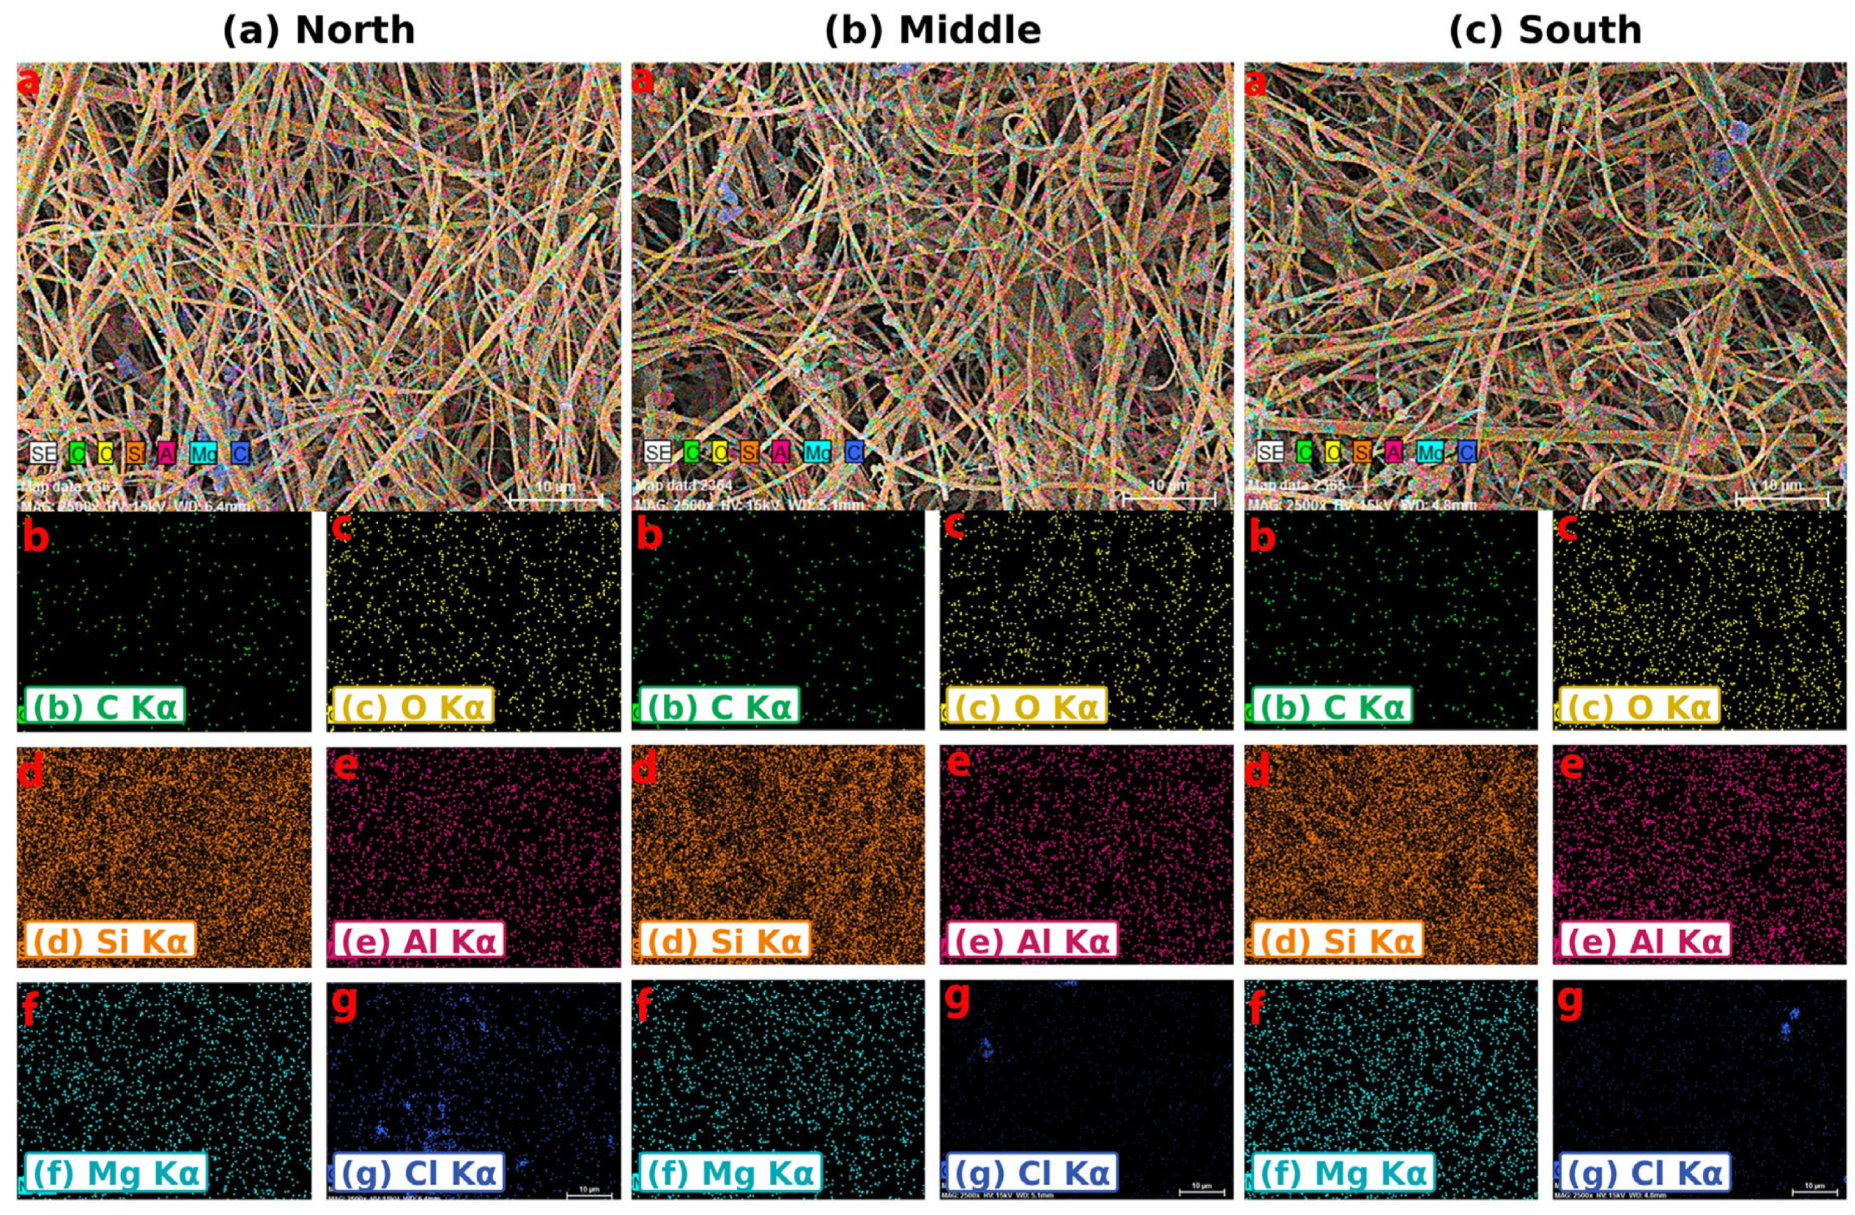
EDX maps for representative fields at each site are shown in the composite Figure 4. In interpreting them, it must be recalled (Section 2.5) that the high, uniform Si signal is dominated by the borosilicate substrate; the maps are therefore most informative for the relative behaviour of the non-substrate elements (C, Cl, and, to a degree, Al and Mg) and for the spatial co-location of elements.
The clearest inter-site signal is chlorine. Discrete Cl deposits are relatively abundant at the North site (Cl panel of Figure 4a), sparse at the Middle site (Figure 4b), and again abundant at the South site (Figure 4c). Because Cl in this setting is carried chiefly by sea-salt particles, this gradient is consistent with stronger marine influence at the seaward North and South sites and weaker marine influence in the urban core. Carbon deposits are most pronounced at the Middle site, consistent with carbonaceous traffic emissions in the centre. At the South site, Al and Mg are spatially correlated, pointing to aluminosilicate (and possibly Mg-bearing) mineral particles. Semi-quantitative compositions (Table 4) are consistent with these observations, but the absolute Si and O percentages are inflated by the substrate and should not be read as airborne-mineral abundances. Importantly, the maps alone do not demonstrate air-mass origin or quantify dilution; they identify microscale elemental associations and should be read together with, not as a substitute for, meteorological or trajectory analysis.
Within these constraints, the maps and Table 4 support three site contrasts that are robust to the substrate effect: higher Na and Cl at the seaward North and South sites (marine influence); higher C, Fe, and S at the Middle site (urban carbonaceous and combustion input); and the highest Al and Mg at the South site, discussed further below.
Mean PM2.5 mass concentrations and selected element concentrations by site are summarized in Table 2 and shown graphically in Figure 5. Figure 5a shows the monotonic decline in PM2.5 mass from north to south, while Figure 5b contrasts the site-level behaviour of Fe, Pb, and Cu: Fe is markedly elevated at the North site relative to Middle and South, whereas Pb peaks sharply at the Middle site, and Cu is elevated at both the North and South. This divergence—one element highest where the other two are not—is the visual basis for the site interpretation that follows. Because only campaign means were available in the present manuscript, the figure does not include error bars or significance markers; sample-level standard deviations and inferential test results must come from the underlying dataset and should not be inferred from the three site means.

3.7. Source Apportionment (PCA)

PCA of the elemental dataset [22] resolved four components explaining 84.4% of the total variance (Table 5). The factor structure, and its interpretation against regional source profiles, is as follows.
The PCA included 44 PM2.5 samples and 15 elemental variables [22]. The available campaign output supports the four-factor solution and the dominant loadings summarized in Table 5. The full rotated loading matrix, communalities, and KMO/Bartlett statistics were not available from the companion dataset and are therefore not reported or reconstructed here; this reporting limitation is important because the campaign covers only one summer season and the factor solution should be regarded as exploratory.
Factor 1 (43.8%; Na, Mg, Ca, K, Al, Ba) combines marine and crustal signatures. The strong mutual correlations among these elements (Na–Mg r = 0.95, Na–Ca r = 0.92, Na–K r = 0.95, Na–Al r = 0.78, Na–Ba r = 0.76) and the moderate Na enrichment (Section 3.4) indicate a background load from sea spray mixed with resuspended desert and coastal soil. We interpret this as a genuinely mixed source rather than pure sea salt, because regional work has shown Na and Ca to be substantially crustal in western Saudi dust, and the companion study likewise attributed the Na signal partly to the earth’s crust [11,22]. This is the dominant background aerosol of the coastal environment.
Factor 2 (18.3%; Fe, Ti, Mn) is terrigenous in character but, in the Jeddah context, carries a clear anthropogenic increment. Fe, Ti, and Mn co-vary almost perfectly (Mn–Ti r = 0.99, Mn–Fe r = 0.99), and the elevated Fe enrichment factor places part of this factor beyond a purely crustal origin. In a city such as Jeddah, several specific processes plausibly contribute the non-crustal fraction: resuspension of mineral-rich road dust on heavily trafficked arteries; construction and earth-moving associated with rapid urban expansion; abrasion and corrosion products from vehicles and metal infrastructure; and emissions from cement and materials handling near the southern industrial zone [5,6,7,37]. The near-perfect Fe–Ti–Mn correlation, together with the morphological evidence of compact non-fibrous grains at the South site, is consistent with a mineral/industrial dust factor rather than a pure soil end-member, echoing the anthropogenically influenced Fe reported by González et al. for an urban–industrial setting [5] and the mixed soil/industrial factors of the Jeddah and Makkah studies [6,8].
Factor 3 (14.5%; V, Ni, Cu) is the oil combustion and shipping signature. The strong V–Ni correlation (r = 0.93) is the classic marker of heavy-fuel-oil combustion, in which V is the most abundant trace metal; V/Ni ratios of this kind are diagnostic of marine-vessel and power-plant emissions [17,18]. Given Jeddah’s major seaport, ship traffic, and oil-fired generation—and the fact that the 2017 sampling predates the 2020 IMO low-sulfur fuel regulation, so a strong HFO signature is expected—this factor is readily attributed to port/shipping and oil combustion, with Cu adding an industrial-process contribution [6,10,17]. Heavy-oil combustion was the single largest PM2.5 source in earlier Jeddah apportionments [6,10], so its appearance as a distinct factor here is consistent with the regional record.
Factor 4 (7.9%; Pb, Zn) represents combustion, incineration, and legacy traffic emissions. Pb and Zn are jointly emitted by waste incineration, fossil-fuel combustion, and tyre and brake wear, and Pb additionally reflects the legacy of leaded gasoline despite its 2001 phase-out [10,36,37]. The concentration of this factor at the urban-centre Middle site (Section 3.3) is consistent with traffic-dominated Pb–Zn emissions in the city core.
Taken together, the four factors reproduce the source structure repeatedly identified for Jeddah and the Red Sea coast—marine/crustal background, mineral/industrial dust, oil combustion/shipping, and traffic/combustion metals [6,7,8,10,15]—but the present study adds the surface-speciation (XPS) and mineralogical (XRD) evidence that ties these statistical factors to specific chemical forms (oxidized Fe, Pb, and Cu; crystalline PbO/PbSO4, CuO, hematite/magnetite, gypsum). This linkage between receptor-model factors and measured chemical state is the principal methodological contribution of the work.
Mechanistically, the agreement among XPS oxidation states, XRD crystalline phases, and PCA factors strengthens source interpretation beyond covariance alone: the V–Ni–Cu factor is linked to oil combustion products, Pb–Zn to oxidized and crystalline Pb-bearing phases at the urban sites, and Fe–Ti–Mn to resuspended and processed mineral matter. This cross-technique convergence reduces, but does not eliminate, uncertainty associated with PCA and the single-season design.

4. Conclusions

This study combined SEM, EDS/EDX mapping, XPS, and XRD with the companion elemental dataset [22] to characterize summer PM2.5 at three Jeddah coastal sites. The central methodological finding is that the glass-fibre substrate dominates the SEM images and EDS Si signal; collected aerosol appears as particles and agglomerates on the fibres. XPS and XRD convergently show oxidized surface metals and crystalline oxide/sulfate phases, especially at the urban Middle site. PCA resolves marine–crustal, mineral/industrial, oil combustion/shipping, and combustion/legacy-traffic factors.
The key spatial finding is a decoupling of PM2.5 mass from industrial proximity: the South site had the lowest mass, but retained marine Cl and correlated Al–Mg signatures. This pattern is consistent with marine influence and local mineral/industrial input, but it does not prove marine-air dilution because direct wind and trajectory measurements were absent. Overall, the study provides a chemically resolved baseline for arid coastal PM2.5; future work should sample across seasons on membrane substrates and pair collection with meteorology, back trajectories, and complete PCA reporting.

Author Contributions

Conceptualization, F.A.A. and R.F.H.; methodology, F.A.A. and R.F.H.; formal analysis, F.A.A. and R.F.H.; investigation, F.A.A. and R.F.H.; writing—original draft preparation, F.A.A.; writing—review and editing, R.F.H.; visualization, F.A.A. All authors have read and agreed to the published version of the manuscript.

Funding

This research was funded by the Deanship of Scientific Research (DSR) at King Abdulaziz University, Jeddah, Saudi Arabia, under grant No. (IPP: 939-155-2026).

Institutional Review Board Statement

Not applicable.

Informed Consent Statement

Not applicable.

Data Availability Statement

The data presented in this study are available on request from the corresponding author.

Acknowledgments

The authors gratefully acknowledge the Deanship of Scientific Research (DSR) at King Abdulaziz University, Jeddah, Saudi Arabia, for funding this project under grant No. (IPP: 939-155-2026) and for providing technical support.

Conflicts of Interest

The authors declare no conflicts of interest.

References

  1. Kim, K.-H.; Kabir, E.; Kabir, S. A review on the human health impact of airborne particulate matter. Environ. Int. 2015, 74, 136–143. [Google Scholar] [CrossRef] [Scilit]
  2. Thangavel, P.; Park, D.; Lee, Y.-C. Recent insights into particulate matter (PM2.5)-mediated toxicity in humans: An overview. Int. J. Environ. Res. Public Health 2022, 19, 7511. [Google Scholar] [CrossRef] [Scilit]
  3. Krittanawong, C.; Qadeer, Y.K.; Hayes, R.B.; Wang, Z.; Virani, S.; Thurston, G.D.; Lavie, C.J. PM2.5 and cardiovascular diseases: State-of-the-art review. Int. J. Cardiol. Cardiovasc. Risk Prev. 2023, 19, 200217. [Google Scholar] [CrossRef] [Scilit]
  4. Alexeeff, S.E.; Liao, N.S.; Liu, X.; Van Den Eeden, S.K.; Sidney, S. Long-term PM2.5 exposure and risks of ischemic heart disease and stroke: A systematic review and meta-analysis. J. Am. Heart Assoc. 2021, 10, e016890. [Google Scholar] [CrossRef] [Scilit]
  5. González, L.T.; Longoria-Rodríguez, F.E.; Sánchez-Domínguez, M.; Leyva-Porras, C.; Silva-Vidaurri, L.G.; Acuna-Askar, K.; Kharisov, B.I.; Villarreal Chiu, J.F.; Alfaro Barbosa, J.M. Chemical and morphological characterization of TSP and PM2.5 by SEM-EDS, XPS and XRD collected in the metropolitan area of Monterrey, Mexico. Atmos. Environ. 2016, 143, 249–260. [Google Scholar] [CrossRef] [Scilit]
  6. Khodeir, M.; Shamy, M.; Alghamdi, M.; Zhong, M.; Sun, H.; Costa, M.; Chen, L.-C.; Maciejczyk, P. Source apportionment and elemental composition of PM2.5 and PM10 in Jeddah City, Saudi Arabia. Atmos. Pollut. Res. 2012, 3, 331–340. [Google Scholar] [CrossRef] [Scilit]
  7. Nayebare, S.R.; Aburizaiza, O.S.; Khwaja, H.A.; Siddique, A.; Hussain, M.M.; Zeb, J.; Khatib, F.; Carpenter, D.O.; Blake, D.R. Chemical characterization and source apportionment of PM2.5 in Rabigh, Saudi Arabia. Aerosol Air Qual. Res. 2016, 16, 3114–3129. [Google Scholar] [CrossRef] [Scilit]
  8. Nayebare, S.R.; Aburizaiza, O.S.; Siddique, A.; Carpenter, D.O.; Hussain, M.M.; Zeb, J.; Aburiziza, A.J.; Khwaja, H.A. Ambient air quality in the holy city of Makkah: A source apportionment with elemental enrichment factors (EFs) and factor analysis (PMF). Environ. Pollut. 2018, 243, 1791–1801. [Google Scholar] [CrossRef] [Scilit]
  9. Nayebare, S.R.; Aburizaiza, O.S.; Siddique, A.; Hussain, M.M.; Zeb, J.; Khatib, F.; Carpenter, D.O.; Khwaja, H.A. Understanding the sources of ambient fine particulate matter (PM2.5) in Jeddah, Saudi Arabia. Atmosphere 2022, 13, 711. [Google Scholar] [CrossRef] [Scilit]
  10. Lim, C.C.; Thurston, G.D.; Shamy, M.; Alghamdi, M.; Khoder, M.; Mohorjy, A.M.; Alkhalaf, A.K.; Brocato, J.; Chen, L.-C.; Costa, M. Temporal variation of fine and coarse particulate matter sources in Jeddah, Saudi Arabia. J. Air Waste Manag. Assoc. 2018, 68, 123–138. [Google Scholar] [CrossRef] [Scilit]
  11. Alghamdi, M.A.; Almazroui, M.; Shamy, M.; Redal, M.A.; Alkhalaf, A.K.; Hussein, M.A.; Khoder, M.I. Characterization and elemental composition of atmospheric aerosol loads during springtime dust storm in western Saudi Arabia. Aerosol Air Qual. Res. 2015, 15, 440–453. [Google Scholar] [CrossRef] [Scilit]
  12. Kadi, M.W. Soil lead pollution from traffic in urban Jeddah, Saudi Arabia. J. King Abdulaziz Univ. Meteorol. Environ. Arid Land Agric. Sci. 2009, 20, 71–83. [Google Scholar]
  13. Harrison, R.M.; Bousiotis, D.; Mohorjy, A.M.; Alkhalaf, A.K.; Shamy, M.; Alghamdi, M.; Khoder, M.; Costa, M. Health risk associated with airborne particulate matter and its components in Jeddah, Saudi Arabia. Sci. Total Environ. 2017, 590–591, 531–539. [Google Scholar] [CrossRef] [Scilit]
  14. Nayebare, S.R.; Aburizaiza, O.S.; Siddique, A.; Carpenter, D.O.; Arden Pope, C.; Mirza, H.M.; Zeb, J.; Aburiziza, A.J.; Khwaja, H.A. Fine particles exposure and cardiopulmonary morbidity in Jeddah: A time-series analysis. Sci. Total Environ. 2019, 647, 1314–1322. [Google Scholar] [CrossRef] [Scilit]
  15. Habeebullah, T.M.; Munir, S.; Zeb, J.; Morsy, E.A. Source apportionment of atmospheric PM10 in Makkah, Saudi Arabia by modelling its ion and trace element contents with positive matrix factorization and generalised additive model. Toxics 2022, 10, 119. [Google Scholar] [CrossRef] [Scilit]
  16. Alharbi, B.; Shareef, M.M.; Husain, T. Study of chemical characteristics of particulate matter concentrations in Riyadh, Saudi Arabia. Atmos. Pollut. Res. 2015, 6, 88–98. [Google Scholar] [CrossRef] [Scilit]
  17. Corbin, J.C.; Mensah, A.A.; Pieber, S.M.; Orásche, J.; Michalke, B.; Zanatta, M.; Czech, H.; Massabo, D.; Buatier de Mongeot, F.; Mennucci, C.; et al. Trace metals in soot and PM2.5 from heavy-fuel-oil combustion in a marine engine. Environ. Sci. Technol. 2018, 52, 6714–6722. [Google Scholar] [CrossRef] [Scilit]
  18. Agrawal, H.; Welch, W.A.; Miller, J.W.; Cocker, D.R. Emission measurements from a crude oil tanker at sea. Environ. Sci. Technol. 2008, 42, 7098–7103. [Google Scholar] [CrossRef] [Scilit]
  19. Lippmann, M.; Ito, K.; Hwang, J.S.; Maciejczyk, P.; Chen, L.-C. Cardiovascular effects of nickel in ambient air. Environ. Health Perspect. 2006, 114, 1662–1669. [Google Scholar] [CrossRef] [Scilit]
  20. Habeebullah, T.M.; Munir, S.; Zeb, J.; Morsy, E.A. Analysis and sources identification of atmospheric PM10 and its cation and anion contents in Makkah, Saudi Arabia. Atmosphere 2022, 13, 87. [Google Scholar] [CrossRef] [Scilit]
  21. Lihavainen, H.; Alghamdi, M.A.; Hyvärinen, A.-P.; Hussein, T.; Aaltonen, V.; Abdelmaksoud, A.S.; Al-Jeelani, H.; Almazroui, M.; Almehmadi, F.M.; Al Zawad, F.M.; et al. Aerosols physical properties at Hada Al Sham, western Saudi Arabia. Atmos. Environ. 2016, 135, 109–119. [Google Scholar] [CrossRef] [Scilit]
  22. Abdelmaksoud, A.S.; Halawani, R.F.; Almehmadi, F.M.; Quicksall, A.N. Characterization of PM2.5 trace metals from the urban-coastal area of Jeddah, Saudi Arabia. Water Air Soil Pollut. 2025, 236, 550. [Google Scholar] [CrossRef] [Scilit]
  23. Willis, R.D.; Blanchard, F.T.; Conner, T.L. Guidelines for the Application of SEM/EDX Analytical Techniques to Particulate Matter Samples; EPA-600/R-02-070; U.S. Environmental Protection Agency: Research Triangle Park, NC, USA, 2002.
  24. Chow, J.C.; Watson, J.G.; Wang, X.; Abbasi, B.; Reed, W.R.; Parks, D. Review of filters for air sampling and chemical analysis in mining workplaces. Minerals 2022, 12, 1314. [Google Scholar] [CrossRef] [Scilit]
  25. Brostøm, A.; Kling, K.I.; Hougaard, K.S.; Mølhave, K. Complex aerosol characterization by scanning electron microscopy coupled with energy dispersive X-ray spectroscopy. Sci. Rep. 2020, 10, 9150. [Google Scholar] [CrossRef] [Scilit]
  26. Wang, W.; Wang, M.; Shao, L.; Zhou, X.; Zhao, Z.; Li, N.; Zhou, H.; Li, W. Morphology and elemental composition of individual solid dust particles: From different sources to the atmosphere. Atmos. Environ. 2024, 338, 120842. [Google Scholar] [CrossRef] [Scilit]
  27. Zhang, Y.; Li, W.; Zhang, J.; Ding, X.; Yuan, Q.; Liu, L.; Xu, L.; Wang, Y.; Jiang, X.; Ma, W.; et al. Morphological and elemental classification of freshly-emitted individual particles from field and laboratory residential biomass burning. J. Geophys. Res. Atmos. 2024, 129, e2023JD040379. [Google Scholar] [CrossRef] [Scilit]
  28. Li, W.; Ito, A.; Wang, G.; Zhi, M.; Xu, L.; Yuan, Q.; Zhang, J.; Liu, L.; Wu, F.; Laskin, A.; et al. Aqueous-phase secondary organic aerosol formation on mineral dust. Natl. Sci. Rev. 2025, 12, nwaf221. [Google Scholar] [CrossRef] [Scilit]
  29. McLennan, S.M. Relationships between the trace element composition of sedimentary rocks and upper continental crust. Geochem. Geophys. Geosyst. 2001, 2, 2000GC000109. [Google Scholar] [CrossRef] [Scilit]
  30. Yu, Y.; Notaro, M.; Kalashnikova, O.V.; Garay, M.J. Climatology of summer Shamal wind in the Middle East. J. Geophys. Res. Atmos. 2016, 121, 289–305. [Google Scholar] [CrossRef] [Scilit]
  31. Keene, W.C.; Pszenny, A.A.P.; Galloway, J.N.; Hawley, M.E. Sea-salt corrections and interpretation of constituent ratios in marine precipitation. J. Geophys. Res. 1986, 91, 6647–6658. [Google Scholar] [CrossRef] [Scilit]
  32. Taylor, S.R.; McLennan, S.M. The Continental Crust: Its Composition and Evolution; Blackwell Scientific Publications: Oxford, UK, 1985. [Google Scholar]
  33. Siudek, P. Chemical composition and source apportionment of ambient PM2.5 in a coastal urban area, Northern Poland. Chemosphere 2024, 356, 141850. [Google Scholar] [CrossRef] [Scilit]
  34. Park, S.-Y.; Cho, Y.-S.; Jang, H.; Kwon, J.; Yoon, S.W.; Lee, C.-M. Source apportionment and dynamics of PM2.5 across regions during and after the coronavirus 2019 pandemic. Sci. Rep. 2025, 15, 23529. [Google Scholar] [CrossRef] [Scilit]
  35. Stone, G.J. Automated SEM/EDS image analysis of particles on filter blanks. In Particles on Surfaces 1: Detection, Adhesion, and Removal; Mittal, K.L., Ed.; Springer: Boston, MA, USA, 1988; pp. 287–300. [Google Scholar]
  36. Aburas, H.M.; Zytoon, M.A.; Abdulsalam, M.I. Atmospheric lead in PM2.5 after leaded gasoline phase-out in Jeddah City, Saudi Arabia. CLEAN–Soil Air Water 2011, 39, 711–719. [Google Scholar] [CrossRef] [Scilit]
  37. Thorpe, A.; Harrison, R.M. Sources and properties of non-exhaust particulate matter from road traffic: A review. Sci. Total Environ. 2008, 400, 270–282. [Google Scholar] [CrossRef] [Scilit]
Figure 1. Locations of the three PM2.5 sampling sites along the Jeddah coastline. Red markers denote air-sampling points; the inset shows Jeddah’s regional location. Key labels and the scale bar were enlarged.
Atmosphere 17 00830 g001
Figure 2. Composite SEM micrographs of PM2.5 collected on borosilicate glass-fibre filters: (a) North (Abhour); (b) Middle (Alhamraa); and (c) South (Alkhomra). The fibrous network is the filter substrate; collected PM2.5 appears as sub-micrometre particles and agglomerates adhering to the fibres. Scale bars = 4 µm.
Atmosphere 17 00830 g002
Figure 3. Merged XPS survey spectra for (a) North, (b) Middle, and (c) South. Major O 1s, C 1s, Si 2p, and Fe 2p peaks are marked. Axes and labels were enlarged.
Atmosphere 17 00830 g003
Figure 4. Composite EDX maps for (a) North, (b) Middle, and (c) South. For each site: (a) SE image with EDS colour overlay (C = green, O = yellow, Si = orange, Al = magenta, Mg = cyan, Cl = blue); (b) C Kα; (c) O Kα; (d) Si Kα; (e) Al Kα; (f) Mg Kα; (g) Cl Kα; uniform Si is mainly filter-derived. Scale bars = 10 µm.
Atmosphere 17 00830 g004
Figure 5. Campaign-mean PM2.5 mass and Fe, Pb, and Cu concentrations by site (data from Table 2 [22]). Error bars are omitted because sample-level dispersion was unavailable.
Atmosphere 17 00830 g005
Table 1. Description of the three sampling sites in Jeddah, Saudi Arabia.
SiteLocalitySurrounding EnvironmentHeight (m a.s.l.)
NorthAbhourResort areas, Sharm Abhour lagoon, King Abdulaziz International Airport~10
MiddleAlhamraaDowntown core; fish market, main desalination plant, heavy traffic~7
SouthAlkhomraHarbour, Jeddah Industrial City, mangrove area~5
Table 2. PM2.5 mass and selected element concentrations by site (data from the companion campaign [22]). Mean Al across all sites was 781.1 ng m−3.
QuantityNorthMiddleSouthMean
PM2.5 (µg m−3)22.218.914.218.4
Fe (ng m−3)727.0308.1204.4413.2
Pb (ng m−3)55.0108.210.257.8
Cu (ng m−3)75.028.661.054.9
Table 3. Enrichment factors (relative to Al; upper-continental-crust reference [31,32]) and source classification of the measured elements.
Element(s)EF (Approx.)Source Classification
Pb, Cu>20Strong anthropogenic (traffic, industry, combustion)
Fe>10Anthropogenic increment over crustal base
Na~8Mixed marine–crustal (sea spray + crust)
V, Zn~5–7Moderate anthropogenic (oil combustion; traffic/industry)
K, Mg, Ca, Cr, Ti, Ni, Mn, Ba1–10Predominantly crustal, minor anthropogenic
Al≈1 (reference)Crustal reference element
Table 4. Semi-quantitative EDX composition (atomic %) by site. Note that O and Si are strongly influenced by the borosilicate substrate (Section 2.5) and do not represent airborne-particle abundances.
ElementNorthMiddleSouth
O56.2 ± 3.454.7 ± 3.855.9 ± 3.2
Si24.8 ± 2.122.3 ± 2.523.5 ± 2.2
Al6.8 ± 0.97.2 ± 1.17.5 ± 0.8
Mg4.3 ± 0.73.9 ± 0.84.6 ± 0.6
C3.2 ± 0.64.8 ± 1.23.5 ± 0.9
Na2.1 ± 0.51.7 ± 0.41.9 ± 0.5
Cl1.3 ± 0.40.8 ± 0.31.2 ± 0.4
K0.7 ± 0.20.6 ± 0.20.8 ± 0.3
Ca0.6 ± 0.20.9 ± 0.30.7 ± 0.2
Fe<0.51.2 ± 0.40.8 ± 0.3
S<0.50.8 ± 0.30.6 ± 0.2
Table 5. Principal components (Varimax rotation) of the elemental dataset, with dominant elements, variance explained, and source assignment.
FactorDominant Elements (Loading > 0.6)Variance (%)Source Assignment
F1Na, Mg, Ca, K, Al, Ba43.75Mixed marine aerosol + resuspended soil
F2Fe, Ti, Mn18.29Terrigenous/industrial (road dust, construction, processing)
F3V, Ni, Cu14.49Oil combustion/shipping + industry
F4Pb, Zn7.86Combustion/incineration/legacy traffic
Disclaimer/Publisher’s Note: The statements, opinions and data contained in all publications are solely those of the individual author(s) and contributor(s) and not of MDPI and/or the editor(s). MDPI and/or the editor(s) disclaim responsibility for any injury to people or property resulting from any ideas, methods, instructions or products referred to in the content.