1. Introduction
The accelerating pace of global climate change and the urgent imperative to decarbonize energy systems have positioned solar energy as a cornerstone of national and international renewable energy strategies. China, as a committed signatory to carbon neutrality goals (peak carbon by 2030, net-zero by 2060), has designated solar energy as a strategic emerging industry given its unparalleled abundance among domestic renewable resources. As the world’s leading installer of photovoltaic (PV) capacity, China requires precise, high-resolution characterization of solar radiation resources to maximize the efficiency and economic viability of PV systems [
1,
2].
Solar radiation reaching the Earth’s surface is not uniformly distributed; it is shaped by a complex interplay of geographic latitude, topography, atmospheric composition (clouds, aerosols, water vapor), and land surface properties, resulting in pronounced spatiotemporal heterogeneity. Quantifying these patterns and identifying their drivers is essential for understanding surface energy balance, optimizing energy layout, and reducing investment risk in solar energy projects. Shortwave radiation (SWR), photosynthetically active radiation (PAR), and ultraviolet radiation (UVA/UVB) are key components of multi-band radiation, each playing distinct roles in energy generation, ecosystem productivity, and human health [
3,
4,
5]. Furthermore, surface downward long-wave radiation (LWR), as an essential component of the surface net energy balance, also plays a critical role. The trapping of LWR by greenhouse gases (GHGs) is the primary driver of global warming. For photovoltaic (PV) applications, ambient LWR and thermal radiation significantly contribute to solar array heating; since the photoelectric conversion efficiency of PV modules typically decreases with rising temperature, LWR implicitly impacts the overall performance and power output of PV systems. However, most regional studies focus on SWR alone, and concurrent spatiotemporal analysis of all four radiation components over complex terrain remains scarce.
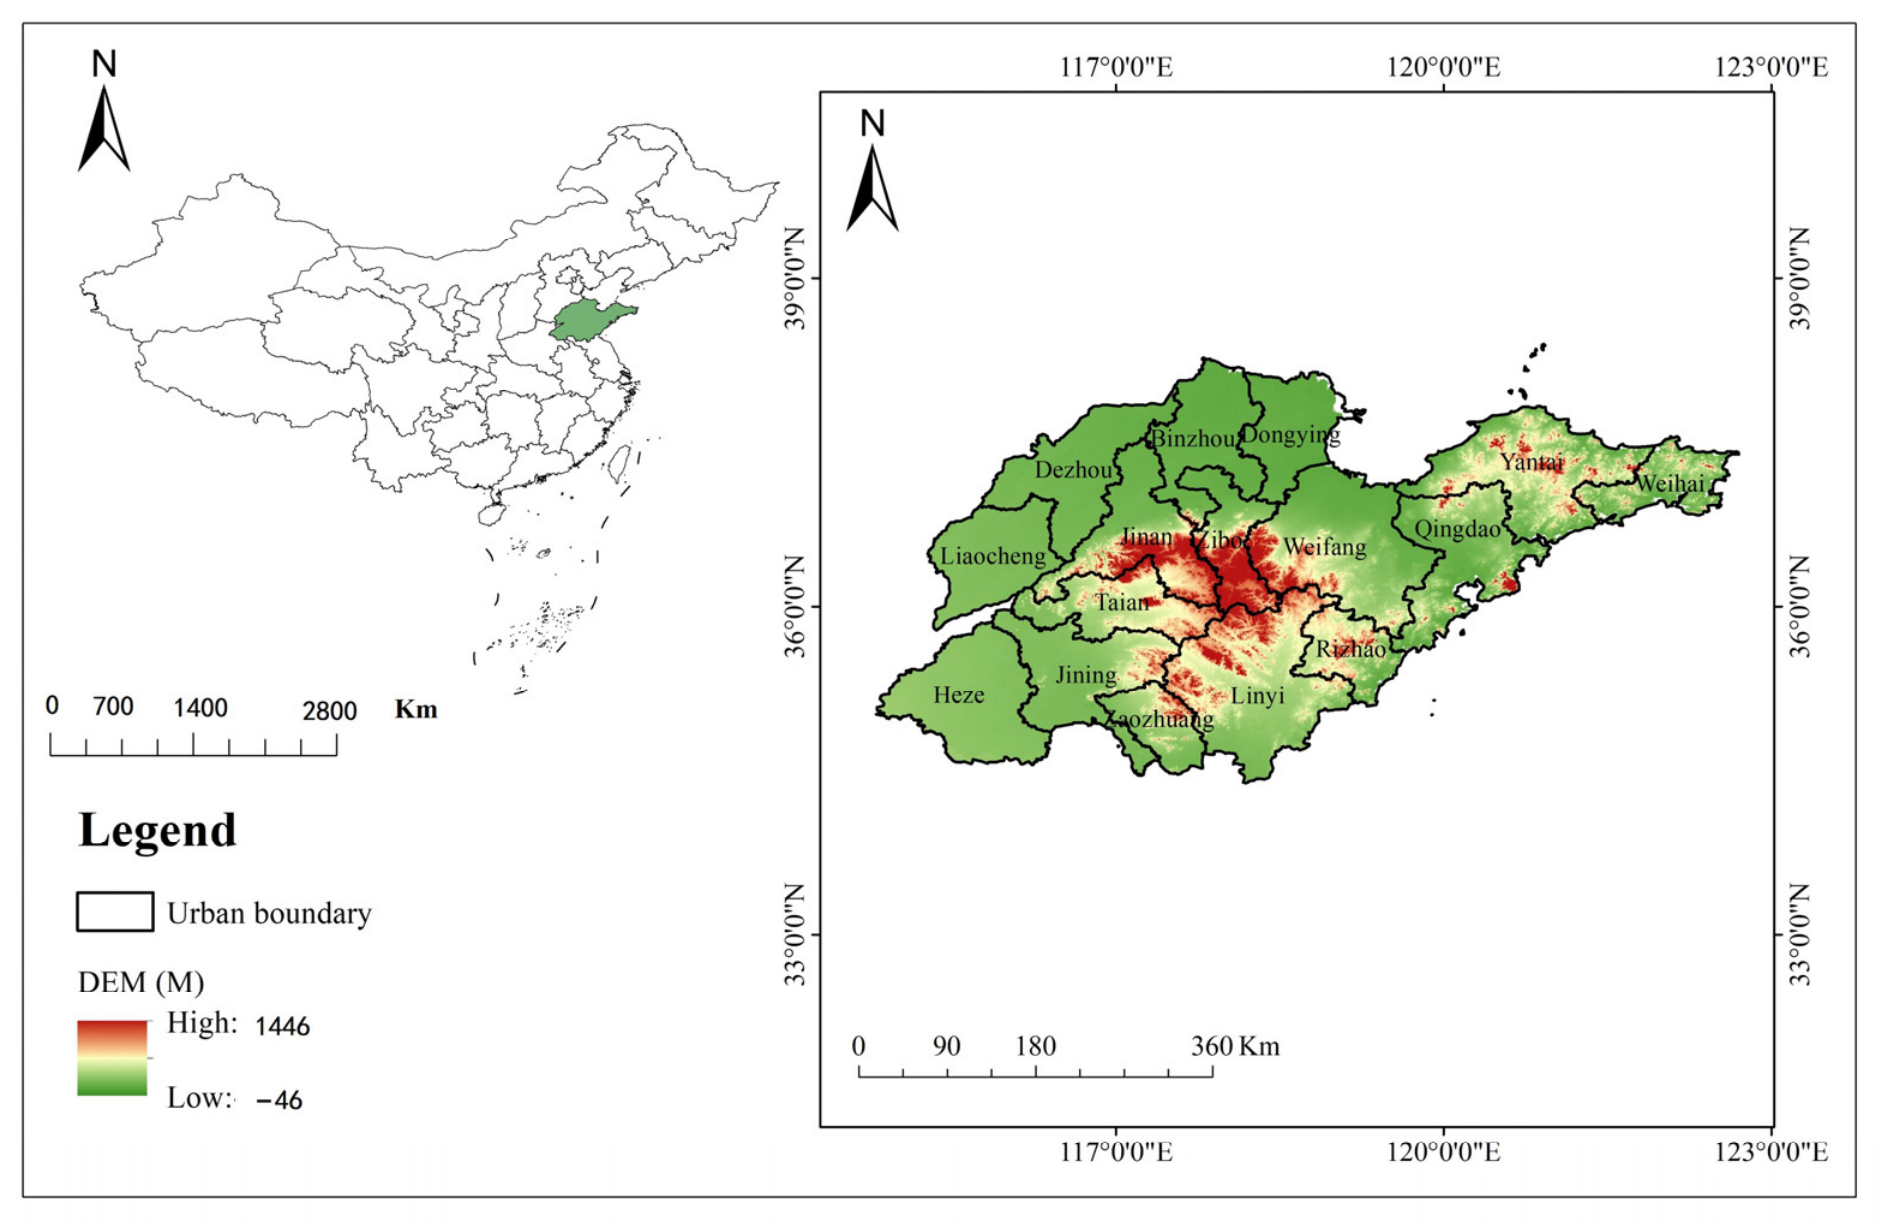
Shandong Province, located in the eastern coastal region of China (114.5° E–122.5° E, 34.5° N–38.5° N), ranks among the country’s top provinces in both economic output and energy consumption, and consistently leads nationally in installed PV capacity. Its highly diverse terrain, including the central-southern Shandong highlands (Mt. Tai, Yimeng Mountains; peaks > 1500 m a.s.l.), the Jiaodong Peninsula (200–400 m), and the vast North Shandong Plain (<50 m a.s.l.), combined with a warm temperate monsoon climate and rapid urbanization, creates highly heterogeneous solar radiation conditions. Previous studies of Shandong solar radiation have primarily relied on sparse meteorological station networks or coarse-resolution reanalysis products [
6,
7], which cannot resolve local details such as urban radiation “shadow zones” or valley-ridge contrasts critical for PV micro-siting.
The CARE (Cloud Remote Sensing, Atmospheric Radiation and Renewable Energy Application) product suite, derived from the Himawari-8/AHI geostationary satellite, provides multi-band surface downwelling solar radiation (SWR, PAR, UVA, UVB) at 0.1° spatial resolution and hourly temporal resolution across East Asia [
8,
9,
10]. Several studies have demonstrated that CARE products outperform ERA5 and CERES over complex terrain. Li et al. [
11] applied CARE products to characterize solar radiation variations across China during 2016–2020, providing a national-scale baseline that motivates the present provincial-scale refinement.
Despite growing interest, critical research gaps remain for Shandong Province. First, while national-scale baseline studies have utilized CARE products [
11], a systematic application to characterize multi-band radiation distributions at the provincial scale across Shandong’s diverse landscapes remains absent. Second, simultaneous analysis of SWR, PAR, UVA, and UVB using consistent data and methods is lacking. Third, quantitative attribution of radiation spatial heterogeneity using the geodetector model has not been performed for this region, particularly regarding the examination of nonlinear factor interactions. Fourth, the linkage between radiation patterns, land-use types, and PV site optimization remains underexplored.
To address these gaps, this study: (1) characterizes the spatiotemporal distribution of SWR, PAR, UVA, and UVB across Shandong Province during 2016–2020 using CARE satellite products; (2) decomposes provincial-mean monthly radiation time series using STL (Seasonal-Trend decomposition using Loess) to reveal trend, seasonal, and residual components; and (3) applies the geodetector model to quantify single-factor contributions and factor interactions involving cloud cover, topography (elevation, slope, aspect), and land-use type. The results aim to provide kilometer-scale scientific guidance for PV layout optimization and the achievement of Shandong’s carbon neutrality objectives.
3. Results
3.1. Spatial Distribution of Multi-Band Solar Radiation
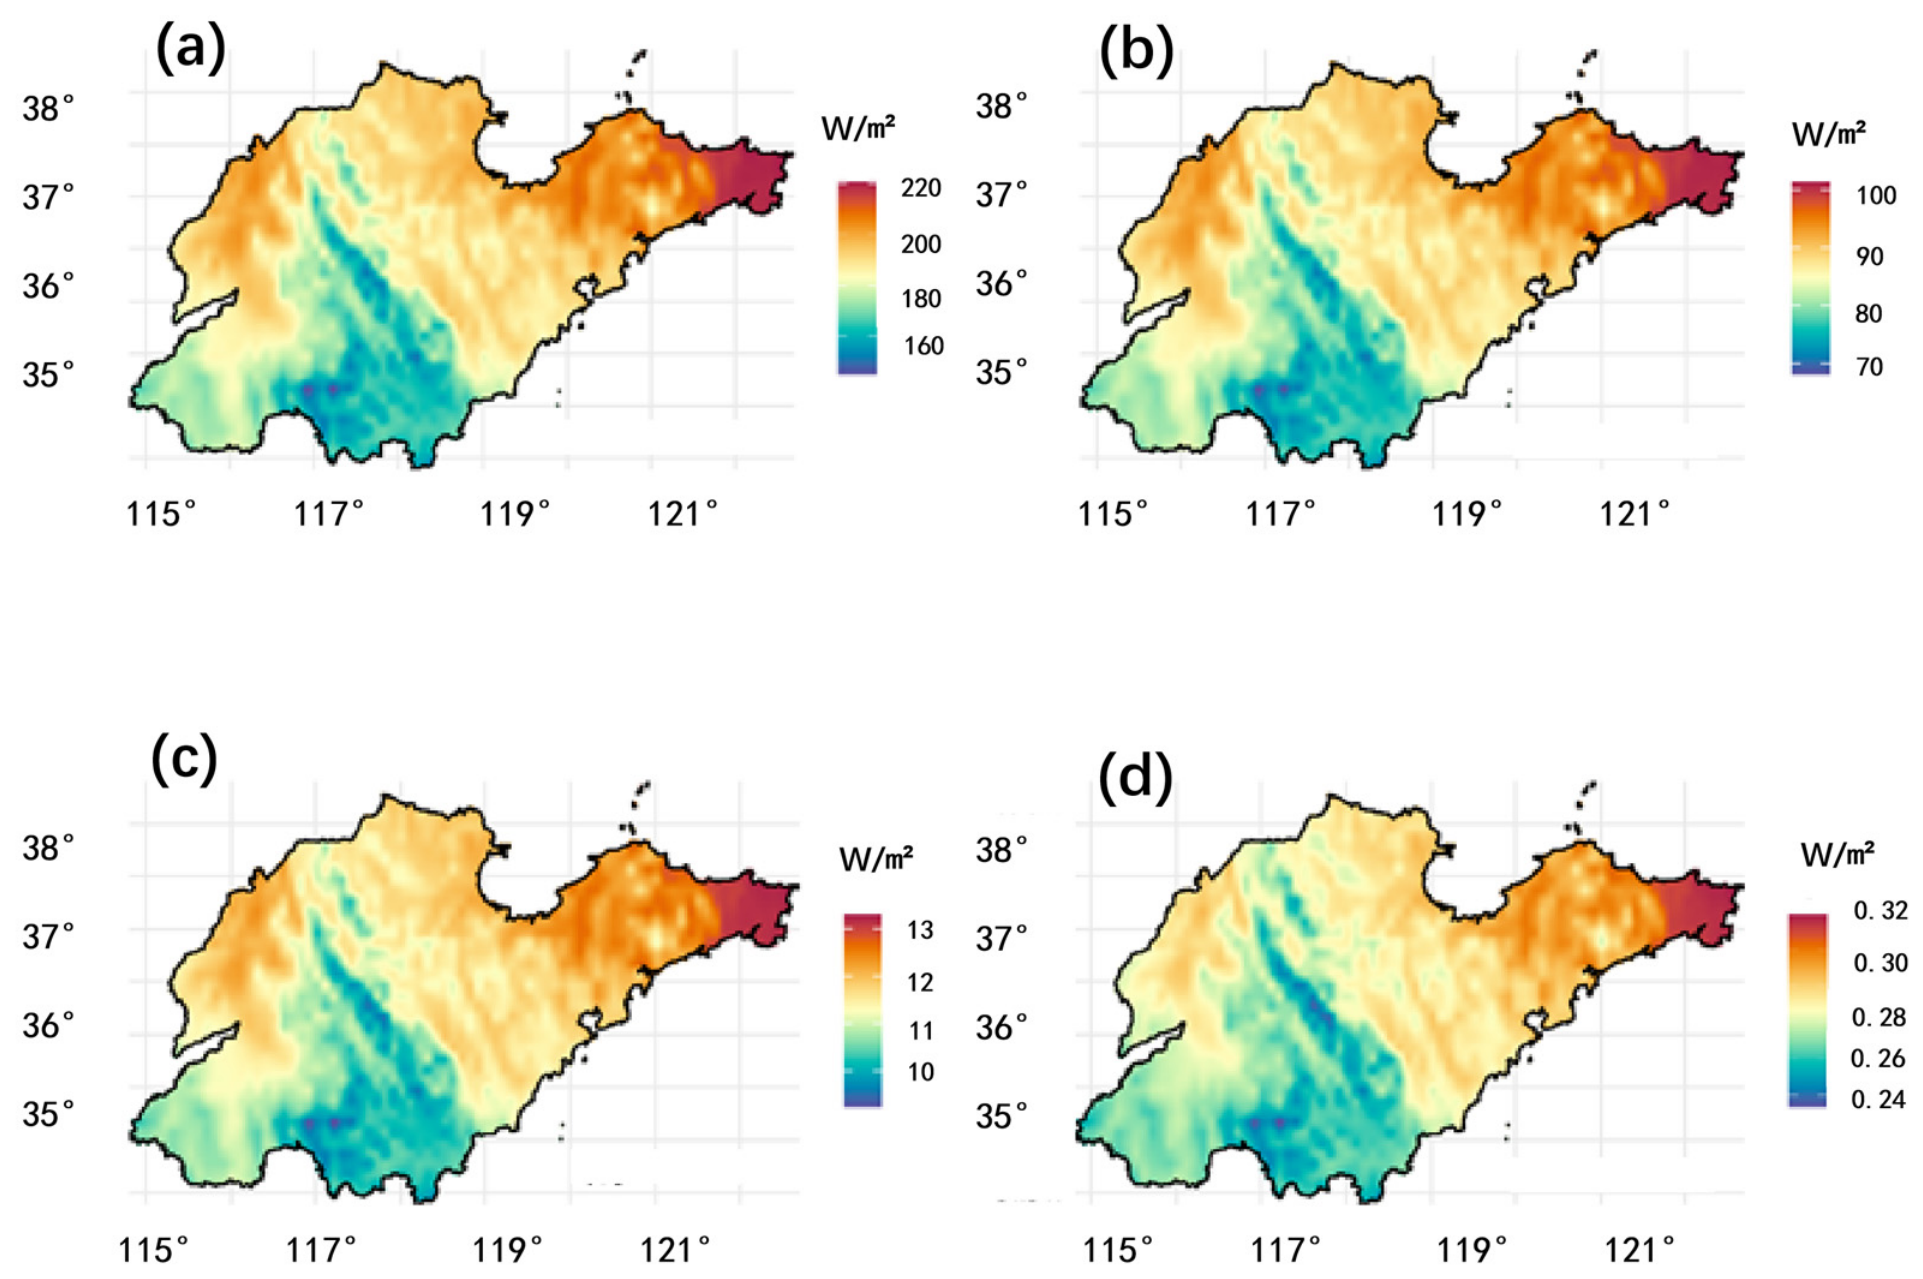
The five-year mean spatial distributions of SWR, PAR, UVA, and UVB over Shandong Province (2016–2020) are shown in
Figure 2. All four radiation components exhibit a broadly consistent “east-high, west-low; north-high, south-low” pattern, reflecting the co-varying spatial gradients in terrain flatness, atmospheric transparency, and urbanization intensity.
The provincial five-year mean SWR is 186.6 W/m2. The highest SWR (~221.0 W/m2) occurs along the eastern coast of the Jiaodong Peninsula (122.61° E, 37.37° N), characterized by flat topography and high atmospheric transparency. The lowest SWR (~142.7 W/m2) is located in southern Shandong (117.22° E, 35.17° N), where mountainous terrain causes pronounced shading, and major urban clusters (Jinan, Zibo) generate aerosol-induced radiation deficits—forming localized radiation “shadow zones.” PAR closely tracks SWR spatially, with a provincial mean of 86.3 W/m2, a maximum of 101.5 W/m2 in the Jiaodong Peninsula, and a minimum of 67.0 W/m2 in southern Shandong.
UVA and UVB distributions broadly parallel those of SWR and PAR. Provincial means are 11.4 W/m2 (UVA) and 0.3 W/m2 (UVB). Low UVA values in southwestern Shandong (Heze, Jining) may reflect enhanced aerosol absorption in addition to terrain effects. The spatial coherence across all four bands confirms that cloud cover and terrain are the primary modulators of the radiation field, with secondary contributions from aerosol-loaded urban areas.
3.2. Interannual Trend Analysis
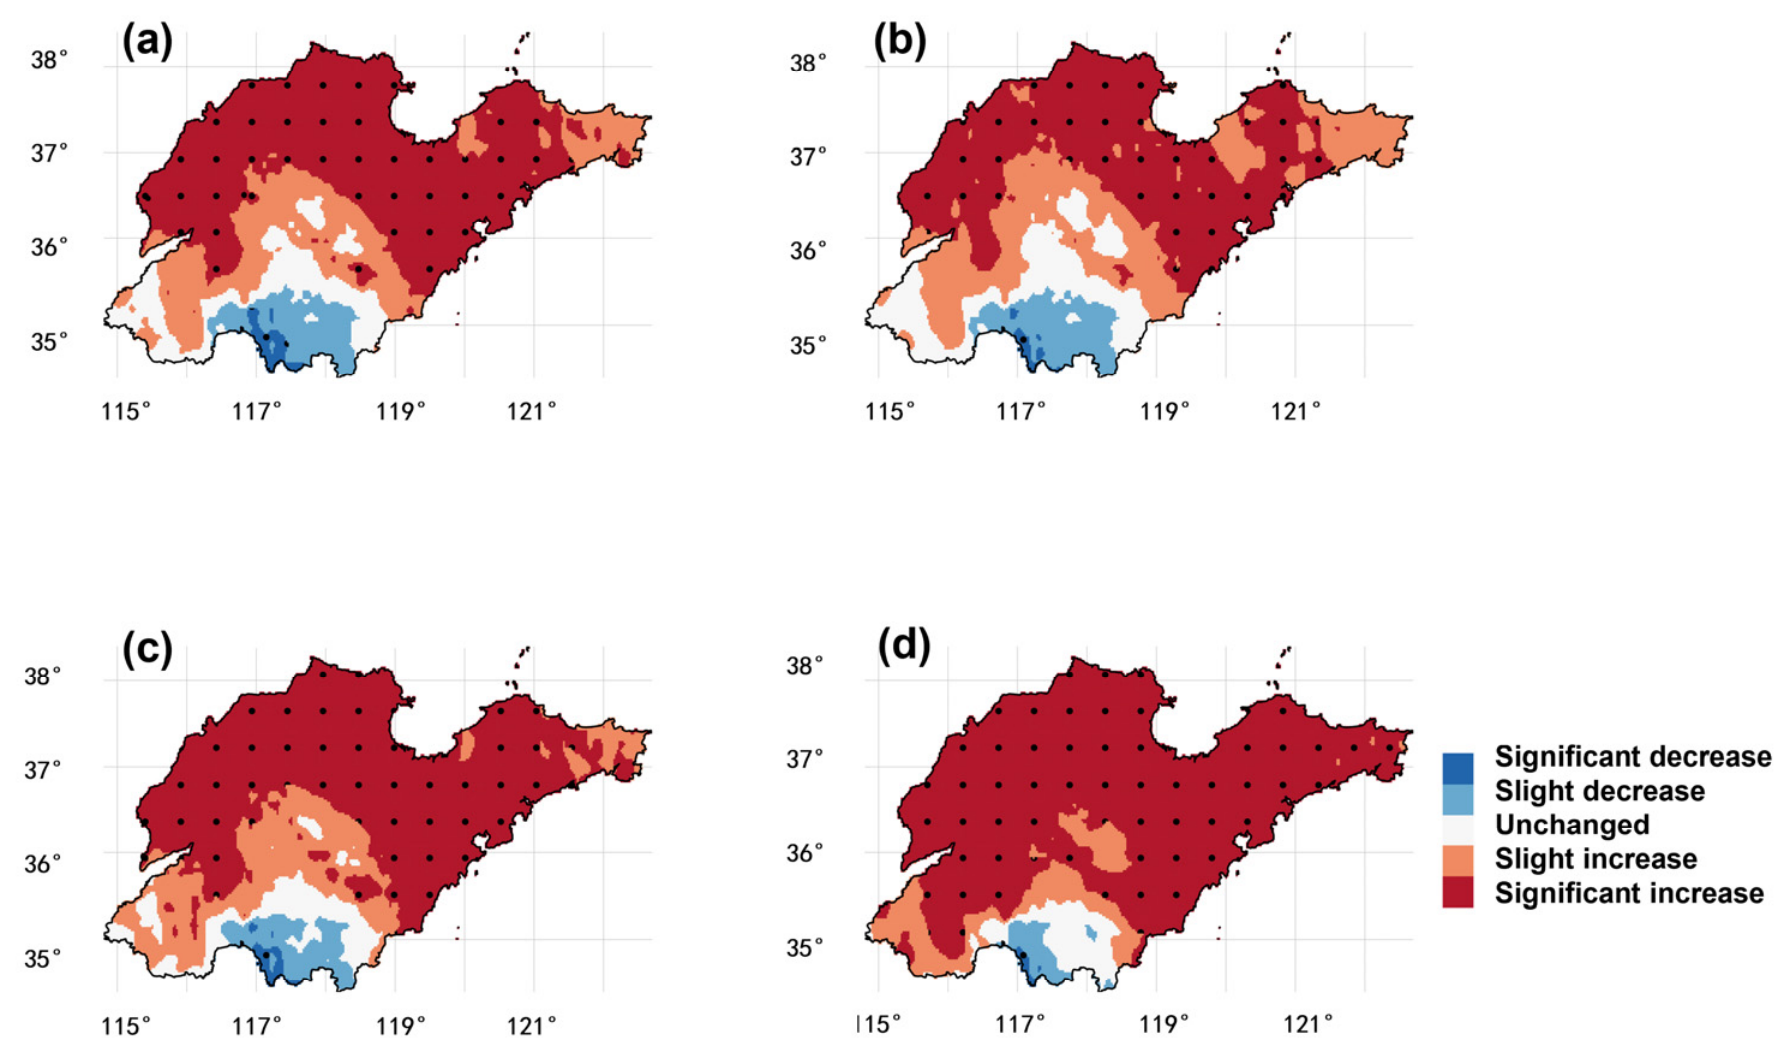
The spatial classification of radiation trends over 2016–2020 is presented in
Figure 3. Increasing trends (significant + slight) dominate for all components: SWR%, PAR 78.0%, UVA 85.1%, and UVB 91.3%. Areas of significant increase are concentrated in the North Shandong Plain and the eastern Jiaodong Peninsula, regions where air quality improvements (reduced aerosol loading) have been most pronounced. The exceptionally high proportion of UVB increases (91.3% of pixels; significantly increasing 80.1%) reflects UVB’s sensitivity to stratospheric ozone and aerosol optical depth.
Notably, all four radiation components exhibit declining trends in winter (December–February), indicating that winter solar resources in Shandong weakened during the study period—a finding with direct implications for seasonal PV yield assessment. Localized decrease zones (~8.1% of pixels for SWR) persist in the Central-South Shandong highlands and around southwestern urban clusters, attributable to topographic shading and continued aerosol emissions.
3.3. Seasonal Variation
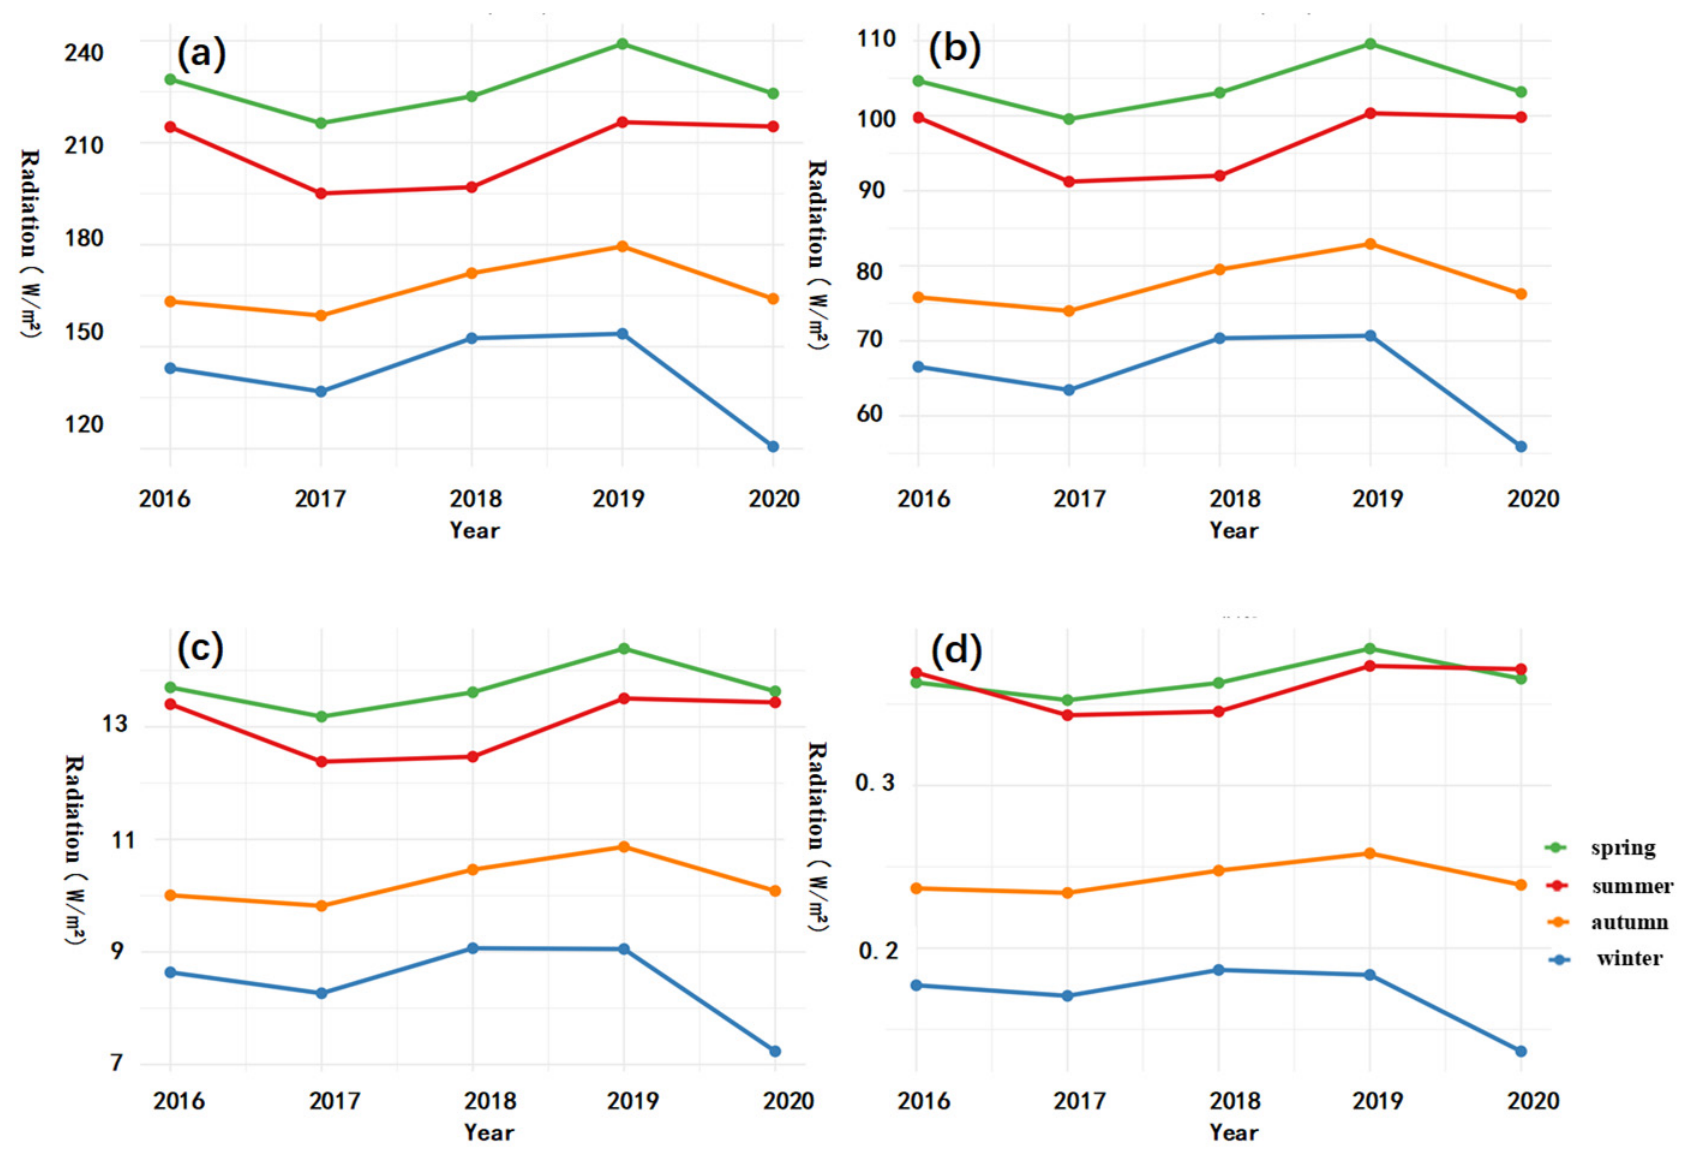
Provincial mean SWR by season is: spring 226.3 ± 9.4 W/m
2, summer 207.5 ± 12.1 W/m
2, autumn 167.5 ± 8.2 W/m
2, and winter 141.5 ± 6.5 W/m
2 (
Figure 4). A paired t-test confirms that spring SWR is significantly higher than summer SWR (
p = 0.024 < 0.05), validating the ‘spring-higher-than-summer’ anomaly. This anomaly is consistent across all four bands and is attributed to enhanced cloud cover and aerosol hygroscopic growth during the East Asian summer monsoon. High-value zones (>230 W/m
2 SWR) are consistently located along the Jiaodong Peninsula coast and in the North Shandong Plain, while low-value zones (<170 W/m
2) occupy the central-southern Shandong highlands and southwestern urban clusters.
Winter radiation is lowest, with a provincial mean SWR of only 141.5 W/m2. The spatial gradient is most pronounced in winter, with the Jiaodong Peninsula coastal area (SWR ~200 W/m2) experiencing nearly 2.4 times the radiation of the southwestern plain (~82 W/m2). UVB exhibits the largest relative seasonal amplitude, with summer-to-winter ratios exceeding 2:1, reflecting its stronger dependence on the solar zenith angle and the atmospheric ozone column.
UVA seasonal means are: spring 13.70 W/m2, summer 13.04 W/m2, autumn 10.25 W/m2, and winter 8.45 W/m2. UVB means are: spring 0.37 W/m2, summer 0.36 W/m2, autumn 0.24 W/m2, and winter 0.17 W/m2. Interannual trends within each season show that spring, summer, and autumn radiation values generally increased from 2016 to 2019 before declining in 2020, while winter radiation declined consistently throughout the study period.
3.4. STL Time-Series Decomposition
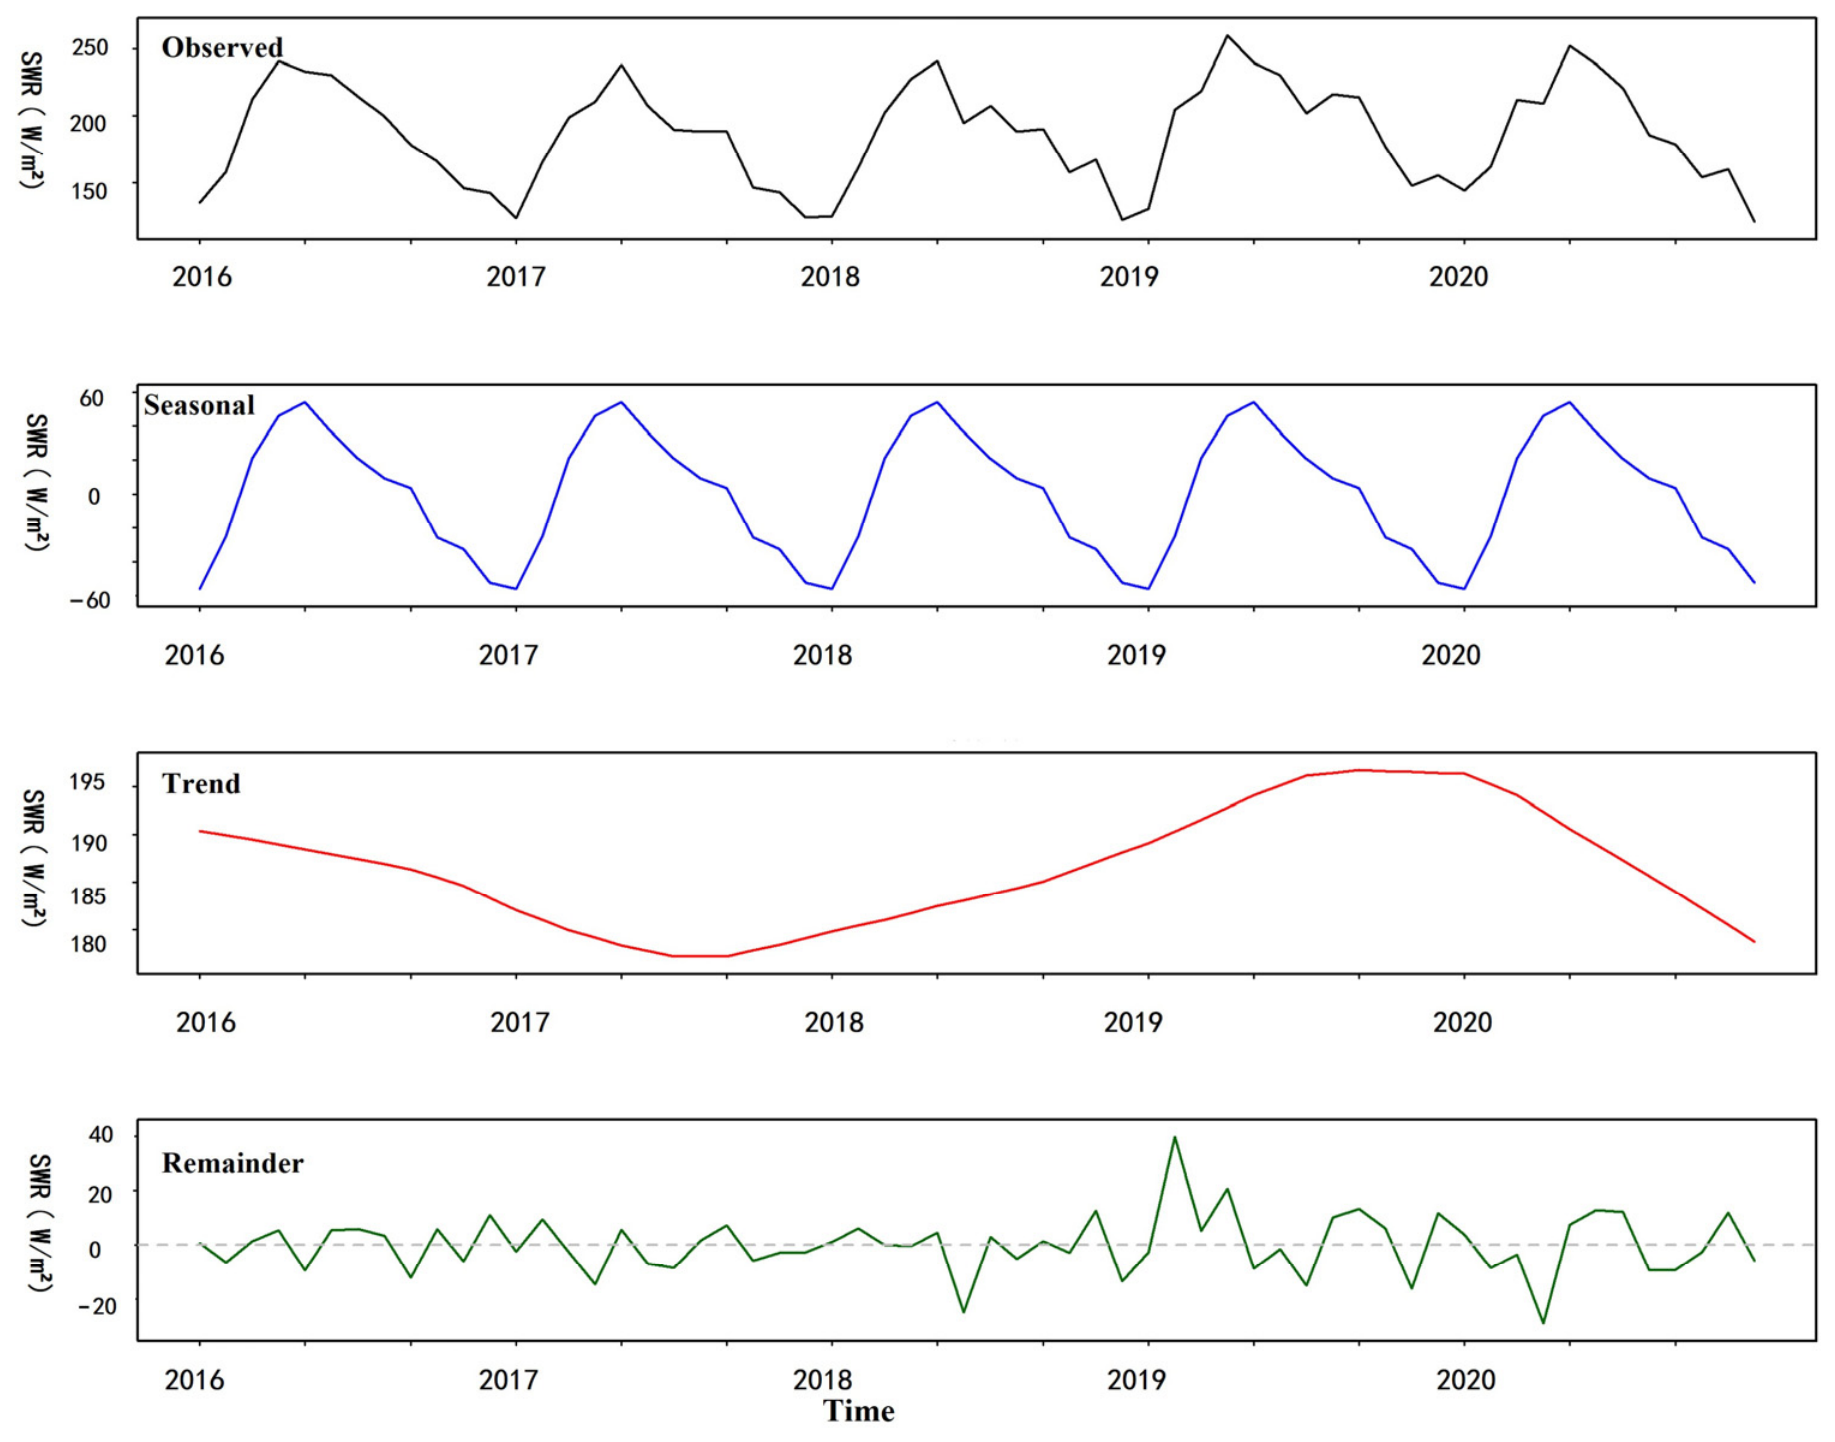
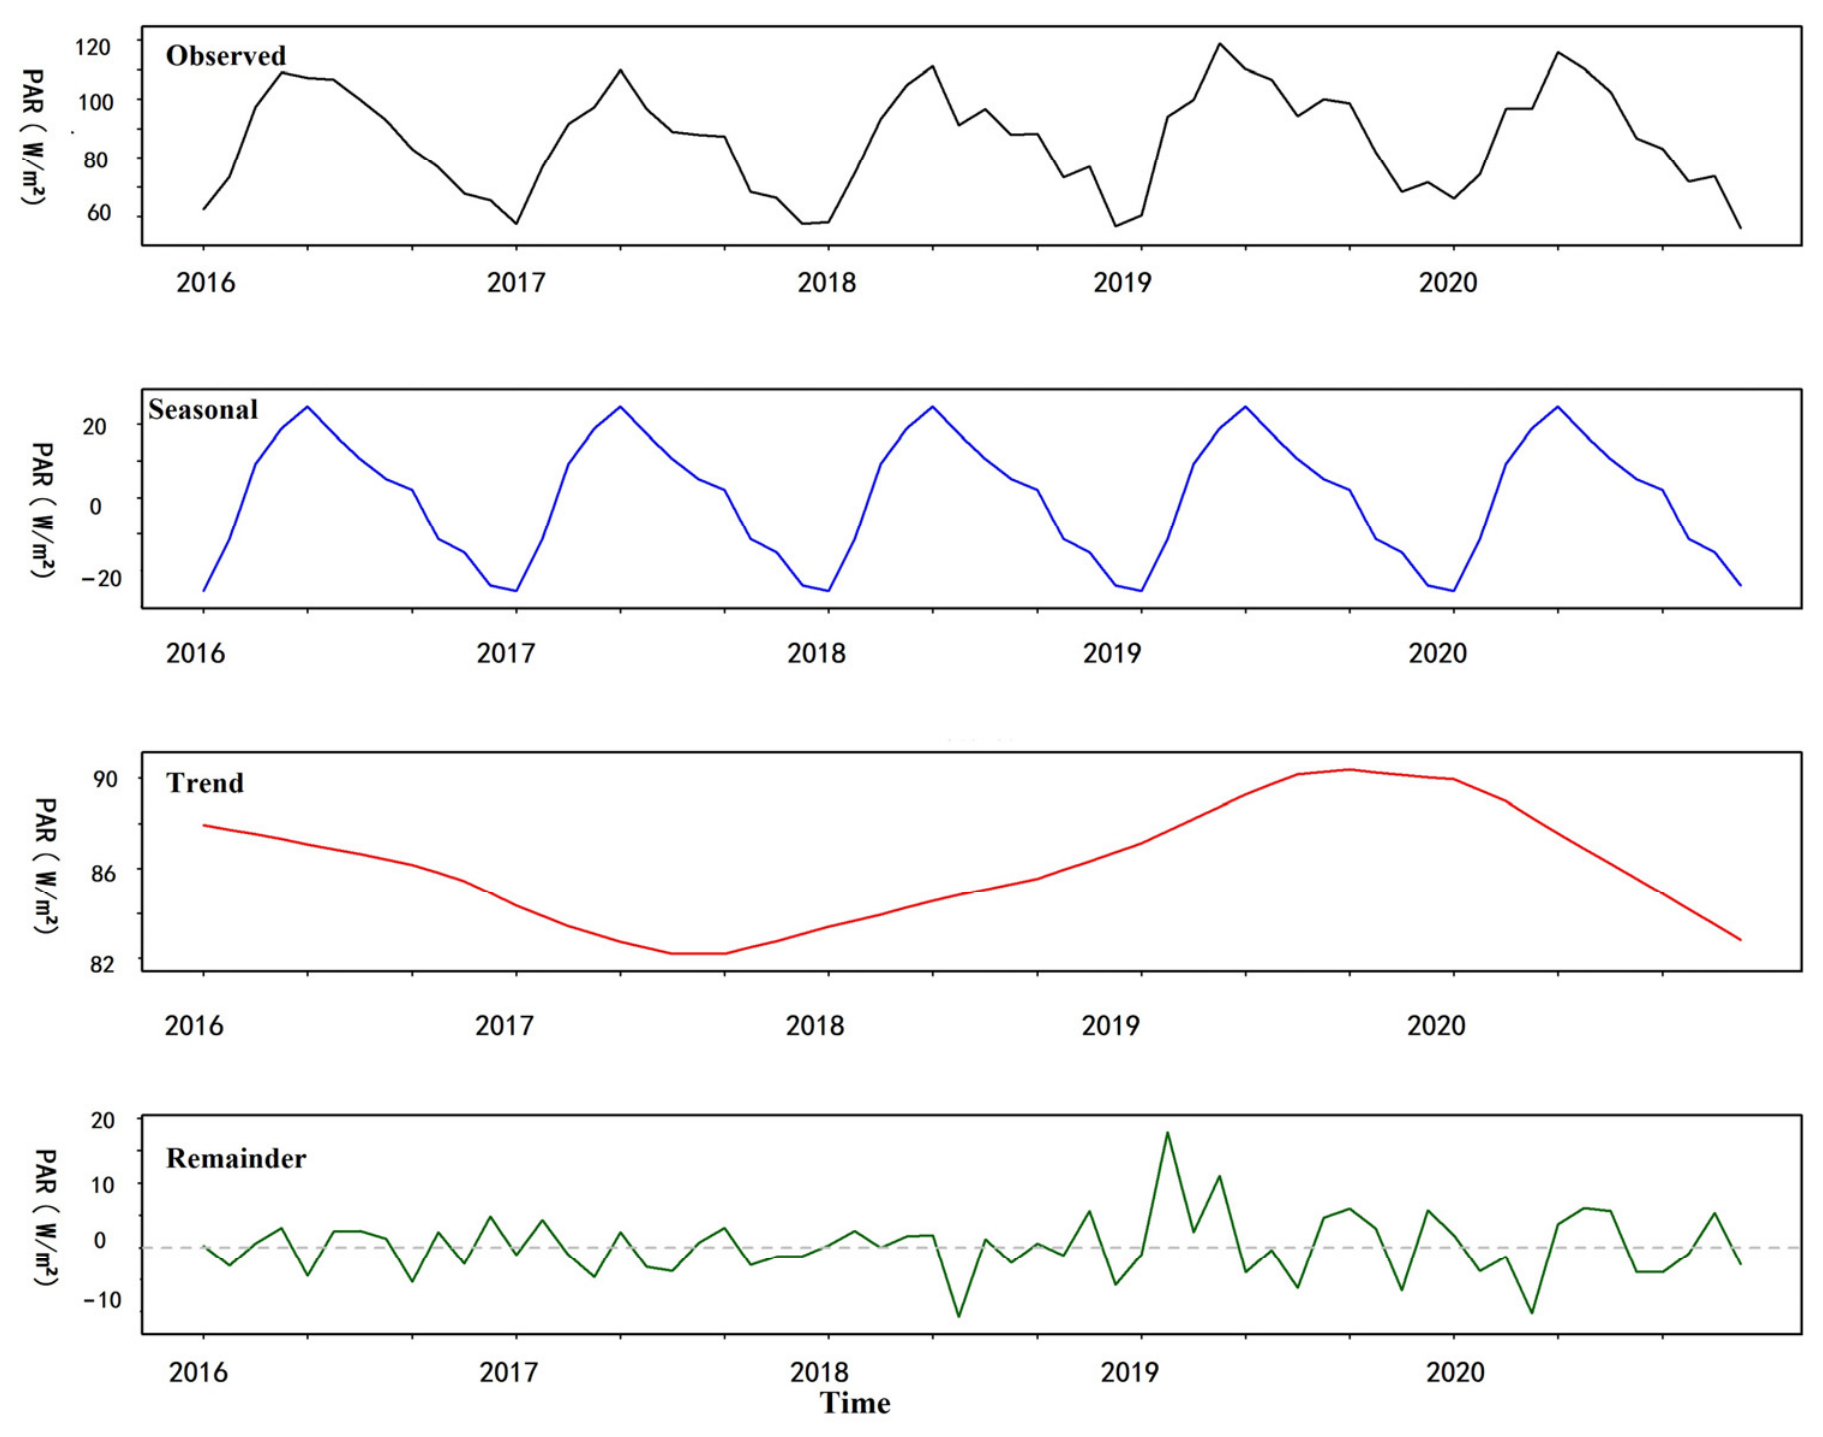
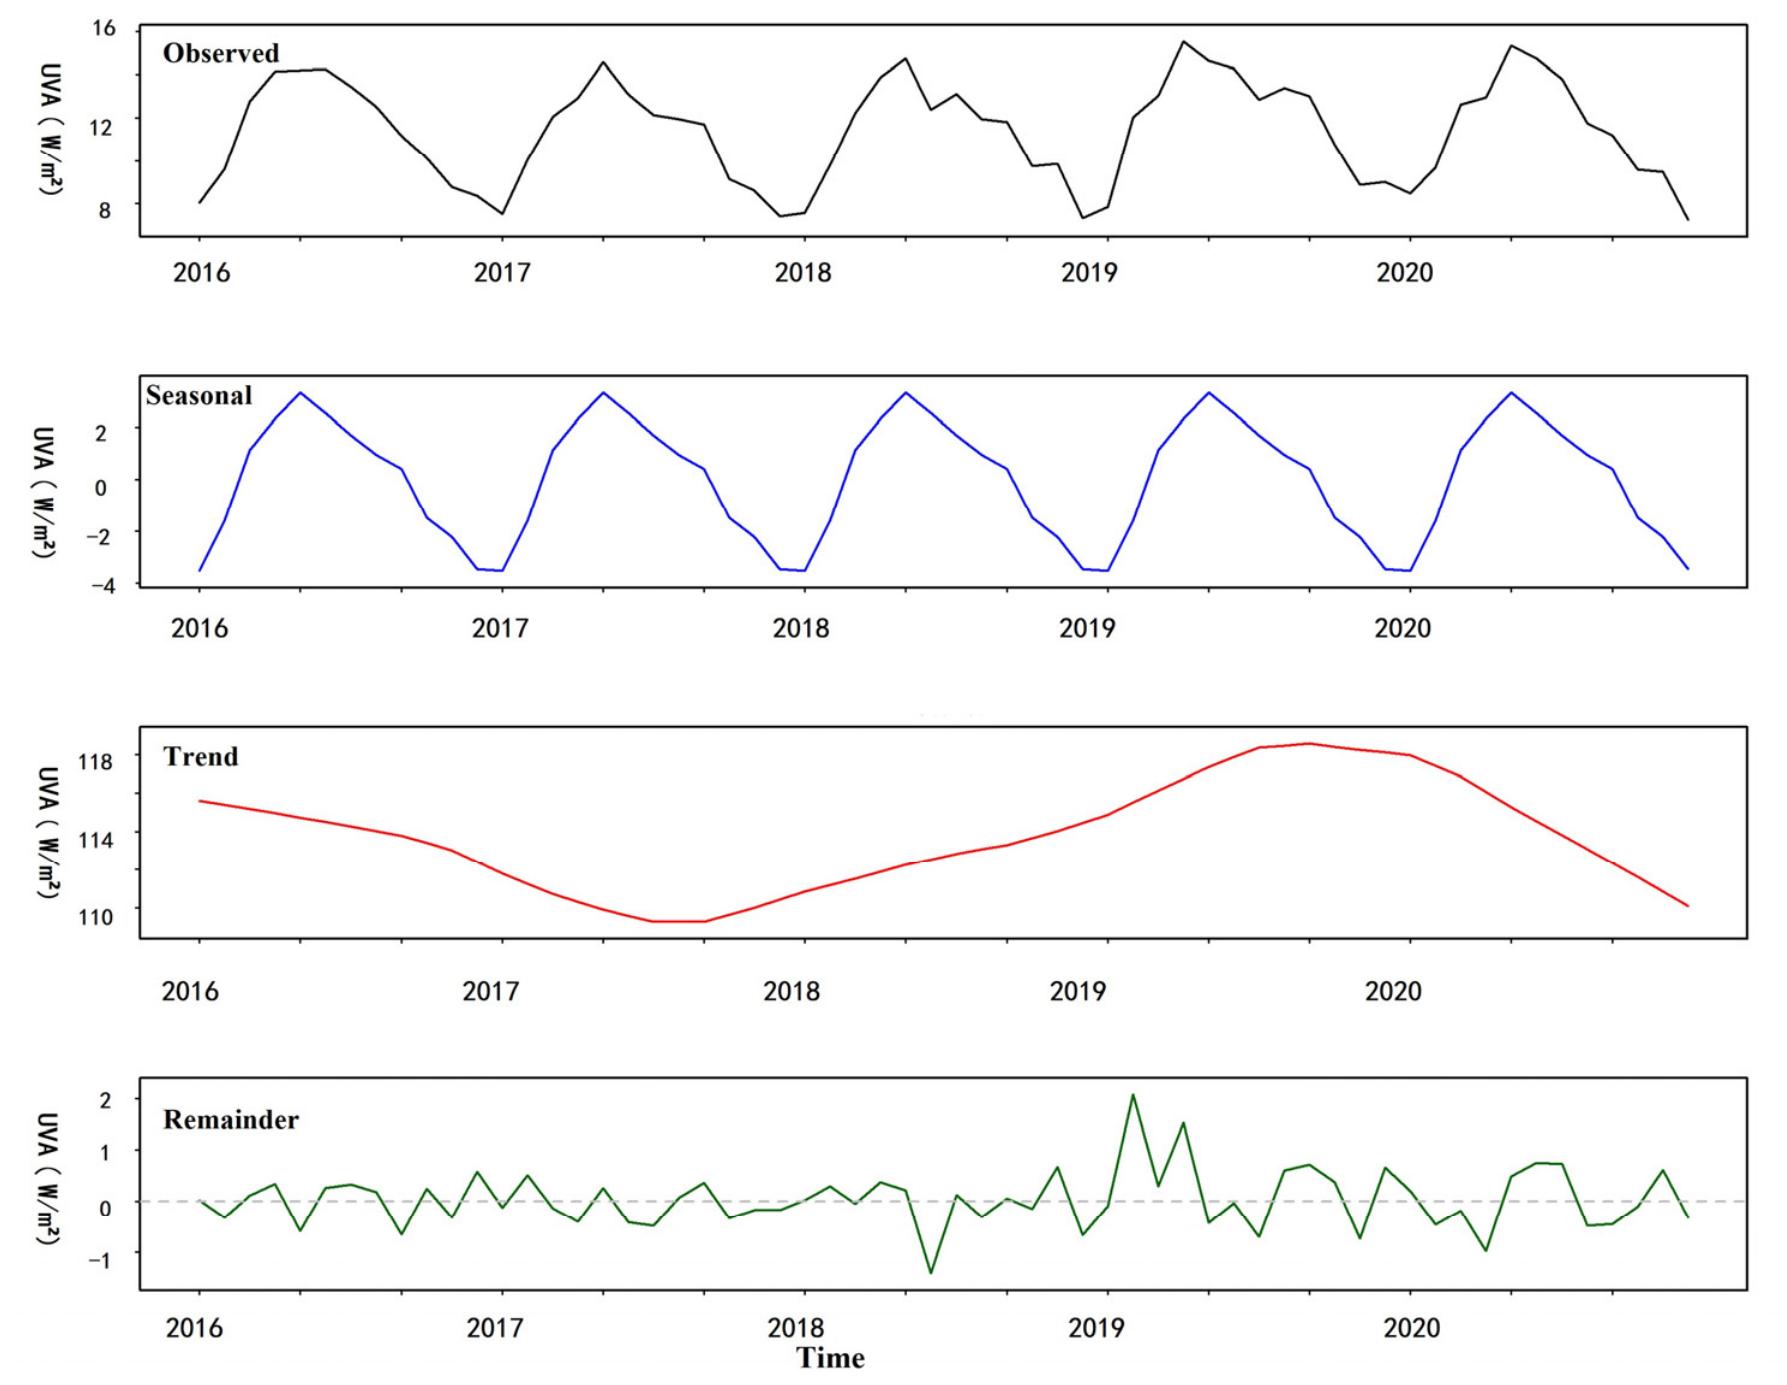
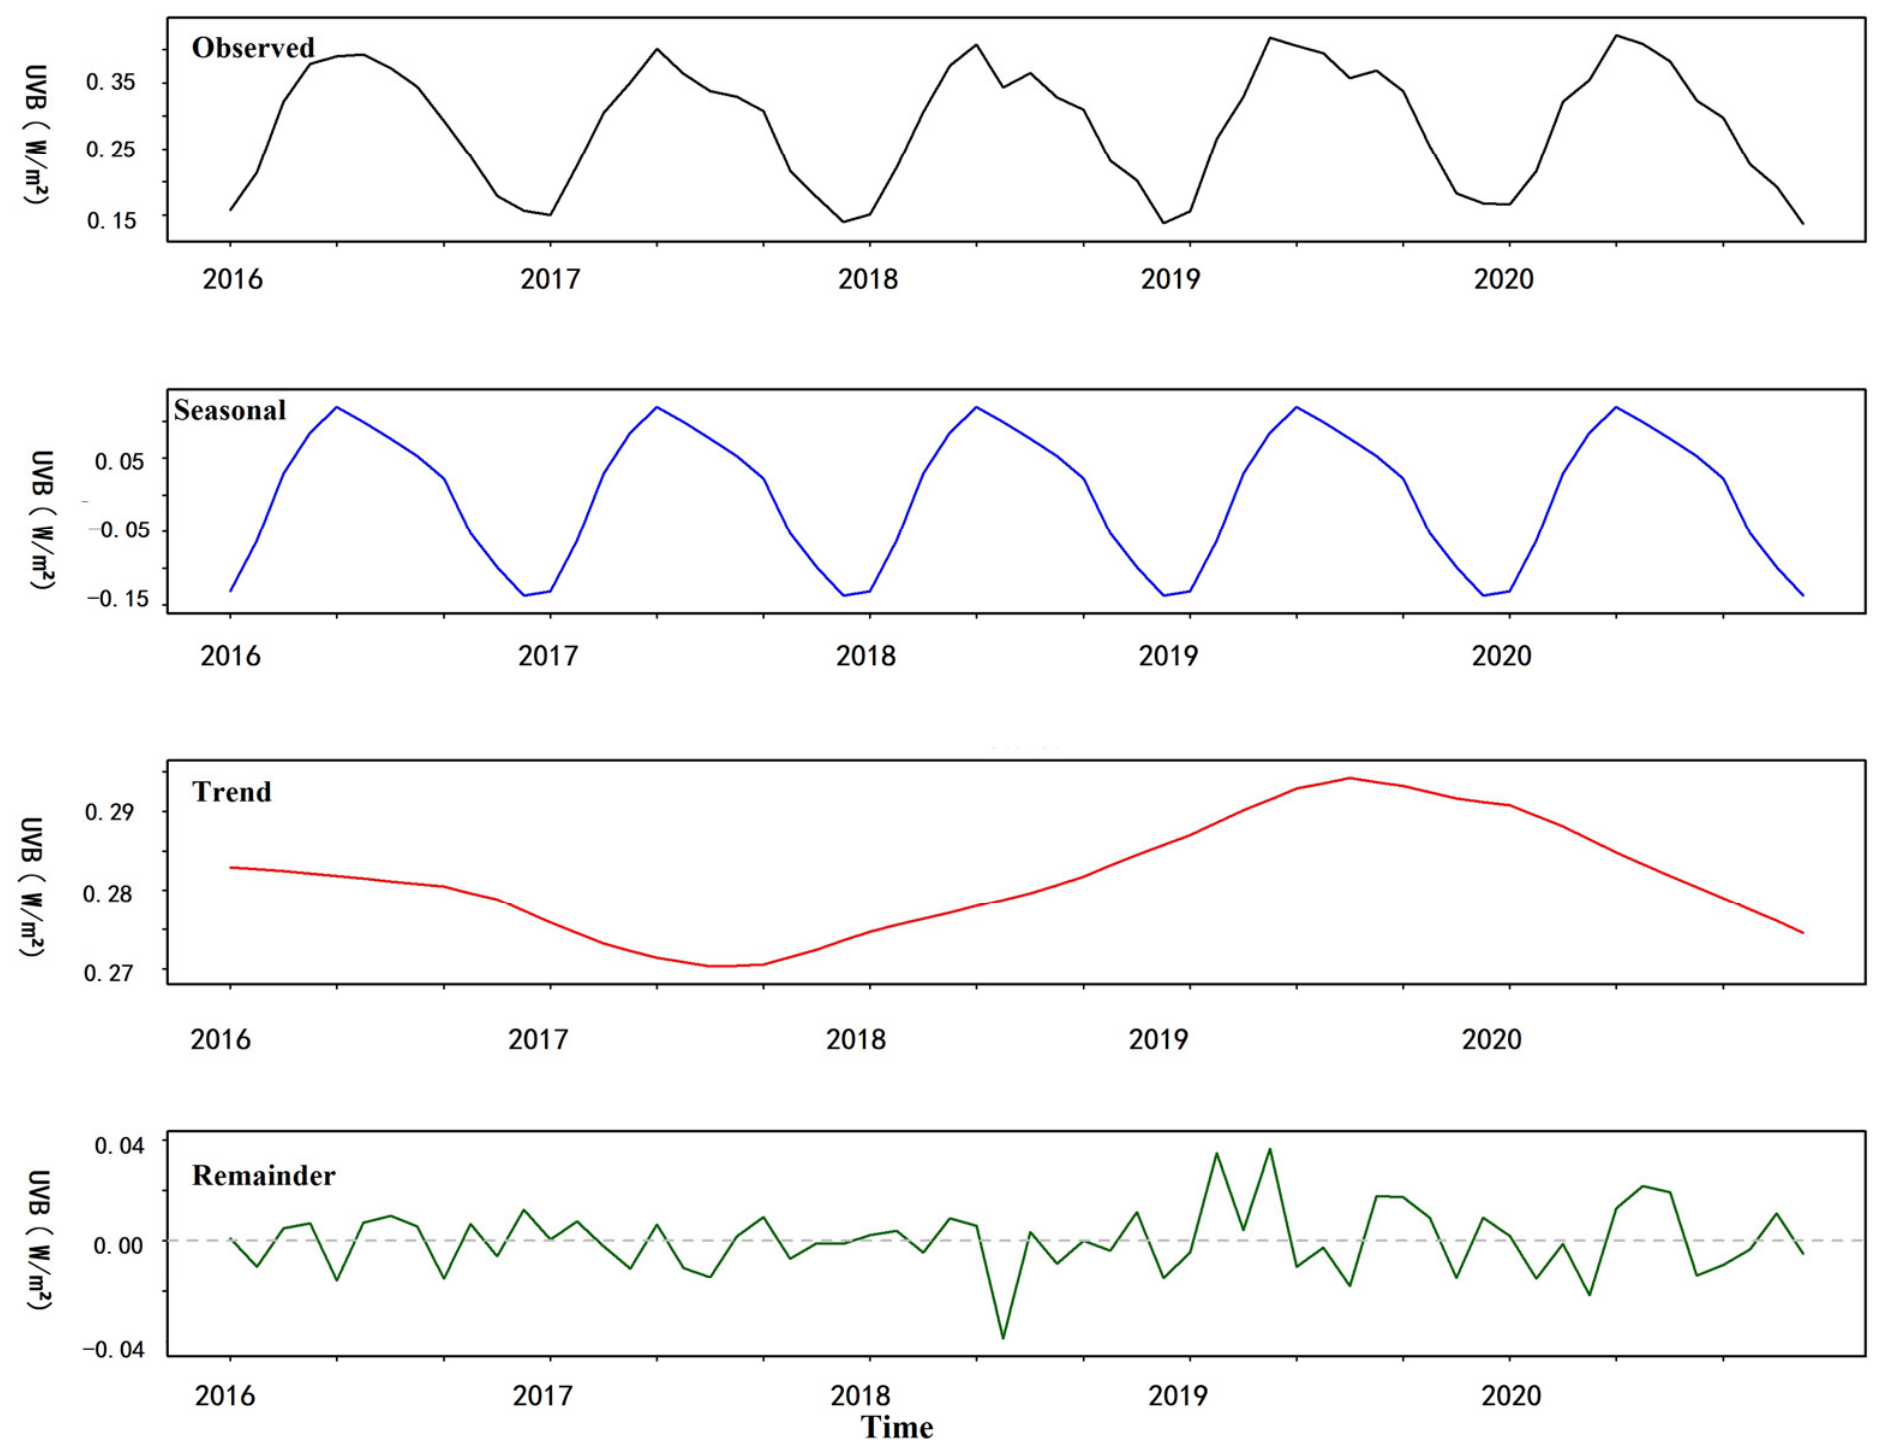
STL decomposition of the 60-month provincial mean radiation series is presented in
Figure 5,
Figure 6,
Figure 7 and
Figure 8 for SWR, PAR, UVA, and UVB, respectively.
All four radiation components follow a consistent trajectory: an initial decline from early 2016, reaching a trough in July 2017 (SWR: 177.2 W/m2; PAR: 82.2 W/m2; UVA: 10.9 W/m2; UVB: 0.28 W/m2), followed by recovery to a peak in September 2019 (SWR: 196.7 W/m2; PAR: 90.4 W/m2; UVA: 11.9 W/m2; UVB: 0.30 W/m2), and a subsequent decline through late 2020. This ‘down-up-down’ pattern is chronologically consistent with the implementation phases of air quality improvement initiatives, although natural interannual variability cannot be fully excluded.
A unimodal annual cycle is evident for all bands, peaking in May and reaching a minimum in January (SWR, PAR, UVA) or December (UVB). SWR seasonal amplitude reaches ±56 W/m2, while UVB amplitude of ±0.13 W/m2 represents ~45% of its mean—confirming that UVB is the most seasonally variable band on a relative basis.
Extreme residuals are linked to identifiable synoptic events. The largest positive SWR residual (39.6 W/m2) appeared in February 2019, when fog and haze cleared following a persistent pollution episode, leading to extended sunny conditions. The most negative PAR residual (−10.9 W/m2) and UVA residual (−1.4 W/m2) occurred in June 2018, coinciding with repeated heavy rainfall (provincial sunshine hours being 65.1 h below the climatological mean). The largest negative SWR residual (−29.1 W/m2) appeared in April 2020, associated with concurrent dust transport from the northwest and severe convective storms across central Shandong. These results demonstrate that extreme weather events can cause short-term radiation deviations of ±15–20% relative to the seasonal mean.
It is important to address why the STL decomposition pathways for SWR, PAR, UVA, and UVB exhibit highly parallel temporal profiles. This strong synchronization is not an artifact, but a reflection of both physical and algorithmic realities. Physically, all four multi-band components represent sub-regimes of the same solar downwelling spectrum, and their temporal variations are overwhelmingly governed by identical bulk atmospheric modulators, primarily macroscale cloud decks and regional aerosol fields. Algorithmically, the CARE satellite products utilize unified cloud optical properties as key input parameters across all bands during radiative transfer modeling. Importantly, this highly synchronized temporal pathway among multi-band solar radiation components is fully consistent with previous large-scale studies in China, which similarly demonstrated near-identical seasonal, trend, and remainder profiles for these closely coupled spectral bands after time-series decomposition. Consequently, while each band possesses unique spectral magnitudes and localized absorption coefficients (e.g., ozone absorption constraining UVB), their standardized temporal trajectories remain tightly collinear due to shared atmospheric forcing.
3.5. Driving Factors of Radiation Spatial Heterogeneity
3.5.1. Hotspot Analysis
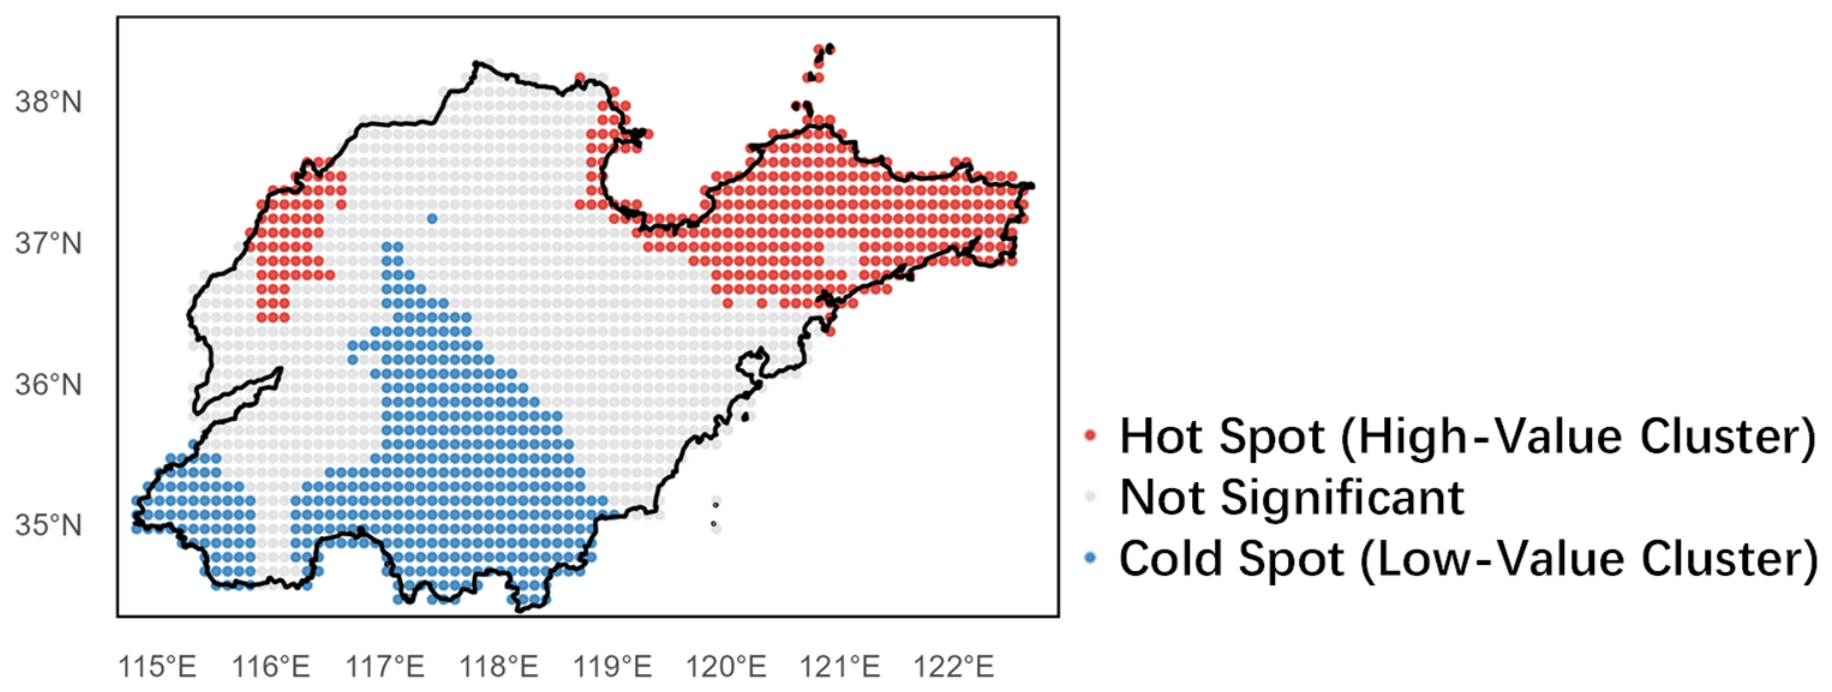
Getis-Ord Gi* analysis (
Figure 9) identifies two distinct hotspot clusters for the five-year mean SWR: the eastern Jiaodong Peninsula coast (Weihai and Yantai) and the North Shandong Plain (Dongying, Binzhou, Dezhou). These regions exhibit both high SWR values and statistically significant spatial concentration. Coldspot zones appear in two archetypes: (i) topographic coldspots in the central-southern Shandong highlands (Mt. Tai and Yimeng Mountains), driven by terrain shading and elevated cloud frequency; and (ii) urban coldspots along the contiguous Jinan–Zibo–Weifang metropolitan corridor, where aerosol loading from industrial and traffic emissions creates a spatially continuous radiation deficit belt. This clustering pattern provides a statistically grounded framework for macroscale PV resource zoning.
3.5.2. Single-Factor Geodetector Results
SWR was selected as the representative target variable for the Geodetector analysis as it captures the total downwelling solar flux and is the primary metric for PV potential assessment. Moreover, as established in
Section 3.1 and
Section 3.4, PAR, UVA, and UVB exhibit extremely high spatial collinearity and identical temporal trajectories with SWR. Since all four components are modulated by shared atmospheric drivers within the CARE algorithm, the factor attribution results for SWR are physically representative of the other spectral bands.
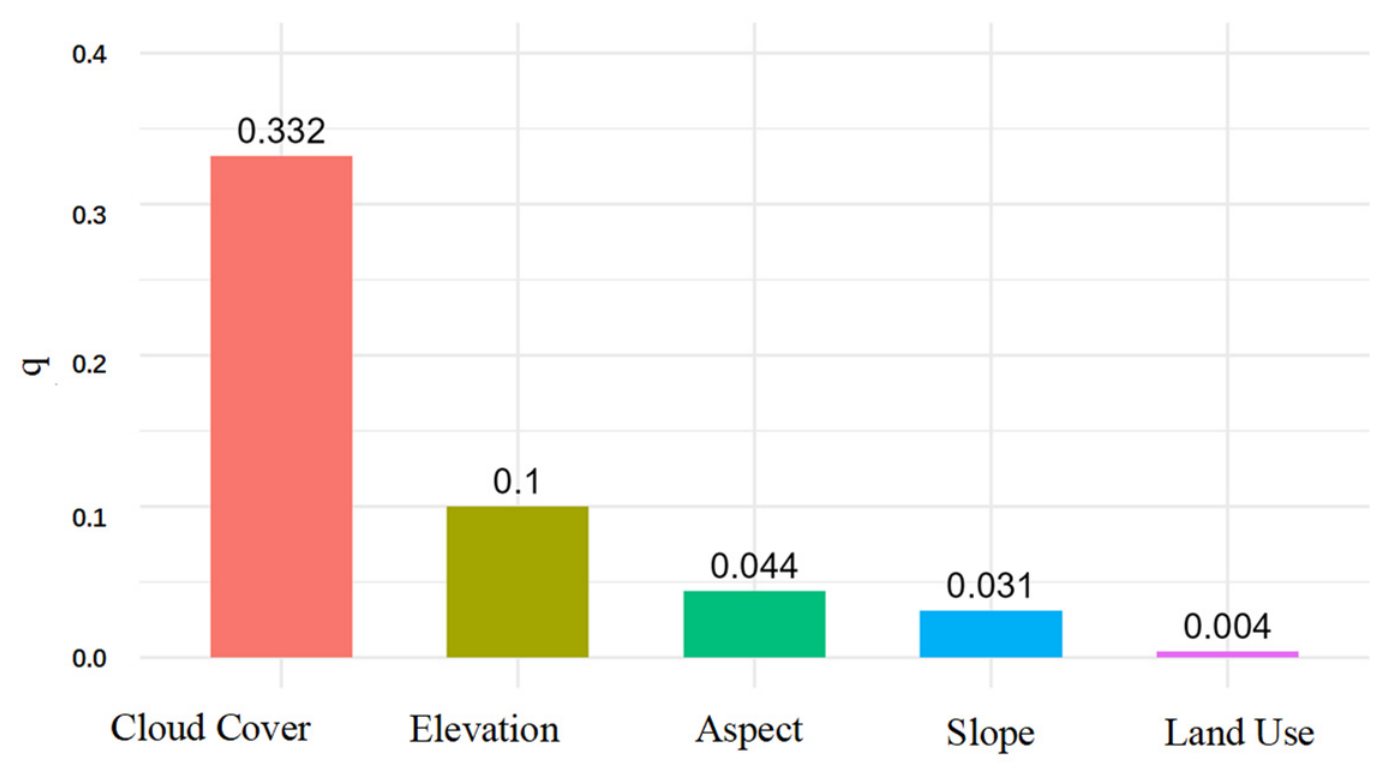
The q values for the five explanatory factors are shown in
Figure 10. Ranked from highest to lowest: cloud cover (q = 0.332) > elevation (q = 0.100) > aspect (q = 0.044) > slope (q = 0.031) > land-use type (q = 0.004); all factors pass significance tests (
p < 0.01).
Cloud cover is the dominant factor (q = 0.332), consistent with its direct attenuation of incoming solar radiation. Its spatial pattern—lower cloud cover along the Jiaodong coastal fringe and higher in southwestern Shandong—closely matches the observed radiation gradient. Elevation ranks second (q = 0.100), reflecting topographic shading and longer atmospheric path lengths in mountainous areas. Aspect and slope contribute modestly (q = 0.044 and 0.031). Land-use type has the lowest individual q value (q = 0.004), partly because its spatial pattern co-varies strongly with cloud cover and elevation.
3.5.3. Interaction Detection
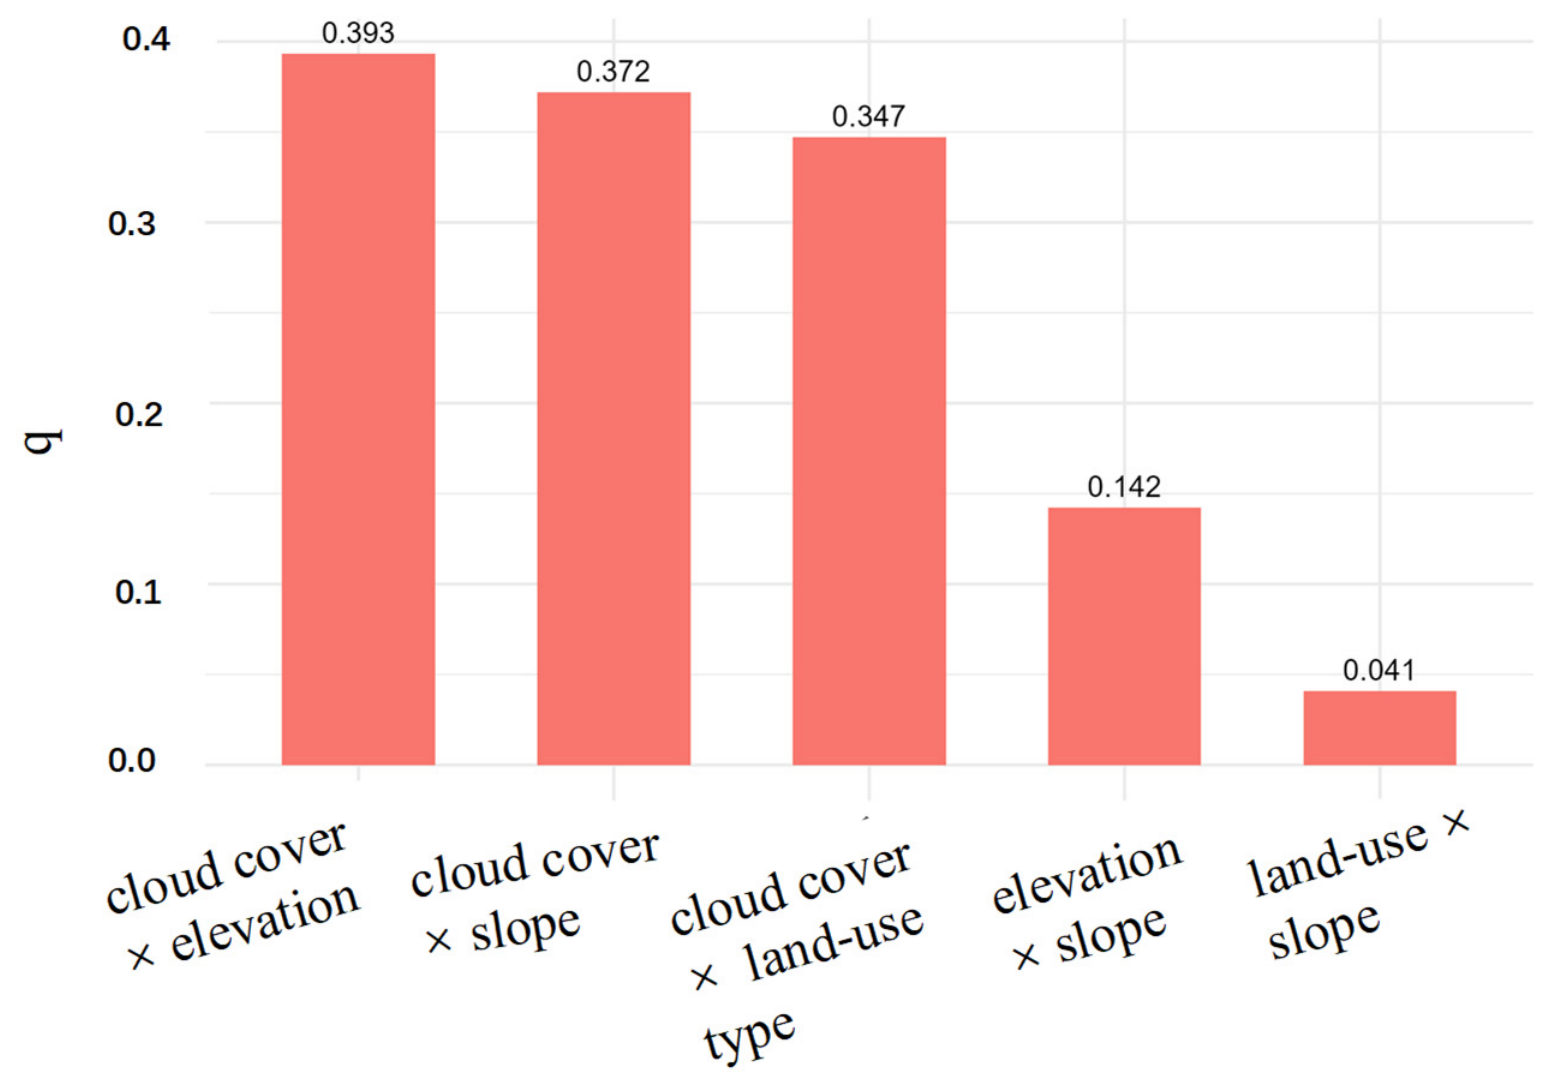
Interaction detection reveals nonlinear enhancement for all factor pairs, with interaction q values exceeding the maximum of either single-factor q (
Figure 11). The cloud cover × elevation interaction is strongest (q = 0.393), substantially exceeding both individual values (0.332 and 0.100), reflecting the coupled influence of large-scale atmospheric circulation and orographic uplift. Cloud cover × slope (q = 0.372) and cloud cover × land use type (q = 0.347) also show pronounced nonlinear enhancement. While the individual explanatory power of land-use type is low (q = 0.004), its interaction with cloud cover reveals significant nonlinear enhancement (q = 0.347). This synergistic effect serves as a spatial proxy for the aerosol–cloud coupling mechanism. Anthropogenic emissions from industrial and urban corridors provide abundant aerosol particles that act as cloud condensation nuclei (CCN), thereby increasing cloud optical thickness and suppressing surface SWR more effectively than cloud cover alone. This explains the spatial convergence of radiation low-value zones and major urban clusters (e.g., Jinan and Zibo). Elevation × slope (q = 0.142) and land-use × slope (q = 0.041) show weaker but still nonlinearly enhanced interactions.
Land-use type affects the surface energy balance and local climate by altering the reflectivity, roughness and thermal properties of the underlying surface, thereby exerting a significant influence on the reception and redistribution of solar radiation. Cropland is the dominant land-use type in Shandong Province, widely distributed across the North Shandong Plain, southwestern Shandong, and the western Jiaodong Peninsula, consistent with the province’s status as a major agricultural region. Built-up land is mainly concentrated in and around the metropolitan cores of Jinan, Qingdao, and Zibo, exhibiting a patchy distribution that extends linearly along transportation corridors. Forest and shrubland are primarily located in the central-southern Shandong highlands (Mount Tai and Yimeng Mountains) and the Jiaodong hills. Wetlands are concentrated in the Yellow River Delta and around Lakes Nansi and Dongping. Road/grassland is sporadically distributed in the peripheral areas of the central-southern highlands and along the coastal zones. The five-year average SWR values corresponding to each category are shown in
Table 2. As shown in
Table 2, built-up land records the lowest mean SWR (172.4 W/m
2), which is significantly lower than that of cropland (185.3 W/m
2) and wetlands (approximately 180 W/m
2) (
p < 0.05). This reduction can be attributed to two mechanisms: (i) elevated aerosol loading (PM
2.5, AOD) over urban areas, which scatters and absorbs incoming shortwave radiation; and (ii) the high heat storage capacity of artificial surfaces (concrete, asphalt), which alters local energy partitioning. Cropland exhibits relatively high SWR (185.3 W/m
2), primarily because it occupies flat, unobstructed plains with favorable radiation reception conditions. Wetland’s SWR lies between that of cropland and built-up land, which may be related to the high albedo and evaporative cooling effects of water surfaces. Forest and road/grassland have SWR values of 178.6 W/m
2 and 180.1 W/m
2, respectively, falling into the intermediate range, which is associated with mountainous shading and higher vegetation coverage.
4. Discussion
4.1. Comparison with Previous Studies
The finding that Shandong solar radiation predominantly exhibited increasing trends during 2016–2020 is broadly consistent with Li et al. [
11], who documented rising SWR, PAR, and UVB across most of China using the same CARE product over the identical period. However, our results reveal a notably higher proportion of significantly increasing UVB pixels (80.1%) compared to the national average, suggesting that Shandong’s air quality improvements, driven by national clean-air policy campaigns, have disproportionately enhanced UV transparency. This coincides temporally with the implementation phases of clean-air initiatives, specifically a policy trough in mid-2017 and a peak in late-2019. It should be noted that while the 2016–2020 study period is relatively short for climatological trend analysis, this window specifically encompasses the most intensive implementation phase of China’s ‘Blue Sky’ Defense War and the ‘Three-Year Action Plan for Cleaner Air.’ Recent studies utilizing multi-source satellite AOD and PM
2.5 data have documented a sharp, nonlinear decline in particulate matter over the North China Plain during these specific years. This provides a plausible physical mechanism and a robust contextual basis for the radiation recovery observed in our CARE dataset. Therefore, the results presented here reflect a high-frequency response of the regional radiation environment to drastic anthropogenic emission reductions, rather than a long-term climate shift.
Earlier station-based studies of Shandong solar radiation [
6] detected declining total solar radiation trends over 1961–2012, dominated by increasing aerosol loading during rapid industrialization. Our results for 2016–2020 represent a reversal of this long-term trend, reflecting nationwide pollution control efforts. This temporal contrast underscores the sensitivity of Shandong’s radiation environment to anthropogenic aerosol forcing and the need for continuous high-resolution monitoring.
The geodetector attribution hierarchy, namely cloud cover > elevation > aspect > slope > land-use, contrasts with He et al. [
15], who found aspect to be the leading factor (q = 0.694) in a mountainous terrain study. This discrepancy reflects the study-area context: Shandong’s predominantly flat terrain limits aspect variability, whereas large-scale atmospheric circulation-driven cloud cover dominates here. The strong cloud cover × elevation interaction (q = 0.393) aligns with the theoretical expectation that macroscale climate control and topographic modulation are mutually reinforcing.
4.2. Mechanistic Interpretation
The observed spatial heterogeneity, characterized by a decreasing radiation gradient from the eastern coast toward the western inland regions, is maintained by two co-varying gradients: (i) a westward increase in cloud cover, driven by moisture advection from the East China Sea and terrain effects; and (ii) a west-to-east reduction in aerosol loading, as prevailing westerly and southwesterly winds transport industrial aerosols from the densely populated North China Plain into western Shandong before dispersal. The urban radiation shadow zones around Jinan and Zibo represent the local maximum of this aerosol gradient.
The counterintuitive spring-higher-than-summer radiation pattern across all bands is explained by the combined effect of increased cloud frequency during the East Asian summer monsoon onset (June–August) and aerosol hygroscopic growth under high summer humidity. The statistical significance of this anomaly (
p < 0.05) reinforces the interpretation that atmospheric modulation dominates over solar geometry in Shandong. Although solar elevation angles reach their maximum in June (summer), the simultaneous onset of the East Asian summer monsoon introduces heavy cloud decks and promotes the hygroscopic growth of aerosols under high humidity, significantly increasing the cloud optical depth compared to the drier, clearer spring months. These atmospheric effects effectively outweigh the geometric advantage, consistent with findings for other monsoon-influenced regions in eastern China [
16,
17].
The nonlinear enhancement of cloud cover × land-use interaction (q = 0.347) is interpreted through a positive feedback loop: urban aerosols serve as cloud condensation nuclei, increasing cloud optical depth over cities; the resulting radiation reduction further suppresses surface heating, modifying local atmospheric stability and boundary-layer cloud properties [
18,
19]. This mechanism is rarely quantified at the provincial scale using satellite-derived radiation data.
Furthermore, a similar nonlinear coupling is reflected in the interaction between cloud cover and terrain slope (q = 0.372). It is worth noting that while the slope is physically critical for defining the solar incident angle and direct array attenuation at a micro-scale, its individual explanatory power (q = 0.031) in the global Geodetector model appears relatively low. This discrepancy is primarily attributed to the geographical context of Shandong Province, which is topographically dominated by vast, relatively flat agricultural plains. Because the slope varies minimally over a large portion of the region, its global statistical contribution to the overall spatial variance of radiation is mathematically constrained. However, its profound physical control is re-established when coupled with atmospheric dynamics: under clear-sky conditions, the local slope heavily dictates the geometric reception of direct beam radiation; conversely, under overcast conditions, intense cloud scattering transforms incoming solar radiation into isotropic diffuse fields, thereby dampening the geometric tilting effects typically imposed by the local topography. This scale-dependent synergy underscores that the physical influence of terrain slopes cannot be decoupled from the prevailing cloud regimes.
Additionally, a relevant question arises as to why the five-year average SWR values across different land-use types appear relatively close (ranging from 172.4 to 188.7 W/m2), given that distinct ecosystems (e.g., forests, grasslands, and wetlands) are typically modulated by varying regional precipitation and cloud regimes. This phenomenon is primarily a consequence of spatial compensation and statistical pooling at the provincial scale. In Shandong Province, certain land-use types are not confined to a single climatic zone but are geographically scattered across contrasting radiation environments. For instance, forests and grasslands are extensively distributed in both the Central-South highlands (characterized by low radiation due to orographic clouds) and the Jiaodong hills (characterized by high radiation and marine air clarity). When calculating the province-wide 5-year averages, these localized high- and low-value radiation regimes mathematically offset each other, resulting in clumped mean values. Conversely, built-up land remains a distinct exception with the lowest SWR (172.4 W/m2), because urban clusters consistently overlap with persistent industrial aerosol loading and enhanced cloud condensation nuclei, preventing such positive spatial compensation. This indicates that while macro-climate and cloudiness firmly govern the overall radiation field, the zonal characteristics of land use are statistically diluted when aggregated globally across a topographically mixed province.
4.3. Implications for Photovoltaic Site Selection
The integrated evidence from hotspot analysis and Geodetector attribution identifies three PV resource tiers in Shandong. Tier 1 (priority development): eastern Jiaodong Peninsula coastal areas (Weihai, Yantai) and the North Shandong Plain (Dongying, Binzhou), with consistently high SWR (>200 W/m2), statistically significant radiation clustering, and minimal terrain obstruction. These areas exhibit the strongest increasing trends and align with hotspot zones, providing both high energy yield and long-term resource growth potential. Tier 2 (conditional development): western plains and transitional hilly zones (SWR 175–195 W/m2), where distributed rooftop PV on agricultural and aquaculture facilities is promising, given that water bodies record the highest mean SWR among all land-use types (188.7 W/m2). Tier 3 (avoidance or supplementation): the central-southern Shandong highlands and core urban clusters, where terrain shading, elevated cloud cover, and aerosol-driven radiation deficits collectively suppress SWR below the provincial mean.
Furthermore, while this study provides a foundational tier-based ranking for solar exploitation based on remote sensing observations, practical multi-criteria photovoltaic (PV) micro-siting often requires the formulation of a structured value function to optimize the final location selection. A generalized value function (V) can be defined as V = , where represents the normalized spatial criteria (e.g., multi-band radiation components, proximity to the power grid, and terrain slopes) and denotes their corresponding optimization weights determined through methods like the Analytic Hierarchy Process (AHP) or machine learning algorithms. Integrating the high-resolution multi-band radiation datasets developed in this work into such mathematical value functions will significantly enhance the precision and techno-economic optimization of regional solar energy engineering.
The documented winter radiation decline has important implications for seasonal storage and grid integration planning. PV installations in Shandong should be designed with winter underperformance in mind, and complementary energy storage or diversified renewable portfolios (e.g., wind energy) should be considered.
4.4. Limitations and Future Work
Several limitations warrant acknowledgment. First, the five-year study period (2016–2020) is relatively short for long-term trend analysis; future work should extend the analysis as longer CARE archives become available, integrating longer-term meteorological station records for calibration. Second, explicit aerosol parameters (e.g., AOD) were not integrated as independent continuous factors in the Geodetector model. This is primarily due to data completeness constraints under cloudy conditions and the physical collinearity between aerosols and clouds. Although the ‘Cloud Cover × Land-use’ interaction partially accounts for urban aerosol impacts, the inability to quantitatively isolate direct aerosol scattering from cloud attenuation remains a limitation. Future research should utilize gap-filled high-resolution aerosol datasets to further refine these contributions.
Third, the 0.1° resolution of CARE products cannot resolve sub-kilometer terrain features relevant for micro-siting; furthermore, the spatial resampling of multi-source datasets to a unified 0.1° grid introduces potential smoothing effects that warrant caution. Specifically, resampling the coarse-resolution ERA5 cloud data (0.25°) and the high-resolution SRTM DEM (30 m) to the 0.1° target resolution may lead to the loss of localized signals. In the central-southern Shandong highlands, this smoothing effect likely underestimates the influence of micro-topography (e.g., slope-induced shading) and sub-mesoscale cloud variations on solar radiation. Consequently, the q-values derived from the Geodetector analysis should be interpreted as a conservative estimate of the influence of clouds and topography at the macro-to-meso scale. For future micro-siting of PV plants, the integration of sub-kilometer satellite products and high-resolution atmospheric modeling would be necessary to resolve these fine-scale heterogeneities.
Fourth, while direct synchronous validation against ground-based pyranometer or specialized UV observations from local Shandong meteorological stations is currently constrained by regional data-sharing restrictions, the scientific reliability and regional applicability of the dataset are robustly backed by extensive baseline validation campaigns across China [
8]. Prior rigorous evaluations against national China Meteorological Administration (CMA) networks have demonstrated that the CARE SWR product achieves exceptional baseline accuracy over eastern China’s typical terrains, exhibiting a high coefficient of determination (R
2) ranging from 0.86 to 0.93 and a low localized Root Mean Square Error (RMSE) bounded between 22 and 35 W/m
2. Nevertheless, incorporating site-specific surface pyranometer observations remains essential to eliminate fine-scale retrieval uncertainties induced by localized industrial aerosols in western Shandong and complex micro-topographic shading in the central mountain regions, which will further strengthen confidence in identified spatial patterns.
Fifth, the linkage between identified high-resource zones and actual PV installation feasibility (accounting for grid connectivity, land ownership, and ecological constraints) requires follow-on operational studies.