Article

Effect of Synergistic Emission Reduction in Air Pollutants and Greenhouse Gases and the Associated Health Benefits


1
School of Biology and Environmental Engineering, Zhejiang Shuren University, Hangzhou 310015, China
2
Guangxi Research Academy of Environmental Sciences, Nanning 530022, China
3
Wuhan Science and Technology Center of Ecology and Environment, Wuhan 430070, China
*
Author to whom correspondence should be addressed.
Atmosphere 2026, 17(7), 690; https://doi.org/10.3390/atmos17070690
Submission received: 21 April 2026 / Revised: 31 May 2026 / Accepted: 3 July 2026 / Published: 15 July 2026
(This article belongs to the Section Air Pollution Control)

Abstract

The transport sector contributes significantly to greenhouse gases and airborne pollutants. This study focuses on the co-benefits related to decreases in air pollutants and CO2 emissions under various mitigation scenarios. The associated mitigations in PM2.5 concentrations are predicted by establishing a random forest (RF) model and the health benefits are evaluated with the global exposure mortality model (GEMM). Environmental tax values and carbon trading prices are integrated alongside traditional elasticity coefficients and coordinate-based approaches to transform reductions into economic advantages. The results indicate that in the most favorable scenario (ELC), CO2 emissions are expected to peak in 2032 with a reduction of 51.71%; this is supported by the marginal CO2 emission curve, which intersects the zero axis around that same year, while the air pollution equivalents (APeq) are projected to decline by 25.65% in 2050. The efficiency of synergistic reductions between air pollutants and CO2 ranks as SO2 > NOX > CO > HC > PM2.5 > PM10, and the elasticity coefficients for all pollutants are gradually aligning toward 1, suggesting that stricter mitigation efforts will enhance co-benefits. Furthermore, the economic benefits attributable to CO2 reduction are anticipated to be 10.81 billion CNY by 2050, and 17,297 premature deaths associated with PM2.5 exposure could be prevented. The findings in this study could provide essential insights for the co-management of CO2 and air pollutants from road mobile sources.

1. Introduction

Climate change has brought various effects to the world [1], including health risks from heat and humidity, species losses, and other hazards [2]. As the largest contributor to carbon dioxide (CO2) emissions, China announced its Intended Nationally Determined Contribution (NDC) commitment in accordance with the Paris Agreement in 2015 and implemented a dual-carbon policy in 2020, aiming to reach peak carbon emissions before 2030 and achieve carbon neutrality by 2060 [3]. In the meantime, although air quality in China has improved significantly since the implementation of a series of action plans (Action Plan on the Prevention and Control of Air Pollution in 2013, the Three-year Action Plan for Blue Skies in 2019, and the Action Plan for Continuous Improvement of Air Quality in 2023), for instance, the annual mean concentration of primary particulate matter with an aerodynamic diameter no greater than 2.5 μm (PM2.5) and the number of days with severe pollution in China have cumulatively declined by 20% and by 25% during the 14th Five-Year Plan period, respectively [4]. However, in 2025, 91 out of 337 cities at the prefecture level or higher still exceeded the National Air Quality Standards implemented on 1 January 2016 [4,5]. The proportion of cities meeting the new National Air Quality Standards, which came into effect on 1 March 2026, should be even lower [4,6]. Not to mention that the national annual average PM2.5 level in 2025 was 4.6 times higher than the World Health Organization’s (WHO) latest guideline of 5 μg/m3 [4,7]. CO2 and air pollutant emissions stem from common sources like fuel combustion and industrial processes. Consequently, controlling CO2 emissions can lead to reduced atmospheric pollutant concentrations [8]. Recognizing the interconnected nature of climate change and air pollution, China has a practical incentive to pursue strategies that yield synergistic benefits. Several studies have explored the co-benefits of simultaneously reducing air pollutants and greenhouse gases (GHGs). For instance, Du et al. (2021) examined the synergistic effects of reducing air pollutants and carbon emissions in thermal power generation [9], while Liu et al. (2024) assessed the co-benefits of carbon and air pollutant mitigation in petroleum refining [10]. The synergistic efficiency in other sectors, including the industrial sector [11,12], coal consumption [13,14], waste disposal [15], and water pollution control [16], has also been extensively discussed. Furthermore, the synergistic role of carbon markets and trading systems in alleviating both carbon and air pollutants has garnered significant attention [2,17].
Among various anthropogenic sources, the transport sector should be highlighted as a major source of GHG emissions. Previous publications indicate that this sector represents the largest consumer of global oil [18] and contributes roughly a quarter of global energy-related CO2 emissions [19]. Meanwhile, transportation-related PM2.5 and ozone concentrations have become a global concern [20]. In China, the transport sector ranks third in GHG emissions, following power generation and manufacturing [21]. Tian et al. (2023) reported that transport emissions constituted 12.4% of China’s total CO2 emissions [22]. In terms of air pollutant emissions, transportation is the leading source of nitrogen oxide (NOx). The transportation sector shows substantial potential for simultaneously controlling CO2 and air pollutants. Several studies have acknowledged the co-benefits of reducing air pollutant and GHG emissions within the transport sector, with research conducted at both national and regional levels. For instance, Zeng et al. (2023) assessed the synergistic emission reduction impacts and indirect drivers of air pollution and carbon emissions in China using the Kaya identity and the LMDI decomposition model [23], while Weng et al. (2025) examined the economic advantages, emission patterns, and combined impacts of reducing CO2 and pollutants, highlighting the importance of these synergistic benefits [24]. Similarly, Xu et al. (2021) developed a Long-range Energy Alternatives Planning System (LEAP) model for the Beijing–Tianjin–Hebei region to forecast emission reduction potential under various policy scenarios and assess associated health co-benefits [25]. Nevertheless, significant provincial disparities exist in China, such as the economy, population, as well as transportation conditions like evolving emission standards, vehicle usage trends, and the adoption rate of renewable energy vehicles, leading to considerable gaps in provincial-level analysis. This provincial-level variability remains unexamined, especially in provinces actively pursuing energy transition and carbon neutrality goals, such as Zhejiang Province. As the demonstration zone for common prosperity, Zhejiang Province’s policies and actions regarding the coordinated reduction in carbon emissions and air pollution may hold significant demonstrative value for other provinces across China. Furthermore, past studies often presumed a fixed transport growth rate, potentially introducing significant inaccuracies in emission projections; or focused on quantifying the emission reductions, leaving the economic and health implications unexamined. The effective communication of economic and health benefits from emission reduction strategies to decision-makers is obstructed by these gaps.
This present study aims to address these existing research gaps. We established nonlinear prediction models of future activity levels in road mobiles, which take economic and population changes into consideration, going beyond simple constant growth. Subsequently, we evaluate and quantify the co-benefits associated with reductions in air pollutant and CO2 emissions across various mitigation scenarios, while the associated mitigations in PM2.5 concentrations are predicted by establishing a machine learning model and the health benefits are quantified with the global exposure mortality model (GEMM). Additionally, we integrated environmental tax values and carbon trading prices with conventional elasticity coefficients and coordinate-based approaches to convert emission reductions into economic benefits. Marginal CO2 emissions were also considered in our projections of peak CO2 emissions. This study primarily aims to uncover a green development pathway that effectively reduces emissions and simultaneously mitigates CO2 and air pollutants in the transport sector of Zhejiang Province, and to provide a model that can be adapted for integrated emission reduction in other areas and sectors.

2. Methodology

2.1. Overview of the Study Area

Zhejiang Province is situated on the southern flank of the Yangtze River Delta (27°02′ N–31°11′ N, 118°01′ E–123°10′ E). This province administers 11 prefecture-level divisions, including the sub-provincial cities of Hangzhou and Ningbo, and covers approximately 105,500 square kilometers. By the end of 2024, Zhejiang’s permanent resident population reached 66.7 million, with a per capita Gross Regional Product (GRP) of 135,565 CNY [26], and the per capita disposable income of urban and rural residents has ranked top in China for years. Zhejiang was particularly considered for this case study due to its unique and representative characteristics. Zhejiang is the birthplace of the concept “lucid waters and lush mountains are invaluable assets”, which has been actively driving improvements in environmental quality and accelerating the green and low-carbon transition. By the end of 2025, clean power constituted 63.6% of Zhejiang’s total installed generation capacity, a landmark achievement where renewable energy capacity surpassed that of thermal power [27]. In terms of green transportation development, civilian vehicle ownership reached 26,015,957 in 2024, of which renewable energy vehicles totaled 3.067 million, representing a 50.3% increase compared with that in 2023 [26]. Additionally, a significant surge in the penetration rate of new energy vehicles with 52.285 was recorded in 2024 [28], far exceeding China’s national average, highlighting a rapid electrification transition in road transport. As the demonstration zone for common prosperity, its experience in operationalizing the concept that “lucid waters and lush mountains are invaluable assets” and achieving the “dual-carbon target” may provide significant reference for other regions in China.

2.2. Emissions Quantification Models for Airborne Pollutants and GHG

The LEAP model, a “bottom-up” energy and environmental accounting tool [29], was employed for this study. LEAP facilitates the simulation and comparative assessment of long-term GHGs and air pollutant emission trajectories under a range of policy and technology scenarios. By integrating detailed technological parameters with macro-level drivers, the model supports quantitative evaluations of the potential impacts, costs, and co-benefits of various emission reduction strategies. This capability makes LEAP particularly valuable for climate action planning and sustainable energy transition research at both national and subnational levels [30]. In this study, a LEAP model specific for Zhejiang was developed to systematically analyze vehicle emissions, focusing on atmospheric pollutants such as NOX, particulate matter (PM2.5 and PM10), hydrocarbons (HCs), carbon monoxide (CO), sulfur dioxide (SO2), and GHG (CO2, CH4 and N2O) from on-road mobiles. These sources were further disaggregated by fuel type and vehicle usage, and an emission inventory system comprising one sector and ten distinct vehicle categories was established (see Table S1). The model was calibrated and validated for the base year 2024 using parameters, including activity levels and energy structure, to ensure an accurate representation of conditions in Zhejiang and to provide a reliable foundation for subsequent scenario projections.
Air pollutant and GHG emissions from on-road mobile sources are quantified by integrating key parameters such as activity levels, energy consumption, and emission factors. Activity levels for road vehicles are derived from vehicle population statistical yearbooks, while future scenarios for each vehicle type are then projected through 2050 to facilitate a systematic assessment of potential emission trajectories under different policy and technological situations. The quantification of air pollutant emissions was primarily implemented according to the Compilation of Air Pollutant Emission Inventory of Road Motor Vehicles [31]. In terms of GHG emissions, the direct CO2 emissions from motor vehicles are estimated on the basis of the 2006 Intergovernmental Panel on Climate Change (IPCC) Guidelines for National Greenhouse Gas Inventories [32], whereas for electric vehicles, their indirect CO2 emissions are accounted for as emissions generated from fossil fuel combustion during the power production process. Detailed GHG emission quantification processes, including methane (CH4) and nitrous oxide (N2O), are described in the Supplementary Materials.

2.3. Predicting Models of On-Road Mobile Source Activities

2.3.1. Socioeconomic Predicting Model

Per capita gross domestic product (GDP) data (at current prices) for Zhejiang Province from 1978 to 2024 [26] were analyzed using the Autoregressive Integrated Moving Average (ARIMA) model, a widely adopted time series analytical technique. The ARIMA model is conventionally denoted as ARIMA (p, d, q), where p represents the order of the autoregressive component, d indicates the degree of differencing required to achieve stationarity, and q specifies the order of the moving-average component. Stationarity testing of the raw data indicated that historical per capita GDP followed an exponential growth pattern. Appropriate differencing was applied to achieve stationarity, which is essential for ARIMA modeling. After this transformation, the autocorrelation function (ACF) and partial autocorrelation function (PACF) were analyzed to identify candidate values for p and q. Systematic parameter identification and diagnostic checking determined that the ARIMA (3, 2, 0) specification provided the optimal fit to Zhejiang’s per capita GDP series, as evidenced by robust performance metrics (R2 = 0.9982, RMSE = 0.1736, MAE = 0.1151). Projections were subsequently generated using the selected model. A logistic growth model was also applied to fit resident population data for Zhejiang Province from 1990 to 2024. This modeling approach was integrated with provincial urban and rural development planning frameworks to project demographic changes through 2050. The combined use of ARIMA for economic indicators and logistic modeling for population dynamics enables a comprehensive foundation for scenario-based study in subsequent analysis.

2.3.2. Road Mobile Source Activity Predicting Model

The vehicle ownership levels have been considered to be correlated with per capita GDP [33,34]. Vehicle stock expansion generally exhibits a nonlinear trajectory, which can be divided into three phases: accelerated growth, decelerated growth, and eventual saturation. To accurately model this S-shaped (sigmoidal) growth pattern, this study utilizes the theoretically robust Gompertz model [35] instead of conventional linear regression methods. Zhejiang Province’s resident population (1990–2024), per capita GDP (1978–2024) and vehicle stock (2005–2024) were collected. The Gompertz function, as specified in Equation (1), was then applied to project the future trajectory of vehicle stock in the region [36]. This methodological approach provides a more precise representation of the nonlinear dynamics of vehicle ownership, thereby improving the reliability of long-term projections for transportation demand and related environmental impacts.
S ( t ) = ae b e cP ( t )
where S ( t ) represents the motor vehicle ownership rate in year t (vehicles/thousand people), and P ( t ) is the per capita GDP in year t ( 10 4 CNY/person). The parameter a depicts the saturation level of the motor vehicle ownership rate (vehicles/thousand people), revealing the theoretical maximum number of vehicles per thousand inhabitants, while the parameters b and c describe the shape and the growth rate of the curve, respectively.
On the basis of this foundation, the determination of activity-level parameters follows a systematic approach. The annual average mileage for various motor vehicle categories, differentiated by usage characteristics such as private cars, taxis, and freight vehicles, is established by extrapolating historical data trends or by developing regression models that incorporate socioeconomic variables, including per capita GDP and road density. Additionally, the retirement volumes for high-emission, older vehicles were projected with consideration of multiple factors, such as vehicle type, applicable emission standards, and average scrappage age. Previous studies show that average service life varies substantially across vehicle categories, for instance, passenger cars and commercial vehicles have distinct usage lifespans and retirement cycles. These parameters provide a critical basis for projecting future vehicle fleet composition and corresponding activity levels in different scenarios.

2.4. Emission Reduction Scenarios

Scenario analysis is a fundamental methodological tool in policy studies and strategic planning, facilitating the projection of potential future outcomes based on hypothesized multi-path system evolutions [37]. By integrating qualitative and quantitative approaches, scenario analysis effectively manages uncertainty and accommodates diverse policy preferences, making it particularly suitable for medium- to long-term strategic planning. In the context of China’s pursuit of its “dual-carbon” objective, scenario analysis could serve as an effective method for evaluating the synergistic effects of greenhouse gas and major air pollutant emissions on overall emission reductions. This study analyzes the synergistic reduction relationships between CO2 and the criteria air pollutants and conducts a multi-scenario assessment of pathways toward the regional carbon emission peaking of Zhejiang. Based on authoritative policy documents, including the Zhejiang Provincial Climate Change Adaptation Action Plan [38] and the Measures for Promoting the Dual Control of Carbon Emissions in Zhejiang Province [39], five representative policy scenarios were developed. To enhance the reliability and comparability of baseline data, and in recognition of the cyclical fluctuations in transport and logistics activities caused by the COVID-19 pandemic in 2022, this study designates 2024 as the base year for emission calculations. Key parameter quantifications are presented in Table S3 of the Supplementary Materials and are informed by research from the Chinese Research Academy of Environmental Sciences. The application of the gradient transition principle enables comparative analysis across scenarios with differing policy intensities and technological adoption rates. Five different scenarios, characterized as a business-as-usual (BAU) scenario, emission reduction (ER) scenario, enhanced emission reduction (EER) scenario, green low-carbon (GLC) scenario and enhanced low-carbon (ELC) scenario, are detailed in the Supplementary Materials.

2.5. Integrated Evaluation of Co-Benefits and Economic Impacts

To comprehensively assess the synergistic relationships between CO2 and air pollutant emission reductions, this study employs three complementary analytical methods. Firstly, the elasticity coefficient method (specified in Equation (2)) is applied to quantitatively evaluate the degree of synergy between CO2 emission reductions and reductions in the criteria air pollutants. This approach captures the relative responsiveness of pollutant mitigation to carbon reduction efforts, providing a metric for characterizing synergy strength across different policy scenarios. Secondly, the synergy effect coordinate system method is utilized to visually present the emission reduction effects of alternative measures or scenarios on CO2 and various pollutants within a two-dimensional coordinate framework. This visualization technique enables intuitive comparison of both individual pollutant reduction outcomes and their synergistic relationships under different policy assumptions. Thereafter, an improved Coupling Coordination Degree model (Equations (3) and (4)) is employed to comprehensively evaluate the coordination level between the CO2 emission reduction system and the air pollutant control system. This method captures the dynamic interactions and mutual feedback mechanisms between the two systems, yielding a composite indicator that reflects the overall coherence and balance of co-control strategies [40,41]. The integration of these three analytical approaches provides a robust methodological foundation for assessing co-benefits and informing integrated policy design [42].

2.5.1. Elastic Coefficient Method

The Pollutant Reduction Elasticity Coefficient Method, applied by Li et al. (2026), is an analytical technique that utilizes elasticity coefficients to link various air pollutants with GHG emissions, primarily CO2 [43]. This method evaluates the sensitivity of greenhouse gas reductions in relation to decreases in different air pollutants. By addressing the substantial disparities present in absolute reduction figures, the elasticity coefficient provides an even impartial and standardized assessment of the combined impacts of multiple emission reduction strategies. Normalizing the differential responses of pollutants to mitigation measures enables the elasticity coefficient method to facilitate comparative evaluation of synergy strength across diverse policy interventions.
Els c / A P = E CO 2 / E CO 2 E AP / E AP
where E CO 2 and E AP denote the CO2 and air pollutant emissions (or air pollutant equivalents) prior to implementing a specific measure, while E CO 2 and E AP represent the corresponding emission reductions. The synergy coefficient Els c / A P is defined to quantify the co-benefit. A value of Els c / A P     0 indicates a lack of synergy, suggesting that a reduction in one type of emission coincides with an increase or no change in the other, demonstrating a negative co-benefit effect. Conversely, Els c / A P   >   0 signifies a positive synergistic effect, where the measure reduces both CO2 and air pollutants. Furthermore, the magnitude of this ratio reveals the relative effectiveness, Els c / A P   >   1 suggests a greater reduction in CO2, whereas Els c / A P = 1 depicts equivalent reduction extents, and 0 < Els c / A P < 1 implies a more pronounced reduction in air pollutants. Thus, the distribution of Els c / A P values allows for a direct comparison of the emission reduction degrees between CO2 and air pollutants.

2.5.2. Coordinate System Method

The coordinated control effects coordinate system functions within a two- or multi-dimensional spatial coordinate framework, where each axis represents a specific pollutant [13]. Each point within this system denotes the emission reduction effect of a particular control measure on the pollutants. The position of a point directly indicates the absolute reduction achieved for each pollutant by the corresponding measure. The quadrant in which a point is located reveals the nature of the control measure: Quadrant I (x > 0, y > 0) represents synergistic reduction, indicating that the measure reduces both pollutants simultaneously. Quadrant II (x < 0, y > 0) reflects a trade-off, where the measure decreases the emissions of one pollutant (such as CO2) but increases the emissions of the other (such as NOX). Quadrant III (x < 0, y < 0) indicates dual deterioration, with increased emissions of both pollutants. Quadrant IV (x > 0, y < 0) also represents a trade-off, where the measure reduces the emissions of one pollutant (such as NOX) while increasing the emissions of CO2.

2.5.3. Integrated Assessment of System Coupling Coordination Degree

The Coupling Coordination Degree (CCD) model offers a comprehensive analytical framework for examining dynamic relationships and synergistic development among multiple subsystems, as well as assessing the overall performance of the integrated system [44]. In this study, carbon emission reduction and air pollutant control are conceptualized as two distinct yet interconnected subsystems within a broader environmental governance framework, characterized by mutual interaction and interdependence. The CCD model consists of three principal metrics, the Coupling Degree (C), Coordination Index (T), and Coupling Coordination Degree (D). The C value measures the intensity of interaction between systems, reflecting their interdependence and mutual influence. The T value assesses the quality of coordination by quantifying the degree of harmonious coupling. The D value, ranging from 0 to 1, quantifies the overall level of coupling coordination between the systems. Values closer to 1 indicate stronger coordination and greater synergy between carbon emission reduction and air pollutant control systems, while values near 0 denote weaker coordination and reduced synergy.
The adapted CCD model, based on the methodological framework established by Zhang et al. (2021) [44], was utilized to assess the synchronization between the CO2 emission reduction mechanism and the air pollution control system for mobile sources in Zhejiang Province. The procedures for model calculations are detailed below:
C = [ 1 ( U 2 U 1 ) ] U 1 U 2
X st = a + ( b a ) ( X X min X max X min )
In this study, the reduction in CO2 emissions (U1) and the reduction in representative air pollutants (U2) were selected as the core indicators for the greenhouse gas and air quality management systems, respectively. Given the distinct units and scales of raw emission data, both U1 and U2 were first normalized to the range [0.01, 0.99] using the min–max scaling method to ensure comparability and that the resulting CCD values fall within a standard interval, a = 0.01, b = 0.99.
T = β 1 U 1 + β 2 U 2 = 0.5 × U 1 + 0.5 × U 2
D = C × T
The coordination degree is quantified by the index T, which is a function of the importance coefficients β 1 and β 2 for the respective systems, where β 1 + β 2 = 1 . In this study, CO2 emission reduction and air pollutant emission reduction were considered equally important; thus, both coefficients were assigned a value of 0.5. The C value was calculated to quantify the strength of interaction between the two systems: carbon emission reduction and air pollutant control. This metric reflects the extent to which these systems influence and depend on each other. The T value was determined as a weighted average of the normalized subsystem values. In alignment with Zhejiang’s policy priorities, equal importance was assigned to both carbon peaking objectives and air quality improvements; therefore, the weights α and β were each set to 0.5. The D value was then computed to represent the overall level of synergistic development between the two systems. Values of D close to 1 indicate a high degree of harmonious and effective co-reduction, signifying well-coordinated progress toward both climate and environmental targets. Conversely, values near 0 reflect weak coordination and limited synergy.

2.5.4. Analysis of Emission Reduction Costs

The environmental protection tax on air pollutants, combined with the carbon pricing mechanism within the emissions trading market, establishes a foundation for quantifying the economic benefits of emission reductions. Utilizing the pricing framework from the China Carbon Market Annual Report, this study monetarily assesses the co-benefits arising from concurrent reductions in CO2 and air pollutants from mobile sources in Zhejiang Province. Although mobile sources are currently exempt from the environmental protection tax under existing regulations, the potential environmental benefits of emission reductions can be evaluated by applying established taxation criteria as proxies for avoided damage or abatement value. By using environmental tax equivalence values for atmospheric pollutants and the carbon market trading price for CO2, emission reductions in both pollutants and greenhouse gases are converted into economic benefits, as specified in Equations (7)–(9). This enables quantification of the economic value of collaborative emission reduction and supports comparative assessment of alternative policy scenarios based on their monetized co-benefits.
S ap j = ( 1000 R ap j W j ) × P ap j
S CO 2 = R CO 2 × P CO 2
S total = S ap j + S CO 2
S ap j and S CO 2 represent the monetary benefits (CNY) from reducing air pollutant and CO2 emissions, respectively. These are calculated based on the corresponding emission reductions R ap j and R CO 2 (t), the pollutant equivalent value W j (kg) listed in Table S1, and the applicable environmental tax standard P ap j (CNY) in Zhejiang. According to the document “Understanding Environmental Protection Tax at a Glance” [45], the tax rate for all air pollutants, except for four categories of heavy metal pollutants, is set at 1.2 CNY per pollution equivalent. A price of 97.5 CNY per ton is applied for CO2, which references the weighted average transaction price of the national carbon emission trading market from 2022 to 2024 [46], and is adjusted with reference to data from the Zhejiang Provincial carbon emission trading pilot.

2.6. Health Benefit Assessment

2.6.1. Health Benefit Assessment Model

The premature deaths linked to PM2.5 exposure are evaluated using the GEMM [47,48], which has been extensively utilized in examining health benefits associated with long-term exposure to PM2.5 [49]. The GEMM demonstrates a high level of confidence in the relationship between PM2.5 and mortality, particularly at elevated pollution levels, making it suitable for use in China [50]. Since nearly all non-accidental deaths associated with PM2.5 are connected to noncommunicable diseases (NCDs) and lower respiratory infections (LRIs), the GEMM limits the excess death estimates to this specific group of illnesses, referred to as GEMM NCD + LRI. The relative risk (RR) for a specific PM2.5 concentration C in the context of GEMM NCD + LRI is represented by formula (10):
RR ( C ) = e θ × ln ( C Co α + 1 ) 1 + e ( ( C Co μ ) / v ) f o r   C   C o 1 f o r   C < C o
Co represents the counterfactual PM2.5 concentration, below which no additional risk is assumed. In this case, Co is set at 2.4 μg/m3 [51]. The parameters θ, α, μ, and ν define the overall shape of the exposure–response curve, and their specific values are provided in Table S4.
According to the Global Burden of Disease (GBD) project, the calculation formula for PM2.5 attributable deaths is
M = m Pi × Bi × RR ( Ci ) 1 RR ( Ci )
M stands for the number of excess deaths attributable to PM2.5 among adults, stratified by age. The subscript i represents the age group, ranging from 25 to 85 years in 5-year intervals. Pi is the population size of age group i, Bi is the baseline mortality rate (from noncommunicable diseases and lower respiratory infections) for that group, and Ci is the PM2.5 concentration to which the group is exposed. It is assumed that within a given region, all age groups experience the same exposure concentration. To evaluate the health benefits under various scenarios, we define the avoided premature deaths as the difference in attributable deaths between the baseline scenario and the target scenario:
Δ M = M b a s l i n e M t a r g e t

2.6.2. Random Forest Algorithm in Predicting PM2.5 Concentration Reduction

Machine learning (ML) algorithms on the basis of statistical techniques consider the correlation mapping between in- and outputs of a system instead of focusing on the complicated process mechanisms [52]. The extremely nonlinear interactions can be accurately modeled by learning from abundant data whether with previous understanding of the studied system or not. A few ML techniques have been successfully used for predicting the nonlinear trends between the concentration of air pollutants and their sources of emission, such as random forest (RF) [53,54]. RF is an ensemble learning method based on decision trees [55]. In this study, we initiated a random forest model to forecast the synergistic effects of a reduction in the PM2.5 concentration for different scenarios. The model training, verification and performance evaluation of the RF model in this study are detailed in the Supporting Materials.

2.7. Data Sources, Processing, and Uncertainty Analysis

2.7.1. Data Sources and Preprocessing

Historical economic and demographic data for Zhejiang Province were obtained from the Zhejiang Statistical Yearbook [26]. Information pertaining to activity levels for road vehicles was similarly derived from the same statistical yearbook [26]. Projections of activity levels and energy structure within the scenario analysis were predominantly based on historical patterns specific to each mode of transportation. These historical trends were further refined by incorporating policy targets and regulatory guidance from multiple authoritative sources. Key references include the accelerated promotion of clean transportation and the enhanced phase-out and retirement schedules [56]. Additional calibration drew upon the accelerated treatment and replacement mandates outlined in the Zhejiang Province Action Plan for the Battle against Diesel Truck Pollution [57]. These empirical and policy sources were further integrated with insights derived from recently issued development plans and relevant policy documents to ensure that scenario assumptions align with current regulatory trajectories and provincial strategic priorities.

2.7.2. Data Quality Control Procedures

To ensure the accuracy and reliability of the research data, this study systematically implemented comprehensive data quality control procedures throughout the analytical process. Economic and social data were rigorously verified against the Zhejiang Statistical Yearbook [26] and corresponding regional statistical bulletins to ensure consistency with officially reported figures. A completeness check was performed on historical data for all relevant years, and where necessary, data were uniformly adjusted to reflect official announcements regarding administrative division changes within the province, thereby maintaining temporal and spatial comparability. Emission factors were supplemented and validated in accordance with national guidelines to ensure methodological consistency with established practices. Policy parameters were strictly aligned with authoritative official documents, including the Notice of the General Office of the People’s Government of Zhejiang Province on Issuing Several Measures for Promoting the Dual Control of Carbon Emissions in Zhejiang Province [39] and the Implementation Opinions of the Zhejiang Provincial Committee of the Communist Party of China and the People’s Government of Zhejiang Province on Deepening the Construction of Beautiful Zhejiang in an All-Round Way [58]. Quality records were maintained throughout the entire research process, ensuring full data traceability and enabling reproducibility of results. This systematic approach to data quality management enhances the credibility and robustness of the study’s findings and conclusions.

2.7.3. Uncertainty Analysis of Emission Quantification

This study systematically identified and characterized the principal sources of uncertainty inherent in the emission accounting process. Regarding activity level data, discrepancies between registered vehicle numbers and actual usage status may introduce approximately ±8% deviation in vehicle mileage estimation. Furthermore, policy implementation progress may experience temporal lags of up to ±4 years, attributable to factors such as the pace of charging infrastructure development and associated enabling conditions. To quantify the range of uncertainty, the 95% confidence interval was assessed following the methodological guidance provided in the Provincial GHG Inventory Compilation Guide. Uncertainty was further controlled through multiple complementary measures, including the establishment of comprehensive parameter archives and cross-verification with the autonomous region’s greenhouse gas inventory. These procedures ensure that the study’s results can be interpreted and applied within scientifically valid boundaries, thereby supporting robust policy conclusions despite inherent data and modeling limitations.

3. Results and Discussion

3.1. Results of On-Road Mobile Activity

3.1.1. Prediction of Population and per Capita GDP

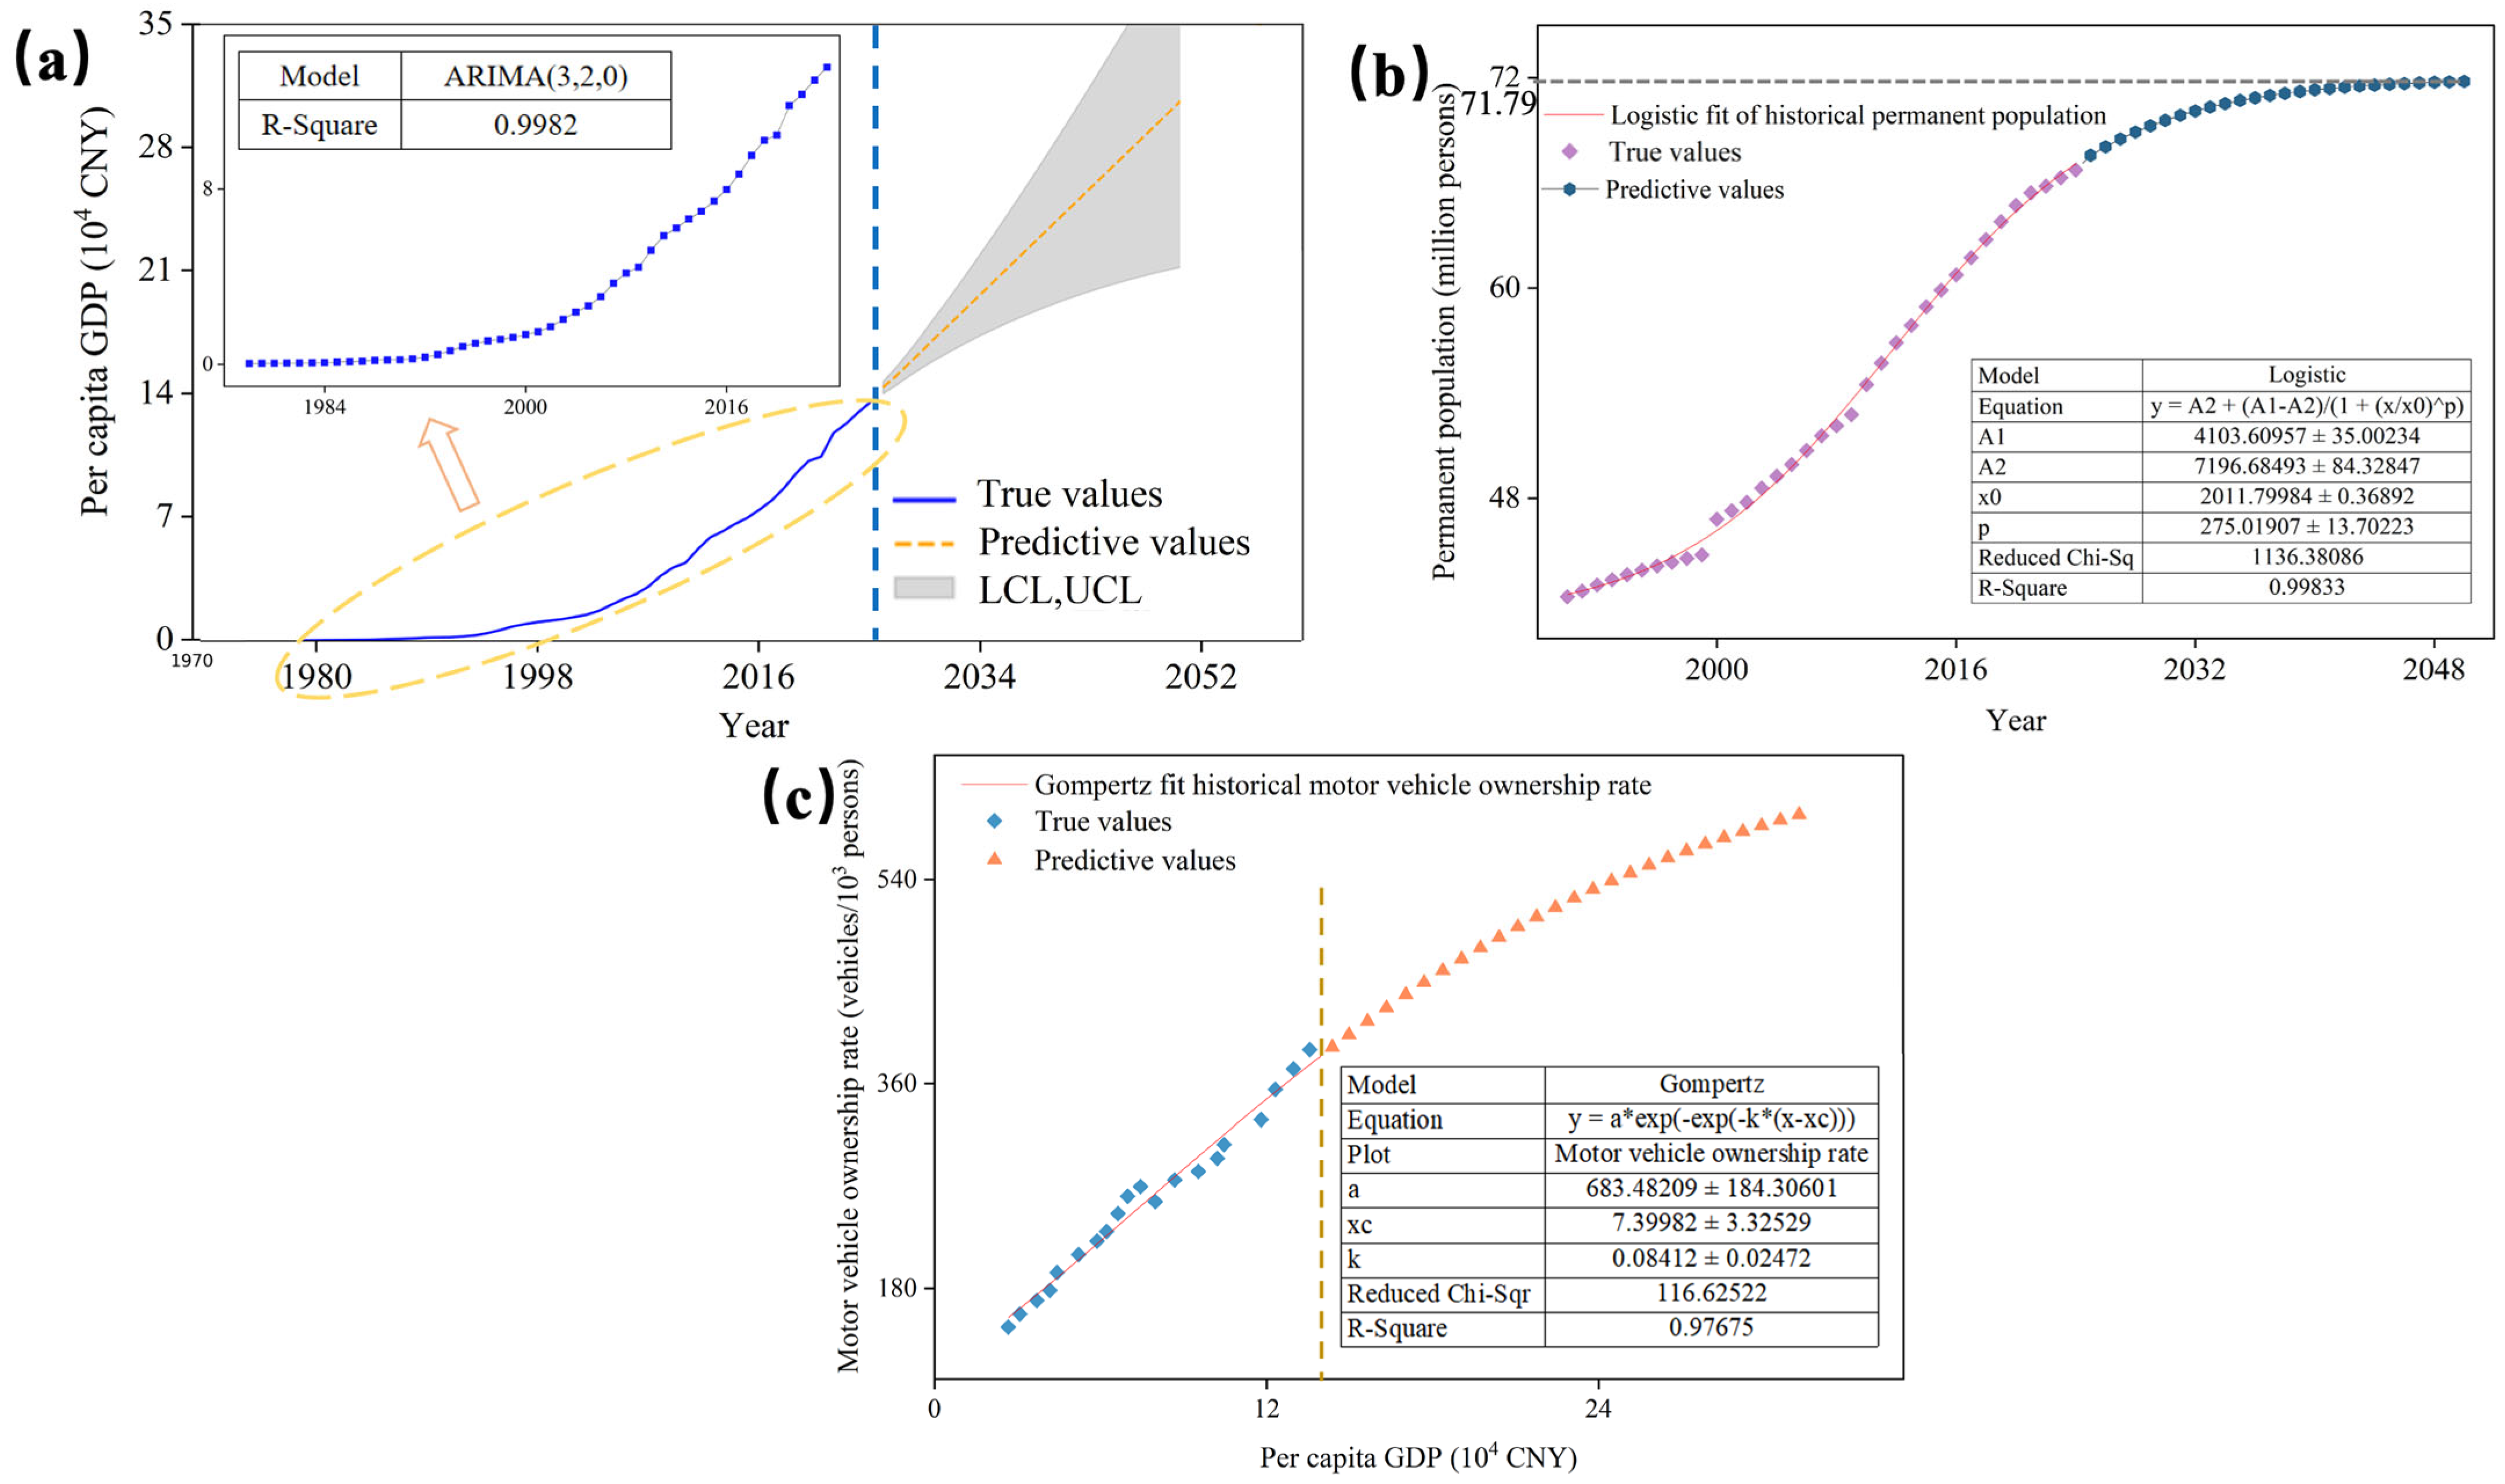
According to an ARIMA (3, 2, 0) model, it is anticipated that Zhejiang’s per capita GDP would increase to 176,934 CNY by the year 2030 and reach 312,307 CNY by 2050 (Figure 1a). Additionally, an examination of Zhejiang’s permanent resident population data from 1990 to 2024 using a Logistic model suggests that the permanent resident population could grow to 69.57 million by 2030, 70.70 million by 2035, and 71.79256 million by 2050 (Figure 1b). The Zhejiang Provincial Master Territorial Spatial Plan (2021–2035) [59] explicitly states that the permanent resident population is projected to be approximately 78–79 million by 2035. However, considering the current low birth rate and the ongoing decrease in China’s overall population, the predicted permanent resident population is convincing.

3.1.2. Prediction of Motor Vehicle Ownership

The motor vehicle ownership rate in Zhejiang from 2025 to 2050 was estimated using the Gompertz model, which integrates the anticipated values for the population of permanent residents and per capita GDP. The results show a strong correlation (R2 = 0.97675) between per capita GDP and the rate of motor vehicle ownership. The anticipated growth rate of motor vehicle ownership shows an overall progressively slowing trend, as seen in Figure 1c, while the motor vehicle ownership rate is expected to reach 597.34 per thousand people by 2050. This growth trajectory suggests that although the number of vehicles would increase, the rate of growth may eventually reduce, indicating that the market may get close to saturation. In the meantime, renewable energy vehicles are essential in achieving low-carbon development objectives [60]. Additionally, as shown in Figure 1, the total motor vehicle stock in Zhejiang Province can be predicted by multiplying the estimated permanent resident population by the projected vehicle ownership rate, which is associated with the annual predicted per capita GDP [61].

3.2. Airborne Pollutant and GHG Emissions During 2017–2024

3.2.1. Airborne Pollutant Emissions During 2017–2024

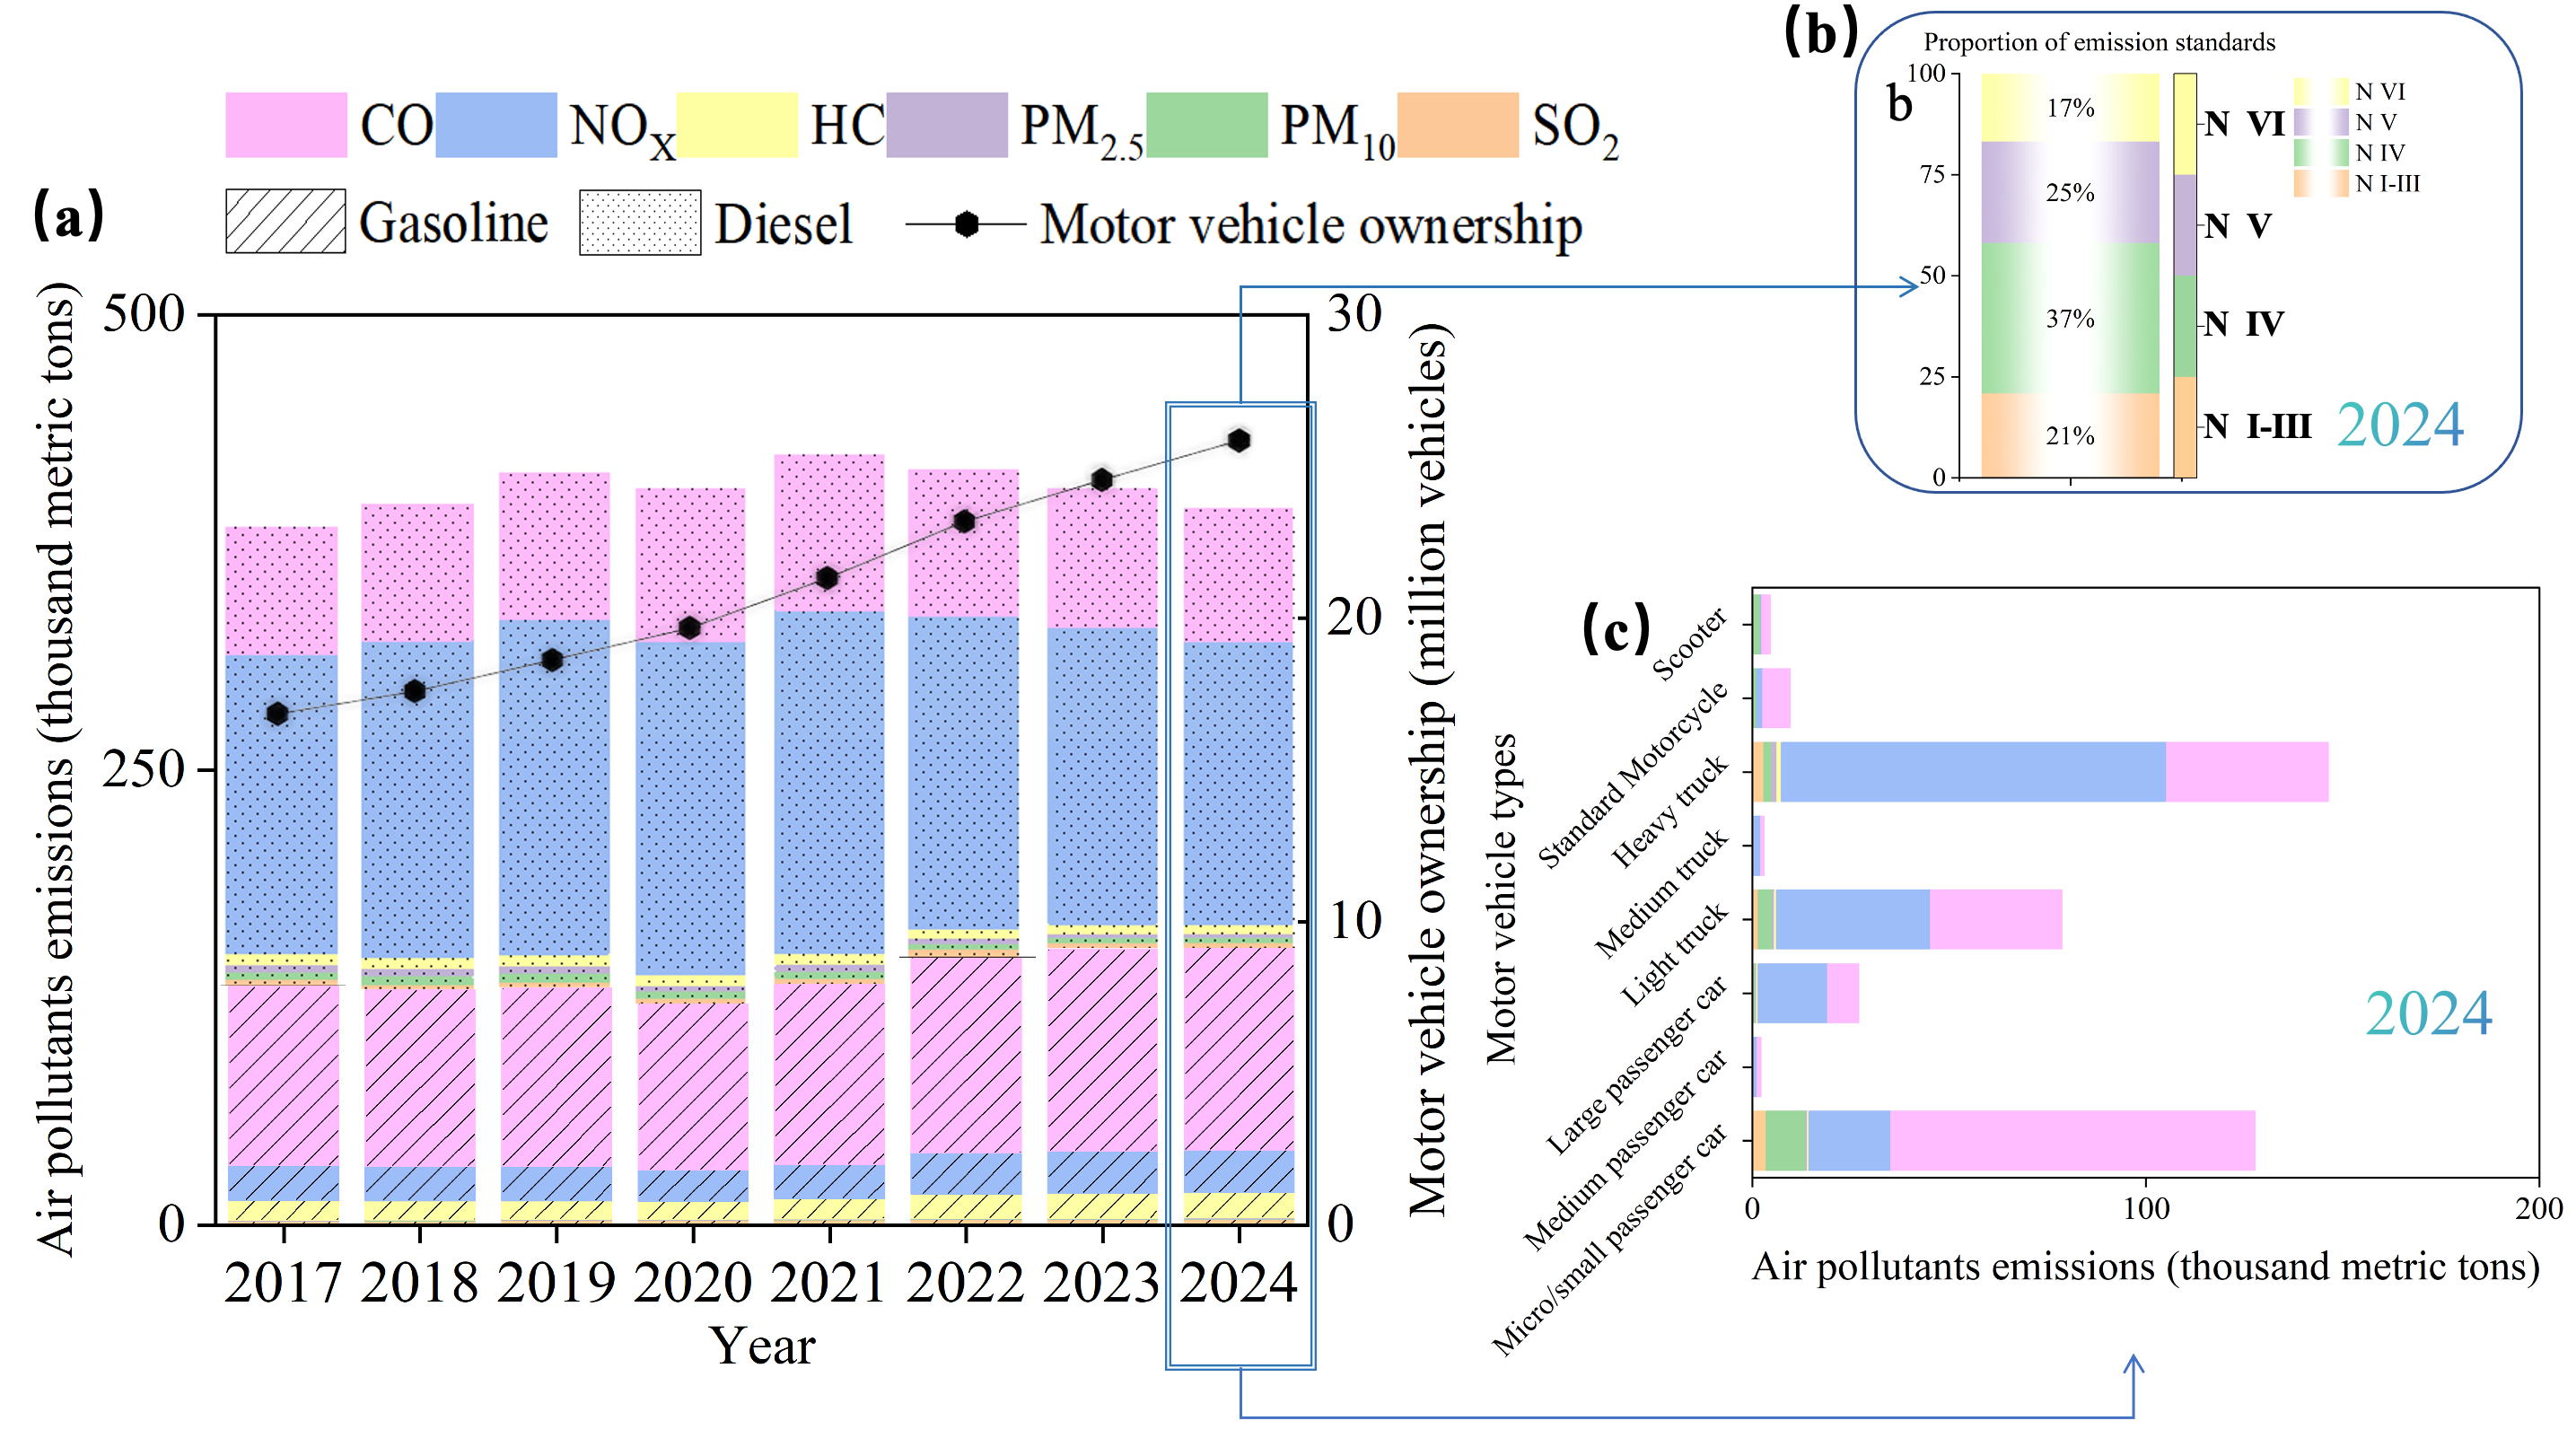
The emissions of six air pollutants from gasoline and diesel automobiles over 2017–2024 were quantified and summarized in Figure 2a. As can be seen from Figure 2a, the emissions of all pollutants peaked in 2021; the phasing out of high-emitting vehicles due to the implementation of the China VI-b emission standard in 2022 could have a considerable impact. CO and NOX emissions from gasoline-powered automobiles show a quick increasing trend. From 2017 to 2024, NOX emissions exhibited an upward trajectory, increasing from 19.19 to 23.36 thousand metric tons, corresponding to a 21.68% rise. Concurrently, CO emissions grew from 98.01 to 111.41 thousand metric tons, marking a 13.6% increase. Gasoline-powered vehicles constitute the principal source of CO emissions, a phenomenon largely attributable to their predominant share in the passenger vehicle fleet and the inherent nature of CO as a typical byproduct of gasoline combustion [62]. Conversely, diesel vehicles are conventionally identified as the primary contributors to NOX emissions. The observed long-term stability in NOX emissions, as depicted in Figure 2, likely reflects an equilibrium between the widespread implementation of diesel emission control technologies (e.g., selective catalytic reduction systems) and policy interventions aimed at decommissioning older diesel vehicles. A synthesis of the data suggests that the initial increase, followed by a subsequent decline, in NOX emissions from diesel vehicles was primarily driven by the confluence of three factors: a temporal lag in the phase-out of older vehicle cohorts, the progressive tightening of emission standards, and advancements in regulatory technologies. Throughout the study scope, PM10 and PM2.5 constituted the least significant contributors to the overall emission profile. The relative contribution of the six monitored pollutants maintained a consistent hierarchy: CO > NOX > HC > SO2 > PM10 > PM2.5. Notably, the aggregate emissions of the two dominant pollutants, CO and NOX, accounted for approximately 91.65% of the total by 2024, underscoring their predominant impact. The observed trend—wherein total pollutant emissions initially rose and subsequently declined against a backdrop of a growing vehicle population—clearly delineates the intricate relationship between transportation sector expansion and its environmental ramifications. This nexus accentuates the imperative for robust vehicle emission control strategies and the promotion of cleaner transportation modalities to mitigate air quality degradation stemming from sustained urban development and evolving mobility demands [63].
Figure 2a also reveals that NOX emissions from diesel vehicles substantially exceed those from their gasoline counterparts, a discrepancy that could be attributable to fundamental differences in combustion mechanisms and exhaust after-treatment systems between the two fuel types [64]. Over the preceding six-year period, Zhejiang Province has enacted policy measures, including the acceleration of end-of-life vehicle retirement and the promotion of new energy vehicles. These initiatives have contributed to a discernible reduction in per-vehicle emission intensity. Consequently, despite an overall expansion in the vehicle fleet, the rate of increase in aggregate pollutant emissions has moderated, suggesting a tangible mitigating effect of the implemented emission control policies.
Figure 2b delineates the emission contribution by emission standard category in 2024. Vehicles compliant with National I–III standards were responsible for 21% of total motor vehicle air pollutant emissions, while National IV, V, and VI vehicles contributed 37%, 25%, and 17%, respectively. As illustrated in Figure 2c, heavy-duty trucks emerged as the largest emission contributors by 2024, closely followed by mini and small passenger vehicles—a pattern primarily driven by their substantial proportional representation within the overall vehicle fleet.

3.2.2. GHG Emissions During 2017–2024

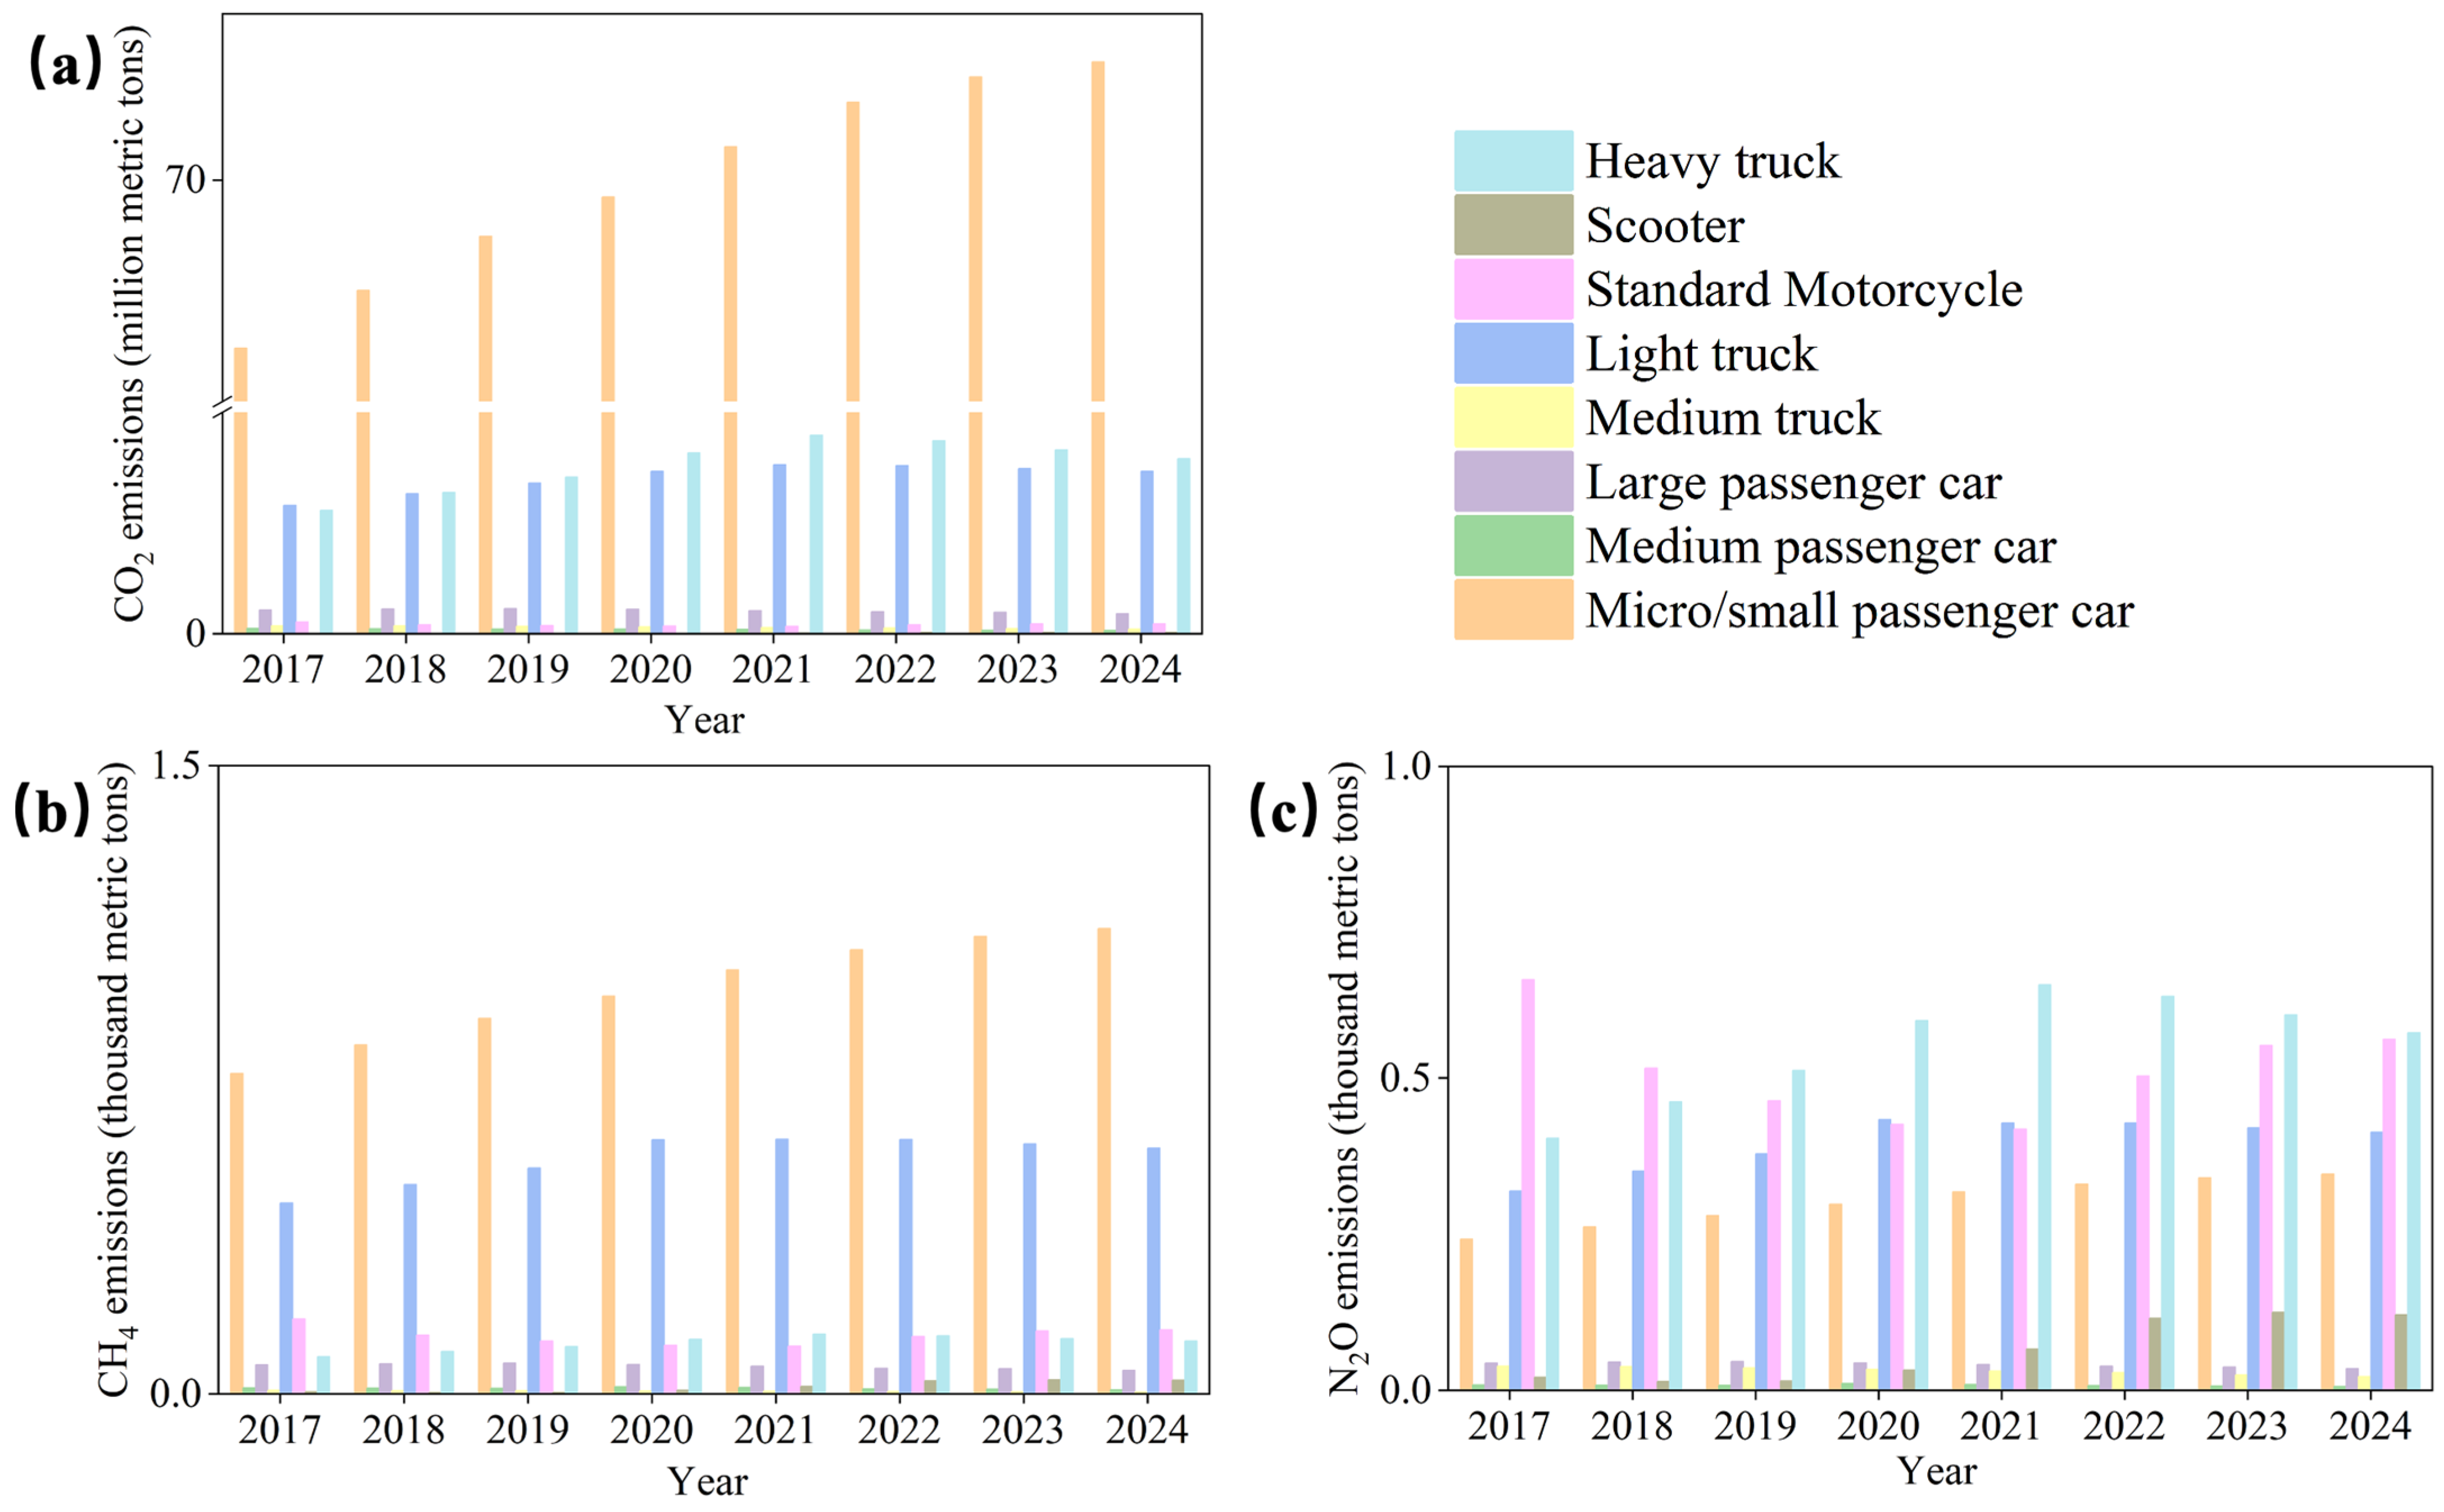
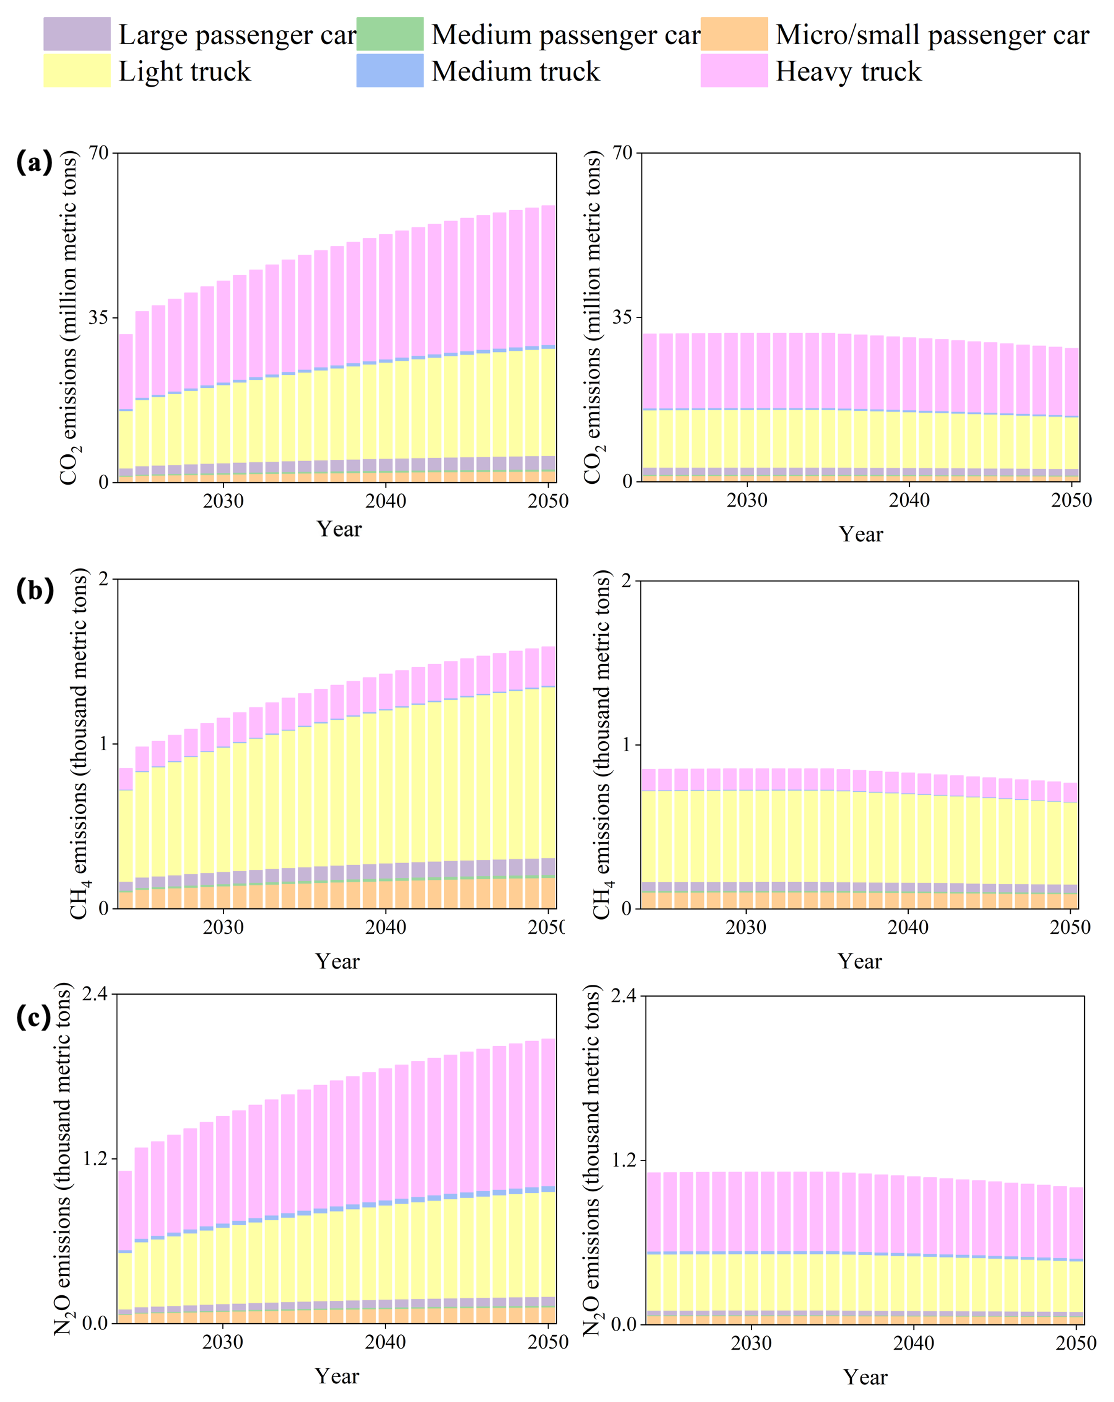
Figure 3 depicts the emission profiles of the GHGs, including CO2, CH4 and N2O, across various vehicle types over 2017–2024. It is notable that the CO2 emissions are substantially higher compared to those of CH4 and N2O. As illustrated in Figure 3a, aggregate CO2 emissions from gasoline and diesel vehicles exhibited a constant upward trajectory, enlarged from approximately 82.06 million metric tons in 2017 to 114.75 million metric tons in 2024. Mini and small passenger cars were identified as the predominant source, consistently contributing between 66.16% and 70.30% of total vehicular CO2 emissions annually. Meanwhile, the vehicular CO2 emissions in Zhejiang Province continued to rise, with the year of 2024 recording an increase of approximately 39.83% relative to the 2017 baseline. Notably, Zhejiang’s vehicle fleet—particularly its passenger car—is undergoing a progressive electrification transition. This shift has contributed to a discernible deceleration in the growth rate of CO2 emissions over the latter part of the study period.
Figure 3b presents the temporal evolution of CH4 emissions from gasoline and diesel vehicles. Total CH4 emissions increased from approximately 1.59 thousand metric tons in 2017 to 2.08 thousand metric tons in 2024. Mini/small passenger cars and light trucks emerged as the principal contributors, accounting for approximately 53.34% and 28.20% of total CH4 emissions, respectively, in 2024. Vehicular CH4 emissions in Zhejiang demonstrated a consistent increasing trend, with an average annual growth rate of approximately 31.03% relative to the 2017 baseline.
Figure 3c illustrates the N2O emissions over the 2017–2024 period. Total N2O emissions from gasoline and diesel vehicles fluctuated modestly before exhibiting a general increase, rising from approximately 1.74 thousand metric tons in 2017 to 2.08 thousand metric tons in 2024. A notable shift in the primary source of N2O emissions occurred over this period, with the dominant contributor transitioning from standard motorcycles to heavy trucks. Vehicular N2O emissions in Zhejiang continued to grow overall, recording an average annual increase of approximately 19.76% relative to the 2017 baseline year.

3.3. Airborne Pollutant and GHG Emissions Under Different Scenarios

3.3.1. Airborne Pollutant Emissions Under Different Scenarios

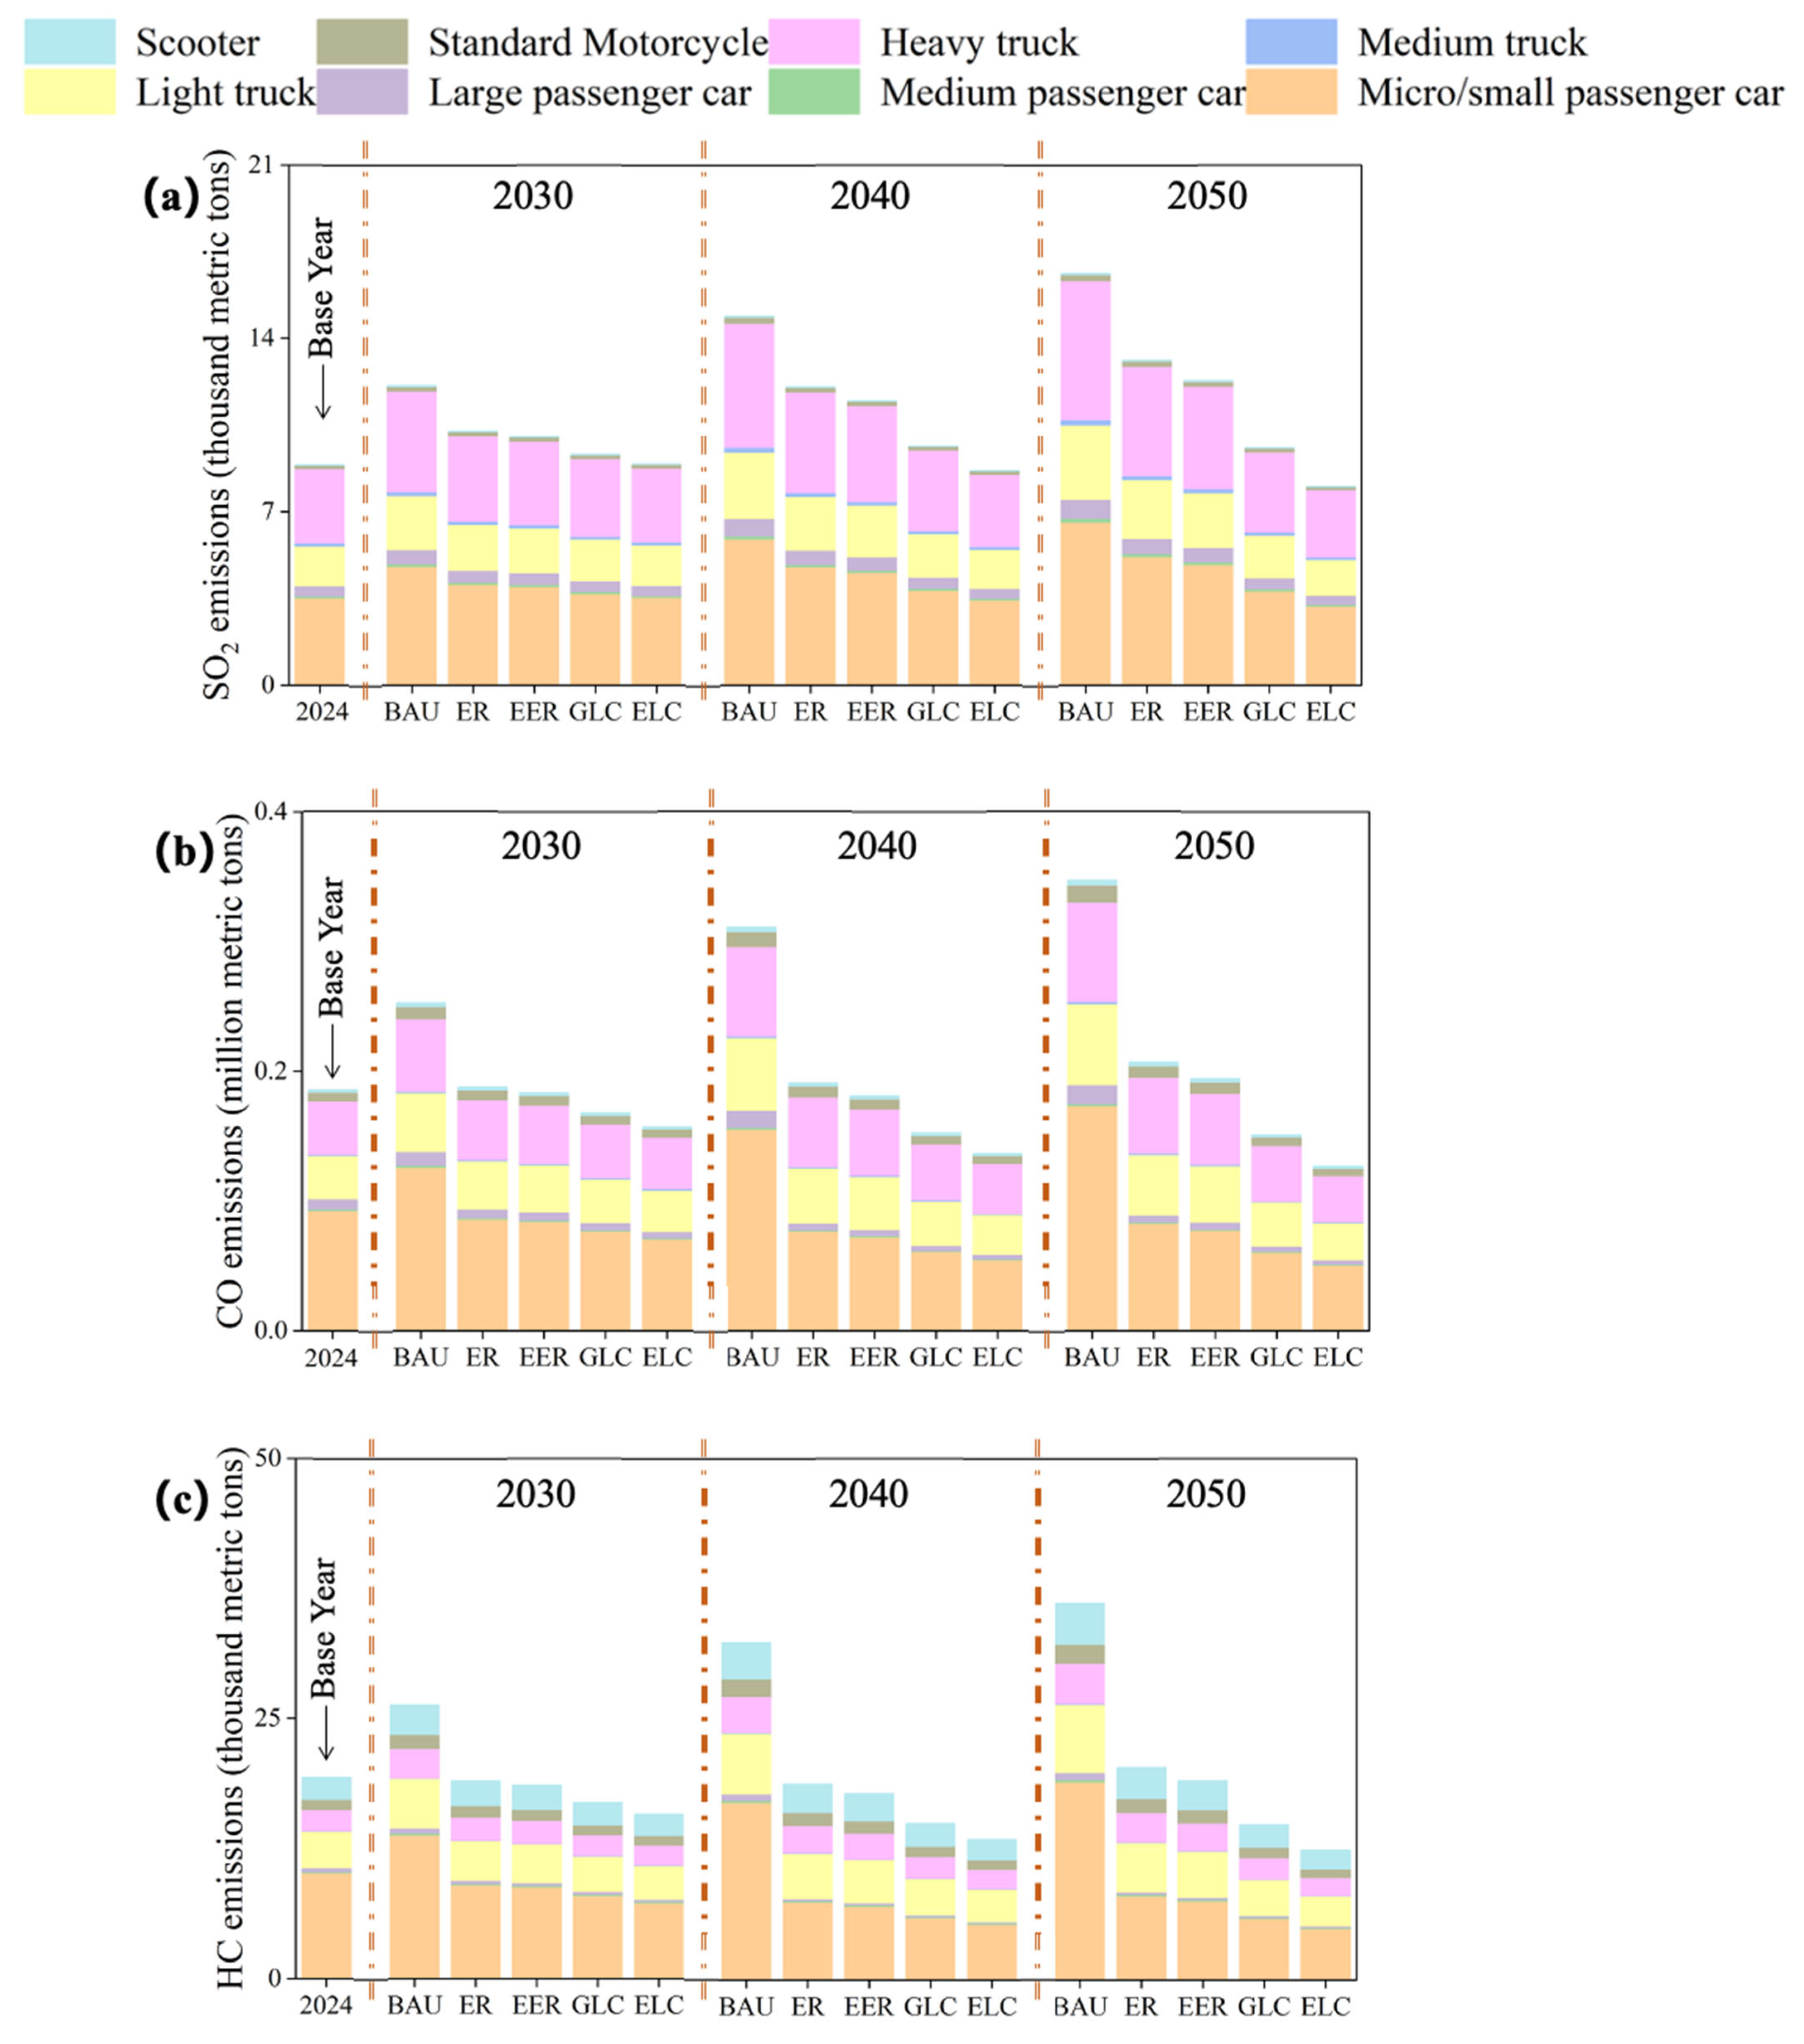
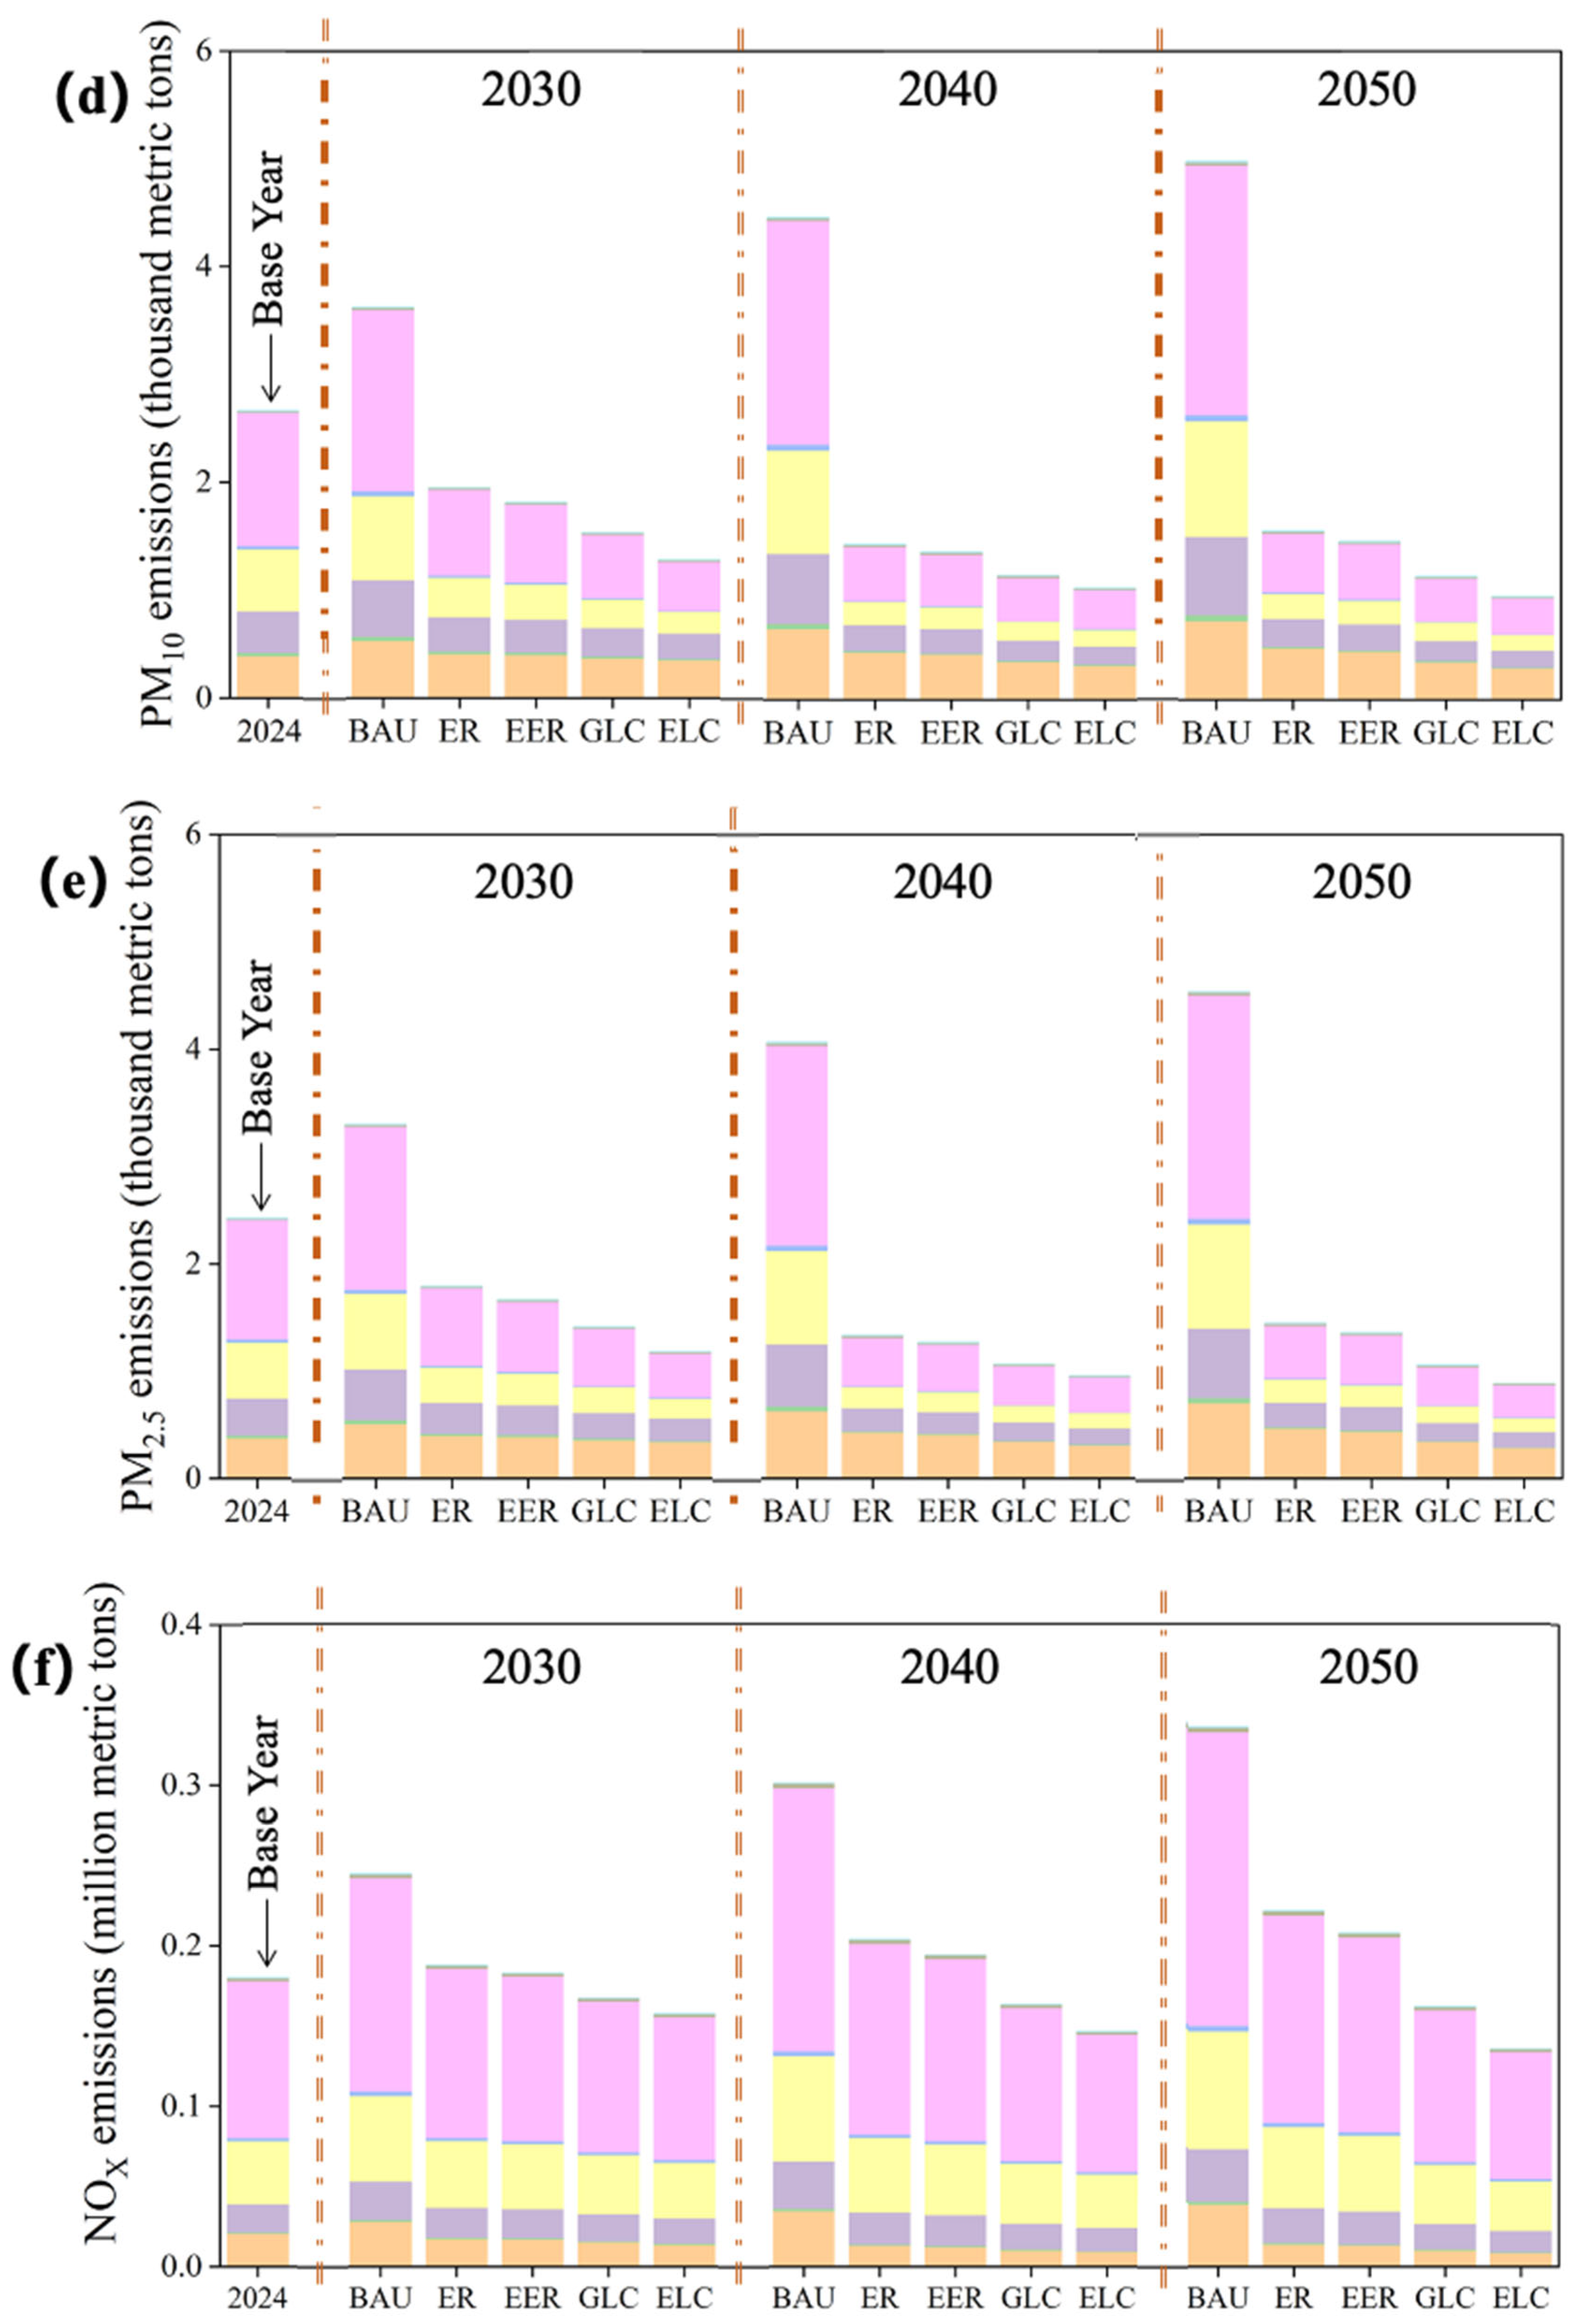
Figure 4 presents the projected emissions of the six criteria air pollutants from on-road vehicles in Zhejiang Province under multiple scenarios for 2024 (base year), 2030, 2040, and 2050. Inter-scenario comparisons for each target year reveal a consistent inverse relationship between the stringency of policy measures and projected emission levels: stricter interventions yield lower emission outcomes. Under the BAU scenario, emissions of SO2, CO, HC, PM10, PM2.5, and NOX are projected to increase by approximately 3.20, 66.94, 6.96, 0.96, 0.87, and 64.87 thousand metric tons, respectively, by 2030, relative to 2024 baseline levels. By 2040, the corresponding increases are projected to level at approximately 6.00, 125.28, 13.03, 1.80, 1.64, and 121.40 thousand metric tons. By 2050, these increments are expected to enhance further to approximately 7.73, 161.50, 16.80, 2.32, 2.11, and 156.49 thousand metric tons, respectively, representing an increase of 36.02%, 67.42%, and 86.90% in 2030, 2040, and 2050, respectively.
In contrast, under the ELC scenario, emissions of CO, HC, PM10, PM2.5, and NOX are projected to decline relative to the 2024 levels, with reductions of approximately 28.54, 3.55, 1.38, 1.24, and 22.26 thousand metric tons, respectively, by 2030. However, SO2 emissions under this scenario are projected to increase by approximately 44.36 metric tons over the same period, a trend that could primarily be attributable to the combined effects of continued growth in the vehicle population and the gradual phase-out of older, high-emission vehicles. By 2040, reductions across all six pollutants under the ELC scenario are projected to reach approximately 0.22, 49.03, 5.87, 1.63, 1.47, and 33.34 thousand metric tons for SO2, CO, HC, PM10, PM2.5 and NOX, respectively, while by 2050, these reductions are expected to deepen further to approximately 0.87, 59.16, 6.87, 1.71, 1.54, and 44.19 thousand metric tons, respectively, depicting a decline of 9.74%, 31.83%, 35.51%, 64.13%,63.45%, and 24.54%, respectively.
Across all four emission reduction scenarios studied, pollutant emissions are uniformly lower than those projected under the BAU scenario. Moreover, for each target year, the emissions of each pollutant decrease monotonically with increasing scenario stringency, consistent with the principle that more ambitious policy interventions yield greater environmental benefits [65]. It is also noted that under the EER scenario, the emissions of all six pollutants remain above 2024 baseline levels, underscoring the need for even more aggressive control measures to achieve absolute reductions. Conversely, under the GLC scenario, the upward trajectory of pollutant emissions moderates considerably. Notably, under the ELC scenario, the emissions of most pollutants exhibit an initial increase followed by a gradual decline over the projection horizon.
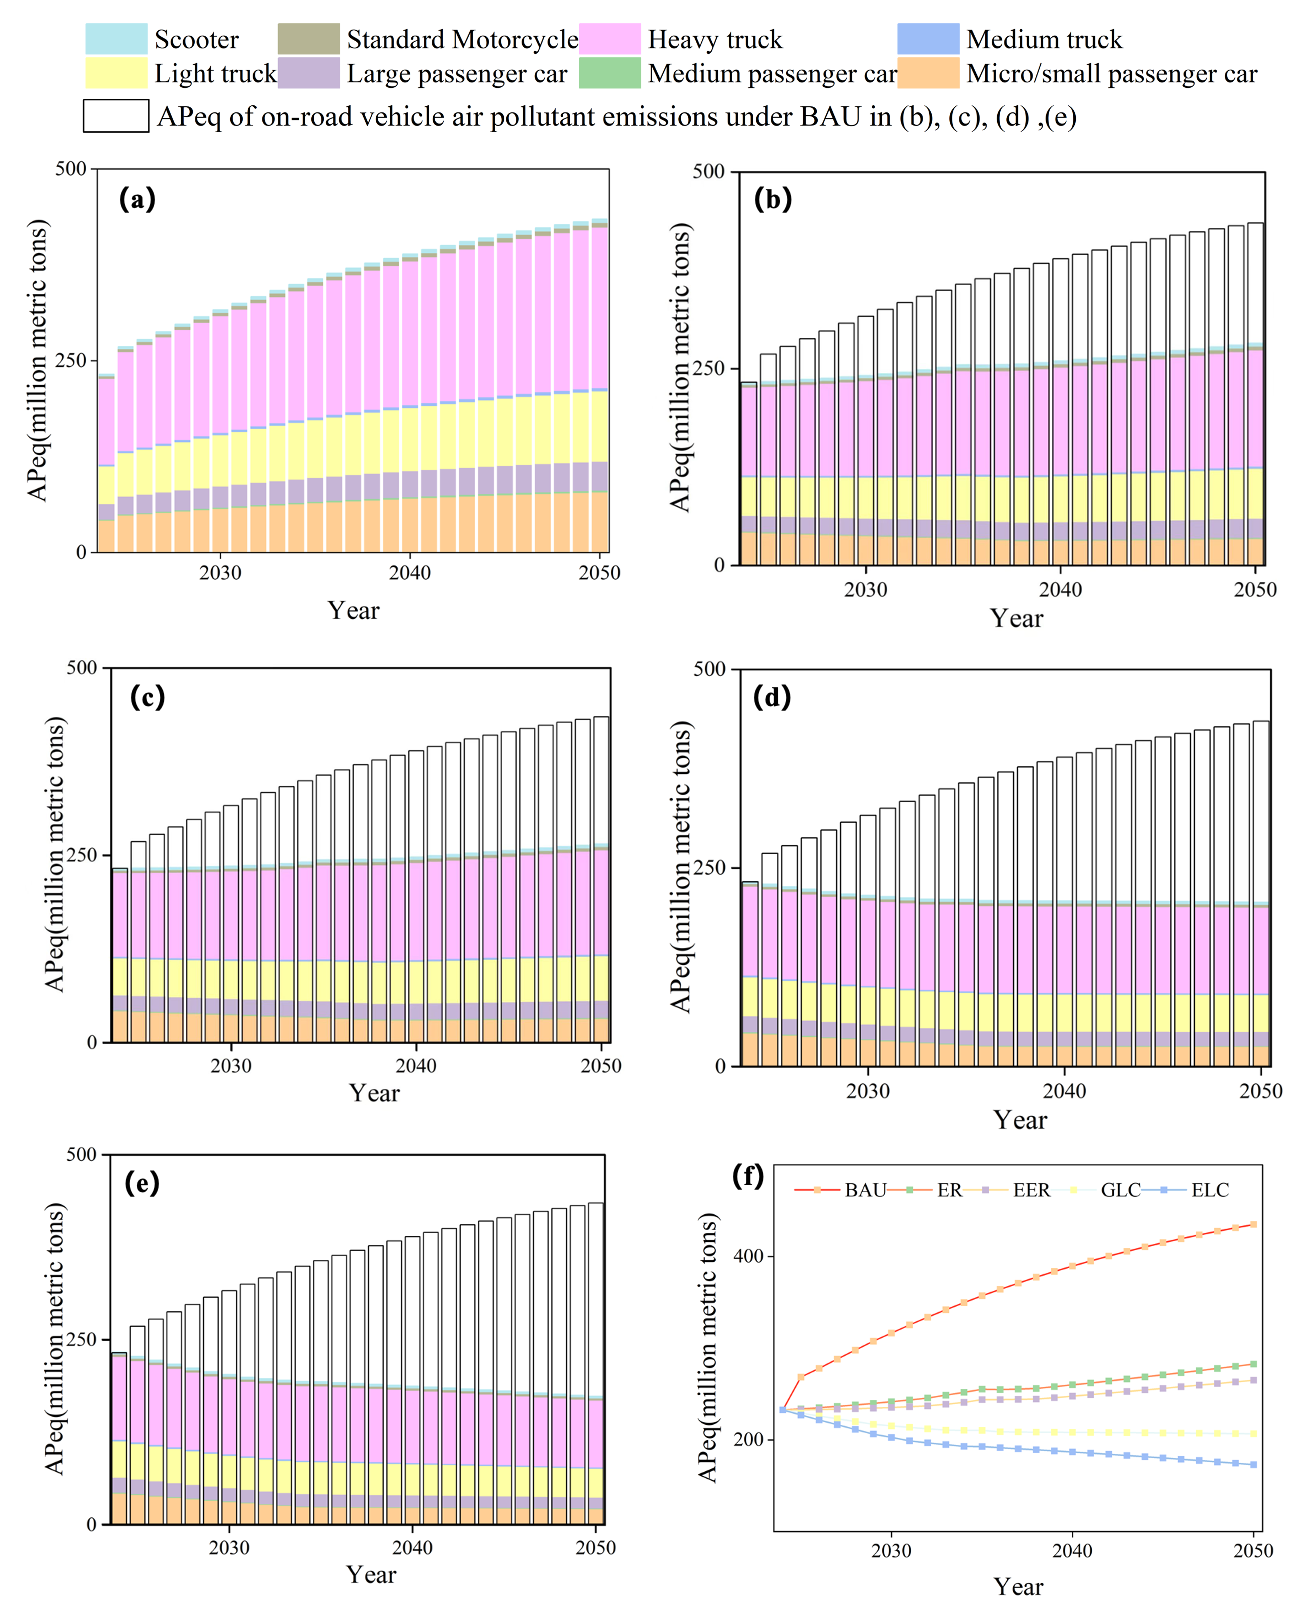
To facilitate an integrated assessment of aggregate pollution loads, the six individual pollutants were harmonized into a common metric—air pollution equivalents (APeq). Figure 5 presents the APeq values for on-road vehicles under the five scenarios (BAU, ER, EER, GLC, and ELC) and a comparative synthesis of total APeq across all scenarios.
Each panel ((a) to (f)) disaggregates APeq contributions by vehicle type over the 2024–2050 period. Under the BAU scenario, APeq exhibits a sustained and substantial growth, reaching an increment of approximately 202.24 million metric tons by 2050 relative to the 2024 baseline, while under the ER scenario, APeq growth is moderated relative to BAU, yet the total emissions continue to increase, culminating in a net increase of 50.02 million metric tons by 2050. With regard to the EER scenario, the 2050 APeq total exceeds the baseline by 32.38 million metric tons, whereas under the GLC scenario, the trend of equivalent carbon dioxide emissions begins to decrease, ultimately yielding a net decrease of 26.06 million metric tons by 2050. Under the ELC scenario, the annual APeq value is further attenuated, with emissions peaking in 2024 and subsequently declining to 59.69 million metric tons below the baseline by 2050, yielding a net decrease of 25.65%.

3.3.2. GHG Emissions Under Different Scenarios

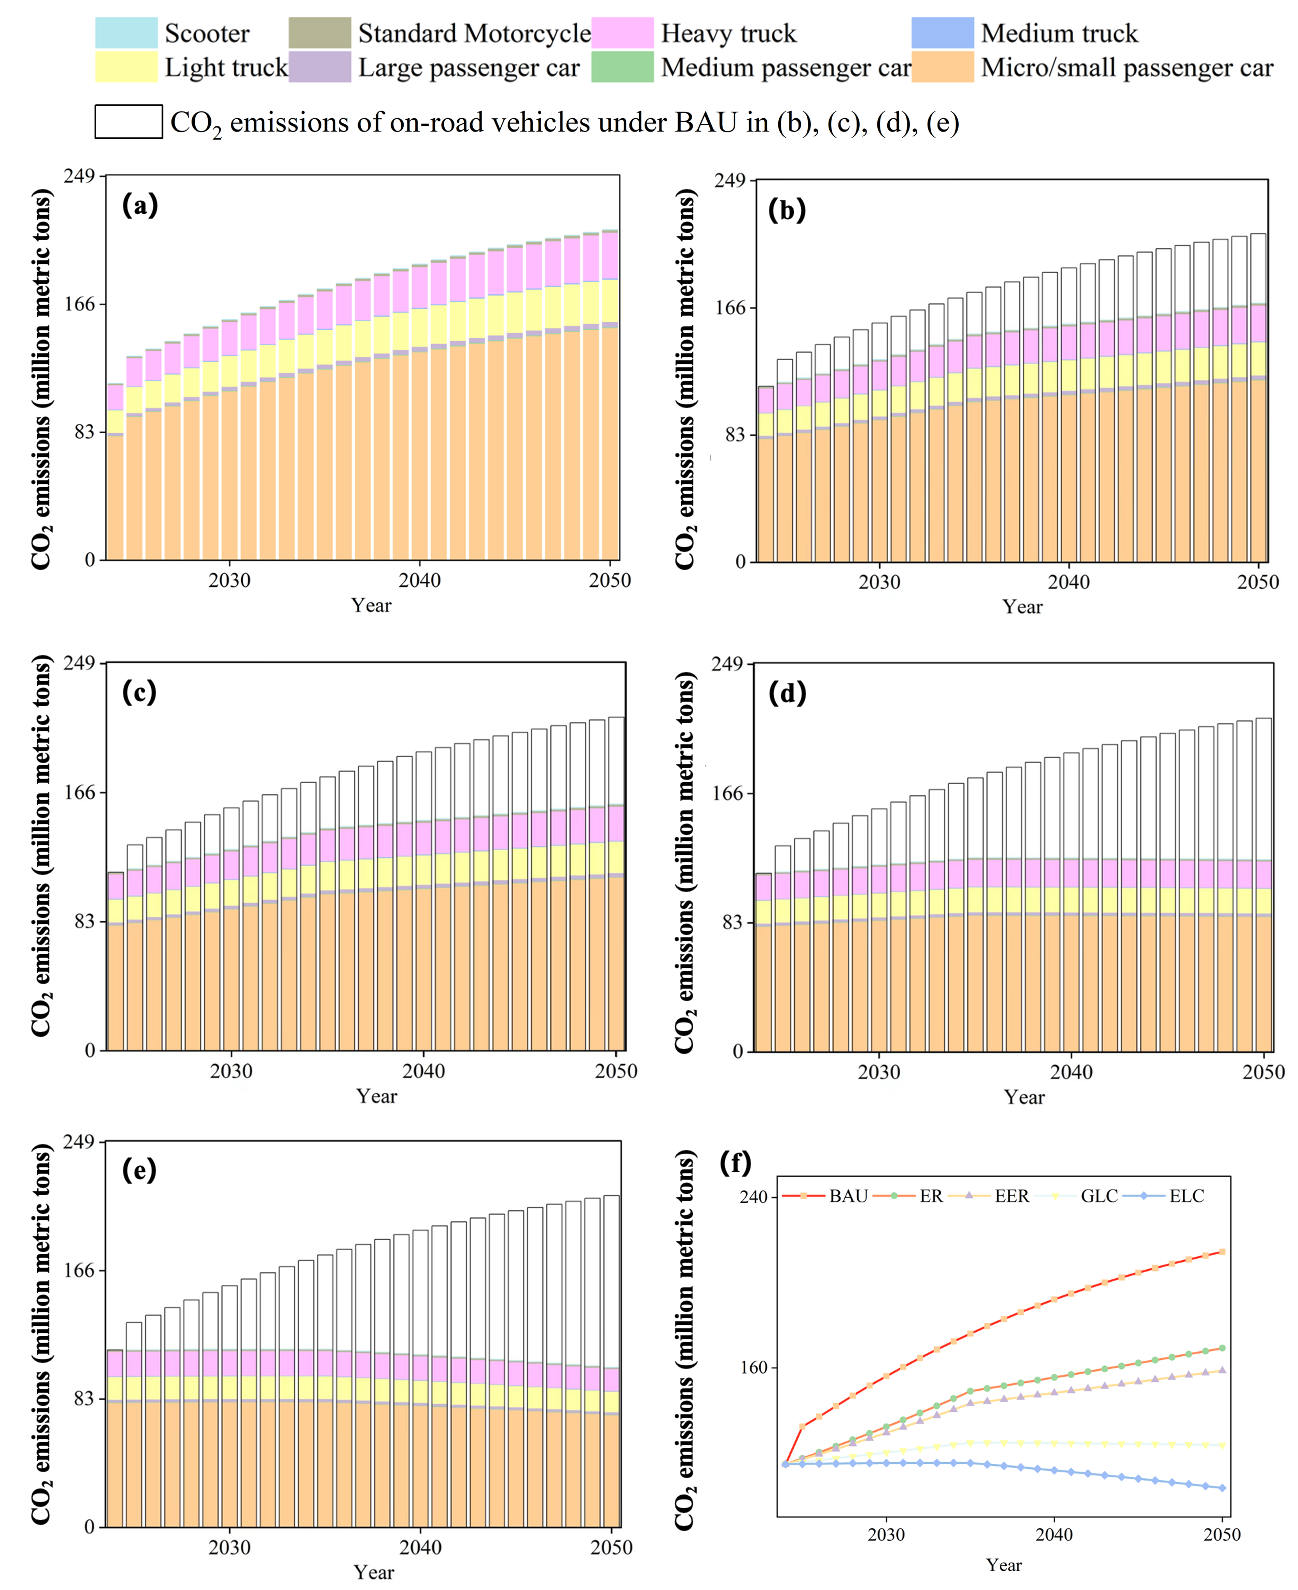
Figure 6 presents the projected CO2-equivalent emissions from motor vehicles in Zhejiang Province under five scenarios: BAU, ER, EER, GLC, and ELC. Under the BAU scenario, total CO2-equivalent emissions are projected to approach approximately 214.47 million metric tons by 2050 (Figure 6a). The contribution structure is as follows: mini/small passenger cars (70.30%), medium buses (0.27%), large buses (1.59%), light trucks (12.79%), medium trucks (0.36%), heavy trucks (13.78%), standard motorcycles (0.80%), and light motorcycles (0.11%). Meanwhile, under the ER scenario, emissions across all vehicle types continue to increase, although the increasing rate declines, with total emissions in 2050 projected to be 21.09% below the BAU level. And the emission growth is further attenuated under the EER scenario, yielding a 26.01% reduction relative to BAU. With regard to the emissions under the GLC scenario, an initial increase followed by a decline can be observed, with total emissions projected to be 42.32% lower than the BAU projection, while a further decrease of 51.71% under the ELC scenario could be expected, with emission reductions becoming progressively more pronounced in the later stages of the projection horizon. Compared to the GLC scenario, the emission peak under the ELC scenario occurs earlier, reaching 115.4 million metric tons in 2032. Against the backdrop of China’s national commitment to achieving a carbon peak by 2030, regionally differentiated peaking pathways have emerged as a critical strategy for realizing the “dual-carbon” goals. Considered as a developed area in China, Zhejiang commenced its industrial and energy structure transformation earlier than many other regions, with the share of non-fossil energy consumption exhibiting a sustained upward trajectory. Provincial policy documents have explicitly articulated an expectation for Zhejiang to assume a pioneering and demonstrative role in this domain. Based on an analysis of the Zhejiang Province 2025 Key Points for Carbon Peak and Carbon Neutrality Work [66] and relevant energy consumption data, it is expected that the province’s carbon emissions peak may occur earlier than the national target year. This assessment is grounded in the actual trajectory of Zhejiang’s economic development and emission reduction progress, and aligns with the national policy directive encouraging “regions with the capacity to peak first.”
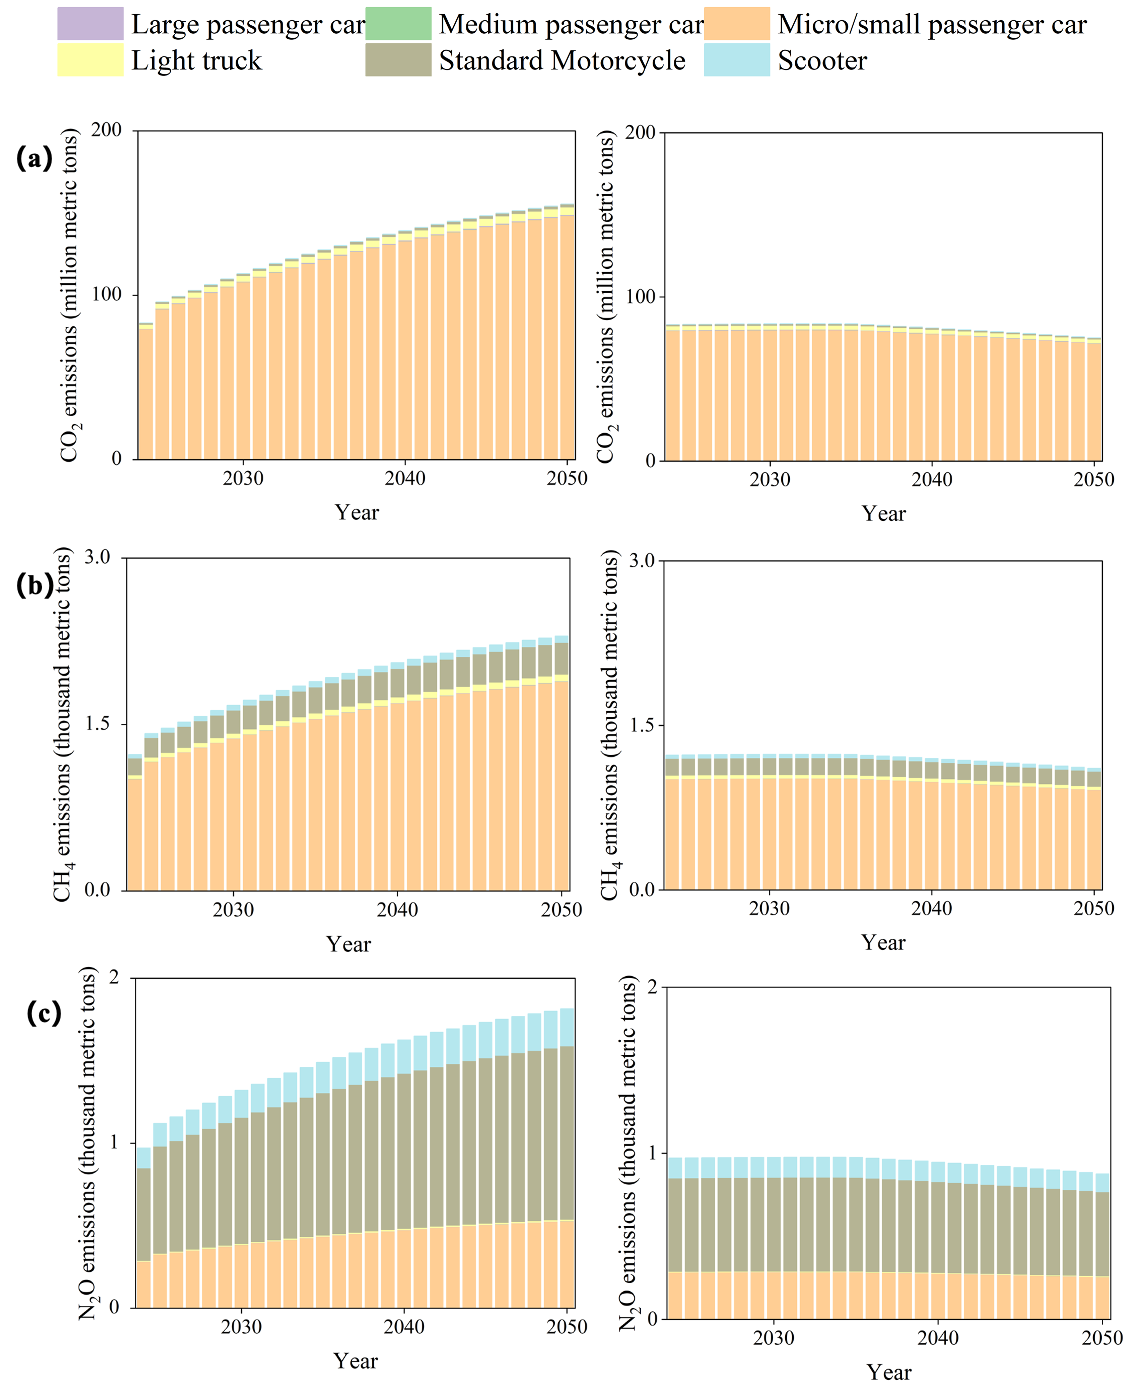
Figure 7 compares CO2, CH4 and N2O emissions from gasoline vehicles by types under the BAU and ELC scenarios. CO2 emissions from all vehicle types remain elevated throughout the projection period, exhibiting no significant downward trend by 2050, with mini/small passenger cars constituting the most prominent contributor. Although aggregate CH4 and N2O emissions are relatively modest in magnitude, they still account for a significant share under the BAU scenario, indicating that without structural mitigation measures, the transportation sector would remain a sustained long-term source of greenhouse gas emissions. CH4 emissions continue to be dominated by mini/small passenger cars, and standard motorcycles emerge as the most prominent contributors to N2O emissions. In contrast, under the ELC scenario, emissions of all vehicle types exhibit a curve characterized by an initial increase followed by a subsequent decline, CO2 emissions peak in 2032 at 83.73 million metric tons, while CH4 and N2O emissions also peak in 2032 at 1.23 and 0.97 thousand metric tons, respectively. This may highlight the critical role of implementing systemic emission reduction policies, including electrification, energy efficiency improvements, and clean fuel substitution. Further analysis reveals that mini/small passenger cars and motorcycles achieve a more efficient emission reduction effect under the ELC scenario, reflecting a stronger flexibility of light-duty vehicles in technological substitution pathways [67]. Conversely, emission control for heavy-duty vehicles (e.g., light trucks) remains contingent upon substantial technological breakthroughs and sustained policy support. Overall, the emission trajectory under the ELC scenario suggests that through proactive intervention, greenhouse gas emissions from the gasoline vehicle fleet may achieve carbon peaking around 2030, thereby delineating a feasible pathway for low-carbon transformation in the transportation sector.
Figure 8 presents a comparative analysis of CO2, CH4 and N2O emissions from diesel vehicles by type under both the BAU and ELC scenarios. It can be seen from the figure that under the BAU scenario, CO2 emissions from the diesel vehicle fleet show a constant elevating trend, with heavy trucks and light trucks representing the largest contributions. Although the absolute magnitude of CH4 and N2O emissions remains modest, they showed a trend of continuous growth, particularly noticeable among freight vehicle types. Under the ELC scenario, greenhouse gas emissions of all diesel vehicle categories depict an initial increment followed by a drop; CO2 emissions peak in 2032 at 31.65 million metric tons, while CH4 and N2O emissions also peak in 2032 at 0.855 and 1.11 thousand metric tons, respectively. The emission reduction potential demonstrated by diesel vehicles under the ELC scenario indicates that, through integrated measures encompassing fuel substitution, energy efficiency improvements, and fleet electrification, deep decarbonization of the diesel transportation sector is achievable. However, the pace and extent of such decarbonization remain mediated by vehicle type and operational characteristics.
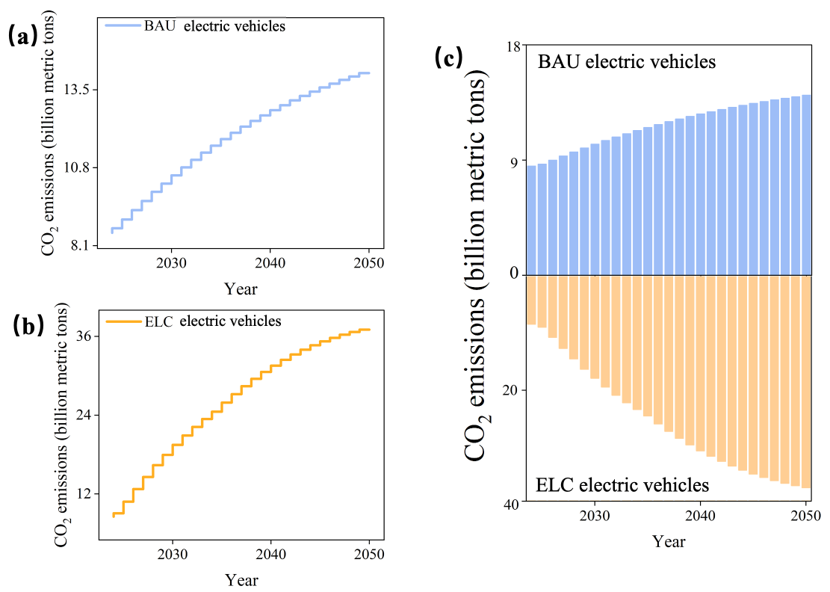
Figure 9 illustrates the total CO2 emissions of electric motor vehicles under the BAU and ELC scenarios. Under the BAU scenario, CO2 emissions from electric vehicles increase from 8.54 million metric tons in 2024 to 14.08 million metric tons in 2050, while with regard to the ELC scenario, emissions increase from 8.54 million metric tons to 37.02 million metric tons over the same period. Notably, CO2 emissions from electric vehicles under the ELC scenario are consistently and slightly higher than those under the BAU scenario throughout the projection span. This phenomenon should be primarily attributable to the asynchronous weakening in the carbon intensity of electricity generation with fleet electrification, because the electric vehicle penetration under the ELC scenario shows a visible under the ELC scenario, while there is a temporal lag in the clean energy transition of the power system. This may underscore that the carbon reduction benefits of electric vehicles are highly contingent upon the decarbonization trajectory of the power system [68]. To fully realize the emission reduction potential of electric vehicles within a low-carbon transition pathway, it is essential to simultaneously advance the clean energy transition of the power structure.

3.4. Co-Benefits of Reduction in Air Pollutants and CO2

3.4.1. Elastic Coefficients of Synergistic Emission Reduction

The co-benefits of reducing air pollutants and CO2 in Zhejiang Province over 2025–2050 are characterized through the elasticity coefficients. As presented in Table 1, the elasticity coefficients for all motor vehicle categories in Zhejiang Province fall within the interval (0, 1) across all scenarios and temporal periods. This suggests that the percentage reduction in atmospheric pollutant emissions exceeds the corresponding percentage reduction in CO2 emissions. The proximity of an elasticity coefficient to unity signifies a more pronounced synergistic emission reduction effect [43]. A distinct hierarchy in the efficiency of synergistic reduction between atmospheric pollutants and CO2 can be found within Zhejiang’s motor vehicle sector: SO2 > NOX > CO > HC > PM2.5 > PM10. This ordering diverges from observations reported for Shanghai, thereby highlighting regional heterogeneity in synergistic effects. Such variations may be attributable to differences in fleet composition, energy structure, and the stringency of applicable control measures across jurisdictions [69].
Two evident temporal trends could be observed. Firstly, as scenarios progress from ER to ELC—reflecting increasingly stringent mitigation strategies, including tighter fuel economy standards and accelerated phase-out schedules for internal combustion engine vehicles—the elasticity coefficients for all pollutants exhibit a progressive convergence toward unity, which demonstrates that enhanced mitigation measures amplify synergistic benefits, yielding increasingly synchronized reductions in CO2 and atmospheric pollutants. Secondly, as the projection period extends from 2030 to 2050, the elasticity coefficients for synergistic reduction between each pollutant and CO2 similarly increase and approach unity. This may emphasize the critical importance of sustained policy implementation to maximize synergistic benefits and achieve deep decarbonization concurrently with continued air quality improvement.

3.4.2. Coordinate System Analysis for Synergistic Control Benefits

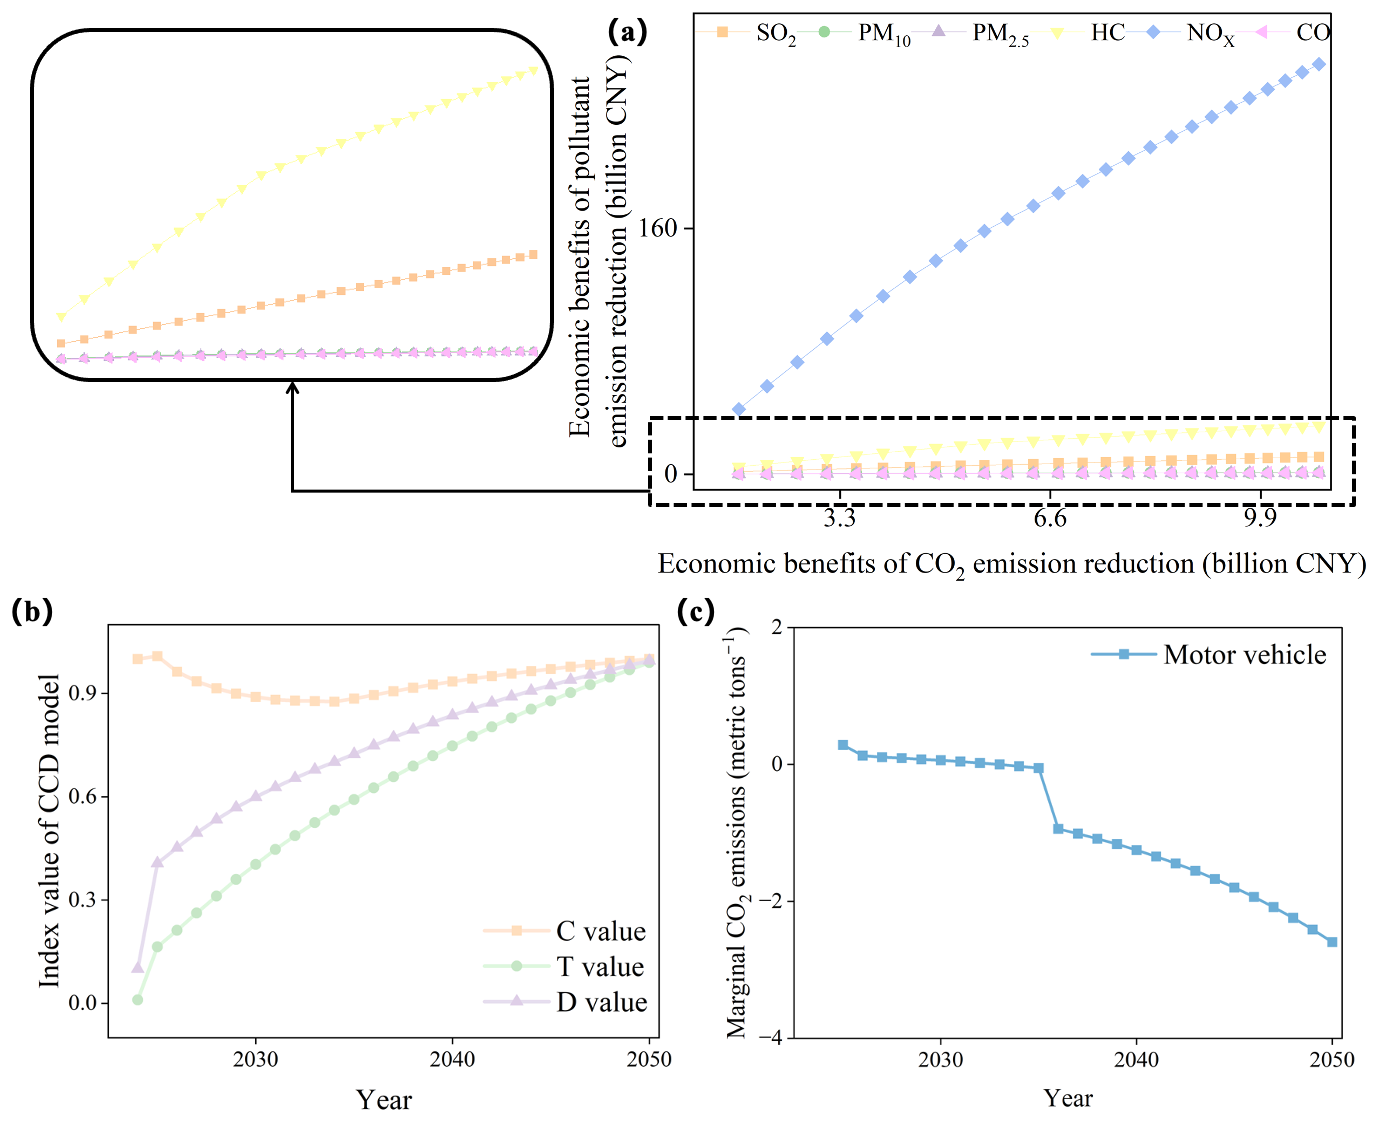
Achieving synergy between pollution abatement and carbon mitigation constitutes a critical pathway for advancing green transformation and fostering high-quality, low-carbon development [70]. Figure 10a presents an assessment of co-control benefits derived from projected vehicle emission reductions under the ELC scenario over 2025–2050. This evaluation monetizes emission reductions using a coordinate system approach, consistent with established methodologies for environmental externality assessment. All coordination points are situated in the first quadrant of the coordinate system, indicating that the implemented mitigation measures generate substantial synergistic benefits through the simultaneous reduction in CO2 and atmospheric pollutants [8]. For each atmospheric pollutant, the coordination points across different years exhibit an approximately linear trajectory. Under a consistent environmental–economic accountability framework, the relative mitigation effort allocated to CO2 versus each respective atmospheric pollutant remains stable over time, while cumulative emission reductions—and consequently the accrued economic benefits—increase progressively with sustained policy implementation.
With regard to the equivalent economic benefits, the NOX-CO2 reduction combination yields the highest aggregate benefits, followed by the HC-CO2 and SO2-CO2 combinations. In comparing the economic benefits of atmospheric pollutant reduction against those of CO2 reduction, the advantage associated with NOX abatement is particularly pronounced, as evidenced by the steepest slope among the respective data point trajectories, while the synergistic emission reduction benefits for the remaining pollutant combinations with CO2 are comparatively modest, although they exhibit a marginal increase over time. Under the ELC scenario, the economic benefits attributable to CO2 reduction are estimated to reach approximately 10.81 billion CNY by 2050. Correspondingly, the monetized benefits from emission reductions in other atmospheric pollutants are as follows: SO2 at 11.43 billion CNY, HC at 31.47 billion CNY, NOX at 266.83 billion CNY, CO at 0.95 billion CNY, PM10 at 1.02 billion CNY, and PM2.5 at 0.92 billion CNY, respectively.

3.4.3. Coupling Coordination Degree of CO2 and Air Pollutant Emission Reduction

The CCD model was employed to analyze the interaction between carbon mitigation and pollutant reduction initiatives [71] and to evaluate the projected reductions in CO2 emissions and total APeq from motor vehicles in Zhejiang Province under the ELC scenario (2024–2050) relative to the BAU scenario. The APeq metric is derived by converting the mass of each individual air pollutant—NOX, SO2, HC, PM2.5, PM10 and CO—into a standardized equivalent based on its respective environmental impact potential. The results indicate that, over the 2024–2050 period, the C value remains persistently high, fluctuating within the range of 0.876 to 1.000. This reflects a strong and stable interdependence between the CO2 reduction subsystem and the atmospheric pollutant reduction subsystem within Zhejiang’s road transportation sector. The sustained high Coupling Degree highlights the inherent interconnectedness and mutual reinforcement between measures targeting CO2 abatement (e.g., efficiency improvements) and those addressing atmospheric pollutants (e.g., stricter emission standards and retrofitting initiatives) [72]. The T value exhibits a stable and strong upward trajectory, rising from approximately 0.010 in 2024 to 0.990 in 2050. The constant increase indicates a progressive enhancement in the overall coordination and synergistic development of the two emission reduction systems over the concerned period, suggesting that the integrated strategy embodied by the ELC scenario gains effectiveness and coherence over time. The D value, which synthesizes both the coupling level and the coordination level, depicts a trajectory analogous to that of the T value. It increases substantially from a low of 0.100 in 2024 to 0.995 in 2050, signifying a clear transition from an initially uncoordinated state to a state of high-quality coordination by the terminal year of the forecast period. This progression highlights the critical importance of long-term, consistent implementation of the ELC strategy for achieving the dual objectives of coordinated climate and clean air objectives within Zhejiang’s transportation sector.

3.5. Marginal Emissions of CO2

Marginal CO2 emissions are defined as the incremental CO2 emissions generated per unit increase in activity level. When marginal CO2 emissions become negative, it signifies that total emissions are declining despite continued growth in activity level—thereby identifying the precise temporal point at which emissions peak. Compared to average CO2 emissions, marginal CO2 emissions offer a distinct analytical advantage in that they enable accurate identification of peak emission timing. Specifically, total emissions attain their maximum when marginal emissions reach their minimum positive value or zero. Figure 10c presents the annual trajectory of marginal CO2 emissions for the on-road transportation sector under the ELC scenario. The curve reveals an evident overall declining trend in marginal CO2 emissions, which reflects substantial improvements in the environmental performance of Zhejiang’s vehicle fleet, driven by increased adoption of clean energy sources and the concomitant reduction in the carbon intensity of the transportation energy mix [73].
A notable finding of the present analysis is that the marginal emissions curve intersects the zero axis around 2032, which indicates that 2032 should be the anticipated peak year for CO2 emissions from the on-road motor vehicle sector in Zhejiang Province under the ELC scenario, according to economic theory and empirical environmental studies that total emissions peak precisely when marginal emissions reach zero. This timing may provide empirical validation for the effectiveness of fleet renewal measures incorporated within the ELC pathway. The transition to negative marginal emissions after 2032 marks a successful decoupling between economic performance and carbon emissions proxied by transport demand. Despite further growth in vehicle activity, the ongoing structural shift toward a cleaner fleet generates a sustained reduction in total emissions.

3.6. Health Benefit Evaluation

The health benefits of PM2.5 reduction in Zhejiang Province under five scenarios (BAU, ER, EER, GLC, ELC) were further evaluated on the basis of the GEMM model combined with the random forest machine learning model. The results indicate that as policy intensity gradually increases, the annual average PM2.5 concentration in Zhejiang Province shows a continuous declining trend, and the associated health benefits would improve. Under the BAU scenario, the annual average PM2.5 concentration shows a slight increase of 1.2% compared to the baseline year, while under the ER, EER, GLC, and ELC scenarios, the PM2.5 concentration could reduce by 2.8%, 4.3%, 6.4% and 6.8%, respectively, which may correspondingly avoid 8697, 11,866, 16,255 and 17,297 premature deaths attributable to PM2.5 exposure in 2050. Based on the results above, it is reasonable to speculate that strengthened air pollution control measures and low-carbon development regulations on the basis of existing policies, integrated with a commitment to achieving carbon neutrality targets, should contribute to air quality improvement and alleviation of adverse effects on human health.

4. Conclusions

This study utilized a multi-scenario analysis approach to identify the emission trends, reduction potential, and the synergic effects of a synchronous reduction in GHG and air pollutants (NOx, HC, PM2.5, PM10, CO and SO2) in the road vehicle sector of Zhejiang Province. Nonlinear predictions of future activity levels in road mobile sources by incorporating economic and demographic variables are initiated and co-benefits associated with reductions in air pollutant and CO2 emissions across various mitigation scenarios are dynamically evaluated, while the associated synergic mitigations in PM2.5 concentrations are predicted by establishing an RF model and the health benefits are evaluated with the GEMM. Based on forecasts from ARIMA and Gompertz, the vehicle ownership rate is expected to reach about 597 vehicles per thousand people by 2050. Multi-scenario analysis reveals significant emission reduction potential. A decrease of 59.69 million tons (a decrease of 25.65%) in APeq can be observed when comparing the APeq under the ELC scenario and baseline, while CO2 emissions could be reduced by 51.71% under ELC and the emission peak time is expected to be 2032, which is also validated by the marginal CO2 emission curve that intersects the zero axis around that same year. Significant co-benefits can be expected and are enhanced by stricter policies. Assessment in this study indicates that reducing CO2 emissions can effectively reduce air pollutants simultaneously. Elasticity coefficient analysis shows that under all scenarios, the percentage reduction in air pollutant emissions is higher than that of CO2, with the synergistic efficiency ranking as SO2 > NOX > CO > HC > PM2.5 > PM10. The elasticity coefficients gradually approach 1 from ER to ELC, indicating that stricter and more sustained policies lead to stronger and more synchronized co-reduction effects. CCD analysis further confirms that under the ELC scenario, the coordination between the CO2 reduction system and the air pollutant reduction system significantly improves from a low level in 2024 to a high-quality coordination by 2050. Under the ELC scenario, the economic profits attributable to CO2 reduction are estimated to reach approximately 10.81 billion CNY by 2050. With regard to the health benefits resulting from the reduced PM2.5 concentration in the road mobile sector under different scenarios, 17,297 premature deaths under the ELC scenario could be prevented in 2050. Based on the findings above, it is reasonable to propose that formulating and implementing a medium- to long-term strategy for synergistic emission reduction in the road mobile sector, and clear quantifiable targets for different phases (e.g., 2030, 2035, 2050), should contribute significantly to the achievement of “dual-carbon” and air quality improvement. The findings in this study could also provide essential insights for the co-management of CO2 and air pollutants in other areas and sectors.
Limitations of this study should also be discussed. In this study, predicting models, such as ARIMA and Gompertz, have been applied. Although the verification of the models shows satisfactory performance, prediction itself inherently involves weaknesses in eliminating the impact of unpredictable events, such as COVID-19. Additionally, the health effect of the synergistic reduction in air pollutants and GHGs focuses on PM2.5-induced premature deaths, while the heath benefit of other air pollutants, such as O3, has not been addressed, and deserves further investigation.

Supplementary Materials

The following supporting information can be downloaded at: https://www.mdpi.com/article/10.3390/atmos17070690/s1. References [1,38,39,42,43,74,75,76,77,78,79,80,81,82,83,84] are cited in the supplementary materials. Figure S1. RF model training and validation in PM2.5 concentration predicting. Table S1. The structure of the mobile sources in the LEAP model. Table S2. Air pollution equivalent value derived from reference [84]. Table S3. key parameters in different mitigation scenarios. Table S4. the specific values for θ, α, μ and v.

Author Contributions

Conceptualization, H.X. and K.X.; Methodology, H.X., X.P., X.J., K.X. and Y.L.; Software, H.X., X.P. and X.J.; Validation, X.P., X.J., K.X. and Y.L.; Formal analysis, X.P., X.J. and K.X.; Investigation, H.X.; Resources, X.P., K.X. and Y.L.; Data curation, X.P. and K.X.; Writing—original draft, H.X.; Writing—review & editing, X.J., K.X. and Y.L.; Visualization, X.J. and K.X.; Supervision, X.J. and Y.L.; Project administration, H.X. and Y.L.; Funding acquisition, H.X., X.J. and Y.L. All authors have read and agreed to the published version of the manuscript.

Funding

This research was funded by the Ministry of Ecology and Environment of China (2025YFF1309300), Country and Region Studies of Ministry of Education of China (2024-N29) and Zhejiang Shuren University (2023R043; 2025XZ033). Any opinions, conclusions or recommendations included in this paper are those of the authors, and do not necessarily reflect the views of the supporters.

Data Availability Statement

Data will be available on request.

Conflicts of Interest

The authors declare no conflict of interest.

References

  1. IPCC (Intergovernmental Panel on Climate Change). AR6 Synthesis Report: Climate Change 2023. 2023. Available online: https://www.ipcc.ch/report/sixth-assessment-report-cycle/ (accessed on 20 January 2026).
  2. Li, C.; Jin, H.; Tan, Y. Synergistic effects of a carbon emissions trading scheme on carbon emissions and air pollution: The case of China. Integr. Environ. Assess. Manag. 2024, 20, 1112–1124. [Google Scholar] [CrossRef]
  3. ICCGD (Institute of Climate Change and Sustainable Development of Tsinghua University). China’s Long-Term Low-Carbon Development Strategy and Pathway; Report; Springer: Heidelberg, Germany, 2020. [Google Scholar]
  4. MEE (Ministry of Ecology and Environment of the People’s Republic of China). February Regular Press Conference: “Deepening the Battle to Defend the Blue Sky and Comprehensively Advancing the Construction of a Beautiful Blue Sky”. 2026. Available online: https://www.mee.gov.cn/ywdt/xwfb/202602/t20260227_1144964.shtml (accessed on 1 March 2026).
  5. GB 3095-2012; Ambient Air Quality Standards. MEE (Ministry of Ecology and Environment of the People’s Republic of China): Beijing, China, 2012. Available online: https://www.mee.gov.cn/ywgz/fgbz/bz/bzwb/dqhjbh/dqhjzlbz/201203/W020250407403788086276.pdf (accessed on 1 March 2026).
  6. GB 3095-2026; Ambient Air Quality Standards. MEE (Ministry of Ecology and Environment of the People’s Republic of China): Beijing, China, 2026. Available online: https://www.mee.gov.cn/ywgz/fgbz/bz/bzwb/dqhjbh/dqhjzlbz/202602/W020260225340726552289.pdf (accessed on 1 March 2026).
  7. WHO (World Health Organization). WHO Global Air Quality Guidelines: Particulate Matter (PM2.5 and PM10), Ozone, Nitrogen Dioxide, Sulfur Dioxide and Carbon Monoxide; Report; World Health Organization: Geneva, Switzerland, 2021. [Google Scholar]
  8. Yi, H.; Zhao, L.; Qian, Y.; Zhou, L.; Yang, P. How to achieve synergy between carbon dioxide mitigation and air pollution control? Evidence from China. Sustain. Cities Soc. 2022, 78, 103609. [Google Scholar] [CrossRef]
  9. Du, L.; Zhao, H.; Tang, H.; Jiang, P.; Ma, W. Analysis of the synergistic effects of air pollutant emission reduction and carbon emissions at coal-fired power plants in China. Environ. Prog. Sustain. Energy 2021, 40, e13630. [Google Scholar] [CrossRef]
  10. Liu, D.; Li, X.; Wang, D.; Wu, H.; Li, Y.; Li, Y.; Qiao, Q.; Yin, Z. An evaluation method for synergistic effect of air pollutants and CO2 emission reduction in the Chinese petroleum refining technology. J. Environ. Manag. 2024, 371, 123169. [Google Scholar] [CrossRef] [PubMed]
  11. Liao, N.; Zhu, L.; He, Y. Synergistic effect of air pollutant abatement on CO2 reduction in the industrial sector: Evidence from China. Environ. Sci. Pollut. Res. 2022, 30, 37726–37743. [Google Scholar] [CrossRef] [PubMed]
  12. Qin, X.; Xie, P.; Liao, C. Study on the synergistic effect of NOx and CO2 emission reduction in the industrial sector of Guangzhou. Front. Environ. Sci. 2025, 13, 1497121. [Google Scholar] [CrossRef]
  13. Jia, W.; Li, L.; Lei, Y.; Wu, S. Synergistic effect of CO2 and PM2.5 emissions from coal consumption and the impacts on health effects. J. Environ. Manag. 2023, 325, 116535. [Google Scholar] [CrossRef] [PubMed]
  14. Tong, Y.; Gao, J.; Yue, T.; Liu, J.; Yuan, Y. Spatio-temporal heterogeneity and synergistic effects of air pollutants and CO2 emissions from Chinese coal-fired industrial boilers. Resour. Conserv. Recycl. 2024, 204, 107504. [Google Scholar] [CrossRef]
  15. Guo, D.; Zhang, S.; Dai, Z.; Hou, H.; Wang, G.; Xu, H. Synergistic benefits of pollution and carbon reduction in collaborative domestic solid waste disposal: A life cycle perspective. Environ. Impact Assess. Rev. 2025, 114, 107892. [Google Scholar] [CrossRef]
  16. Chen, Y.; Qiu, R.; Wang, J.; Chen, P.; Zheng, M.; Guo, H. Synergistic efficiency in greenhouse gas emission reduction and water pollution control: Evaluating policy impacts in China. Front. Environ. Sci. Eng. 2025, 19, 132. [Google Scholar] [CrossRef]
  17. Yu, Q.; Yang, S. Synergistic effect of carbon emission reduction from regional carbon trading on air pollutant emission reduction. Front. Environ. Sci. 2025, 13, 1590813. [Google Scholar] [CrossRef]
  18. Bogdanov, D.; Ram, M.; Khalili, S.; Aghahosseini, A.; Fasihi, M.; Breyer, C. Effects of direct and indirect electrification on transport energy demand during the energy transition. Energy Policy 2024, 192, 114205. [Google Scholar] [CrossRef]
  19. Udoh, J.; Lu, J.; Xu, Q. Application of Machine Learning to Predict CO2 Emissions in Light-Duty Vehicles. Sensors 2024, 24, 8219. [Google Scholar] [CrossRef] [PubMed]
  20. Han, H. Increases in global transportation-induced air pollution mortality and radiative forcing during 1990–2019. Front. Environ. Sci. 2025, 13, 1545924. [Google Scholar] [CrossRef]
  21. Duan, L.; Hu, W.; Deng, D.; Fang, W.; Xiong, M.; Lu, P.; Li, Z.; Zhai, C. Impacts of reducing air pollutants and CO2 emissions in urban road transport through 2035 in Chongqing, China. Environ. Sci. Ecotechnology 2021, 8, 100125. [Google Scholar] [CrossRef] [PubMed]
  22. Tian, P.; Mao, B.; Tong, R.; Zhang, H.; Zhou, Q. Analysis of carbon emission level and intensity of China’s transportation industry and different transportation modes. Clim. Change Res. 2023, 19, 347–356. [Google Scholar] [CrossRef]
  23. Zeng, Q.; He, L. Study on the synergistic effect of air pollution prevention and carbon emission reduction in the context of “dual carbon”: Evidence from China’s transport sector. Energy Policy 2023, 173, 113370. [Google Scholar] [CrossRef]
  24. Weng, D.; Zhang, H.; Wen, X.; Hu, X.; Zhang, L. Co-benefits of carbon and pollutant emission reduction in urban transport: Sustainable pathways and economic efficiency. Urban Clim. 2025, 60, 102348. [Google Scholar] [CrossRef]
  25. Xu, J.; Guan, Y.; Oldfield, J.; Guan, D.; Shan, Y. China carbon emission accounts 2020–2021. Appl. Energy 2024, 360, 122837. [Google Scholar] [CrossRef]
  26. ZPBS (Zhejiang Provincial Bureau of Statistics). Zhejiang Statistical Yearbook (2025). 2025. Available online: https://tjj.zj.gov.cn/col/col1525563/index.html (accessed on 8 December 2025).
  27. ZEIC (Zhejiang Economic and Information Center). Zhejiang’s Clean Energy Installed Capacity Surpasses the 100-Million-Kilowatt. 2026. Available online: https://zjic.zj.gov.cn/ywdh/nyhj/202602/t20260203_23933373.shtml (accessed on 1 March 2026).
  28. ZPDRC (Zhejiang Provincial Development and Reform Commission). Annual Report on Charging and Swapping Infrastructure in Zhejiang Province (2024). 2025. Available online: https://fzggw.zj.gov.cn/art/2025/10/21/art_1620995_58941511.html (accessed on 1 March 2026).
  29. Ates, S.A. Energy efficiency and CO2 mitigation potential of the Turkish iron and steel industry using the LEAP (long-range energy alternatives planning) system. Energy 2015, 90, 417–428. [Google Scholar] [CrossRef]
  30. Yang, D.; Liu, D.; Huang, A.; Lin, J.; Xu, L. Critical transformation pathways and socio-environmental benefits of energy substitution using a LEAP scenario modeling. Renew. Sustain. Energy Rev. 2021, 135, 110116. [Google Scholar] [CrossRef]
  31. MEE (Ministry of Ecology and Environment). The technical guidelines for compilation of air pollutant emission inventory of road motor vehicles. 2014. Available online: https://www.mee.gov.cn/gkml/hbb/bgth/201407/W020140708387895271474.pdf/ (accessed on 8 January 2026).
  32. IPCC (Intergovernmental Panel on Climate Change). 2006 IPCC Guidelines for National Greenhouse Gas Inventories. 2006. Available online: https://www.ipcc-nggip.iges.or.jp/public/2006gl/ (accessed on 8 January 2026).
  33. Medlock, K.B., III; Soligo, R. Car ownership and economic development with forecasts to the year 2015. J. Transp. Econ. Policy (JTEP) 2002, 36, 163–188. Available online: https://www.jstor.org/stable/20053900 (accessed on 12 January 2026). [CrossRef]
  34. Law, T.H.; Hamid, H.; Goh, C.N. The motorcycle to passenger car ownership ratio and economic growth: A cross-country analysis. J. Transp. Geogr. 2015, 46, 122–128. [Google Scholar] [CrossRef]
  35. Miladinov, G. Socioeconomic development and life expectancy relationship: Evidence from the EU accession candidate countries. Genus 2020, 76, 2. [Google Scholar] [CrossRef]
  36. Nagula, M. Forecasting of fuel cell technology in hybrid and electric vehicles using Gompertz growth curve. J. Stat. Manag. Syst. 2016, 19, 73–88. [Google Scholar] [CrossRef]
  37. Duinker, P.N.; Greig, L.A. Scenario analysis in environmental impact assessment: Improving explorations of the future. Environ. Impact Assess. Rev. 2007, 27, 206–219. [Google Scholar] [CrossRef]
  38. ZPDEE (Zhejiang Provincial Department of Ecology and Environment). Notice of the Department of Ecology and Environment of Zhejiang Province and 22 Other Departments on Issuing the Zhejiang Provincial Climate Change Adaptation Action Plan. 2024. Available online: https://sthjt.zj.gov.cn/art/2025/1/10/art_1229263469_2542853.html (accessed on 5 December 2025).
  39. ZPPG (Zhejiang Province People’s Government). Notice of the General Office of Zhejiang Provincial People’s Government on Issuing Several Measures for Promoting the Dual Control of Carbon Emissions in Zhejiang Province. 2025. Available online: https://zjjcmspublic.oss-cn-hangzhou-zwynet-d01-a.internet.cloud.zj.gov.cn/jcms_files/jcms1/web3096/site/attach/0/3ce654f2646a454098d3346e23e474a7.pdf (accessed on 21 January 2026).
  40. Wang, S.-J.; Kong, W.; Ren, L.; Dan-dan, Z.; Binting, D. Research on misuses and modification of coupling coordination degree model in China. J. Nat. Resour. 2021, 36, 793–810. (In Chinese) [Google Scholar] [CrossRef]
  41. Jiang, L.; Bai, L.; Wu, Y.-M. Coupling and coordinating degrees of provincial economy, resources and environment in China. J. Nat. Resour. 2017, 32, 788–799. [Google Scholar] [CrossRef]
  42. Shi, X.; Huang, Z.; Dai, Y.; Du, W.; Cheng, J. Evaluating emission reduction potential and co-benefits of CO2 and air pollutants from mobile sources: A case study in Shanghai, China. Resour. Conserv. Recycl. 2024, 202, 107347. [Google Scholar] [CrossRef]
  43. Li, C.; Qiu, Z.; Yang, W.; Lv, X. Assessing the co-benefits of reductions in mobile-source CO2 and pollutant emissions for urban air quality and public health. Ecotoxicol. Environ. Saf. 2024, 309, 119569. [Google Scholar] [CrossRef]
  44. Zhang, L.; Wu, M.; Bai, W.; Jin, Y.; Yu, M.; Ren, J. Measuring coupling coordination between urban economic development and air quality based on the Fuzzy BWM and improved CCD model. Sustain. Cities Soc. 2021, 75, 103283. [Google Scholar] [CrossRef]
  45. ZPTS (Zhejiang Provincial Tax Service). Understanding Environmental Protection Tax at a Glance. 2025. Available online: https://zhejiang.chinatax.gov.cn/art/2025/4/23/art_11924_636380.html (accessed on 23 December 2025).
  46. SEEE (Shanghai Environment and Energy Exchange). Weekly Composite Price Trends and Trading Information of the National Carbon Market. 2024. Available online: https://www.cneeex.com/c/2024-12-20/495845.shtml (accessed on 12 January 2026).
  47. Burnett, R.; Cohen, A. Relative risk functions for estimating excess mortality attributable to outdoor PM2.5 air pollution: Evolution and state-of-the-art. Atmosphere 2020, 11, 589. [Google Scholar] [CrossRef]
  48. Qin, Y.; Zhou, M.; Hao, Y.; Huang, X.; Tong, D.; Huang, L.; Zhang, C.; Cheng, J.; Gu, W.; Wang, L.; et al. Amplified positive effects on air quality, health, and renewable energy under China’s carbon neutral target. Nat. Geosci. 2024, 17, 411–418. [Google Scholar] [CrossRef]
  49. Maji, K.J. Substantial changes in PM2.5 pollution and corresponding premature deaths across China during 2015–2019: A model prospective. Sci. Total Environ. 2020, 729, 138838. [Google Scholar] [CrossRef] [PubMed]
  50. Zhang, Y. All-cause mortality risk and attributable deaths associated with long-term exposure to ambient PM2.5 in Chinese adults. Environ. Sci. Technol. 2021, 55, 6116–6127. [Google Scholar] [CrossRef] [PubMed]
  51. Richard, B.; Hong, C.; Mieczyslaw, S.; Neal, F.; Bryan, H.; Pope, C.A., III; Apte, J.S.; Brauer, M.; Cohen, A.; Weichenthal, S.; et al. Global estimates of mortality associated with long-term exposure to outdoor fine particulate matter. Proc. Natl. Acad. Sci. USA 2018, 115, 9592–9597. [Google Scholar] [CrossRef] [PubMed]
  52. Bhavsar, P.; Safro, I.; Bouaynaya, N.; Polikar, R.; Dera, D. Chapter 12—Machine Learning in Transportation Data Analytics. In Data Analytics for Intelligent Transportation Systems; Elsevier: Amsterdam, The Netherlands, 2017; pp. 283–307. [Google Scholar] [CrossRef]
  53. Ketu, S. Spatial Air Quality Index and Air Pollutant Concentration prediction using Linear Regression based Recursive Feature Elimination with Random Forest Regression (RFERF): A case study in India. Nat. Hazards 2022, 114, 2109–2138. [Google Scholar] [CrossRef]
  54. Özüpak, Y.; Alpsalaz, F.; Aslan, E. Air Quality Forecasting Using Machine Learning: Comparative Analysis and Ensemble Strategies for Enhanced Prediction. Water Air Soil Pollut. 2025, 236, 464. [Google Scholar] [CrossRef]
  55. Breiman, L. Random Forests. Mach. Learn. 2001, 45, 5–32. [Google Scholar] [CrossRef]
  56. ZPDEE (Zhejiang Provincial Department of Ecology and Environment). As reported in Zhejiang Daily: By the End of This Year, the Proportion of New Energy Trucks and China VI Emission Standard Trucks is Expected to Reach 42%. Tackling Vehicle Exhaust: See How Committed Zhejiang Is. 2025. Available online: https://sthjt.zj.gov.cn/art/2025/5/10/art_1229588133_58958978.html (accessed on 10 January 2026).
  57. ZPPG (Zhejiang Province People’s Government). Action Plan for the Battle Against Diesel Truck Pollution in Zhejiang Province. 2019. Available online: https://www.zj.gov.cn/art/2019/4/25/art_1229017139_56680.html (accessed on 18 January 2026).
  58. ZPPG (Zhejiang Province People’s Government). Zhejiang Provincial Committee of the Communist Party of China and Zhejiang Provincial People’s Government Issue the Implementing Opinions on Comprehensively Deepening the Construction of Beautiful Zhejiang. 2024. Available online: https://www.zj.gov.cn/ (accessed on 16 January 2026).
  59. DNRZP (Department of Natural Resources of Zhejiang Province). The Zhejiang Provincial Master Territorial Spatial Plan (2021–2035). 2024. Available online: https://zrzyt.zj.gov.cn/art/2024/8/9/art_1292468_59029235.html (accessed on 25 January 2026).
  60. Yuan, X.; Liu, X.; Zuo, J. The development of new energy vehicles for a sustainable future: A review. Renew. Sustain. Energy Rev. 2015, 42, 298–305. [Google Scholar] [CrossRef]
  61. Ma, L.; Wu, M.; Tian, X.; Zheng, G.; Du, Q.; Wu, T. China’s provincial vehicle ownership forecast and analysis of the causes influencing the trend. Sustainability 2019, 11, 3928. [Google Scholar] [CrossRef]
  62. Amarachi, N.; Emeka, O.; Christopher, A.; Lovell, A.; Conrad, E. Emissions of gasoline combustion by products in automotive exhausts. Int. J. Sci. Res. Publ. 2016, 6, 464–2250. [Google Scholar]
  63. Glazener, A.; Khreis, H. Transforming our cities: Best practices towards clean air and active transportation. Curr. Environ. Health Rep. 2019, 6, 22–37. [Google Scholar] [CrossRef] [PubMed]
  64. Lu, J. Environmental Effects of Vehicle Exhausts, Global and Local Effects: A Comparison Between Gasoline and Diesel. Master’s Thesis, Halmstad University, Halmstad Sweden, 2011. [Google Scholar]
  65. Amann, M.; Klimont, Z.; Wagner, F. Regional and global emissions of air pollutants: Recent trends and future scenarios. Annu. Rev. Environ. Resour. 2013, 38, 31–55. [Google Scholar] [CrossRef]
  66. ZPDRC (Zhejiang Provincial Development and Reform Commission). Notice of the Provincial Development and Reform Commission on Issuing the Key Tasks for Carbon Peak and Carbon Neutrality in Zhejiang Province in 2025. 2025. Available online: https://fzggw.zj.gov.cn/art/2025/3/19/art_1229629046_5479777.html (accessed on 19 January 2026).
  67. Saygili, E. CO2 Emission Reduction Challenge for Light Commercial Vehicles (LCVs) Beyond 2020: The European LCV Market Assessment Through CO2 Regulations with Technical, Economic and Social Analysis. Ph.D. Thesis, Politecnico di Torino, Turin, Italy, 2021. [Google Scholar]
  68. Ahmadi, P. Environmental impacts and behavioral drivers of deep decarbonization for transportation through electric vehicles. J. Clean. Prod. 2019, 225, 1209–1219. [Google Scholar] [CrossRef]
  69. Changhong, C.; Bingyan, W.; Qingyan, F.; Green, C.; Streets, D.G. Reductions in emissions of local air pollutants and co-benefits of Chinese energy policy: A Shanghai case study. Energy Policy 2006, 34, 754–762. [Google Scholar] [CrossRef]
  70. Chen, X.; Di, Q.; Liang, C. The mechanism and path of pollution reduction and carbon reduction affecting high quality economic development-taking the Yangtze River Delta urban agglomeration as an example. Appl. Energy 2024, 376, 124340. [Google Scholar] [CrossRef]
  71. Chen, X.; Meng, Q.; Wang, K.; Liu, Y.; Shen, W. Spatial patterns and evolution trend of coupling coordination of pollution reduction and carbon reduction along the Yellow River Basin, China. Ecol. Indic. 2023, 154, 110797. [Google Scholar] [CrossRef]
  72. Yi, M.; Guan, Y.; Wu, T.; Wen, L.; Sheng, M.S. Assessing China’s synergistic governance of emission reduction between pollutants and CO2. Environ. Impact Assess. Rev. 2023, 102, 107196. [Google Scholar] [CrossRef]
  73. Ming, X.; Wang, Q.; Luo, K.; Zhang, L.; Fan, J. An integrated economic, energy, and environmental analysis to optimize evaluation of carbon reduction strategies at the regional level: A case study in Zhejiang, China. J. Environ. Manag. 2024, 351, 119742. [Google Scholar] [CrossRef] [PubMed]
  74. EPA; U.S. Environmental Protection Agency. EPA Emission Factors for Greenhouse Gas Inventories. 2025. Available online: https://www.epa.gov/system/files/documents/2025-01/ghg-emission-factors-hub-2025.pdf (accessed on 1 March 2026).
  75. ZPDT (Zhejiang Provincial Department of Transport). Interpretation of Zhejiang Province’s Subsidy Policy for the Replacement of New Energy Urban Buses and Power Batteries. 2025. Available online: https://jtyst.zj.gov.cn/art/2025/6/10/art_1229114318_2556422.html (accessed on 10 December 2025).
  76. ZPPG (Zhejiang Province People’s Government). Announcement on Soliciting Public Opinions on the Implementation Plan for Government Rewards and Subsidies for the Early Phase-Out of Non-Operating China III and Below Medium and Heavy-Duty Diesel Trucks in Quzhou City (Draft for Comments). 2025. Available online: https://www.qz.gov.cn/art/2025/7/10/art_1229596677_66187.html (accessed on 1 March 2026).
  77. MEE (Ministry of Ecology and Environment). Notice on Issuing the Action Plan for the Battle Against Diesel Truck Pollution. 2018. Available online: https://www.mee.gov.cn/xxgk2018/xxgk/xxgk03/201901/t20190104_688587.html (accessed on 1 March 2026).
  78. JPDEE (Jiangsu Provincial Department of Ecology and Environment). The Yangtze River Delta Regional Guidance Plan for Restricting the Operation of China III Diesel Trucks. 2023. Available online: https://www.autothinker.net/publicsentiment/daily_express_details/id/187784/date/2023-11-14/dateall/ (accessed on 20 October 2025).
  79. ZPDEE; Zhejiang Provincial Department of Ecology and Environment. Bulletin on the State of the Ecology and Environment in Zhejiang Province 2013-2025. 2026. Available online: https://sthjt.zj.gov.cn/col/col1229116546/index.html (accessed on 15 June 2026).
  80. Li, M.; Liu, H.; Geng, G.; Hong, C.; Liu, F.; Song, Y.; Tong, D.; Zheng, B.; Cui, H.; Man, H.; et al. Anthropogenic emission inventories in China: A review. Natl. Sci. Rev. 2017, 4, 834–866. [Google Scholar] [CrossRef]
  81. Zheng, B.; Tong, D.; Li, M.; Liu, F.; Hong, C.; Geng, G.; Li, H.; Li, X.; Peng, L.; Qi, J.; et al. Trends in China’s anthropogenic emissions since 2010 as the consequence of clean air actions. Atmos. Chem. Phys. 2018, 18, 14095–14111. [Google Scholar] [CrossRef]
  82. Geng, G.; Liu, Y.; Liu, Y.; Liu, S.; Cheng, J.; Yan, L.; Wu, N.; Hu, H.; Tong, D.; Zheng, B.; et al. Efficacy of China’s clean air actions to tackle PM2.5 pollution between 2013 and 2020. Nat. Geosci. 2024, 17, 987–994. [Google Scholar] [CrossRef]
  83. Mamun, M.; Kim, J.-J.; Alam, M.A.; An, K.-G. Prediction of Algal Chlorophyll-a and Water Clarity in Monsoon-Region Reservoir Using Machine Learning Approaches. Water 2020, 12, 30. [Google Scholar] [CrossRef]
  84. State Taxation Administration. Environmental protection tax law of People’s Republic of China. 2018. Available online: https://www.chinatax.gov.cn/chinatax/n610/c5178958/content.html/ (accessed on 1 March 2026).
Figure 1. Historical records and forecast results in Zhejiang: (a) per capita GDP; (b) permanent population; (c) motor vehicle ownership rate.
Atmosphere 17 00690 g001
Figure 2. Emissions of air pollutants from road vehicles during 2017–2024: (a) gasoline and diesel vehicle, and motor vehicle ownership; (b) detailed air pollutant emissions of different vehicle types in 2024; (c) proportion of emission standards in 2024.
Atmosphere 17 00690 g002
Figure 3. (a) CO2; (b) CH4 and (c) N2O emission proportions of different vehicle types in 2017–2024.
Atmosphere 17 00690 g003
Figure 4. Air pollutant emissions under different scenarios in 2024, 2030, 2040, and 2050: (a) SO2; (b) CO; (c) HC; (d) PM10; (e) PM2.5; (f) NOx.
Atmosphere 17 00690 g004aAtmosphere 17 00690 g004b
Figure 5. Air pollution equivalents under different scenarios over 2024–2050: (a) BAU; (b) ER; (c) EER; (d) GLC; (e) ELC; (f) comparison of five scenarios.
Atmosphere 17 00690 g005
Figure 6. CO2 emissions under different scenarios over 2024–2050: (a) BAU; (b) ER; (c) EER; (d) GLC; (e) ELC; (f) comparison of five scenarios.
Atmosphere 17 00690 g006
Figure 7. Emissions of different gasoline vehicle types under BAU and ELC scenario: (a) CO2; (b) CH4; (c) N2O.
Atmosphere 17 00690 g007
Figure 8. Emissions of different diesel vehicle types under BAU and ELC scenario: (a) CO2; (b) CH4; (c) N2O.
Atmosphere 17 00690 g008
Figure 9. CO2 emissions of electric vehicles under BAU and ELC scenario: (a) BAU; (b) ELC; (c) comparison of total emissions between BAU and ELC.
Atmosphere 17 00690 g009
Figure 10. (a) Co-control effects coordinate system of air pollutants and CO2 in ELC scenario; (b) the CCD model of APeq and CO2 in ELC scenario; (c) marginal CO2 emissions of motor vehicles in Zhejiang under ELC scenario.
Atmosphere 17 00690 g010
Table 1. Elastic coefficients of synergistic emission reduction in CO2 and air pollutants from road mobile sources in different scenarios.
Air PollutantsNOxHCPM2.5PM10COSO2
Scenarios
2030ER0.6340.5300.3220.3200.5731
EER0.6900.5940.3520.3490.6351
GLC0.6810.6040.3760.3740.6411
ELC0.7440.6620.4120.4090.7001
2040ER0.7380.5660.3540.3510.6161
EER0.7510.6110.3990.3950.6571
GLC0.7720.6410.4660.4630.6741
ELC0.8070.7090.5420.5390.7391
2050ER0.7330.5720.3660.3630.6171
EER0.7790.6300.4240.4210.6731
GLC0.7700.6780.5200.5170.7061
ELC0.8320.7570.6170.6140.7811
Disclaimer/Publisher’s Note: The statements, opinions and data contained in all publications are solely those of the individual author(s) and contributor(s) and not of MDPI and/or the editor(s). MDPI and/or the editor(s) disclaim responsibility for any injury to people or property resulting from any ideas, methods, instructions or products referred to in the content.