Article

Spatiotemporal Characteristics and Driving Factors of Drought-Flood Abrupt Alternation in the Sichuan Basin

1
College of Resources and Environment, Aba Teachers College, Wenchuan 623002, China
2
Faculty of Geography and Resources Science, Sichuan Normal University, Chengdu 610101, China
*
Author to whom correspondence should be addressed.
Atmosphere 2026, 17(4), 412; https://doi.org/10.3390/atmos17040412
Submission received: 25 February 2026 / Revised: 4 April 2026 / Accepted: 16 April 2026 / Published: 18 April 2026
(This article belongs to the Special Issue Compound Events and Climate Change Impacts in Agriculture)

Abstract

The Sichuan Basin is a high-incidence area for China’s drought–flood abrupt alternation (DFAA) events. To reveal the spatiotemporal evolution characteristics and driving factors of drought–flood abrupt alternation (DFAA) compound disasters in the Sichuan Basin, this study identified drought-to-flood (DF) and flood-to-drought (FD) events using the Standardized Precipitation Evapotranspiration Index based on meteorological data and circulation factors from 1963 to 2022. By constructing a standardized drought–flood abrupt alternation magnitude index to classify event grades, combined with methods such as trend analysis, Morlet wavelet and Random Forest, the study explored the trend variation laws, spatial distribution patterns, and core driving factors of DFAA events in the basin. The results showed that on the interannual scale, the upward trend of FD events was more obvious than that of DF events, with a significant increase in the proportion of moderate and severe events; both the frequency and intensity of summer FD events increased significantly, and the intensity of winter FD events also exhibited a marked upward trend. Spatially, DF events occurred frequently in Guang’an and Chongqing, while FD events were concentrated in the western edge of the basin, as well as Yibin and Luzhou. Moderate and severe events were more prominent in the edge areas of the basin. The occurrence of DFAA events was generally jointly driven by the meteorological factors and regulation of large-scale sea surface temperature-circulation factors: the triggering factors of DF events showed a diversified and decentralized characteristic, while FD events were mainly driven by the subtropical high, and tropical sea surface temperature anomalies were the common precursor signal for both types of events. This study provides a scientific basis and technical support for the formulation of disaster prevention and mitigation strategies and the optimal management of water resources for compound extreme meteorological disasters in the Sichuan Basin.

1. Introduction

In the context of global climate change, extreme climatic events have become increasingly frequent. Drought–flood abrupt alternation (DFAA), a compound disaster characterized by rapid transitions between drought and flood on a consecutive-month scale, exerts significant impacts on agricultural production, ecosystems, and socio-economic systems [1,2,3]. The occurrence of DFAA events is closely linked to regional climate systems and topographic features, with variations in their intensity and frequency directly reflecting the hydrological cycle’s response to climate change [4,5,6].
DFAA events are generally specified as speedy transitions between drought and flood over short periods, encompassing both drought-to-flood (DF) and flood-to-drought (FD) events [7]. DFAA events have been widely detected worldwide for a long time, indicating that this is a global and long-standing climate phenomenon [8,9,10]. Existing studies have predominantly relied on precipitation or runoff data to construct indices for DFAA events at various scales, facilitating quantitative assessments. For instance, Wu et al. [11] first proposed the Long-period Drought–flood Alternation Index to quantitatively evaluate summer meteorological disasters induced by DFAA in the middle and lower reaches of the Yangtze River. Subsequently, scholars developed the Short-period Drought–Flood Alternation Index [12] and the Drought–Flood Coexistence Index (DFCI) by adjusting weights and time scales. Using these indices, researchers have investigated the characteristics of DFAA events in regions such as the Mi River Basin [13], Liaoning Province [14], and the Yangtze River Basin [15,16] from diverse perspectives. Some scholars have also calculated the Standardized Runoff Index (SRI) using monthly runoff data [17] and the Standardized Precipitation Index (SPI) using monthly precipitation data [18] to identify abrupt drought–flood transitions. However, these studies often faced limitations, including misclassification, omission of events, and subjectivity in weight assignment. Beyond precipitation, potential evapotranspiration (PET) has been recognized as a critical factor influencing local drought and flood events, with its role becoming increasingly significant under global warming. The Standardized Precipitation Evapotranspiration Index (SPEI), which incorporates both precipitation and evapotranspiration. Compared with indices based solely on precipitation or evapotranspiration, SPEI provides a more comprehensive representation of dry–wet conditions and thus enables more reliable identification of DFAA events [19]. Using SPEI, Sun et al. [20] identified an increasing trend in DF events across China. Further studies by Qiao, Wang, and colleagues [21,22,23] demonstrate that SPEI-based identification of DFAA events provides meaningful insights for assessing drought–flood risks in China under the context of global warming.
Despite the insights gained from previous studies, several limitations remain. First, identification methods for DFAA events have not yet been standardized [24]. Most existing DFAA identification methods adopt inconsistent classification thresholds that are not aligned with standard drought/flood grades, which hinders unified disaster assessment and result comparability [25]. To address this issue, this study uses the standardized Drought–Flood Abrupt Alternation Magnitude Index (DFAAMI), whose classification thresholds are consistent with conventional drought and flood grades, ensuring rationality and comparability. Second, research on the Sichuan Basin has largely focused on individual drought or flood events [26,27,28,29], with insufficient systematic analysis of compound events like DFAA. In particular, long-term, basin-wide characterization of DFAA features remains scarce [17]. Third, the investigation of periodic characteristics and spatial differentiation mechanisms of DFAA events is still inadequate, limiting the practical application of such research for precise disaster prevention and mitigation.
Amid global warming, the increasing incidence of severe hydrological events has become a critical challenge for regional sustainable development. The Sichuan Basin, situated at the transitional zone between the eastern edge of the Qinghai–Tibet Plateau and the middle–upper reaches of the Yangtze River, is recognized as a high-incidence area for DFAA events in China due to its unique topography and the convergence of monsoons [30]. As a key agricultural hub and densely populated region in southwest China, the basin has experienced rising direct economic losses from DFAA over the past five decades, posing persistent threats to food security, ecological barrier functions, and the operation of major infrastructure projects [31,32,33].
In this context, the present study focuses on the Sichuan Basin as the research area. Using data 1963–2022, we applied the SPEI to identify DF and FD events. Distinguishing these two types enables a clearer presentation of their distinct spatiotemporal patterns. By integrating the modified DFAAMI [34], trend analysis, wavelet transform and random forest, this study systematically examines the temporal trends, periodic patterns, spatial distribution characteristics and driving factors of DFAA events. The aim is to provide a scientific foundation for regional climate change adaptation and optimized water resource management.

2. Data and Methods

2.1. Research Zone Overview and Data Sources

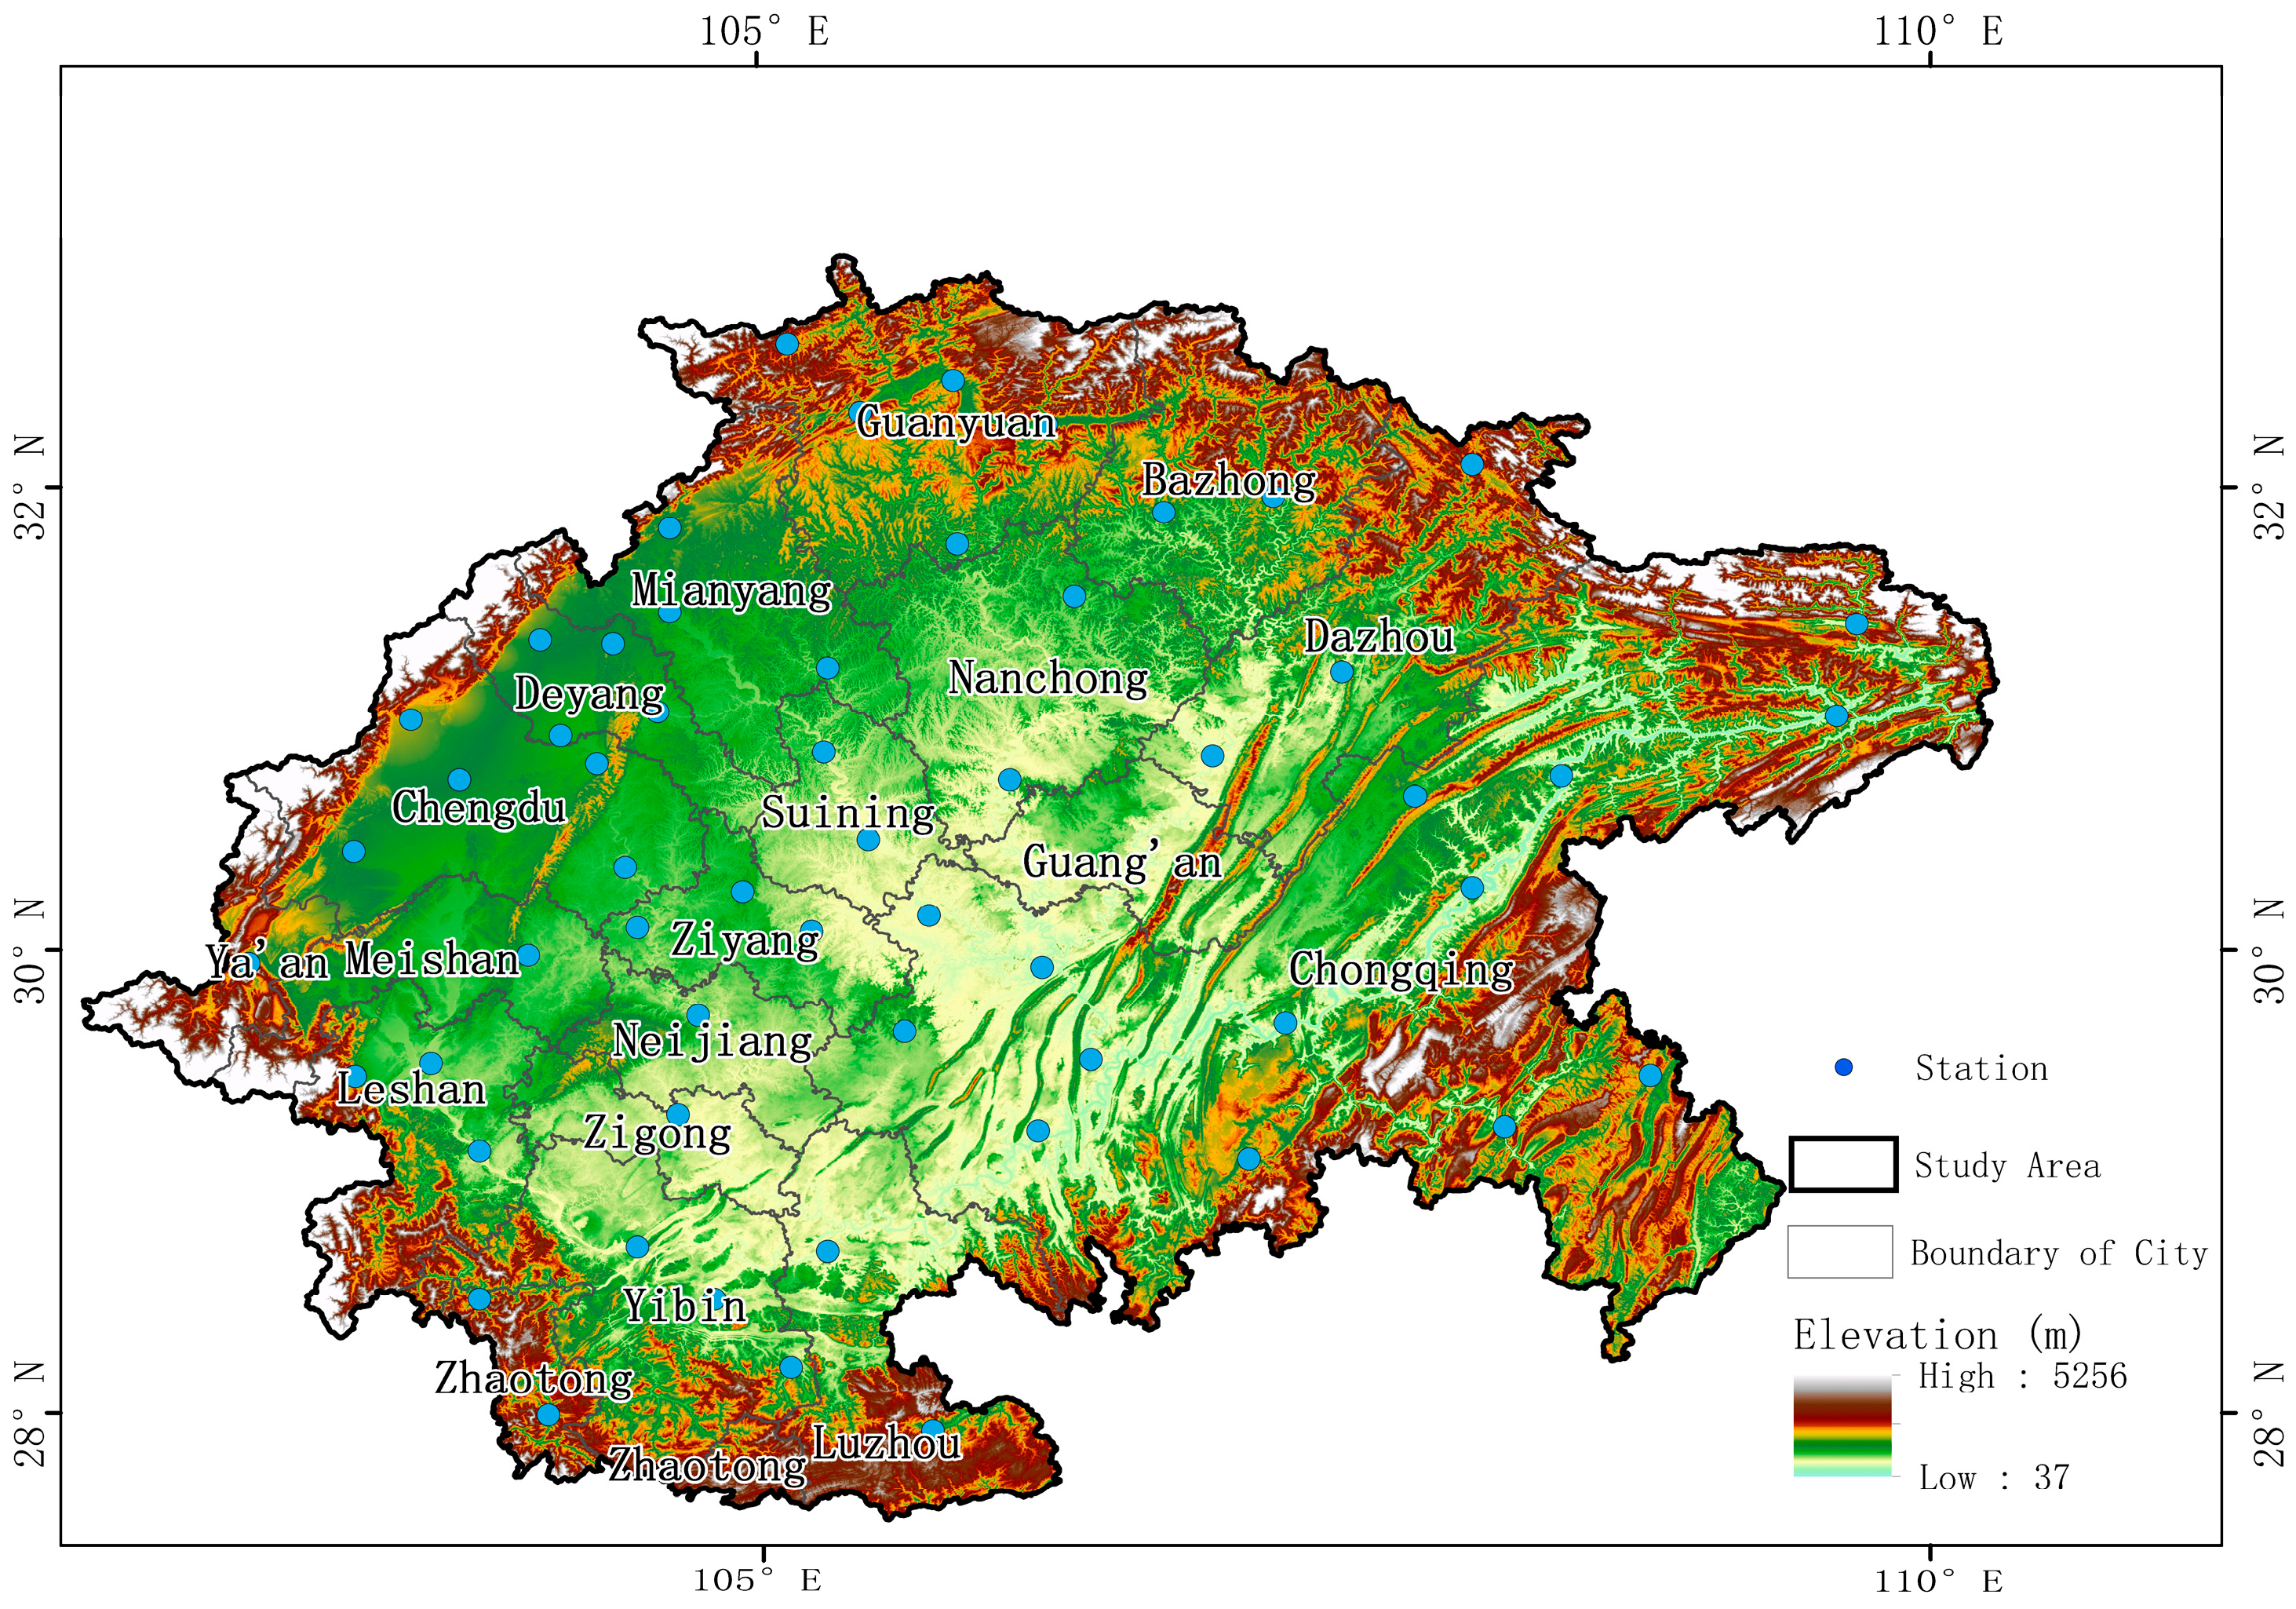
The Sichuan Basin (102°50′–110°9′ E, 27°40′–33°2′ N) is a topographically enclosed region, bordered by the Tibetan Plateau, the Daba and Qinling Mountains, the Wushan Mountains, and the Yunnan–Guizhou Plateau (Figure 1). The interior consists primarily of the Western Sichuan Plain, the Central Sichuan Hills, and the Eastern Sichuan Parallel Ridge-and-Valley region. The basin experiences a subtropical humid monsoon climate, influenced by both the East Asian and South Asian monsoons. Annual precipitation averages 850 to 1200 mm, with 70–75% occurring in summer and nighttime rainfall exceeding 70%. Precipitation exhibits significant spatial variability: the western region, affected by orographic lifting, receives up to 1800 mm annually, whereas the northeastern area receives only 800–1000 mm [35]. The annual mean temperature is 16–18 °C, with a warming trend observed over the past five decades; extreme temperatures have ranged from −9.4 °C to 43 °C [36]. The region is characterized by hot and humid summers, dry winters and springs, and low sunshine duration, resulting in relatively low evapotranspiration outside summer. Home to over 100 million people, the basin has a well-developed agricultural sector and serves as a key commodity grain base, yet it is frequently affected by droughts and floods [37]. Its unique topography and climate contribute to high precipitation variability, creating favorable conditions for the occurrence of DFAA events.
Meteorological data for the Sichuan Basin from 1963 to 2022 were obtained from the Resource and Environmental Science Data Center of the Chinese Academy of Sciences (https://www.resdc.cn, accessed on 12 May 2024). This period covers 60 years of complete monthly observations, which is sufficiently long for analyzing long-term trends, periodicity, and driving factors of drought–flood abrupt alternation. The dataset includes monthly meteorological variables such as maximum, minimum, and mean temperature, precipitation, wind speed, sunshine duration, and relative humidity. To ensure data reliability, stations with more than 3% missing data were excluded, resulting in 57 stations for the final analysis. For individual missing data points at the selected stations, linear interpolation was used for imputation, while missing precipitation values were supplemented with data from neighboring stations. The rationality of interpolation and supplementation was verified by comparing the consistency of mean and variance before and after data filling. These procedures were implemented to maintain the completeness and dependability of the dataset.
Given that meteorological disasters may exhibit lagged responses to circulation factors [38], this study analyzed the correlations between large-scale circulation factors in the three months prior to the events and the intensities of DF and FD events. The results indicated that the factors with the strongest correlations primarily include meteorological factors, sea surface temperature (SST) factors, and atmospheric circulation factors, as detailed in Table 1. The circulation factor data were retrieved from the National Climate Centre of the China Meteorological Administration (https://www.ncc-cma.net/, accessed on 12 October 2025).

2.2. Research Methods

2.2.1. SPEI

The SPEI integrates precipitation and evapotranspiration, effectively characterizing the dynamics of water supply and demand. It is particularly suitable for analyzing rapid transitions between dry and wet conditions in DFAA events [39,40,41,42]. In this study, SPEI at a 1-month time scale was calculated to identify monthly drought and flood conditions, which was further used to determine the occurrence of DFAA events. Since SPEI values can vary depending on the evapotranspiration model used, the Penman–Monteith algorithm, which is widely regarded as providing the most accurate approximation of actual evapotranspiration, was employed in this study [43].
P E T = 0.408 Δ R n G + γ 900 T   +   273.15 U 2 e s e a Δ + γ 1 + 0.34 u 2
where Δ is the slope of the saturation vapor pressure curve, R n is the net radiation, G is the soil heat flux, γ is the psychrometric constant, T is the mean temperature, U 2 is the wind speed at 2 m height, e s is the saturation vapor pressure, and e a is the actual vapor pressure. The input data include meteorological variables such as temperature, humidity, wind speed, and sunshine duration.
Subsequently, the difference between precipitation and evapotranspiration was calculated to derive the water surplus or deficit D i :
D i = P i P E T i
where P i is the monthly precipitation and P E T i is the PET.
The water surplus/deficit sequence D i , was fitted using a log–logistic probability distribution:
f x = β α x γ α β 1 [ 1 + ( x γ α ) β ] 2
where α , β , and γ are the scale, shape, and location parameters, respectively. The cumulative distribution function of the sequence is calculated as follows:
F ( x ) = [ 1 + ( a x γ ) β ] 1
Finally, the cumulative distribution function was standardized to derive the SPEI. Let P denote the cumulative probability; the probability-weighted moments are then calculated as follows:
W = 2 ln ( P )
S P E I = W C 0 + C 1 W + C 2 W 2 1 + d 1 W + d 2 W 2 + d 3 W 3
where the parameters are C 0 = 2.515517 , C 1 = 0.189269 , C 2 = 0.010328 , d 1 = 1.432788 , d 2 = 0.189269 , d 3 = 0.001308 .

2.2.2. Identification and Classification of DFAA Events

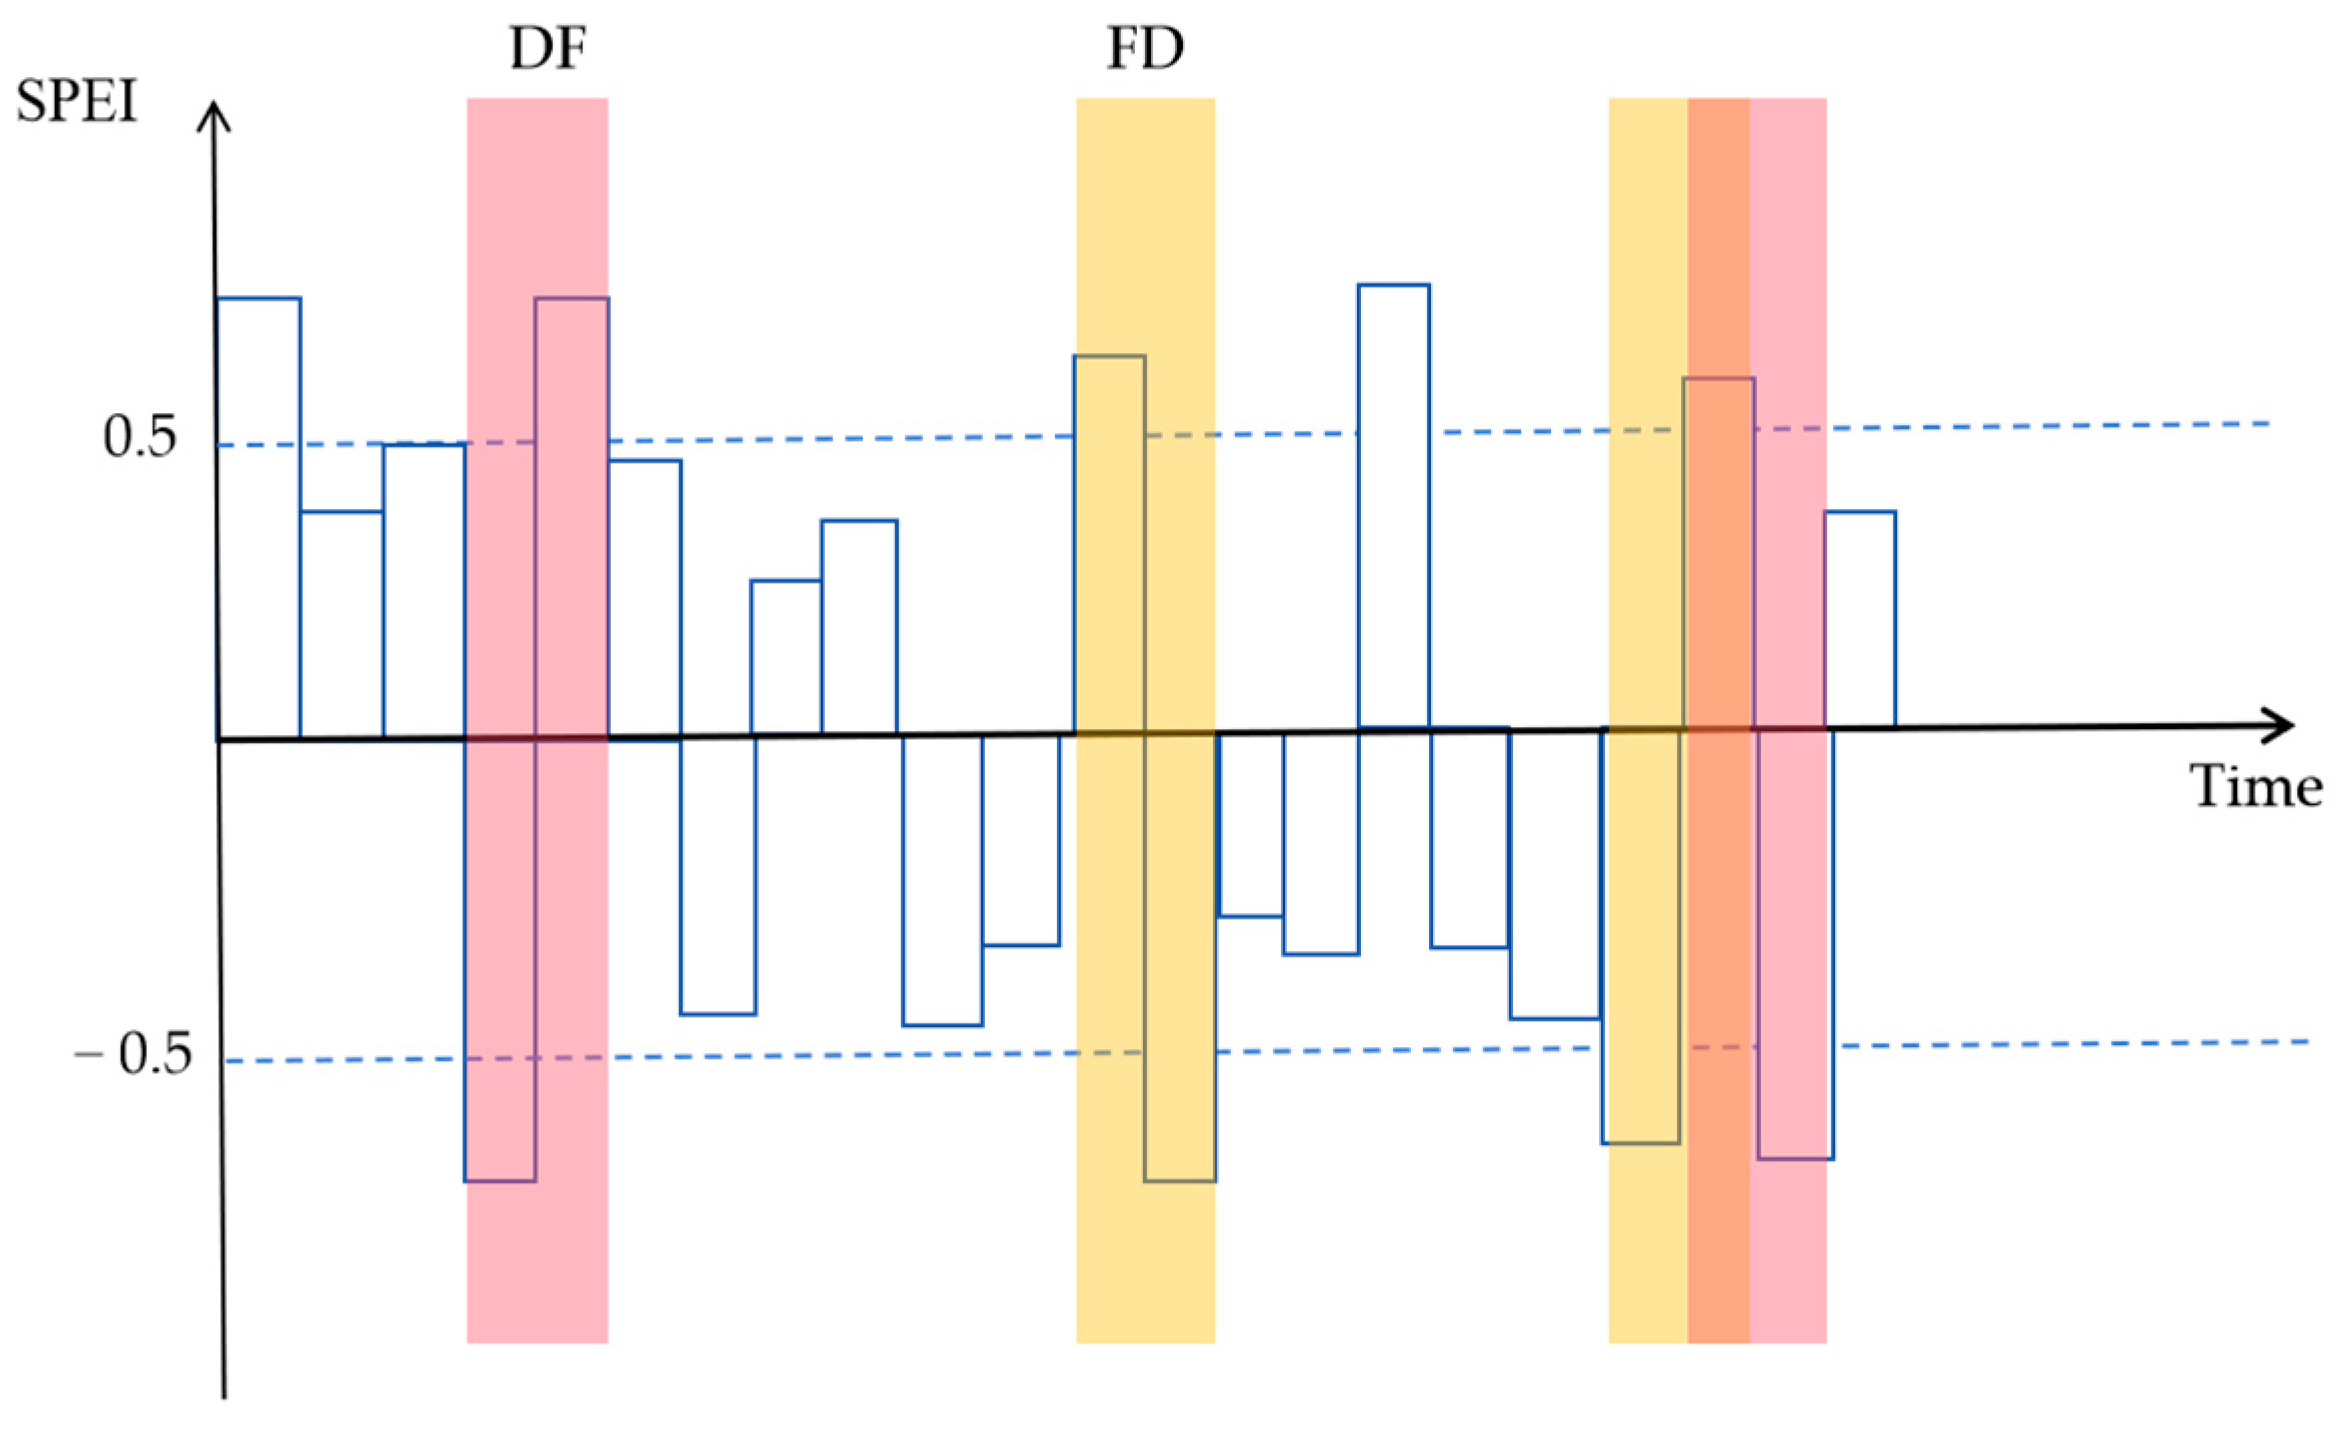
The SPEI has been widely applied in studies of droughts and floods [44,45] and can also be used to quantify drought–flood alternation phenomena [46]. In this study, DFAA events, as an extreme compound meteorological disaster, are defined as abrupt transitions between SPEI < −0.5 and SPEI > 0.5 within consecutive months. This threshold is strictly in accordance with the national standard GB/T 20481-2017 grades of meteorological drought [47], where SPEI ≤ −0.5 is defined as light drought, and flood grades are symmetrically divided with reference to the drought standard. DFAA events are categorized into two types: DF events and FD events (Figure 2). Consecutive occurrences of DF followed by FD, or FD followed by DF, are considered as two distinct events.
Traditional DFAA indices are limited by misclassification, omission, and the lack of a standardized approach for categorizing event severity. The standardized DFAA index proposed by Tu has significantly improved the accuracy of event identification and established a unified framework for severity classification [34]. Following the methodology of Tu et al. (2022) [34], this study constructs a DFAAMI based on SPEI:
D F A A M I = ( S P E I i + 1 S P E I i ) 2 ( 1 + | S P E I i + 1 + S P E I i | R )
where DFAAMI is the DFAA magnitude index, representing the intensity of DF or FD events. It can be further categorized into DF magnitude index (DFMI) and FD magnitude index (FDMI). R denotes the absolute deviation of the SPEI:
R = m a x ( S P E I i   ) m i n ( S P E I i   )
The classification criteria for DFAA event grades are presented in Table 2.

2.2.3. Periodicity Analysis

The periodic characteristics of the drought–flood abrupt alternation magnitude index were analyzed using the Morlet wavelet transform method. This approach can effectively identify multi-time-scale periodic signals in climatic time series and reflect the temporal distribution characteristics of periodic oscillations. Detailed calculation procedures are provided in Reference [48].
Before the wavelet transform, the original DFAAMI series was subjected to detrending processing to eliminate the influence of long-term trends on periodic identification. The Morlet wavelet was selected as the mother wavelet due to its good applicability in climatic and hydrological series analysis.
The wavelet variance was calculated to determine the primary period of DFAAMI, where the peak value of wavelet variance represents the most prominent periodic component. Meanwhile, the real part of the wavelet coefficients was used to characterize the phase structure and temporal evolution of periodic oscillations at different time scales. The significance of periodic signals was tested against at the 95% confidence level to ensure that the identified periods were physically meaningful rather than random fluctuations.

2.2.4. Pearson Correlation Analysis and Random Forest

Pearson correlation analysis is a linear association measurement method based on the assumption of variable normality. It quantifies the direction and strength of the linear correlation between two variables by calculating the Pearson correlation coefficient (r). A value of r > 0 indicates a positive correlation, r < 0 denotes a negative correlation, and r = 0 implies no linear correlation. Furthermore, the closer the absolute value of r is to 1, the stronger the linear association [49]. In this study, Pearson correlation analysis was employed to qualitatively identify the linear association characteristics between 15 driving factors (in the current month, 1 month before, 2 months before, and 3 months before the events) and the DFMI as well as the FDMI.
Pearson correlation analysis can only capture linear associations and fails to reflect non-linear relationships and the effects of multicollinearity among variables. Therefore, the random forest algorithm was integrated for supplementary validation [50]. In this study, the random forest algorithm was used to quantitatively measure the relative contribution of each driving factor to drought–flood abrupt alternation events. A random forest model was constructed with DFMI and FDMI as the dependent variables and 15 driving factors as the independent variables. This method can effectively capture the complex non-linear associations between driving factors and drought–flood abrupt alternation events, and accurately identify the independent contributions of each factor [25]. Building on the results of Pearson correlation analysis, this method further clarifies the ranking of the relative importance of driving factors, enabling qualitative and quantitative dual validation of the driving mechanisms.

3. Results

3.1. Trend Variations of DFAA Events

3.1.1. Interannual Trends

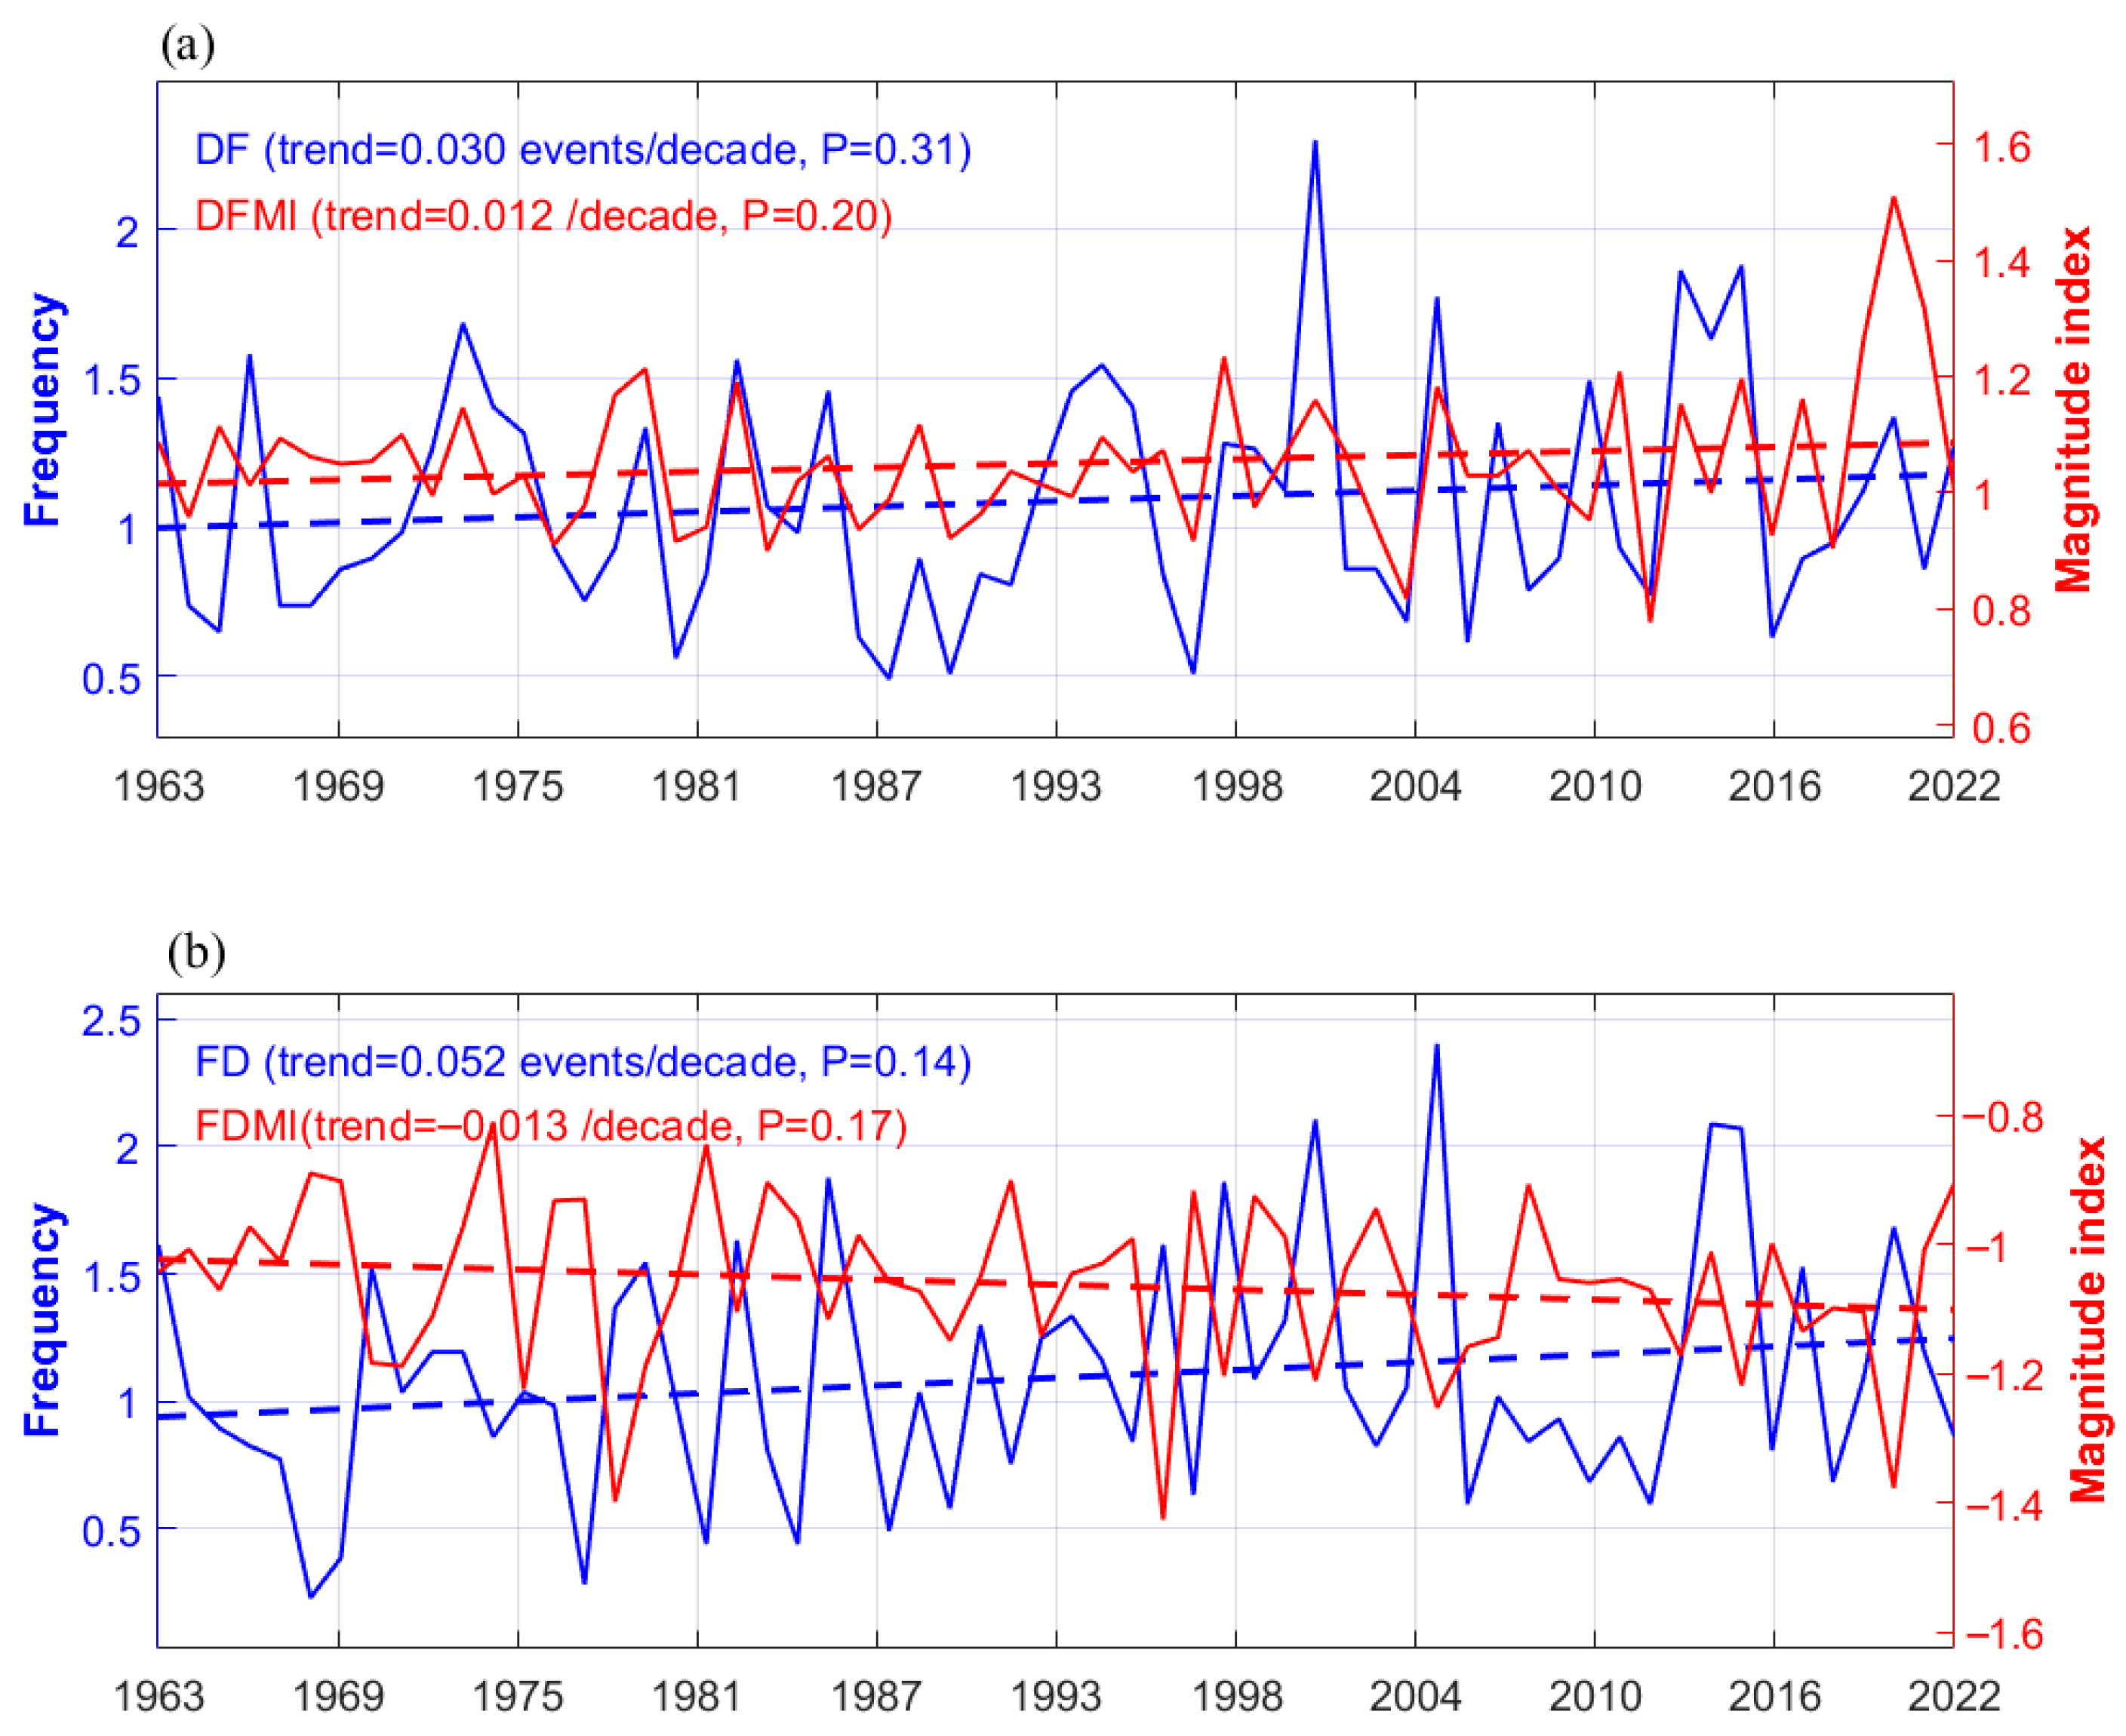
An analysis was conducted on the interannual variation trends of DFAA events in the Sichuan Basin. As depicted in Figure 3a, the frequency of DF events and the DFMI exhibited a slight upward trend, with rates of 0.030 events per decade and 0.012 per decade, respectively; however, neither trend was statistically significant. The annual occurrence rate of FD events displayed a more noticeable upward trend of 0.052 events per decade (Figure 3b), which, although not statistically significant, exceeded the growth rate of DF events. In contrast, the FDMI displayed a downward tendency of −0.013 per decade, suggesting a potential increase in the severity of FD events. From a decadal perspective, DF events reached two peaks in the 1970s and 2010s, while the frequency of FD events began to increase markedly around the 2000s, indicating that FD events in the Sichuan Basin have tended to intensify since the beginning of the 21st century.
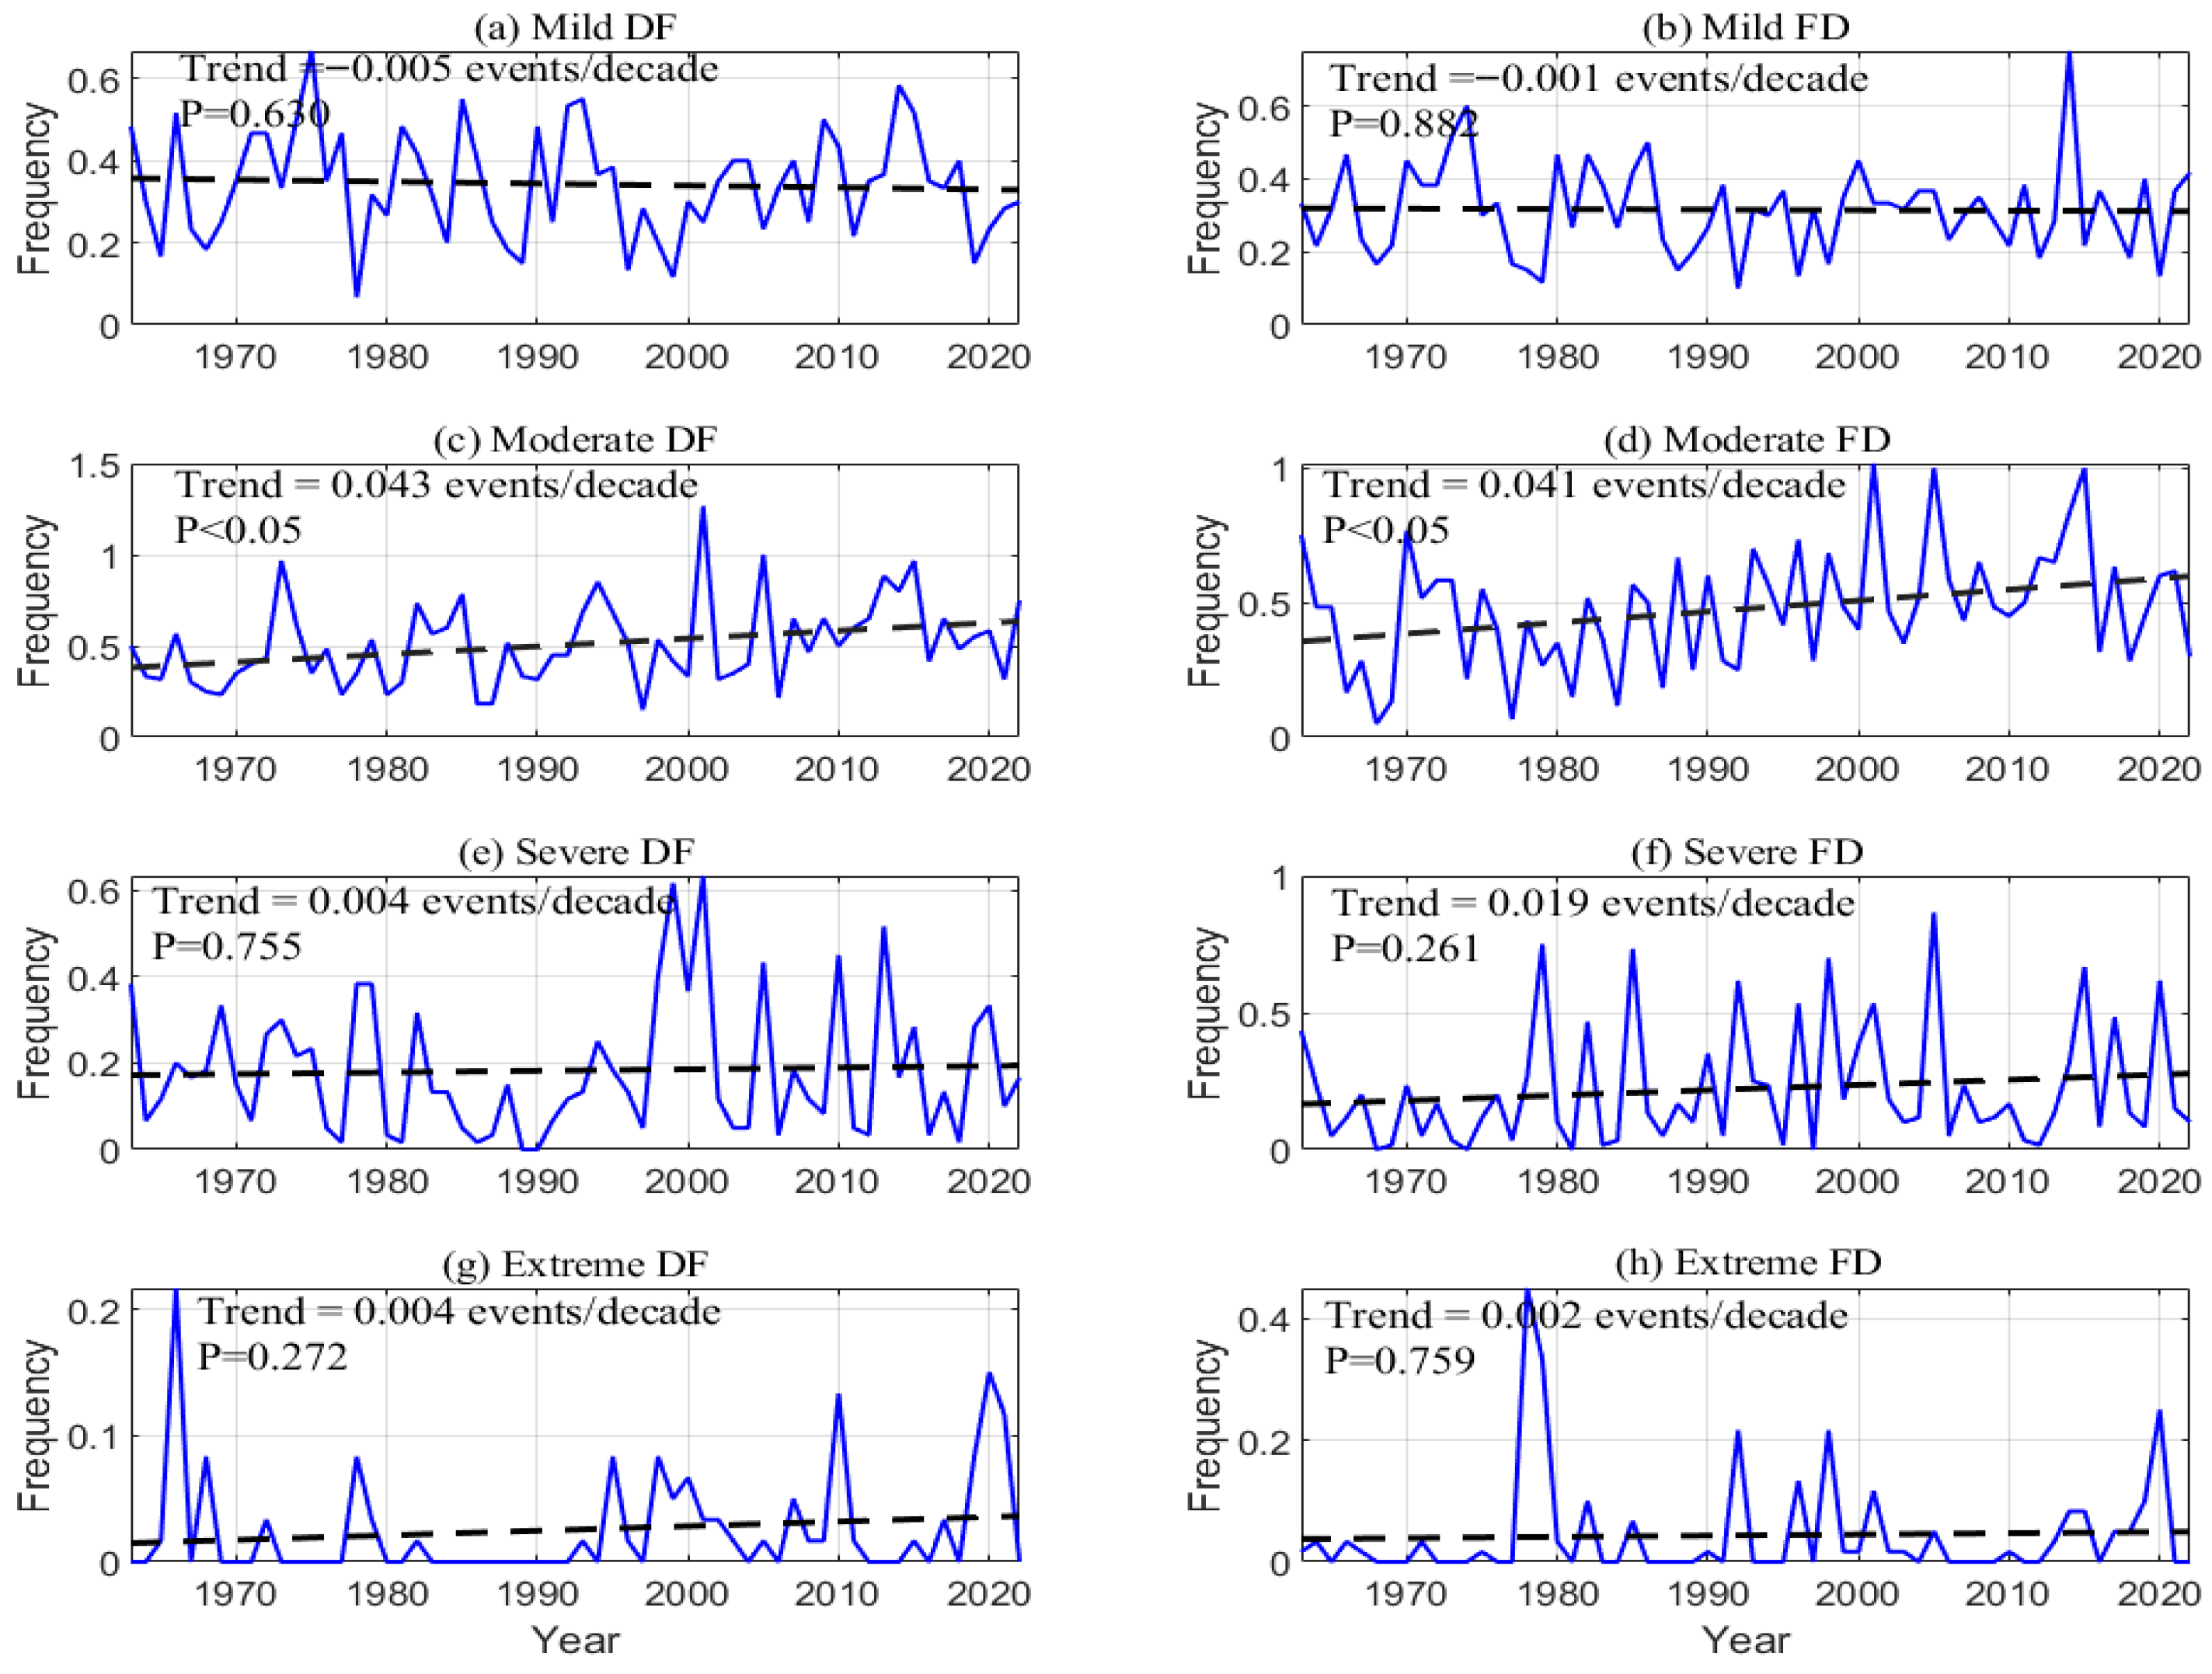
Figure 4 illustrates the interannual variations in DFAA events of different intensities in the Sichuan Basin. Moderate, severe, and extreme DFAA events all exhibit upward trends. Among these, the changes in moderate DF and FD events are particularly notable, with rates of 0.043 and 0.041 events per decade, respectively, and the upward trends are statistically significant. In contrast, the upward trends of severe and extreme DFAA events are not statistically significant. Mild DF and FD events show a slight, insignificant downward trend. Overall, these results suggest that both DF and FD events in the Sichuan Basin may evolve toward greater intensity in the future. Furthermore, the increase in FD events appears more pronounced than that in DF events.

3.1.2. Seasonal Trend Changes

DFAA events are strongly modulated by seasonal climate variability, and the Sichuan Basin, with its distinct monsoon climate, shows pronounced seasonal differences in the occurrence of such extreme events. To clarify the differential trends of DFAA across seasons and support targeted seasonal water resource management in the basin, this section analyzes the seasonal variation characteristics of DF and FD events.
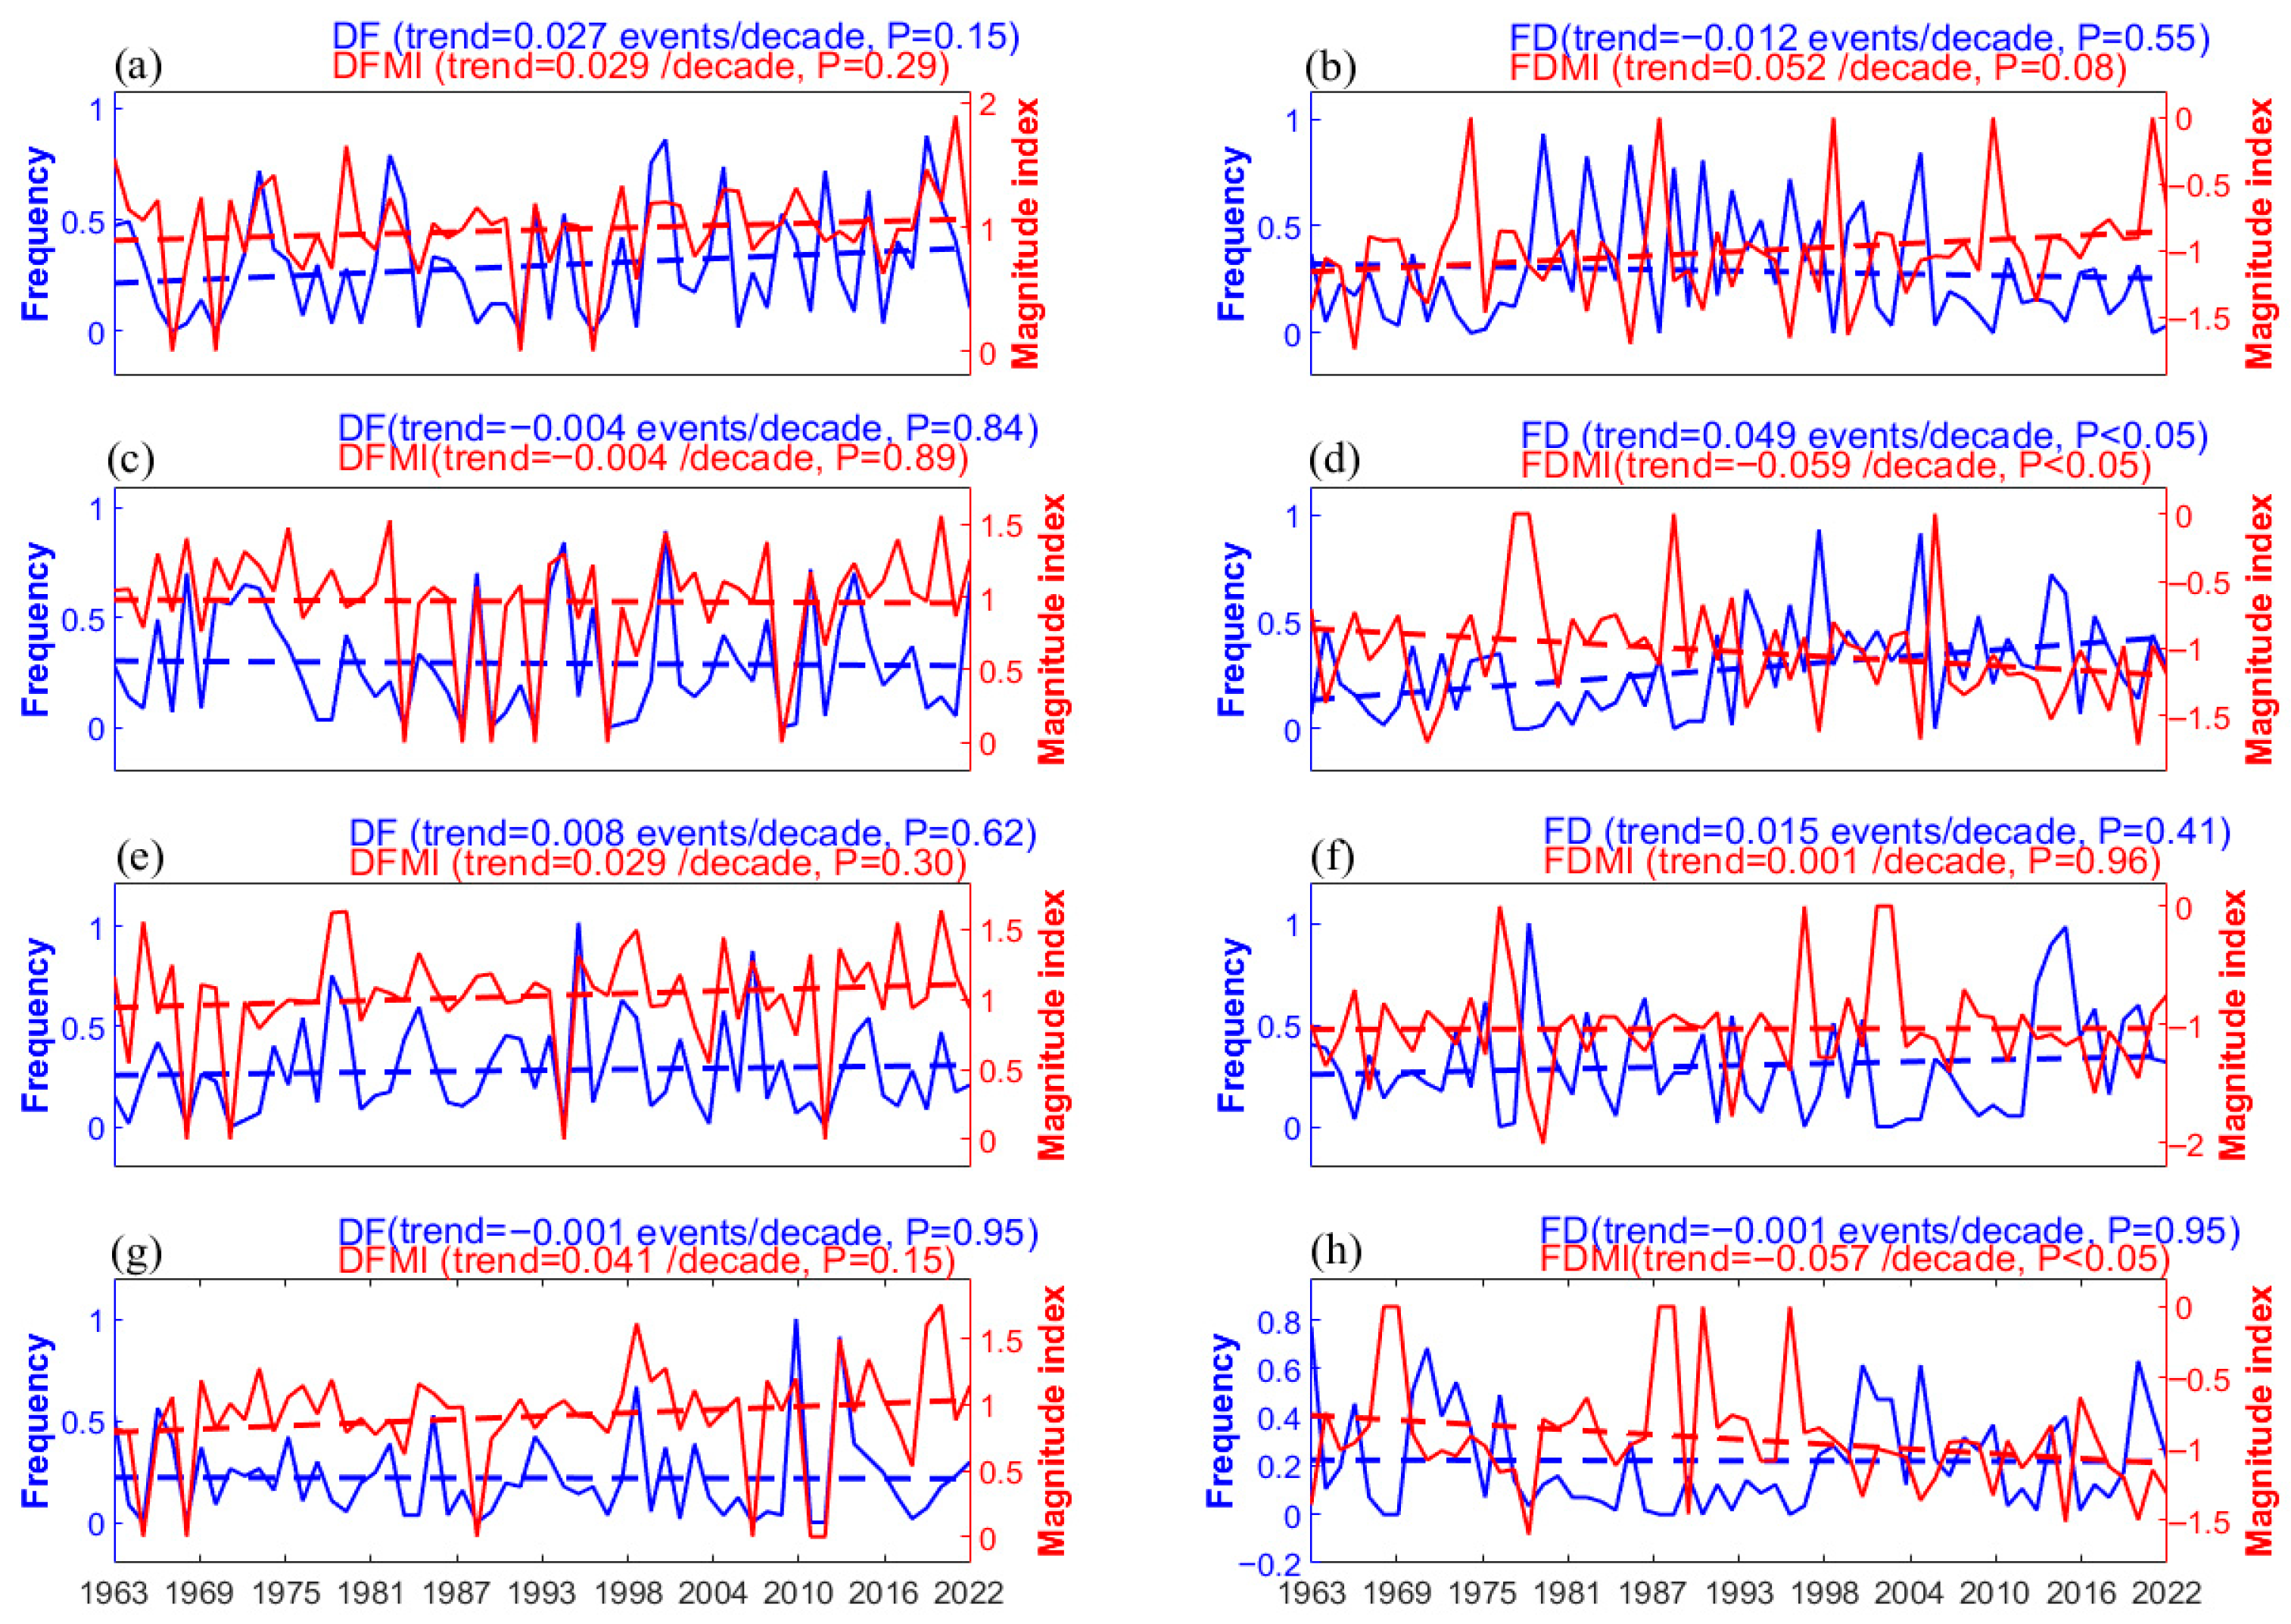
The trends of DF and FD events exhibit notable seasonal disparities (Figure 5). In spring, DF events show a slight upward trend (0.027 events per decade, Figure 5a), whereas FD events exhibit a downward trend (−0.012 events per decade, Figure 5b). Both DFAA magnitude indices, DFMI and FDMI, display upward trends, with the upward trend of FDMI approaching significance (0.052 per decade, p = 0.08). This suggests that in spring, the frequency of FD events in the Sichuan Basin is decreasing, and the intensity of these events is also relatively weakening. In summer, FD events show a significant upward trend (0.049 events per decade, p < 0.05), while FDMI exhibits a significant decrease (−0.059 per decade, p < 0.05), indicating that summer FD events not only increase in frequency but also intensify in magnitude (Figure 5d). In contrast, the trends of DF events and DFMI in summer are not pronounced (Figure 5c). In autumn, both DF and FD events show slight upward trends, with rates of 0.008 and 0.015 events per decade, respectively (Figure 5e and Figure 5f), but changes in both frequency and DFAAMI are not statistically significant. In winter, the frequency of DF (Figure 5g) and FD (Figure 5h) events does not change markedly; however, DFMI shows an upward trend, suggesting that while the frequency of winter DF events remains stable, their intensity is increasing. Conversely, winter FDMI exhibits a significant downward trend, decreasing by 0.057 per decade (p < 0.05), indicating that the intensity of FD events in winter is significantly rising. These findings imply that, for seasonal water resource management in the Sichuan Basin, greater attention should be given to addressing drought conditions following summer floods.

3.2. Analysis of Periodic Variations in DFAAMI

3.2.1. Annual Periodic Variation Pattern of DFAAMI in the Sichuan Basin

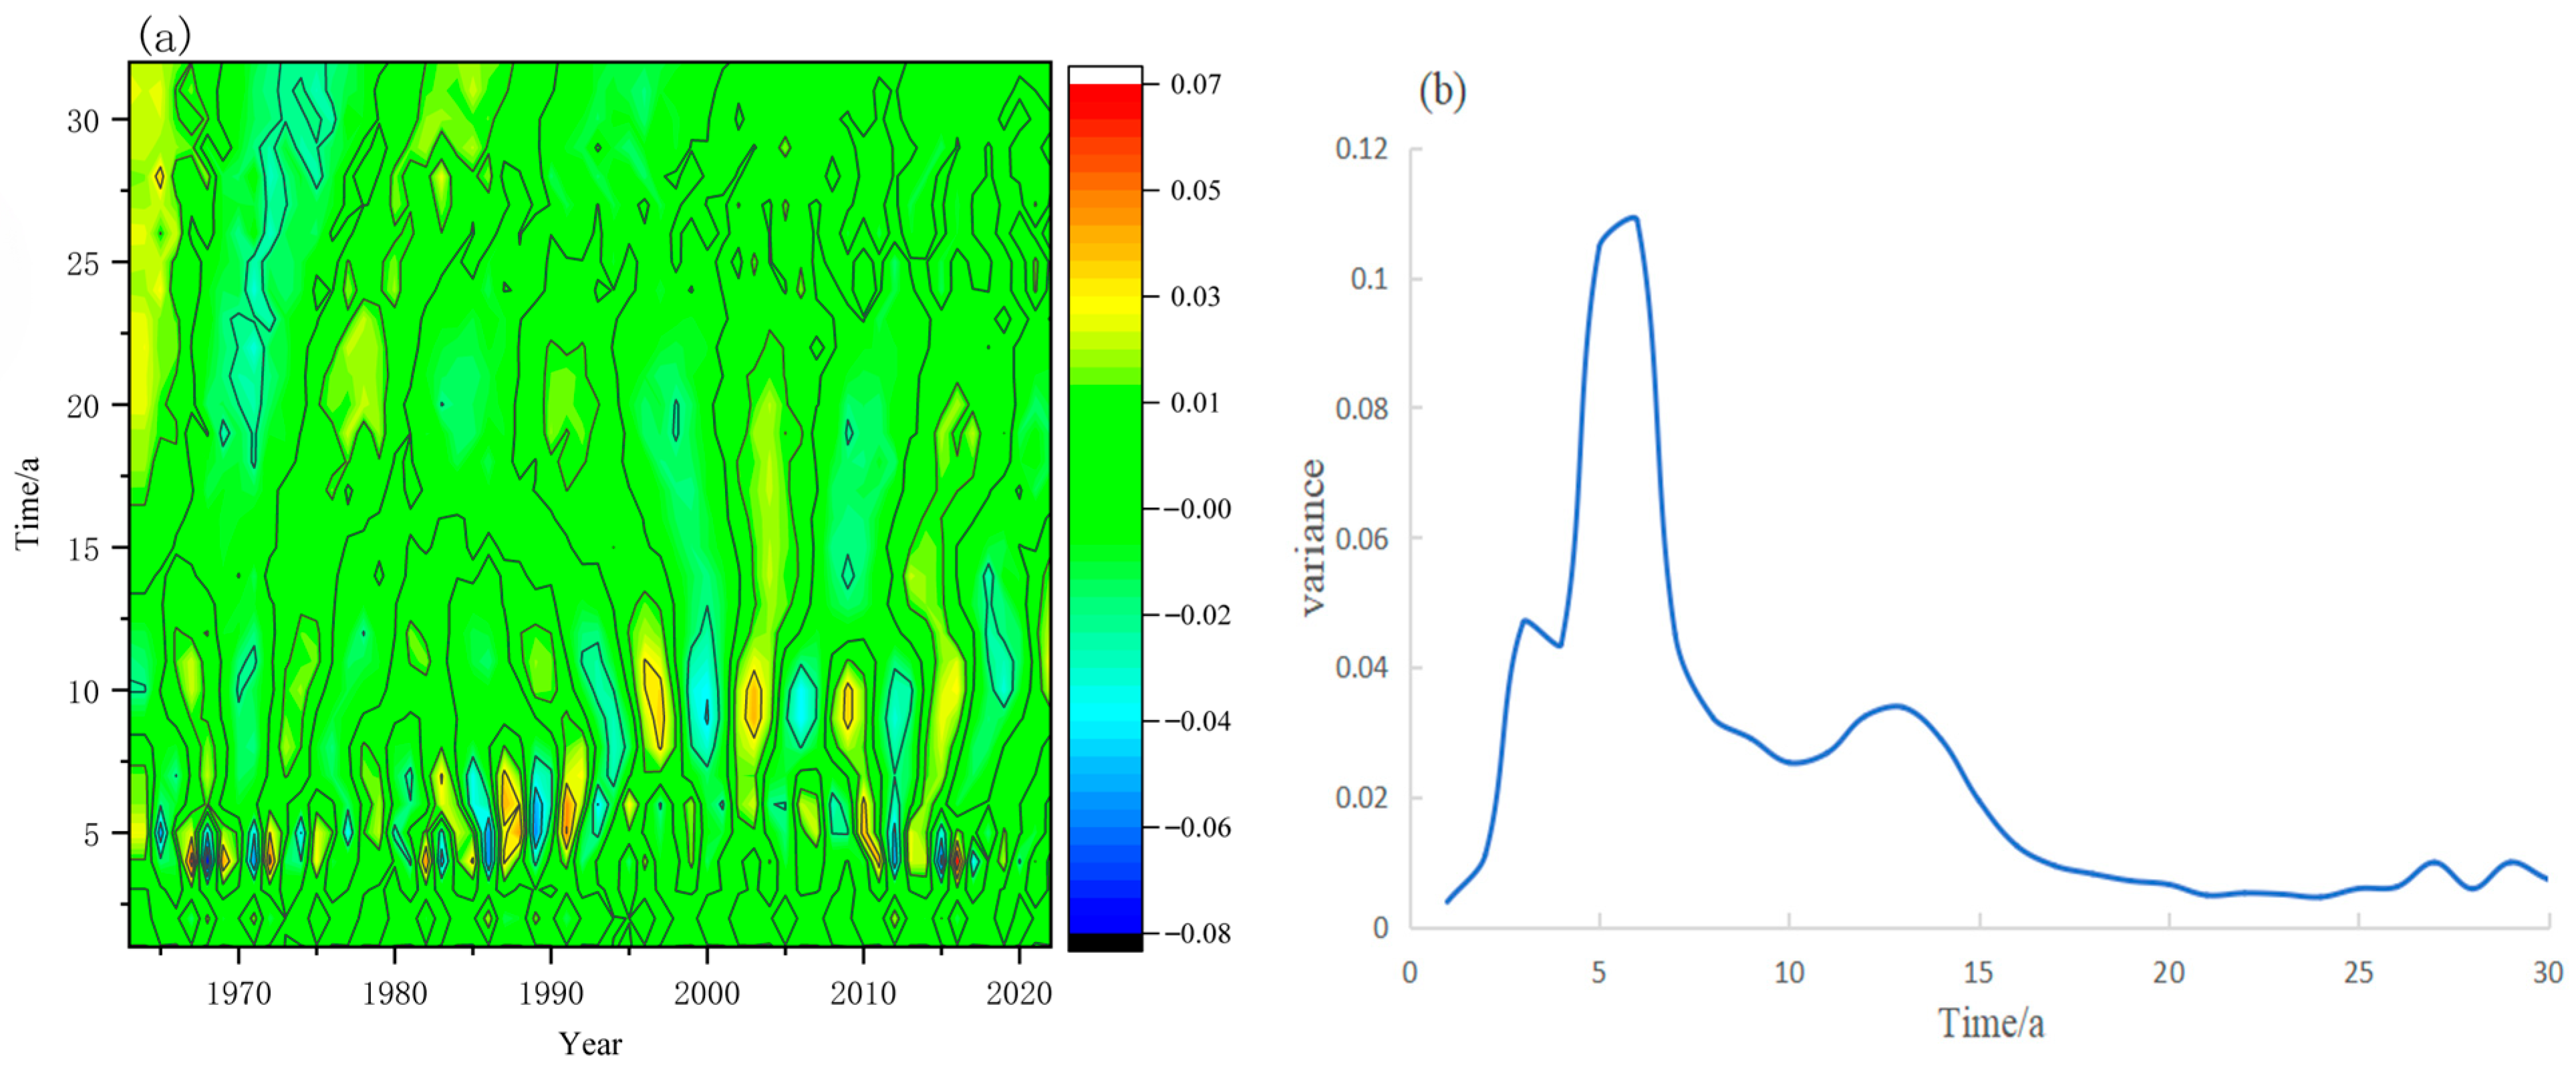
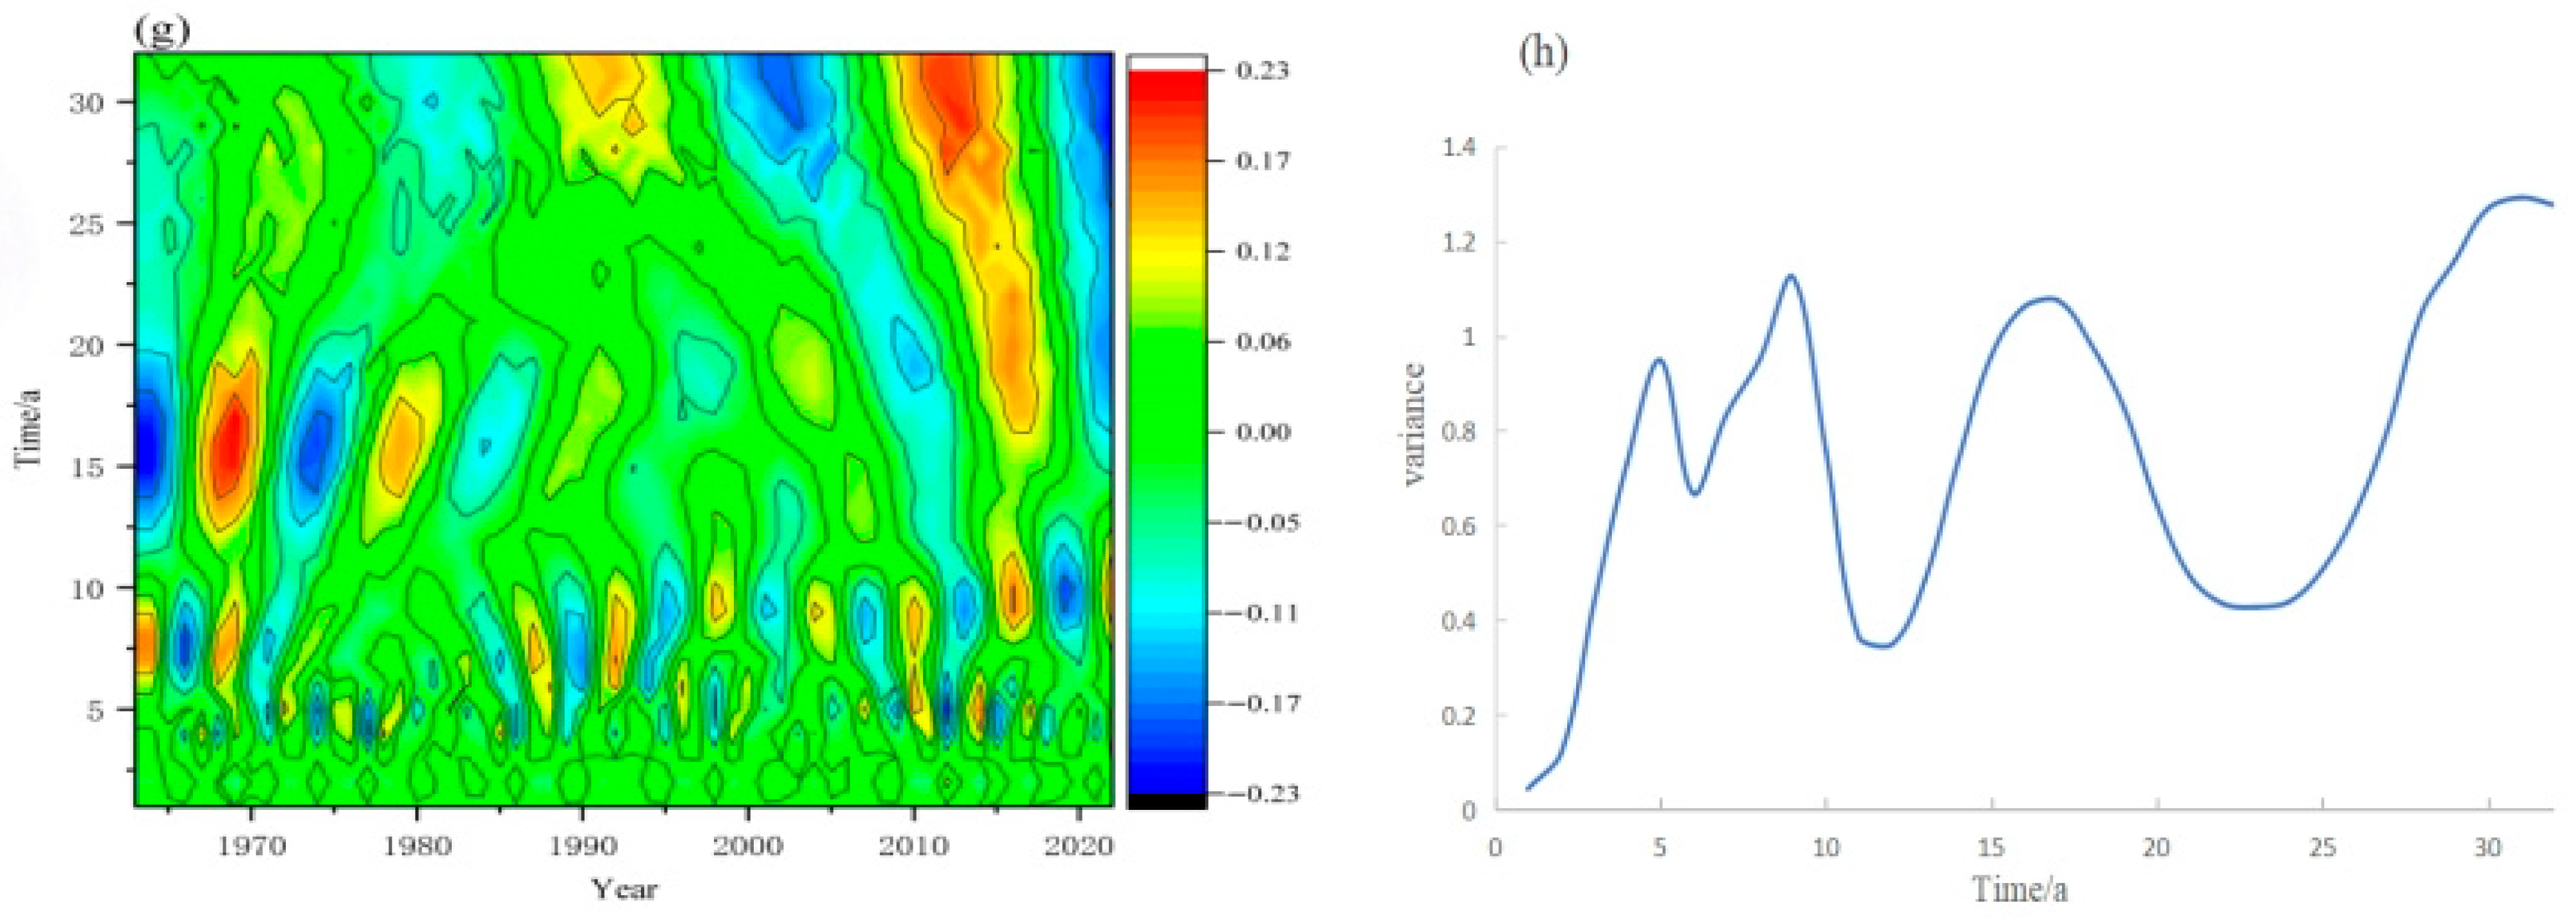
The Morlet wavelet transform was applied to the DFAAMI from 1963 to 2022 to examine the periodic variation patterns of DFAA events. Figure 6 presents the changes in the DFAAMI wavelet coefficients (Figure 6a). As shown, the interannual DFAAMI primarily exhibits oscillatory signals at two scales: 4–8 years and 10–15 years. The 4–8-year period spans the entire study period, whereas the 10–15-year periodic signal is more pronounced during 1995–2010.
Combined with the wavelet variance plot (Figure 6b), the highest peak occurs at a 6-year period, indicating that the primary period of interannual DFAAMI is 6 years, with a secondary period of 13 years. This suggests that the interannual variations in DFAA events in the Sichuan Basin may be influenced jointly by short-term and long-term climate fluctuations.

3.2.2. Seasonal Periodic Variations

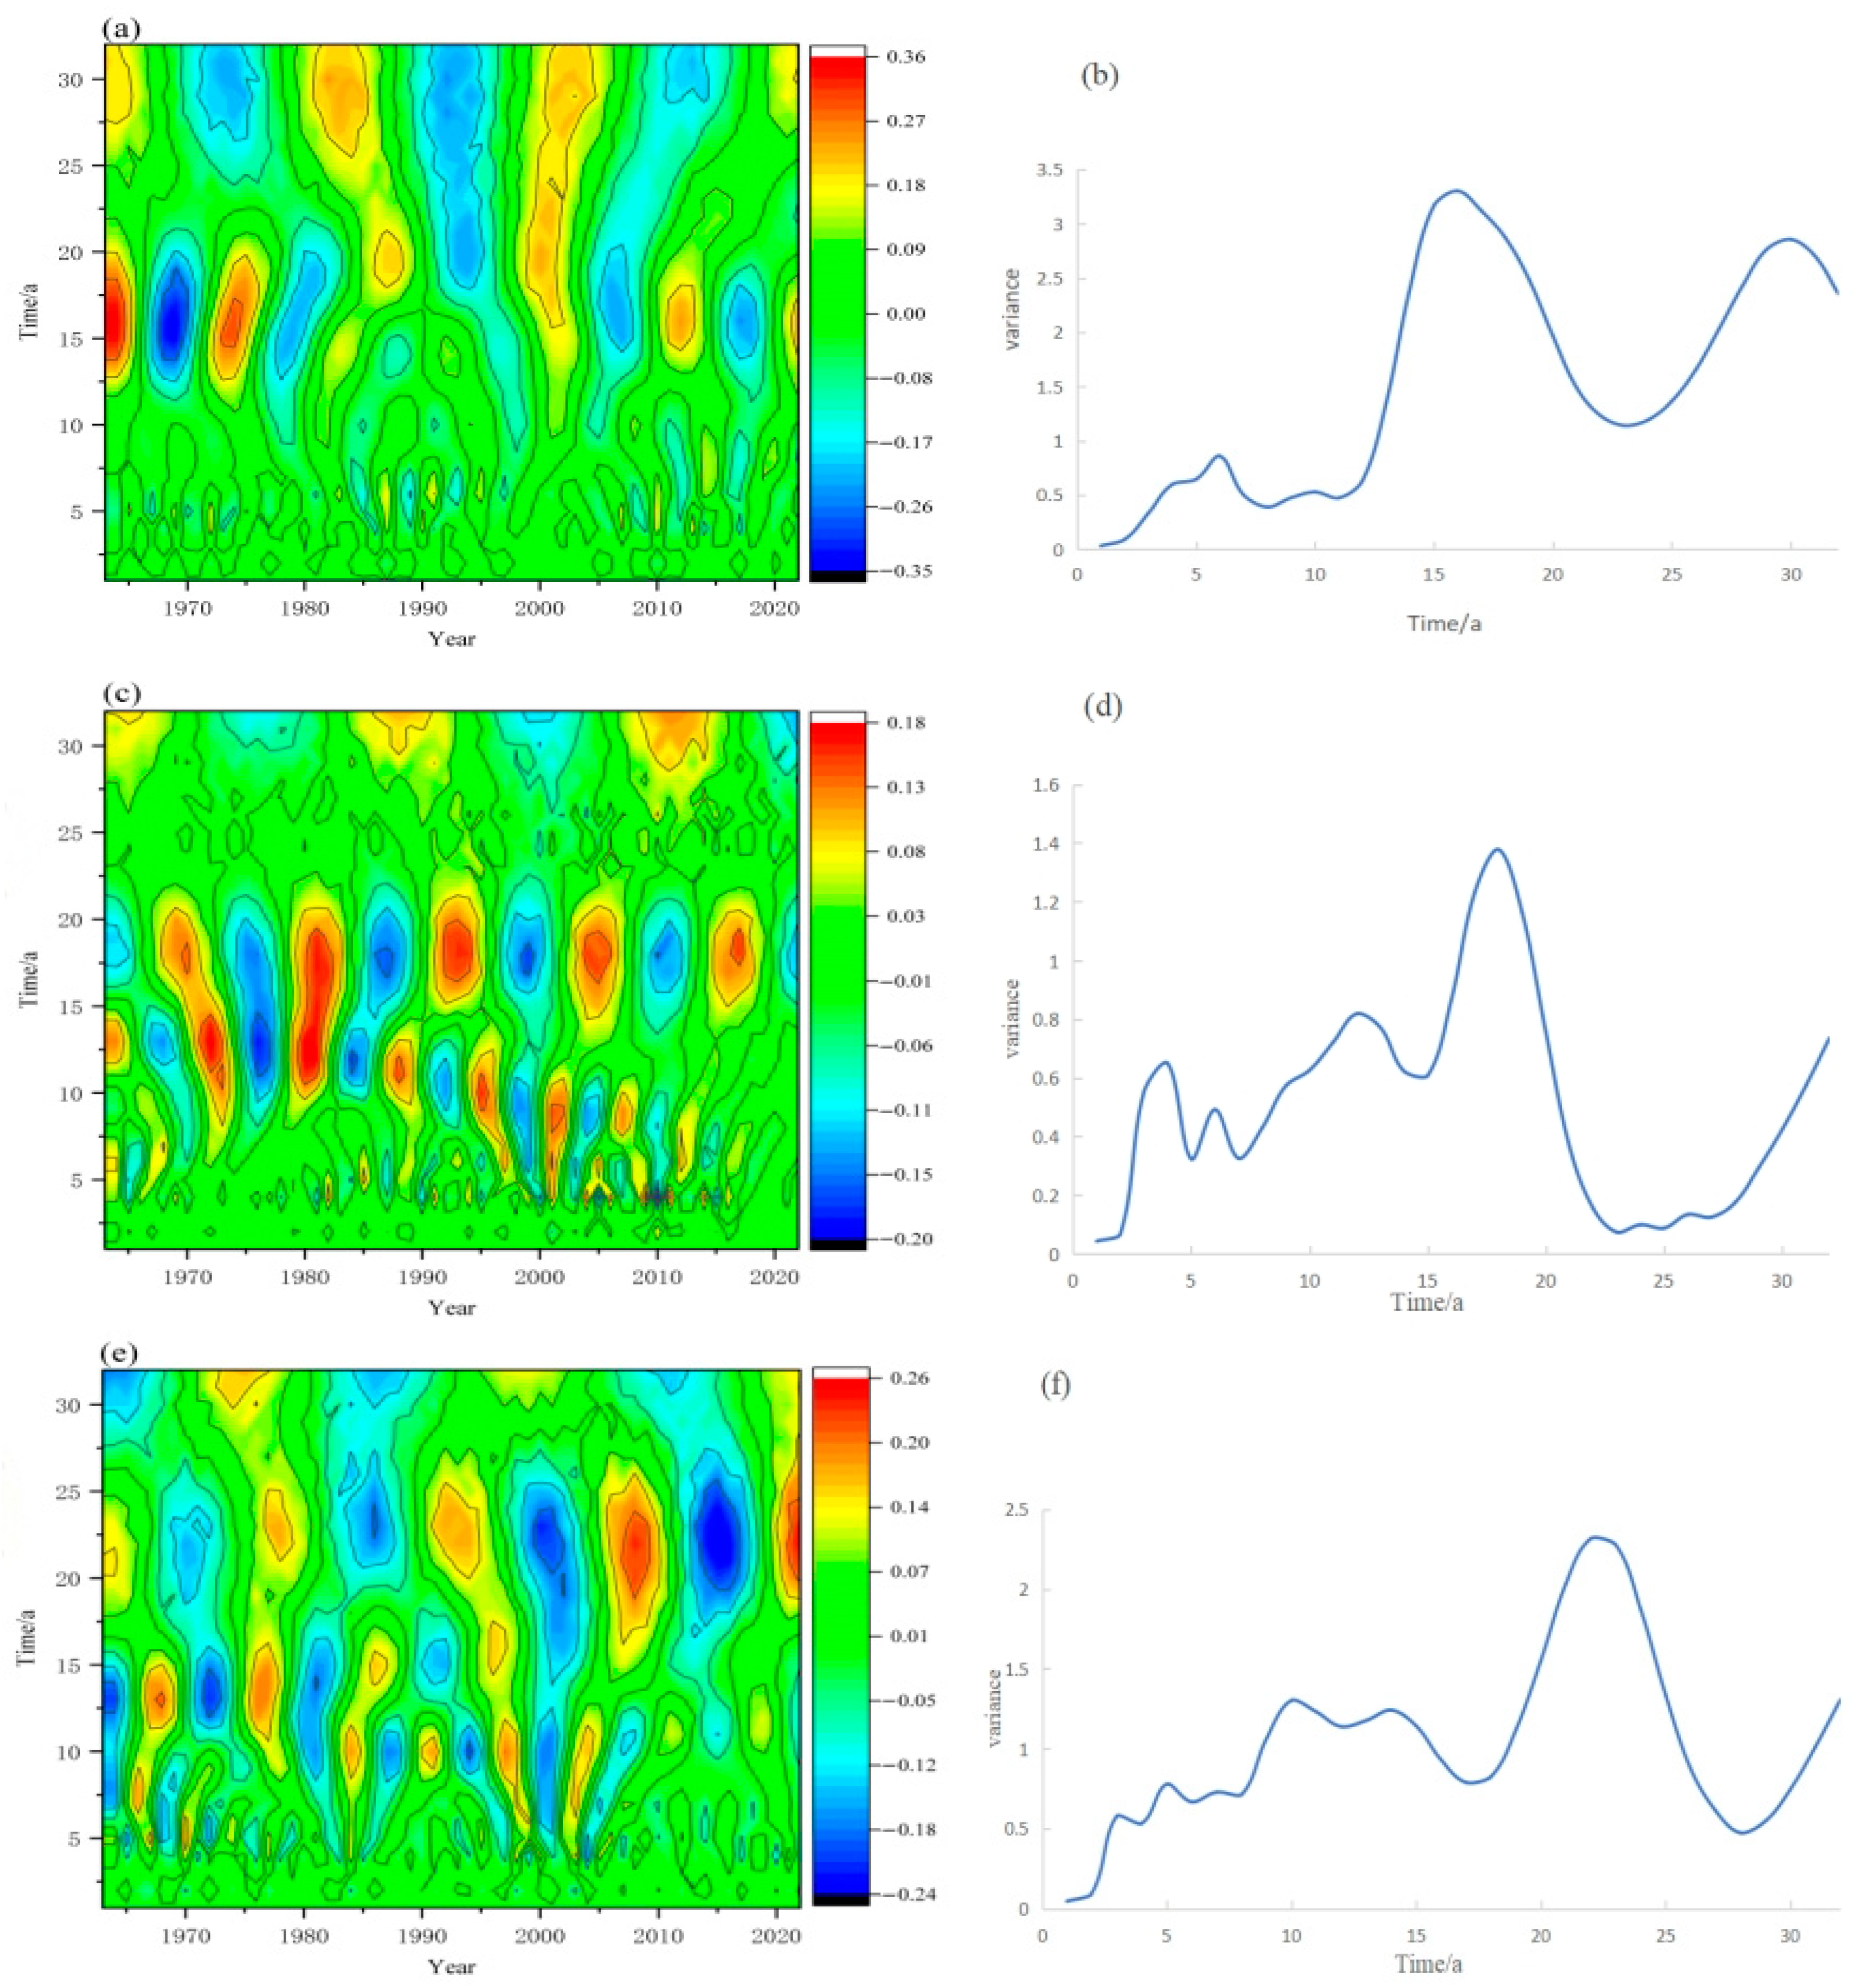
Figure 7 displays the isoline maps of the actual component of the DFAAMI wavelet coefficients for spring, summer, autumn, and winter in the Sichuan Basin (Figure 7a,c,e,g), along with the related wavelet variance maps for each season (Figure 7b,d,f,h). Seasonal differences in periodic variations are evident. In spring (Figure 7a), two distinct periodic oscillations are observed, with the 15–20-year scale exhibiting the strongest energy. Combined with the wavelet variance map (Figure 7b), the primary period is 16 years. Given the 60-year data length, long periods of 15–20 years should be interpreted with caution, as they only represent approximately 3–4 full cycles. The real part of the wavelet transform after 2022 is not completely closed, but this pattern is not sufficiently reliable to support extrapolation into the future. In summer (Figure 7c), two significant periodic oscillations are identified: 15–20 years and 10–14 years. The 15–20-year scale exhibits the strongest energy and largest wavelet variance, serving as the primary period. Based on the wavelet variance map (Figure 7d), the primary and secondary periods are determined to be 18 years and 12 years, respectively. Similarly, the 18-year period should be interpreted cautiously due to the limited data length, and no firm future persistence is inferred. In autumn (Figure 7e), periodic variations occur at 10–15 years and 20–25 years, with the 20–25-year period dominating and persisting throughout 1963–2022, yielding a primary period of 22 years. The 10–15-year period was more prominent prior to the 1990s. In winter, three oscillation signals are evident. Before 1990, a ~15-year period was pronounced, whereas after 1990, the 30-year period became dominant. Based on the wavelet variance plot, the main winter cycle is determined to be 30 years. A 30-year period covers only half the study period and is therefore highly uncertain; it is presented for completeness but not interpreted as a stable cycle. These seasonal differences in periodicity may be related to the influence of atmospheric circulation systems, such as the summer and winter monsoons, in different seasons.

3.3. Spatial Distribution Characteristics of DFAA in the Sichuan Basin

3.3.1. Interannual Spatial Variation Analysis of DFAA

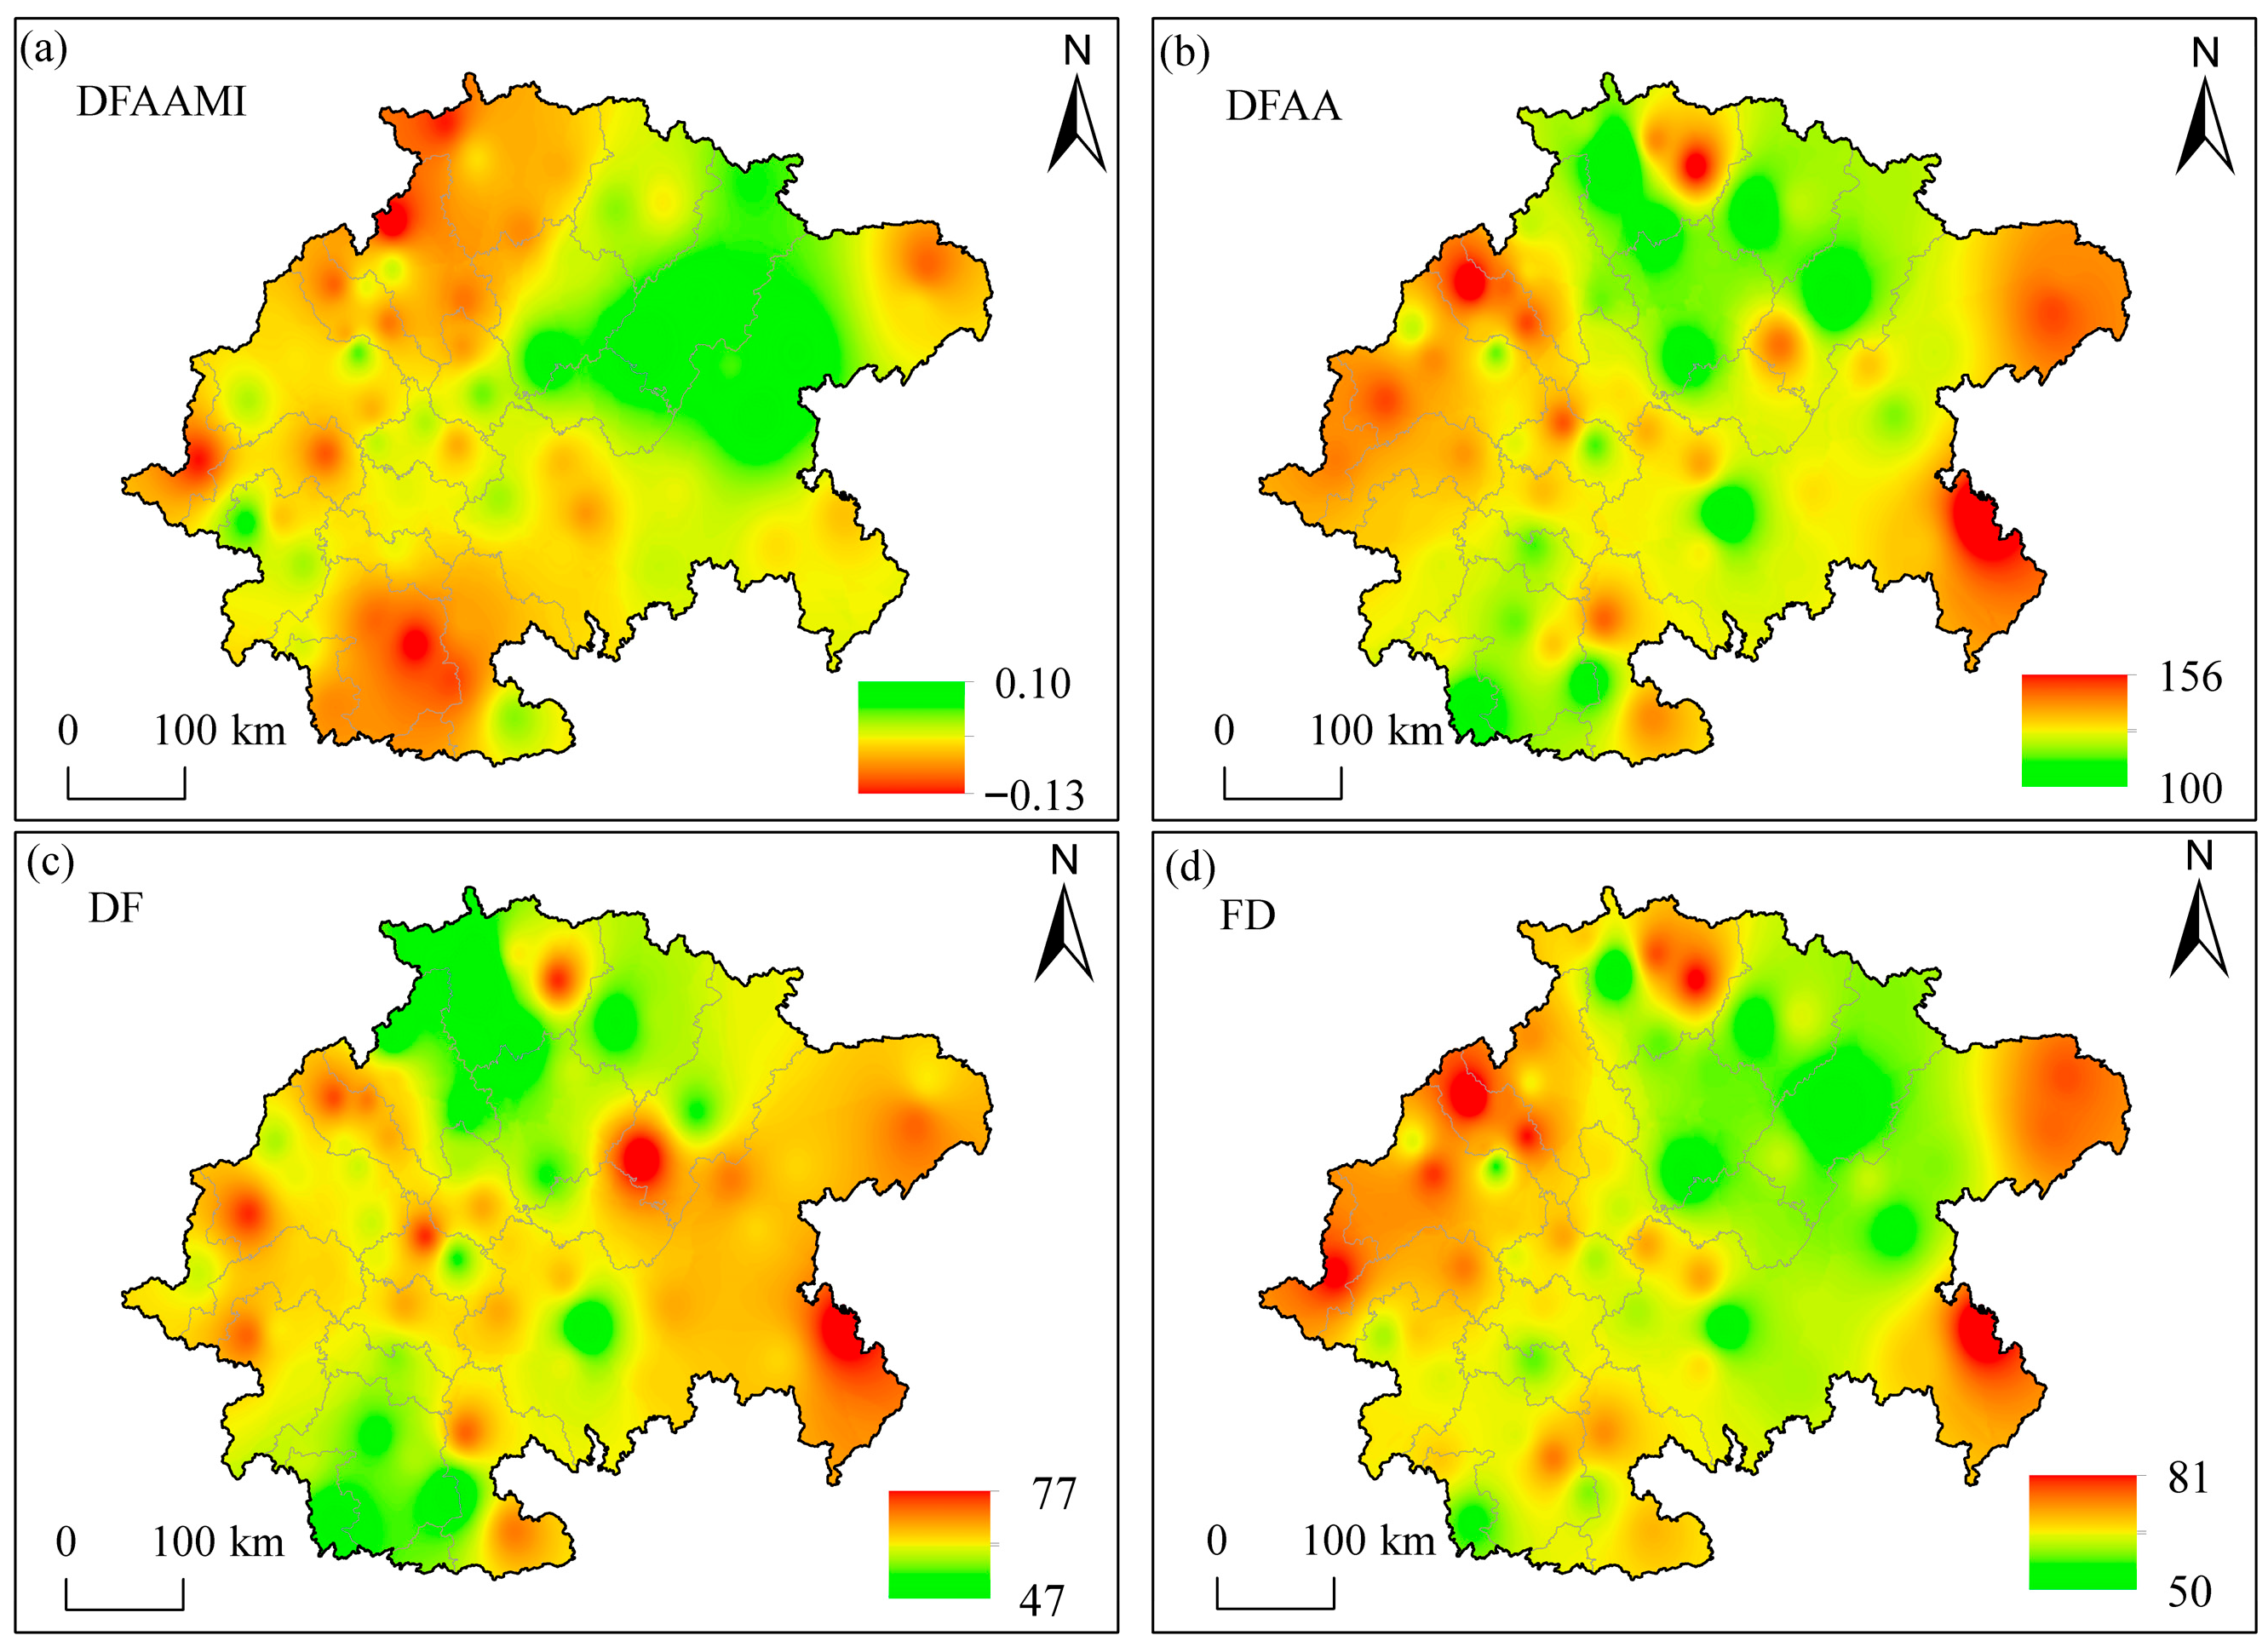
Figure 8 illustrates the multi-year average of DFAAMI and the spatial distribution of DFAA event frequency in the Sichuan Basin. From 1963 to 2022, high DFAAMI values were primarily observed in Dazhou, Kaizhou, and Wanzhou in the northeastern part of the basin, while low values were concentrated in the northwestern edge and southern regions, such as Yibin and Luzhou (Figure 8a). Analysis of the number of DFAA events (Figure 8b) indicates that the areas most prone to DFAA are the northern and eastern parts of Chongqing, northern Guangyuan, Deyang, and Chengdu, all situated along the basin margins. As shown in Figure 8c,d, over 80% of the stations in the study area recorded more than 60 DF events. High-frequency areas are mainly distributed in Chongqing, Chengdu, Deyang, and surrounding regions, which also correspond to high-frequency areas for FD events. These findings suggest that these regions are likely to experience alternating DFAA events in the short term, emphasizing the need to consider both DF and FD events in disaster prevention and mitigation planning.
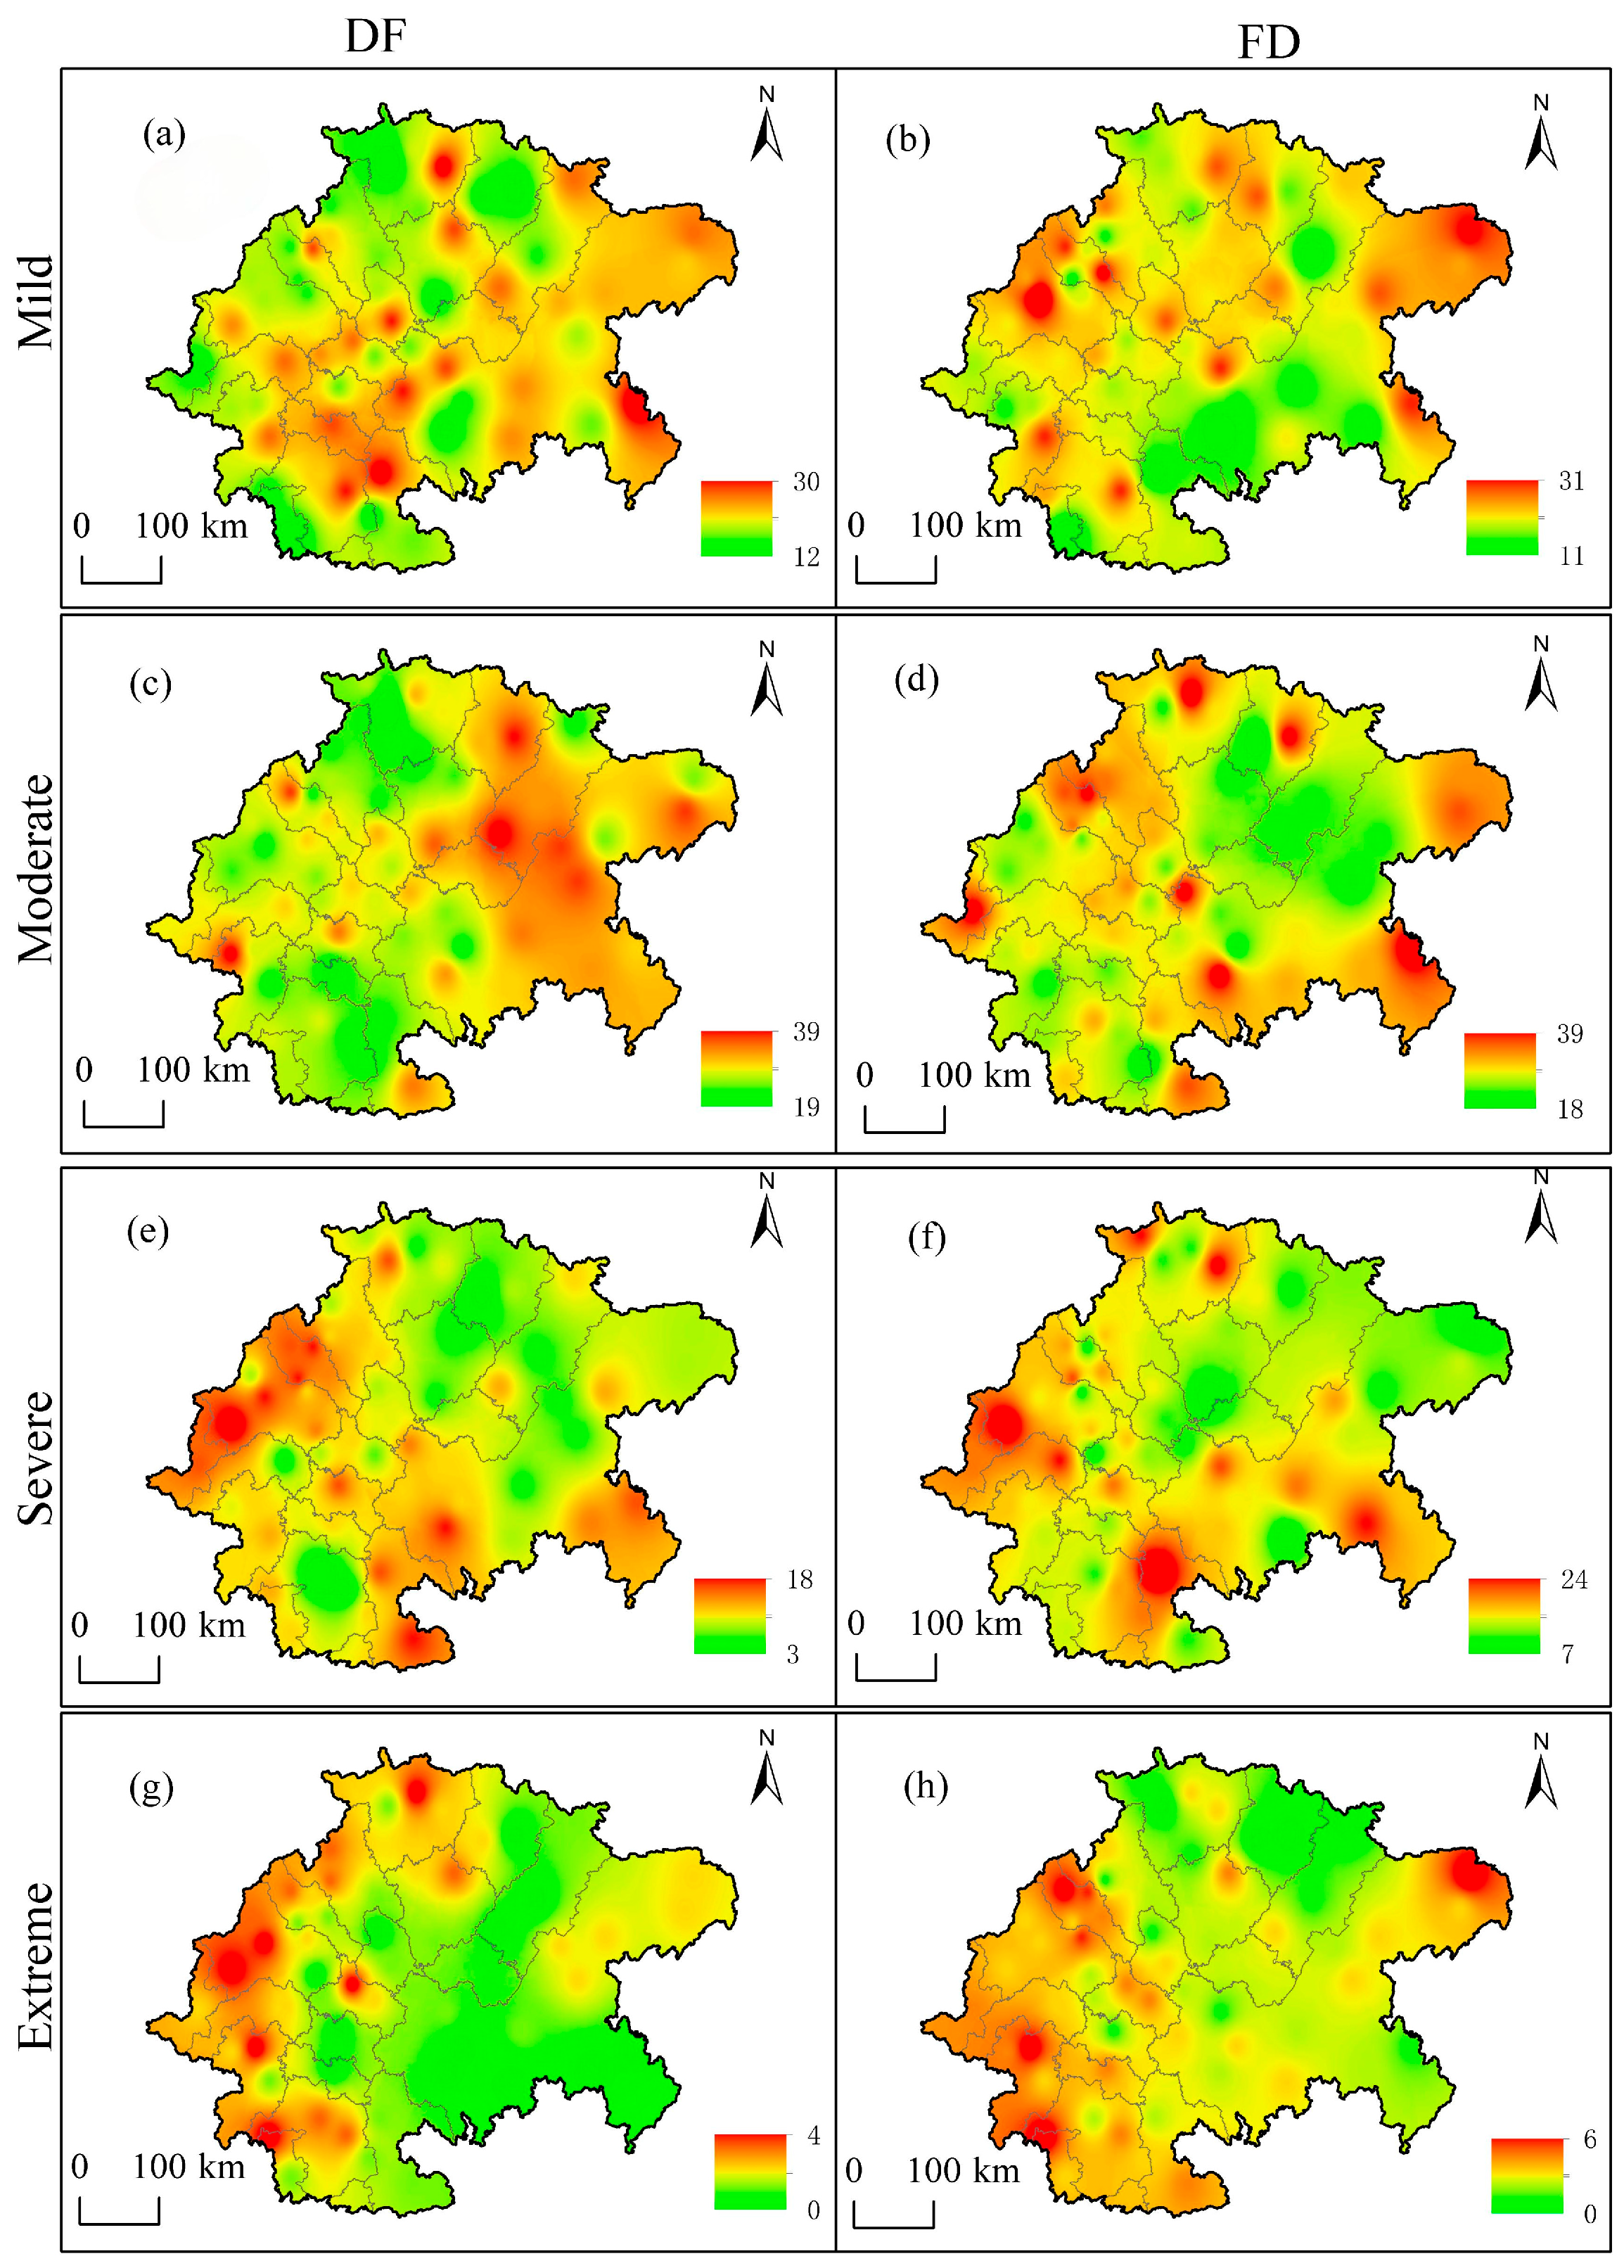
Based on the DFAAMI numerical classification criteria, DFAA events can be categorized into four intensity levels: mild, moderate, severe, and extreme. We examined the spatial distribution of DFAA events across varied intensity levels according to event counts. Mild DF events (Figure 9a) and mild FD events (Figure 9b) exhibit similar occurrences. Mild DF events are primarily concentrated in northern and eastern Chongqing, as well as in Zigong and Luzhou, whereas mild FD events are relatively sparse from central-southern Chongqing to Luzhou. Moderate events are the most frequent among the four intensity grades, with high-frequency areas reaching approximately 6.5 events per 10 years. Moderate DF events mainly occur in central Chongqing, Dazhou, and Bazhong, which coincide with low-frequency areas for FD events (Figure 9c,d). Severe DF events (Figure 9e) and severe FD events (Figure 9f) are predominantly distributed in the western basin, including Chengdu, Ya’an, and Meishan, as well as in certain areas along the eastern edge of the basin. The occurrence rate of severe DF events is slightly lower than that of severe FD events. Extreme DFAA events occur infrequently, with high-incidence areas for both DF and FD events largely concentrated along the basin margins, and occasional occurrences in other regions.

3.3.2. Spatial Characteristics of Seasons DFAA Events

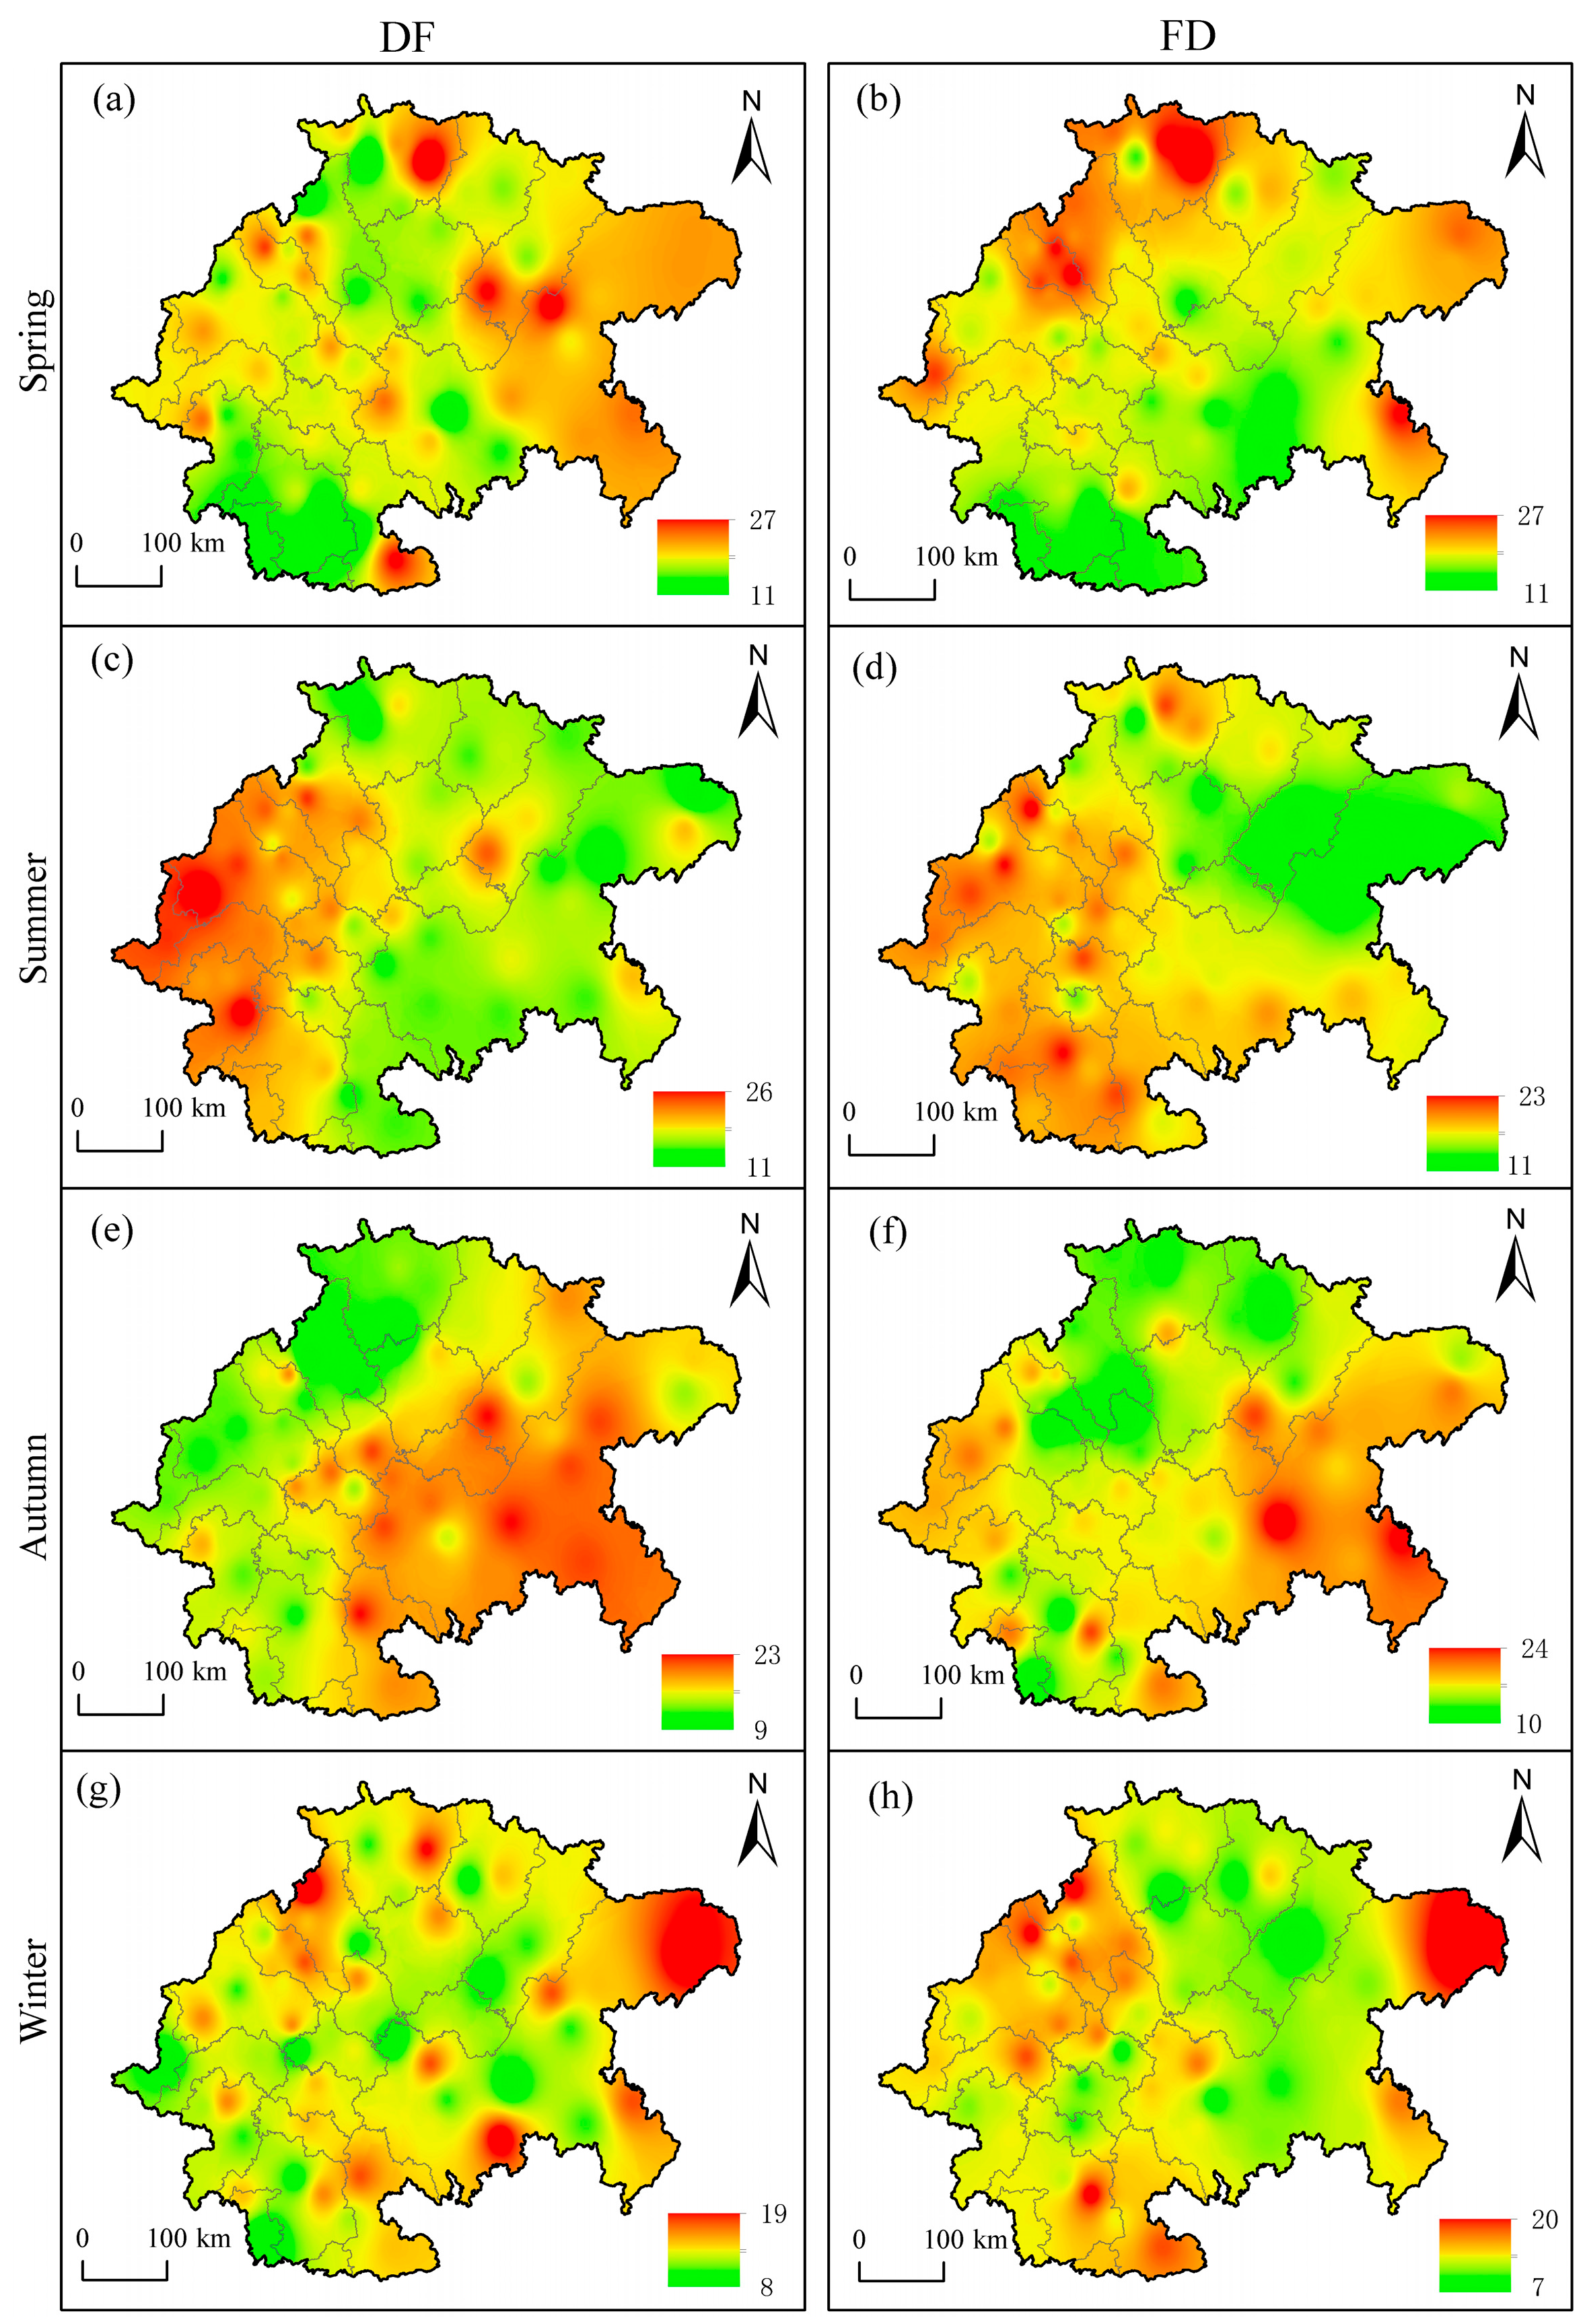
The spatial distribution of DFAA events in the Sichuan Basin varies across seasons. As shown in Figure 10, the highest frequencies of DFAA events in spring, summer, and autumn are relatively similar, whereas winter exhibits fewer occurrences. In spring, high-value areas for DF events are primarily located in Wulong and north of Fengdu in Chongqing, as well as in Wangcang in the northern basin. High-value areas for FD events also appear in Chongqing but cover a smaller range, while both the frequency and spatial extent of FD events in Wangcang are higher (Figure 10a,b). In summer, DFAA events are distributed over similar regions, predominantly in the western to southern sections of the basin. DF events reach a maximum frequency of 4.3 events per 10 years, and their high-frequency areas are more extensive (Figure 10c,d). Unlike spring, the frequency of DFAA events in northern Chongqing decreases significantly during summer. In autumn, high-value areas for both DF and FD events shift to the central and eastern parts of the basin (Figure 10e,f), contrasting with the summer distribution. The high-frequency range of DF events in autumn is notably wider than in summer. In winter, the overall times of DFAA events is lower, with a maximum of approximately 3.3 events per 10 years (Figure 10h). High-incidence areas include northern Chongqing and Qianjiang in the eastern basin. Overall, northern and eastern Chongqing experience frequent DFAA events except in summer, when DFAA events are more common in the southwestern basin. In autumn, the central and eastern sections of the basin see higher event frequencies.

3.4. Driving Mechanisms of DFAA Events in the Sichuan Basin

3.4.1. Qualitative Evaluation Based on Pearson Correlation

To study the driving mechanisms of DFAA events, 15 potential driving factors were selected. By calculating the Pearson correlation coefficients between the DFMI, FDMI, and each driving factor in the current month (M0) as well as 1 month (M-1), 2 months (M-2), and 3 months (M-3) prior to the events, the impacts of each factor on the two types of DFAA events across different time scales were initially revealed. The results are presented in Table 3.
As shown in Table 3, TEM, SSH, and WIN are the key meteorological factors driving DF events. Specifically, TEM and SSH in the current month (M0) of the event show a significantly positive correlation with the DFMI. High temperatures and long sunshine duration can accelerate soil moisture loss, thereby intensifying the transition process from drought to flood. TEM and WIN also exhibit significantly positive correlations with DFMI 2 months and 3 months prior to the events. In contrast, the associations between FD events and concurrent meteorological factors are generally weak; only PRE and RHU show a significantly positive correlation in M0. This implies that FD events may rely more on the establishment of the preceding circulation background rather than the concurrent local meteorological triggering.
Large-scale SST anomalies and atmospheric circulation systems provide an important preceding background for DFAA events through air–sea interaction and teleconnection processes. We found that tropical SST anomalies, especially the WPWPSI and the SST anomaly in the NINO B region, exert persistent and leading impacts on both DF and FD events (Table 3). The WPWPSI shows a significantly positive correlation with the magnitude indices 1 month before DF events and 2 months before FD events. This reveals that the sustained warm SST in the western equatorial Pacific and the adjacent eastern Indian Ocean can stimulate convective activities, adjust the Walker circulation, and thereby affect water vapor transport in the East Asian monsoon region, serving as a preceding oceanic signal for predicting DFAA events in the Sichuan Basin.
The positive correlation between the WPSHII and FD events is particularly prominent in M-2 (Table 3), indicating that the westward extension of the subtropical high and its ridge point facilitates the establishment of stable sinking airflow control prior to FD events. Additionally, the EATII and the TPRI are mainly significantly correlated with DF events, suggesting that the activities of trough-ridge systems in the mid-high latitudes and the thermal-dynamic forcing of the Tibetan Plateau play important roles in regulating the precipitation reversal process from drought to flood. The AO, as well as the AZCI and AMCI, did not show stably significant correlations in this study.

3.4.2. Quantitative Analysis of the Relative Contribution of Driving Factors Based on Random Forest

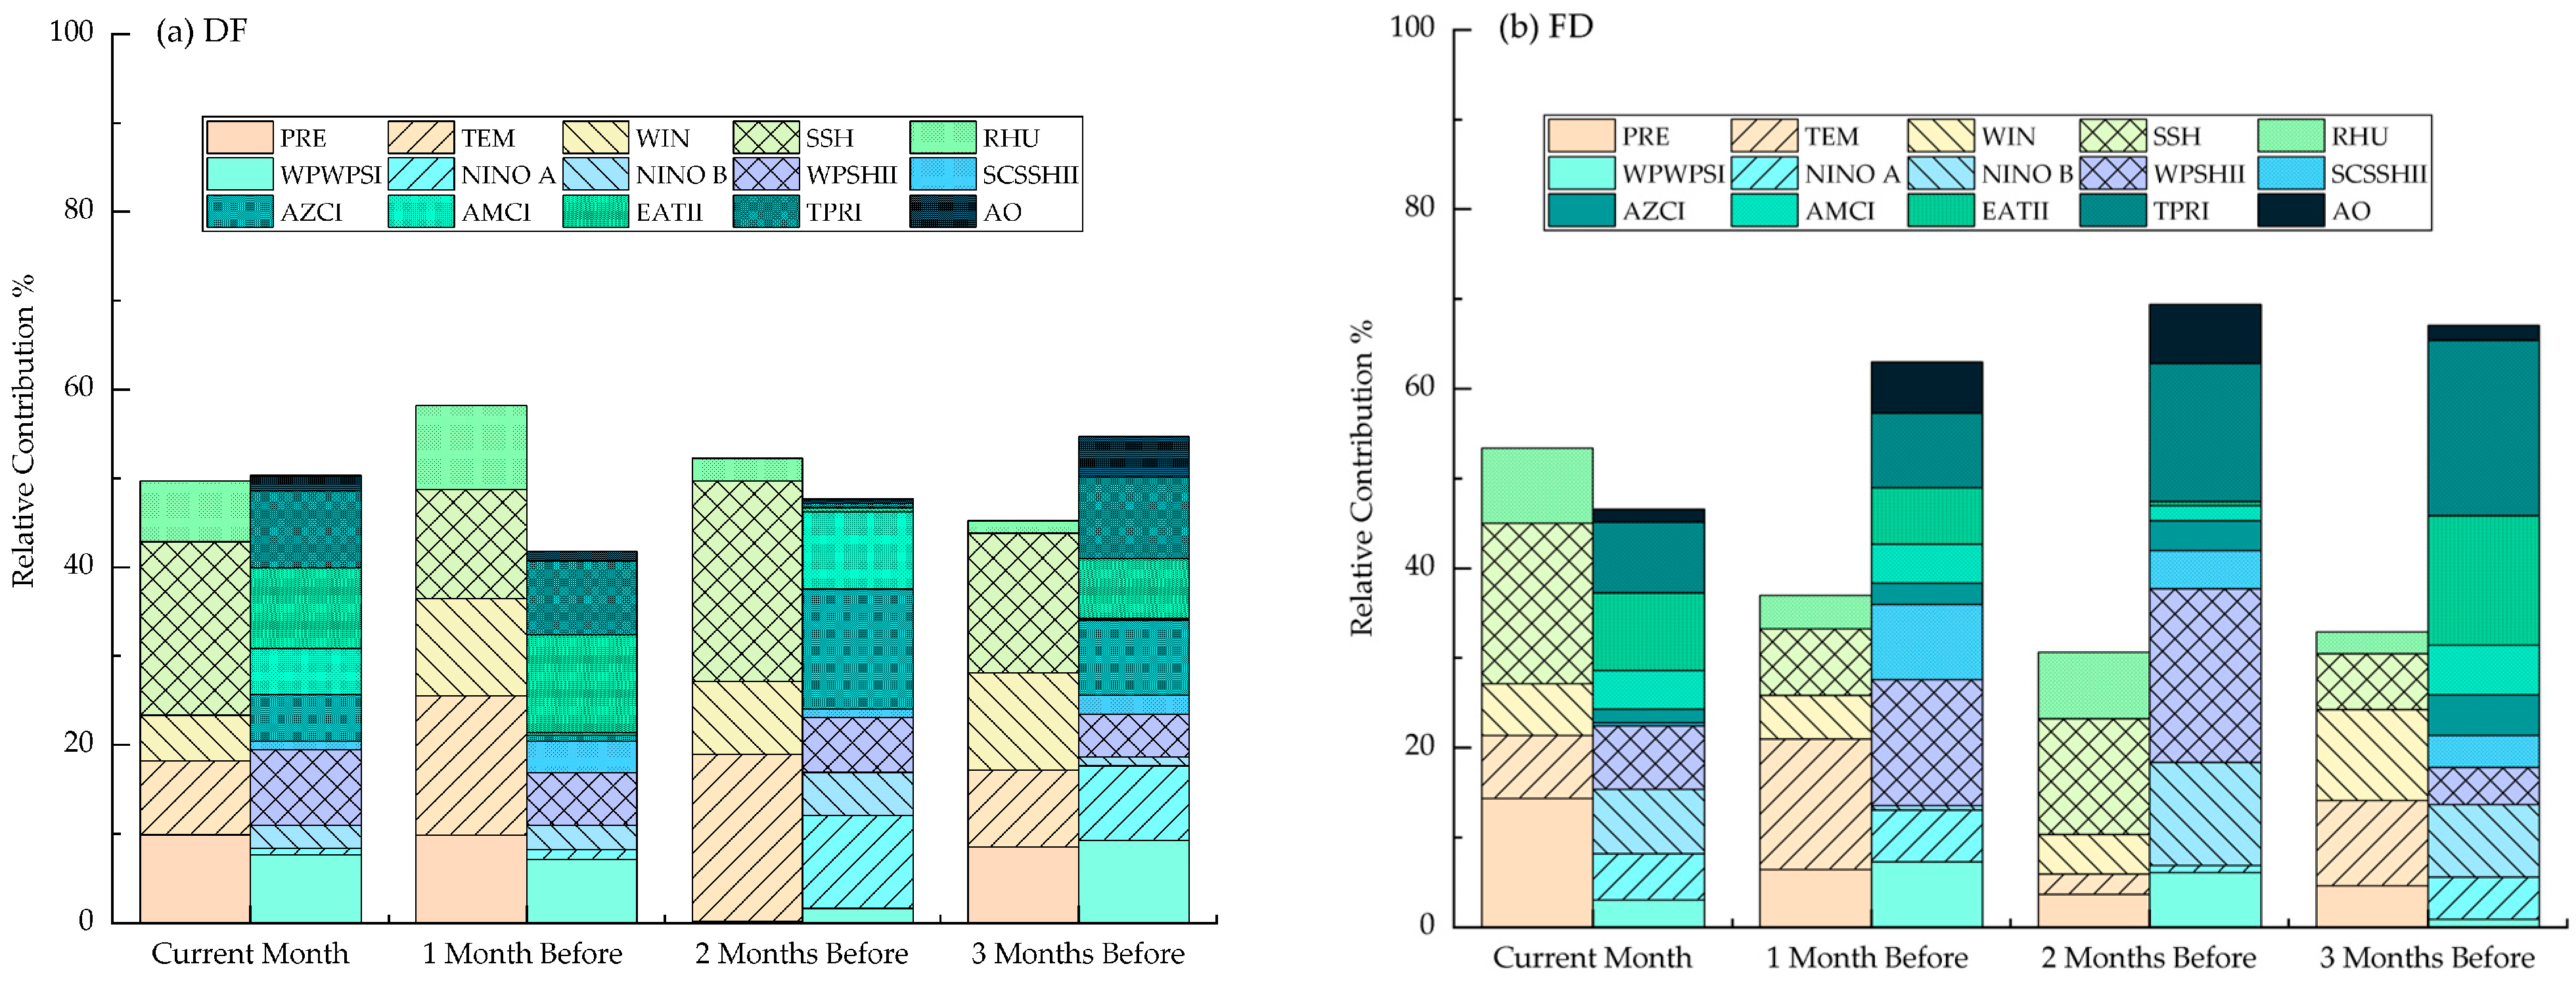
Given the potential complex nonlinear relationships among the driving factors of DFAA, traditional linear models have inherent limitations in quantifying their respective contributions. To address this issue, the random forest algorithm was introduced in this study to quantify the importance of each factor to the target variables. By calculating the relative contribution of each driving factor in the current month (M0) as well as 1 to 3 months prior to the occurrence of DF and FD events, the key driving factors and the temporal evolution characteristics of their impacts were revealed from a nonlinear perspective. The results of the relative contribution of each factor are presented in Figure 11, respectively.
For DF events (Figure 11a), the dominant role of driving factors exhibited phased shifts across different time periods. Three months prior to the events, the dominant signals showed a decentralized pattern. SSH (15.73%), WIN (10.94%), WPWPSI (9.29%), TPRI (9.16%) and TEM (8.67%) constituted the top five key factors in terms of contribution. This combination indicates that three months before the occurrence of DF events, multiple factors including sea surface temperature, plateau thermal forcing, regional radiation and atmospheric dynamics may have already established a preceding anomalous background favorable for subsequent circulation adjustment. Two months prior to the events, the signals shifted from decentralization to centralization. SSH and TEM emerged as the most prominent local factors with contribution rates reaching 22.61% and 18.71%, respectively. This suggests that persistent long sunshine duration and high temperatures in the region during this period may have exacerbated the preceding drought condition, while laying the groundwork for subsequent water vapor evaporation and the conversion of convection to a warm and humid state. Meanwhile, the contribution rates of NINO A SSTA and AZCI increased significantly to 10.44% and 13.49%, respectively. This reveals that specific sea surface temperature anomalies in the central equatorial Pacific had begun to affect the large-scale zonal circulation through teleconnection processes, serving as a key medium-term adjustment signal for the direction of circulation evolution. One month prior to the events, the dominant factors shifted to TEM and SSH, with contribution rates of 15.68% and 12.25%, respectively. At the same time, the contribution rate of EATII rose to 11.05%, and WIN and PRE also showed notable contributions of 10.96% and 9.84%, respectively. This reflects that one month before the events, significant regional warming, persistent sunshine conditions, enhanced wind speed and active mid-latitude troughs not only aggravated climatic drought, but also established a thermal, dynamic and circulation background conducive to water vapor transport and convective development. In the month of the events, the top three most important factors were SSH, EATII and PRE in sequence, with contribution rates of 19.49%, 9.01% and 9.87%, respectively. This indicates that strong solar radiation during the event month may have induced convective instability by enhancing surface heating; the deepening of the East Asian Trough provided large-scale dynamic lifting and a certain precipitation basis. WPSHII also made a certain contribution of 8.53%, implying that water vapor transport along its edge may have been involved in the process.
The driving factor of FD events differed from that of DF events, with the evolution of factor importance characterized by the Subtropical High as the core and the coordination of different systems in various stages (Figure 11b). Three months prior to the events, TPRI and EATII ranked top two in contribution rates, accounting for 19.49% and 14.45%, respectively. This suggests that the earliest preceding signals of FD events mainly originated from the thermal forcing of the Tibetan Plateau and the activities of mid-latitude trough-ridge systems. Two months prior to the events, the contribution rate of WPSHII increased to 19.34%, becoming the important factor. TPRI (15.34%) and SSH (12.88%) also had prominent contributions. One month prior to the events, the region was still in a flood state, but the meteorology had already transitioned toward “drought conversion”. WPSHII remained an important influencing factor with a contribution rate of 14.03%, while TEM also reached a contribution rate of 14.57%. In the month of FD events, SSH (17.87%) and PRE (14.33%) had the highest contribution rates, which was directly related to the weather turning sunny and precipitation decreasing significantly during the event period. EATII (8.67%) and WPSHII (7.08%) also showed certain contributions. This indicates that FD events are ultimately realized through suppressing precipitation and increasing sunshine duration under the circulation background dominated by the Subtropical High, thus completing the transition from flood to drought.

4. Discussion

This study reveals that DFAA events in the Sichuan Basin are characterized by “FD dominance and intensification of moderate-to-severe grades,” which contrasts with the pattern of more frequent DF events observed in the middle and lower reaches of the Yangtze River [15]. This difference may be attributed to the “rain shadow effect” resulting from the basin’s enclosed topography: the Qinghai–Tibet Plateau in the west blocks moisture, leading to abundant precipitation in the western basin, prone to floods [51], whereas descending air currents in the northeastern basin reduce precipitation, making it more susceptible to droughts. These spatial contrasts provide a basis for the predominance of FD events. Moreover, the notable intensification of FD events in summer (0.049 events per decade, p < 0.05) aligns with the observed decreasing trend in summer precipitation. Global warming prompts the subtropical ridge to expand westward, driving the phenomenon [21]. Elevated temperatures further enhance evaporation, amplifying the intensity of “FD” transitions [36].
Similar patterns of increasing drought–flood alternation have been identified in other monsoon regions, including the Yangtze River Basin [5], South Korea [8], and the United States [9]. Most studies attribute these changes to intensified monsoon variability and warming-induced evapotranspiration increases [52]. The overall trend observed in the Sichuan Basin aligns with the regional trend conclusions mentioned above., though the seasonal timing shows regional specificity due to complex terrain.
SPEI incorporates both precipitation and evapotranspiration, making it more responsive to water supply–demand imbalance under warming and drying trends than SPI [53]. This choice improves the detection of dry–wet transitions that characterize DFAA events. The DFAAMI further reduces uncertainty by unifying severity grading, which has been inconsistent in earlier DFAA methods. A key limitation is that SPEI relies on potential evapotranspiration, which is sensitive to temperature and wind. Future studies could improve accuracy by using actual evapotranspiration data.
The WPWPSI, NINO B SST, and WPSHII were strongly statistically correlated with both DF and FD events, serving as a large-scale common environmental background for the occurrence of regional drought–flood abrupt alternation. This confirms that the thermal conditions of the tropical oceans and the resultant response of the WPSH form the basic circulation framework governing the intraseasonal precipitation anomaly reversal in the Sichuan Basin [15,30]. However, the mechanisms underlying these two types of events differed. In addition to being influenced by the aforementioned common background, the intensity of DF events was also significantly correlated with local air temperature, sunshine duration, wind speed, the intensity of the East Asian Trough, and the thermal conditions of the Tibetan Plateau. This indicates that DF events may be a cascading process triggered by local meteorological conditions, which is synergistically driven by SST anomalies via modulating the subtropical high, mid-high latitude circulation, and the thermal forcing of the Tibetan Plateau [54].
In contrast, the significantly correlated factors for FD events were relatively concentrated, mainly associated with tropical SST (WPWPSI, NINO B SST) and the subtropical high (WPSHII, SCSSHII). This suggests that FD events may be dominated by the process of tropical SST anomalies driving the intensification of the subtropical high system, which in turn induces the transition from flood to drought, with the direct role of local meteorological factors being less pronounced [5,25,52]. Given the differences in the driving factors between the two types of events, future predictions of DF events should focus on the synergistic anomalies of the Western Pacific Warm Pool, the thermal conditions of the Tibetan Plateau, and local wind fields during the three months preceding the events, as well as the adjustment signals of SST in the NINO A region and the Asian zonal circulation during the two months preceding the events. For FD event prediction, attention should be paid earlier to the thermal conditions of the Tibetan Plateau and the persistent intensification trend of the Western Pacific Subtropical High; notably, the sustained strong intensification of the subtropical high during the period from two months to one month prior to the events may serve as a clear predictive indicator.
This study finds that moderate-to-severe DFAA events are more prominent along the edges of the basin, consistent with the conclusion that “topographic uplift enhances precipitation variability” [35]. Compared with broader studies of the southwestern region [55], the increase in FD events in the Sichuan Basin is more pronounced. This pattern may be attributed to the “heat island effect” within the basin, which exacerbates local aridification and provides a basis for regionally differentiated disaster prevention strategies.

5. Conclusions

We investigated the chronological and geographical variations in DFAA events in the Sichuan Basin from 1963 to 2022. We have discovered these conclusions:
(1)
The frequency of FD events in the Sichuan Basin showed a more pronounced upward trend (0.052 events per decade) compared to DF events. The proportion of moderate-to-severe events increased significantly, with trends of 0.043 and 0.041 events per decade for moderate DF and FD events, respectively (p < 0.05), indicating that DFAA events are evolving toward higher intensity. In summer, both the frequency (0.049 events per decade, p < 0.05) and intensity of FD events increased significantly. Winter FD events also exhibited a marked upward trend in intensity (−0.057 per decade, p < 0.05). Among the four seasons, summer represents the high-incidence period for DFAA events.
(2)
DF events are most frequent in the northeastern basin, whereas FD events are concentrated along the northwestern edge and in southern regions, such as Yibin and Luzhou. Moderate-to-severe events are particularly prominent along basin margins. Highly populated areas, including Chongqing and Chengdu, are prone to alternating DF and FD events.
(3)
DF events represent a multi-stage energy accumulation process. Three months prior to the event occurrence, the dominant signals exhibited a decentralized pattern; overall, the contribution of circulation signals exceeded that of meteorological factors. Two months before the events, the contribution rates of SSH and TEM reached 22.61% and 18.71%, respectively, while the contribution rates of SST in the NINO A region and AZCI increased significantly to 10.44% and 13.49%. One month prior to the events, TEM and SSH served as the dominant factors, with contribution rates of 15.68% and 12.25%, respectively, and the contribution rate of EATII rose to 11.05%. In the month of the events, local meteorological conditions and mid-latitude systems directly triggered the occurrence of disasters; the top three most important factors were SSH, EATII and PRE in sequence, with contribution rates of 19.49%, 9.01% and 9.87%, respectively. Three months prior to the occurrence of FD events, TPRI and EATII ranked the top two in terms of contribution rates, accounting for 19.49% and 14.45%, respectively. Two months before the events, the contribution rate of WPSHII increased to 19.34%, and TPRI (15.34%) and SSH (12.88%) also showed prominent contributions. One month prior to the events, the contribution rates of TEM and WPSHII reached 14.57% and 14.03%, respectively. In the month of the events, the meteorological factors SSH (17.87%) and PRE (14.33%) had the highest contribution rates.
This study has several limitations. The 60-year data length limits the reliability of long-period oscillations in wavelet analysis. Spatial patterns are presented descriptively, without hotspot testing or uncertainty quantification. The analysis uses only observations and lacks numerical model validation. Future work should extend the data length to improve periodic detection. Spatial statistics should be applied to quantify hotspots and uncertainty. Results should also be validated with climate models to better understand the physical mechanisms.

Author Contributions

Conceptualization, Z.Y. and H.X.; methodology, Y.H. and S.J.; data curation, Z.Y.; writing—original draft preparation, Z.Y.; writing—review and editing, S.J. and H.X. All authors have read and agreed to the published version of the manuscript.

Funding

This research was supported by the University-level Post-subsidy Project of Aba Teachers College (AS-HBZ2026-60), the 2025 Project of Research Center for Meteorological Disaster Prediction, Early Warning, and Emergency Management, Key Research Base of Humanities and Social Sciences in Sichuan Province (ZHYJ25-YB07), the Sichuan Provincial Department of Science and Technology Project (21RKX0483).

Institutional Review Board Statement

Not applicable.

Informed Consent Statement

Not applicable.

Data Availability Statement

The data presented in this study are available on request from the corresponding author.

Acknowledgments

We are grateful to the Meteorological Research Institute of the Minjiang River Upper Reaches, the Aba State Institute for Geological Environment Evolution and High-Quality Development.

Conflicts of Interest

The authors declare no conflicts of interest.

Abbreviations

The following abbreviations are used in this manuscript:
DFAADrought–Flood Abrupt Alternation
DFDrought-to-Flood
FDFlood-to-Drought
DFAAMIDrought-Flood Abrupt Alternation Magnitude Index
DFMIDrought-to-Flood Magnitude Index
FDMIFlood-to-Drought Magnitude Index
SPEIStandardized Precipitation Evapotranspiration Index
SPIStandardized Precipitation Index
SRIStandardized Precipitation Index
DFCIDrought–Flood Coexistence Index
PETPotential Evapotranspiration
RFRandom Forest
SSTsea surface temperature

References

  1. Li, W.H.; Cao, H.; Ren, Y.F.; Liu, X.B.; Ma, Y.M.; Li, W.D. Study on evolution law of drought-flood abrupt alternation and its influence on runoff in Jialing River Basin. Yangtze River 2024, 55, 128–140. [Google Scholar] [CrossRef]
  2. Zscheischler, J.; Martius, O.; Westra, S.; Bevacqua, E.; Raymond, C.; Horton, R.M.; van den Hurk, B.; AghaKouchak, A.; Jézéquel, A.; Mahecha, M.D.; et al. A typology of compound weather and climate events. Nat. Rev. Earth Environ. 2020, 1, 333–347. [Google Scholar] [CrossRef]
  3. Zscheischler, J.; Westra, S.; Van Den Hurk, B.J.; Seneviratne, S.I.; Ward, P.J.; Pitman, A.; AghaKouchak, A.; Bresch, D.N.; Leonard, M.; Wahl, T. Future climate risk from compound events. Nat. Clim. Change 2018, 8, 469–477. [Google Scholar] [CrossRef]
  4. Huang, L.; Du, H.; Dang, Y.; He, H.S.; Wang, L.; Na, R.; Li, N.; Wu, Z. Observed and projected changes in wet and dry spells for the major river basins in East Asia. Int. J. Climatol. 2023, 43, 5369–5386. [Google Scholar] [CrossRef]
  5. Yang, P.; Zhang, S.; Xia, J.; Zhan, C.; Cai, W.; Wang, W.; Luo, X.; Chen, N.; Li, J. Analysis of drought and flood alternation and its driving factors in the Yangtze River Basin under climate change. Atmos. Res. 2022, 270, 106087. [Google Scholar] [CrossRef]
  6. Yuan, X.; Wang, Y.; Zhou, S.; Li, H.; Li, C. Multiscale causes of the 2022 Yangtze mega-flash drought under climate change. Sci. China Earth Sci. 2024, 67, 2649–2660. [Google Scholar] [CrossRef]
  7. Qiao, Y.; Xu, W.; Meng, C.N.; Zhao, D.D. Review of Study on Dry Wet Abrupt Alternation: Progress and Challenge. J. Catastrophology 2023, 38, 131–138. [Google Scholar]
  8. Son, H.-J.; Kim, J.E.; Byun, S.H.; Lee, J.-H.; Kim, T.-W. Monitoring and evaluating the severity of drought-flood abrupt alternation events using daily standardized precipitation index. KSCE J. Civ. Eng. 2024, 28, 1002–1010. [Google Scholar] [CrossRef]
  9. DeFlorio, M.J.; Sengupta, A.; Castellano, C.M.; Wang, J.; Zhang, Z.; Gershunov, A.; Guirguis, K.; Luna Niño, R.; Clemesha, R.E.; Pan, M.; et al. From California’s extreme drought to major flooding: Evaluating and synthesizing experimental seasonal and subseasonal forecasts of landfalling atmospheric rivers and extreme precipitation during winter 2022/23. Bull. Am. Meteorol. Soc. 2024, 105, E84–E104. [Google Scholar] [CrossRef]
  10. Chen, H.; Wang, S.; Zhu, J.; Zhang, B. Projected Changes in Abrupt Shifts Between Dry and Wet Extremes over China Through an Ensemble of Regional Climate Model Simulations. J. Geophys. Res. Atmos. 2020, 125, e2020JD033894. [Google Scholar] [CrossRef]
  11. Wu, Z.W.; Li, J.P.; He, J.H.; Jiang, Z.H. Large-scale atmospheric singularities and summer long-cycle droughts-floods abrupt alternation in the middle and lower reaches of the Yangtze River. Chin. Sci. Bull. 2006, 51, 1717–1724. [Google Scholar] [CrossRef]
  12. Sun, P.; Liu, C.L.; Zhang, Q. Spatio-temporal variations of drought-flood abrupt alternation during main flood season in East River Basin. Pearl River 2012, 33, 29–34. [Google Scholar]
  13. Zhang, W.; Liu, Y.Y.; Chen, A.Q.; Liu, W.; Sang, G.Q. Characteristics of Drought-Flood Abrupt Alternation in Mihe River Basin from 1976 to 2020. Yellow River 2024, 46, 31–37. [Google Scholar]
  14. Zhao, Z.M.; Shao, W.W.; Cao, Y.Q.; Ren, B. Study on the characteristics and trend of drought-flood abrupt alternation in Liaoning Province. Water Resour. Hydropower Eng. 2024, 55, 32–43. [Google Scholar] [CrossRef]
  15. Shan, L.; Zhang, L.; Song, J.; Zhang, Y.; She, D.; Xia, J. Characteristics of dry-wet abrupt alternation events in the middle and lower reaches of the Yangtze River Basin and the relationship with ENSO. J. Geogr. Sci. 2018, 28, 1039–1058. [Google Scholar] [CrossRef]
  16. Wang, Y.F.; Fan, L.J. Evolution characteristics of abrupt drought-flood alternationevents in the source region of the Changjiang river. J. Chang. River Sci. Res. Inst. 2023, 40, 186–190. [Google Scholar]
  17. Xu, J.W.; Ji, G.X.; Zhang, Y.L. Analysis on the characteristics of drought-flood abrupt alternation in the Jialing River Basin from 1982 to 2020 based on SRI. J. Henan Norm. Univ. (Nat. Sci. Ed.) 2025, 53, 42–49. [Google Scholar] [CrossRef]
  18. Kumar, A.; Arya, D.S. Spatiotemporal analysis and mechanisms of drought flood abrupt alternation events in India. J. Hydrol. Reg. Stud. 2025, 62, 102992. [Google Scholar] [CrossRef]
  19. Bai, X.; Wang, Z.; Wu, J.; Zhang, Z.; Zhang, P. A novel multivariate multiscale index for drought-flood abrupt alternations: Considering precipitation, evapotranspiration, and soil moisture. J. Hydrol. 2024, 643, 132039. [Google Scholar] [CrossRef]
  20. Sun, J.H.; Su, B.D.; Wang, D.F.; Huang, J.L.; Wang, B.W.; Dai, R.; Jiang, T. Temporospatial characteristics of drought-flood abrupt alteration events in China. Water Resour. Hydropower Eng. 2024, 55, 13–23. [Google Scholar]
  21. Qiao, Y.; Xu, W.; Meng, C.; Liao, X.; Qin, L. Increasingly dry/wet abrupt alternation events in a warmer world: Observed evidence from China during 1980–2019. Int. J. Climatol. 2022, 42, 6429–6440. [Google Scholar] [CrossRef]
  22. Qiao, Y.; Xu, W.; Wu, D.; Meng, C.; Qin, L.; Li, Z.; Zhang, X. Changes in the spatiotemporal patterns of dry/wet abrupt alternation frequency, duration, and severity in Mainland China, 1980–2019. Sci. Total Environ. 2022, 838, 156521. [Google Scholar] [CrossRef]
  23. Wang, Y.T.; Huang, S.Z.; Huang, Q.; Deng, X.D.; Cheng, L.W.; Luo, J. Spatial-temporal distribution and driving mechanism of drought predictability in the Loess Plateau. J. Nat. Disasters 2024, 33, 137–151. [Google Scholar] [CrossRef]
  24. Zhang, G.; Wang, H.; Gan, T.Y.; Zhang, S.; Zhao, J.; Su, X.; Fu, X.; Shi, L.; Xu, P.; Lu, M.; et al. A comprehensive review of recent progress on the drought-flood abrupt alternation. J. Hydrol. 2025, 661, 133806. [Google Scholar] [CrossRef]
  25. Xue, L.Q.; Zhang, Y.H.; Liu, Y.H. Comparative study on change characteristics of drought-flood abrupt alternation in arid and humid zones. Water Resour. Prot. 2024, 40, 1–8. [Google Scholar]
  26. Yang, Z.; Zhang, B.; Chen, J.; Hou, Y.; Wu, Y.; Xie, H. Characteristics of Spatial and Temporal Variation in Drought in the Sichuan Basin from 1963 to 2022. Sustainability 2024, 16, 8397. [Google Scholar] [CrossRef]
  27. Zhou, C.; Li, Y. Characteristics of Atmospheric Diabatic Heating of the Southwest China Vortex That Induces Extreme Rainstorms in Sichuan. Atmosphere 2024, 15, 861. [Google Scholar] [CrossRef]
  28. Wang, Y.G.; Lan, L.; Lei, S.; Wang, X.X.; Wang, X.K. Study on spatial-and-temporal characteristics of typical drought events in Sichuan Province. China Flood Drought Manag. 2023, 33, 22–26. [Google Scholar] [CrossRef]
  29. Wang, Z.; Liang, C.; Long, Y.D.; Zhan, C. Temporal and spatial distribution characteristics of drought in hilly region of central Sichuan based on SPEI. Yangtze River 2015, 46, 12–15+23. [Google Scholar] [CrossRef]
  30. Zheng, Y.; Dong, X.F.; He, J. Evolution characteristics of long-term drought and flood alternation in summer and analysis of the circulation influence in Sichuan Province from 1961 to 2017. Trans Atmos Sci 2021, 44, 355–362. [Google Scholar] [CrossRef]
  31. Gao, H.J.; Guo, M.H.; Liu, J.Y.; Liu, T.J.; He, S.J. Power Supply Challenges and Prospects in New Power System from Sichuan Electricity Curtailment Events Caused by High-temperature Drought Weather. Proc. CSEE 2023, 43, 4517–4538. [Google Scholar] [CrossRef]
  32. Xia, J.; Chen, J.; She, D.X. Impacts and countermeasures of extreme drought in the Yangtze River Basin in 2022. J. Hydraul. Eng. 2022, 53, 1143–1153. [Google Scholar] [CrossRef]
  33. Xu, J.J.; Yuan, Z. Drought Characteristics of Changjiang River Basin in 2022 and Drought Mitigation Response Pattern under New Circumstances. J. Chang. River Sci. Res. Inst. 2023, 40, 1–8. [Google Scholar]
  34. Tu, X.J.; Pang, W.N.; Chen, X.H.; Lin, K.R.; Liu, Z.Y. Limitations and improvement of the traditional assessment index for drought-wetness abrupt alternation. Adv. Water Sci. 2022, 33, 592–601. [Google Scholar] [CrossRef]
  35. Li, J. The Spatio-Temporal Variation and Formation Mechanism of Nocturnal Precipitation over the Sichuan Basin. Ph.D. Thesis, Nanjing University of Information Science and Technology, Nanjing, China, 2021. [Google Scholar]
  36. Li, X.H.; Liu, Z.T. Spatiotemporal change characteristics and future trends of extreme temperature events in Sichuan Basin. Res. Soil Water Conserv. 2023, 30, 264–273. [Google Scholar] [CrossRef]
  37. Tan, H.Z.; Lu, X.N.; Yang, S.Q.; Wang, Y.Q.; Li, F.; Liu, J.B.; Chen, J.; Huang, Y. Drought risk assessment in the coupled spatial-temporal dimension of the Sichuan Basin, China. Nat. Hazards 2022, 114, 3205–3233. [Google Scholar] [CrossRef]
  38. Chen, F.; Du, E.; Jia, H.; Chen, Y.; Wang, L. Lagged effects of atmospheric circulation teleconnections on agricultural drought prediction in China. Int. J. Digit. Earth 2025, 18, 2528628. [Google Scholar] [CrossRef]
  39. Matanó, A.; Berghuijs, W.R.; Mazzoleni, M.; de Ruiter, M.C.; Ward, P.J.; Van Loon, A.F. Compound and consecutive drought-flood events at a global scale. Environ. Res. Lett. 2024, 19, 064048. [Google Scholar] [CrossRef]
  40. Zhang, B.; Chen, Y.; Chen, X.; Gao, L.; Liu, M. Spatial-temporal variations of drought-flood abrupt alternation events in Southeast China. Water 2024, 16, 498. [Google Scholar] [CrossRef]
  41. Cao, Y.Q.; Lu, J.; Li, L.H. Analysis of multi-scale drought and flood characteristics in Liaoning Province based on SPEI. J. China Inst. Water Resour. Hydropower Res. 2021, 19, 210–220. [Google Scholar] [CrossRef]
  42. Cui, Y.Q.; Zhang, B.; Huang, H.; Zeng, J.J.; Wang, X.D.; Jiao, W.H. Spatiotemporal Characteristics of Drought in the North China Plain over the Past 58 Years. Atmosphere 2021, 12, 844. [Google Scholar] [CrossRef]
  43. Song, G.Y.; Zhou, C.B.; Fu, S.J. Analysis of drought characteristics and construction of prediction model in Chongqing based on SPEI index. Eng. J. Wuhan Univ. 2023, 56, 1458–1471. [Google Scholar] [CrossRef]
  44. Ionita, M.; Nagavciuc, V. Changes in drought features at the European level over the last 120 years. Nat. Hazards Earth Syst. Sci. 2021, 21, 1685–1701. [Google Scholar] [CrossRef]
  45. Peres, D.J.; Bonaccorso, B.; Palazzolo, N.; Cancelliere, A.; Mendicino, G.; Senatore, A. A dynamic approach for assessing climate change impacts on drought: An analysis in Southern Italy. Hydrol. Sci. J. 2023, 68, 1213–1228. [Google Scholar] [CrossRef]
  46. Zhang, Y.; You, Q.; Ullah, S.; Chen, C.; Shen, L.; Liu, Z. Substantial increase in abrupt shifts between drought and flood events in China based on observations and model simulations. Sci. Total Environ. 2023, 876, 162822. [Google Scholar] [CrossRef]
  47. GB/T 20481-2017; Grades of Meteorological Drought. China Meteorological Administration: Beijing, China, 2017.
  48. Zhang, Y.Q.; Xiang, Y.; Chen, C.C.; Wei, R.C. Research on spatial-temporal variation of drought and flood events over Ganjiang basin. J. Meteorol. Sci. 2015, 35, 346–352. [Google Scholar]
  49. Dykes, C.; Pearson, J.; Bending, G.; Abolfathi, S. Impact of seasonal climate variability on constructed wetland treatment efficiency. J. Water Process Eng. 2025, 72, 107350. [Google Scholar] [CrossRef]
  50. Cordova, M.; Orellana-Alvear, J.; Rollenbeck, R.; Célleri, R. Determination of climatic conditions related to precipitation anomalies in the Tropical Andes by means of the random forest algorithm and novel climate indices. Int. J. Climatol. 2022, 42, 5055–5072. [Google Scholar] [CrossRef]
  51. Mei, S.L.; Chen, S.F. Varation Characteristics Causes of Autumn Rain in Westem China. Plateau Meteorol. 2022, 41, 1492–1500. [Google Scholar]
  52. Chen, Z.; Li, X.; Zhang, X.; Xu, L.; Du, W.; Wu, L.; Wang, D.; Zhang, Y.; Chen, N. Global drought-flood abrupt alternation: Spatio-temporal patterns, drivers, and projections. Innov. Geosci. 2025, 3, 100113. [Google Scholar] [CrossRef]
  53. Vicente-Serrano, S.M.; Beguería, S.; López-Moreno, J.I. A Multiscalar Drought Index Sensitive to Global Warming: The Standardized Precipitation Evapotranspiration Index. J. Clim. 2010, 23, 1696–1718. [Google Scholar] [CrossRef]
  54. Shi, W.; Huang, S.; Liu, D.; Huang, Q.; Han, Z.; Leng, G.; Wang, H.; Liang, H.; Li, P.; Wei, X. Drought-flood abrupt alternation dynamics and their potential driving forces in a changing environment. J. Hydrol. 2021, 597, 126179. [Google Scholar] [CrossRef]
  55. Zhao, D.S.; Zhang, J.C.; Deng, S.Q.; Guo, C.Y. Spatio-temporal characteristics of drought-flood abrupt alternation in Southwest China from 1960 to 2018. Sci. Geogr. Sin. 2021, 41, 2222–2231. [Google Scholar] [CrossRef]
Figure 1. Research region.
Atmosphere 17 00412 g001
Figure 2. Schematic diagram for DFAA identification. DF (red rectangles) represents DF events, and FD (yellow rectangles) represents FD events. Consecutive DF and FD events are identified as two independent events.
Atmosphere 17 00412 g002
Figure 3. Trends in frequency and intensity of (a) DF and (b) FD events from 1963 to 2022. The frequency of DF/FD events in Figure is defined as the station-averaged annual occurrence number. The linear trend is expressed as events per decade (events/decade) to reflect the long-term change rate.
Atmosphere 17 00412 g003
Figure 4. Interannual variations in the frequency of DFAA events of different grades from 1963 to 2022. Rows represent changes in different DFAA grades, and columns represent changes in different types of DFAA events.
Atmosphere 17 00412 g004
Figure 5. Trends in frequency and DFAAMI of DF and FD events. Spring (a,b), summer (c,d), autumn (e,f), winter (g,h).
Atmosphere 17 00412 g005
Figure 6. Periodic variations in the DFAAMI (a) and wavelet variance plot (b) in the Sichuan Basin from 1963 to 2022.
Atmosphere 17 00412 g006
Figure 7. Seasonal periodic variations in DFAAMI (a,c,e,g) and wavelet variance plots (b,d,f,h) in the Sichuan Basin from 1963 to 2022.
Atmosphere 17 00412 g007aAtmosphere 17 00412 g007b
Figure 8. Multi-year average spatial distribution of DFAAMI (a) and total cumulative frequency of DFAA (b), DF (c), and FD (d) events in the Sichuan Basin.
Atmosphere 17 00412 g008
Figure 9. Spatial distribution of DFAA events of various levels from 1963 to 2022. Columns represent DF and FD events; rows represent events of different grades ((a,b) mild, (c,d) moderate, (e,f) severe, and (g,h) extreme).
Atmosphere 17 00412 g009
Figure 10. Spatial distribution of DFAA events from 1963 to 2022. Columns represent DF and FD events; rows represent events ((a,b) spring, (c,d) summer, (e,f) autumn, and (g,h) winter).
Atmosphere 17 00412 g010
Figure 11. Relative contribution of each factor to DF (a) and FD (b) events at different time scales.
Atmosphere 17 00412 g011
Table 1. Meteorological and Circulation factors.
Factor
Properties
Driving FactorAbbreviation
Meteorological factorprecipitationPRE
temperatureTEM
wind speedWIN
sunshine hoursSSH
Relative humidityRHU
Circulation
factor
Western Pacific Warm Pool Strength indexWPWPSI
NINO A region sea surface temperature anomaly indexNINO A
NINO B region sea surface temperature anomaly indexNINO B
Western Pacific Subtropical High Intensity IndexWPSHII
South China Sea Subtropical High Intensity IndexSCSSHII
Asian Zonal Circulation IndexAZCI
Asian Meridional Circulation IndexAMCI
East Asian Trough Intensity IndexEATII
Tibet Plateau Region IndexTPRI
Arctic OscillationAO
Table 2. Classification standard of DFAAMI.
GradeDFFD
NormalDFMI < 0.5FDMI > −0.5
Mild0.5 ≤ DFMI < 1−1 < FDMI ≤ −0.5
Moderate1 ≤ DFMII ≤ 1.5−1.5 < FDMII ≤ −1
Severe1.5 ≤ DFMI < 2−2 < FDMI ≤ −1.5
ExtremeDFMI ≥ 2FDMI ≤ −2
Table 3. Pearson correlation coefficients between each driving factor and DFMI and FDMI.
Driving FactorDFMIFDMI
M0M-1M-2M-3M0M-1M-2M-3
PRE0.0190.120 *0.0760.0900.122 *0.0410.0440.003
TEM0.140 **0.115 *0.112 *0.0710.0410.0630.0560.019
WIN0.111 *0.113 *0.110 *0.148 **0.0500.0290.0640.015
SSH0.217 **0.0810.162 **0.116 *−0.1030.0480.0700.064
RHU−0.132 *−0.003−0.078−0.0710.128 *−0.021−0.062−0.061
WPWPSI0.152 **0.135 *0.0870.0670.109 *0.133 *0.108 *0.089
NINO A0.0960.0660.124 *0.117 *0.0650.0110.0440.010
NINO B0.117 *0.109 *0.0860.0860.122 *0.108 *0.120 *0.121 *
WPSHII0.168 **0.1030.0680.0880.129 *0.125 *0.168 **0.103
SCSSHII0.0980.0570.0120.0490.0380.0240.0860.126 *
AZCI0.035−0.0560.018−0.045−0.026−0.076−0.0830.001
AMCI−0.067−0.013−0.075−0.0630.108 *−0.056−0.019−0.078
EATII0.0970.124 *0.1010.0450.0760.0700.040−0.003
TPRI0.152 **0.122 *0.105 *0.0410.0530.0580.0370.020
AO0.007−0.0280.009−0.044−0.040−0.061−0.018−0.005
* p < 0.05, ** p < 0.01.
Disclaimer/Publisher’s Note: The statements, opinions and data contained in all publications are solely those of the individual author(s) and contributor(s) and not of MDPI and/or the editor(s). MDPI and/or the editor(s) disclaim responsibility for any injury to people or property resulting from any ideas, methods, instructions or products referred to in the content.