Article

Terrestrial Net Ecosystem Productivity on the Tibetan Plateau: Characteristics, Climate Drivers and Future Changes


1
Observation and Research Station of Gas Hydrate and Permafrost Environment in Muli Town (Qinghai Province), Ministry of Natural Resources, Beijing 100083, China
2
School of Civil Engineering and Water Resources, Qinghai University, Xining 810016, China
3
Oil and Gas Survey, China Geological Survey, Beijing 100083, China
*
Author to whom correspondence should be addressed.
Atmosphere 2026, 17(3), 317; https://doi.org/10.3390/atmos17030317
Submission received: 30 January 2026 / Revised: 14 March 2026 / Accepted: 15 March 2026 / Published: 19 March 2026

Abstract

Variations in terrestrial carbon flux influence atmospheric CO2 exchange and related climate feedback, with Net ecosystem productivity (NEP) serving as a key metric for assessing ecosystem carbon source–sink dynamics. Given the vital ecological barrier function of the Tibetan Plateau (TP), understanding the spatiotemporal variability of NEP and its climatic controls is essential for elucidating carbon sink and climate interactions under ongoing climate change. The spatiotemporal dynamics of NEP across the TP from 1979 to 2018 are investigated using the process-based Community Land Model version 5.0 (CLM5.0). And climate sensitivity experiments are conducted to quantify the relative contributions of different climate factors to NEP variability. Furthermore, future changes in NEP for the period 2025–2100 under multiple Shared Socioeconomic Pathway (SSP) scenarios are projected. The results indicate that the TP functioned predominantly as a net carbon sink during the historical period, with a multi-year mean NEP of 23.96 g C m2 yr−1. Spatially, NEP showed a significantly increasing gradient from the northwest to the southeast. During 1979–2018, NEP exhibited an overall decreasing trend across most regions of the TP. Air temperature was identified as the dominant controlling factor, accounting for approximately 68% of the interannual NEP variability, followed by solar radiation (21%) and precipitation (11%). The dominant climatic drivers of NEP variation differ among regions: air temperature predominates in the southwestern and southeastern regions, radiation dominates in the northwestern and central areas, and precipitation exerts a controlling effect in the northern and western regions. Future projections suggest that NEP remains positive under all SSP scenarios, indicating that the TP is likely to persist as a carbon sink throughout the 21st century. This study provides important reference for the development of ecological protection, restoration planning, and regional carbon neutrality strategies.

1. Introduction

Terrestrial ecosystems constitute a key component of the global carbon cycle, offsetting approximately 25–30% of anthropogenic carbon dioxide(CO2) emissions [1]. Thus, they play a vital role in regulating atmospheric CO2 concentration and maintaining climate stability [2,3,4]. Net ecosystem productivity (NEP) directly reflects the net CO2 uptake or release between terrestrial ecosystems and the atmosphere and serves as a key indicator for evaluating ecosystem carbon source–sink functions [5,6,7]. As an important component of the terrestrial ecosystem [8], high-altitude ecosystems store approximately 25% of soil organic carbon. These regions are highly sensitive to climate change, with a warming rate approximately twice the global average [9,10]. Previous studies have shown that high-altitude ecosystems have significant carbon sink characteristics, but the spatial distribution patterns of carbon sinks vary greatly [11,12]. Climate change, land-use change, and vegetation change can all alter the spatial distribution of carbon sink [13,14,15]. In recent decades, climate change has exacerbated the uncertainty of carbon source/sink trends in high-altitude ecosystems, thereby affecting the accurate prediction of future climate change [16]. Therefore, the estimation, spatiotemporal evolution of the NEP, and the driving factors of NEP changes in high-altitude ecosystems have become hot topics in global change research [6,17].
Climate change is a key driver of changes in carbon flux in high-altitude ecosystems. Temperature regulates Gross Primary Productivity (GPP) and NEP by influencing photosynthetic rates and associated carbon inputs to the vegetation–soil system [18,19]. Precipitation enhances photosynthetic efficiency by increasing soil moisture content and stomatal conductivity, thereby increasing ecosystem productivity [20]. Solar shortwave radiation determines the upper limit of plant photosynthesis and thus constrains ecosystem carbon uptake capacity [21]. Despite these established mechanisms, the relationships between climatic factors and NEP remain complex and, in some cases, inconsistent. Temperature is generally considered a positive driver of NEP at the global scale [22], evidence from regional studies indicates that this relationship is not always consistent and may vary over time [23]. Precipitation also exerts complex influences on ecosystem productivity. In water-limited systems, increased precipitation usually promotes an increase in NEP [24]. However, in wet environments, NEP is inhibited by increased precipitation [25]. Beyond single-factor effects, the interaction among climatic variables adds significant complexity to ecosystem carbon dynamics [26]. For instance, the synergy between rising temperature and precipitation can stimulate productivity, yet this positive effect is vulnerable to physiological limits or ecological thresholds [27]. Precipitation-induced increases in cloud cover can reduce incoming solar radiation, thereby constraining photosynthetic carbon assimilation [28]. Therefore, systematically quantifying the relative contributions and interactions of various climate drivers not only helps improve the accuracy of NEP predictions but also identifies potential key climate thresholds, providing a scientific basis for determining the critical thresholds under which ecosystem carbon source-sink functions may abruptly change [10,29].
Climate warming has accelerated glacial retreat and permafrost degradation in high-altitude ecosystems [30]. Continued warming may trigger the melting of permafrost, releasing large amounts of carbon, thereby offsetting regional carbon sink capacity and potentially causing these ecosystems to transform from carbon sinks into carbon sources [31,32], making the future trajectory of ecosystem carbon balance highly uncertain. Therefore, the spatiotemporal changes in the carbon cycle of high-altitude ecosystems in the future have attracted widespread attention. Previous studies have yielded inconsistent predictions of productivity in the high-altitude ecosystems. For example, the GPP of the Tibetan Plateau shows an increasing trend based on simulations with the IBIS model under multiple Shared Socioeconomic Pathway (SSP) scenarios [33]. Through the CASA model, the net primary productivity (NPP) of alpine meadows in the Three-River-Source region would follow a slow growth trajectory [34]. In contrast, Yang et al. employed an ecosystem model driven by CMIP predictions and found that NPP exhibits a pronounced increasing trend under high emission scenarios, whereas the increase in NPP is much weaker or even negative under low-emission scenarios [35]. Similarly, other studies have shown that NPP in alpine grasslands may decrease under the SSP2–4.5 scenario, but may increase under the SSP5–8.5 scenario [36]. In addition to model differences, remote sensing-derived GPP products (such as VPM and GOSIF) exhibit systematic biases when applied to high-altitude ecosystems [37]. This uncertainty mainly stems from differences in model structure, driving datasets, and scenario assumptions, which may lead to significant discrepancies in simulated carbon flux responses under future climate conditions.
Advances in modeling and observation techniques have provided a variety of strategies for estimating NEP [38,39,40]. Field-based observations can provide direct and accurate measurement data, but they are often constrained by high costs and the need for extensive spatiotemporal monitoring [41]. Process-based models combine plant physiological processes with environmental drivers, enabling the simulation of ecosystem functions and interactions between vegetation and meteorological conditions, as well as the simulation of historical and future scenarios [42]. However, their application to high-altitude ecosystems has often been hindered by biases, primarily due to insufficient simulation of permafrost dynamics, soil physics, and alpine vegetation characteristics. For example, remote sensing-based models (such as CASA) rely on static vegetation-climate relationships and fail to capture the dynamic response of vegetation to rapid warming [43,44]. Similarly, early process-based models (such as TEM and CLM4.0) were often limited by simplified soil freeze–thaw schemes and generic parameters, leading to an overestimation of ecosystem respiration and an underestimation of soil temperature in colder regions [45,46,47]. In contrast, the Community Land Model version 5.0 (CLM5.0) effectively addresses these limitations by incorporating a vertically resolved soil biogeochemical module, improved snow and soil hydrology parameterizations [48], and updated photosynthetic parameters (e.g., Vcmax) specifically for alpine vegetation [49]. These improvements enable more accurate simulations of the effects of soil thermodynamics, active layer thickness, and temperature on phenology [50,51,52]. Validation against MODIS GPP and field observations demonstrates that CLM5.0 reliably reproduces GPP and NPP patterns across the Tibetan Plateau (TP) [53,54,55,56]. By coupling soil thermodynamics with carbon cycling and plant physiological mechanisms, CLM5.0 offers a robust framework for quantifying the contribution of climate drivers to NEP in high-altitude ecosystems [57,58,59], such as the TP.
The TP has an elevation of over 4000 m in most areas, making it the world’s largest high-altitude ecosystem [60]. It is characterized by fragile ecosystems and high sensitivity to climate change [61]. As a major ecological and climatic security barrier for Asia, the TP plays a crucial role in regulating regional carbon cycling and maintaining climate stability [62,63,64]. Despite that, limited research has focused on the response of the NEP in TP to climate change during the early 21st century, and existing research results remain somewhat divergent. Du et al. [65] report that the NEP of grasslands on the TP during the growing season is positively correlated with temperature in most areas. Guo et al. [66] believe that grassland NEP is most strongly correlated with precipitation. According to the research results of Hu et al. [67] in the alpine meadows of the TP, the main driving factor of GPP and NEP was temperature before 2010; thereafter, the influence of precipitation has become increasingly important, and the positive impact of temperature on carbon absorption has weakened in recent decades. These contrasting results suggest that the dominant controls on NEP may not remain constant but may evolve under ongoing climate change, leading to shifts in the spatial distribution and strength of regional carbon sinks. Moreover, existing studies on future carbon fluxes in the TP have primarily focused on vegetation NPP [54,68,69], while the magnitude, trajectory, and potential tipping points of future NEP have yet to be systematically quantified.
Consequently, this study centers on the TP to test two core hypotheses: (1) temperature dominates the spatiotemporal variability of NEP on the TP, and (2) under future climate scenarios, the carbon sink function of the TP will likely exhibit a saturation trend rather than maintaining a linear increase. By answering the above questions, this study aims to: (1) reconstruct the spatiotemporal dynamics of NEP from 1979 to 2018; (2) quantify the relative contribution of meteorological factors to NEP changes using sensitivity experiments and partial correlation analysis; (3) predict the future changes of carbon source and sink patterns under different climate scenarios and assess the regional carbon sink capacity under different emission pathways. By clarifying the NEP trajectory, this research deepens the understanding of climate impacts on carbon cycling in high-altitude regions.

2. Materials and Methods

2.1. Study Area

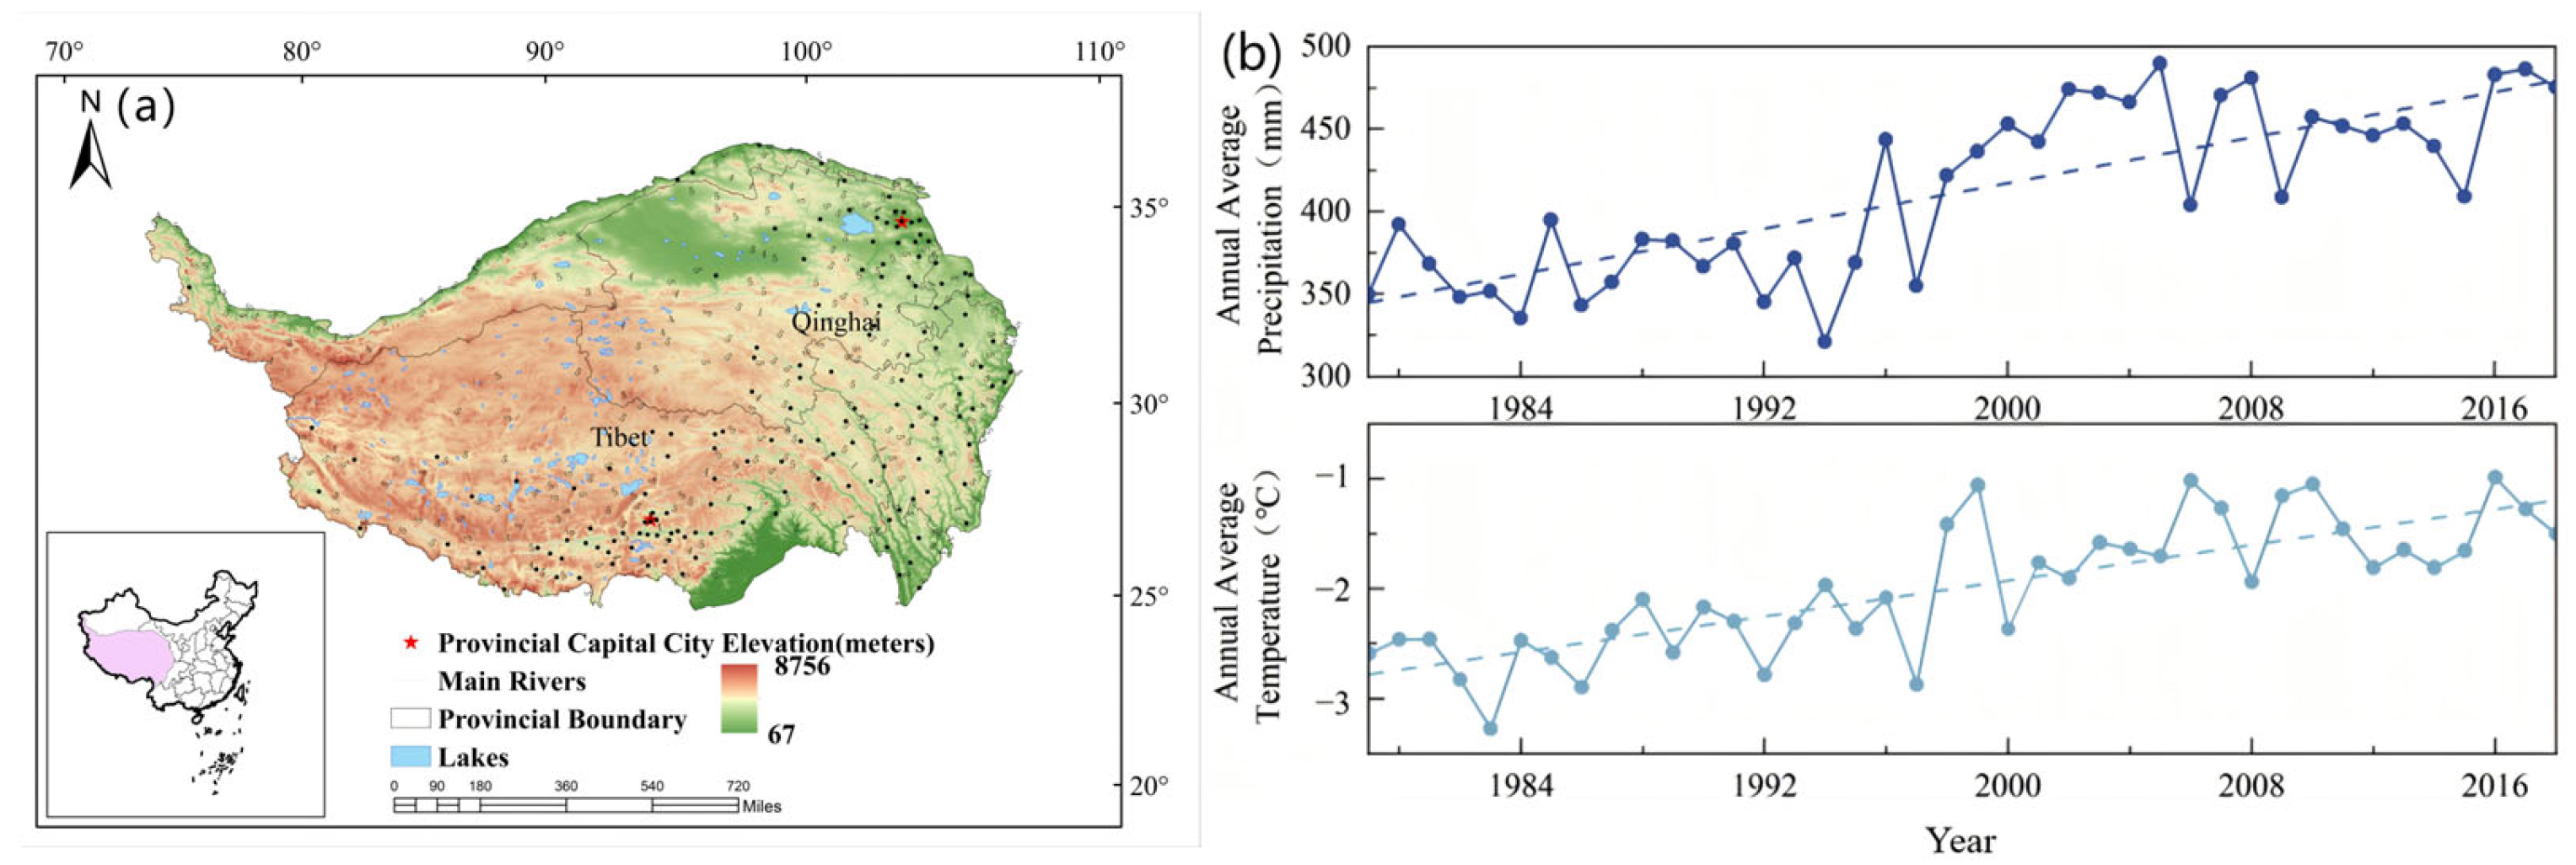
The TP occupies southwestern China (26°00′–39°47′ N, 73°19′–104°47′ E). Covering about 2.5 million km2, it spans the whole Tibet Autonomous Region and Qinghai Province, as well as adjacent parts of Sichuan, Yunnan, Gansu, and Xinjiang (Figure 1a). Most areas of the plateau are located at elevations above 4000 m above sea level. This extensive high-elevation terrain makes it the largest alpine region globally [60]. More than 60% of the plateau is characterized by grassland vegetation, whereas forested areas are concentrated in the relatively humid southeastern sector [70]. The TP is mainly characterized by a tundra climate (ET), with an annual mean temperature of approximately −1.43 °C. From 1979 to 2018, the annual mean temperature increased significantly at a rate of about 0.04 °C yr−1 (p < 0.01) [71]. Mean annual precipitation across the plateau is approximately 412 mm, and a significant increasing trend was observed during the same period, with an average increase of 3.45 mm yr−1 (p < 0.01) [71]. The TP contains the largest extent of permafrost in China, covering approximately 1.07·106 km2, which accounts for nearly 70% of the national permafrost area [72]. Based on these environmental characteristics, multiple climate and land surface datasets were compiled to drive the model simulations.

2.2. Date

Meteorological data was derived from the China Meteorological Forcing Dataset (CMFD), maintained by the National Tibet Plateau Science Data Center [71]. The dataset covers 1979–2018 at 0.1° spatial resolution and 3-hourly temporal frequency. It consists of near-surface air temperature (2 m), near-surface specific humidity, surface air pressure, wind speed at 10 m, downward shortwave and precipitation rate, and long wave radiation [73]. We used these datasets to force the land surface model in order to simulate ecosystem carbon dynamics.

2.3. Model Description

Land surface models simulate the exchanges of energy, water, and carbon at the terrestrial interface. They describes the coupling between land processes and the atmosphere–ocean system [74]. The CLM, developed by the National Center for Atmospheric Research (NCAR) in the United States, evolved from the Common Land Model (CoLM). The CoLM was originally developed based on earlier models such as BATS and LSM.
The biogeochemical (BGC) framework of CLM5.0 is used to simulate carbon cycle processes. It includes autotrophic respiration, photosynthesis, litter formation, carbon allocation, carbon–nitrogen interactions, and soil organic matter decomposition [75]. Compared with CLM4.5, CLM5.0 introduces substantial updates in process representation and parameterization, including improvements in soil structure, vegetation hydrology, snow density, C–N coupling, crop dynamics, and land-use processes [76]. In the hydrological component, CLM5.0 incorporates a soil evaporation resistance scheme for dry surface layers, enhancing evapotranspiration simulations. The model also increases vertical soil resolution, extending soil depth to 3 m with additional soil layers, thereby improving the representation of active layer thickness in permafrost regions [48]. In terms of plant physiology, the Ball–Berry stomatal conductance formulation has been replaced by the Medlyn scheme [77], allowing a more mechanistic representation of stomatal behavior and plant hydraulic stress. In CLM5.0, several new modules have been incorporated into the simulation of carbon and nitrogen dynamics. These include the nitrogen fixation and uptake (FUN) framework, the FLEXIBLECN scheme for dynamic carbon-to-nitrogen ratios, and the LUNA method for optimizing photosynthetic nitrogen input in leaves [78,79]. These developments strengthen nitrogen feedback representation and improve model responsiveness to environmental change. Furthermore, CLM5.0 refines the simulation of permafrost thermal and hydrological processes [80], enhancing soil temperature and soil moisture dynamics. These improvements make the model particularly suitable for applications in cold and permafrost-dominated regions.
The BGC module in CLM5.0 simulates ecosystem carbon fluxes. Under this framework, NEP is defined as NPP minus heterotrophic respiration ( R h ). The model framework and parameter schemes is available in Lawrence et al. [48].
NPP represents the amount of carbon fixed by photosynthesis that is available for ecosystem growth and heterotrophic consumption. Annual NPP is calculated as:
N P P = G P P R m R g
where R m is defined as the respiration required for plant maintenance, and R g is defined as the respiration associated with plant growth.
GPP is calculated on a daily basis as
G P P = P E T C o h o r t T i m e ( A n + R d ) × L A I × f s t r e s s
In this formulation, GPP represents the total carbon assimilated through photosynthesis at the ecosystem scale. A n refers to the net photosynthetic rate, R d is dark respiration rate, LAI signifies leaf area index, f s t r e s s is stress factors such as temperature and water availability.
NEP quantifies the net carbon gain and is obtained as NPP minus heterotrophic (soil) respiration [81]:
N E P = N P P R h
Heterotrophic respiration ( R h ) is calculated as the sum of decomposition fluxes from multiple soil carbon pools following a CENTURY-based soil biogeochemical framework [48]:
R h = i = 1 n k i C i f T f W f O f D
where k i is the corresponding base decomposition rate, C i is the carbon content of the i-th soil carbon pool, The decomposition rate is modified by environmental scalars, including temperature ( f T ), soil moisture ( f W ), oxygen limitation ( f O ), and depth-dependent attenuation ( f D ).
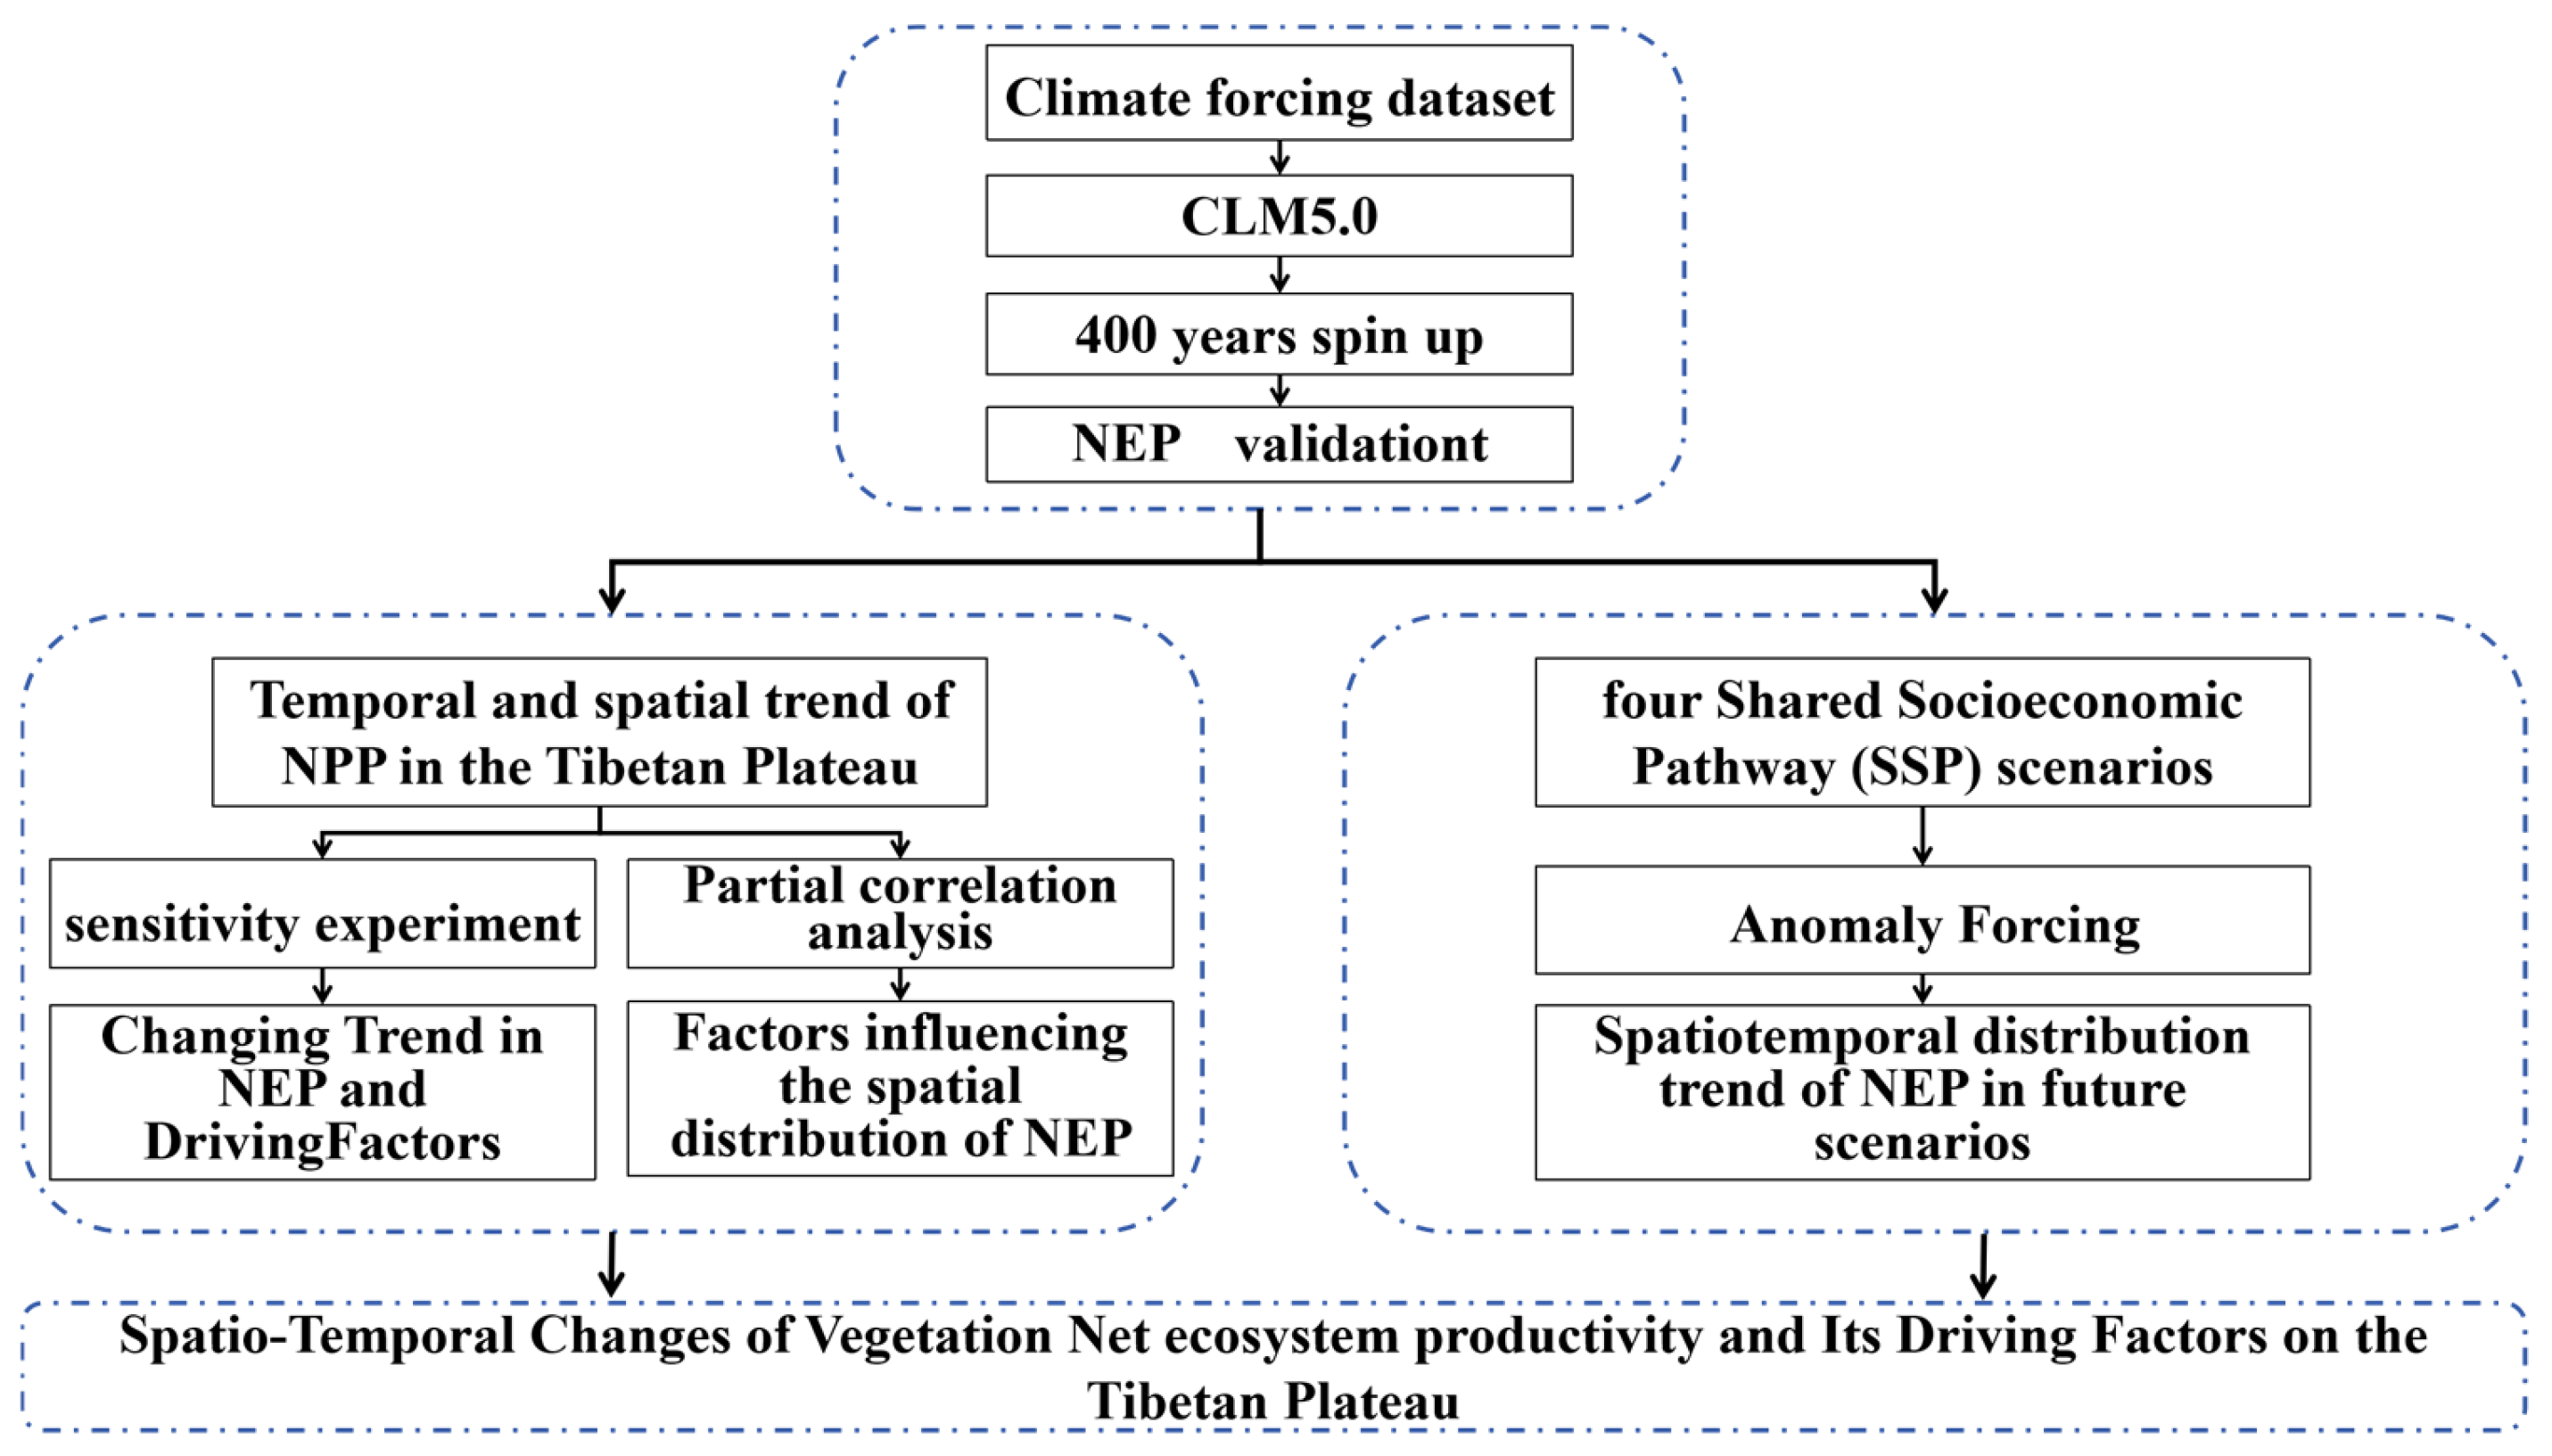
This study employed the CLM5.0 to simulate NEP over the TP for the period 1979–2018. Because terrestrial carbon cycle simulations require balanced initial carbon pools and fluxes, a spin-up procedure was conducted prior to the simulation to minimize the influence of initial conditions [82]. The model was spin-up for 400 years using CMFD forcing until key state variables (soil moisture, soil temperature, sensible heat flux, and latent heat flux) approached quasi-equilibrium conditions [83]. Following spin-up, a 40-year simulation was performed, and the output from 1979 to 2018 was used for subsequent analysis. The model was configured at 0.1° spatial resolution with outputs generated at 3 h intervals.
The CLM requires high-temporal-resolution, multivariate atmospheric forcing to simulate land–atmosphere interactions. However, future climate projections from the Coupled Model Intercomparison Project Phase 6 (CMIP6) are generally available at coarser temporal resolution and do not directly satisfy the requirements of CLM. To address this limitation, NCAR introduced the “Anomaly Forcing” approach in CLM version 4.5, which can predict future climate without requiring high-resolution, multivariate datasets [84]. This method superimposes scenario-based monthly anomalies derived from CMIP6 outputs onto a repeated historical dataset, thereby generating modified atmospheric dataset for driving CLM simulations under future climate conditions [48]. In this study, the CMFD dataset combined with anomaly forcing was applied to simulate NEP over the TP during 2025–2100 under four Shared Socioeconomic Pathway (SSP) scenarios (SSP1–2.6, SSP2–4.5, SSP3–7.0, and SSP5–8.5). To quantify the influence of individual climatic variables on NEP, a series of sensitivity experiments were performed. The workflow is summarized in Figure 2.

2.4. Experimental Design and Analytical Methods

We conducted a series of sensitivity experiments to disentangle the impacts of key climatic drivers—precipitation, air temperature, and solar radiation—on NEP (Table 1). The control experiment (S1) was driven by observational climate forcing data for the period 1979–2018. Three additional sensitivity experiments (S2–S4) were designed by holding one climatic variable constant at its long-term mean (1979–2018), while allowing the remaining variables to vary temporally as in the control simulation. In experiment S2, the temporal variation in air temperature was suppressed by prescribing its multi-year mean value, while other forcing variables followed the original observations. In experiment S3, precipitation was set to a constant value equal to its long-term mean. Solar radiation was treated in the same manner in experiment S4 and kept at its climatological mean during the simulation.
We estimated how temperature, precipitation, and radiation individually influence NEP by contrasting the control simulation with the sensitivity runs (S2–S4). NEP trends were calculated for each simulation using ordinary least squares regression. The contribution of a given climate factor was then determined by taking the difference between the trend in the control run and that in the experiment where the factor was held constant.

2.5. Partial Correlation Analysis

Partial correlation analysis isolates the association between two variables by excluding the confounding effects of others [85]. The partial correlation coefficient between x 1 and x 2 must be adjusted for the third variable y:
We applied partial correlation analysis to determine the relationship between NEP and each climate factor while keeping other factors constant. This approach enables the identification of the dominant climatic drivers of NEP at different spatial locations by isolating the independent contribution of each factor. The partial correlation coefficient between variables x 1 and x 2 , controlling for variable y, is calculated as:
r x 1 x 2 · y = r 1 x 2 r x 1 y r x 2 y ( 1 r x 1 y 2 ) ( 1 r x 2 y 2 )

3. Results

The following sections present the spatiotemporal characteristics of NEP across the TP, followed by analyses of its climatic sensitivities and future projections. According to previous research, ecosystems are typically classified as carbon sinks when NEP values are positive, whereas negative NEP values indicate carbon source behavior [44]. In non-forest ecosystems, areas with NEP ≥ 50 g C m2 yr−1 are classified as strong carbon sinks, while those with 0 ≤ NEP < 50 g C m2 yr−1 are classified as weak carbon sinks [86].

3.1. Spatial Distribution and Variations in NEP

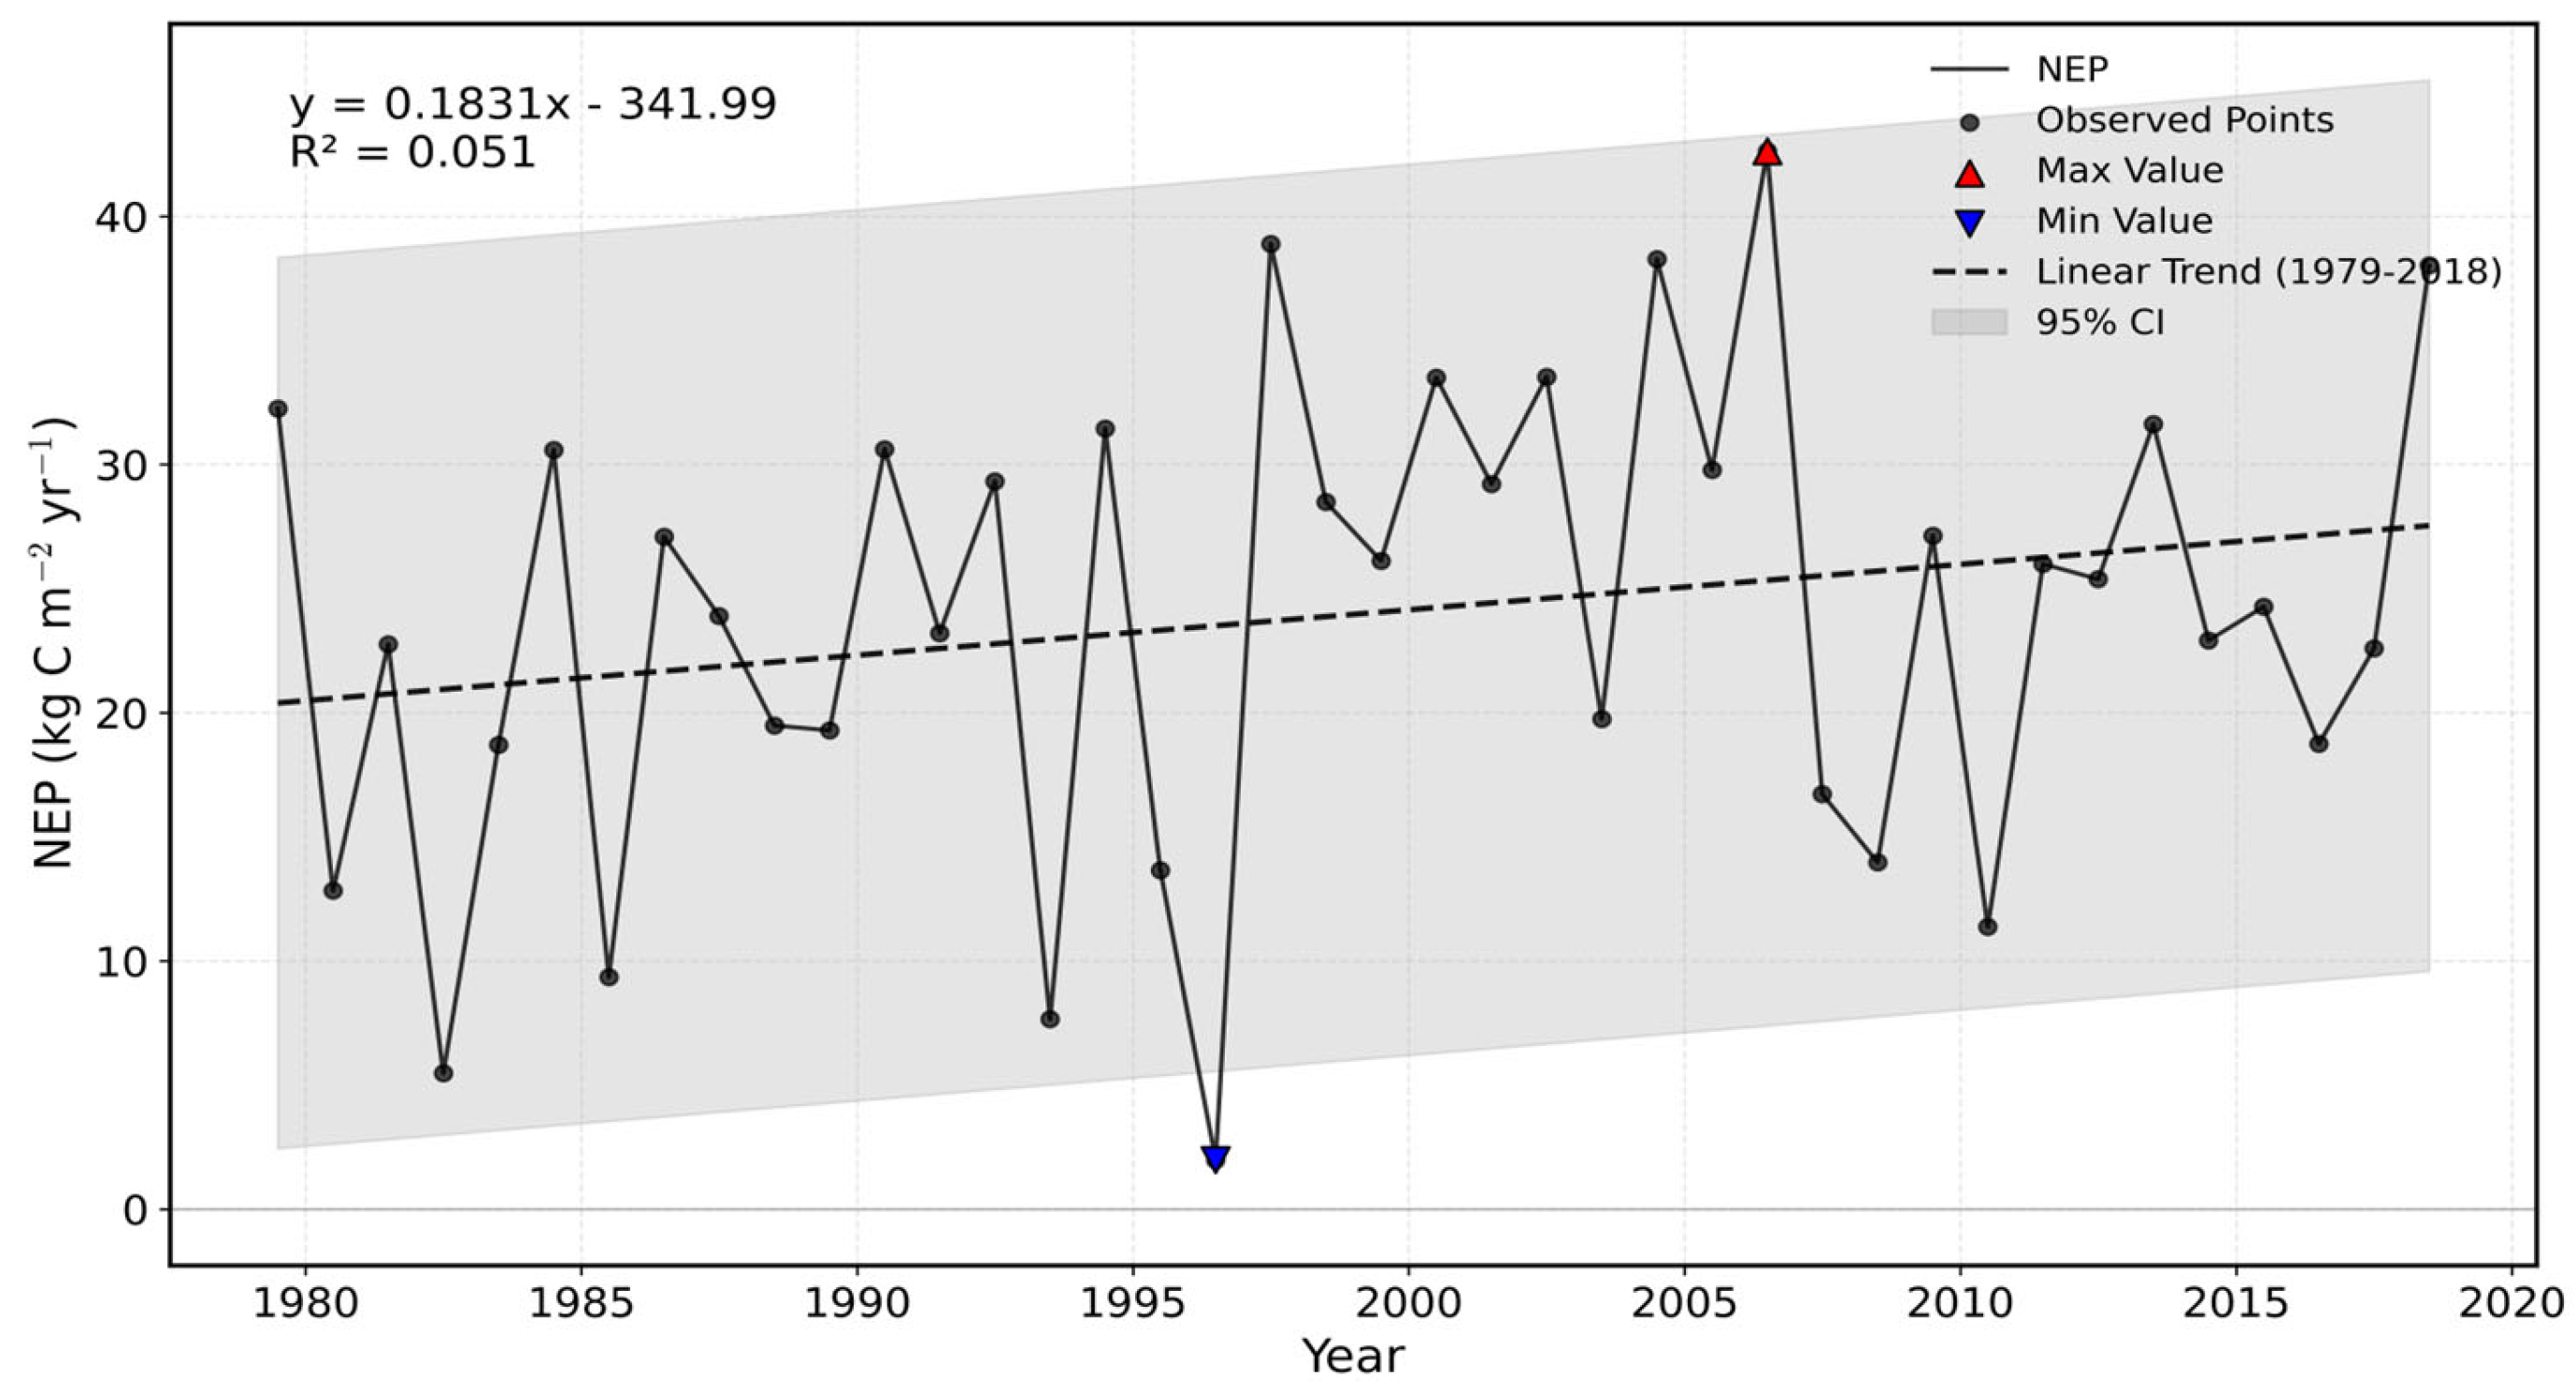
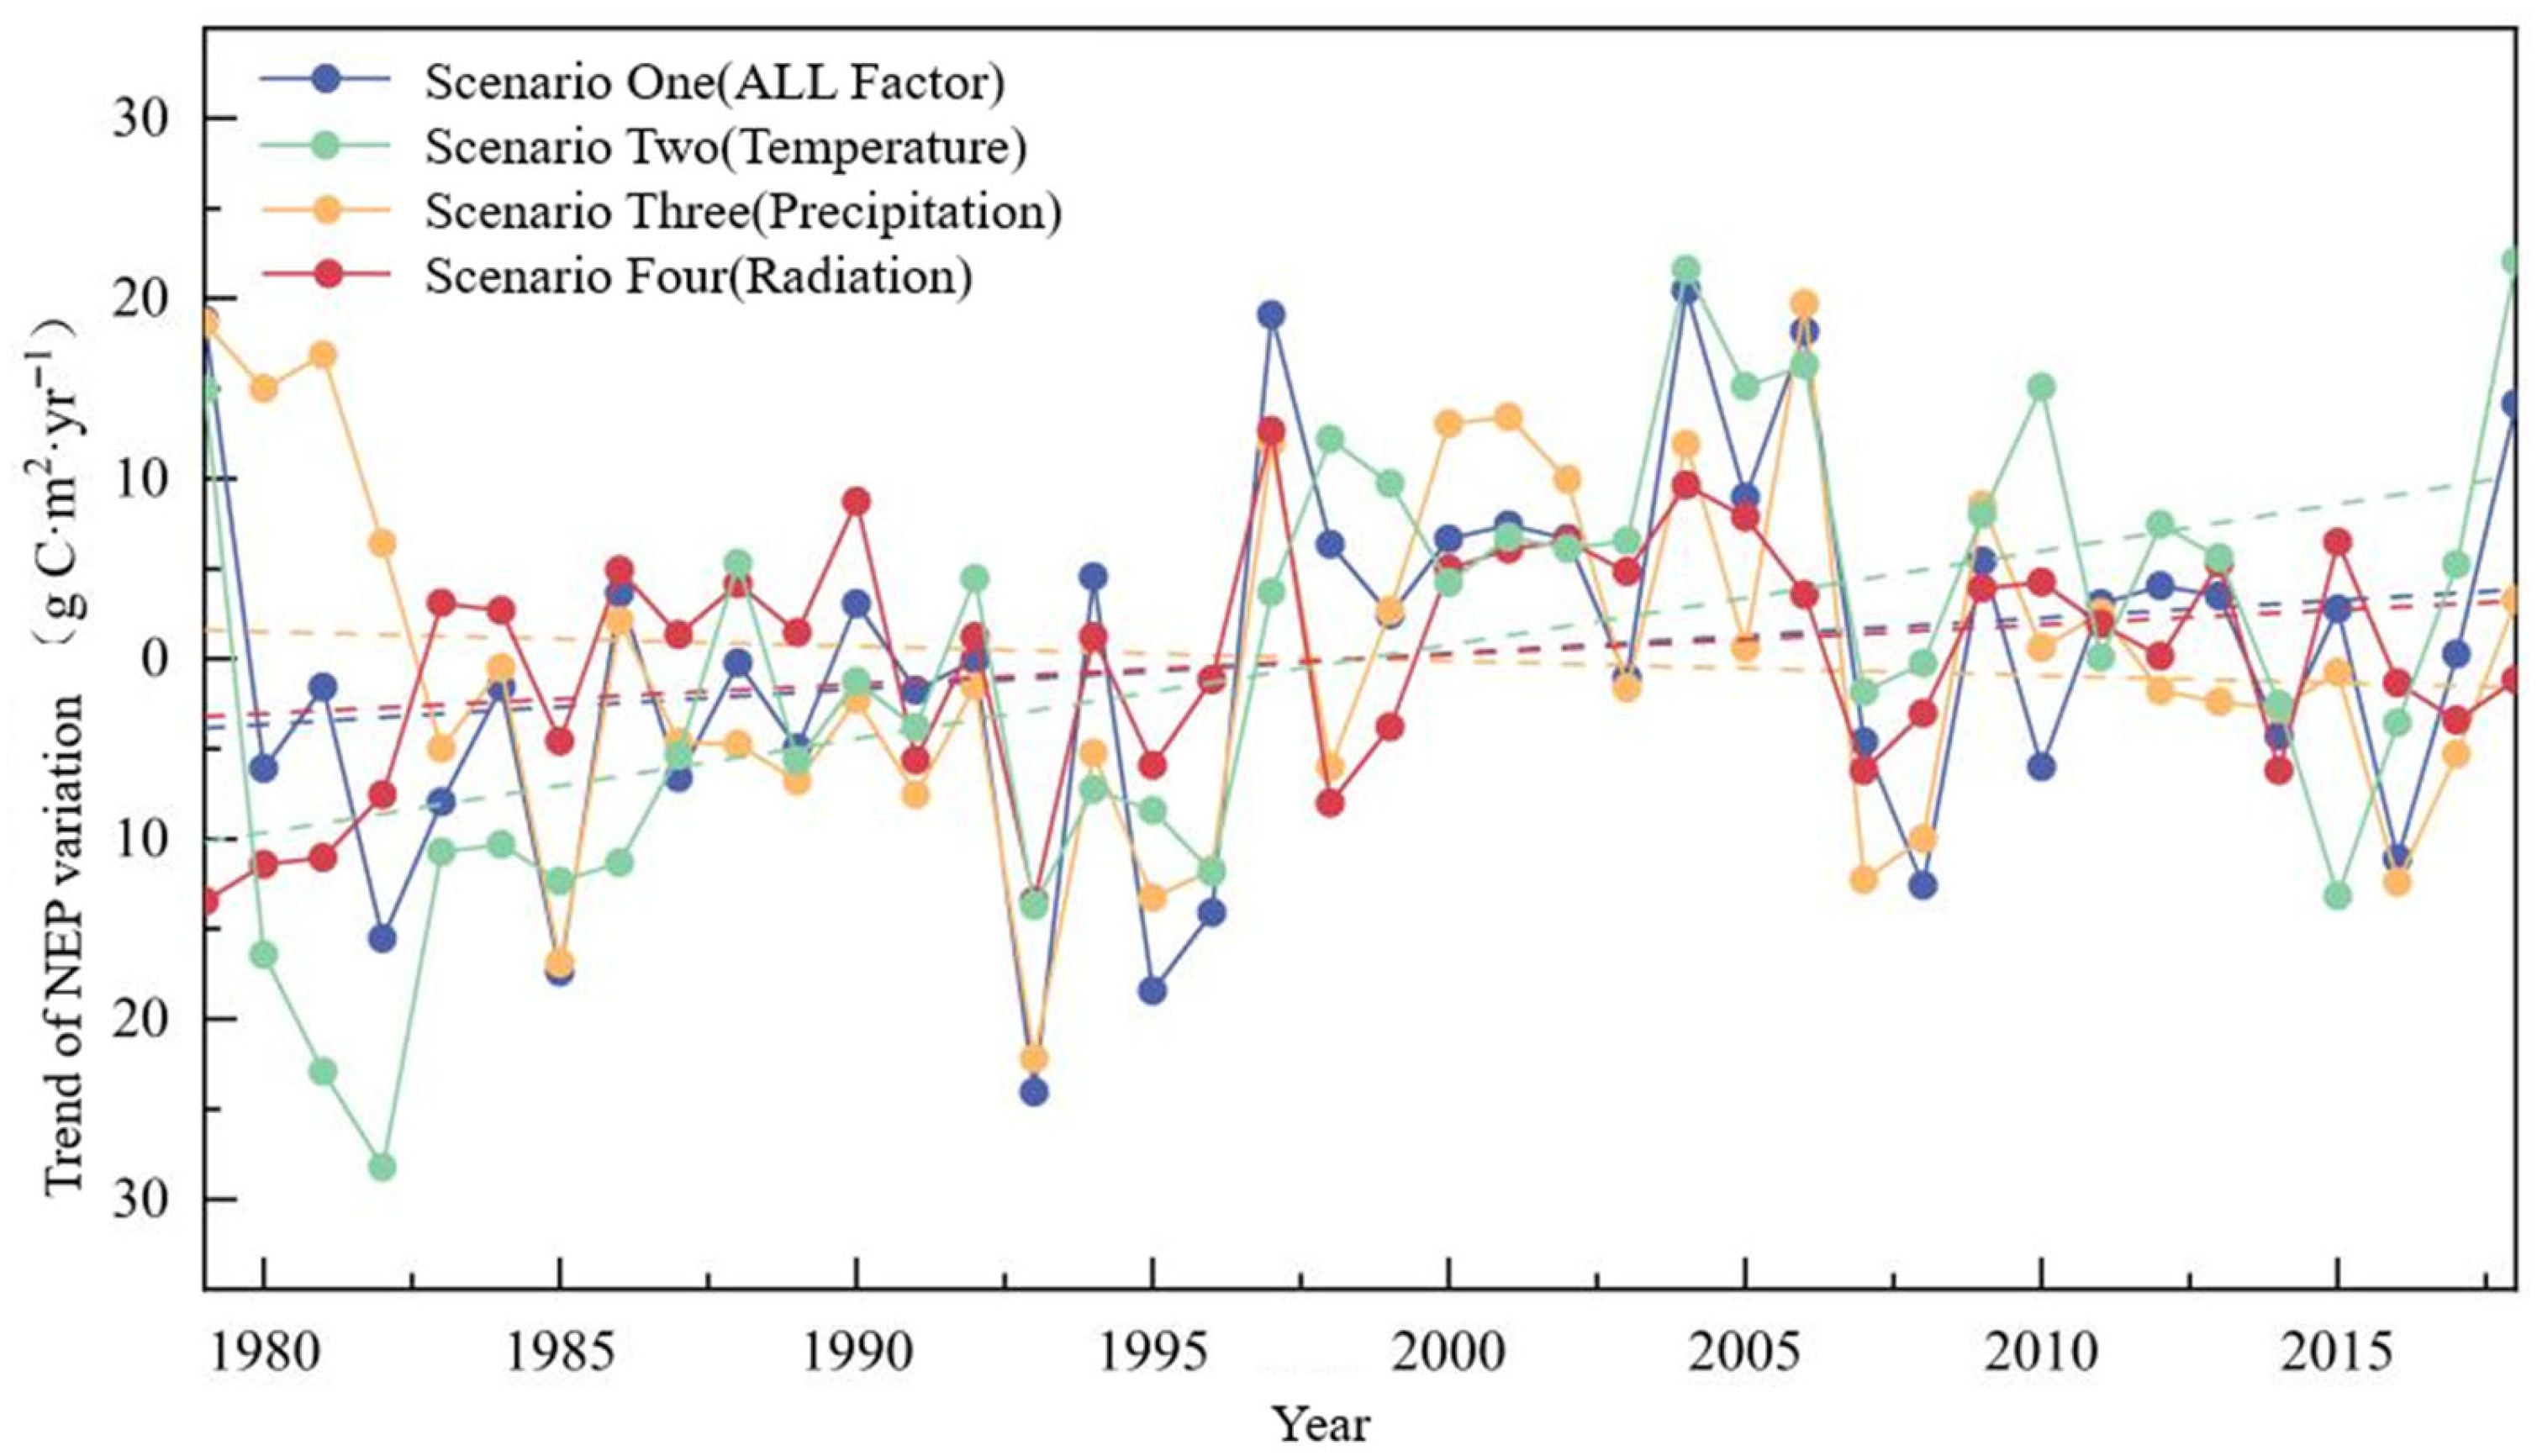
Figure 3 illustrates the temporal variation in NEP over the TP from 1979 to 2018. The multi-year mean NEP during this period was 23.96 g C m2 yr−1, exhibiting an increasing trend at a rate of 0.2 g C m2 yr−1. This result indicates that the TP functioned as a net carbon sink over the past four decades, with a slightly enhanced carbon sequestration capacity. NEP reached its maximum value of 42.61 g C m2 yr−1 in 2006 and its minimum value in 1996. During the study period, NEP on the TP increased from 18.95 g C m2 yr−1 in the 1980s to 24.54 g C m2 yr−1 in the 2010s, representing a growth of approximately 29.5% (Table 2). NEP increased by 4.19 and 5.31 g C m2 yr−1 in the 1990s and 2000s, respectively, compared to the preceding decades. However, in the 2010s, NEP declined by 3.90 g C m2 yr−1 relative to the 2000s. These findings indicate that the rapid growth in NEP over the past 40 years was primarily concentrated in the 2000–2009 period, whereas the 2010–2018 period exhibited a significant downward trend.
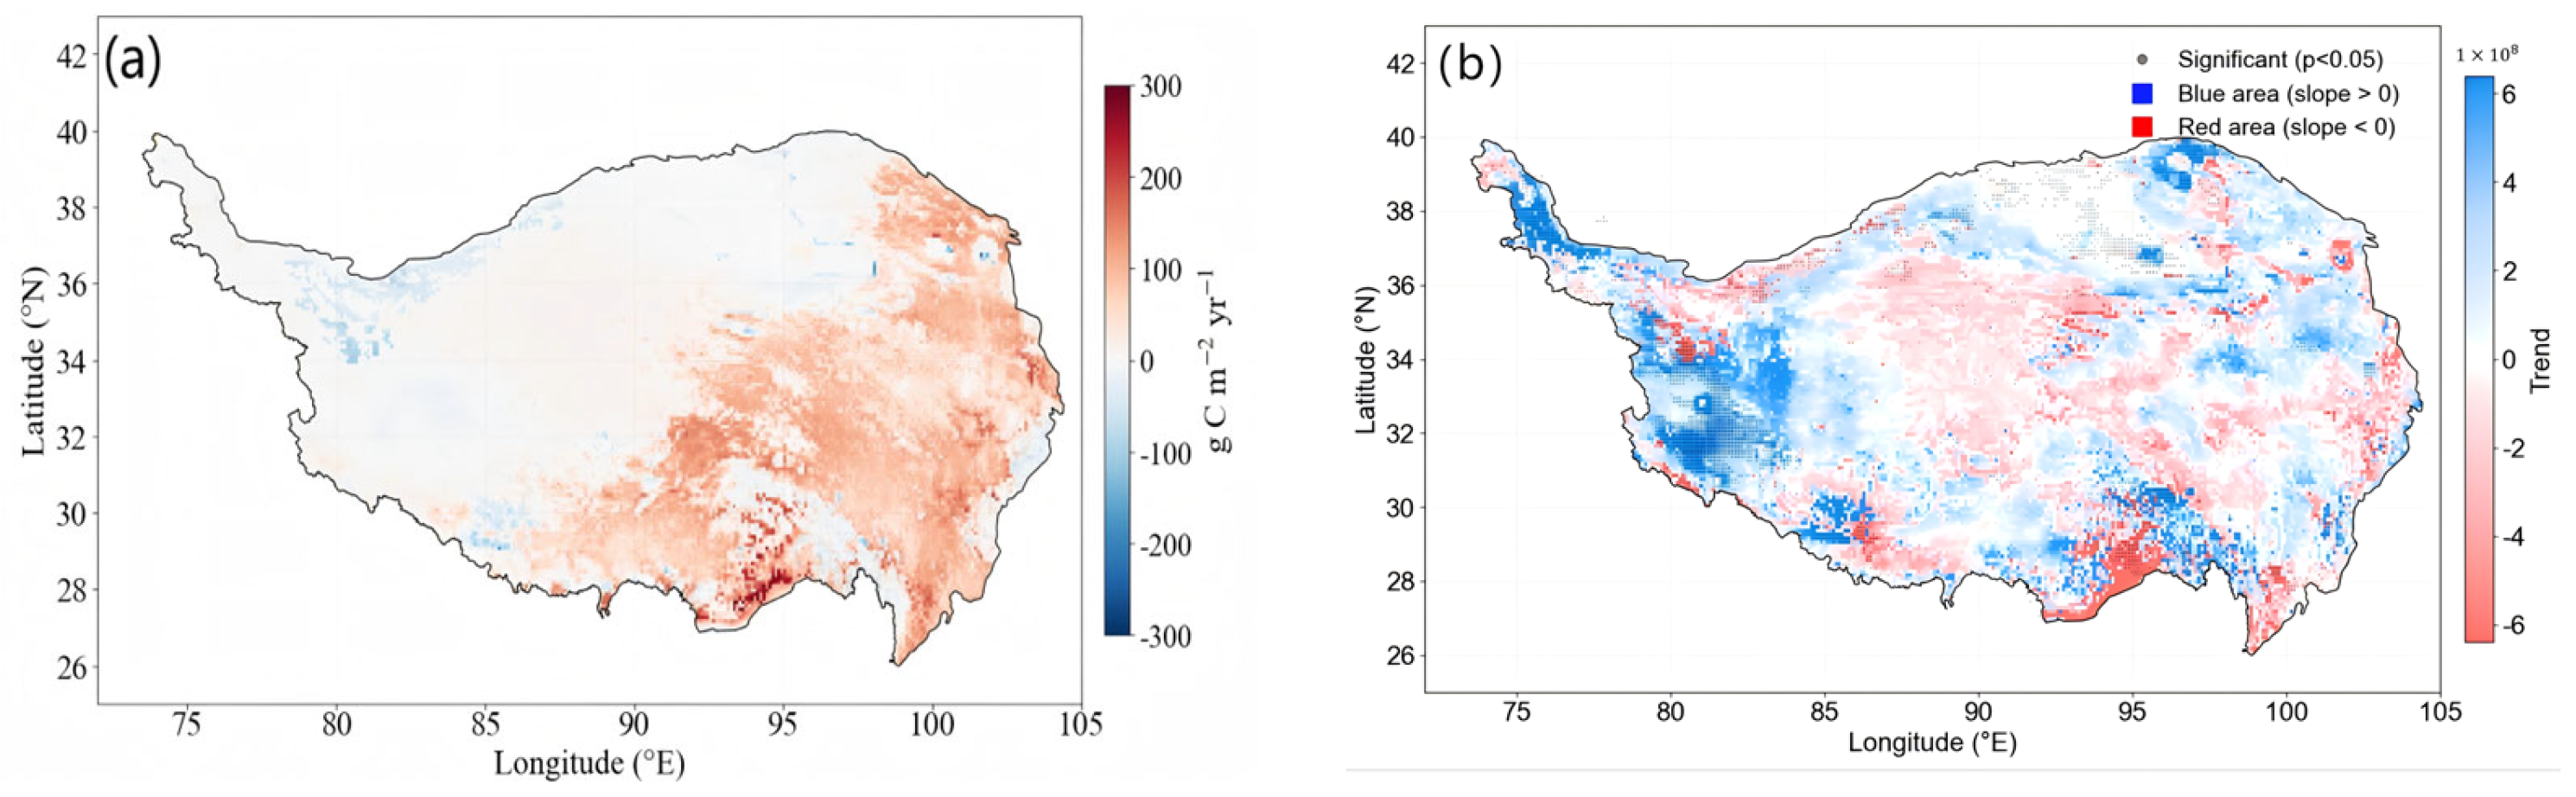
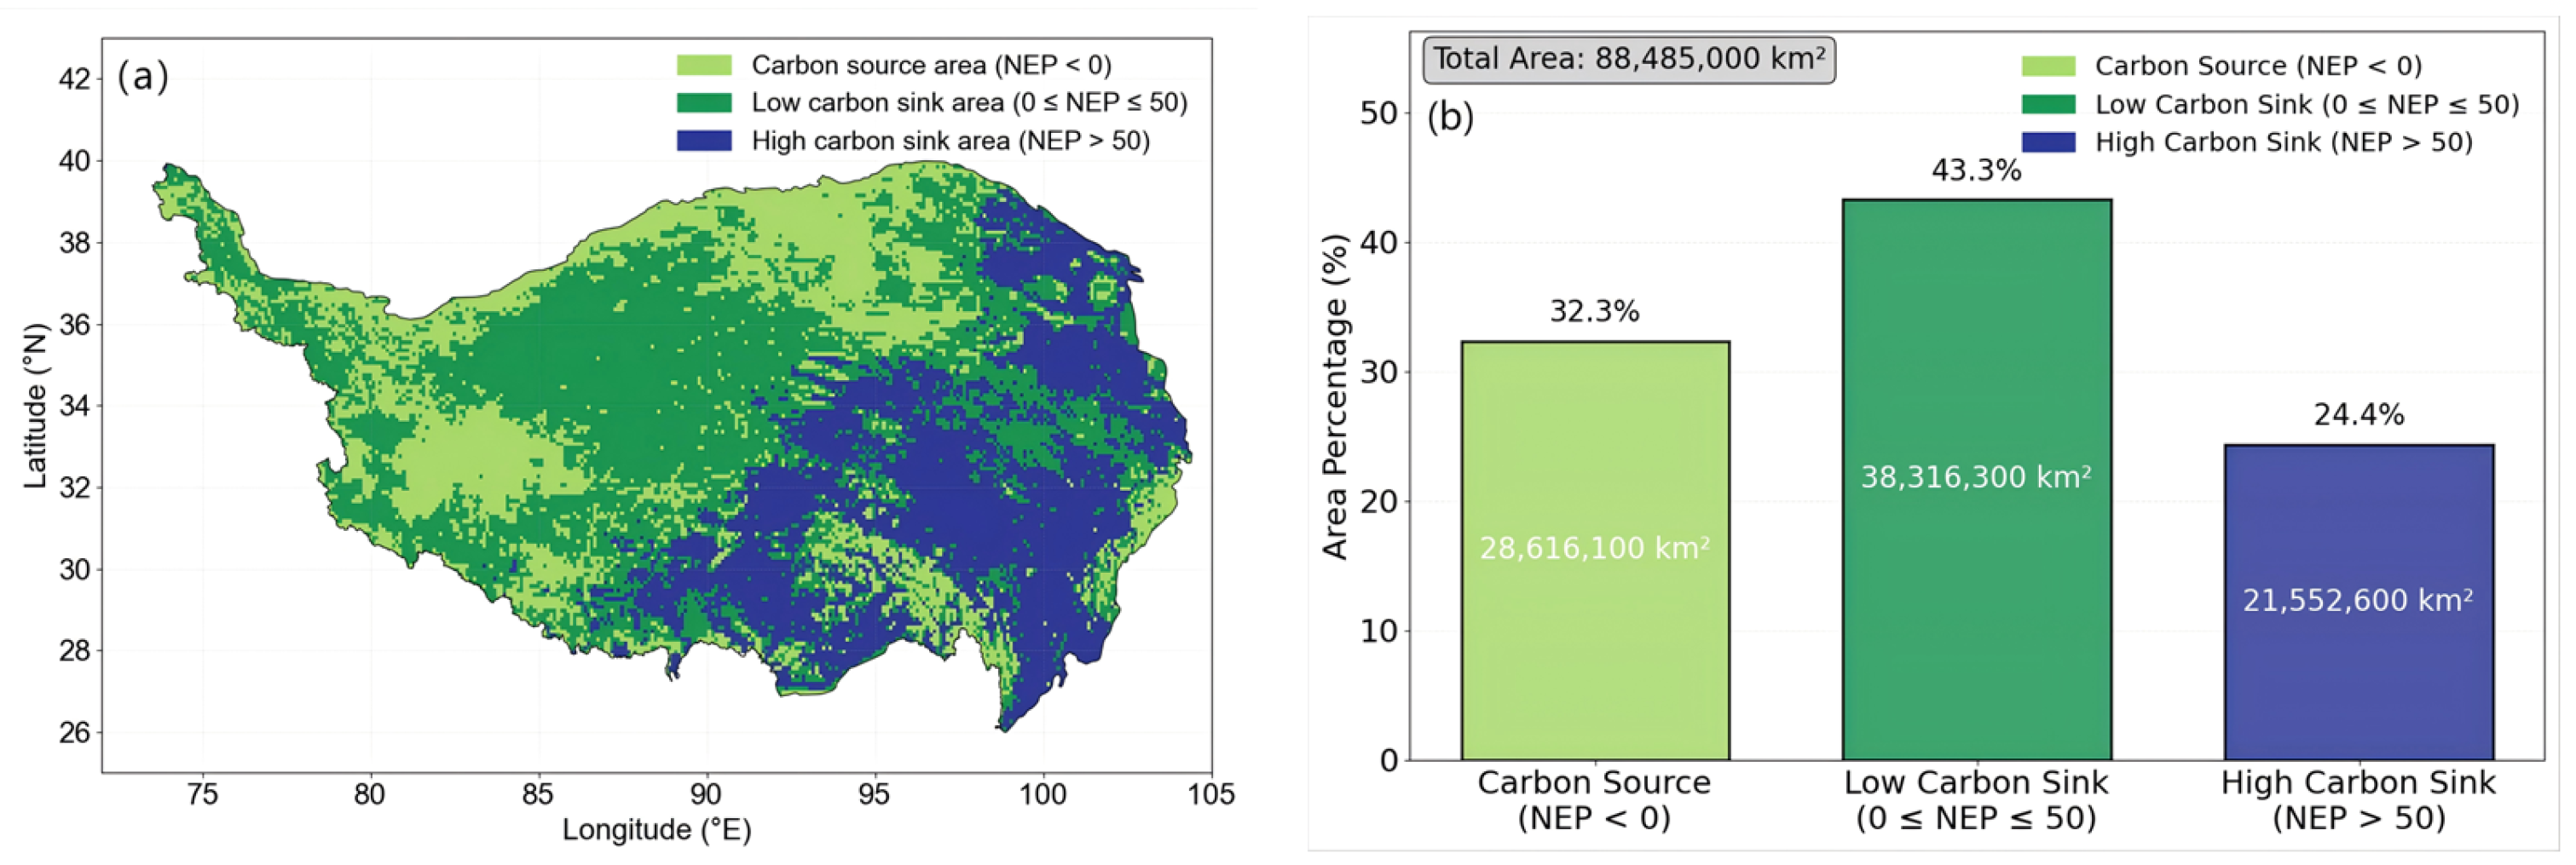
Spatially, NEP exhibited a clear gradient increasing from the northwest to the southeast of the TP (Figure 4a). As shown in Figure 5b, carbon sink areas accounted for 67.7% of the plateau, while carbon source areas accounted for 32.3%, indicating that carbon sinks dominate the regional carbon balance. Strong carbon sink areas (NEP > 50 g C m2 yr−1) were mainly distributed in the eastern TP, whereas weak carbon sink areas (0 < NEP < 50 g C m2 yr−1) were primarily located in the central and parts of the eastern plateau. Carbon source regions (NEP < 0 g C m2 yr−1) were mainly concentrated in the Qaidam Basin, with scattered distributions in the western and eastern TP.
From 1979 to 2018, NEP showed an overall decreasing trend in most parts of the TP (Figure 4b). Significant decreases were observed in the eastern TP and the southern Himalayan region, while moderate decreases occurred in the central and eastern plateau. In contrast, increasing trends were detected in the western desert regions and the Qilian Mountains in the northeastern TP. To better understand the mechanisms underlying these spatiotemporal patterns, sensitivity experiments were conducted to evaluate the responses of NEP to key climatic variables.

3.2. Attributions of NEP Variations

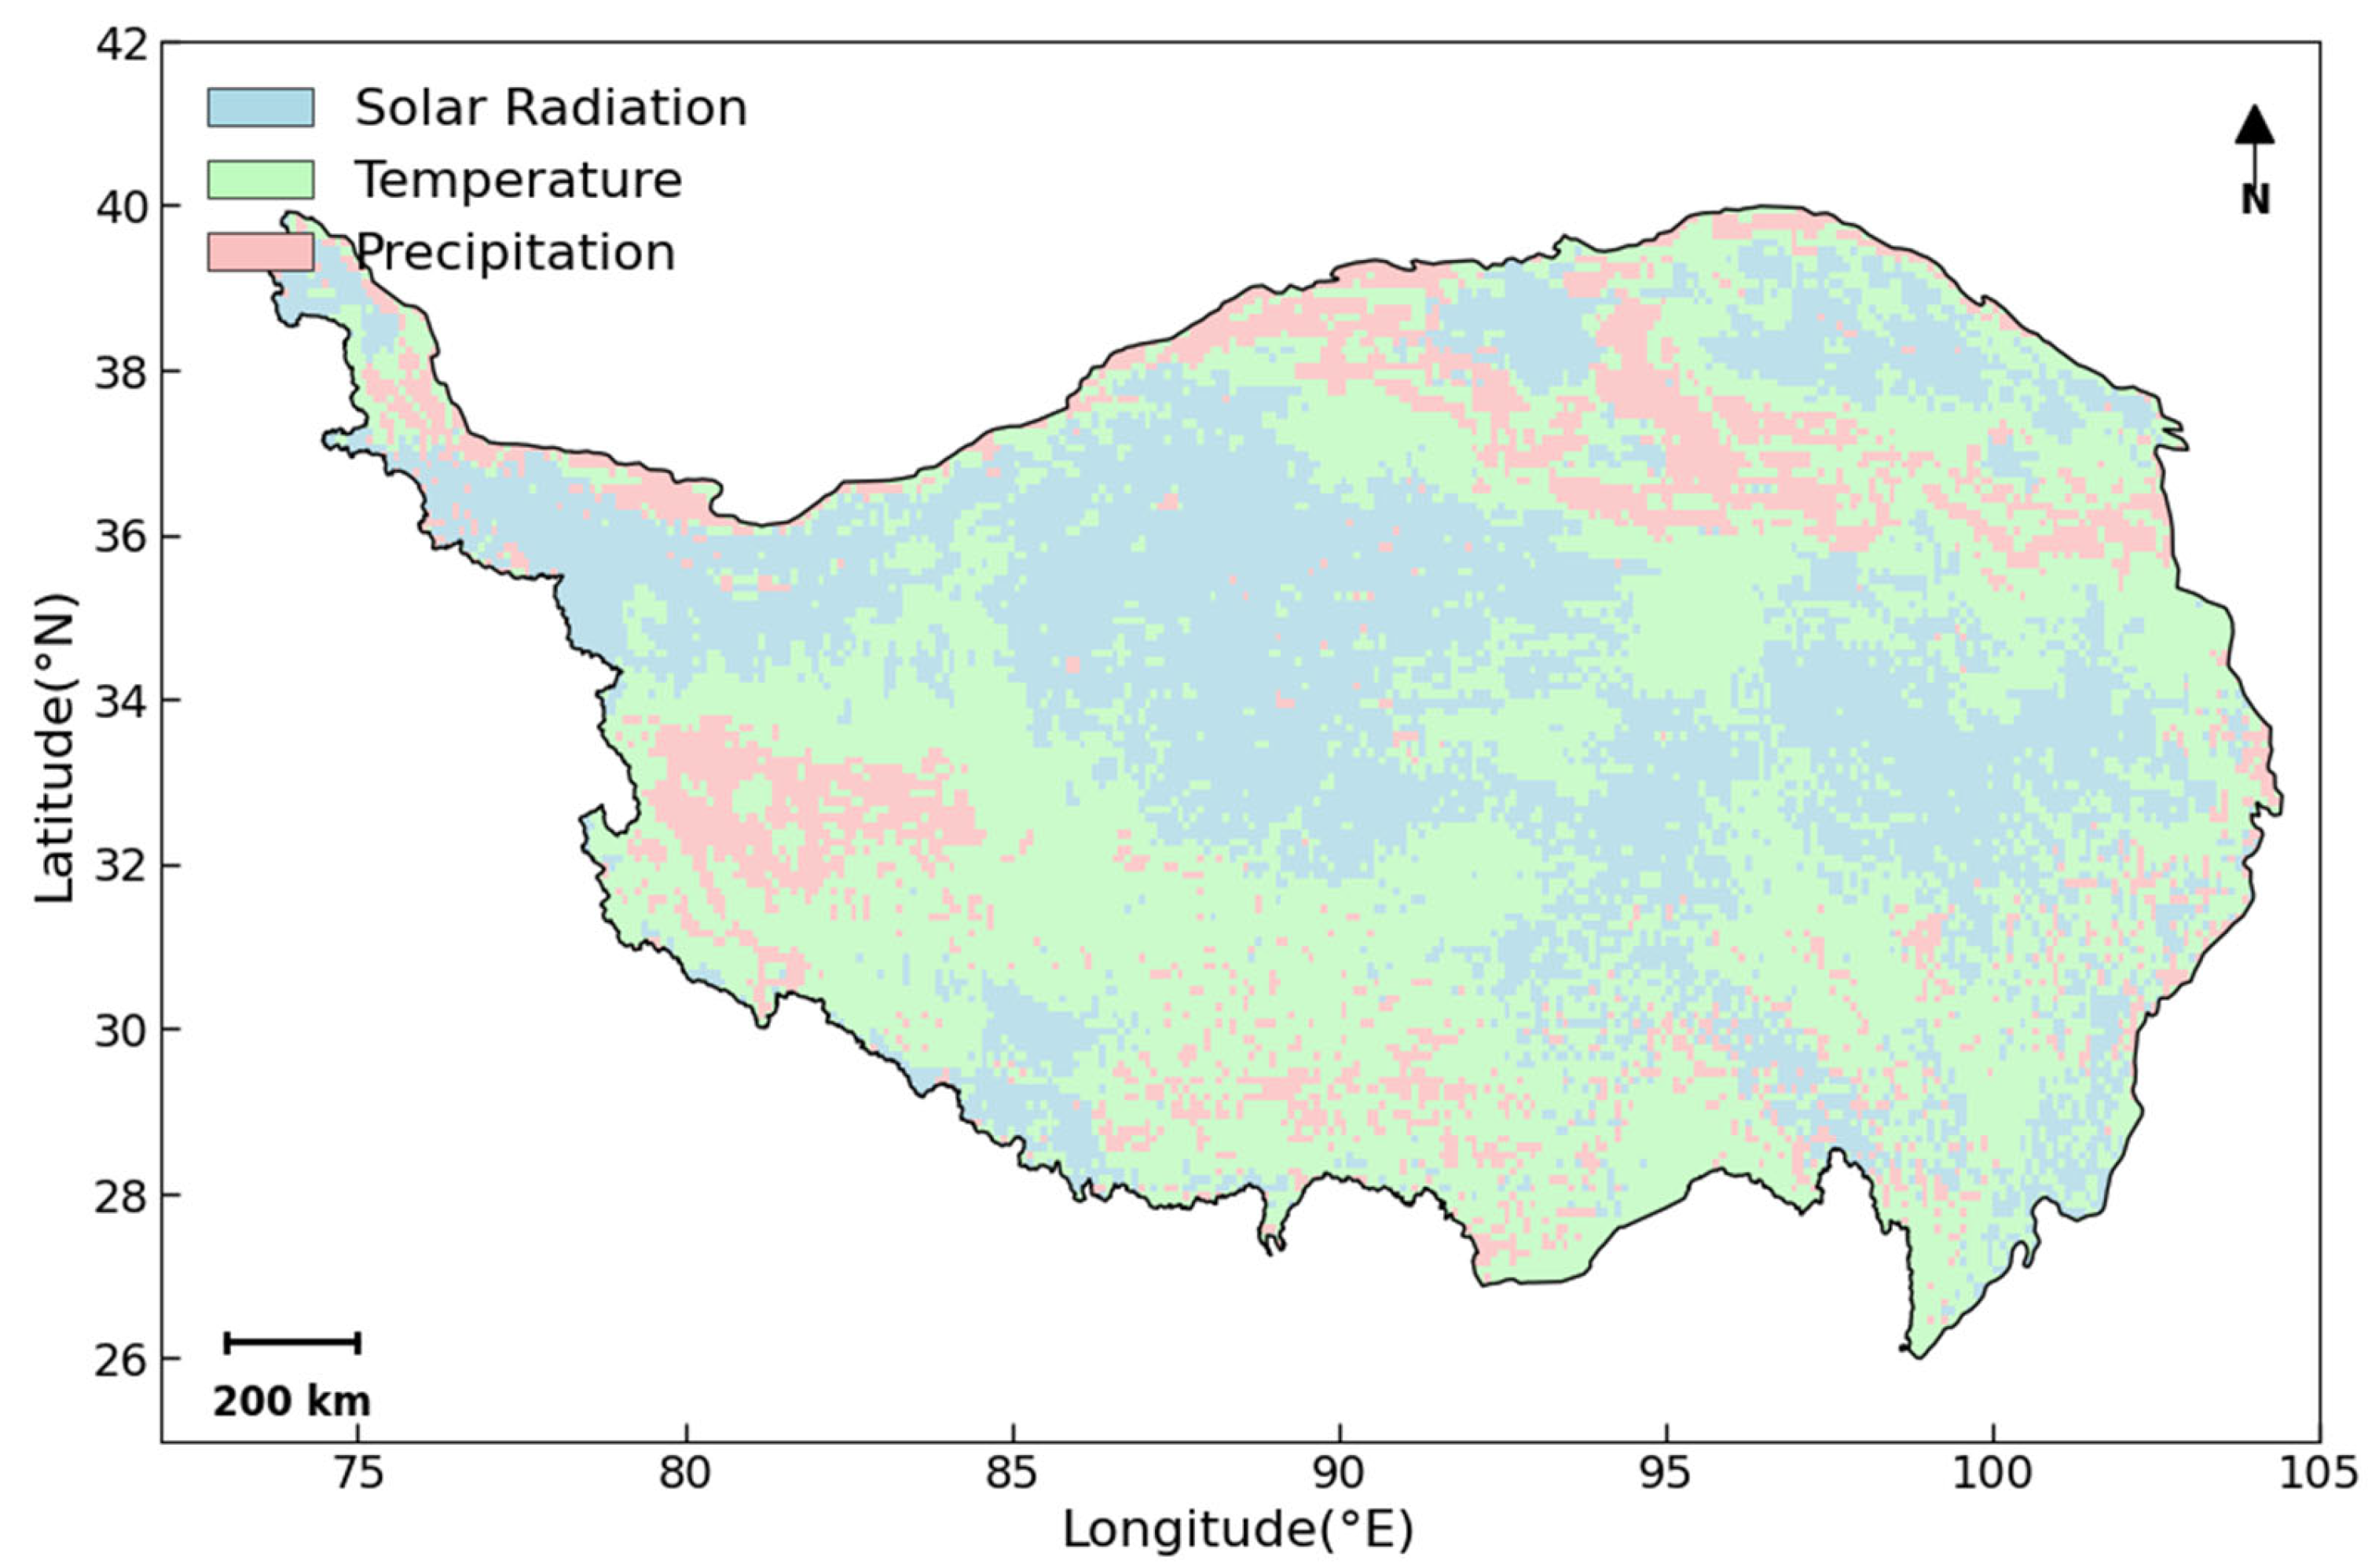
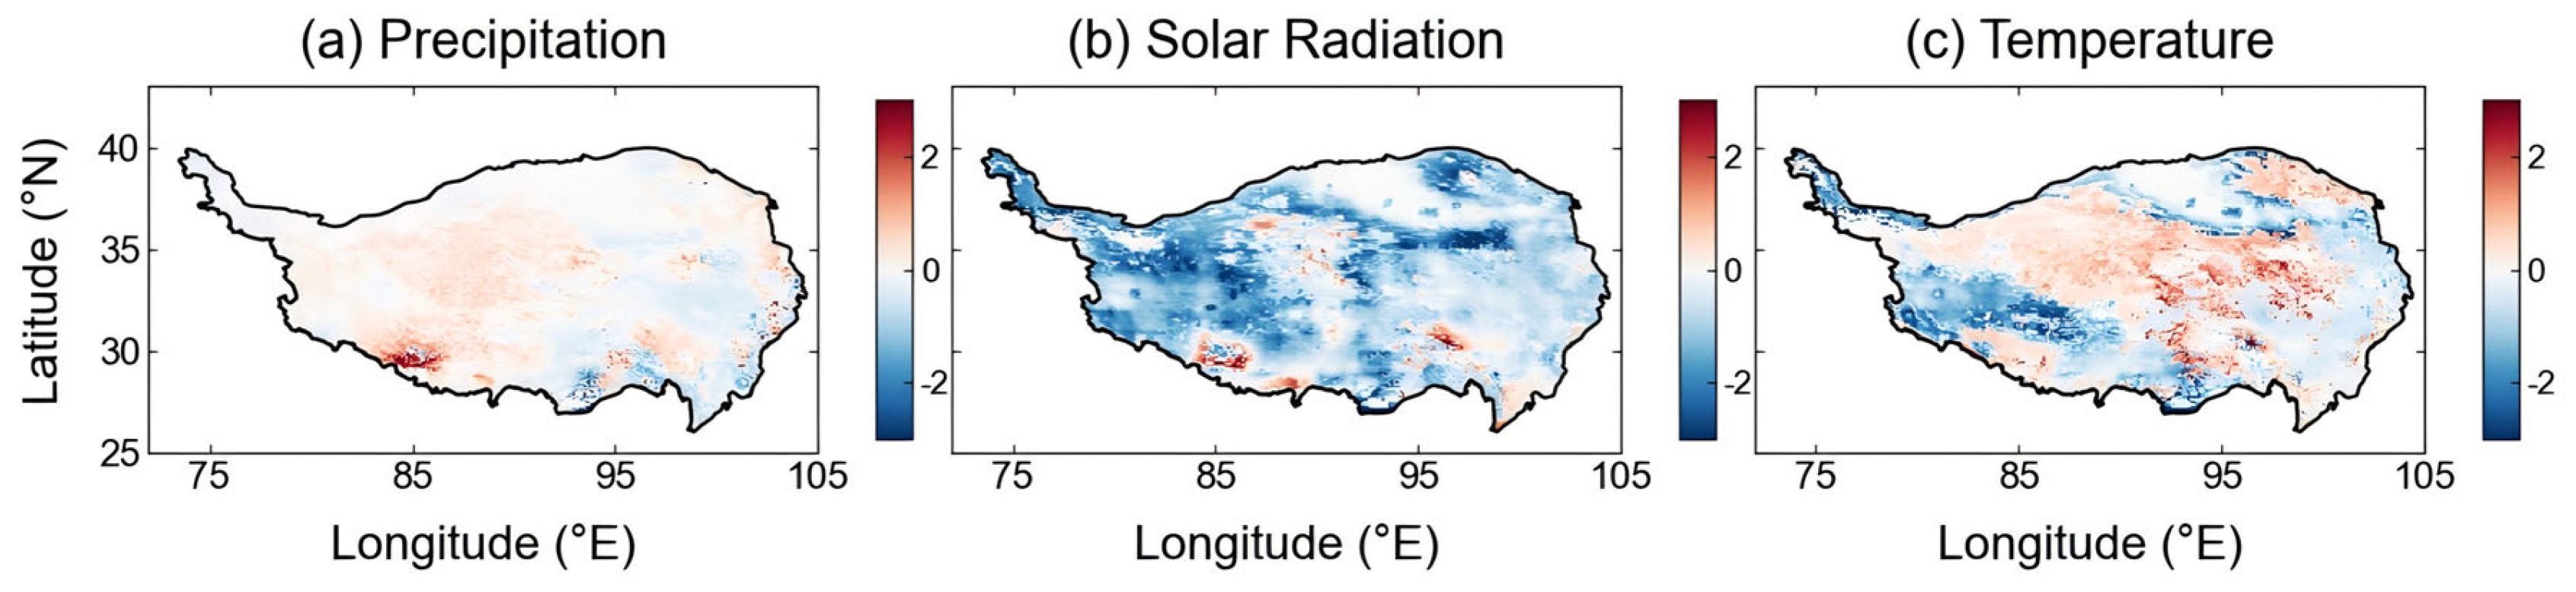
The complex controls on ecosystem carbon dynamics on the TP stem from vegetation processes that are mediated by the combined effects of precipitation, temperature, and solar radiation [87]. In order to disentangle the contributions of individual climatic factors to NEP variations, a series of sensitivity experiments were performed, analyzing NEP trends under controlled climatic conditions. (Figure 6). To assess the spatial relative importance of each factor, partial correlation analysis was used for calculation (Figure 7).
Table 3 illustrates that under temperature-controlled scenarios, NEP rose significantly at a rate of 0.5 g C m2 yr−1, contributing approximately 68% of the total NEP change. This identifies temperature as the dominant driver of NEP dynamics on the TP over the past four decades. NEP under solar radiation control exhibited an increasing trend of 0.2 g C m2 yr−1, contributing approximately 21% to NEP variation and representing the second most influential factor. Conversely, the precipitation-controlled scenario yielded a slight decline of 0.1 g C m−2 yr−1, representing an 11% contribution. Collectively, the climatic drivers follow an order of influence: temperature > solar radiation > precipitation.
Spatially, temperature emerged as the dominant driver of NEP changes across 46.5% of the TP, with its most pronounced effects concentrated in the southwest and southeast (Figure 7). Solar radiation exerted the primary control over 28.9% of the plateau, predominantly affecting the northwest and central sectors. In comparison, precipitation governed NEP variability in about 24.6% of the region, notably in the northern and western zones.
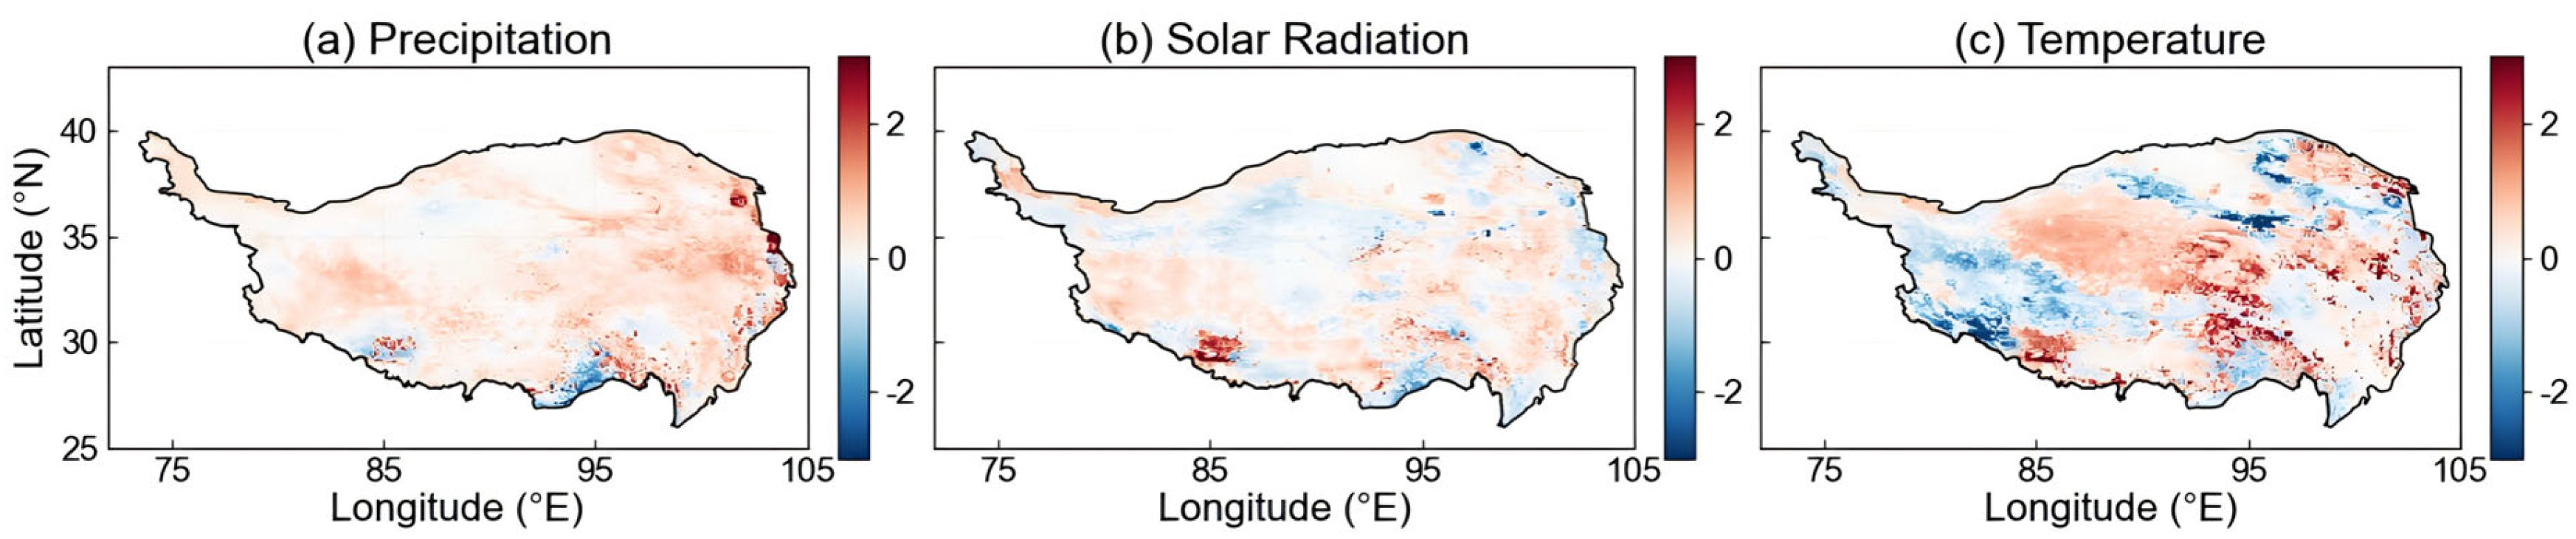
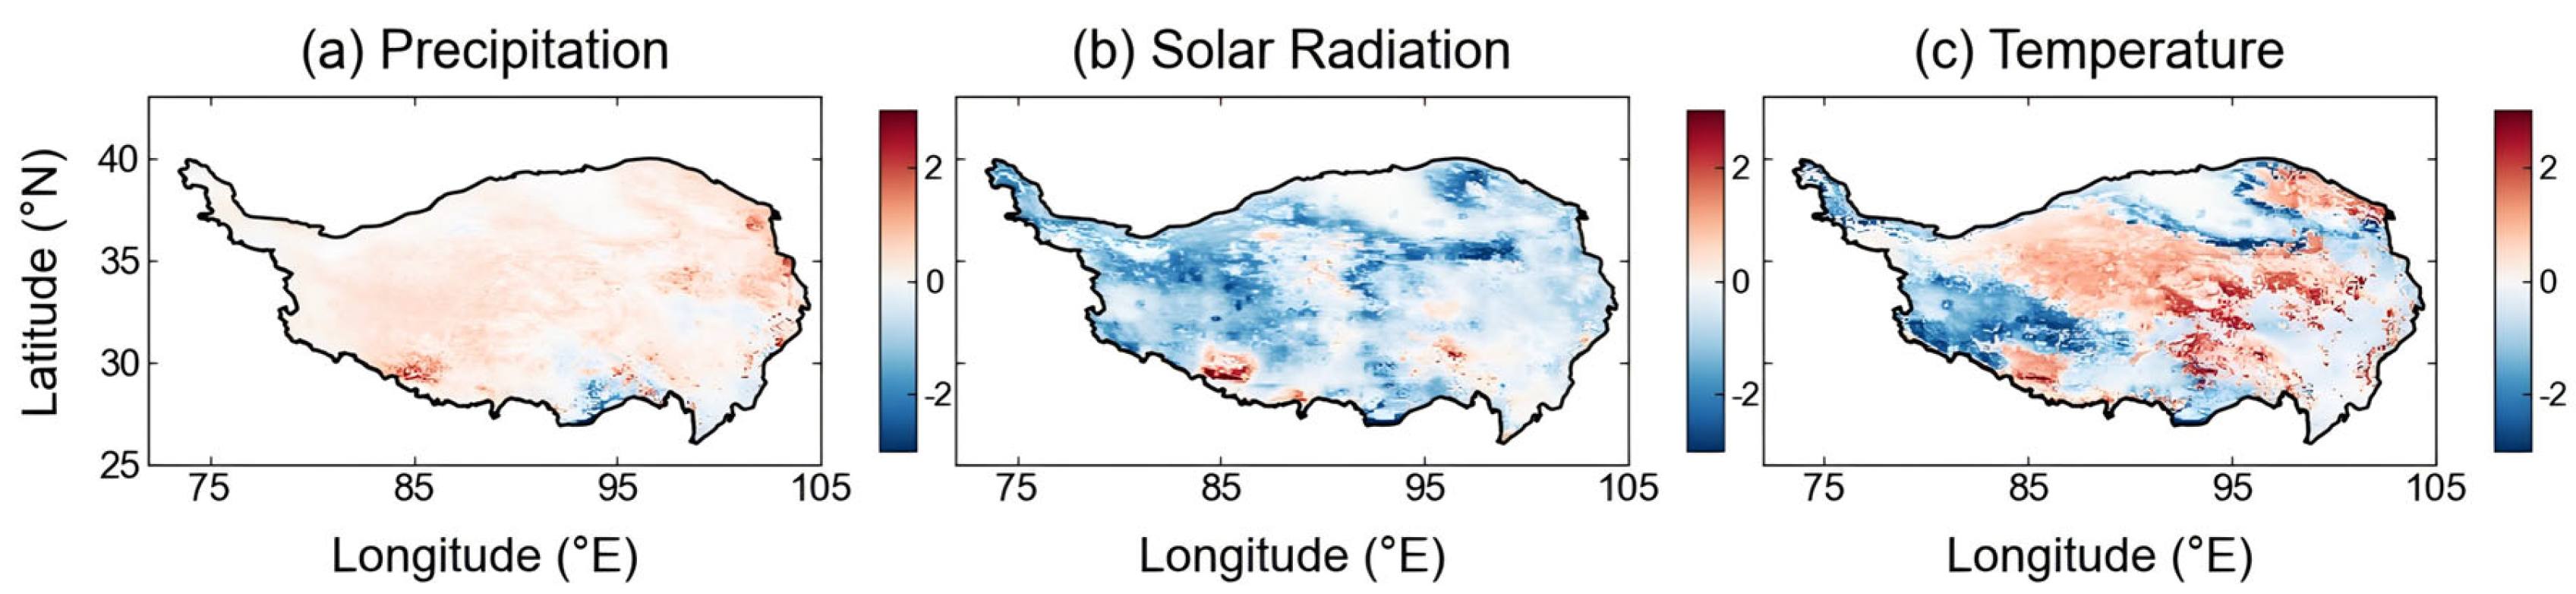
The influence of individual climatic factors on NEP varied substantially across the plateau, demonstrating clear spatial heterogeneity (Figure 8). Under precipitation control, NEP decreased in the central TP and southern Qinghai Plateau, while increasing trends were observed in the western plateau and southern Himalayas (Figure 8a). When driven by solar radiation, NEP exhibited increasing trends in the western TP and the Kunlun Mountains, whereas declining trends were observed in the eastern TP and parts of the southwestern plateau (Figure 8b). Temperature-driven NEP responses exhibited clear spatial contrasts, with declining trends concentrated in the central and eastern TP and increasing trends mainly occurring in the western plateau as well as parts of the central and northern TP (Figure 8c). Building on the identified climatic controls, future changes in NEP under different emission scenarios were further projected.

3.3. The NEP Spatial-Temporal Variation in Future Scenarios

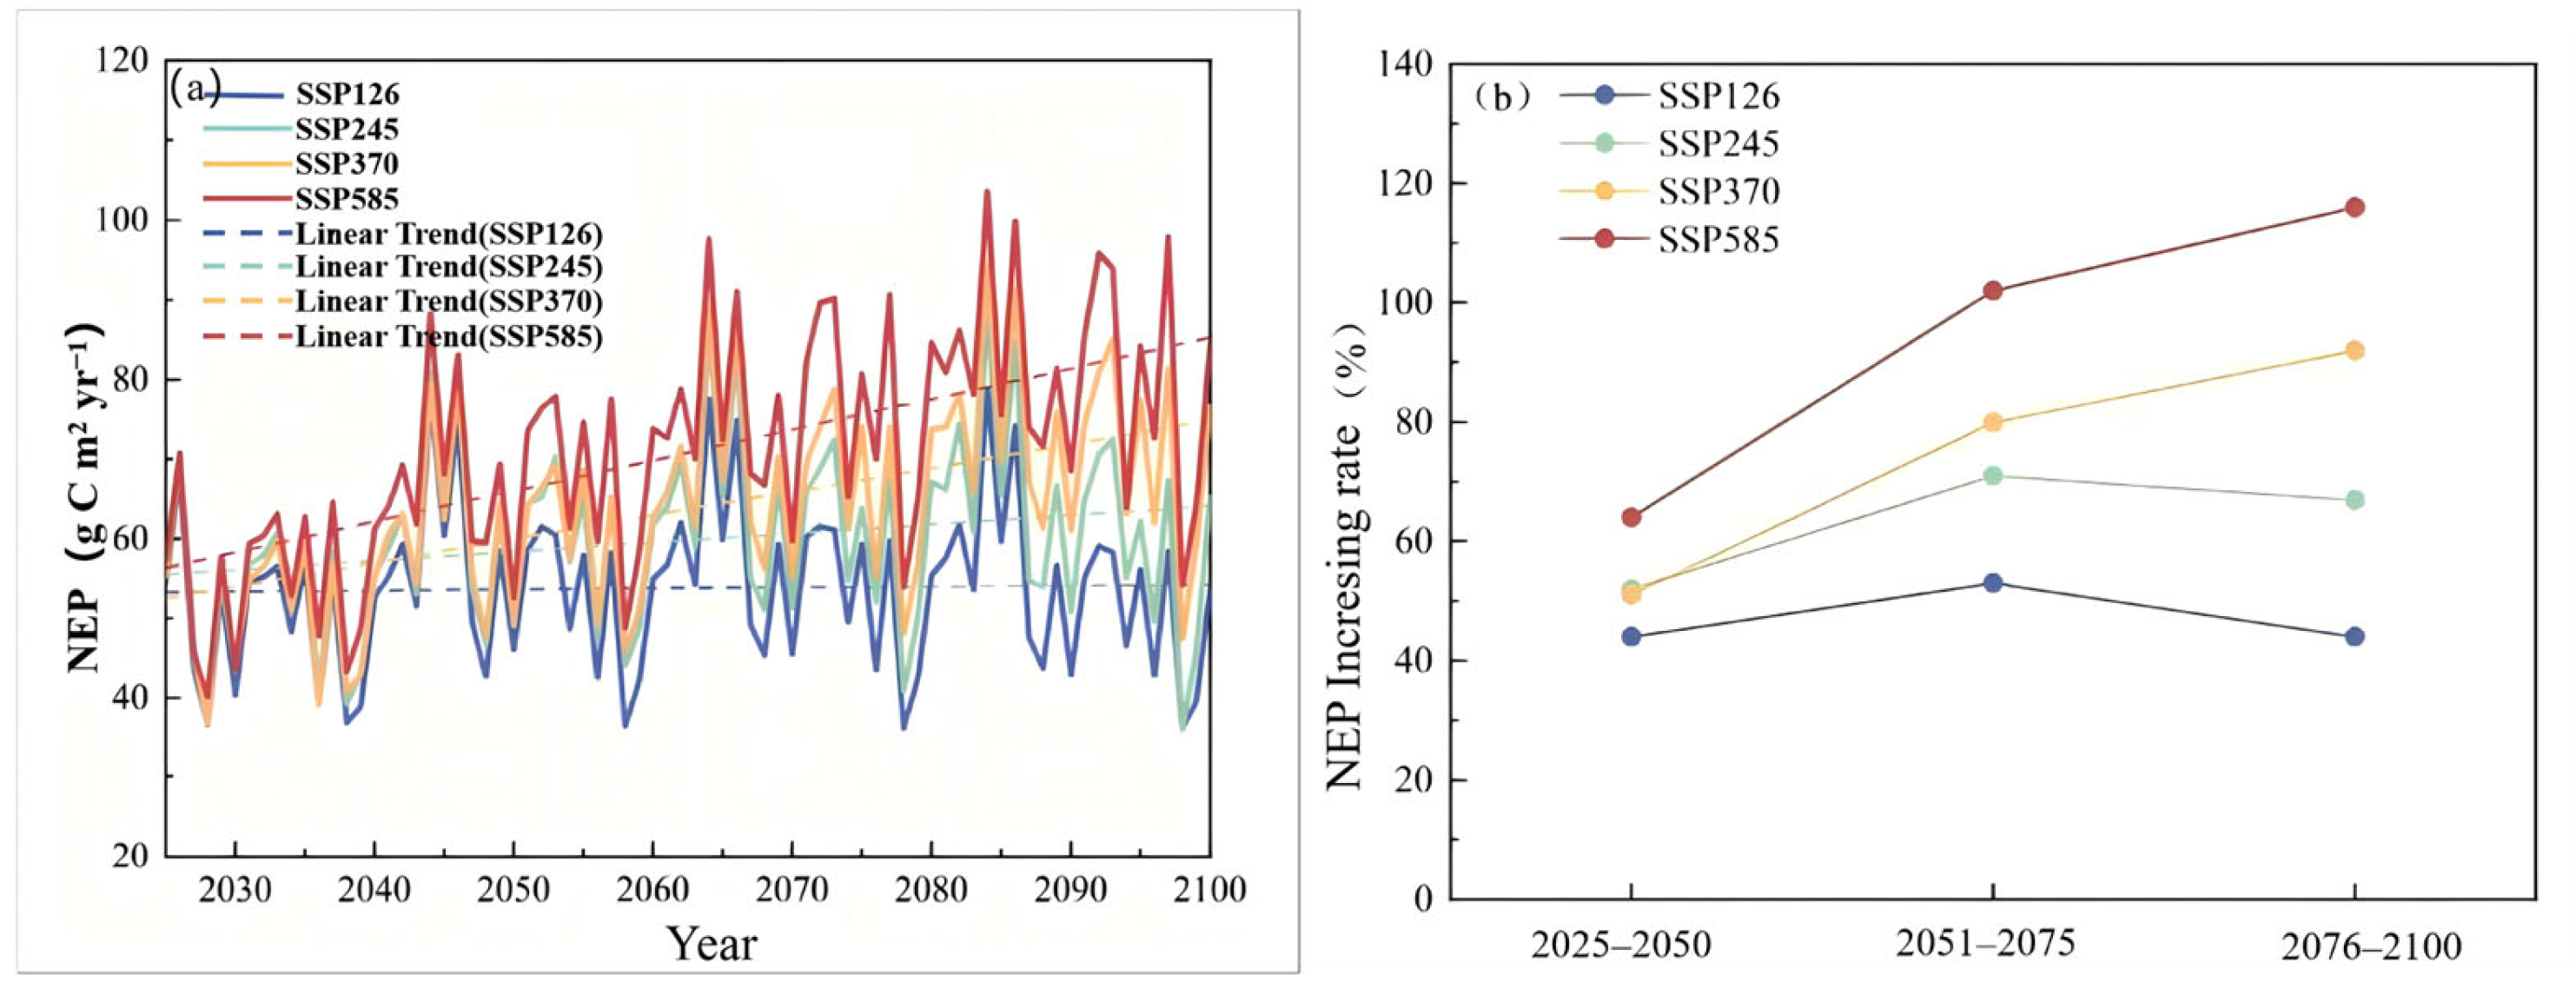
Under all future SSP scenarios, NEP over the TP remained positive and exhibited an overall increasing trend, indicating that the region is projected to function as a stronger carbon sink in the future. Initially, the projected NEP trajectories remained tightly clustered across scenarios, but distinct divergence emerged as the projection horizon advanced (Figure 9a). The differences in both NEP magnitude and growth rate became more pronounced when comparing the near-, mid-, and long-term periods.
Future NEP projections for the TP display distinct trajectories across the various scenarios (Figure 9). Under SSP1–2.6, carbon sinks sustain stable growth, averaging 53.8 g C m2 yr−1 (range: 36–79 g C m2 yr−1). Despite a 47% increase in growth rate compared to historical records, the trend follows a ‘rise-then-fall’ pattern. The SSP2–4.5 scenario yields a wider NEP range (38–89 g C m2 yr−1) and a growth rate (0.11 g C m2 yr−1) that is roughly 63% above historical levels, though growth momentum eventually weakens. In contrast, SSP3–7.0 maintains a consistent upward trajectory (0.30 g C m2 yr−1) with values spanning 37–95 g C m2 yr−1. Notably, SSP5–8.5 generates the highest values (40–103 g C m2 yr−1) and a growth rate (0.40 g C m2 yr−1) that more than double the historical NEP levels.
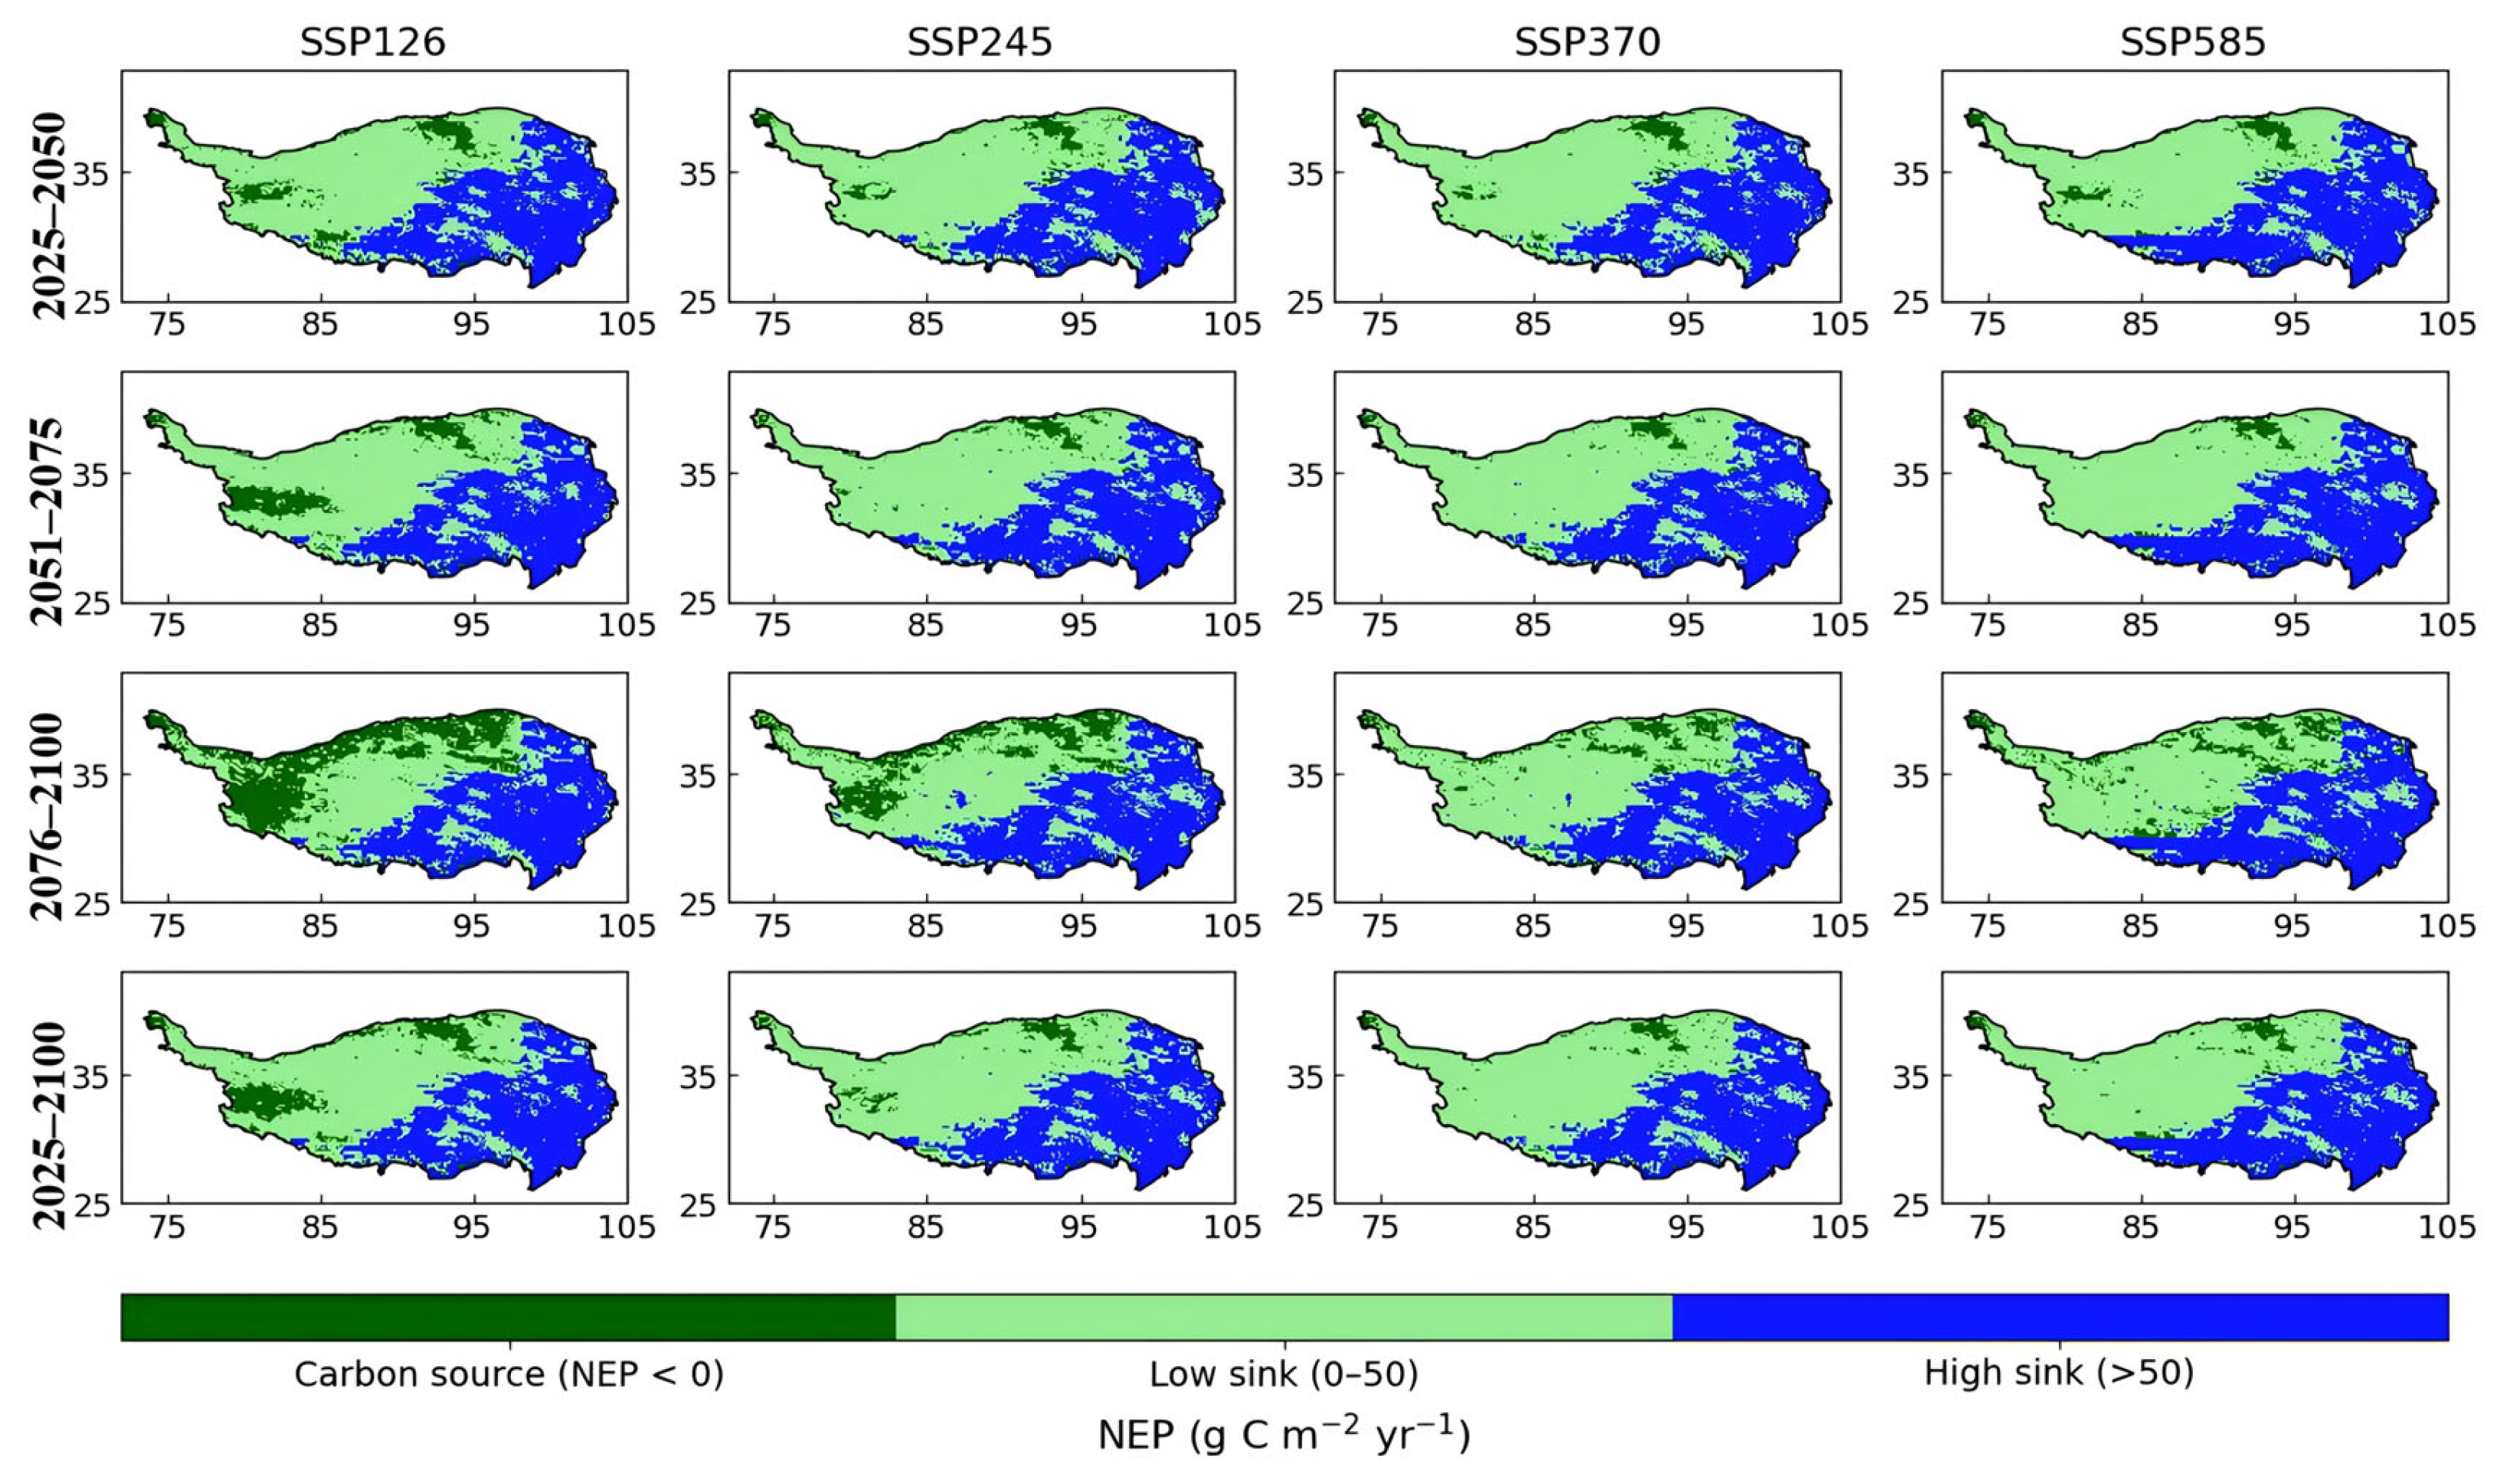
In terms of spatial distribution, future NEP showed a consistent pattern of higher values in the southeastern TP and lower values in the northwestern region, with considerable variation over time across different scenarios (Figure 10). Under SSP1–2.6, strong carbon sinks were concentrated in the southeastern TP, while carbon source regions persisted in the western Alxa region and the northern Qaidam Basin, with expansion of source areas in the mid- to long-term. Under SSP2–4.5, most of the TP functioned as a carbon sink, with carbon source regions mainly restricted to the Qaidam Basin and Alxa region, and increasing transitions from carbon sources to sinks over time. Under SSP3–7.0, NEP increased substantially in the southeastern TP, with some regions exceeding 225 g C m2 yr−1, and carbon sink areas expanded in the northwestern TP. In the long term, transitions from carbon source to carbon sink became more widespread, particularly in the western and northern plateau. Under SSP5–8.5, most of the TP functioned as a strong carbon sink, with pronounced sink regions in the southern TP, eastern Himalayas, and Qilian Mountains (NEP > 225 g C m2 yr−1), while carbon sources were mainly confined to small areas around the Qaidam Basin.
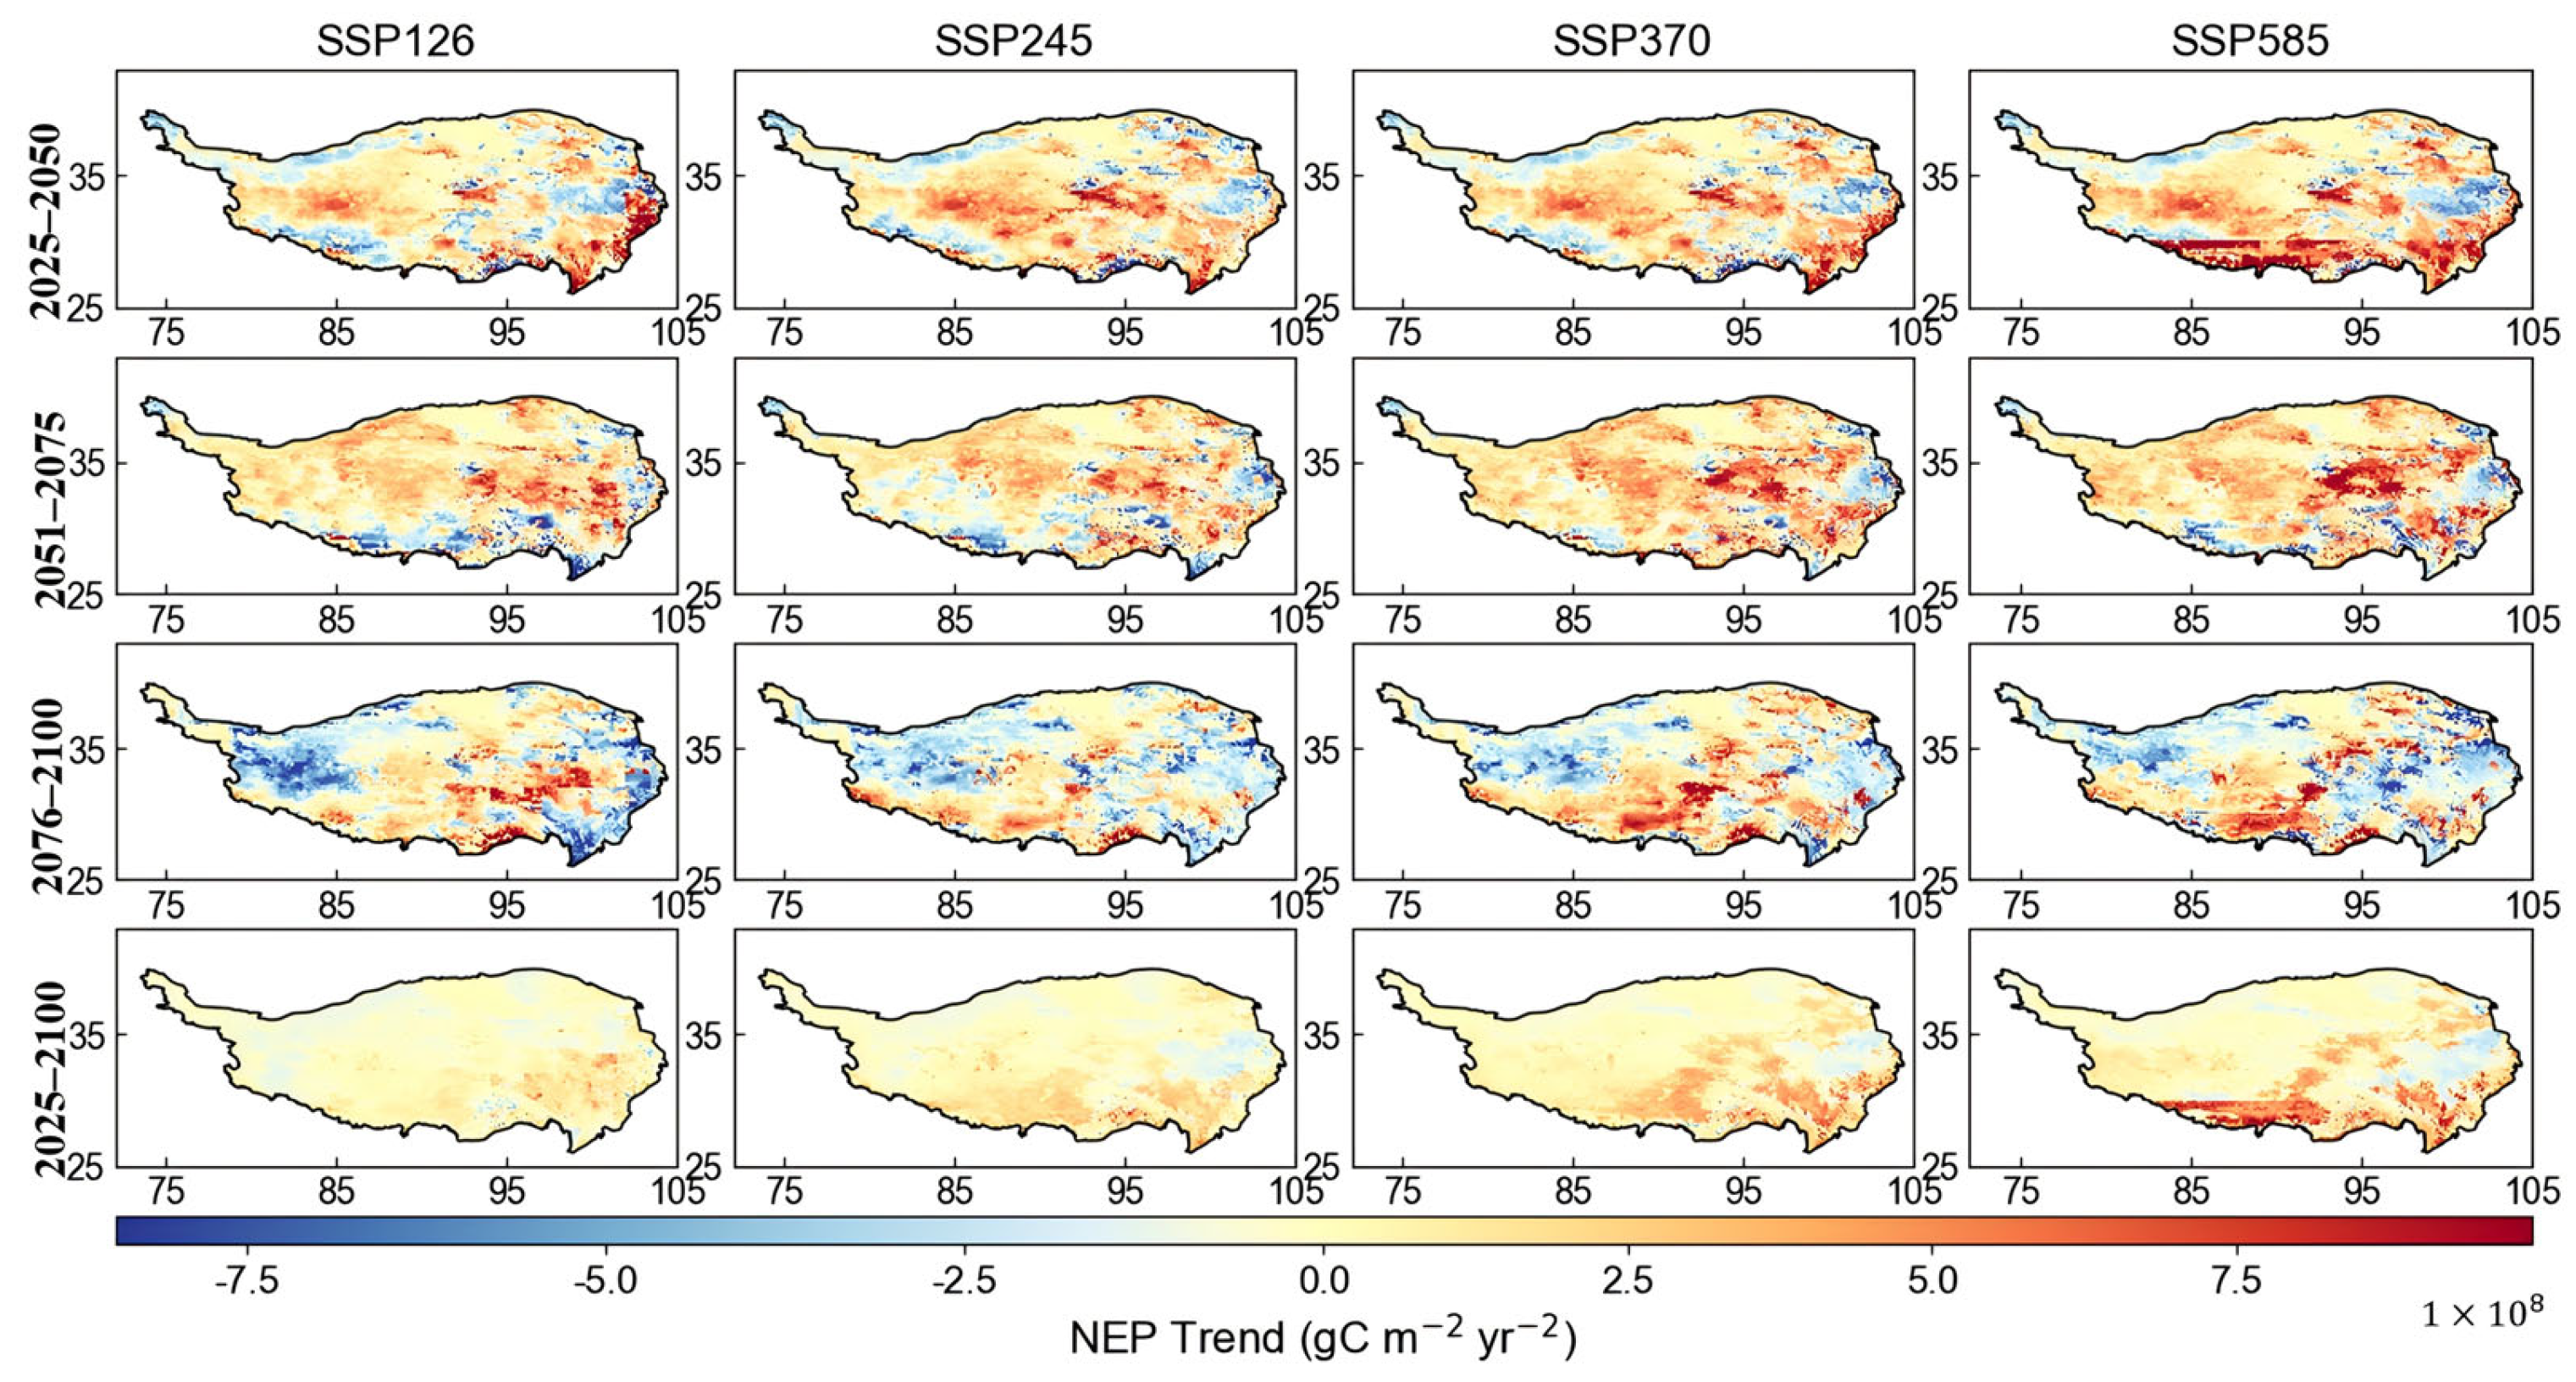
The spatial trends of NEP under different SSP scenarios exhibited substantial heterogeneity (Figure 11). Under SSP1–2.6, NEP trends from 2025 to 2100 were relatively weak, with slight decreases in the northwest and slight increases in the southwest and southeast TP. In the near and mid-term, NEP increased in many regions, whereas in the long term, decreasing trends dominated most areas except the central TP. Under SSP2–4.5, regions with increasing NEP expanded, particularly in the central and western TP, while decreasing trends persisted in parts of the eastern TP. Under SSP3–7.0, NEP exhibited a pronounced increasing trend across most of the TP, with significant increases in the central and eastern regions, although declining trends emerged in the northern and eastern TP in the long term. Under SSP5–8.5, increasing and decreasing NEP trends were spatially interspersed, with significant increases in the central and southern TP and parts of southeastern Sichuan and Tibet, while decreases occurred in the eastern and northern TP. In the near and mid-term, NEP increased across most regions, whereas long-term decreases dominated the western, central, and eastern TP, with sustained increases mainly confined to the southern TP.

4. Discussion

4.1. Characteristics of NEP Carbon Sequestration Variations

Global carbon balance is a critical topic in climate change research, with the identification of carbon sources and sinks being a major focus. NEP serves as a key measure of ecosystem carbon budgets and provides an integrated assessment of processes related to carbon sequestration [88]. Recent studies suggest that the global average NEP of terrestrial ecosystems ranges from 1.5 to 3.0 Pg C yr−1, which corresponds to an average annual carbon uptake of roughly 20–40 g C m2 yr−1 by vegetation [89]. In this study, the TP acted mainly as a carbon sink during 1979–2018. The long-term mean NEP was 23.96 g C m2 yr−1, showing a slight upward trend of 0.2 g C m2 yr−1. This suggests that the carbon sequestration capacity of the TP is close to, or in some areas exceeds, the global average for land ecosystems. Specifically, NEP growth peaked during the 2000–2009 period but lost steam after 2010, reflecting a strong coupling with climatic variations. The earlier decade’s ‘warm-wet’ climate alleviated water constraints and prolonged the growing season, thereby boosting vegetation productivity [90,91]. In contrast, sustained warming after 2010 intensified evapotranspiration and triggered drought stress. This shift caused water to override temperature as the primary constraint, effectively halting the continued expansion of NEP [92].
In contrast to the marked seasonality of temperate zones, the TP is defined by a unique monsoon system that supports a dual seasonal structure: an extended, cold non-growing season juxtaposed with a brief, warm growing season [93,94]. Most annual ecosystem carbon uptake occurs during this relatively short warm period from late spring to early autumn, while carbon fluxes are relatively low during the long, cold season [95,96]. Therefore, annual NEP can effectively integrate the carbon dynamics dominated by the growing season, and analyzing NEP on an annual scale can effectively capture the long-term trajectory of ecosystem source-sink functions driven by internal climate change.
Spatially, NEP varied considerably, increasing from the northwest to the southeast, in agreement with the findings of Xian Liu et al. [61]. Areas with strong carbon sink activity are mainly located in the southern TP, the Qilian Mountains, and southeastern mountain regions, where alpine meadow and forest ecosystems dominate. Under relatively humid conditions, enhanced precipitation promotes plant growth and increases NPP, while R h remains comparatively stable, resulting in a carbon sink [97]. In contrast, weak carbon sink areas are mainly located in the eastern Kunlun region and the TP, where alpine grassland and desert grassland ecosystems prevail under cold and arid conditions. Limited soil moisture and sparse vegetation cover constrain photosynthetic carbon uptake, leading to reduced NPP and consequently weaker carbon sink intensity [97], with some areas even functioning as net carbon sources. Regions with NEP values below zero are predominantly distributed in desert zones. In these areas, extremely low vegetation productivity results in NPP values approaching zero, whereas soil heterotrophic respiration continues, leading to net carbon release [98]. Similar source patterns have been reported in arid regions globally, where water limitation restricts productivity responses to warming and CO2 fertilization [99]. In contrast, most vegetated areas of the plateau functioned as carbon sinks, consistent with recent regional assessments of high-altitude ecosystem carbon dynamics [100].

4.2. Influencing Mechanisms of NEP Carbon Sequestration Variations

Climate change plays a fundamental role in regulating terrestrial carbon cycling, and strong linkages have been widely reported between climate warming and carbon flux dynamics [101]. Therefore, precipitation, temperature, and solar radiation were selected as key climatic drivers for analysis. The TP has experienced pronounced warming and humidification [102], with increasing trends in annual precipitation and temperature of 3.45 mm year−1 and 0.04 °C year−1, respectively (Figure 1a), which have exerted significant impacts on vegetation productivity [59].
NEP is defined as the difference between NPP and R h . To further elucidate the mechanisms underlying NEP variability, Table 4 and Figure 12 and Figure 13 present the temporal trends of NPP and R h under different meteorological drivers. Over the past four decades, the spatial patterns of R h responses to precipitation closely resemble those of NPP, with increasing trends across most areas of the TP and localized decreases in parts of the southern region (Figure 12a and Figure 13a). Under temperature forcing, R h exhibits a pronounced increasing trend in the central plateau, while decreasing trends are observed in parts of the southern plateau (Figure 12c and Figure 13c). In contrast, radiation-driven R h shows limited increases in small areas of the central plateau but decreasing trends in both the western and eastern regions (Figure 12b and Figure 13b). These contrasting spatial responses of R h under different climatic drivers contribute to the observed heterogeneity in NEP dynamics across the plateau.
The enhancement in NEP was primarily driven by temperature, which was responsible for a quantified increase of 0.5 g C m2 yr−1 (Table 4). This result is consistent with remote sensing-based estimates reported by Zha et al. [103]. Temperature modulates ecosystem carbon balance through its synergistic effects on photosynthesis and respiration [104,105]. On the one hand, rising temperatures stimulate plant physiological processes, prolonging the growing season under cold-limited conditions and thus increasing NPP. On the other hand, rising temperatures accelerate the decomposition of soil organic matter and microbial activity [106,107], leading to increased R h Temperature-driven NEP showed a significant positive trend in the Alishan Mountains and alpine meadows of western TP (Figure 8c). These areas are cold-limited and sparsely vegetated ecosystems, and moderate warming can alleviate the thermal limitation of plant growth and increase NPP without proportionally increasing R h , thus achieving net carbon gain. Previous studies have also reported similar temperature-driven NPP increases in high-altitude meadows [108,109]. In contrast, a decreasing trend of NEP was observed in the desert regions of central TP and the alpine regions of southern TP. In these areas, warming may have exacerbated respiration-driven carbon loss, increased the R h /NPP ratio, and thus reduced NEP [110,111].
As the primary energy input for photosynthetic processes, solar radiation plays a direct role in regulating plant carbon uptake. Model results indicate that solar radiation exerted a secondary positive effect on NEP, contributing an increase of approximately 0.2 g C m2 yr−1. Overall, while NPP decreased under radiation (−0.01 g C m2 yr−1), R h decreased more significantly (−0.3 g C m2 yr−1), resulting in a slight increase in NEP. Enhanced radiation primarily stimulates photosynthesis by increasing light intensity, while its effect on R h is more indirect, mainly through altering soil temperature and humidity conditions [112]. In Alishan and parts of western and eastern Qilian Mountains, enhanced radiation promoted vegetation photosynthesis. This was mainly because the increase in NPP caused by radiation exceeded the corresponding change in R h , leading to a net increase in NEP.
Precipitation increases stimulate photosynthesis and transpiration, enhance vegetation activity, and promote root growth and microbial respiration, collectively influencing ecosystem respiration and carbon balance [113,114]. Under precipitation forcing, NEP exhibited a weak negative trend (−0.1 g C m2 yr−1), which was closely related to vegetation distribution. Precipitation-induced increases in NEP were observed primarily in scattered portions of the plateau’s western and southern sectors, which were largely composed of low-cover grasslands. The increased precipitation effectively replenished soil moisture deficits and enhanced photosynthetic intensity, thereby improving the carbon sequestration capacity of low-cover grasslands [115,116]. In contrast, in the eastern low-altitude areas, such as the Qilian Mountains, high-cover grasslands and coniferous forests are the main vegetation types. Increased precipitation significantly enhanced R h (Figure 13a), resulting in a more pronounced decreasing trend in NEP in this region.

4.3. Analysis of the Evolution of the NEP Under Future Scenarios on the TP

The TP, often referred to as the “Third Pole of the Earth,” is highly sensitive to climatic forcing due to its harsh environmental conditions. It is widely recognized that future climate over the plateau will continue to exhibit warming and humidification trends [115]. Our simulations indicate that mean NEP remains positive under all SSP scenarios and exhibits an increasing trend throughout the 21st century. This result is consistent with previous findings [32]. When comparing the four SSP scenarios, the increase in NEP tends to be larger under higher emission pathways. This trend can be largely attributed to rising atmospheric CO2 levels and greater warming. Higher CO2 concentration enhance photosynthesis, leading to increases in GPP and NPP [117]. At the same time, warmer temperatures reduce thermal constraints in high-altitude ecosystems, which supports the growth of vegetation in alpine grasslands and forested areas [4,106].
However, rising temperatures can speed up the decomposition of soil organic matter and stimulate microbial activity, which leads to higher R h [118]. Therefore, the net carbon accumulation in the ecosystem depends on how the increase in productivity compares with the rise in respiration. Under higher-emission scenarios (SSP3–7.0 and SSP5–8.5), stronger CO2 fertilization and more pronounced warming lead to greater increases in NPP relative to respiration, resulting in a stronger carbon sink response compared to lower-emission pathways (SSP1–2.6 and SSP2–4.5). In all scenarios, NEP increases more rapidly during the mid-century period (2051–2075) and slows toward the late century (2076–2100), particularly under low-emission pathways. The mid-century acceleration is likely associated with the combined effects of rising CO2 concentration and moderate warming. In contrast, continued warming toward the end of the century may enhance soil respiration and potentially trigger permafrost carbon release [119].
A distinct southeast-to-northwest gradient characterizes the spatial pattern of NEP, with values increasing toward the humid southeast and declining toward the arid northwest. Under projected climate change, the eastern TP is expected to become warmer and wetter [120], favoring vegetation growth and reinforcing carbon sink intensity in the southeastern plateau, western Sichuan, southeastern mountainous regions, and the eastern Qilian Mountains. Under intensifying climate forcing, carbon sink areas are projected to expand and shift in a northwesterly direction. However, gains in their stability remain contingent upon specific environmental thresholds and could diminish during a potential mid-century climate slowdown.

4.4. Limitations and Future Directions

Although this study achieved its objectives, several limitations should be acknowledged. CLM5.0 primarily simulates carbon sequestration through vegetation photosynthesis. While CLM5.0 has significantly refined the decomposition process of soil organic matter compared to earlier versions, it still lacks characterization of the soil’s own carbon sequestration pathways as a primary producer. Future development of models integrating microbial-mediated carbon sequestration processes could potentially further improve the accuracy of predictions. Furthermore, the CLM5.0 simulations were driven by the CMFD1.0 dataset, which spans the period 1979–2018. The atmospheric dataset used in this study is widely used in Chinese land surface model research. The dataset’s brevity, unfortunately, omits recent data, hindering the assessment of ecosystem responses to modern climate trends. To address this, future studies should prioritize newer, longer-span datasets to better quantify long-term carbon trajectories.
Climatically, the TP is defined by long, frozen winters that restrict biological activity to a brief growing season. Previous studies have shown that most annual carbon uptake occurs within this finite period, while winter carbon exchange is relatively small. Annual NEP can assess the long-term ecosystem carbon balance on the Tibetan Plateau. However, more refined time-series analyses can further deepen our understanding of seasonal carbon-climate interactions. A shift toward seasonal or monthly time-series analysis is needed to elucidate these patterns. This approach would clarify the mechanisms regulating carbon fluxes, offering a deeper understanding of climate-ecosystem interactions.

5. Conclusions

Based on CLM5.0 simulations, this research characterizes the spatiotemporal evolution of Net Ecosystem Productivity (NEP) across the Tibetan Plateau (TP) over the last forty years. We further disentangle the climatic drivers of NEP variability and project its trajectory under varying emission pathways. The key findings are outlined below:
From 1979 to 2018, the TP functioned as a net carbon sink, yielding a mean annual NEP of 23.96 g C m2 yr−1. A slight upward trend (approximately 0.2 g C m2 yr−1) characterized the study period, peaking notably between 2000 and 2009. Spatially, a distinct gradient emerged, with values rising from the northwest toward the southeast. Notably, carbon sink zones covered 67.7% of the region over double the extent of source areas (32.3%), further reinforcing the plateau’s role as a dominant carbon sequestration area.
Among the examined climatic factors, temperature emerged as the dominant driver of NEP variability across the plateau, explaining roughly 68% of the interannual variance, whereas solar radiation and precipitation played secondary roles (21% and 11%, respectively). This thermal dominance was also evident spatially, accounting for 46.5% of spatial variation, followed by radiation (29%) and precipitation (25%). Overall, the long-term increase in NEP appears to be mainly associated with rising temperatures, while variations in solar radiation and precipitation provided secondary influences.
Model projections suggest the TP will persist as a net carbon sink throughout the 21st century across all SSPs. The strength of this sink is expected to increase. This growth, however, is phased, speeding up during the 2051–2075 window before slowing down after 2076. The spatial gradient remains consistent with the past, dominated by a southeast-to-northwest decline. Furthermore, as emission trajectories steepen, carbon sink areas gradually expand, whereas carbon source regions become more limited.
The study provides a scientific basis for ecological management in high-altitude zones. Since temperature drives NEP variability, enhancing vegetation adaptability to warming is crucial. Measures such as grassland restoration, protection of alpine meadow ecosystems, and prevention of land degradation could help sustain ecosystem productivity. Furthermore, safeguarding forest and shrub ecosystems is key to maintaining current sink areas and supporting long-term carbon storage across the region.
Collectively, these results elucidate the mechanisms by which climate variability modulates carbon dynamics on the TP. The findings contribute to a better understanding of how climate change influences ecosystem carbon dynamics in high-altitude regions and offer reference information for regional carbon management and ecological conservation. Future research should prioritize longer forcing datasets and higher temporal resolution; such improvements are key to sharpening regional carbon estimates and clarifying climate–carbon feedback.

Author Contributions

Conceptualization, Y.L.; Methodology, Q.L.; Software, M.L.; Validation, Q.L.; Formal analysis, Y.L. and Y.S.; Writing—original draft, Y.L. and Q.L.; Writing—review and editing, S.P.; Supervision, S.P. All authors have read and agreed to the published version of the manuscript.

Funding

This research was supported in part by the Science and Technology Innovation Platform Open Fund of Oil & Gas Survey, China Geological Survey (OGS2024KC010); in part by the National Natural Science Foundation of China under grant 42542033.

Institutional Review Board Statement

Not applicable.

Informed Consent Statement

Not applicable.

Data Availability Statement

The climate forcing data used in this study were obtained from the China Meteorological Forcing Dataset (CMFD), which is publicly available through the National Qinghai–Tibet Plateau Science Data Center at https://data.tpdc.ac.cn (accessed on 13 September 2025). The CMFD provides near-surface meteorological variables at a temporal resolution of 3 h and a spatial resolution of 0.1°, including air temperature, surface air pressure, specific humidity, wind speed, downward shortwave radiation, downward longwave radiation, and precipitation. No new datasets were generated during the current study.

Acknowledgments

The authors acknowledge the use of the Community Land Model version 5.0 (CLM5.0) for simulating net ecosystem productivity over the Qinghai–Tibet Plateau. We also thank the developers and contributors of CLM5.0 for making the model publicly available, which greatly facilitated this study. The authors have reviewed and edited the output and take full responsibility for the content of this publication.

Conflicts of Interest

The authors declare no conflicts of interest. The funders had no role in the design of the study; in the collection, analyses, or interpretation of data; in the writing of the manuscript; or in the decision to publish the results.

References

  1. Lei, T.; Feng, J.; Zheng, C.; Li, S.; Wang, Y.; Wu, Z.; Lu, J.; Kan, G.; Shao, C.; Jia, J. Review of Drought Impacts on Carbon Cycling in Grassland Ecosystems. Adv. Geosci. 2020, 14, 17. [Google Scholar] [CrossRef]
  2. Schimel, D.S. Terrestrial Ecosystems and the Carbon Cycle. Glob. Change Biol. 1995, 1, 77–91. [Google Scholar] [CrossRef]
  3. Li, Z.; Chen, Y.; Fang, G.; Li, Y. Multivariate Assessment and Attribution of Droughts in Central Asia. Sci. Rep. 2017, 7, 1316. [Google Scholar] [CrossRef] [PubMed]
  4. Contribution of Working Group I to the Sixth Assessment Report of the Intergovernmental Panel on Climate Change. Climate Change 2021: The Physical Science Basis; Masson-Delmotte, V., Zhai, P., Pirani, A., Connors, S.L., Péan, C., Berger, S., Caud, N., Chen, Y., Goldfarb, L., Gomis, M.I., et al., Eds.; Cambridge University Press: Cambridge, UK; New York, NY, USA, 2021. [Google Scholar]
  5. Cui, E.; Bian, C.; Luo, Y.; Niu, S.; Wang, Y.; Xia, J. Spatial Variations in Terrestrial Net Ecosystem Productivity and Its Local Indicators. Biogeosciences 2020, 17, 6237–6246. [Google Scholar] [CrossRef]
  6. Keenan, T.F.; Prentice, I.C.; Canadell, J.G.; Williams, C.A.; Wang, H.; Raupach, M.; Collatz, G.J. Recent Pause in the Growth Rate of Atmospheric CO2 Due to Enhanced Terrestrial Carbon Uptake. Nat. Commun. 2016, 7, 13428. [Google Scholar] [CrossRef]
  7. Yang, S.; Zan, M.; Xue, C.; Zhai, L.; Zhou, J.; Zhao, Z.; Ke, J. Study on Changes in Vegetation Carbon Footprint and Its Influencing Factors in Xinjiang, a Typical Arid Region of China. Land 2025, 15, 10. [Google Scholar] [CrossRef]
  8. Satti, Z.; Naveed, M.; Shafeeque, M.; Zhao, Y.; Li, H.; Zhu, S. Spatiotemporal Dynamics of Net Ecosystem Productivity in the Tibetan Plateau Under Changing Climate Conditions. Earth Syst. Environ. 2025, in press. [Google Scholar] [CrossRef]
  9. Pepin, N.; Bradley, R.S.; Diaz, H.F.; Baraer, M.; Caceres, E.B.; Forsythe, N.; Fowler, H.; Greenwood, G.; Hashmi, M.Z.; Liu, X.D.; et al. Elevation-Dependent Warming in Mountain Regions of the World. Nat. Clim. Change 2015, 5, 424–430. [Google Scholar] [CrossRef]
  10. Schuur, E.A.G.; McGuire, A.D.; Schädel, C.; Grosse, G.; Harden, J.W.; Hayes, D.J.; Hugelius, G.; Koven, C.D.; Kuhry, P.; Lawrence, D.M.; et al. Climate Change and the Permafrost Carbon Feedback. Nature 2015, 520, 171–179. [Google Scholar] [CrossRef]
  11. Sitch, S.; Friedlingstein, P.; Gruber, N.; Jones, S.D.; Murray-Tortarolo, G.; Ahlström, A.; Doney, S.C.; Graven, H.; Heinze, C.; Huntingford, C.; et al. Recent Trends and Drivers of Regional Sources and Sinks of Carbon Dioxide. Biogeosciences 2015, 12, 653–679. [Google Scholar] [CrossRef]
  12. Liu, Y.; Chen, R.; Han, C.; Liu, Z.; Zhao, Y.; Yang, Z. Research on the Characteristics, Driving Mechanism and Spatial Pattern of Carbon Sink in Alpine Ecosystem: A Study Case of Qilian Mountains. Agric. For. Meteorol. 2024, 356, 110166. [Google Scholar] [CrossRef]
  13. Wei, X.; Yang, J.; Luo, P.; Lin, L.; Lin, K.; Guan, J. Assessment of the Variation and Influencing Factors of Vegetation NPP and Carbon Sink Capacity under Different Natural Conditions. Ecol. Indic. 2022, 138, 108834. [Google Scholar] [CrossRef]
  14. Huntzinger, D.N.; Michalak, A.M.; Schwalm, C.; Ciais, P.; King, A.W.; Fang, Y.; Schaefer, K.; Wei, Y.; Cook, R.B.; Fisher, J.B.; et al. Uncertainty in the Response of Terrestrial Carbon Sink to Environmental Drivers Undermines Carbon-Climate Feedback Predictions. Sci. Rep. 2017, 7, 4765. [Google Scholar] [CrossRef] [PubMed]
  15. Levy, P.E.; Cannell, M.G.R.; Friend, A.D. Modelling the Impact of Future Changes in Climate, CO2 Concentration and Land Use on Natural Ecosystems and the Terrestrial Carbon Sink. Glob. Environ. Change 2004, 14, 21–30. [Google Scholar] [CrossRef]
  16. Liu, X.; Wang, S.; Zhuang, Q.; Jin, X.; Bian, Z.; Zhou, M.; Meng, Z.; Han, C.; Guo, X.; Jin, W.; et al. A Review on Carbon Source and Sink in Arable Land Ecosystems. Land 2022, 11, 580. [Google Scholar] [CrossRef]
  17. Na, Y.-S.; Yeh, S.-W. Changes in Vegetation-Induced Carbon Sequestration in East Asia Under Global Warming in CMIP6 Earth System Models. Earth Syst. Environ. 2025, 9, 1635–1650. [Google Scholar] [CrossRef]
  18. Bilir, T.E.; Bloom, A.A.; Konings, A.G.; Liu, J.; Parazoo, N.C.; Quetin, G.R.; Norton, A.J.; Worden, M.A.; Levine, P.A.; Ma, S.; et al. Satellite-Constrained Reanalysis Reveals CO2 Versus Climate Process Compensation Across the Global Land Carbon Sink. AGU Adv. 2025, 6, e2025AV001689. [Google Scholar] [CrossRef]
  19. Feng, S.; Li, W.; Xu, J.; Liang, T.; Ma, X.; Wang, W.; Yu, H. Land Use/Land Cover Mapping Based on GEE for the Monitoring of Changes in Ecosystem Types in the Upper Yellow River Basin over the Tibetan Plateau. Remote Sens. 2022, 14, 5361. [Google Scholar] [CrossRef]
  20. Huang, L.; Jia, G.; Fang, S.; Shangguan, D.; Hu, Y.; Zhang, Z.; Peng, D. Big Earth Data for UN Sustainable Development Goals: Climate Change and Action. Bull. Chin. Acad. Sci. 2021, 36, 923–931. [Google Scholar]
  21. Liu, Q.; Yao, X.; Zhao, C.; Cheng, X. Effects of Enhanced UV-B Radiation on Growth and Photosynthetic Responses of Four Species of Seedlings in Subalpine Forests of the Eastern Tibet Plateau. Environ. Exp. Bot. 2011, 74, 151–156. [Google Scholar] [CrossRef]
  22. Liu, M.; Bai, X.; Tan, Q.; Luo, G.; Zhao, C.; Wu, L.; Chen, F.; Li, C.; Yang, Y.; Ran, C.; et al. Climate Change Enhanced the Positive Contribution of Human Activities to Net Ecosystem Productivity from 1983 to 2018. Front. Ecol. Evol. 2023, 10, 1101135. [Google Scholar] [CrossRef]
  23. Zheng, J.; Mao, F.; Du, H.; Li, X.; Zhou, G.; Dong, L.; Zhang, M.; Han, N.; Liu, T.; Xing, L. Spatiotemporal Simulation of Net Ecosystem Productivity and Its Response to Climate Change in Subtropical Forests. Forests 2019, 10, 708. [Google Scholar] [CrossRef]
  24. Nayak, R.K.; Patel, N.R.; Dadhwal, V.K. Inter-Annual Variability and Climate Control of Terrestrial Net Primary Productivity over India. Int. J. Climatol. 2013, 33, 132–142. [Google Scholar] [CrossRef]
  25. Uribe, M.R.; Sierra, C.A.; Dukes, J.S. Seasonality of Tropical Photosynthesis: A Pantropical Map of Correlations with Precipitation and Radiation and Comparison to Model Outputs. J. Geophys. Res. Biogeosci. 2021, 126, e2020JG006123. [Google Scholar] [CrossRef]
  26. Wang, L.; Chen, W.; Song, W.; Huang, N.; Zhang, Y.; Li, G.; Zhang, X.; Peng, Y.; Niu, Z. Spatiotemporal Dynamics of NEP and Its Influencing Factors: Exploring the Impact Mechanisms Under Extreme Climate Conditions. Remote Sens. 2025, 17, 3633. [Google Scholar] [CrossRef]
  27. Zhao, N.; Zhou, L.; Zhuang, J.; Wang, Y.; Zhou, W.; Chen, J.; Song, J.; Ding, J.; Chi, Y. Integration Analysis of the Carbon Sources and Sinks in Terrestrial Ecosystems, China. Acta Ecol. Sin. 2021, 41, 7648–7658. [Google Scholar] [CrossRef]
  28. Gitelson, A.A.; Peng, Y.; Arkebauer, T.J.; Suyker, A.E. Productivity, Absorbed Photosynthetically Active Radiation, and Light Use Efficiency in Crops: Implications for Remote Sensing of Crop Primary Production. J. Plant Physiol. 2015, 177, 100–109. [Google Scholar] [CrossRef]
  29. Keenan, T.F.; Davidson, E.; Moffat, A.M.; Munger, W.; Richardson, A.D. Using Model-data Fusion to Interpret Past Trends, and Quantify Uncertainties in Future Projections, of Terrestrial Ecosystem Carbon Cycling. Glob. Change Biol. 2012, 18, 2555–2569. [Google Scholar] [CrossRef]
  30. Wang, S.; Che, Y.; Pang, H.; Du, J.; Zhang, Z. Accelerated Changes of Glaciers in the Yulong Snow Mountain, Southeast Qinghai-Tibetan Plateau. Reg. Environ. Change 2020, 20, 38. [Google Scholar] [CrossRef]
  31. Wang, T.; Yang, D.; Yang, Y.; Piao, S.; Li, X.; Cheng, G.; Fu, B. Permafrost Thawing Puts the Frozen Carbon at Risk over the Tibetan Plateau. Sci. Adv. 2020, 6, eaaz3513. [Google Scholar] [CrossRef]
  32. Wei, D.; Qi, Y.; Ma, Y.; Wang, X.; Ma, W.; Gao, T.; Huang, L.; Zhao, H.; Zhang, J.; Wang, X. Plant Uptake of CO2 Outpaces Losses from Permafrost and Plant Respiration on the Tibetan Plateau. Proc. Natl. Acad. Sci. USA 2021, 118, e2015283118. [Google Scholar] [CrossRef] [PubMed]
  33. Wu, T.; Ma, W.; Wu, X.; Li, R.; Qiao, Y.; Li, X.; Yue, G.; Zhu, X.; Ni, J. Weakening of Carbon Sink on the Qinghai–Tibet Plateau. Geoderma 2022, 412, 115707. [Google Scholar] [CrossRef]
  34. Zheng, Z.; Zhu, W.; Zhang, Y. Seasonally and Spatially Varied Controls of Climatic Factors on Net Primary Productivity in Alpine Grasslands on the Tibetan Plateau. Glob. Ecol. Conserv. 2020, 21, e00814. [Google Scholar] [CrossRef]
  35. Yang, K.; Wu, H.; Qin, J.; Lin, C.; Tang, W.; Chen, Y. Recent Climate Changes over the Tibetan Plateau and Their Impacts on Energy and Water Cycle: A Review. Glob. Planet. Change 2014, 112, 79–91. [Google Scholar] [CrossRef]
  36. Xu, S.; Zhang, M.; Su, M. Estimation of Grassland Productivity in the Period 1978–2021 and Prediction under Different Climate Scenarios in the Period 2021–2100 in the Qinghai-Tibet Plateau in China. Glob. Ecol. Conserv. 2023, 43, e02449. [Google Scholar] [CrossRef]
  37. Xu, D.; Mou, W.; Wang, X.; Zhang, R.; Gao, T.; Ai, D.; Yuan, J.; Zhang, R.; Fang, X. Consistent Responses of Ecosystem CO2 Exchange to Grassland Degradation in Alpine Meadow of the Qinghai-Tibetan Plateau. Ecol. Indic. 2022, 141, 109036. [Google Scholar] [CrossRef]
  38. Denning, A.S.; Collatz, G.J.; Zhang, C.; Randall, D.A.; Berry, J.A.; Sellers, P.J.; Colell, G.D.; Dazlich, D.A. Simulations of Terrestrial Carbon Metabolism and Atmospheric CO2 in a General Circulation Model. Part 1: Surface Carbon Fluxes. Tellus B 1996, 48, 521–542. [Google Scholar] [CrossRef]
  39. Han, L.; Wang, Q.-F.; Chen, Z.; Yu, G.-R.; Zhou, G.-S.; Chen, S.-P.; Li, Y.-N.; Zhang, Y.-P.; Yan, J.-H.; Wang, H.-M.; et al. Spatial Patterns and Climate Controls of Seasonal Variations in Carbon Fluxes in China’s Terrestrial Ecosystems. Glob. Planet. Change 2020, 189, 103175. [Google Scholar] [CrossRef]
  40. Piao, S.; He, Y.; Wang, X.; Chen, F. Estimation of China’s Terrestrial Ecosystem Carbon Sink: Methods, Progress and Prospects. Sci. China Earth Sci. 2022, 65, 641–651. [Google Scholar] [CrossRef]
  41. Qi, S.; Zhang, H.; Zhang, M. Evolutionary Characteristics of Carbon Sources/Sinks in Chinese Terrestrial Ecosystems Regarding to Temporal Effects and Geographical Partitioning. Ecol. Indic. 2024, 160, 111923. [Google Scholar] [CrossRef]
  42. Wang, X.; Yang, M.; Pang, G.; Wan, G.; Chen, X. Simulation and Improvement of Land Surface Processes in Nameqie, Central Tibetan Plateau, Using the Community Land Model (CLM3.5). Environ. Earth Sci. 2015, 73, 7343–7357. [Google Scholar] [CrossRef]
  43. Zhou, Y.; Zhang, L.; Xiao, J.; Chen, S.; Kato, T.; Zhou, G. A Comparison of Satellite-Derived Vegetation Indices for Approximating Gross Primary Productivity of Grasslands. Rangel. Ecol. Manag. 2014, 67, 9–18. [Google Scholar] [CrossRef]
  44. Jia, W.; Liu, M.; Wang, D.; He, H.; Shi, P.; Li, Y.; Wang, Y. Uncertainty in Simulating Regional Gross Primary Productivity from Satellite-Based Models over Northern China Grassland. Ecol. Indic. 2018, 88, 134–143. [Google Scholar] [CrossRef]
  45. Yang, L.; Feng, Q.; Adamowski, J.F.; Alizadeh, M.R.; Yin, Z.; Wen, X.; Zhu, M. The Role of Climate Change and Vegetation Greening on the Variation of Terrestrial Evapotranspiration in Northwest China’s Qilian Mountains. Sci. Total Environ. 2021, 759, 143532. [Google Scholar] [CrossRef]
  46. Yan, L.; Zhou, G.S.; Wang, Y.H.; Hu, T.Y.; Sui, X.H. The Spatial and Temporal Dynamics of Carbon Budget in the Alpine Grasslands on the Qinghai-Tibetan Plateau Using the Terrestrial Ecosystem Model. J. Clean. Prod. 2015, 107, 195–201. [Google Scholar] [CrossRef]
  47. Deng, M.; Meng, X.; Lyv, Y.; Zhao, L.; Li, Z.; Hu, Z.; Jing, H. Comparison of Soil Water and Heat Transfer Modeling over the Tibetan Plateau Using Two Community Land Surface Model (CLM) Versions. J. Adv. Model. Earth Syst. 2020, 12, e2020MS002189. [Google Scholar] [CrossRef]
  48. Lawrence, D.M.; Fisher, R.A.; Koven, C.D.; Oleson, K.W.; Swenson, S.C.; Bonan, G.; Collier, N.; Ghimire, B.; Van Kampenhout, L.; Kennedy, D.; et al. The Community Land Model Version 5: Description of New Features, Benchmarking, and Impact of Forcing Uncertainty. J. Adv. Model. Earth Syst. 2019, 11, 4245–4287. [Google Scholar] [CrossRef]
  49. Wang, D.; Wang, D.; Mei, Y.; Yang, Q.; Ji, M.; Li, Y.; Liu, S.; Li, B.; Huang, Y.; Mo, C. Estimates of the Land Surface Hydrology from the Community Land Model Version 5 (CLM5) with Three Meteorological Forcing Datasets over China. Remote Sens. 2024, 16, 550. [Google Scholar] [CrossRef]
  50. Peng, Q.; Jia, B.; Lai, X.; Wang, L.; Huang, Q. Characteristics of Near-surface Soil Freeze–Thaw Status Using High Resolution CLM5.0 Simulations on the Tibetan Plateau. Atmos. Sci. Lett. 2023, 24, e1168. [Google Scholar] [CrossRef]
  51. Yang, S.; Li, R.; Zhao, L.; Wu, T.; Wu, X.; Zhang, Y.; Shi, J.; Qiao, Y. Evaluation of the Performance of CLM5.0 in Soil Hydrothermal Dynamics in Permafrost Regions on the Qinghai–Tibet Plateau. Remote Sens. 2022, 14, 6228. [Google Scholar] [CrossRef]
  52. Duarte, H.F.; Sun, G.; Aguilos, M.; McNulty, S.; Kim, J.B.; Starr, G.; Xiao, J. Assessing the Community Land Model (CLM5) for Quantifying Energy, Water, and Carbon Balances in Loblolly and Longleaf Pine Ecosystems in Southeastern United States. J. Geophys. Res. Biogeosci. 2025, 130, e2025JG009014. [Google Scholar] [CrossRef]
  53. Peng, Q.; Jia, B.; Lai, X.; Wang, L.; Huang, Q. Increasing Gross Primary Productivity under Soil Warming and Wetting on the Tibetan Plateau. Environ. Res. Lett. 2024, 19, 024021. [Google Scholar] [CrossRef]
  54. Hao, R.; Yu, D.; Huang, T.; Li, S.; Qiao, J. NPP Plays a Constraining Role on Water-Related Ecosystem Services in an Alpine Ecosystem of Qinghai, China. Ecol. Indic. 2022, 138, 108846. [Google Scholar] [CrossRef]
  55. Ma, X.; Wang, A. Systematic Evaluation of a High-Resolution CLM5 Simulation over Continental China for 1979–2018. J. Hydrometeorol. 2022, 23, 1879–1897. [Google Scholar] [CrossRef]
  56. Deng, M.; Meng, X.; Lu, Y.; Li, Z.; Zhao, L.; Niu, H.; Chen, H.; Shang, L.; Wang, S.; Sheng, D. The Response of Vegetation to Regional Climate Change on the Tibetan Plateau Based on Remote Sensing Products and the Dynamic Global Vegetation Model. Remote Sens. 2022, 14, 3337. [Google Scholar] [CrossRef]
  57. Malle, J.T.; Mazzotti, G.; Karger, D.N.; Jonas, T. Regionally Optimized High-Resolution Input Datasets Enhance the Representation of Snow Cover in CLM5. Earth Syst. Dyn. 2024, 15, 1073–1115. [Google Scholar] [CrossRef]
  58. Deng, M.; Meng, X.; Lu, Y.; Shu, L.; Li, Z.; Zhao, L.; Chen, H.; Shang, L.; Sheng, D.; Ao, X. Impact of Climatic and Vegetation Dynamic Change on Runoff over the Three Rivers Source Region Based on the Community Land Model. Clim. Dyn. 2023, 61, 1193–1208. [Google Scholar] [CrossRef]
  59. Li, M.; Li, Q.; Xue, M. Spatio-Temporal Changes of Vegetation Net Primary Productivity and Its Driving Factors on the Tibetan Plateau from 1979 to 2018. Atmosphere 2024, 15, 579. [Google Scholar] [CrossRef]
  60. Wen, B.; Zhang, T.; Zhou, X.; Yi, G.; Li, J.; Bie, X.; Chen, Y. Variation Characteristics of Frozen Ground Degradation in the Qinghai-Tibet Plateau Observed Using Time Series Data of MODIS from 2000 to 2020. Theor. Appl. Climatol. 2023, 151, 1673–1686. [Google Scholar] [CrossRef]
  61. Liu, X.; Li, H.; Zhou, Y.; Wang, X. Spatiotemporal Dynamics of Vegetation Net Primary Productivity in Chinese Ecological Function Conservation Areas: The Influences of Climate and Topography. J. Nat. Conserv. 2025, 84, 126846. [Google Scholar] [CrossRef]
  62. Jiang, W.; Yuan, L.; Wang, W.; Cao, R.; Zhang, Y.; Shen, W. Spatio-Temporal Analysis of Vegetation Variation in the Yellow River Basin. Ecol. Indic. 2015, 51, 117–126. [Google Scholar] [CrossRef]
  63. Xu, L.; Xu, R.; Peng, W. Vegetation Phenological Responses to Multi-Factor Climate Forcing on the Tibetan Plateau: Nonlinear and Spatially Heterogeneous Mechanisms. Land 2025, 14, 2238. [Google Scholar] [CrossRef]
  64. Zhao, J.; Ma, J.; Zhu, Y. Evaluating Impacts of Climate Change on Net Ecosystem Productivity (NEP) of Global Different Forest Types Based on an Individual Tree-Based Model FORCCHN and Remote Sensing. Glob. Planet. Change 2019, 182, 103010. [Google Scholar] [CrossRef]
  65. Du, Q.; Yi, G.; Zhou, X.; Zhang, T.; Li, J.; Xie, H.; Hu, J. Analysis of Asymmetry in Diurnal Warming and Its Impact on Vegetation Phenology in the Qinghai-Tibetan Plateau Using MODIS Remote Sensing Data. J. Appl. Remote Sens. 2021, 15, 028502. [Google Scholar] [CrossRef]
  66. Guo, D.; Song, X.; Hu, R.; Zhu, X.; Jiang, Y.; Cai, S.; Zhang, Y.; Cui, X. Large-Scale Analysis of the Spatiotemporal Changes of Net Ecosystem Production in Hindu Kush Himalayan Region. Remote Sens. 2021, 13, 1180. [Google Scholar] [CrossRef]
  67. Hu, Z.; Niu, B.; Tang, J.; Zhang, Y.; Xiang, M.; Zhang, X. Has the Dominant Climatic Driver for the Carbon Budget of Alpine Grassland Shifted from Temperature to Precipitation on the Qinghai–Tibet Plateau? Remote Sens. 2023, 15, 2492. [Google Scholar] [CrossRef]
  68. Liu, B.; Tang, Q.; Zhou, Y.; Zeng, T.; Zhou, T. The Sensitivity of Vegetation Dynamics to Climate Change across the Tibetan Plateau. Atmosphere 2022, 13, 1112. [Google Scholar] [CrossRef]
  69. Gao, Y.; Zhou, X.; Wang, Q.; Wang, C.; Zhan, Z.; Chen, L.; Yan, J.; Qu, R. Vegetation Net Primary Productivity and Its Response to Climate Change during 2001–2008 in the Tibetan Plateau. Sci. Total Environ. 2013, 444, 356–362. [Google Scholar] [CrossRef]
  70. Diao, C.; Liu, Y.; Zhao, L.; Zhuo, G.; Zhang, Y. Regional-Scale Vegetation-Climate Interactions on the Qinghai-Tibet Plateau. Ecol. Inform. 2021, 65, 101413. [Google Scholar] [CrossRef]
  71. Yang, K.; He, J.; Tang, W.; Lu, H.; Qin, J.; Chen, Y.; Li, X. China Meteorological Forcing Dataset v1.6 (1979–2018). Natl. Tibet. Plateau Data Cent. 2025. [Google Scholar] [CrossRef]
  72. Ran, Y.; Li, X.; Cheng, G. Climate Warming over the Past Half Century Has Led to Thermal Degradation of Permafrost on the Qinghai–Tibet Plateau. Cryosphere 2018, 12, 595–608. [Google Scholar] [CrossRef]
  73. Qu, Q.; Jian, S.; Chen, A.; Xiao, C. Investigating the Dynamic Change and Driving Force of Vegetation Carbon Sink in Taihang Mountain, China. Land 2024, 13, 1348. [Google Scholar] [CrossRef]
  74. Zhao, W.; Li, A. A Review on Land Surface Processes Modelling over Complex Terrain. Adv. Meteorol. 2015, 2015, 607181. [Google Scholar] [CrossRef]
  75. Fisher, R.A.; Wieder, W.R.; Sanderson, B.M.; Koven, C.D.; Oleson, K.W.; Xu, C.; Fisher, J.B.; Shi, M.; Walker, A.P.; Lawrence, D.M. Parametric Controls on Vegetation Responses to Biogeochemical Forcing in the CLM5. J. Adv. Model. Earth Syst. 2019, 11, 2879–2895. [Google Scholar] [CrossRef]
  76. Danabasoglu, G.; Lamarque, J.-F.; Bacmeister, J.; Bailey, D.A.; DuVivier, A.K.; Edwards, J.; Emmons, L.K.; Fasullo, J.; Garcia, R.; Gettelman, A.; et al. The Community Earth System Model Version 2 (CESM2). J. Adv. Model. Earth Syst. 2020, 12, e2019MS001916. [Google Scholar] [CrossRef]
  77. Medlyn, B.E.; Duursma, R.A.; Eamus, D.; Ellsworth, D.S.; Prentice, I.C.; Barton, C.V.M.; Crous, K.Y.; De Angelis, P.; Freeman, M.; Wingate, L. Reconciling the Optimal and Empirical Approaches to Modelling Stomatal Conductance: Reconciling Optimal and Empirical Stomatal Models. Glob. Change Biol. 2011, 17, 2134–2144. [Google Scholar] [CrossRef]
  78. Ali, A.A.; Xu, C.; Rogers, A.; Fisher, R.A.; Wullschleger, S.D.; Massoud, E.C.; Vrugt, J.A.; Muss, J.D.; McDowell, N.G.; Fisher, J.B.; et al. A Global Scale Mechanistic Model of Photosynthetic Capacity (LUNA V1.0). Geosci. Model Dev. 2016, 9, 587–606. [Google Scholar] [CrossRef]
  79. Ghimire, B.; Riley, W.J.; Koven, C.D.; Mu, M.; Randerson, J.T. Representing Leaf and Root Physiological Traits in CLM Improves Global Carbon and Nitrogen Cycling Predictions. J. Adv. Model. Earth Syst. 2016, 8, 598–613. [Google Scholar] [CrossRef]
  80. Schädel, C.; Rogers, B.M.; Lawrence, D.M.; Koven, C.D.; Brovkin, V.; Burke, E.J.; Genet, H.; Huntzinger, D.N.; Jafarov, E.; McGuire, A.D.; et al. Earth System Models Must Include Permafrost Carbon Processes. Nat. Clim. Change 2024, 14, 114–116. [Google Scholar] [CrossRef]
  81. Wylie, B.K.; Fosnight, E.A.; Gilmanov, T.G.; Frank, A.B.; Morgan, J.A.; Haferkamp, M.R.; Meyers, T.P. Adaptive Data-Driven Models for Estimating Carbon Fluxes in the Northern Great Plains. Remote Sens. Environ. 2007, 106, 399–413. [Google Scholar] [CrossRef]
  82. Fang, Y.; Liu, C.; Leung, L.R. Accelerating the Spin-up of the Coupled Carbon and Nitrogen Cycle Model in CLM4. Geosci. Model Dev. 2015, 8, 781–789. [Google Scholar] [CrossRef]
  83. Kang, Z.; Qiu, B.; Xiang, Z.; Liu, Y.; Lin, Z.; Guo, W. Improving Simulations of Vegetation Dynamics over the Tibetan Plateau: Role of Atmospheric Forcing Data and Spatial Resolution. Adv. Atmos. Sci. 2022, 39, 1115–1132. [Google Scholar] [CrossRef]
  84. Wieder, W.R.; Cleveland, C.C.; Smith, W.K.; Todd-Brown, K. Future Productivity and Carbon Storage Limited by Terrestrial Nutrient Availability. Nat. Geosci. 2015, 8, 441–444. [Google Scholar] [CrossRef]
  85. Shuai, C.; Chen, X.; Wu, Y.; Tan, Y.; Zhang, Y.; Shen, L. Identifying the Key Impact Factors of Carbon Emission in China: Results from a Largely Expanded Pool of Potential Impact Factors. J. Clean. Prod. 2018, 175, 612–623. [Google Scholar] [CrossRef]
  86. Phillips, R.L.; Beeri, O. Scaling-up Knowledge of Growing-season Net Ecosystem Exchange for Long-term Assessment of North Dakota Grasslands under the Conservation Reserve Program. Glob. Change Biol. 2008, 14, 1008–1017. [Google Scholar] [CrossRef]
  87. Zhao, F.; Wu, Y.; Sivakumar, B.; Long, A.; Qiu, L.; Chen, J.; Wang, L.; Liu, S.; Hu, H. Climatic and Hydrologic Controls on Net Primary Production in a Semiarid Loess Watershed. J. Hydrol. 2019, 568, 803–815. [Google Scholar] [CrossRef]
  88. Li, Z.; Chen, Y.; Zhang, Q.; Li, Y. Spatial Patterns of Vegetation Carbon Sinks and Sources under Water Constraint in Central Asia. J. Hydrol. 2020, 590, 125355. [Google Scholar] [CrossRef]
  89. Friedlingstein, P.; O’Sullivan, M.; Jones, M.W.; Andrew, R.M.; Hauck, J.; Landschützer, P.; Le Quéré, C.; Li, H.; Luijkx, I.T.; Olsen, A.; et al. Global Carbon Budget 2024. Earth Syst. Sci. Data 2025, 17, 965–1039. [Google Scholar] [CrossRef]
  90. Piao, S.; Tan, J.; Chen, A.; Fu, Y.H.; Ciais, P.; Liu, Q.; Janssens, I.A.; Vicca, S.; Zeng, Z.; Jeong, S.-J.; et al. Leaf Onset in the Northern Hemisphere Triggered by Daytime Temperature. Nat. Commun. 2015, 6, 6911. [Google Scholar] [CrossRef]
  91. Teng, H.; Luo, Z.; Chang, J.; Shi, Z.; Chen, S.; Zhou, Y.; Ciais, P.; Tian, H. Climate Change-Induced Greening on the Tibetan Plateau Modulated by Mountainous Characteristics. Environ. Res. Lett. 2021, 16, 064064. [Google Scholar] [CrossRef]
  92. Li, X.; Zhang, K.; Li, X. Responses of Vegetation Growth to Climate Change over the Tibetan Plateau from 1982 to 2018. Environ. Res. Commun. 2022, 4, 045007. [Google Scholar] [CrossRef]
  93. Shen, M.; Piao, S.; Chen, X.; An, S.; Fu, Y.H.; Wang, S.; Cong, N.; Janssens, I.A. Strong Impacts of Daily Minimum Temperature on the Green-up Date and Summer Greenness of the Tibetan Plateau. Glob. Change Biol. 2016, 22, 3057–3066. [Google Scholar] [CrossRef] [PubMed]
  94. Wang, Y.; Liu, H.; Chung, H.; Yu, L.; Mi, Z.; Geng, Y.; Jing, X.; Wang, S.; Zeng, H.; Cao, G.; et al. Non-growing-season Soil Respiration Is Controlled by Freezing and Thawing Processes in the Summer Monsoon-dominated Tibetan Alpine Grassland. Glob. Biogeochem. Cycles 2014, 28, 1081–1095. [Google Scholar] [CrossRef]
  95. Zhang, D.; Zhao, Y.; Wu, J. Assessment of Carbon Balance Attribution and Carbon Storage Potential in China’s Terrestrial Ecosystem. Resour. Conserv. Recycl. 2023, 189, 106748. [Google Scholar] [CrossRef]
  96. Shen, M.; Piao, S.; Cong, N.; Zhang, G.; Jassens, I.A. Precipitation Impacts on Vegetation Spring Phenology on the Tibetan Plateau. Glob. Change Biol. 2015, 21, 3647–3656. [Google Scholar] [CrossRef]
  97. Chen, B.; Zhang, X.; Tao, J.; Wu, J.; Wang, J.; Shi, P.; Zhang, Y.; Yu, C. The Impact of Climate Change and Anthropogenic Activities on Alpine Grassland over the Qinghai-Tibet Plateau. Agric. For. Meteorol. 2014, 189–190, 11–18. [Google Scholar] [CrossRef]
  98. Mu, Q.; Zhao, M.; Running, S.W. Improvements to a MODIS Global Terrestrial Evapotranspiration Algorithm. Remote Sens. Environ. 2011, 115, 1781–1800. [Google Scholar] [CrossRef]
  99. Ahlström, A.; Raupach, M.R.; Schurgers, G.; Smith, B.; Arneth, A.; Jung, M.; Reichstein, M.; Canadell, J.G.; Friedlingstein, P.; Jain, A.K.; et al. The Dominant Role of Semi-Arid Ecosystems in the Trend and Variability of the Land CO2 Sink. Science 2015, 348, 895–899. [Google Scholar] [CrossRef]
  100. Zhang, L.; Wylie, B.K.; Ji, L.; Gilmanov, T.G.; Tieszen, L.L.; Howard, D.M. Upscaling Carbon Fluxes over the Great Plains Grasslands: Sinks and Sources. J. Geophys. Res. 2011, 116, G00J03. [Google Scholar] [CrossRef]
  101. Hari, M.; Tyagi, B. Terrestrial Carbon Cycle: Tipping Edge of Climate Change between the Atmosphere and Biosphere Ecosystems. Environ. Sci. Atmos. 2022, 2, 867–890. [Google Scholar] [CrossRef]
  102. Zhang, Q.; Yang, J.; Wang, W.; Ma, P.; Lu, G.; Liu, X.; Yu, H.; Fang, F. Climatic Warming and Humidification in the Arid Region of Northwest China: Multi-Scale Characteristics and Impacts on Ecological Vegetation. J. Meteorol. Res. 2021, 35, 113–127. [Google Scholar] [CrossRef]
  103. Zha, X.; Niu, B.; Li, M.; Duan, C. Increasing Impact of Precipitation on Alpine-Grassland Productivity over Last Two Decades on the Tibetan Plateau. Remote Sens. 2022, 14, 3430. [Google Scholar] [CrossRef]
  104. Wang, H.; Liu, H.; Cao, G.; Ma, Z.; Li, Y.; Zhang, F.; Zhao, X.; Zhao, X.; Jiang, L.; Sanders, N.J.; et al. Alpine Grassland Plants Grow Earlier and Faster but Biomass Remains Unchanged over 35 Years of Climate Change. Ecol. Lett. 2020, 23, 701–710. [Google Scholar] [CrossRef]
  105. Yang, X.; Wu, J.; Chen, X.; Ciais, P.; Maignan, F.; Yuan, W.; Piao, S.; Yang, S.; Gong, F.; Su, Y.; et al. A Comprehensive Framework for Seasonal Controls of Leaf Abscission and Productivity in Evergreen Broadleaved Tropical and Subtropical Forests. Innovation 2021, 2, 100154. [Google Scholar] [CrossRef]
  106. Davidson, E.A.; Janssens, I.A. Temperature Sensitivity of Soil Carbon Decomposition and Feedbacks to Climate Change. Nature 2006, 440, 165–173. [Google Scholar] [CrossRef]
  107. Luo, Y. Terrestrial Carbon–Cycle Feedback to Climate Warming. Annu. Rev. Ecol. Evol. Syst. 2007, 38, 683–712. [Google Scholar] [CrossRef]
  108. Lin, X.; Han, P.; Zhang, W.; Wang, G. Sensitivity of Alpine Grassland Carbon Balance to Interannual Variability in Climate and Atmospheric CO2 on the Tibetan Plateau during the Last Century. Glob. Planet. Change 2017, 154, 23–32. [Google Scholar] [CrossRef]
  109. Gu, J.; Yang, F.; Song, X.; Yang, S.; Zhang, G.-L. Edaphic Regulation of Soil Organic Carbon Fractions in the Mattic Layer across the Qinghai-Tibetan Plateau. Sci. Total Environ. 2024, 943, 173814. [Google Scholar] [CrossRef] [PubMed]
  110. Wang, J.; Sun, H.; Xiong, J.; He, D.; Cheng, W.; Ye, C.; Yong, Z.; Huang, X. Dynamics and Drivers of Vegetation Phenology in Three-River Headwaters Region Based on the Google Earth Engine. Remote Sens. 2021, 13, 2528. [Google Scholar] [CrossRef]
  111. Natali, S.M.; Schuur, E.A.G.; Mauritz, M.; Schade, J.D.; Celis, G.; Crummer, K.G.; Johnston, C.; Krapek, J.; Pegoraro, E.; Salmon, V.G.; et al. Permafrost Thaw and Soil Moisture Driving CO2 and CH4 Release from Upland Tundra. J. Geophys. Res. Biogeosci. 2015, 120, 525–537. [Google Scholar] [CrossRef]
  112. Running, S.W.; Nemani, R.R.; Heinsch, F.A.; Zhao, M.; Reeves, M.; Hashimoto, H. A Continuous Satellite-Derived Measure of Global Terrestrial Primary Production. BioScience 2004, 54, 547. [Google Scholar] [CrossRef]
  113. Zeng, N.; Ren, X.; He, H.; Zhang, L.; Niu, Z. Precipitation Conditions Constrain the Sensitivity of Aboveground Net Primary Productivity in Tibetan Plateau Grasslands to Climate Change. Remote Sens. 2023, 15, 2591. [Google Scholar] [CrossRef]
  114. Li, H.; Wu, Y.; Liu, S.; Xiao, J. Regional Contributions to Interannual Variability of Net Primary Production and Climatic Attributions. Agric. For. Meteorol. 2021, 303, 108384. [Google Scholar] [CrossRef]
  115. Ye, C.; Sun, J.; Liu, M.; Xiong, J.; Zong, N.; Hu, J.; Huang, Y.; Duan, X.; Tsunekawa, A. Concurrent and Lagged Effects of Extreme Drought Induce Net Reduction in Vegetation Carbon Uptake on Tibetan Plateau. Remote Sens. 2020, 12, 2347. [Google Scholar] [CrossRef]
  116. Reichstein, M.; Rey, A.; Freibauer, A.; Tenhunen, J.; Valentini, R.; Banza, J.; Casals, P.; Cheng, Y.; Grünzweig, J.M.; Irvine, J.; et al. Modeling Temporal and Large-scale Spatial Variability of Soil Respiration from Soil Water Availability, Temperature and Vegetation Productivity Indices. Glob. Biogeochem. Cycles 2003, 17, 2003GB002035. [Google Scholar] [CrossRef]
  117. Ainsworth, E.A.; Long, S.P. What Have We Learned from 15 Years of Free-air CO2 Enrichment (FACE)? A Meta-analytic Review of the Responses of Photosynthesis, Canopy Properties and Plant Production to Rising CO2. New Phytol. 2005, 165, 351–372. [Google Scholar] [CrossRef]
  118. Crowther, T.W.; Todd-Brown, K.E.O.; Rowe, C.W.; Wieder, W.R.; Carey, J.C.; Machmuller, M.B.; Snoek, B.L.; Fang, S.; Zhou, G.; Allison, S.D.; et al. Quantifying Global Soil Carbon Losses in Response to Warming. Nature 2016, 540, 104–108. [Google Scholar] [CrossRef]
  119. Natali, S.M.; Watts, J.D.; Rogers, B.M.; Potter, S.; Ludwig, S.M.; Selbmann, A.-K.; Sullivan, P.F.; Abbott, B.W.; Arndt, K.A.; Birch, L.; et al. Large Loss of CO2 in Winter Observed across the Northern Permafrost Region. Nat. Clim. Change 2019, 9, 852–857. [Google Scholar] [CrossRef]
  120. Cuo, L.; Zhang, Y.; Li, N. Historical and Future Vegetation Changes in the Degraded Frozen Soil and the Entire Tibetan Plateau and Climate Drivers. J. Geophys. Res. Biogeosci. 2022, 127, e2022JG006987. [Google Scholar] [CrossRef]
Figure 1. Information on the TP: (a) Geographic location; (b) Temporal trends of meteorological factors (precipitation, temperature) from 1979 to 2018.
Atmosphere 17 00317 g001
Figure 2. Workflow chat.
Atmosphere 17 00317 g002
Figure 3. Trends in the simulated NEP by CLM5.0 from 1979 to 2018.
Atmosphere 17 00317 g003
Figure 4. Spatial distribution and variations in NEP: (a) Spatial distribution of NEP; (b) NEP trends during 1979–2018.
Atmosphere 17 00317 g004
Figure 5. Spatial distribution and variations in NEP: (a) Average NEP spatial distribution (b) Areal percentage of NEP.
Atmosphere 17 00317 g005
Figure 6. Spatial patterns of NEP trends across the TP from 1979 to 2018 under different environmental drivers; dashed lines denote fitted linear trends.
Atmosphere 17 00317 g006
Figure 7. Dominant factors of NEP on the TP from 1979 to 2018.
Atmosphere 17 00317 g007
Figure 8. Spatial patterns of NEP trends across the TP during 1979–2018 in response to different meteorological drivers: (a) precipitation, (b) solar radiation, and (c) temperature.
Atmosphere 17 00317 g008
Figure 9. Values of NEP under different SSP scenarios in the TP during 2025−2100 (a) Values (b) Increasing Rate.
Atmosphere 17 00317 g009
Figure 10. Spatial distribution of NEP in the TP under different SSP scenarios in the future.
Atmosphere 17 00317 g010
Figure 11. Spatial variation in NEP in the TP under different SSP scenarios in the future.
Atmosphere 17 00317 g011
Figure 12. Spatial patterns of NPP trends across the TP during 1979–2018 in response to different meteorological drivers: (a) precipitation, (b) solar radiation, and (c) temperature.
Atmosphere 17 00317 g012
Figure 13. Spatial patterns of R h trends across the TP during 1979–2018 in response to different meteorological drivers: (a) precipitation, (b) solar radiation, and (c) temperature.
Atmosphere 17 00317 g013
Table 1. Experimental design.
ExperimentalClimate Factors
TemperaturePrecipitationRadiation
Scenario OneTTT
Scenario TwoCTT
Scenario ThreeTCT
Scenario FourTTC
Note: The symbols T and C denote, respectively, a time-varying variable and a constant-valued variable.
Table 2. Mean and difference in NEP on the TP at different time periods (g C m2 yr−1).
Time PeriodMean NEPTime PeriodsNEP Diff.
1980–198918.95
1990–199923.141990s–1980s4.19
2000–200928.452000s–1990s5.31
2010–201824.542010s–2000s−3.90
Table 3. Annual variation trends in NEP under the influence of climate factors from 1979 to 2018 (g C m2 yr−1).
Experiment ScenarioScenario OneScenario TwoScenario ThreeScenario Four
NEP0.20.5−0.10.2
Table 4. Annual variation trends of NPP, R h and NEP under the influence of climate factors from 1979 to 2018 (g C m2 yr−1).
Experiment ScenarioNPP R h NEP
Scenario One2.42.10.2
Scenario Two1.71.90.5
Scenario Three2.52.7−0.1
Scenario Four−0.01−0.30.2
Disclaimer/Publisher’s Note: The statements, opinions and data contained in all publications are solely those of the individual author(s) and contributor(s) and not of MDPI and/or the editor(s). MDPI and/or the editor(s) disclaim responsibility for any injury to people or property resulting from any ideas, methods, instructions or products referred to in the content.