Article

Evaluation of Wind Field for ERA5 Reanalysis Data in Offshore East China Sea

Shanghai Investigation, Design & Research Institute Co., Ltd., Shanghai 200335, China
*
Author to whom correspondence should be addressed.
Atmosphere 2026, 17(3), 310; https://doi.org/10.3390/atmos17030310
Submission received: 13 January 2026 / Revised: 14 March 2026 / Accepted: 15 March 2026 / Published: 18 March 2026
(This article belongs to the Special Issue Meteorological Issues for Low-Altitude Economy)

Abstract

This study evaluates the applicability of ERA5 wind speed (WS) and wind direction (WD) in the East China Sea, using high-resolution vertical wind profiles measured by a floating LiDAR at the Shanghai Nanhui Offshore Wind Farm from 15 January 2022 to 15 January 2023. Key findings are as follows: (1) Strong positive correlations exist between LiDAR-measured and ERA5 WS across all evaluated heights, with correlation coefficients of 0.76 (ground level), 0.86 (50 m), 0.88 (100 m), and 0.90 (200 m), respectively, and corresponding root mean square errors (RMSEs) of 2.33 m/s, 1.78 m/s, 1.73 m/s, and 1.77 m/s. This systematic improvement in correlation and modest reduction in RMSE with increasing height indicate that ERA5 captures vertical wind structure with progressively higher fidelity above the surface layer. (2) Both the ERA5 dataset and LiDAR measurements consistently show dominant wind frequencies in the NNE and SSE directions, with peaks at approximately 1000 occurrences. The minimal differences in the two datasets demonstrate the ERA5’s robust representation of near-surface offshore WD climatology. (3) The ERA5 reanalysis data of typhoon Muifa can better illustrate the increase in the initial WS and its subsequent decreases. However, the peak WS lags behind measurements by 2 h, and the extreme WS is significantly lower than that measured. Evaluations of the multi-year return period WS demonstrate an underestimation of extreme WS by 16.06–16.51% for the ERA5 data. Regarding the WD, the measured direction is clockwise, while that of the ERA5 is counterclockwise, revealing a fundamental deficiency in its representation of mesoscale cyclonic wind structure. Therefore, ERA5 reanalysis data provides reliable characterization of typical offshore WS and WD within the operational wind turbine hub-height range (100–200 m). For typhoon-related wind engineering assessments, the applicability of ERA5 data necessitates caution and potentially bias correction.

1. Introduction

Wind energy, as a clean and renewable resource, is becoming increasingly prominent in the global energy landscape. The extensive development and utilization of wind resources play a significant role in promoting energy structure transformation and reducing greenhouse gas emissions. These efforts are crucial for achieving low-carbon energy targets and mitigating global climate change [1,2,3,4]. China possesses vast and widely distributed wind energy resources, and by the end of 2020, its installed wind power capacity had reached 281 million kilowatts, a year-on-year growth of 33.1%, securing its leading global position. Regionally, wind energy resources are primarily concentrated in the northwest, north, and coastal areas of China [5,6,7,8,9]. In the northwest, regions such as Xinjiang, Gansu, and Inner Mongolia boast expansive deserts and Gobi landscapes, characterized by high and stable wind speed (WS), making them key areas for onshore wind power development. North China benefits from plains and hilly terrains, which also present potential for wind power development. Coastal regions harness sea wind resources, vigorously developing offshore wind power, which has become a highlight of wind power growth in recent years. The cumulative grid-connected capacity of offshore wind power in China has reached 8.99 million kilowatts, a year-on-year increase of 51.6%. Offshore wind power, with its advantages of high WS, large power generation capacity, and no land occupation, represents a crucial direction for future wind power development [10,11,12].
The marine wind resources offered by the East China Sea are among the region’s most abundant natural resources, holding great potential for development and utilization [13,14,15]. These resources exhibit significant regional- and seasonal-dependent characteristics [16]. Located in the East Asian monsoon zone, the East China Sea is notably influenced by monsoon circulation, leading to temporal and spatial variability in wind energy resources. During summer, the area experiences southeastern monsoons, producing higher WSs and abundant wind energy resources. Conversely, in winter, northwestern monsoons dominate, resulting in lower WSs and relatively limited wind resources. Additionally, the land–sea breeze effect along the East China Sea coast significantly impacts the distribution of wind energy resources. The land–sea breeze effect, caused by the thermal capacity differences between seawater and land, results in sea breezes blowing toward land during the day and land breezes blowing toward the ocean at night. This phenomenon creates notable diurnal variations in wind energy resources along the coast [17,18], and, as a result, evaluating the wind resources in the East China Sea requires comprehensive consideration of regional, seasonal, and land–sea breeze factors.
The ERA5 reanalysis dataset, provided by the European Centre for Medium-Range Weather Forecasts (ECMWF), is one of the most advanced and comprehensive global climate reanalysis datasets [19,20,21]. Covering the period from January 1950 to the present, ERA5 offers global climate data encompassing various atmospheric, land, and oceanic variables with high spatial and temporal resolutions over an extended time series. It is widely applied in climate change research [22,23], but its applicability in specific regions, such as evaluating marine wind resources in the East China Sea, requires further validation. For example, some studies suggest that ERA5 WS data may overestimate observed WSs in the lower atmosphere under certain conditions, particularly at elevations below 500 m [24]. Therefore, when using ERA5 data to assess wind resources in the East China Sea, it is essential to account for systematic biases in the dataset and adopt appropriate correction measures to ensure accurate and reliable evaluation results.
In this study, we used one-year (15 January 2022 to 15 January 2023) continuous vertical wind profile measurements at ground level, 50 m, 100 m, and 200 m at the Shanghai Nanhui Offshore Wind Farm to rigorously evaluate the accuracy and representativeness of ERA5 reanalysis wind speed (WS) and wind direction (WD) data in the East China Sea. The results provide quantitative support for deploying ERA5 data in regional wind energy resource assessment, particularly for turbine hub-height wind characterization and long-term climatological analysis.

2. Methods

2.1. Measurement Site

The measurement equipment for this study was deployed near the Nanhui Offshore Wind Farm in the coastal waters of Shanghai. Offshore wind farms have already been built in this area, with an offshore distance of about 20–30 km and a water depth of 8–10 m, which is representative of typical underlying surfaces for offshore wind farms.
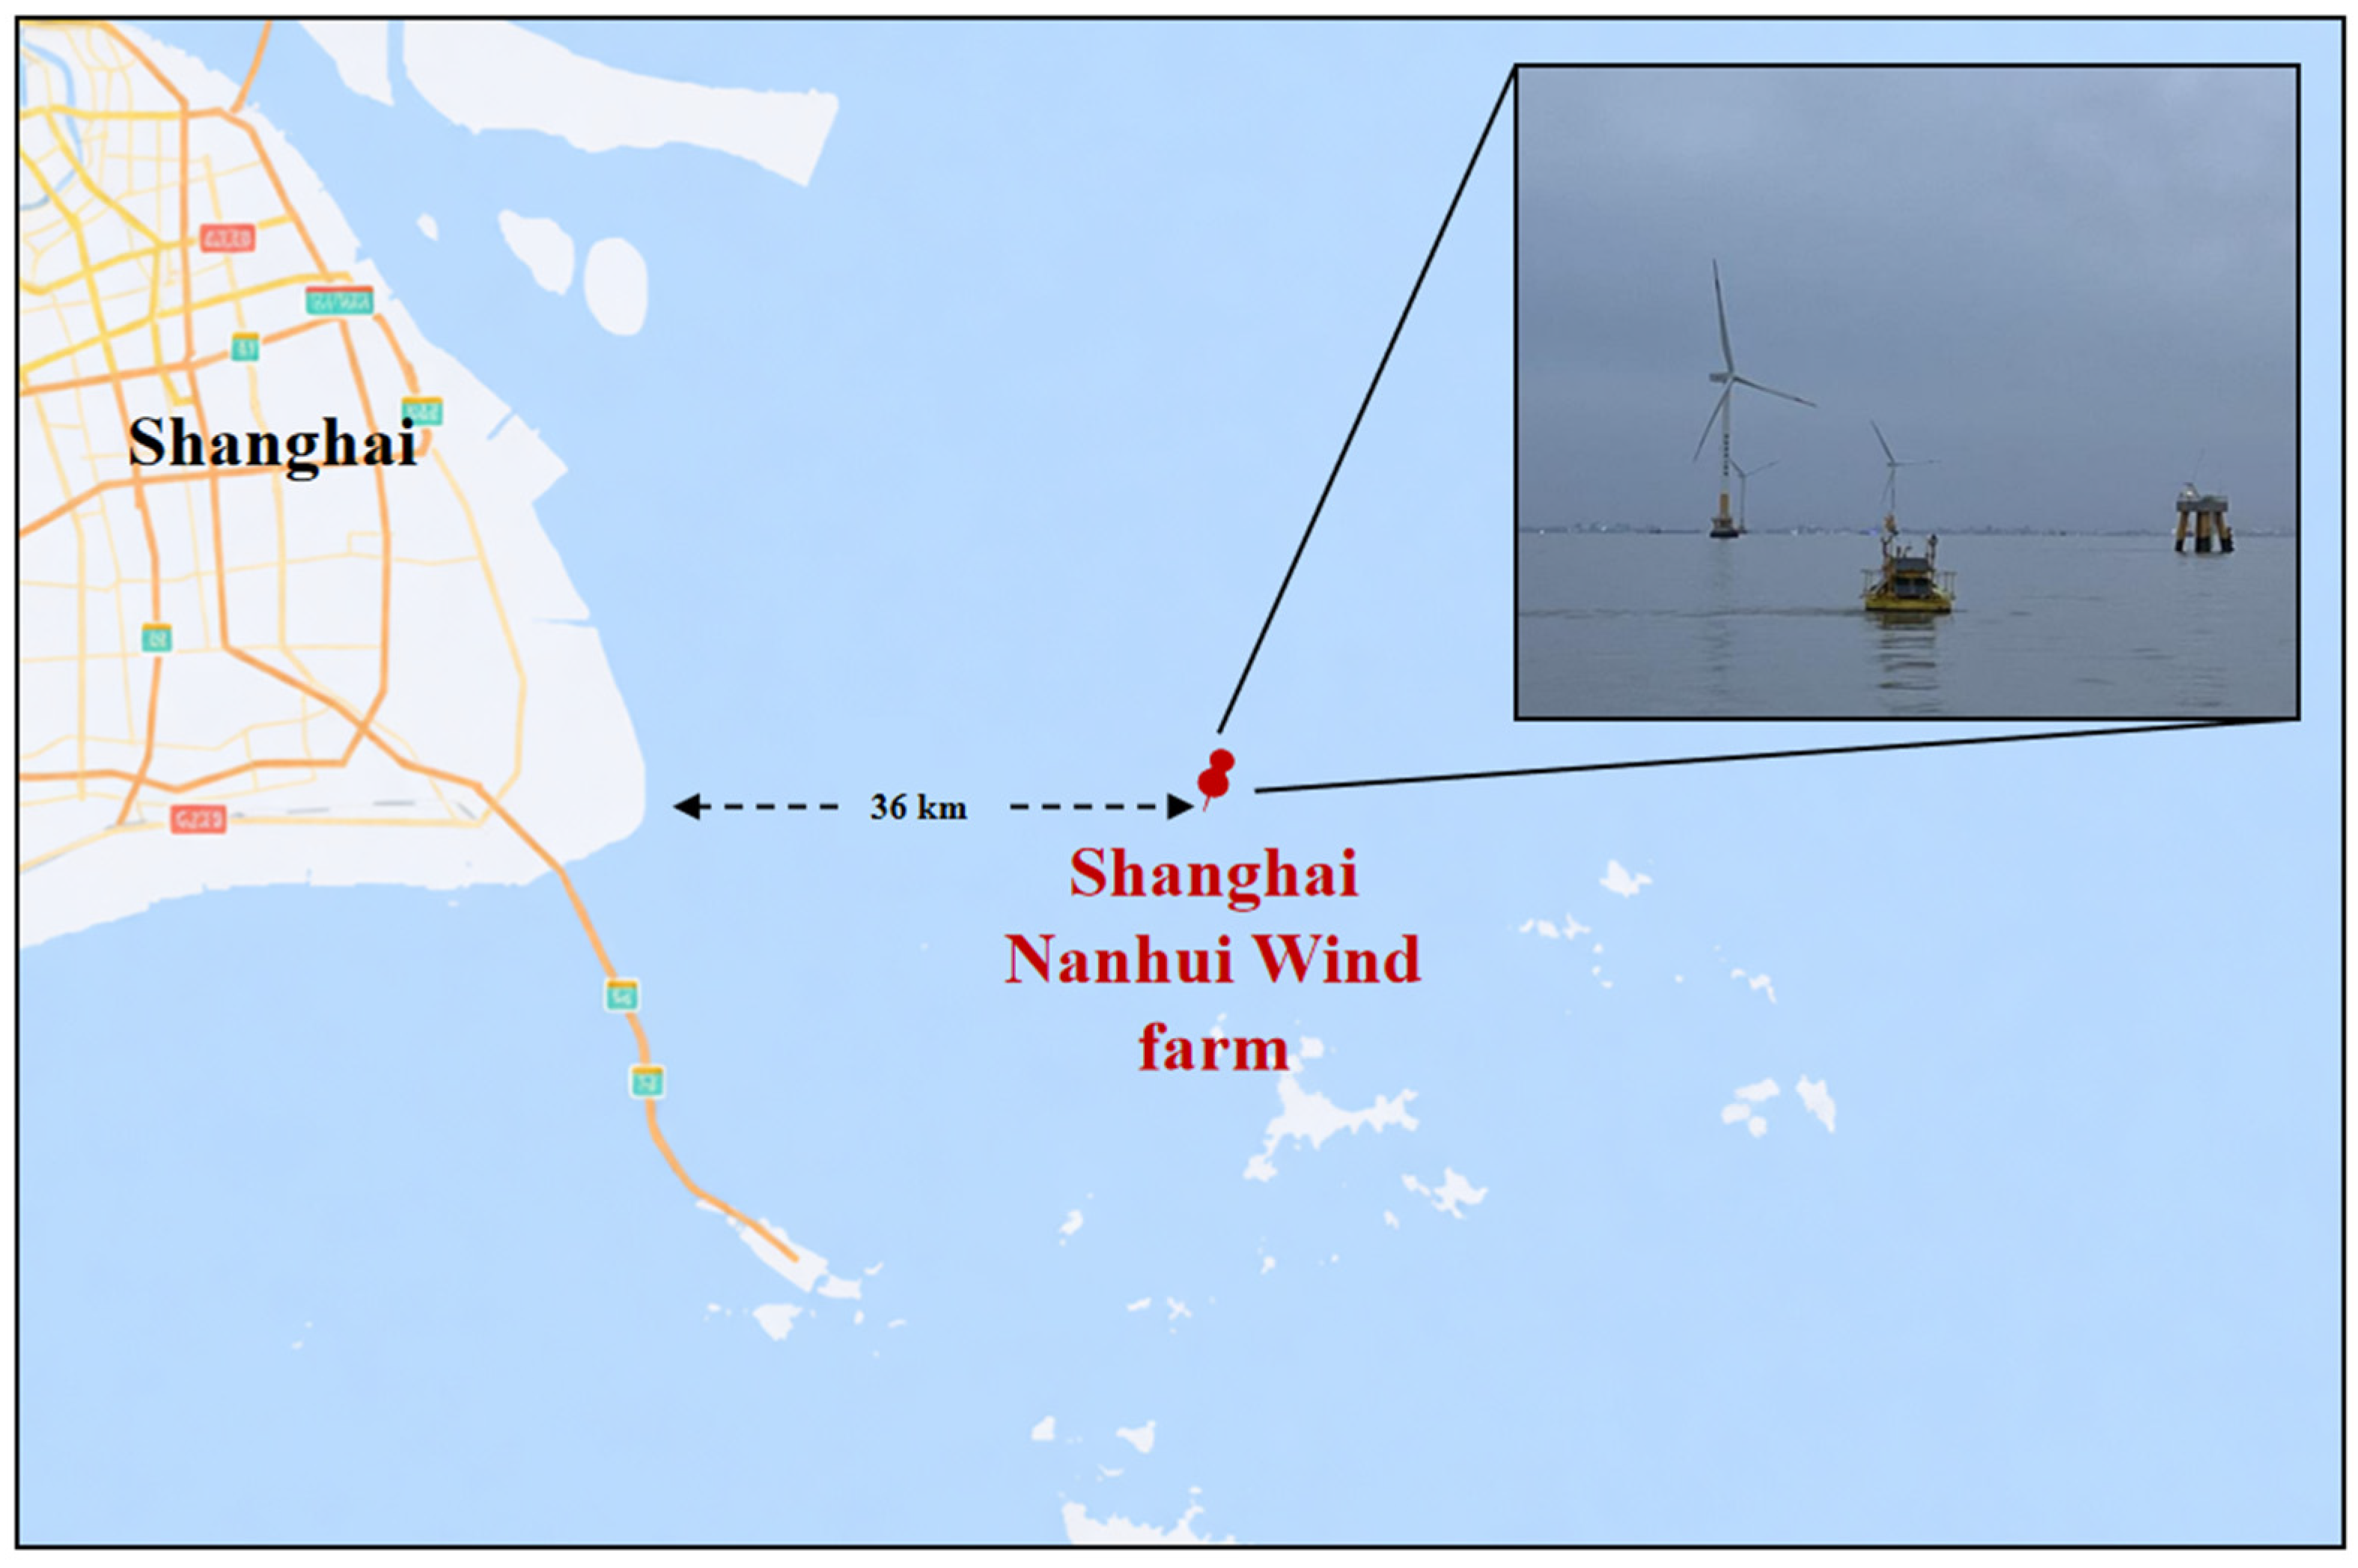
A BA-FLS-NX5 floating LiDAR wind measurement system (developed by Hangzhou Jingzhimenglan Technology Co., Ltd., Hangzhou, China) was used for wind resource observations in the Shanghai Nanhui Offshore Wind Farm from 15 January 2022 to 15 January 2023, a period with no significant climatic anomaly, thus guaranteeing the robustness of the results [25,26]. The observation site was located at 122.33° E, 30.89° N, approximately 36 km from the coastline, and situated east of the wind farm, as shown in Figure 1. As the westerly wind is not the dominant WD in this area, the upwind perturbation of the wind farm had minimal influence on the LiDAR measurements.

2.2. Instrument Description

The BA-FLS-NX5 floating LiDAR wind measurement system, independently developed by Hangzhou Jingzhimenglan Technology Co., Ltd., represents a new generation of equipment for wind resource exploration and power verification and is primarily used for evaluating wind resources in offshore wind farms. By collecting various oceanic meteorological and hydrological data, including wind, waves, currents, temperature, humidity, salinity, depth, tidal level, air pressure, and rainfall in the target area, this measurement equipment supports medium- to long-term offshore wind energy development and utilization.
This LiDAR wind measurement system employs Doppler-shift coherent technology. It actively emits laser beams into the atmosphere, which interact with moving aerosols or other particles in the air, producing Doppler-shifted scattering signals that are reflected back to and received by the detector. The wind data are then recorded based on the Doppler shift. In addition, the system is equipped with a ground meteorological station, enabling precise vertical wind field measurements from near-ground to a height of 200 m. The output measurement heights include 3.7 m (ground level), 20 m, 32 m, 50 m, 70 m, 80 m, 90 m, 100 m, 120 m, 130 m, 140 m, and 200 m, with a time resolution of one minute.
The LiDAR incorporates a posture calibration algorithm that compensates for measurement errors induced by platform motion, including translational velocity and attitude variations, thereby ensuring robust performance under challenging marine conditions such as surface wave-induced platform oscillations and heavy rainfall. Validation against collocated measurements from a marine wind measurement tower yields correlation coefficients of 0.99 for both WS and WD [27,28].

2.3. Research Methods

2.3.1. ERA5 Reanalysis Dataset

ERA5, the fifth-generation reanalysis dataset from the European Centre for Medium-Range Weather Forecasts (ECMWF), is a high-resolution global reanalysis dataset. By integrating various types of observational data with advanced numerical weather prediction models, it provides accurate, continuous, and consistent atmospheric and surface meteorological variables. ERA5 (https://cds.climate.copernicus.eu/datasets/reanalysis-era5-single-levels?tab=download, accessed on 14 March 2026) covers global climate data from January 1950 to the present; offers hourly estimates for numerous atmospheric, land, and oceanic climate variables with a spatial resolution of 0.25° × 0.25°; and employs 137 vertical levels to analyze the atmosphere from the surface to 80 km. Additionally, the ERA5 reanalysis inherently incorporates uncertainties arising from multiple sources, including observational errors, parameterization uncertainties in the model, and data assimilation uncertainties [29,30]. Nevertheless, the applicability of ERA5 requires further validation.
This study utilized parameters such as horizontal WS and geopotential height from ERA5 hourly data on pressure levels from 15 January 2022 to 15 January 2023. Bilinear interpolation was applied to extract data corresponding to the observation site, and cubic spline interpolation was subsequently used to obtain meteorological variables at heights matching the measured data [24,31,32,33]. We also verified the uncertainties of the cubic spline interpolation by comparing measured-height ERA5 data with the nearest-height values and found that the errors caused by the interpolation method were one order of magnitude smaller than the systematic bias of the ERA5 data and could be ignored.

2.3.2. Taylor Diagram

Taylor diagrams are often used to evaluate model accuracy, with commonly used metrics including correlation coefficient (R), standard deviation (STD), and root mean square error (RMSE). In a typical Taylor diagram, scatter points represent model results, radial lines indicate the correlation coefficient, the horizontal and vertical axes denote STD, and dashed lines represent RMSE [34].

2.3.3. Weibull Distribution

Weibull distribution demonstrates the probability distribution of wind speed well. It is a continuous probability distribution, and its probability density function is given by
f ( v ) = k c ( v c ) k 1 e x p [ ( v c ) k ]
where v denotes wind speed; k is the shape parameter, governing the skewness and tail behavior of the wind speed distribution; and c is the scale parameter, representing the characteristic wind speed magnitude. Specifically, when k = 1, the Weibull distribution simplifies to the exponential distribution; when k = 2, it converges to the Rayleigh distribution, a widely adopted model in wind resource assessment and turbine performance analysis [35].

2.3.4. Gumbel Distribution

Gumbel distribution is the most widely used model for multi-year return period extreme wind speed estimation and is specifically optimized for fitting extreme meteorological events (e.g., typhoon extreme wind speeds). The Gumbel distribution cumulative distribution function (CDF) for extreme wind speeds is
F ( x ) = e x p [ e x p ( x μ σ ) ]
where x is the extreme wind speed (m/s); μ and σ are the location and scale parameters (related to the average of extreme values). Then, the T-year return period extreme wind speed xT is derived by inverting the CDF [36]:
x T = μ σ l n ( l n ( T 1 T ) )

3. Results and Analysis

3.1. Comparison of LiDAR-Measured and ERA5 WSs at Different Heights

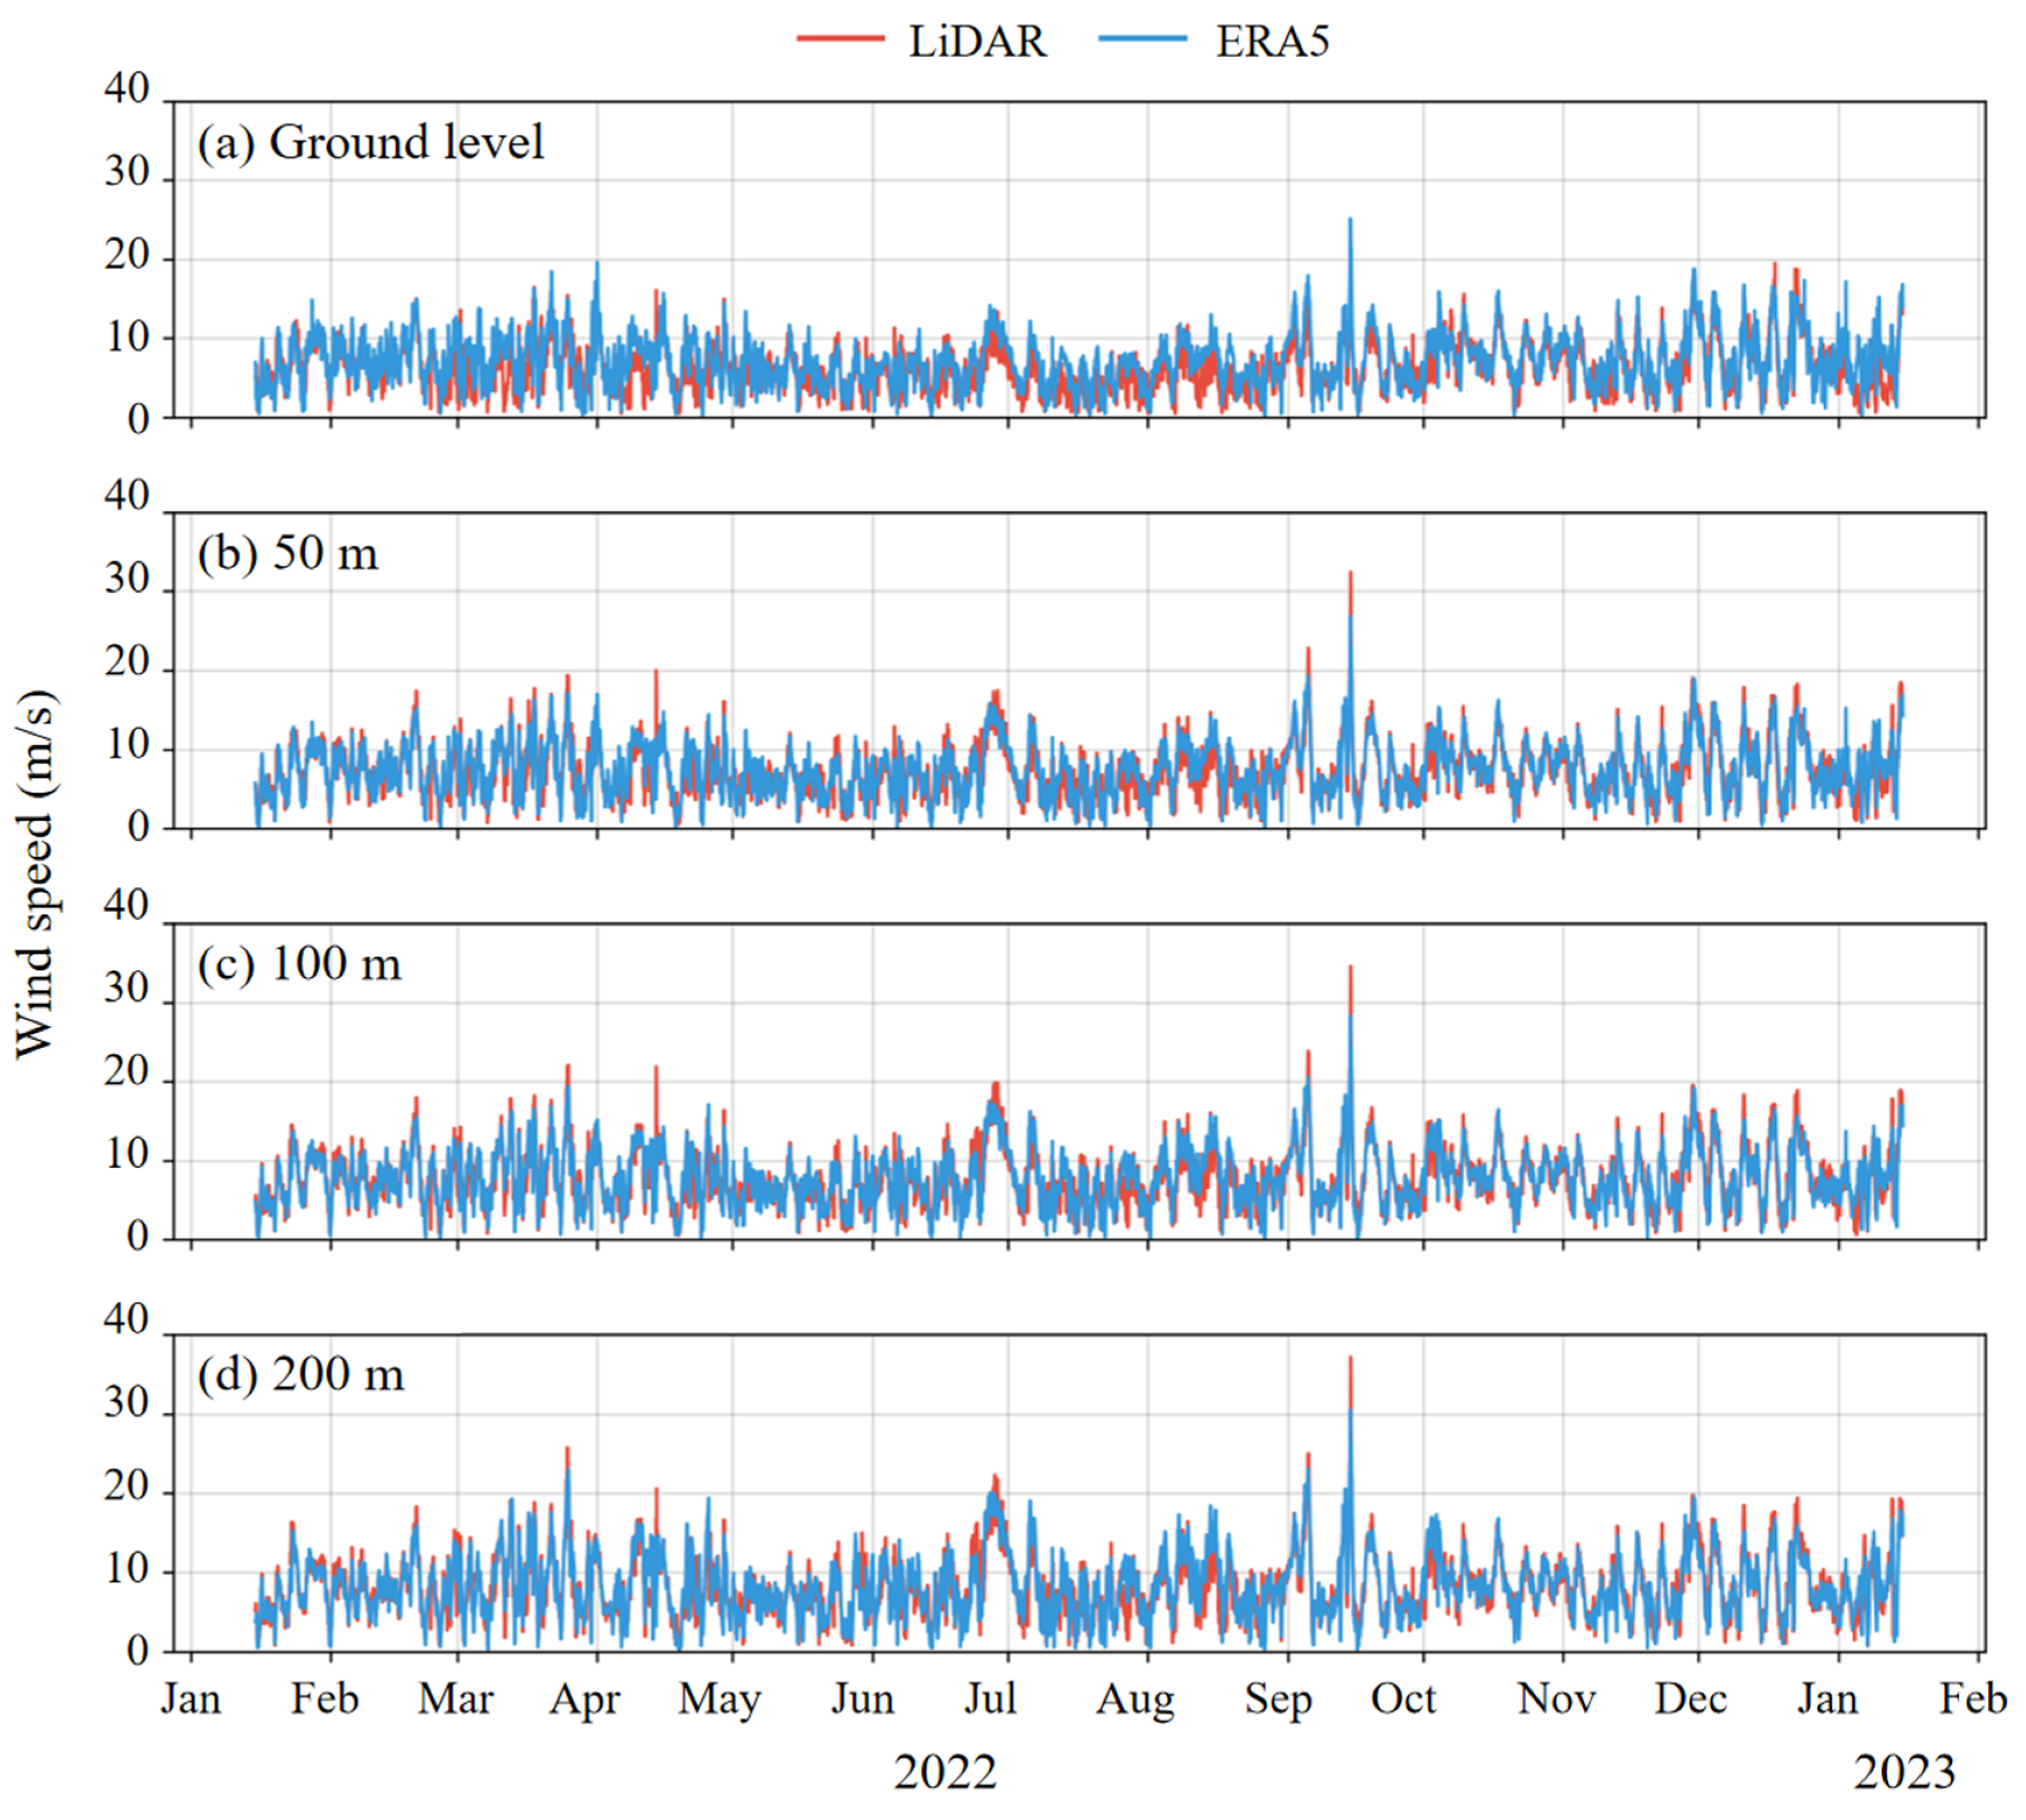
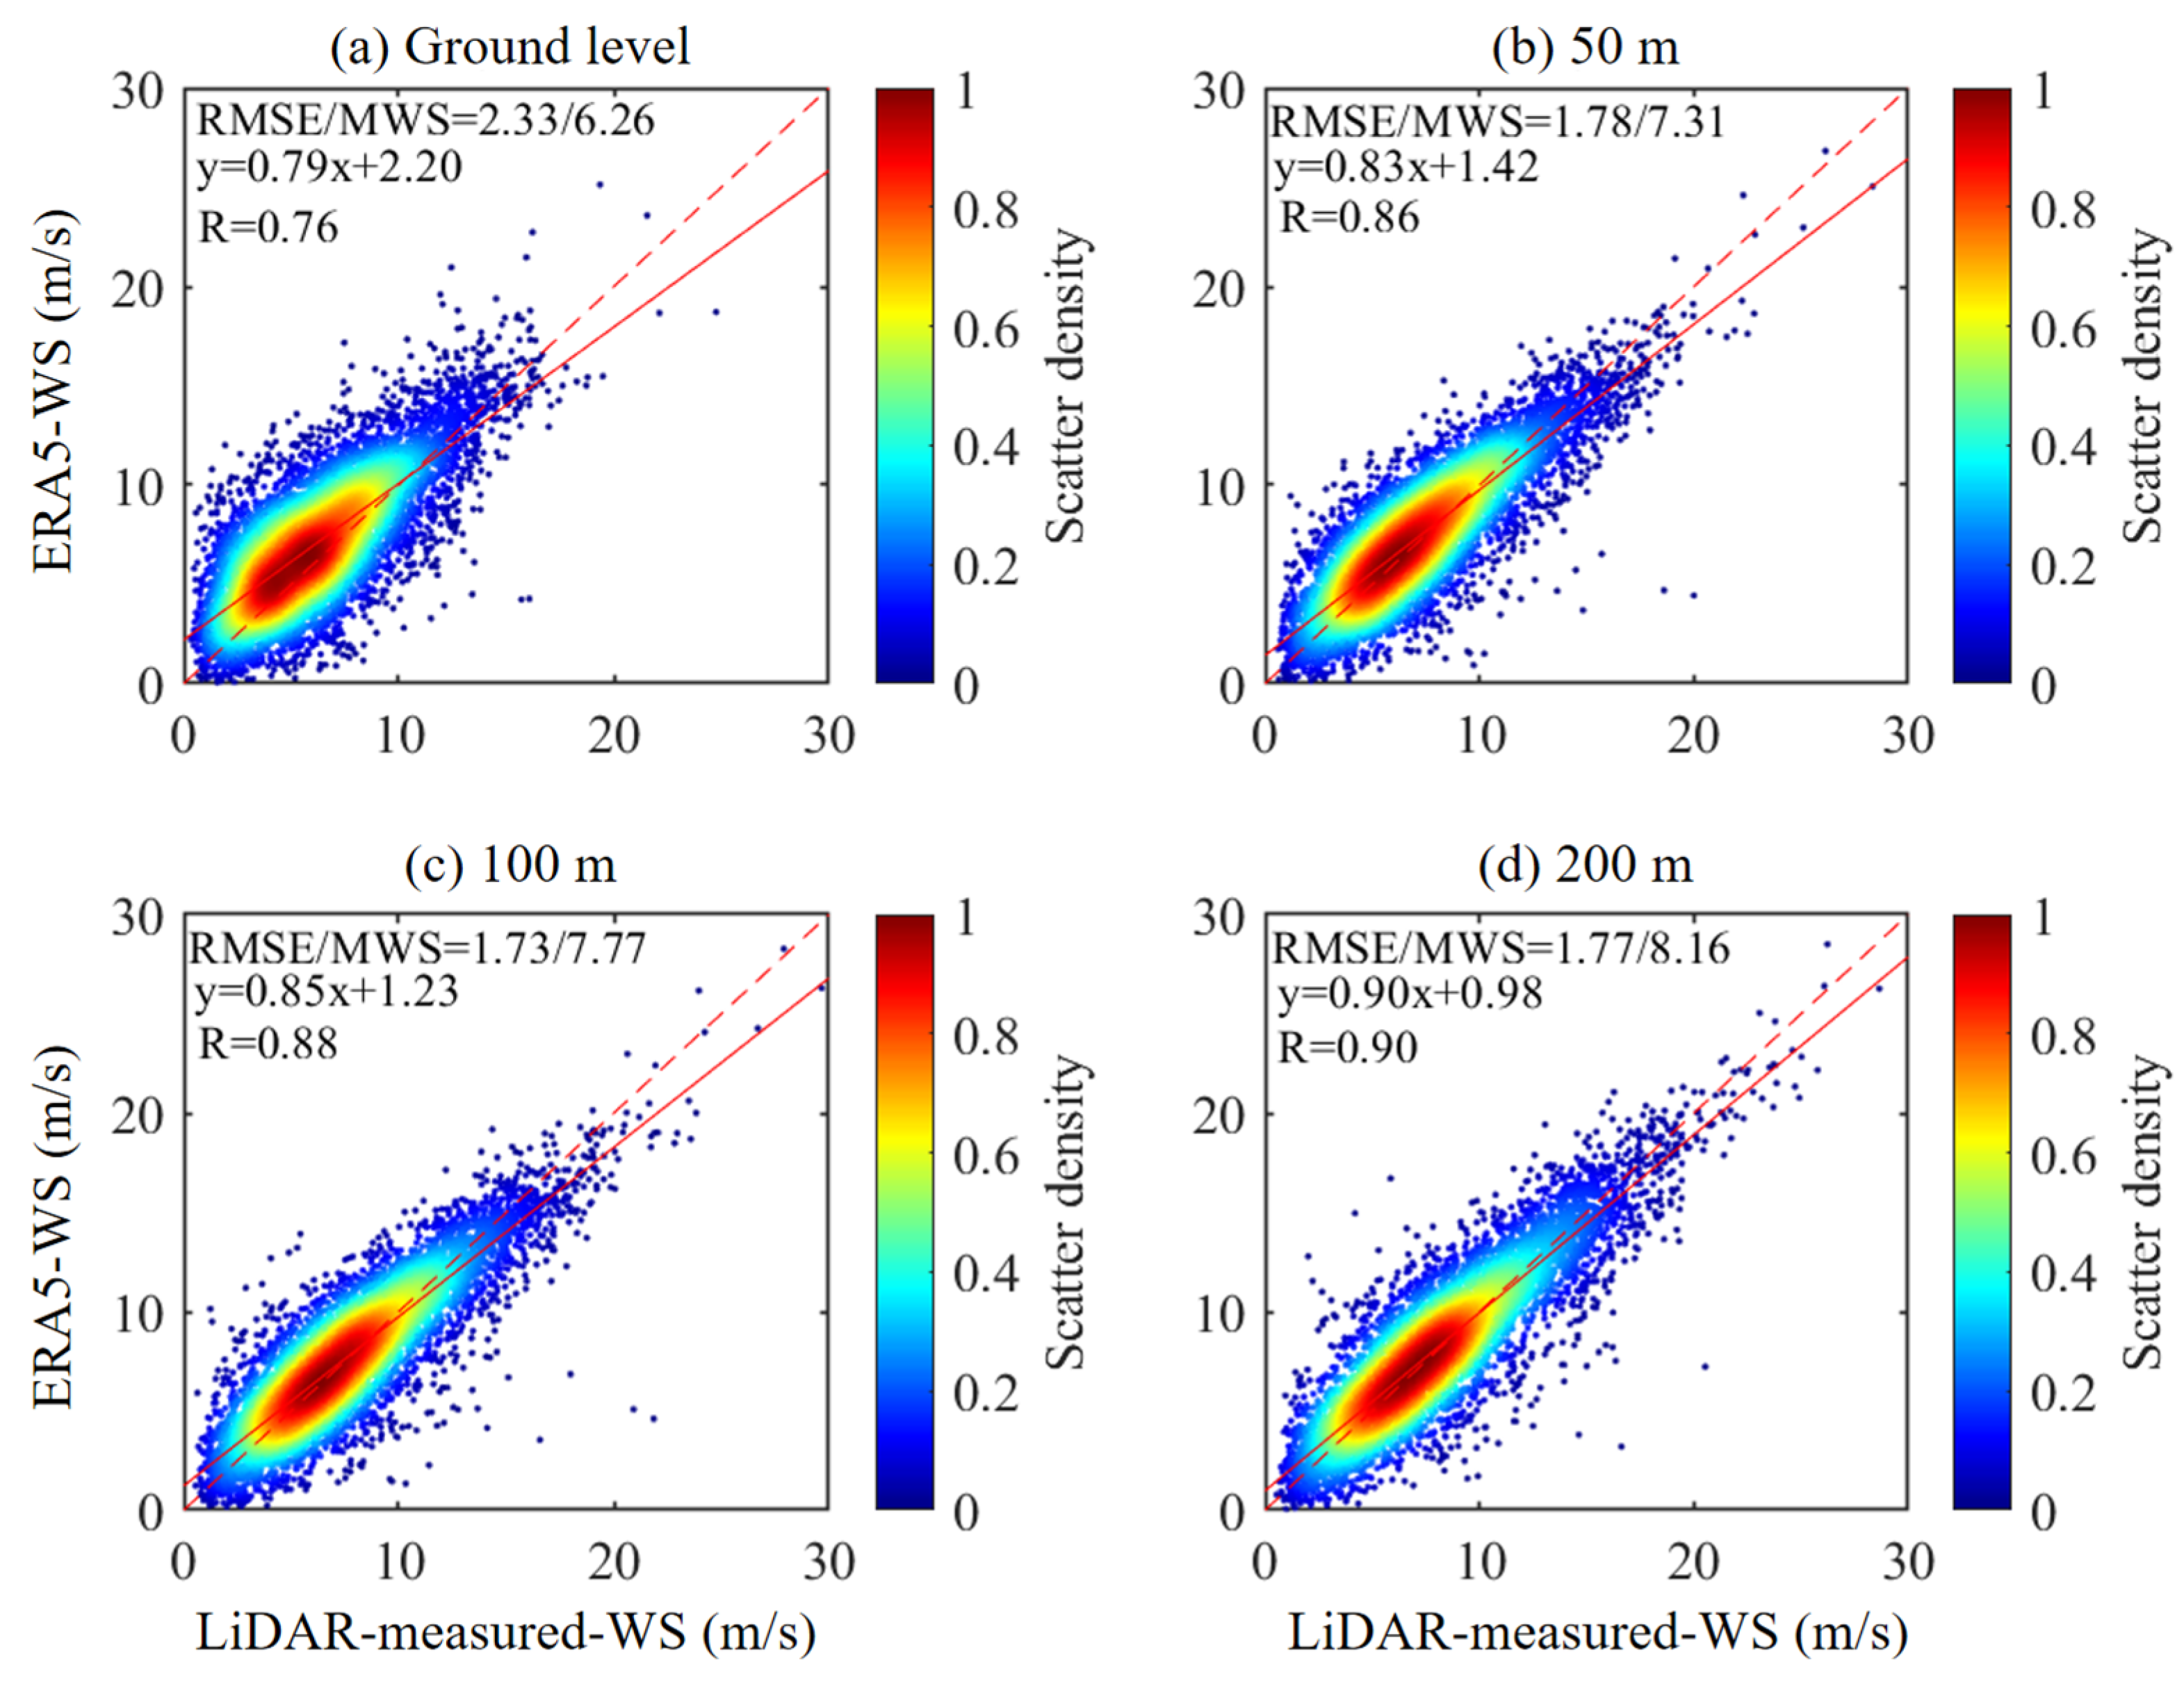
Figure 2 illustrates the day-to-day horizontal WS differences between LiDAR measurements and the ERA5 reanalysis data at various heights (ground level, 50 m, 100 m, and 200 m). The trends were generally consistent, indicating a strong correlation between the two datasets (Figure 3), with correlation scatter equations for different heights being Y = 0.79X + 2.20, Y = 0.83X + 1.42, Y = 0.85X + 1.23, and Y = 0.90X + 0.98, with corresponding correlation coefficients (R) of 0.76, 0.86, 0.88, and 0.90. These results demonstrate that the correlation between LiDAR measurements and ERA5 reanalysis data, along with the accuracy of ERA5, improved with height. This improvement may be attributed to the diminishing effects of surge-induced fluid friction at higher altitudes. The root mean square errors (RMSEs) between ERA5 and observed data at the different heights were 2.33 m/s, 1.78 m/s, 1.73 m/s, and 1.77 m/s, respectively. This discrepancy is likely attributable to ERA5’s relatively coarse spatial resolution (0.25° × 0.25°), which limits its ability to resolve fine-scale atmospheric processes and coastal topographic heterogeneities. Consequently, surface roughness parameterization is inadequately represented, small-scale circulations are excessively smoothed, and wind steering effects are misrepresented. These limitations collectively contribute to systematic errors in near-surface WS. In contrast, the progressive reduction of WS errors with increasing height reflects diminishing influence of surface-related uncertainties, consistent with the expected vertical decoupling from ground-level forcing.
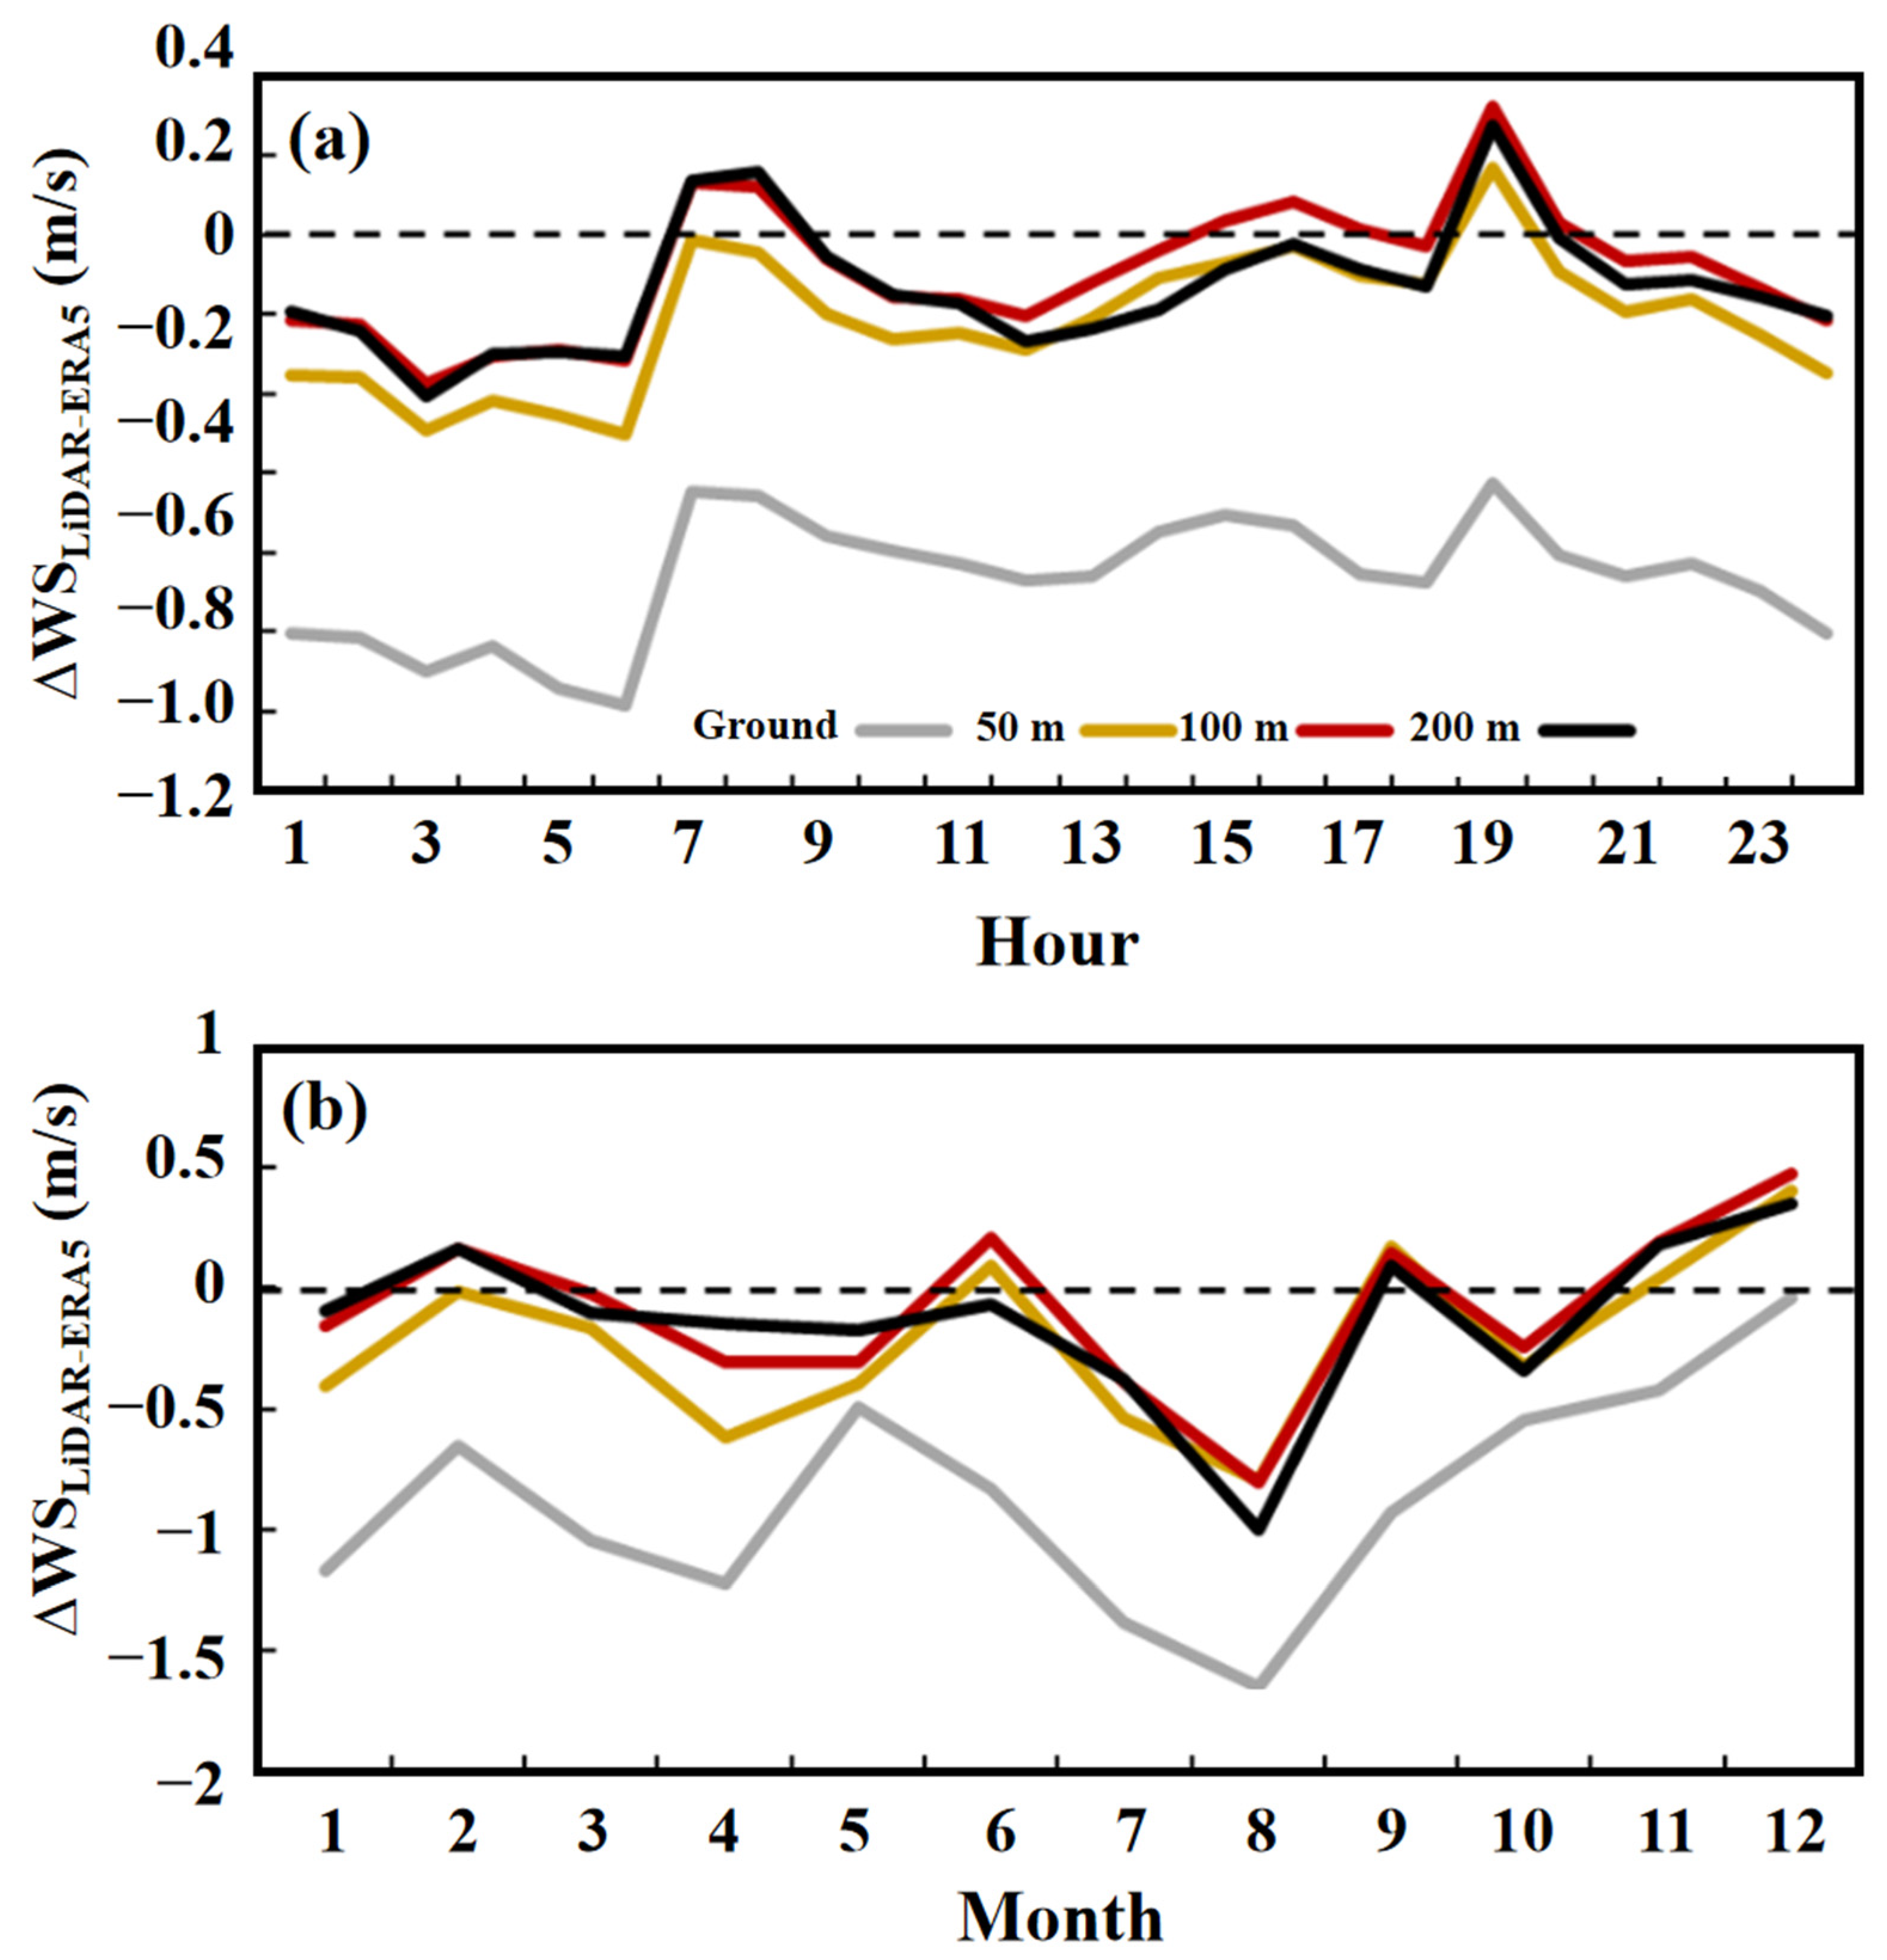
Figure 4 presents the hourly and monthly average differences in WS between observations and ERA5 reanalysis data. ERA5 data generally overestimated WS compared to observations, with the largest bias occurring at ground level. On an annual scale, WSs for both observed and reanalysis data increased with height between May and October. The largest discrepancies were observed in August, with ERA5 WSs exceeding observations by 1.65 m/s at ground level and 0.80 m/s at 50 m. At each elevation, the months in which the smallest discrepancies could be found were as follows: ground level (December), with ERA5 overestimating by 0.04 m/s; 50 m (February), with an overestimation of 0.02 m/s; 100 m (March), with ERA5 exceeding observations by 0.02 m/s; and, finally, 200 m (June), with ERA5 overestimating by 0.07 m/s.
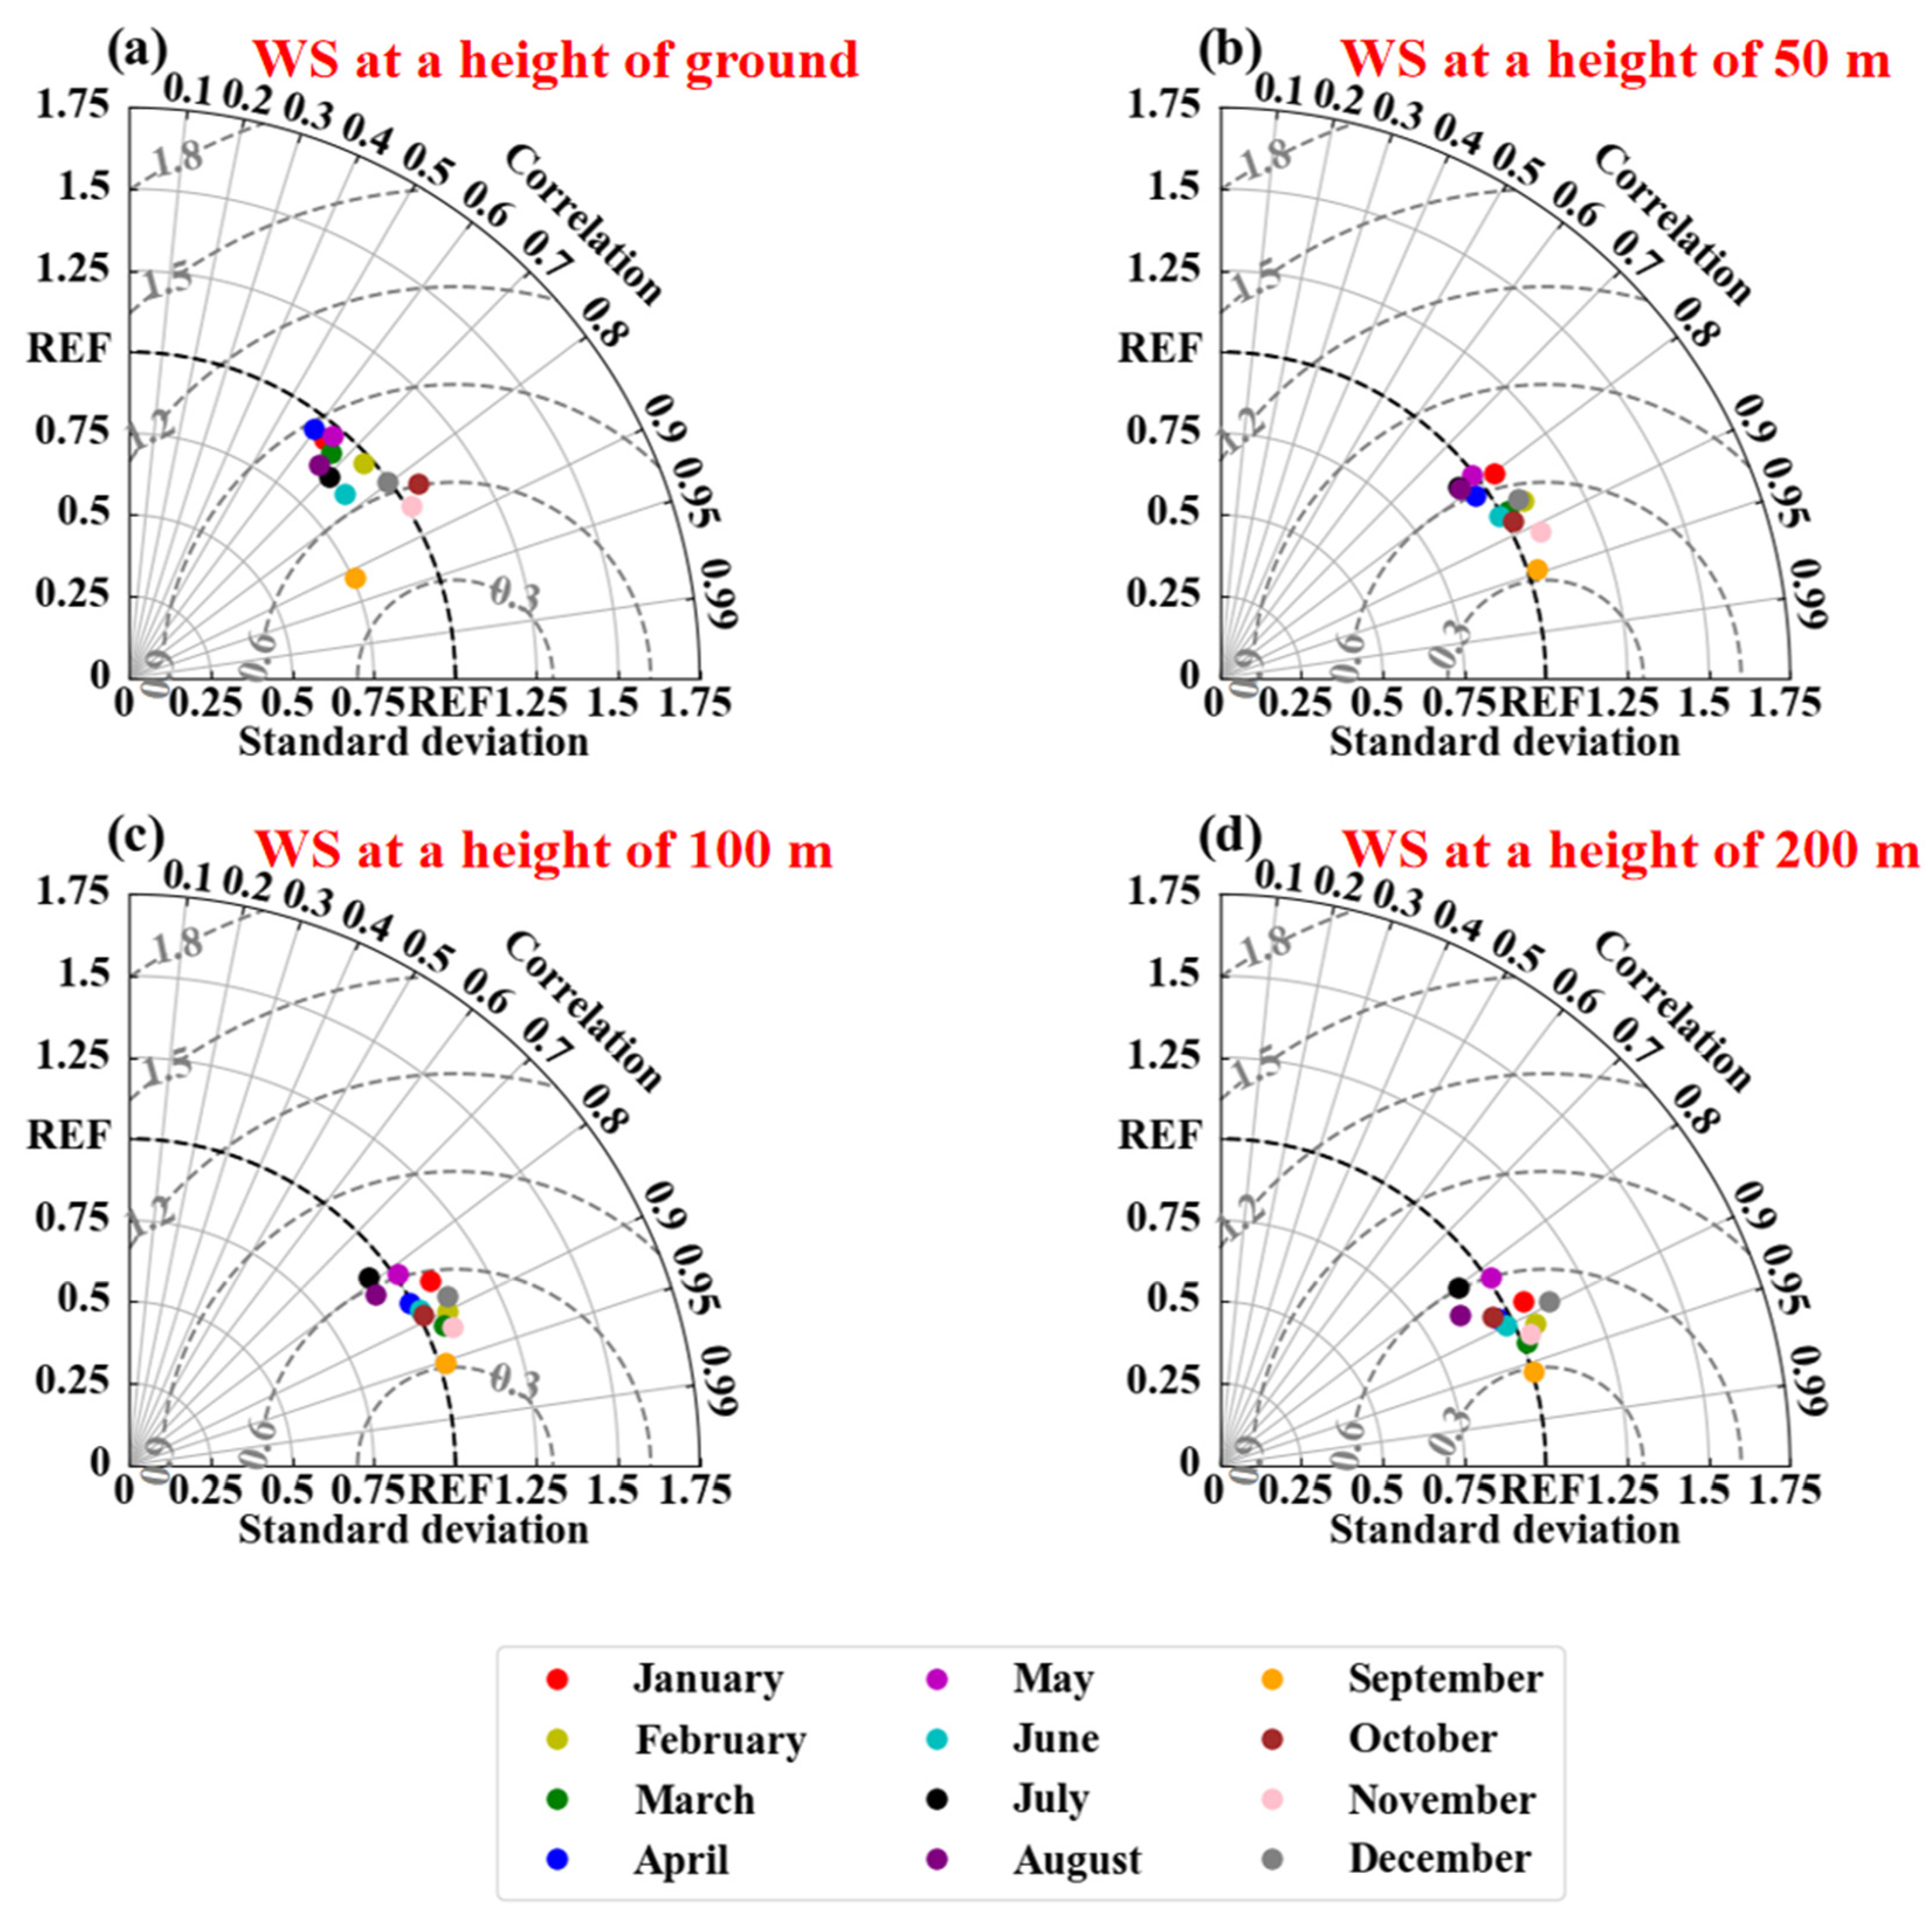
Figure 5 presents the Taylor diagrams of monthly WS errors for observations and ERA5 reanalysis data at heights of ground level, 50 m, 100 m, and 200 m. The overall distribution of WS errors reveals significant differences between observed values and ERA5 data from the surface to approximately 200 m. At the surface level, the correlation was relatively low, with an average coefficient (R) of 0.76, but as height increased, the correlation improved significantly, with data points at 50 m becoming more concentrated and showing reduced standard deviation. This suggests an improvement in ERA5’s WS simulation at 50 m, though some errors persisted. At heights of 100 m and 200 m, the correlation further increased and the distribution of data points on the Taylor diagram was more concentrated, indicating a better match between the ERA5 WS data and the observed data. This suggests that the ERA5 model had better accuracy in WS simulation at medium and high levels, especially at 200 m, where the correlation reached 0.9. Additionally, the error distribution transitioned from being more dispersed at the surface to being more concentrated at 200 m, with biases decreasing progressively. The primary reason for this trend may be the systematic biases inherent in ERA5 reanalysis data, which are based on a combination of numerical weather prediction models and historical observations [37,38,39]. Near the surface, ERA5 often underestimated or overestimated WS, likely due to limitations in modeling surface friction and local circulations [40,41]. At higher altitudes, WS direction and intensity were more closely aligned with broader climatic patterns, resulting in reduced errors as height increased. On a monthly scale, WS errors were smallest in September, possibly due to relatively stable climatic conditions during this period. In coastal regions, the reduction in errors suggests that WS variations during September were smoother, with simpler diurnal changes and less complex climatic systems. Conversely, during summer months (e.g., July and August), frequent typhoons and strong convective activities led to greater WS fluctuations. ERA5 may have struggled to fully capture these localized meteorological phenomena, resulting in larger prediction errors. The stability of September’s weather systems likely contributed to the smaller differences between ERA5 and observed data during this period. Overall, ERA5 exhibited a relatively good correlation with recorded data, particularly at higher altitudes, underscoring its applicability for WS simulations in elevated atmospheric layers.
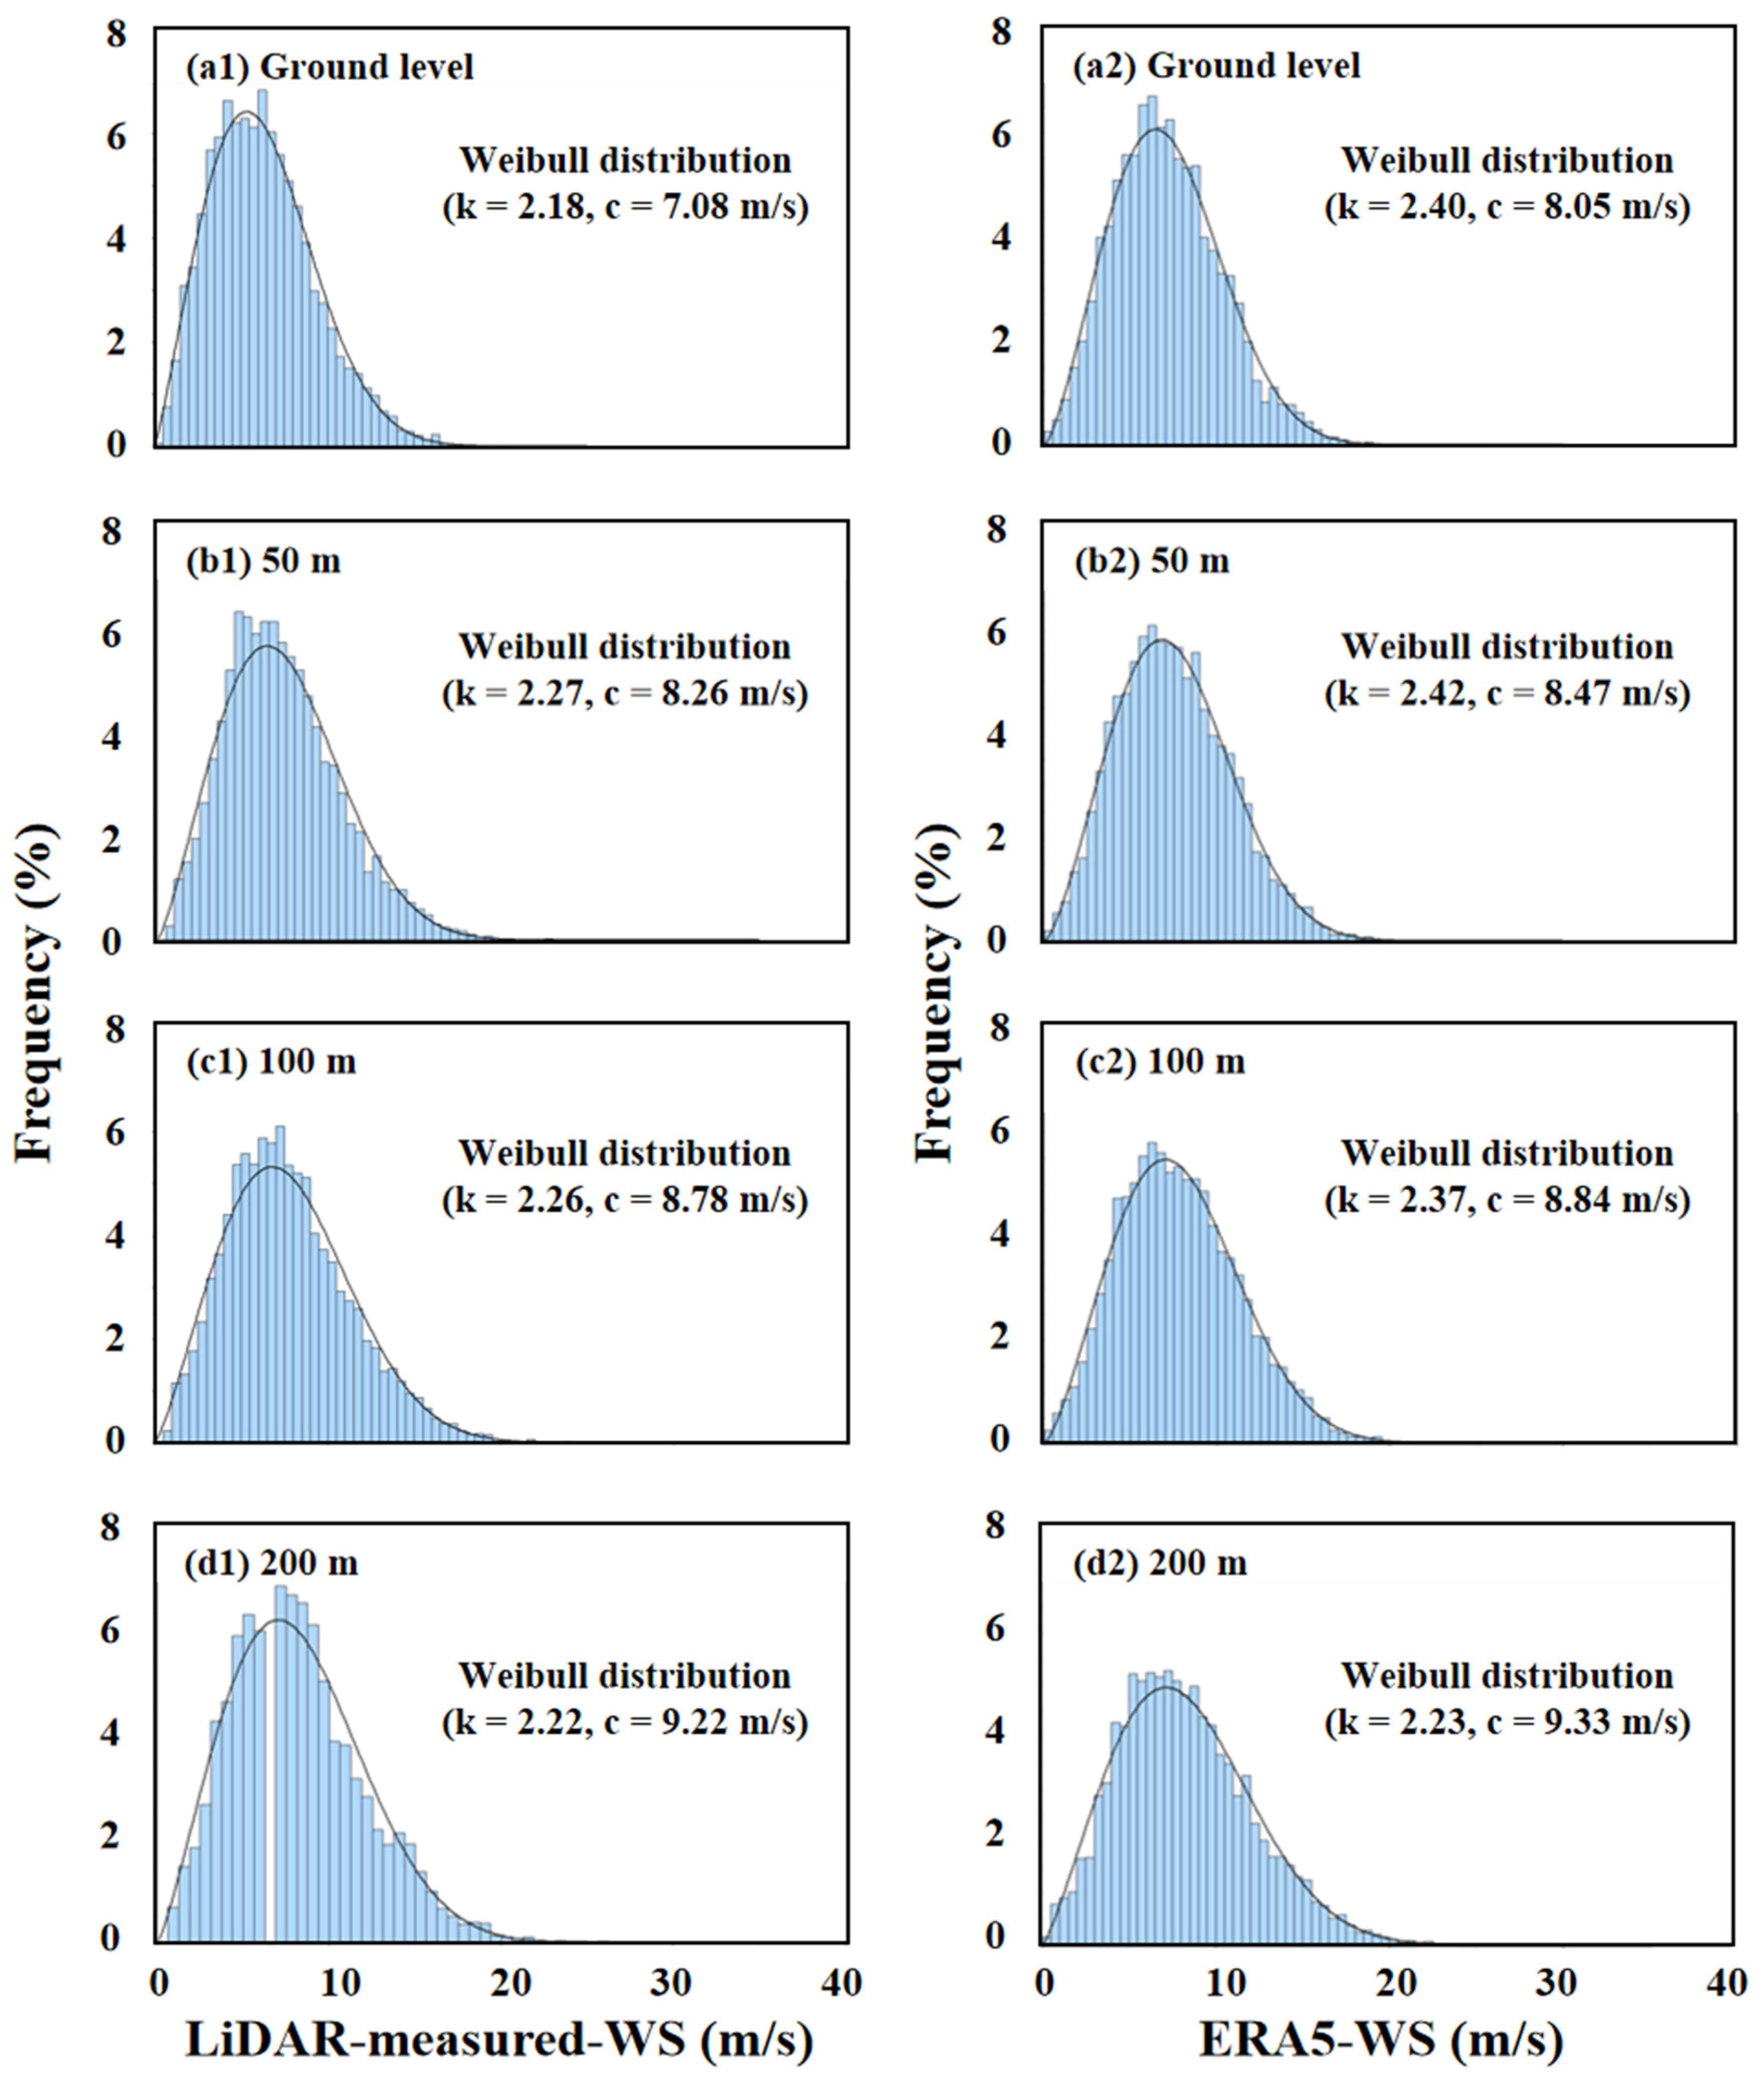
The WS frequency distributions at all heights conformed to the Weibull distribution. As WS increased, the frequency first rose, peaking at around 6–8 m/s, and then decreased. The peak frequency increased with height, as shown in Figure 6. The ERA5 reanalysis data for the maximum wind frequency were greater than observed, with discrepancies being more pronounced at the surface compared to higher altitudes. Overall, the Weibull distribution parameters k and c for ERA5 WS data were greater than those for the observed data, and the ERA5 distribution curve was steeper near the peak, indicating a more concentrated WS distribution. Additionally, the larger c value for ERA5 suggests a rightward shift in the distribution, indicating higher WS compared to observations. For observed data, the WS frequency distribution curve had the highest k value at 50 m and 100 m, and the WS distribution was more concentrated at higher frequencies.

3.2. Comparison Between LiDAR-Measured and ERA5 WDs at Different Heights

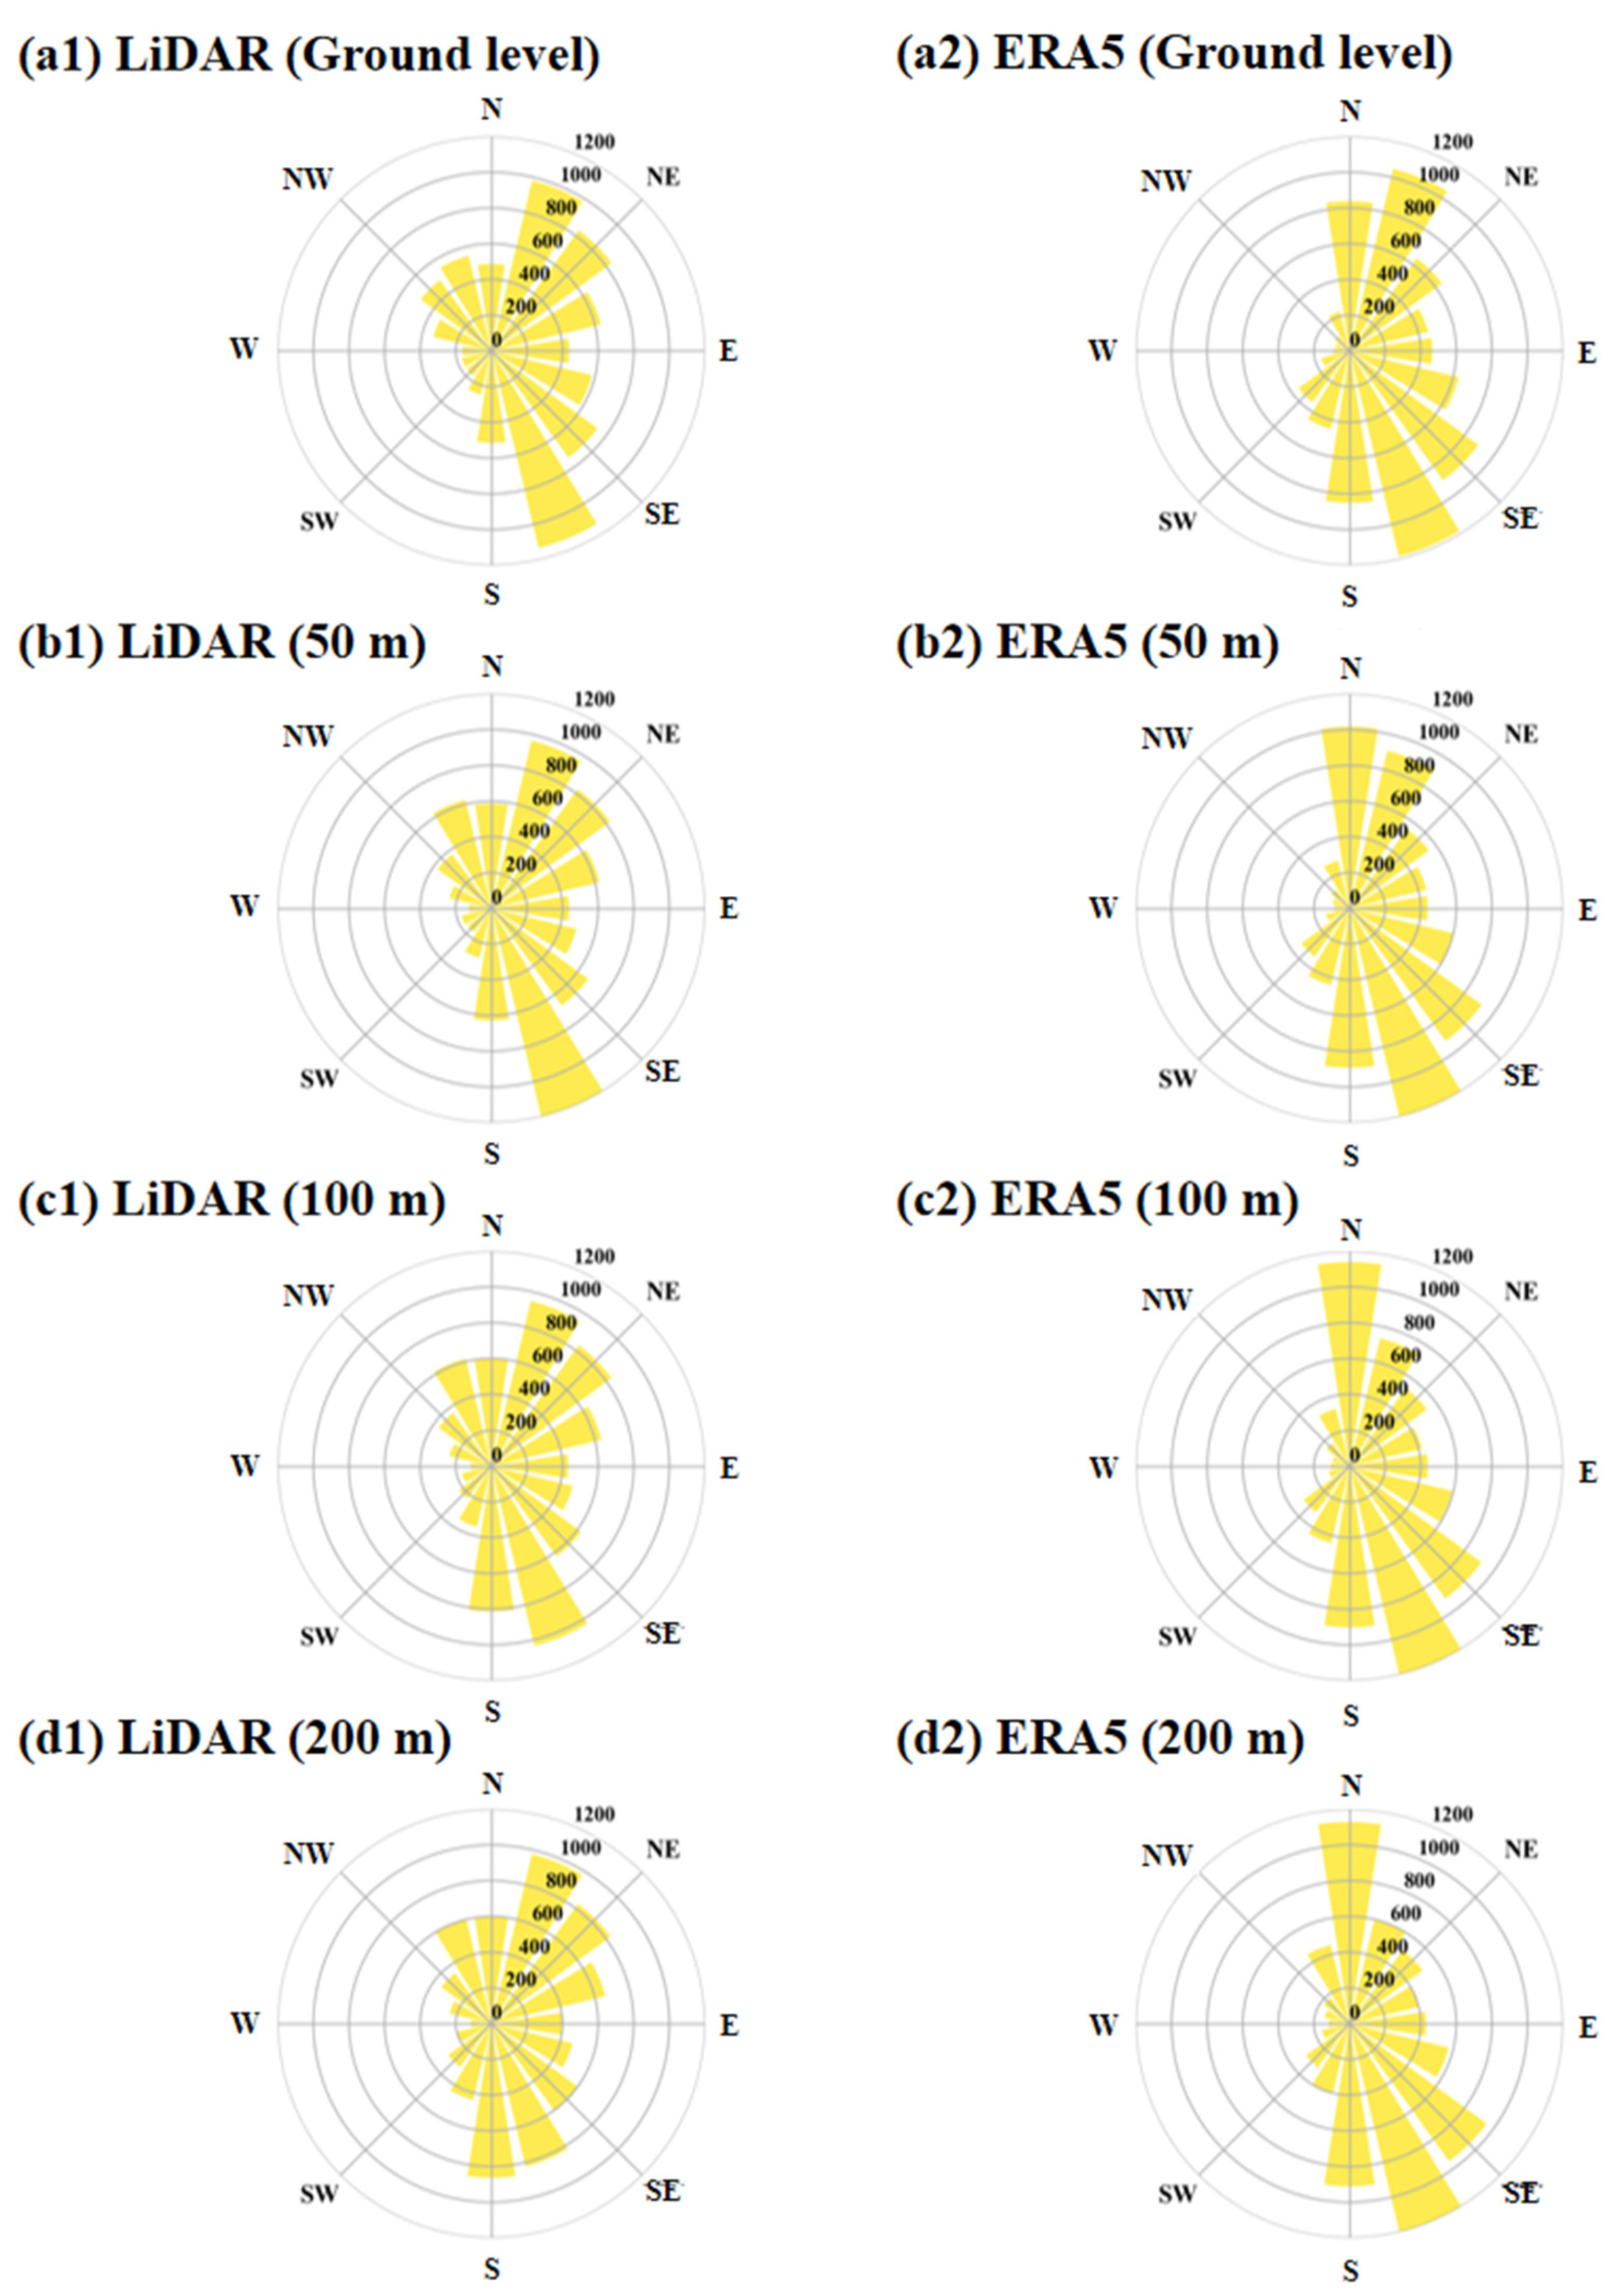
Figure 7 presents the vertical profile of wind frequency distributions at multiple heights, comparing LiDAR measurements with ERA5 reanalysis data. Both datasets showed dominant wind frequencies in the NNE and SSE directions, with values exceeding 1000 occurrences. At all measured heights, LiDAR measurements consistently identified NNE as the most frequent WD, peaking at approximately 1000 occurrences. In contrast, ERA5 exhibited a slight shift in dominant direction with height: SSE emerged as the most frequent direction (1200 occurrences), while northerly winds within the NE quadrant became increasingly prominent above 50 m, which exceeded 1000 occurrences. Notably, ERA5 demonstrated strong fidelity in reproducing offshore near-surface WDs, particularly below 200 m.
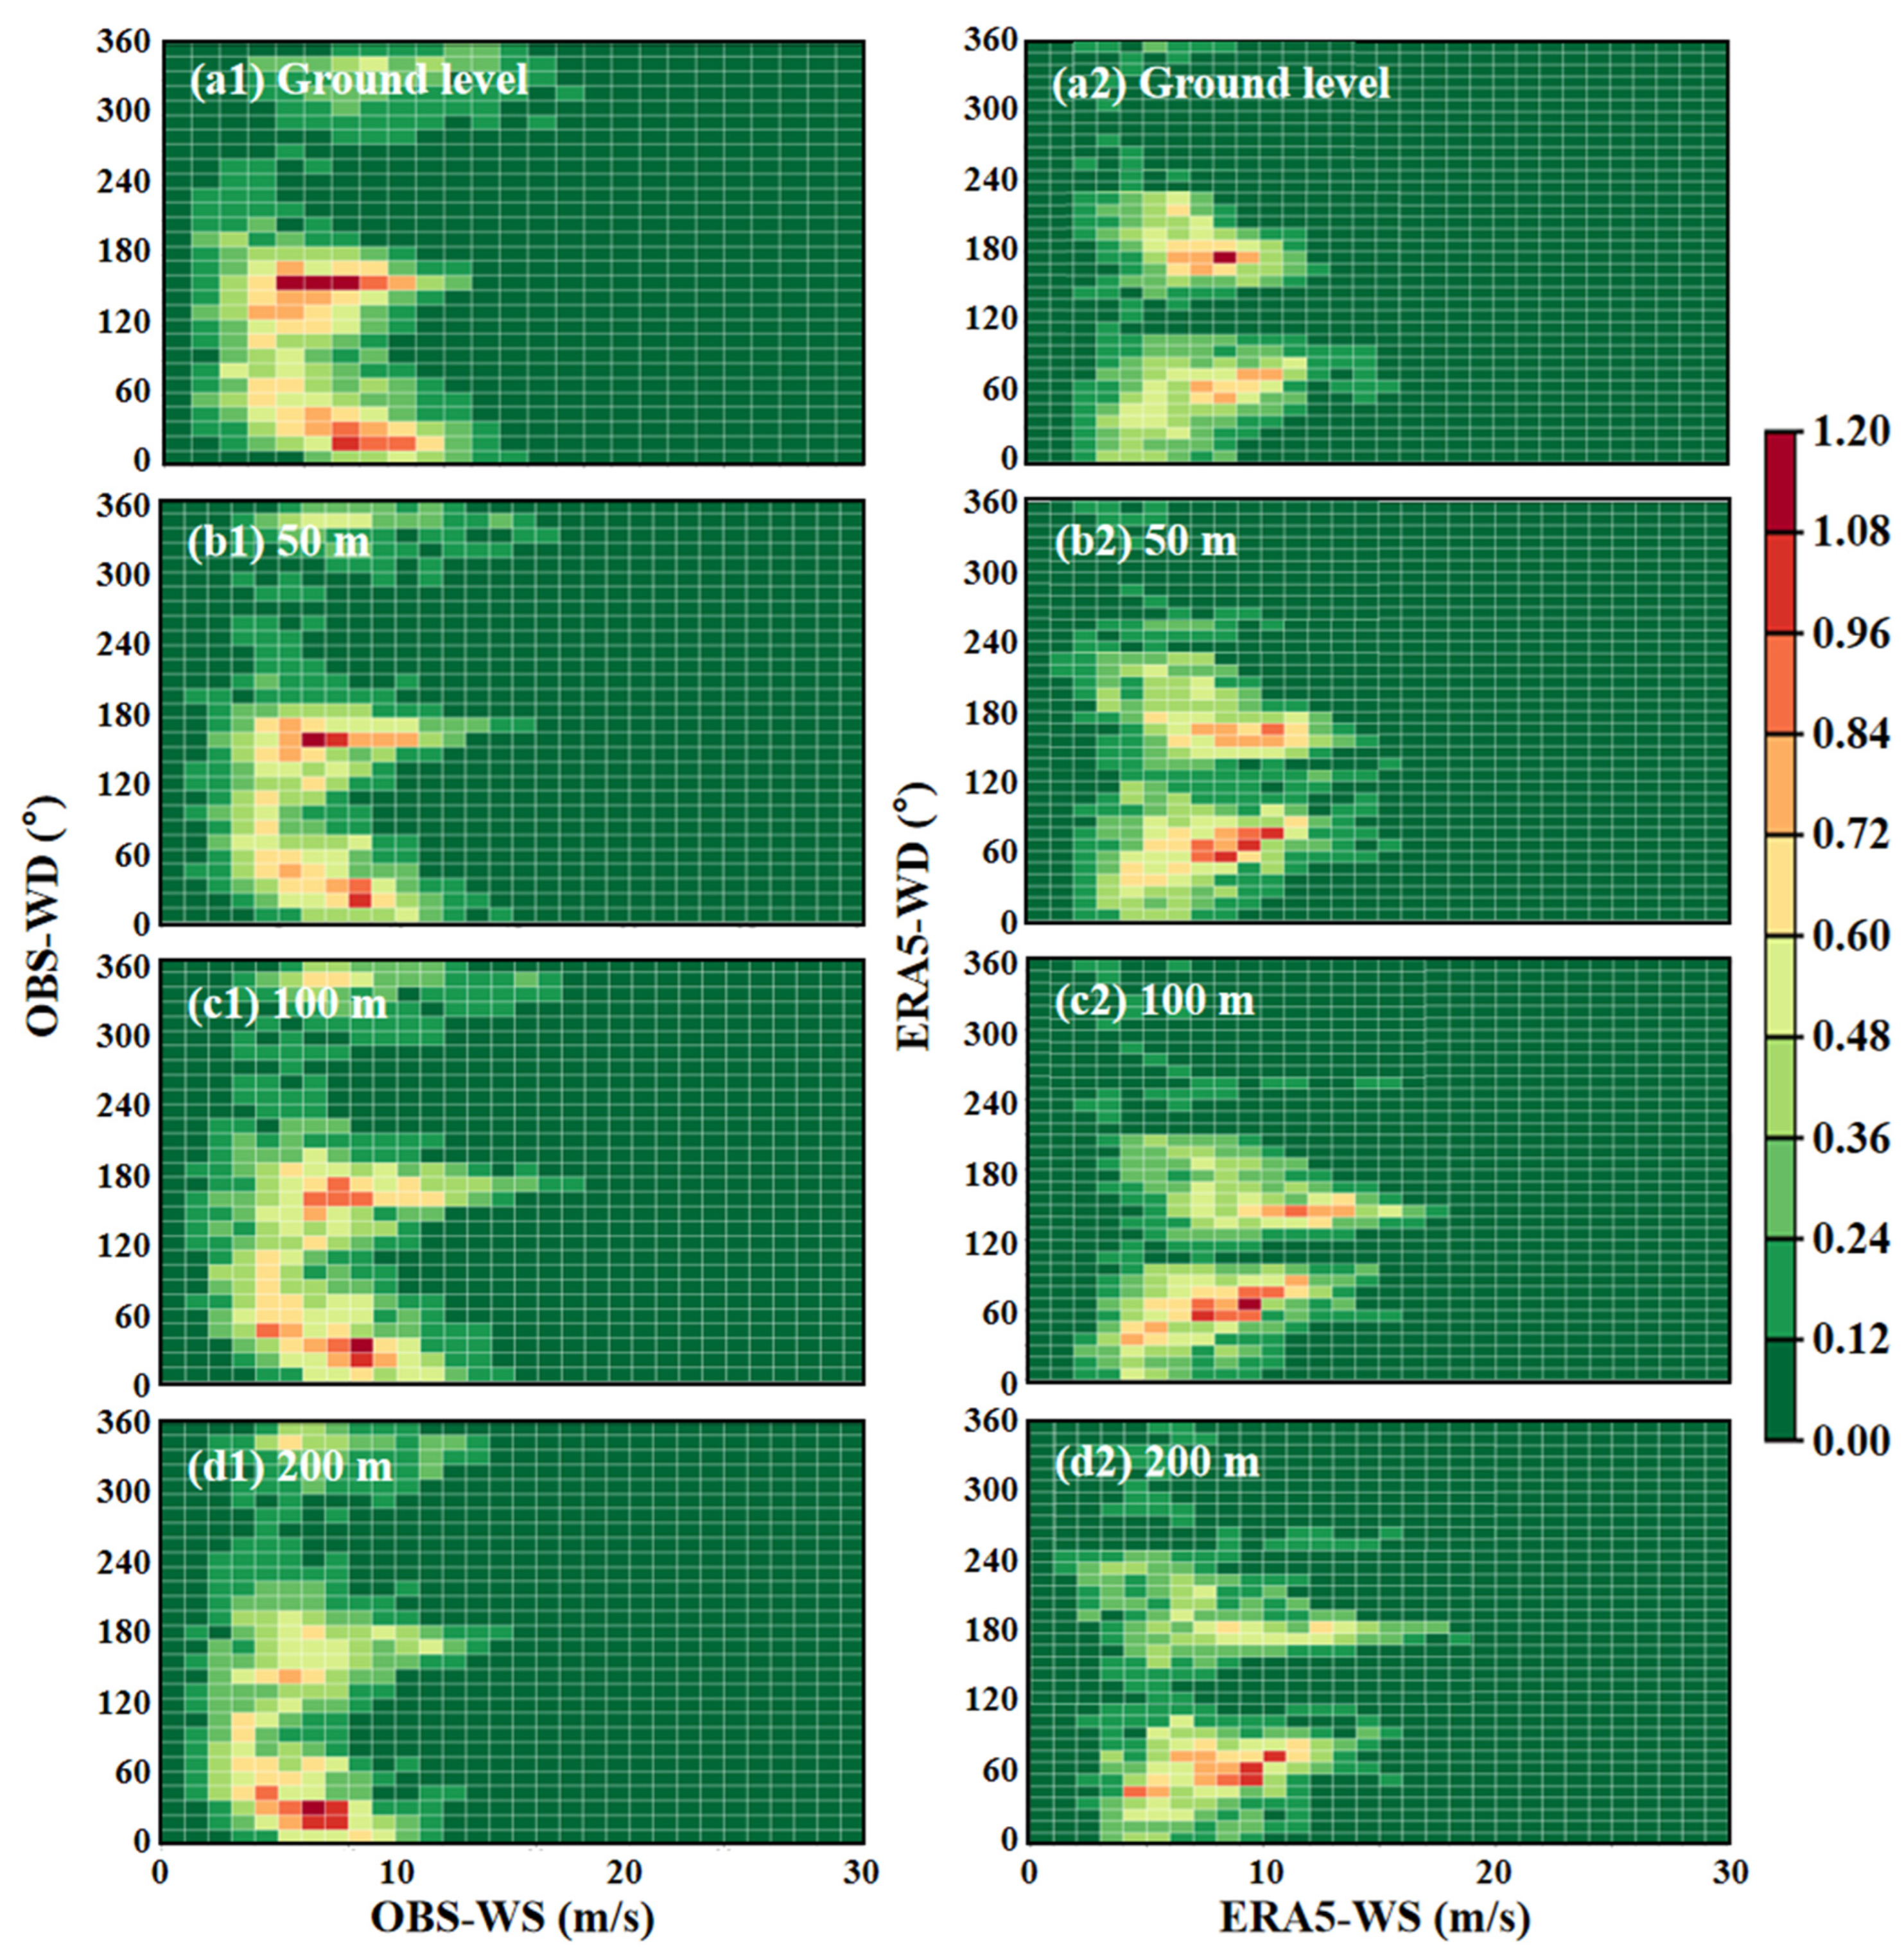
The joint distributions of LiDAR and ERA5 WSs and corresponding WDs at each height were further compared (Figure 8). At the ground level, the maximum frequency of measured WSs was in the range of 4–7 m/s, and the WDs were near 160° and 10°. WSs higher than 10 m/s were mainly in the direction of 280–30°. The maximum frequency of ERA5 reanalysis data WS was in the range of 6–10 m/s, and WDs were near 150–180° and 60–80°. WSs higher than 10 m/s were mainly in the directions 30–90° and 130–190°. At a 50–200 m altitude, the observed maximum wind frequency gradually switched from 160° to near 10–30°. However, 160–180° showed an increase in the frequency of larger WSs above 10 m/s. The ERA5 reanalysis data also showed two areas of large frequency values, with WDs of 50–80°, similar to those in the measurements.

3.3. Evaluation of ERA5 Reanalysis Data Applicability in a Typical Typhoon Event

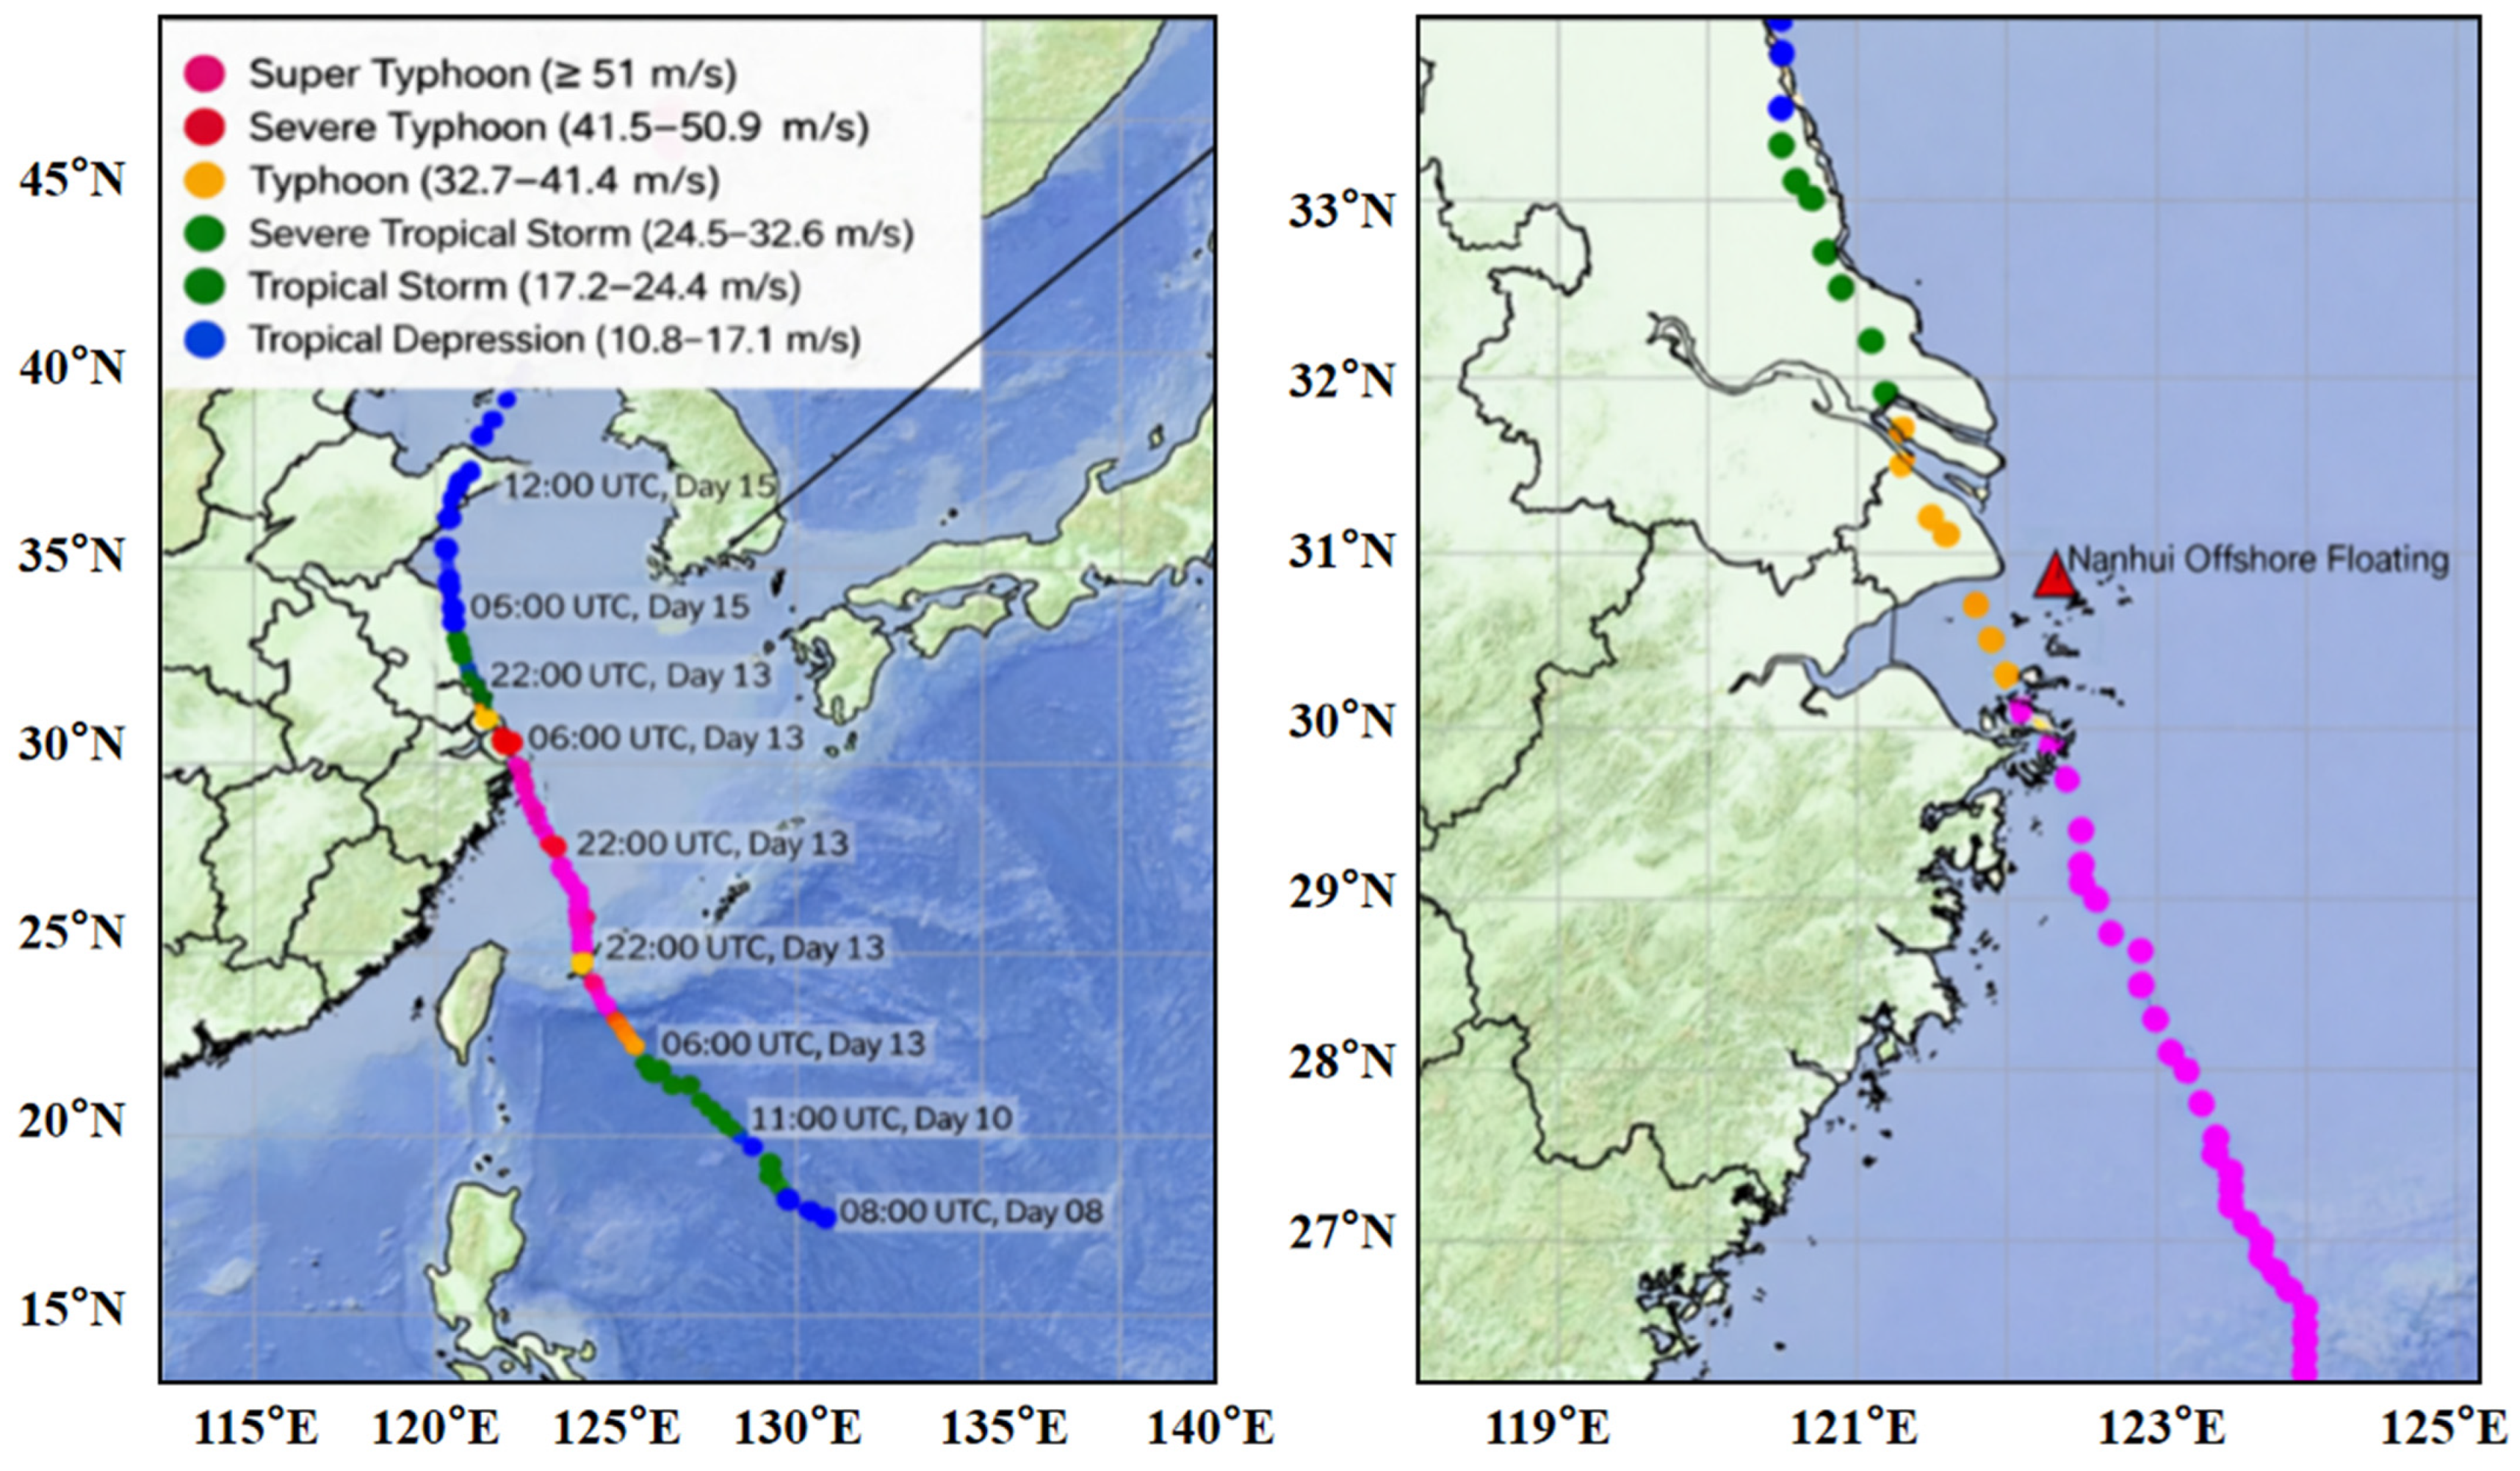
On September 8, 2022, at 8:00 AM, Typhoon Muifa (tropical storm level) formed over the Northwest Pacific Ocean (Figure 9), with a maximum WS of 18 m/s (Force 8) and a minimum central pressure of 998 hPa. The typhoon’s center was located approximately 1120 km southeast of Naha City, Okinawa, Japan. By the early morning of September 11, Muifa had intensified into a severe typhoon, with its center positioned 440 km southeast of Taipei, Taiwan (latitude 22.4° N, longitude 124.7° E). At this stage, the maximum WS near its center was 42 m/s (Force 14), the minimum central pressure was 955 hPa, and the radius of gale force winds (Force 7) extended 260–300 km, with a radius of 70 km for force 10 winds and 30 km for force 12 winds.
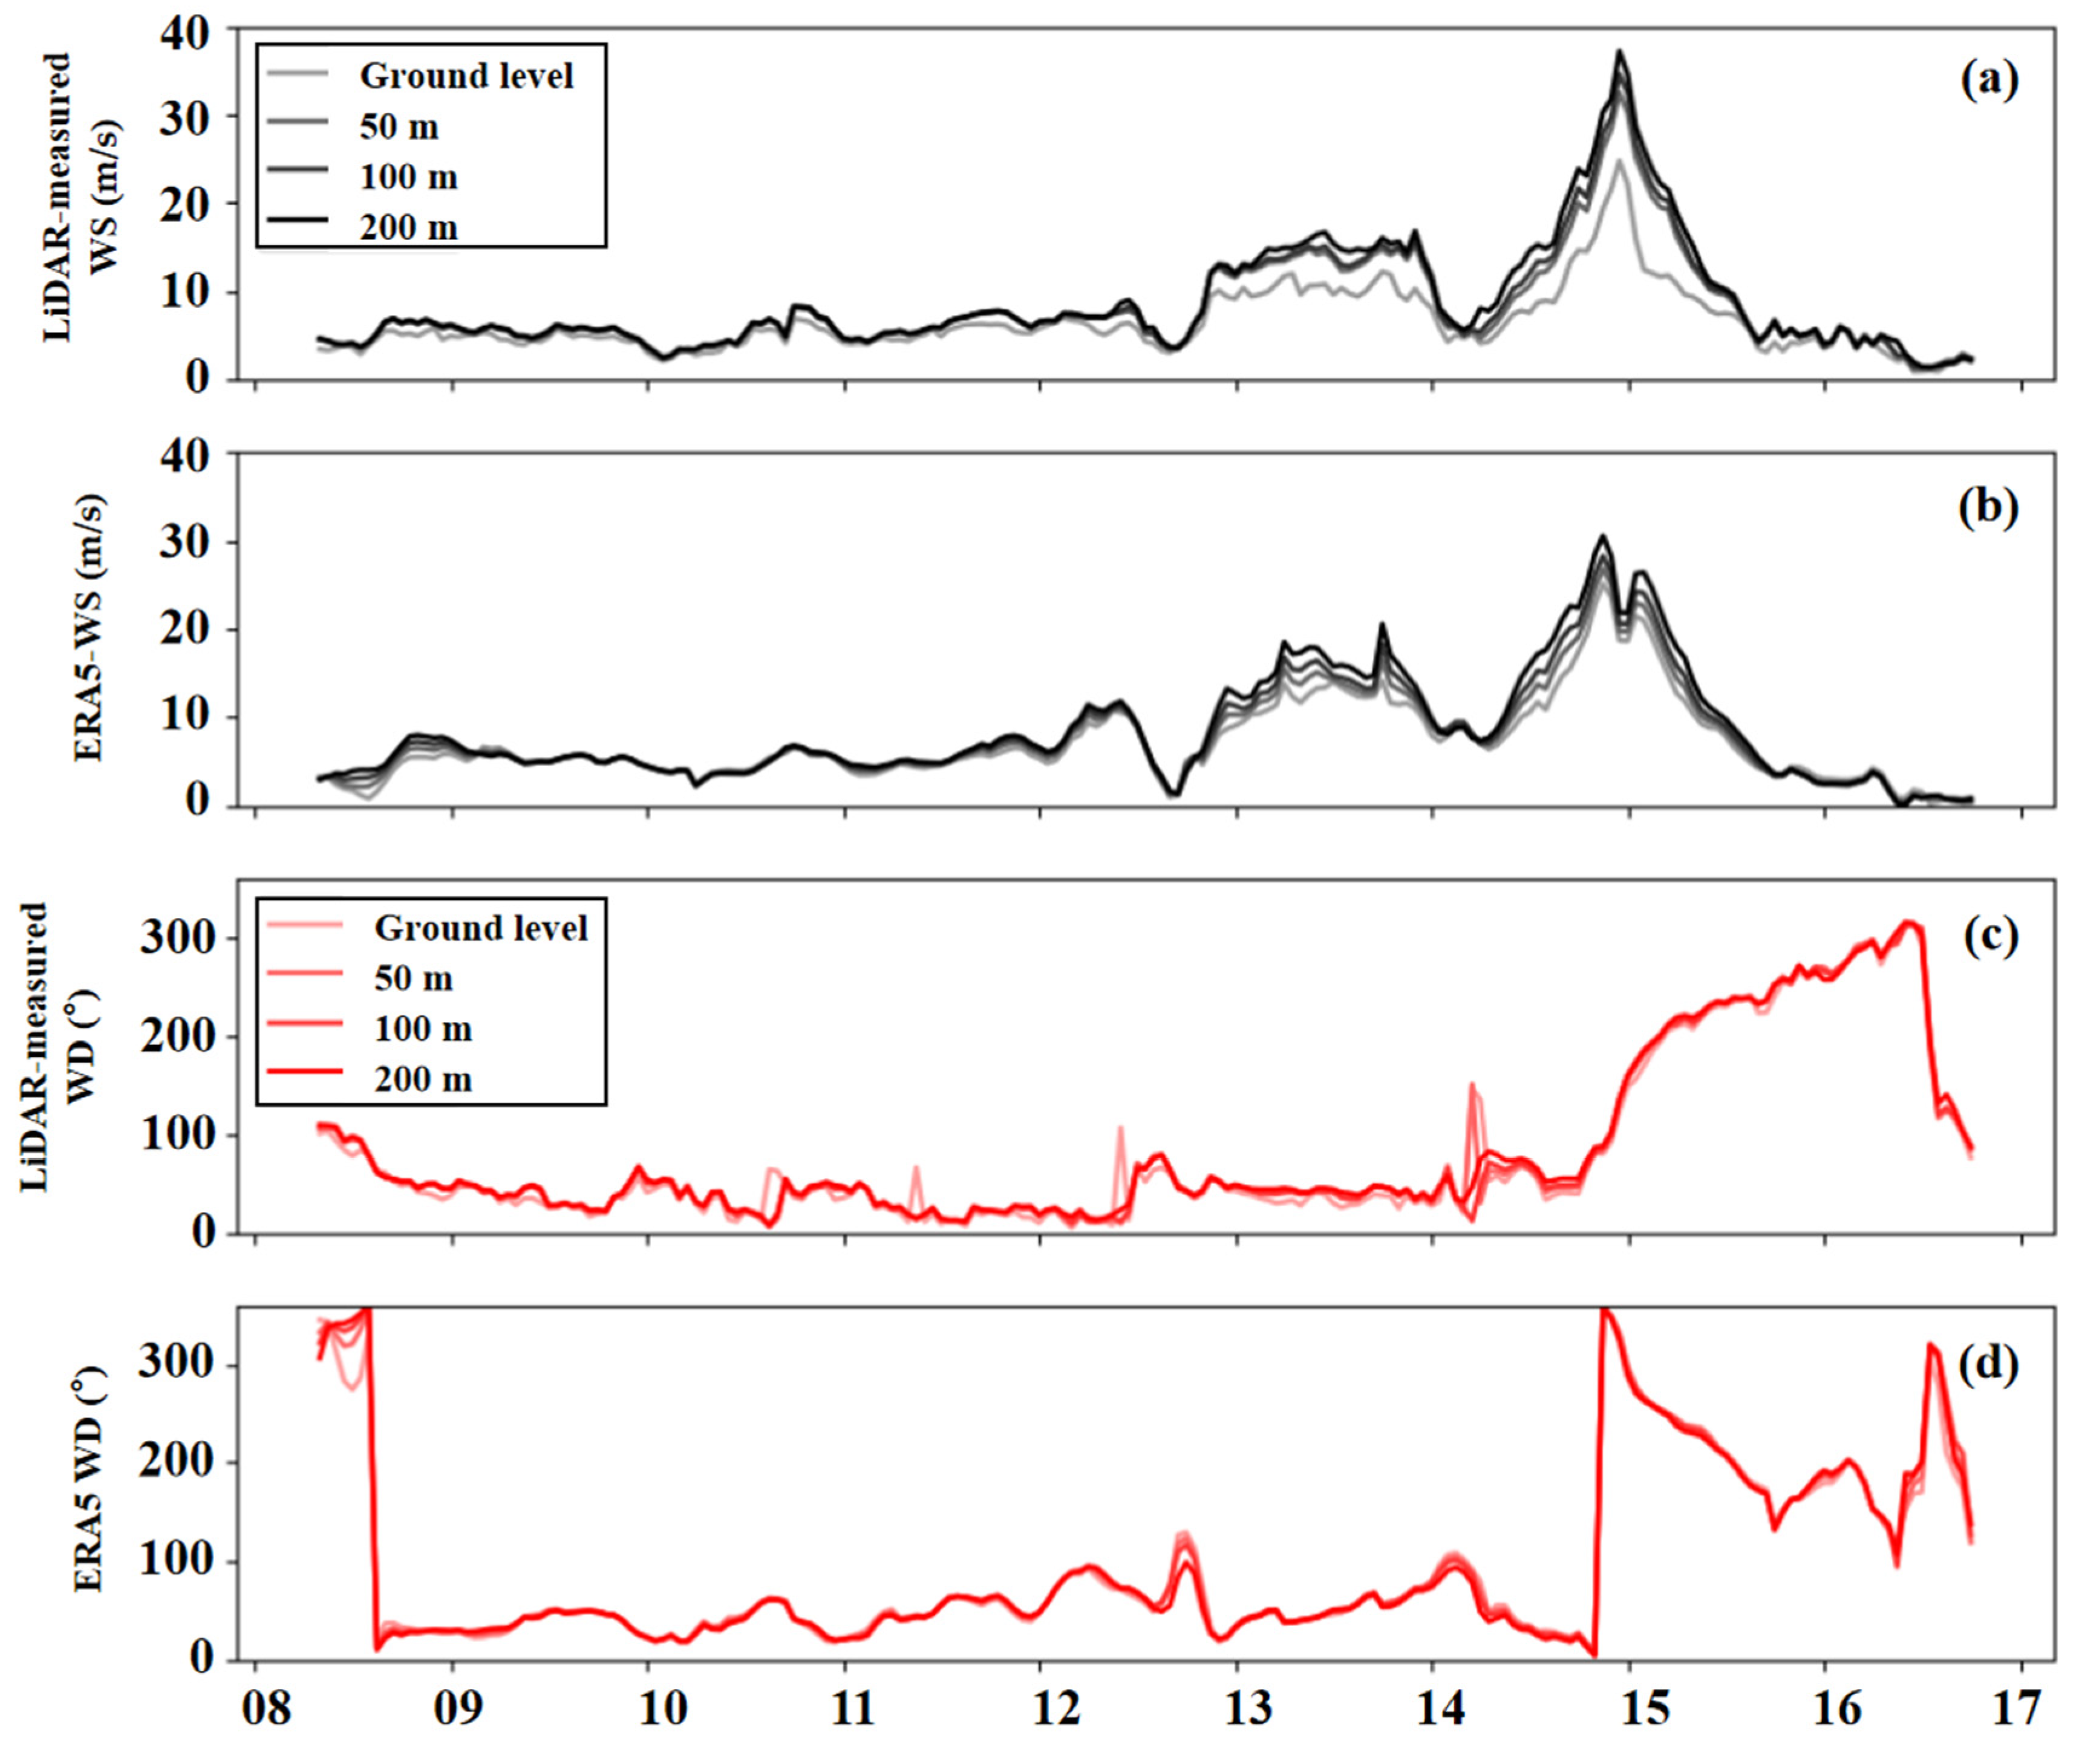
Typhoon Muifa started at 8:00 a.m. on the morning of the 14th, affecting the wind radar observation area (WS > 6 m/s), and at 14:00 on the 15th, the typhoon passed through, and the effect on the LiDAR measurement area disappeared (WS < 6 m/s). As shown in Figure 10, with the movement of the typhoon, the WS detected by the LiDAR first increased and then decreased. The ERA5 WS and LiDAR WS both reflected this feature very well. The peak WSs measured by LiDAR at ground level, 50 m, 100 m, and 200 m were 24.7 m/s, 32.4 m/s, 34.6 m/s, and 37.2 m/s, respectively, all occurring at 23:00 on the 14th, while the peak WSs of ERA5 at the same four heights were 25.1 m/s, 26.8 m/s, 28.3 m/s, and 30.5 m/s, all of which occurred at 21:00 on the 14th. In terms of WS extremes, the maximum WS of ERA5 during Typhoon Muifa was significantly lower than the LiDAR measurements and showed a certain degree of lag, indicating that there is a risk of underestimating the maximum WS based on ERA5 data evaluation. The underestimation of extreme wind speeds by ERA5 is not merely a numerical discrepancy but a consequential bias with direct engineering implications. As shown in Table 1, for 10-, 20-, and 50-year return period winds, ERA5 underestimates wind speeds by 16.06–16.51%, resulting in inadequate safety margins in the wind-resistant design of offshore wind turbines and thereby introducing quantifiable structural and operational risks. The measured WDs at different heights show clockwise evolution, while the WD of ERA5 has a counterclockwise pattern, which shows that ERA5 was less effective for the WD data during the extreme typhoon event. This was possibly because ERA5’s coarse spatial resolution failed to resolve tropical cyclone boundary-layer inflow and coastal steering flow interactions, thus failing to capture the evolution of WD.
As Typhoon Muifa is the only single event that traversed the measurement site during the measurement period, the LiDAR datasets do not support comparative analysis across multiple typhoon cases. Although our findings cannot be generalized to all typhoon events, they provide empirically validated insights into ERA5’s performance under the specific observational constraints and boundary-layer conditions encountered during this tropical cyclone.

4. Conclusions and Discussion

In this study, we used one-year continuous measurements of the wind profile from 15 January 2022 to 15 January 2023 at the Shanghai Nanhui Offshore Wind Farm to evaluate the applicability of ERA5 wind data over the East China Sea, with the findings summarized below.
The correlations of WSs between the two datasets increased with height from 0.76 at the ground level to 0.90 at 200 m, indicating that the accuracy of ERA5 data improved correspondingly. Consistently, ERA5 WS exhibited a positive bias relative to observations across all levels, with the magnitude of overestimation decreasing from 2.33 m/s at the ground level to 1.77 m/s at 200 m. In addition, the smallest discrepancies were observed in December, while the largest occurred in August, likely due to frequent monsoon activity in summer. Furthermore, the WS frequency distributions at all heights conformed to the Weibull distribution. In terms of WD, ERA5 demonstrated strong fidelity in reproducing offshore near-surface WDs. Both datasets consistently showed dominant wind frequencies in the NNE and SSE directions, peaking at approximately 1000 occurrences. During a typical typhoon event (Muifa), ERA5 reanalysis data effectively captured the process of WS initially increasing and then decreasing. However, ERA5 displayed a certain degree of lag in capturing peak WS, and its extreme WSs were significantly lower than observed values. For multi-year return period assessments, ERA5 data may underestimate extreme WS by 16.06–16.51%. Regarding WD, observations demonstrated a clockwise evolution pattern, while ERA5 data exhibited a counterclockwise pattern, indicating poor performance of ERA5 in representing WD during typhoon events.
The novelty of this study lies in two aspects: (1) Unlike previous coastal validation efforts that predominantly utilized fixed meteorological towers or land-based lidar systems, this work leveraged a BA-FLS-NX5 floating LiDAR system deployed at a representative offshore wind farm site in the East China Sea, enabling direct, in situ validation of ERA5 reanalysis under realistic marine conditions. (2) It extended vertical validation continuously from the sea surface to 200 m, comprehensively covering the full operational hub-height range of contemporary offshore wind turbines (currently spanning 100–160 m, with emerging installations extending to 180–200 m). To our knowledge, this constitutes the first observationally grounded, vertically resolved assessment of ERA5 performance across the entire atmospheric column, critical for offshore wind energy resource characterization in the East China Sea.
For operational use of ERA5 data in offshore wind energy applications, we recommend a height-dependent linear bias correction strategy based on the site-specific scatter regression equations derived in this study. Within the turbine hub height range (100–200 m), ERA5 exhibits comparatively lower systematic bias and thus warrants prioritized use. For turbine siting, ERA5 reliably identifies broad mean wind corridors at regional scales. However, in typhoon-prone zones where flow distortion and extreme gusts dominate, high-resolution numerical modeling or high-frequency in situ measurements remain essential for micro-siting decisions. For power forecasting, optimal performance is achieved by dynamically blending ERA5’s medium- to long-term atmospheric boundary conditions with real-time observational updates to mitigate its known lag in capturing rapid-onset extreme wind events. Further improvements can be realized through dynamical downscaling of ERA5 using regional climate models coupled with data assimilation of floating LiDAR profiles, thereby reducing vertical structure errors and strengthening ERA5’s utility for the planning and operation of offshore wind farms in the East China Sea.

Author Contributions

Writing—original draft, Y.Y. and Y.M.; methodology, Y.M.; software, Y.Y.; writing—review and editing, L.D., Y.Z., K.K. and X.H.; funding acquisition, Y.Y.; formal analysis, Y.Y. and Y.M.; visualization, Y.Z.; data curation, Y.Y. and Y.M. All authors have read and agreed to the published version of the manuscript.

Funding

This research was funded by the scientific research project of Shanghai Investigation, Design & Research Institute Co., Ltd. [2021FD(8)-027].

Institutional Review Board Statement

Not applicable.

Informed Consent Statement

Not applicable.

Data Availability Statement

Research data from this study will be made available upon request (ma_yining@ctg.com.cn).

Conflicts of Interest

Authors Yibo Yuan, Yining Ma, Li Dai, Yuxin Zang, Keteng Ke and Xiaoxiang Huang were employed by the company Shanghai Investigation, Design & Research Institute Co., Ltd. The authors declare that the research was conducted in the absence of any commercial or financial relationships that could be construed as a potential conflict of interest.

References

  1. IPCC. Climate Change 2021: The Physical Science Basis. Contribution of Working Group I to the Sixth Assessment Report of the Intergovernmental Panel on Climate Change; Arias, P., Bellouin, N., Coppola, E., Eds.; Technical Summary; Cambridge University Press: Cambridge, UK, 2021. [Google Scholar]
  2. McInnes, K.L.; Erwin, T.A.; Bathols, J.M. Global Climate Model projected changes in 10 m wind speed and direction due to anthropogenic climate change. Atmos. Sci. Lett. 2011, 12, 325–333. [Google Scholar] [CrossRef] [Scilit]
  3. Lu, X.; McElroy, M.B. Global potential for wind-generated electricity. In Wind Energy Engineering; Academic Press: Cambridge, MA, USA, 2023; pp. 47–61. [Google Scholar]
  4. Shen, C.; Li, Z.B.; Yuan, H.S.; Yu, Y.; Lei, Y.D.; Chen, D.L. Increases of Offshore Wind Potential in a Warming World. Geophys. Res. Lett. 2024, 51, e2024GL109494. [Google Scholar] [CrossRef] [Scilit]
  5. MacKay, D.J. Solar energy in the context of energy use, energy transportation and energy storage. Philos. Trans. R. Soc. A Math. Phys. Eng. Sci. 2013, 371, 20110431. [Google Scholar]
  6. Archer, C.L.; Jacobson, M.Z. Evaluation of global wind power. J. Geophys. Res. Atmos. 2005, 110, D12110. [Google Scholar] [CrossRef] [Scilit]
  7. Pryor, S.C.; Barthelmie, R.J. Climate change impacts on wind energy: A review. Renew. Sustain. Energy Rev. 2010, 14, 430–437. [Google Scholar] [CrossRef] [Scilit]
  8. Li, Z.-B.; Sun, M.; Shen, C.; Chen, D. ENSO-driven seasonal variability in near-surface wind speed and wind power potential across China. Geophys. Res. Lett. 2025, 52, e2025GL115537. [Google Scholar] [CrossRef] [Scilit]
  9. Li, Z.B.; Xu, Y.; Yuan, H.S.; Chang, Y.L.; Shen, C. AMO footprint of the recent near-surface wind speed change over China. Environ. Res. Lett. 2024, 19, 114031. [Google Scholar] [CrossRef] [Scilit]
  10. Wu, J.; Shi, Y. Changes in surface wind speed and its different grades over China during 1961–2020 based on a high-resolution dataset. Int. J. Climatol. 2022, 42, 3954–3967. [Google Scholar] [CrossRef] [Scilit]
  11. Jiang, D.; Zhuang, D.; Huang, Y.; Wang, J.; Fu, J. Evaluating the spatio-temporal variation of China’s offshore wind resources based on remotely sensed wind field data. Renew. Sustain. Energy Rev. 2013, 24, 142–148. [Google Scholar]
  12. Salvação, N.; Guedes Soares, C. Resource assessment methods in the offshore wind energy sector. In Floating Offshore Wind Farms; Springer: Cham, Switzerland, 2016; pp. 121–141. Available online: http://www.springer.com/series/8059 (accessed on 14 March 2026).
  13. Zheng, C.W.; Zhuang, H.; Li, X.; Li, X. Wind energy and wave energy resources assessment in the East China Sea and South China Sea. Sci. China Technol. Sci. 2012, 55, 163–173. [Google Scholar]
  14. Nie, B.C.; Li, J.C. Technical potential assessment of offshore wind energy over shallow continent shelf along China coast. Renew. Energy 2018, 128, 391–399. [Google Scholar] [CrossRef] [Scilit]
  15. Dörenkämper, M.; Witha, B.; Steinfeld, G.; Heinemann, D.; Kühn, M. The impact of stable atmospheric boundary layers on wind-turbine wakes within offshore wind farms. J. Wind Eng. Ind. Aerodyn. 2015, 144, 146–153. [Google Scholar] [CrossRef] [Scilit]
  16. Siswanto, E.; Ishizaka, J.; Morimoto, A.; Tanaka, K.; Okamura, K.; Kristijono, A.; Saino, T. Ocean physical and biogeochemical responses to the passage of Typhoon Meari in the East China Sea observed from Argo float and multiplatform satellites. Geophys. Res. Lett. 2008, 35, L15604. [Google Scholar] [CrossRef] [Scilit]
  17. Zhao, D.; Xin, J.; Wang, W.; Jia, D.; Wang, Z.; Xiao, H.; Liu, C.; Zhou, J.; Tong, L.; Ma, Y.; et al. Effects of the sea-land breeze on coastal ozone pollution in the Yangtze River Delta, China. Sci. Total Environ. 2022, 807, 150306. [Google Scholar] [CrossRef] [Scilit]
  18. Jia, D.; Xin, J.; Wang, Z.; Wang, W.; Wang, X.; Xiao, H.; Liu, C.; Zhou, J.; Tong, L.; Sun, Y.; et al. The dynamic, thermal and material structures of sea-land breeze circulation at the coastal of Ningbo, East China Sea. Atmos. Res. 2023, 283, 106540. [Google Scholar] [CrossRef] [Scilit]
  19. Hersbach, H. The ERA5 atmospheric reanalysis. In AGU Fall Meeting Abstracts; AGU: San Francisco, CA, USA, 2016; Volume 2016, p. NG33D-01. [Google Scholar]
  20. Hersbach, H.; Bell, B.; Berrisford, P.; Hirahara, S.; Horányi, A.; Muñoz-Sabater, J.; Nicolas, J.; Peubey, C.; Radu, R.; Schepers, D.; et al. The ERA5 global reanalysis. Q. J. R. Meteorol. Soc. 2020, 146, 1999–2049. [Google Scholar] [CrossRef] [Scilit]
  21. Prein, A.F. Thunderstorm straight line winds intensify with climate change. Nat. Clim. Change 2023, 13, 1353–1359. [Google Scholar]
  22. Ramon, J.; Lledó, L.; Torralba, V.; Soret, A.; Doblas-Reyes, F.J. What global reanalysis best represents near-surface winds? Q. J. R. Meteorol. Soc. 2019, 145, 3236–3251. [Google Scholar] [CrossRef] [Scilit]
  23. Carvalho, D.; Rocha, A.; Gómez-Gesteira, M.; Santos, C.S. Offshore wind energy resource simulation forced by different reanalyses: Comparison with observed data in the Iberian Peninsula. Appl. Energy 2014, 134, 57–64. [Google Scholar] [CrossRef] [Scilit]
  24. Wei, Y.M.; Peng, K.C.; Ma, Y.J.; Sun, Y.; Zhao, D.; Ren, X.; Yang, S.; Ahmad, M.; Pan, X.; Wang, Z.; et al. Validation of ERA5 boundary layer meteorological variables by the remote-sensing measurements in the southeast China mountains. Remote Sens. 2024, 16, 548. [Google Scholar] [CrossRef] [Scilit]
  25. Xue, D.; Lu, J.; Leung, L.R.; Teng, H.; Song, F.; Zhou, T.; Zhang, Y. Robust projection of East Asian summer monsoon rainfall based on dynamical modes of variability. Nat. Commun. 2023, 14, 3856. [Google Scholar] [CrossRef] [Scilit] [PubMed]
  26. Li, J.; Ju, H.F.; Jiang, Y.Y.; Zhong, S.S.; Zhu, Z.W. Insignificant future changes in decadal variability of East Asiansummer monsoon rainfall. Clim. Dyn. 2026, 64, 122. [Google Scholar] [CrossRef] [Scilit]
  27. Yuan, Y.B.; He, Y.; Zhu, B.H.; Gu, C.; Song, L.F.; Chen, D.D.; Qiu, J.Y.; Yang, C. Analysis and validation of measurement data for a continuous wave lidar based floating wind-measurement system. J. Appl. Oceanogr. 2025, 44, 355–364. [Google Scholar]
  28. Wang, Q.; Wang, T.; Lu, J.N. Comparison of the data measured by Fraunhofer IWES buoy and fixed wind tower in testing stage. Coast. Eng. 2020, 39, 130–141. [Google Scholar]
  29. Nefabas, K.L.; Söder, L.; Mamo, M.; Olauson, J. Modeling of ethiopian wind power production using era5 reanalysis data. Energies 2021, 14, 2573. [Google Scholar] [CrossRef] [Scilit]
  30. Cucchi, M.; Weedon, G.P.; Amici, A.; Bellouin, N.; Lange, S.; Müller Schmied, H.; Buontempo, C. WFDE5: Bias-adjusted ERA5 reanalysis data for impact studies. Earth Syst. Sci. Data 2020, 12, 2097–2120. [Google Scholar] [CrossRef] [Scilit]
  31. Wei, Y.; Sun, Y.; Ma, Y.; Tan, Y.; Ren, X.; Peng, K.; Yang, S.; Lin, Z.; Zhou, X.; Ren, Y.; et al. Deviations of Boundary Layer Height and Meteorological Parameters Between Ground-Based Remote Sensing and ERA5 over the Complex Terrain of the Mongolian Plateau. Remote Sens. 2025, 17, 393. [Google Scholar] [CrossRef] [Scilit]
  32. Suo, C.N.; Sun, A.X.; Yan, C.W.; Cao, X.Q.; Peng, K.C.; Tan, Y.L.; Yang, S.M.; Wei, Y.M.; Wang, G.J. Quality assessment of ERA5 wind speed and its impact on atmosphere environment using Radar profiles along the Bohai Bay Coastline. Atmosphere 2024, 15, 1153. [Google Scholar] [CrossRef] [Scilit]
  33. Wang, J.; Li, Z.; Liang, Y.; Ke, J. An Assessment of the Applicability of ERA5 Reanalysis Boundary Layer Data Against Remote Sensing Observations in Mountainous Central China. Atmosphere 2025, 16, 1152. [Google Scholar] [CrossRef] [Scilit]
  34. Yang, S.; Ma, Y.; Zhang, W.; Ren, X.; Peng, K.; Ahmad, M.; Jia, D.; Zhao, D.; Kong, L.; Ma, Y.; et al. High-Resolution Remote Sensing of the Gradient Richardson Number in a Megacity Boundary Layer. Remote Sens. 2024, 16, 1075. [Google Scholar] [CrossRef] [Scilit]
  35. Bulut, A.; Bingol, O. Weibull parameter estimation methods on wind energy applications—A review of recent developments. Theor. Appl. Climatol. 2025, 155, 9157–9184. [Google Scholar] [CrossRef] [Scilit]
  36. Kang, D.; Ko, K.; Huh, J. Determination of extreme wind values using the Gumbel distribution. Energy 2015, 86, 51–58. [Google Scholar] [CrossRef] [Scilit]
  37. Zhai, R.; Huang, C.; Yang, W.; Tang, L.; Zhang, W. Applicability evaluation of ERA5 wind and wave reanalysis data in the South China Sea. J. Oceanol. Limnol. 2023, 41, 495–517. [Google Scholar] [CrossRef] [Scilit]
  38. Ombadi, M.; Risser, M.D.; Rhoades, A.M.; Varadharajan, C. A warming-induced reduction in snow fraction amplifies rainfall extremes. Nature 2023, 619, 305–310. [Google Scholar] [CrossRef] [Scilit] [PubMed]
  39. Xin, Y.; Lu, N.; Jiang, H.; Liu, Y.; Yao, L. Performance of ERA5 reanalysis precipitation products in the Guangdong-Hong Kong-Macao greater bay area 2021, China. J. Hydrol. 2021, 602, 126791. [Google Scholar] [CrossRef] [Scilit]
  40. Jiang, Q.; Li, W.; Fan, Z.; He, X.; Sun, W.; Chen, S.; Wen, J.; Gao, J.; Wang, J. Evaluation of the ERA5 reanalysis precipitation dataset over Chinese Mainland. J. Hydrol. 2021, 595, 125660. [Google Scholar] [CrossRef] [Scilit]
  41. Jiao, D.; Xu, N.; Yang, F.; Xu, K. Evaluation of spatial-temporal variation performance of ERA5 precipitation data in China. Sci. Rep. 2021, 11, 17956. [Google Scholar] [CrossRef] [Scilit]
Figure 1. Location map of the Shanghai Nanhui Offshore Wind Farm.
Atmosphere 17 00310 g001
Figure 2. Time series of LiDAR-measured WS (red solid line) and ERA5 WS (blue solid line) at (a) ground level, (b) 50 m, (c) 100 m, and (d) 200 m.
Atmosphere 17 00310 g002
Figure 3. Density scatter plots of LiDAR-measured and ERA5 WSs at (a) ground level, (b) 50 m, (c) 100 m, and (d) 200 m.
Atmosphere 17 00310 g003
Figure 4. (a) Hourly and (b) monthly mean differences (∆WSLiDAR-ERA5) between LiDAR-measured and ERA5 WSs.
Atmosphere 17 00310 g004
Figure 5. Taylor diagram of WS standard deviations at different heights.
Atmosphere 17 00310 g005
Figure 6. Frequency distributions of LiDAR-measured and ERA5 WSs at (a1,a2) ground level, (b1,b2) 50 m, (c1,c2) 100 m, and (d1,d2) 200 m.
Atmosphere 17 00310 g006
Figure 7. Wind frequency distributions at different heights for (left) LiDAR-measured and (right) ERA5 data.
Atmosphere 17 00310 g007
Figure 8. Joint distributions of WS and WD for (a1d1) LiDAR measurements and (a2d2) ERA5 reanalysis data at (a1,a2) ground Level, (b1,b2) 50 m, (c1,c2) 100 m, and (d1,d2) 200 m.
Atmosphere 17 00310 g008
Figure 9. Track and intensity of Typhoon Muifa.
Atmosphere 17 00310 g009
Figure 10. LiDAR-measured and ERA5 (a,b) WSs and (c,d) WDs at different heights.
Atmosphere 17 00310 g010
Table 1. The bias of ERA5 data for different return periods.
Return Period
(Years)
Measurement
(m/s)
ERA5
(m/s)
Absolute Bias
(m/s)
Relative Bias
(%)
1039.8533.27−6.58−16.51
2042.7335.71−7.02−16.43
5046.3238.88−7.44−16.06
Disclaimer/Publisher’s Note: The statements, opinions and data contained in all publications are solely those of the individual author(s) and contributor(s) and not of MDPI and/or the editor(s). MDPI and/or the editor(s) disclaim responsibility for any injury to people or property resulting from any ideas, methods, instructions or products referred to in the content.