Article

Climate Change Impacts on Olive Growing in Extremadura (Spain) Based on Different Bioclimatic Indices and Future Climate Scenarios


by
Virginia Alberdi Nieves
Departamento de Didáctica de las Ciencias Sociales, Lengua y Literatura, Facultad de Educación y Psicología, Universidad de Extremadura, Avenida de Elvas s/n, 06006 Badajoz, Spain
Atmosphere 2026, 17(3), 309; https://doi.org/10.3390/atmos17030309
Submission received: 26 June 2025 / Revised: 5 March 2026 / Accepted: 10 March 2026 / Published: 18 March 2026
(This article belongs to the Special Issue Climate Change and Its Effects over Spain)

Abstract

Olive cultivation is widespread throughout the Mediterranean basin, where the world’s main producing countries are located. Regions such as Extremadura are considered to be at high risk from the effects of climate change in the near future. In particular, olive cultivation is highly sensitive to climate change and can suffer profound effects on phenology and yield. This crop depends directly on variables such as maximum and minimum temperatures and rainfall. In this study, we have analysed how olive cultivation could be affected by calculating two bioclimatic indices, the Dryness Index (DI) and the Cool Night Index (CI), for three future periods. The methodology used projected ten combinations of climate models in two scenarios, RCP 4.5 and RCP 8.5. The results showed significant variations in the bioclimatic indices over the periods, which were used to calculate the water stress and extreme temperatures that these crops could suffer. They indicate that most of Extremadura will continue to be suitable for cultivation in the near future (2006–2035), while by the middle of the century (2036–2065) 67% of the area will remain temperate, where 72% of the olive groves are located, with a Dryness Index of 18% in the very dry category. By the end of the century (2066–2095), the zone will be 60–34% warm and very dry, with a Dryness Index of 72%. These results show that it will probably be necessary to create new areas suitable for olive cultivation and new varieties.

1. Introduction

Olive cultivation is a cornerstone of the agroclimatic landscape of Extremadura (south-western Spain), representing both the largest permanent crop in the region and a key pillar of its rural economy [1]. The region’s distinctive climate, characterised by increasing aridity combined with relatively cool nocturnal temperatures, makes Extremadura particularly suitable for evaluating climate-related constraints on olive growing [2]. In this context, the joint analysis of the Dryness Index (DI) and the Cool Night Index (CI) provides a novel and robust framework to assess current and future agroclimatic suitability, while high-resolution, multi-model climate projections offer valuable insights for regional agricultural planning under climate change conditions [3,4].
Olive groves constitute one of the most important permanent crops in the Mediterranean basin, covering approximately 11.5 million hectares worldwide. Within the European Union, olive cultivation accounts for 48.3% of the global olive-growing area, with Spain alone representing 50.5% of the EU total [5]. In Extremadura, olive groves occupy 296,190 ha (10.2% of the national olive-growing area), making olives the crop with the largest surface area in the region and a fundamental component of rural economies, as reported in the Agricultural Statistics Yearbook of the Ministry of Agriculture, Fisheries and Food (MAPA) [6].
Climatic conditions, particularly temperature and precipitation regimes, strongly determine olive productivity, phenology, and oil quality [7]. Minimum temperatures play a crucial role in defining crop distribution and productivity, influencing frost risk, phenological development, and physiological processes [8,9]. The Cool Night Index (CI) has been widely used to assess the impact of nocturnal temperatures on crop suitability and spatial distribution [10,11]. Likewise, water availability is a critical limiting factor in semi-arid Mediterranean environments. Climate projections indicate rising temperatures and altered precipitation patterns across the region, leading to enhanced water stress and increased irrigation demand [12,13]. Notably, nocturnal temperatures are projected to increase faster than daytime temperatures, potentially affecting flowering, fruit set, and oil quality [14].
Recent research highlights the advantages of combining temperature- and vegetation-based indices to characterise dryness conditions [15,16]. In this context, the DI together with the CI provides an effective framework for assessing agroclimatic suitability and potential stress for olive cultivation. However, few studies have applied these indices jointly using high-resolution, multi-model climate projections to evaluate future changes at a regional scale [17].
Future climate projections are closely linked to greenhouse gas (GHG) emission trajectories, commonly represented by the Representative Concentration Pathways (RCPs: 2.6, 4.5, 6.0, 8.5) developed by the IPCC [18]. Using ensembles of Global Climate Models (GCMs) and Regional Climate Models (RCMs) allows a robust assessment of uncertainty and spatial variability, particularly at high spatial resolution. Land surface temperature (LST) is closely related to soil moisture and vegetation cover, both of which influence drought detection and agroclimatic assessments [19]. Therefore, integrated approaches that combine temperature and dryness indices are essential in heterogeneous olive-growing landscapes [20].
Against this background, the objective of this study is to assess current and future agroclimatic suitability for olive cultivation in Extremadura by jointly analysing the Dryness Index (DI) and the Cool Night Index (CI) under multiple future climate scenarios (2006–2035, 2036–2065 and 2066–2095). By employing high-resolution multi-model climate projections, this work aims to provide a comprehensive and spatially explicit evaluation of potential climate change impacts on olive growing in the region.
The main objectives of this study were to: (1) analyse the influence of bioclimatic indices on olive cultivation in Extremadura, evaluating temporal trends in the Cool Night Index (CI) and Dryness Index (DI), as well as the projected increase in night-time temperatures and the intensification of aridity, (2) generate high-resolution (12.5 km) maps of the CI and DI indices across the different periods to determine the expansion of very dry and extremely dry zones, (3) determine the spatial redistribution of agroclimatic suitability for olive cultivation across the different time horizons, by overlaying CI–DI maps with the current distribution of olive groves, (4) to quantita-tively evaluate the agroclimatic impact on olive yield and oil quality, considering the effects of rising night-time temperatures and water stress on flowering and fruit size.

2. Methodology

2.1. Study Area

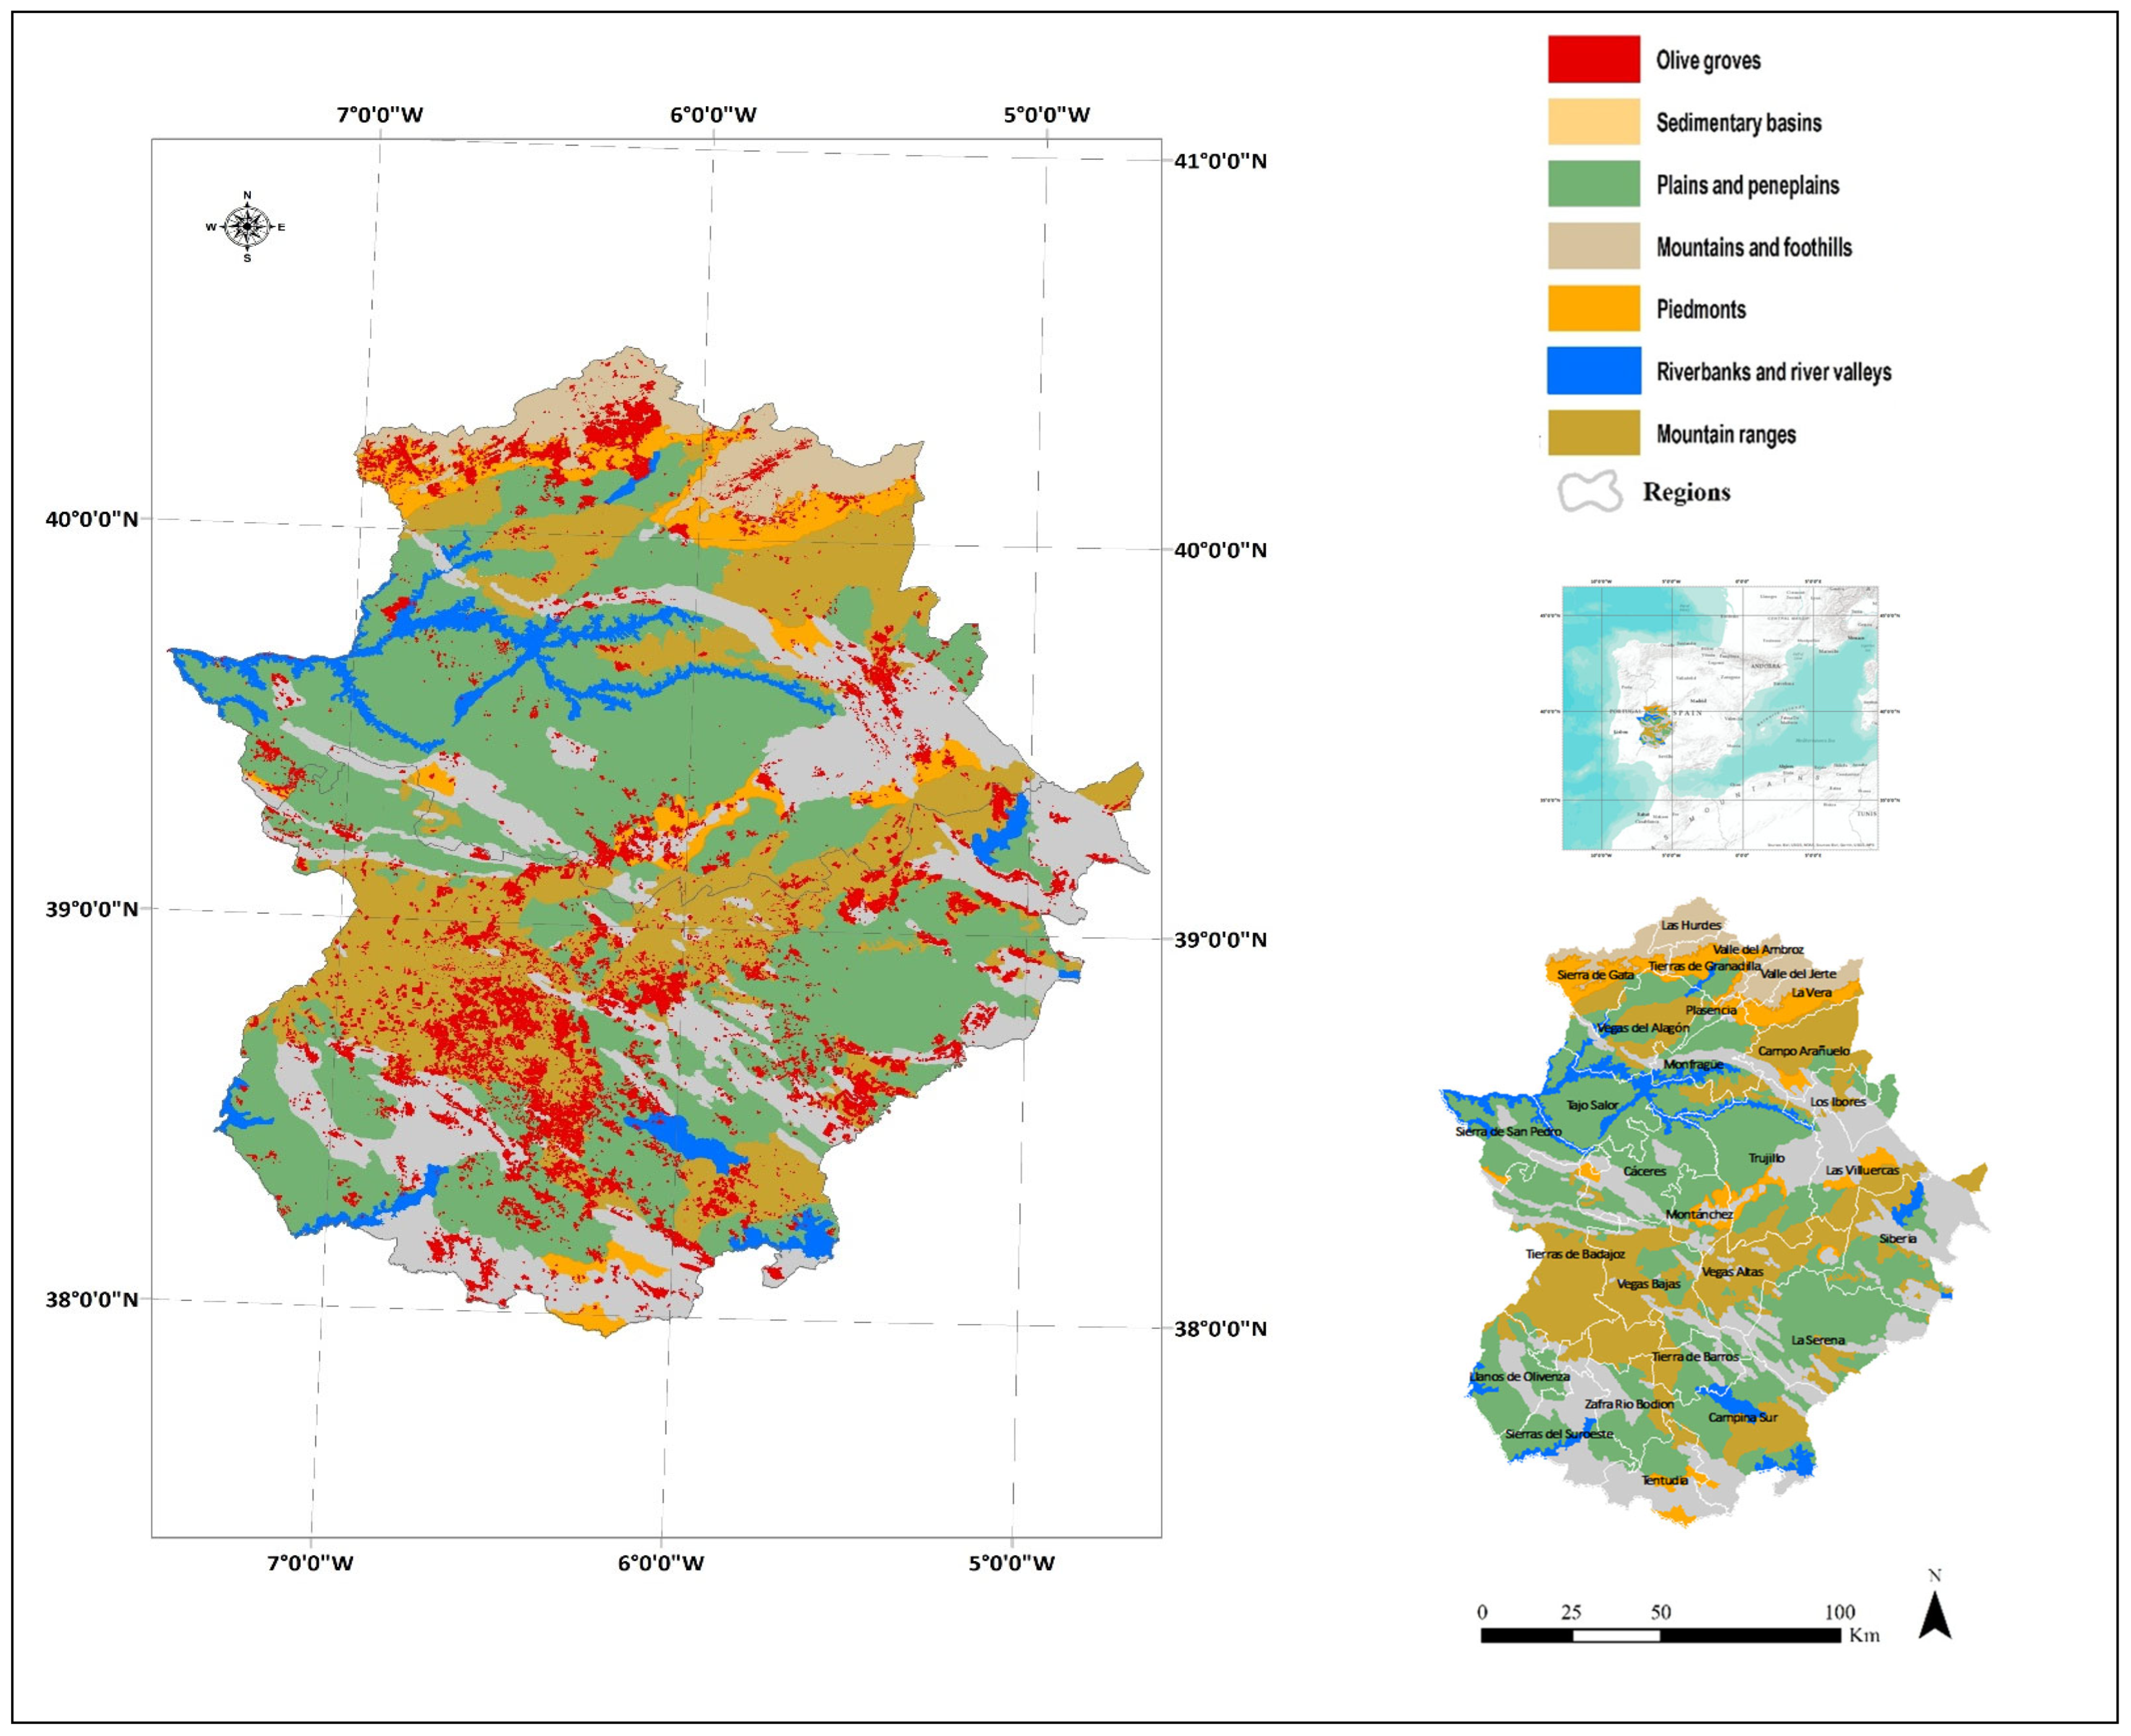
The region of Extremadura (37°57′ to 40°29′ N, 4°39′ to 7°33′ W) is located in the southwest of Spain, on the border with Portugal. This region is characterised by a great diversity of ecosystems combined with a varied topography over a territory of 41,633 km2 with an altitude of 425 m above sea level (m.a.s.l.), divided into twenty-eight comarcas, as shown in Figure 1.
In this autonomous region the agricultural area of olive groves is 296,190 ha, mainly traditional and rainfed. It also has an irrigated area of 61,551 ha, which has increased in recent years. Spain has the largest olive grove area in the world with 2,788,084 ha, with Extremadura accounting for 10.6% of the national total.
Temperature significantly influences the geographic distribution and suitability of olive groves. Precipitation limits the yield of this crop, as it is related to the availability of water and temperature, which delimits the areas of olive grove development.
The climate of Extremadura is typically Mediterranean, characterised by inter-annual variations affecting both temperature and rainfall. The Mediterranean climate is characterised by mild temperatures, with hot, dry summers and wet, rainy winters [21], and is also generally exposed to high daily radiation, including ultraviolet (UV) radiation.
Areas suitable for olive cultivation have an average annual temperature of 15–20 °C, with a temperature minimum of 4 °C and a temperature maximum between 35 °C [22] and 40 °C [23]. In general, the ideal temperature for the vegetative growth of olive trees is between 10 °C and 30 °C [24].

2.2. Climatic Data

This section can be divided into subsections. The climate data for precipitation and maximum and minimum temperatures were obtained from the EUROCORDEX Project [25], for the historical period and for future periods with a grid resolution of 12.5 km.
Four possible climate scenarios or representative concentration trajectories (RCP), defined in the 2014 IPCC AR5 report [26], RCP 2.0, RCP 4.5, RCP 6.0 and RCP 8.5, were used, each trajectory describing different possible climate scenarios depending on the volume of greenhouse gases [27]. For this study, RCP 4.5 and RCP 8.5 have been considered, where the number indicates the radiative forcing expressed in watts per square metre, so it would be 4.5 W/m2 and 8.5 W/m2 by the end of the century, where combined with other gases, greenhouse gas emissions are measured [28].
The study was conducted using an ensemble of several RCMs and GCMs derived from the Coupled Model Intercomparison Project (CMIP5), with the aim of understanding past, present and future climate changes arising from radiative forcing in a multi-model context. For this purpose, four time intervals have been used, the timeline P0: 1971–2005 and three future scenarios P1: 2006–2035, P2: 2036–2065 and P3: 2066–2095.
The data on average maximum and minimum temperatures and precipitation were downloaded from the http://cordex.org/, (20 May 2025) for the historical period 1971–2005 and two scenarios between 2006 and 2095, with a grid resolution of 0.125° (about 12.5 km). The bioclimatic indices studied in this work were calculated with a spatial resolution of 12.5 km, using a dataset of ten combinations of GCM and RCM (Table 1) in the RCP 4.5 and RCP 8.5 scenarios for the future.

2.3. Bioclimatic Index

For assessing the climatic suitability for olive cultivation in Extremadura, the CI (Cool Night Index) and DI (Dryness Index) were used, which are widely employed to characterize the suitability of an area for specific crops. These indices constitute a set of climatic indicators that allow the identification of zones with favorable conditions for olive development, considering only climatic variables and excluding topographic conditions of the region.
The DI (Dryness Index) is based on the soil water balance and its retention capacity. It evaluates soil water availability from the relationship between precipitation, evapotranspiration, and water losses, providing information on water stress conditions and soil water holding capacity [29]. The index is calculated using the following expression:
DI = ∑(W0 + PTvEs)
where
-
P: monthly precipitation (mm), calculated as P = E T P k , where ETP is the monthly potential evapotranspiration, and k is the crop factor, representing the fraction of reference evapotranspiration corresponding to the crop. For olives, k starts at 0.1 during the first month and varies throughout the crop cycle, increasing during rapid development stages and decreasing as leaves age.
-
W0: initial soil water reserve (mm), calculated as W 0 = E T P N ( 1 k ) J P m , where N is the number of days in the month, and JPm represents the days of effective soil evaporation during that month. This parameter adjusts the water balance to the actual soil evaporation.
-
Tv: potential monthly transpiration (mm), equal to T v = E T P k .
-
Es: direct soil evaporation (mm).
The DI classifies climate according to relative dryness, ranging from extremely dry to very humid, as shown in Table 2.
The CI (Cool Night Index) is a thermal index based on minimum nighttime temperature during the ripening period (September in the Northern Hemisphere). It evaluates nocturnal conditions that allow the organoleptic characteristics of olives to be preserved, which is especially relevant for olive oil quality. The climate is classified from extremely cold to very warm according to the average minimum temperature in September (Table 2).

2.4. Statistical Analysis

Time trends of bioclimatic index were studied using the Mann–Kendall test, as suggested by the World Meteorological Organisation [30]. Sen’s non-parametric procedure [31] determined the gradients and their direction. To analyse mean variation in each bioclimatic index, the relative change (RC) over the period studied was determined using the following expression:
R C = n β x     100
where n is the record length of the data set, β is the trend in the time series and |x| is the mean absolute value of the time series.
The Mann–Kendall test has the following expression:
S = k = 0 n     [ j = i + 1 n s g n   ( X j + X i ) ]
Comparisons were made between the three future periods (P1, P2 and P3) and the historical period (P0) and the two indices in simultaneous RCP scenarios. The statistically significant anomalies were evaluated by the ANOVA test, at a 5% significant step, for the mean values of each grid point. The null hypothesis indicates that the data set has the same mean, and the negative of this hypothesis is performed by Tukey’s test. This multiple comparison procedure was used to find significantly different means between the three periods and the historic period.
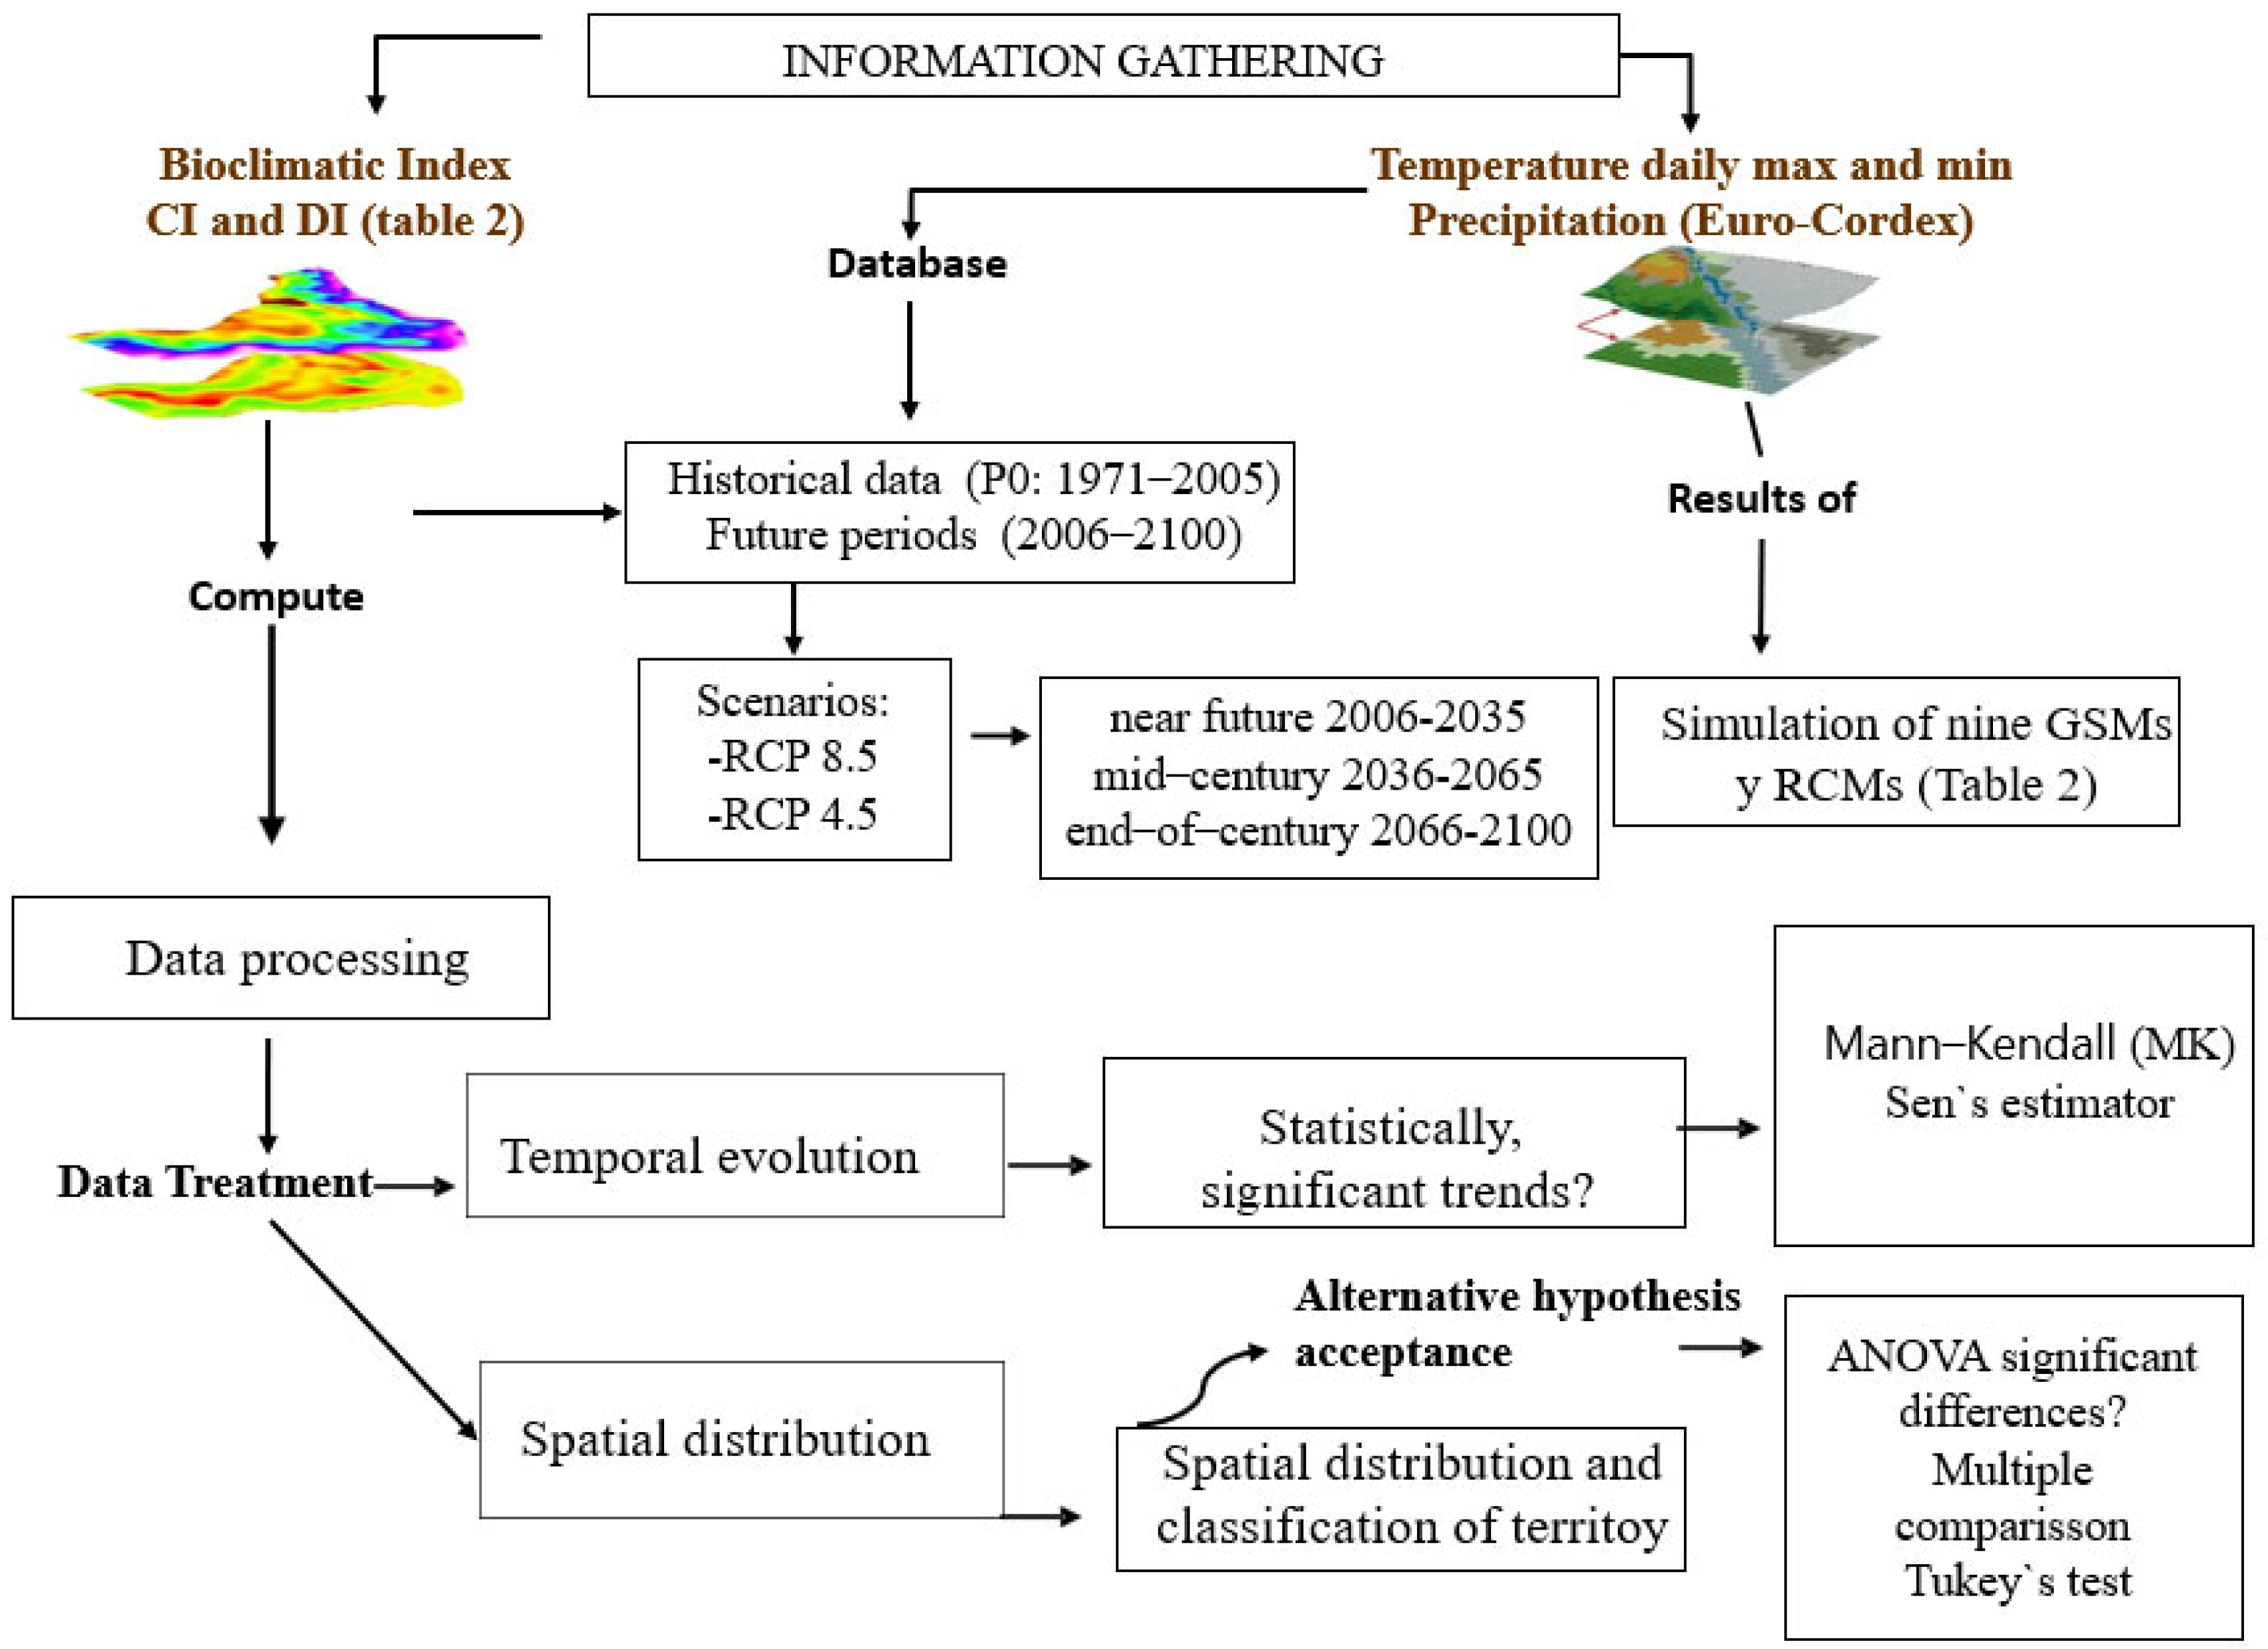
The programme was used to represent the indices ArcGIS v.10.5 (ESRI Inc., Redlands, CA, USA). Figure 2 shows the information process used in this study.

3. Results

3.1. Temporal Evolution of Bioclimatic Indices (CI and DI)

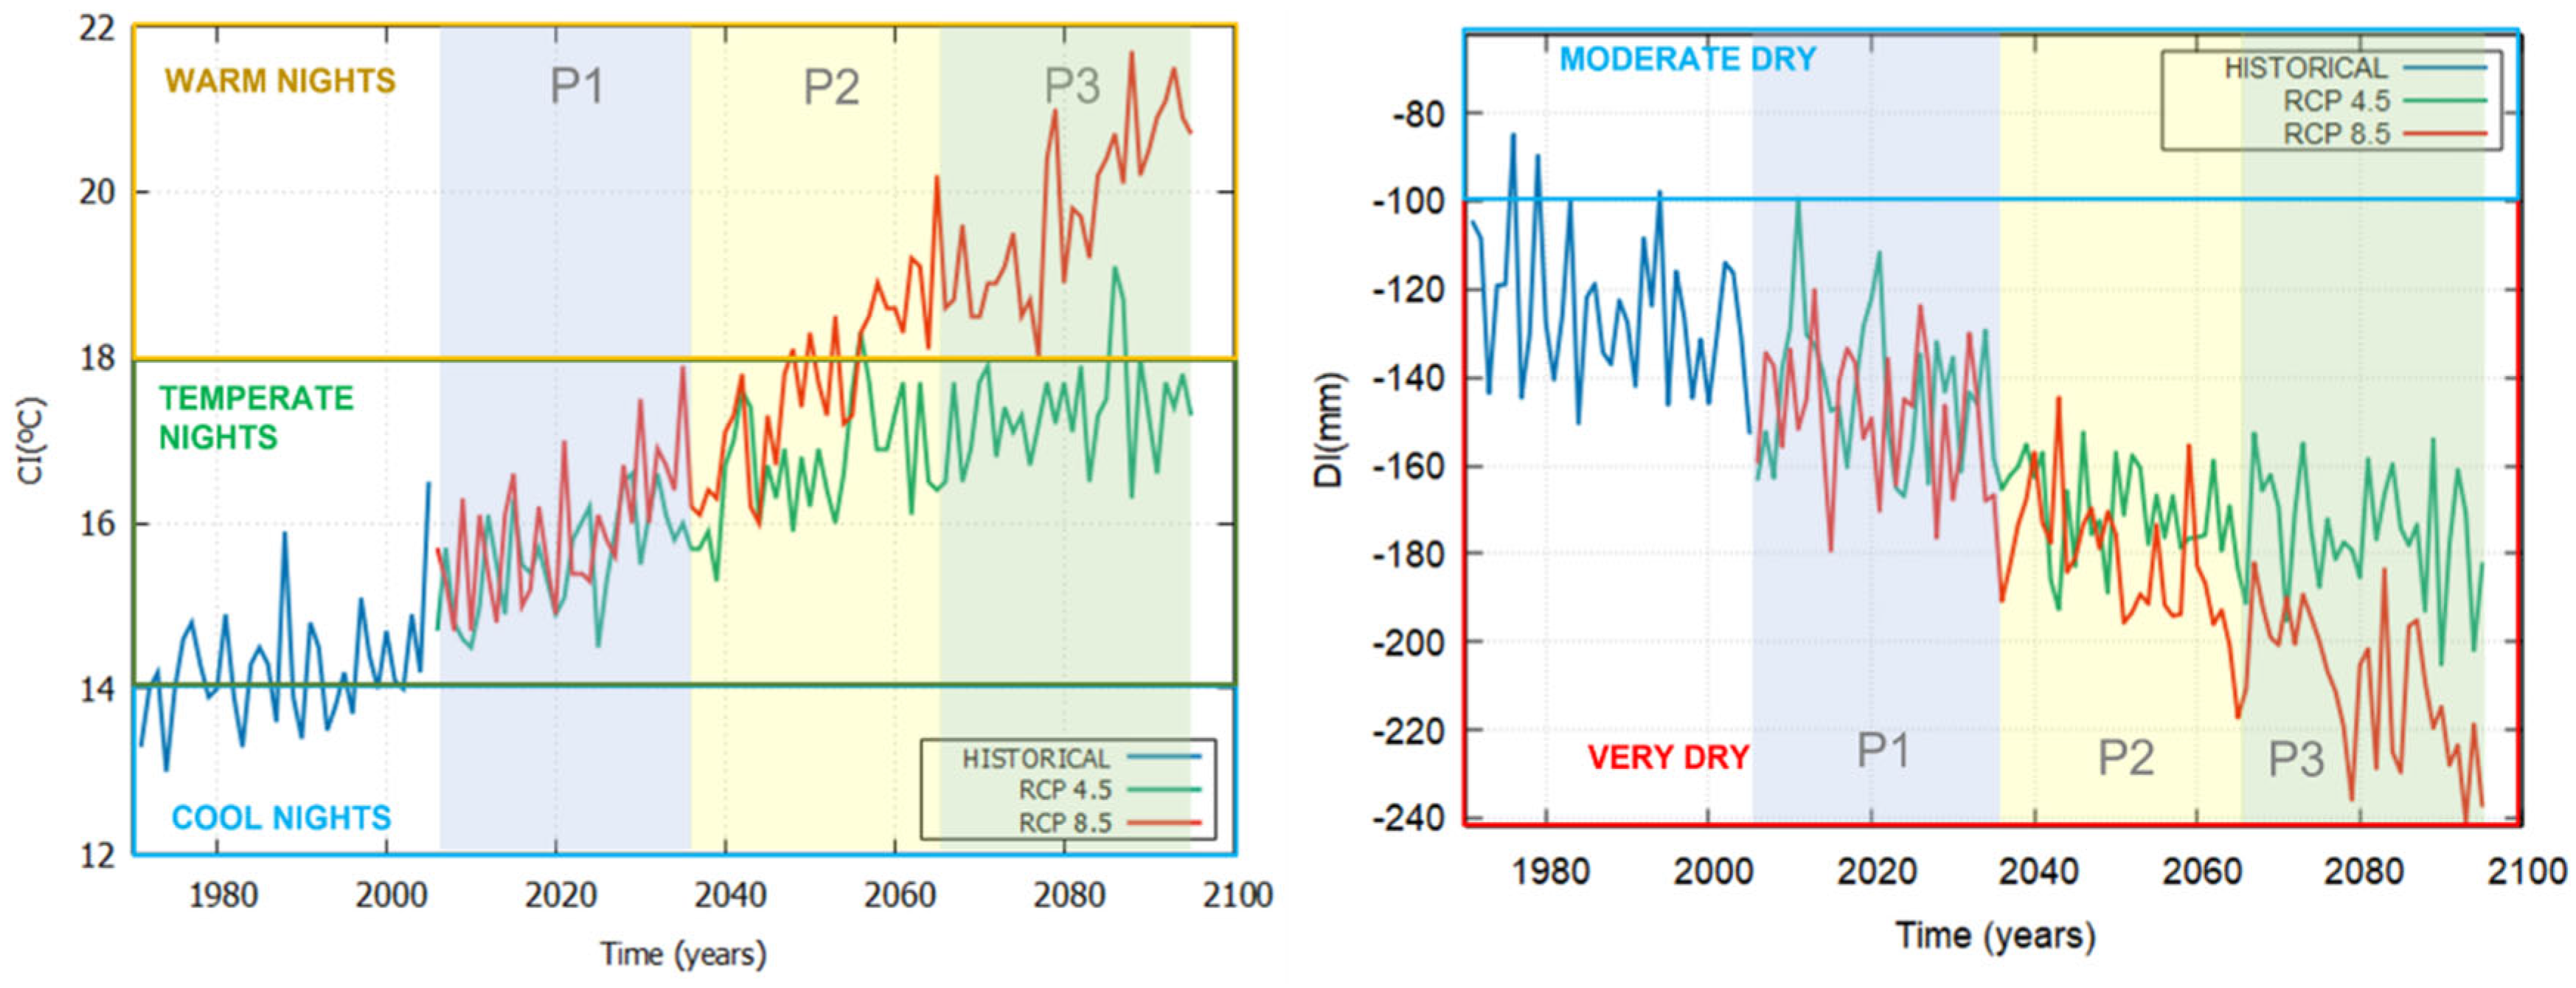
Both the Cool Night Index (CI) and the Dryness Index (DI) exhibit a clear and progressive shift throughout the 21st century, indicating a combined trend towards warmer nocturnal conditions and increasing aridity in Extremadura (Table 3; Figure 3). These changes are evident under both emission scenarios, but they intensify markedly under the high-emission pathway (RCP 8.5).
During the historical reference period (P0, 1971–2005), Extremadura is characterised by moderately dry conditions (DI = −125.1 mm) and cold nights (CI = 14.2 °C), a combination widely considered optimal for olive cultivation. From the first future period (P1, 2006–2035), both indices begin to deviate from this baseline. Mean CI values increase steadily, while DI values become more negative, reflecting a progressive reduction in water availability.
Under RCP 4.5, CI increases from 15.6 °C in P1 to 17.4 °C by the end of the century (P3), while DI declines to −175.1 mm. In contrast, under RCP 8.5, these changes are substantially amplified, with CI reaching 19.8 °C and DI decreasing to −209.6 mm in P3 (Table 3). This divergence between scenarios highlights the strong sensitivity of olive-growing conditions to emission trajectories.
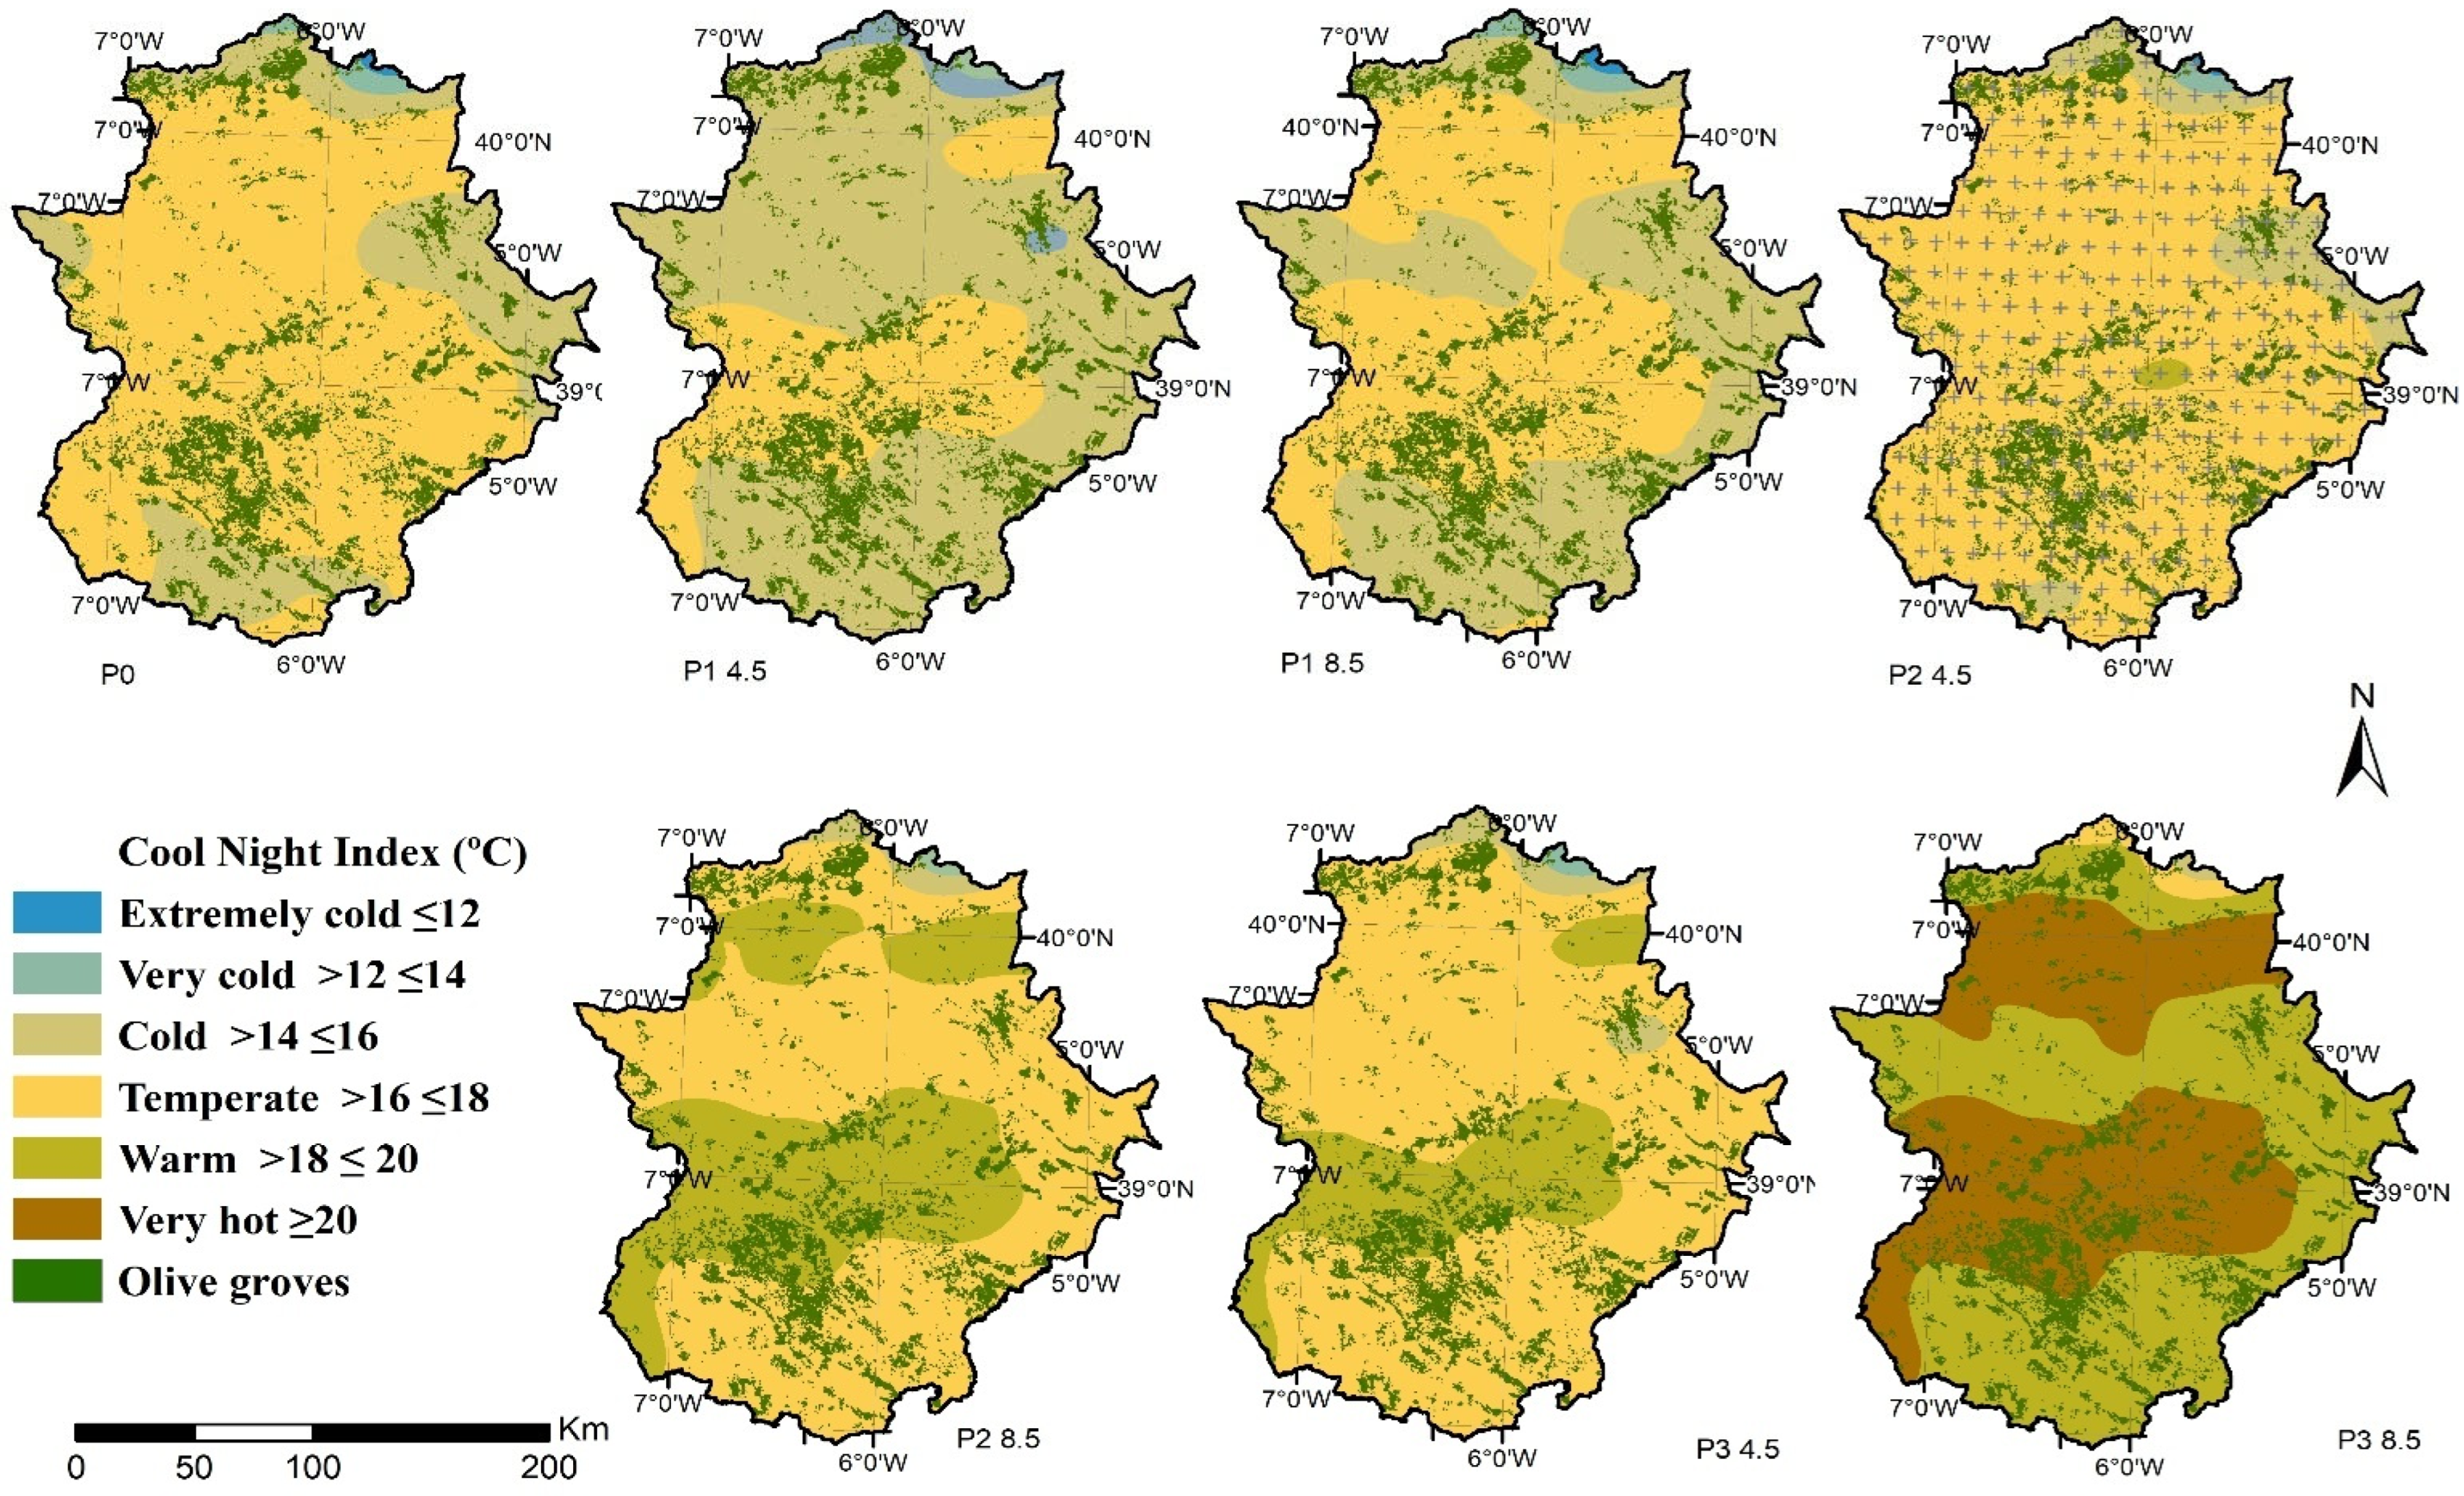
Figure 3 shows that these characteristics are supported in both scenarios until the end of period P1. In the P2 and P3 periods, most of the region will be in a very dry condition, and in the CI index in the P2 period for the RCP 4.5 scenario, most of the region will be in the temperate nights category; nevertheless, for the RCP 8 the warm nights will increase. In the P3 period for the RCP 4.5 scenario, most of the region will be in the Warm category, and in the RCP 8.5 scenario, more than 50% of the region will be very hot, allowing the cultivation of olive varieties better adapted to heat or with higher water needs.

3.2. Trend Analysis and Scenario Contrasts

Trend analysis using the Mann–Kendall test confirms that both indices exhibit statistically significant trends over the 21st century (Table 4). No significant trends are detected during the historical period, reinforcing its role as a stable reference baseline.
Under RCP 4.5, CI shows a positive and significant trend (Z = 8.39, p < 0.001), while DI displays a significant negative trend (Z = −6.59, p < 0.001), indicating gradual warming of nighttime temperatures and increasing dryness. These trends are considerably stronger under RCP 8.5, where Sen’s slope values approximately double for both indices (CI: Q = 0.07; DI: Q = −0.99), and relative changes reach 34.2% for CI and −49.9% for DI.
These results demonstrate that while moderate mitigation (RCP 4.5) slows the pace of agroclimatic degradation, it does not prevent a substantial departure from historically favourable conditions for olive cultivation.
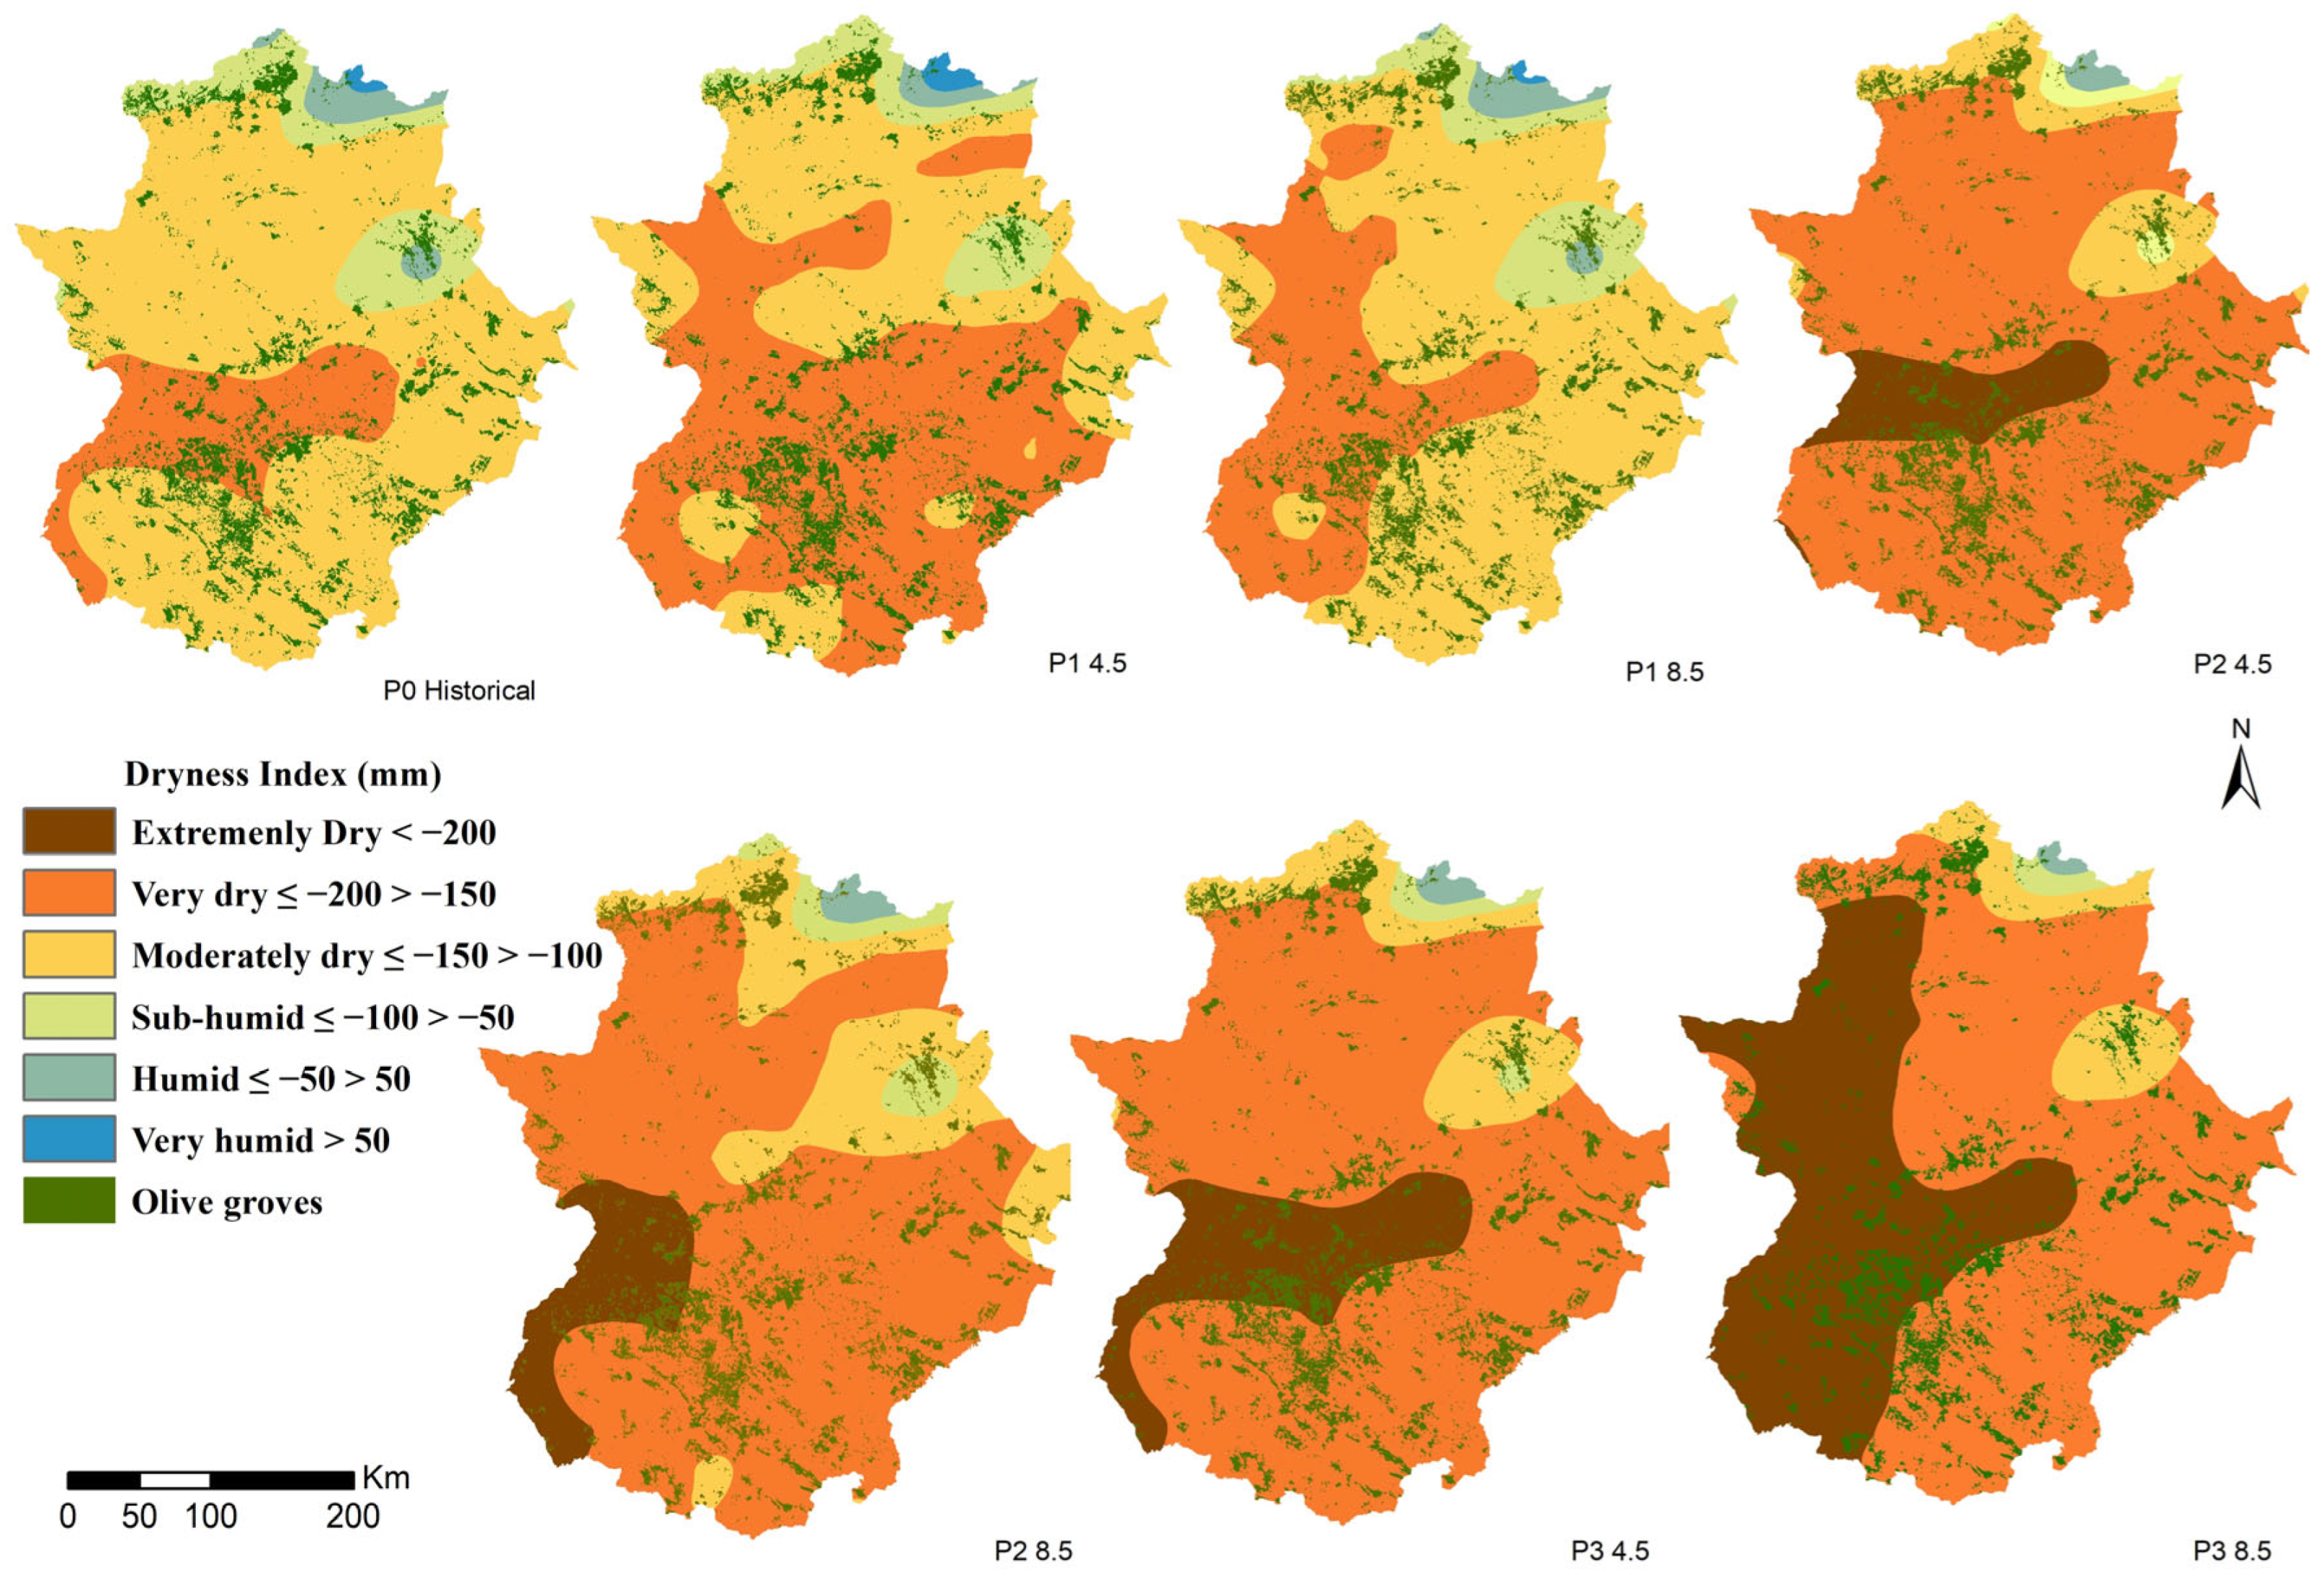
An important part of the olive grove is located in central-western Extremadura in sedimentary basins and vegas. This will be the first zone to perceive the very dry category for the olive grove in both scenarios in the period P1 (Table 3 and Figure 4).

3.3. Spatial Expansion of Dry Conditions (DI)

Spatial analysis reveals a pronounced expansion of dry and very dry conditions across Extremadura, particularly affecting areas with the highest concentration of olive groves (Table 5; Figure 4). During the historical period, 63.4% of olive groves were located in moderately dry areas, while very dry conditions affected only 22.4%.
By the mid-century (P2), very dry conditions dominate olive-growing areas under both scenarios, exceeding 70% of the total distribution. Under RCP 8.5, extremely dry conditions emerge earlier and expand more rapidly, affecting 34.3% of olive groves by the end of the century (P3). Under RCP 4.5, although extremely dry conditions remain limited, very dry areas encompass nearly 80% of olive groves.
Central-western Extremadura, particularly the sedimentary basins and vegas of Badajoz province, emerges as the most vulnerable zone, being the first to transition into very dry and extremely dry classes.
In the period May–June the alternation caused by the effects of DI could increase, causing a decrease in the size of the fruit [32,33] from June to the realisation of the harvest, because in the period P2 (mid-century), 82.3% of the olive grove will be in the Temperate category for RCP4.5 and 43.7% in the Warm category for RCP 8.5 (Table 5).
From July to November, oil production is carried out, and the increase in night temperatures of IC can have negative effects and cause a decrease in its production, because in the period P3 (end-of-century), 78% of Extremadura (Table 6) would be in the Temperate type in the RCP 4.5 scenario, while in the RCP 8.5 scenario 61.2% and 34.2% of the region’s surface will be in the Warm and Very Warm nights with night temperatures between 18 °C and 20 °C (Table 6), which can influence the vegetative growth of the olive grove, and thus reduce its flowering and subsequent fruit growth (Figure 5).

3.4. Shift in Nocturnal Thermal Regimes (CI)

Changes in the Cool Night Index reveal a marked transition from cold to warm nocturnal regimes (Table 6; Figure 5). During the historical period, cold nights dominate, covering over 85% of olive-growing areas. This proportion decreases sharply in future periods.
By mid-century (P2), temperate nights become dominant under RCP 4.5, whereas under RCP 8.5, warm nights already affect nearly half of the olive-growing area. By the end of the century (P3), 61.2% of the region experiences warm nights and 34.2% very warm nights under RCP 8.5, with nighttime temperatures between 18 °C and 20 °C.
These thermal shifts have important agronomic implications, as elevated night temperatures are known to reduce flowering intensity, impair fruit set and negatively affect oil accumulation during the summer–autumn period
The combined evolution of DI and CI indicates a progressive loss of agroclimatic suitability for traditional olive cultivation in Extremadura, particularly under the high-emission scenario. The transition from moderately dry conditions with cold nights to very dry environments with warm or very warm nights is likely to alter phenological cycles, reduce fruit size and compromise oil yield and quality.
These impacts will be especially pronounced in areas with high olive grove density, notably central-western Badajoz, which concentrates over 70% of the regional olive-growing area. The results underscore the urgency of adaptive strategies focused on varietal selection, irrigation efficiency and long-term water resource management, in line with previous findings highlighting the vulnerability of Mediterranean perennial crops to climate change [34].
This study assumes static land use and does not account for potential adaptation strategies, such as irrigation, changes in cultivars, or management shifts. Topographical constraints were also not explicitly included, and uncertainties inherent in multi-model climate projections remain. These factors may influence the absolute magnitude of predicted agroclimatic changes, but the overall trends of increasing aridity and warmer nights are robust. Despite these limitations, the results provide valuable spatially explicit insights into areas most vulnerable to climate change, particularly central-western Extremadura, where over 70% of the regional olive-growing area is concentrated. The findings emphasise the urgent need for adaptive measures, including the selection of heat- and drought-tolerant varieties, efficient irrigation practices, and long-term water resource management, to sustain olive productivity and oil quality under future climate scenario

4. Discussion

The results show a progressive transition from moderately dry conditions toward scenarios dominated by very dry and extremely dry categories of the DI, particularly under the RCP 8.5 scenario. This evolution has direct physiological implications for olive trees, as DI values below −175 mm are usually associated with severe water deficits that affect leaf water potential, stomatal regulation, and carbon assimilation.
Under high aridity conditions, the olive tree reduces stomatal conductance as a defence mechanism against water loss, which limits CO2 uptake and consequently decreases net photosynthesis. If water stress coincides with key phenological stages such as flowering, fruit set, and pit hardening, it may result in reduced vegetative growth and smaller fruit size. In this regard, the spatial expansion of very dry areas in Extremadura, exceeding 70% of the olive-growing area from period P2 onwards, suggests a significant increase in chronic water stress, even in olive groves traditionally considered well adapted to rainfed conditions.
Similarly, the increase in aridity in areas with high concentrations of olive groves, such as the plains and sedimentary basins of central-western Extremadura, reinforces the vulnerability of intensive and super-intensive systems, which are more dependent on irrigation and have limited resilience to water scarcity.
Some studies indicate that prolonged periods of drought and high temperatures can cause physiological alterations in olive groves and have a high impact on production [35]. The reduction in olive-growing area could be due to water availability, as suggested by Arfaoui [36], who proposes that “relocation of olive groves to mountainous areas with a cooler climate could be very beneficial for the olive sector of the province of Jaén in the future” (p. 16). Similarly, Rodríguez [37] indicates that olive groves will require greater water availability, suggesting the possibility of shifting cultivation north and east within the Extremadura region [38]. These are areas that would fall outside the Extremely Dry category of the DI index under the RCP 8.5 scenario, corresponding to 72.8% of the area.
Some studies show significant changes based on bioclimatic indices, indicating that Extremadura may reach high dryness values in the DI index at the beginning of the century [39], implying a reduction in olive-growing area due to loss of climatic suitability in the region. However, water supply is not guaranteed in areas where the climate is characterised by dryness and water resources are very limited [40].
A progressive increase in the CI index is observed, with a clear transition toward warm and very warm nights throughout the 21st century; this represents another critical factor identified in this study. Nights with temperatures above 18 °C—which, under the RCP 8.5 scenario, affect more than 95% of the regional area during period P3—have documented effects on key metabolic processes in olive trees [41].
Elevated nighttime temperatures increase nocturnal transpiration, reducing the net carbon balance available for growth. This phenomenon may result in lower flowering intensity, poor fruit set, and reduced lipid accumulation during the summer–autumn period, when oil forms in the fruit [42]. In addition, several studies have indicated that warm nights can negatively affect olive oil quality parameters [43], such as polyphenol content, oxidative stability, and aromatic profile, and may even increase free acidity when coinciding with prolonged water and heat stress [44].
In this context, the combination of warm nights with very dry conditions—especially during the summer and early autumn months—could compromise not only oil quantity but also commercial quality, reducing the competitiveness of the olive sector in Extremadura in high value-added markets. Technological improvements will be necessary to prevent the economic impact of climate change on olive groves [45].
The results are consistent with previous studies indicating an intensification of aridity and thermal stress in Mediterranean regions [46], but they add value by providing a joint, high-spatial-resolution assessment of DI and CI indices. Unlike earlier studies based on coarser resolutions or one-dimensional analyses, this study allows for more precise quantification of the magnitude of change, its spatial distribution, and temporal evolution [47].
In terms of magnitude, decreases in DI and increases in CI under RCP 8.5 are consistent with recent regional projections, although they show a more pronounced intensification in low-altitude areas with high continentality [48]. From a spatial perspective, early identification of particularly vulnerable areas—such as central-western Badajoz—aligns with studies highlighting the greater sensitivity of sedimentary basins and agricultural plains to increasing water deficits [49].
Regarding temporal dynamics, the results indicate that the most critical changes accelerate from mid-century onward, in line with studies projecting critical climatic thresholds for Mediterranean woody crops during that period [50,51].
Future research could address technical aspects such as ecological approaches to ensure sustainability and productivity under climate change, improve the resilience of olive varieties, and develop efficient irrigation systems.

5. Conclusions

The indices examined in this work show that in the Extremadura region major changes are expected in the coming decades, where climatic conditions for olive cultivation will change, especially in the RCP 8.5 scenario and in the different periods analysed. These results indicate that the hypothesis raised in the study shows in different scenarios how climate change will affect olive cultivation at different times in the region of Extremadura.
As a conclusion, in the RCP 8.5 scenario the area of olive groves will decrease significantly, being narrowed down to high-altitude areas in the north of the region, where currently 28.6% of the olive groves are located. These changes in climatic conditions will make it necessary to adapt olive growing. The necessary adaptation of the Extremadura olive groves to climate change could be based on measures such as rationalisation of irrigation or a change to varieties with greater adaptation to heat conditions.
In general, in the two scenarios that have been analysed, RCP 4.5 shows a smaller increase in rates compared to the P2 period, reaching high categories, but not as extreme as those of the RCP 8.5 scenario, according to which conditions in Extremadura will be too hot for olive production at the end of the 21st century.
Much of the olive grove in the region is dry, and it is expected to face increased water stress caused by rising temperatures and dryness in the future, becoming unviable in many areas of the region. This situation may have important consequences, so that in possible future lines of work it is proposed to evaluate the changes in olive cultivation, as well as to study preventive measures and adaptation to climate change, and the application of new farming techniques. As a novelty in the work, it is concluded that there is a need to develop new areas for olive cultivation and new varieties adapted to the climatic conditions of the region.
Despite the robustness of the methodological approach, this study has limitations that should be acknowledged. First, the use of a static land-use map does not allow for the capturing of future changes in the distribution of olive groves resulting from abandonment, intensification, or relocation to climatically more favourable areas.
Second, explicit agronomic adaptation scenarios have not been incorporated, such as the adoption of varieties more tolerant to heat and drought, improvements in irrigation efficiency, or changes in soil management practices. These strategies could partially mitigate the projected impacts, although their feasibility will depend on the actual availability of water resources and socioeconomic factors.
Finally, although high-resolution multi-model climate projections are employed, inherent uncertainties in climate models remain, particularly in simulating precipitation and extreme nighttime temperatures. Nevertheless, the consistency of the detected trends, as confirmed by the Mann–Kendall test, reinforces the overall robustness of the results.

Funding

This research received no external funding.

Data Availability Statement

The original contributions presented in this study are included in the article. Further inquiries can be directed to the corresponding author.

Conflicts of Interest

The author declares no conflict of interest.

References

  1. Poma-Sarango, M.A.; Poma-Sarango, D.; Guaman, L.; Chuncho, C.G.; Juela, O.; Benavides-Silva, C. Potential distribution of ecosystems in the Southern Zone of Ecuador: Modeling from a correlative approach. Rev. Estud. Andal. 2024, 8–32. [Google Scholar] [CrossRef] [Scilit]
  2. Benavidez-Silva, C.; Jensen, M.; Pliscoff, P. Future scenarios for land use in Chile: Identifying drivers of change and impacts over protected area system. Land 2021, 10, 408. [Google Scholar] [CrossRef] [Scilit]
  3. Malhi, Y.; Franklin, J.; Seddon, N.; Solan, M.; Turner, M.G.; Field, C.B.; Knowlton, N. Climate change and ecosystems: Threats, opportunities and solutions. Philos. Trans. R. Soc. 2020, 375, 20190104. [Google Scholar] [CrossRef] [Scilit]
  4. Dagtekin, D.; Şahan, E.A.; Denk, T.; Köse, N.; Dalfes, H.N. Past, present and future distributions of Oriental beech (Fagus orientalis) under climate change projections. PLoS ONE 2020, 15, e0242280. [Google Scholar] [CrossRef] [Scilit] [PubMed]
  5. Moral, F.J.; Rebollo, F.J.; Paniagua, L.L.; García, A.; Honorio, F. Integration of climatic indices in an objective probabilistic model for establishing and mapping viticultural climatic zones in a region. Theor. Appl. Climatol. 2016, 124, 1033–1043. [Google Scholar] [CrossRef] [Scilit]
  6. Luo, Q. Temperature thresholds and crop production: A review. Clim. Change 2011, 109, 583–598. [Google Scholar] [CrossRef] [Scilit]
  7. Ministerio de Agricultura Pesca y Alimentación (MAPA). Anuario de Estadística Agraria, Avance 2020. Catálogo de Publicaciones de la Administración General del Estado. 2021. Available online: https://cpage.mpr.gob.es/ (accessed on 9 March 2026).
  8. Tonietto, J.; Carbonneau, A. A multicriteria climatic classification system for grape-growing regions worldwide. Agr. For. Meteorol. 2004, 124, 81–97. [Google Scholar] [CrossRef] [Scilit]
  9. García-Martín, A.; Paniagua, L.L.; Aguirado, C.; Guerra, E. Trends in minimum winter temperatures and date of the last spring frost in the main fruit-growing areas of Spain. Acta Hortic. 2023, 1372, 215–222. [Google Scholar] [CrossRef] [Scilit]
  10. Hatfield, J.L.; Prueger, J.H. Temperature extremes: Effect on plant growth and development. Weather Clim. Extrem. 2015, 10, 4–10. [Google Scholar] [CrossRef] [Scilit]
  11. Food and Agriculture Organization of the United Nations (FAO). The Future of Food and Agriculture—Trends and Challenges; Editorial FAO: Rome, Italy, 2017; Available online: https://openknowledge.fao.org/handle/20.500.14283/i6583e (accessed on 9 March 2026).
  12. Meyer, L.; Pachauri, R.K. Cambio Climático 2014: Informe de Síntesis—Contribución de los Grupos de Trabajo I, II y III al Quinto Informe de Evaluación del Grupo Intergubernamental de Expertos Sobre el Cambio Climático 2014; Editorial IPCC: Geneva, Switzerland, 2014; Available online: https://www.ipcc.ch/site/assets/uploads/2018/02/SYR_AR5_FINAL_full_es.pdf (accessed on 9 March 2026).
  13. Southwick, L. The Anti-Science of Climate Change Advocates. iBusiness 2016, 8, 19–30. [Google Scholar] [CrossRef]
  14. Hawkins, E.; Sutton, R. The potential to narrow uncertainty in regional climate predictions. Bull. Amer. Meteor. Soc. 2009, 90, 1095–1107. [Google Scholar] [CrossRef] [Scilit]
  15. Hoerling, M.; James, H.; Arun, K.; Laurent, T.; Eischeid, J.; Pegion, P.; Zhang, T.; Quan, X.; Xu, T. On North American Decadal Climate for 2011–20. J. Clim. 2011, 24, 4519–4528. [Google Scholar] [CrossRef] [Scilit]
  16. Martins, M.P.; Dos Reis, E.F.; Lopes, L.L. Spatial and Temporal Variability of Vegetation Indices with Industrial Tomato Yield. J. Sustain. Dev. 2024, 16, 42–54. [Google Scholar] [CrossRef] [Scilit]
  17. Agencia Estatal de Meteorología (AEMET). Calendario Meteorológico. September 2022. Available online: https://www.aemet.es/documentos_d/conocermas/recursos_en_linea/calendarios/cm-2022.pdf (accessed on 9 March 2026).
  18. Riou, C. Le Determinisme Climatique de la Maturation du Raisin: Application au Zonage de la Teneur en Sucre dans la Communauté Europée nne; Office des Publications Officielles des Communautés Européennes: Luxembourg, 1994; Available online: https://hal.inrae.fr/hal-02843975 (accessed on 9 March 2026).
  19. Kayode, O.T.; Aizebeokhai, A.P.; Odukoya, A.M. Geophysical and contamination assessment of soil spatial variability for sustainable precision agriculture in Omu-Aran farm, Northcentral Nigeria. Heliyon 2022, 8, e08976. [Google Scholar] [CrossRef] [Scilit]
  20. Pratola, M.T.; Chkrebtii, O. Bayesian calibration of multistate stochastic simulators. Comput. Exp. Uncertain. Quantif. 2018, 28, 693–719. [Google Scholar] [CrossRef] [Scilit]
  21. Stocker, T.F.; Qin, D.; Plattner, G.; Alexander, L.; Allen, S.; Bindoff, N.; Bréon, F.; Church, J.; Cubasch, U.; Emori, S. Technical Summary. In Climate Change The Physical Science Basis; University Press: Cambridge, UK, 2013. [Google Scholar] [CrossRef] [Scilit]
  22. Giorgi, F. Exploring uncertainties in regional climate change: The regional climate change hypermatrix framework. EOS 2008, 89, 445–446. [Google Scholar] [CrossRef] [Scilit]
  23. Krishna, K.R. Agroecosystems: Soils, Climate, Crops, Nutrient Dynamics and Productivity; Apple Academic Press: Cambridge, MA, USA, 2013. [Google Scholar] [CrossRef] [Scilit]
  24. Therios, I. Olives: Crop Production Science in Horticulture 18; CABI Publishing: Wallingford, UK, 2009. [Google Scholar]
  25. Tombesi, A.; Tombesi, S.; Sbitri, M.O.; Serafini, F. Orchard planning and planting. In Production Techniques in Olive Growing; International Olive Council: Madrid, Spain, 2007; pp. 17–40. Available online: https://www.internationaloliveoil.org/product/production-techniques-in-olive-growing/?lang=es (accessed on 9 March 2026).
  26. Mascaro, G.; White, D.; Westerhoff, P.; Bliss, N. Performance of the CORDEX-Africa regional climate simulations in representing the hydrological cycle of the Niger River basin. J. Geophys. Res. Atmos. 2015, 120, 425–444. [Google Scholar] [CrossRef] [Scilit]
  27. Gitay, H.; Suárez, A.; Dokken, D.; Watson, R. Cambio Climático y Biodiversidad. Documento técnico V del IPCC, Grupo Intergubernamental de Expertos sobre el Cambio Climático. 2022. Available online: https://archive.ipcc.ch/pdf/technical-papers/climate-changes-biodiversity-sp.pdf (accessed on 9 March 2026).
  28. Moss, R.; Edmonds, J.; Hibbard, K. The next generation of scenarios for climate change research and assessment. Nature 2010, 463, 747–756. [Google Scholar] [CrossRef] [Scilit]
  29. Ho, J.; Tumkaya, T.; Aryal, S. Moving beyond P values: Data analysis with estimation graphics. Nat. Methods 2019, 16, 565–566. [Google Scholar] [CrossRef] [Scilit] [PubMed]
  30. Brixner, D.; Biltaji, E.; Bress, A.; Unni, S.; Ye, X.; Mamiya, T.; Ashcraft, K.; Biskupiak, J. The effect of pharmacogenetic profiling with a clinical decision support tool on healthcare resource utilization and estimated costs in the elderly exposed to polypharmacy. J. Med. Econ. 2016, 19, 213–228. [Google Scholar] [CrossRef] [Scilit] [PubMed]
  31. Management of Water Resources and Application of Hydrological Practices. In Guide to Hydrological Practices; World Meteorological Organization: Geneva, Switzerland, 2009; Volume 2, p. 168. Available online: https://www.hydrology.nl/images/docs/hwrp/WMO_Guide_168_Vol_II_en.pdf (accessed on 9 March 2026).
  32. Sen, P.K. Estimates of the Regression Coefficient Based on Kendall’s Tau. J. Am. Stat. Assoc. 1968, 63, 1379–1389. [Google Scholar] [CrossRef]
  33. Rojano-Cruz, R.; Martinez, F.J.; Galindo-Zaldívar, J.; Lamas, F.; Gonzalez, L.; Delgado, G. Efecto del Dispositivo Infiltrador en la Humedad del Suelo en Olivares de Regiones Semiáridas Mediterráneas. Asociación Española de Riegos y Drenajes. 2024. Available online: https://hdl.handle.net/10953/3017 (accessed on 9 March 2026).
  34. Delgado Barrado, J.M.; Castillo Martínez, J.M.; Partal Ortega, L.; Ortiz Villarejo, A.J. Representaciones cartográficas del paisaje singular del olivar en el entorno de la (super)intendencia de las nuevas poblaciones de Sierra Morena. El caso de Baños de la Encina (1752–1797). Rev. Electrónica Patrim. Histórico 2023, 246–279. [Google Scholar] [CrossRef] [Scilit]
  35. Cohen, M.; Ronchail, J.; Alonso-Roldán, M.; Morcel, C.; Angles, S.; Araque-Jimenez, E.; Labat, D. Adaptability of Mediterranean Agricultural Systems to Climate Change. The Example of the Sierra Mágina Olive-Growing Region (Andalusia, Spain). Part I: Past and Present. Wea. Climate Soc. 2014, 6, 380–398. [Google Scholar] [CrossRef] [Scilit]
  36. Orestes-Santos, E.; Valdés-Reinoso, R.H.; Castillo-Edua, C.B.R. Propuesta de medidas para mitigar daños por encharcamiento en plantaciones de olivo. Revista Latinoamericana De Recursos Naturales 2014, 20, 10–17. [Google Scholar]
  37. Arfaoui, F.; Cohen, M.; Ronchail, J.; Oudin, L. Evolution, modeling and mapping of olive grove yields in the province of Jaen, Spain (1959–2018). Climatologie 2021, 18, 4. [Google Scholar] [CrossRef] [Scilit]
  38. Rodríguez-Cohard, J.C.; Sánchez-Martínez, J.D.; Gallego-Simón, V.J. The upgrading strategy of olive oil producers in Southern Spain: Origin, development and constraints. Rural. Soc. 2017, 26, 30–47. [Google Scholar] [CrossRef] [Scilit]
  39. Honorio, F.; García-Martín, A.; Paniagua, L.L.; Aguirado, C. Climatic Structure Analysis of Olive Growing in Extremadura, Southwest Spain. Land 2025, 14, 789. [Google Scholar] [CrossRef] [Scilit]
  40. Moriondo, M.; Jones, G.V.; Bois, B. Projected shifts of wine regions in response to climate change. Clim. Change 2013, 119, 825–839. [Google Scholar] [CrossRef] [Scilit]
  41. Moral, F.J.; Rebollo, F.J.; García-Martín, A.; Paniagua, L.L.; Honorio, F. Spatial and Temporal Analysis of Water Resources in the Olive-Growing Areas of Extremadura, Southwestern Spain. Land 2024, 13, 1294. [Google Scholar] [CrossRef] [Scilit]
  42. Su, Q.; Rohila, J.; Ranganathan, S.; Karthikeyan, R. Rice yield and quality in response to daytime and nighttime temperature increase—A meta-analysis perspective. Sci. Total Environ. 2023, 898, 165256. [Google Scholar] [CrossRef] [Scilit]
  43. Moriondo, M.; Bindi, M.; Brilli, L.; Trombi, G. Modelling olive trees response to climate change in the Mediterranean basin. Clim. Change 2013, 120, 655–669. [Google Scholar] [CrossRef] [Scilit]
  44. Sánchez-Martínez, J.D.; Rodríguez-Cohard, J.C.; Garrido-Almonacid, A.; Gallego-Simón, V.J. Social innovation in rural areas? The case of Andalusian olive oil co-operatives. Sustainability 2020, 12, 10019. [Google Scholar] [CrossRef] [Scilit]
  45. Moral, F.J.; Aguirado, C.; Alberdi, V.; García-Martín, A.; Paniagua, L.L.; Rebollo, F.J. Future Scenarios for Viticultural Suitability under Conditions of Global Climate Change in Extremadura, Southwestern Spain. Agriculture 2022, 12, 1865. [Google Scholar] [CrossRef] [Scilit]
  46. Lionello, P.; Scarascia, L. The relation between climate change in the Mediterranean region and global warming. Reg. Environ. Change 2018, 18, 1481–1493. [Google Scholar] [CrossRef] [Scilit]
  47. Ponti, L.; Gutierrez, A.P.; Ruti, P.M.; Dell’Aquila, A. Fine-Scale Ecological and Economic Assessment of Climate Change on Olive in the Mediterranean Basin reveals winners and losers. Proc. Natl. Acad. Sci. USA 2014, 111, 5598–5603. [Google Scholar] [CrossRef] [Scilit]
  48. Fraga, H.; Pinto, J.G.; Santos, J.A. Climate change projections for olive yields in the Mediterranean Basin. Reg. Environ. Change 2019, 14, 563–578. [Google Scholar] [CrossRef] [Scilit]
  49. Vicente-Serrano, S.M.; Beguería, S.; López-Moreno, J.I. A multiscalar drought index sensitive to global warming: The SPEI. Glob. Planet. Change 2014, 121, 21–38. [Google Scholar] [CrossRef] [Scilit]
  50. Lorenzo-Lacruz, J.; Vicente-Serrano, S.M.; González-Hidalgo, J.C.; López-Moreno, J.I. Droughts in the Iberian Peninsula: Spatial and temporal analysis. Hydrol. Earth Syst. Sci. 2013, 17, 4031–4046. [Google Scholar]
  51. Bacelar, E.A.; Moutinho-Pereira, J.M.; Gonçalves, B.C.; Lopes, J.I.; Correia, C.M. Physiological responses of different olive genotypes to drought conditions. Acta Physiol. Plant. 2009, 31, 611–621. [Google Scholar] [CrossRef] [Scilit]
Figure 1. Location of olive groves in the region of Extremadura (Left). Its location in the European context (Right), and lithological domains in Extremadura regions. Source: Data from the Spanish Land Occupation Information System (SIOSE) 2024. Prepared by the authors.
Atmosphere 17 00309 g001
Figure 2. General information process used in the study. Source: own elaboration.
Atmosphere 17 00309 g002
Figure 3. Temporal evolution of the Cool Night Index (CI) and Dryness Index (DI) in Extremadura under historical conditions and future climate scenarios (RCP 4.5 and RCP 8.5). Historical period (blue line) and the future time periods the RCP 4.5 (green line) and RCP 8.5 (red line).
Atmosphere 17 00309 g003
Figure 4. Projected spatial expansion of dry and extremely dry conditions (DI) in Extremadura under RCP 4.5 and RCP 8.5.
Atmosphere 17 00309 g004
Figure 5. Spatial shift in nocturnal thermal regimes (CI) across Extremadura under future climate scenarios.
Atmosphere 17 00309 g005
Table 1. Combination of Global GCM and RCM used in the work.
General ModelsRegional Models
CCLM4-8-17RCA4RACMO22EREMO2009
CNRM-CM5XX
EC-EARTH X
IPSL-CM5AMR X
MPI-ESMLRXX X
MOHC-HadGEM2-ESXXX
Source: IPCC AR5. X shows the different general circulation models (GCMs) and the regional climate models (RCMs) with which they have been combined. Own elaboration.
Table 2. Climate type of Cool Night Index (CI) and Dryness Index (DI).
EquationCI Index (°C). Type of Climate
Tª min September (°C)Extremely cold ≤ 12
Very cold > 12 ≤ 14
Cold > 14 ≤ 16
Temperate > 16 ≤ 18
Warm > 18 ≤ 20
Very hot > 20
DI Index (mm). Type of climate
W 0 + P T v E s
(1) P  = ETP · k
(2) W 0  = (ETP/N) · (1 − k) · JPm
Extremely dry < −200
Very dry ≤ −200 > −150
Moderately dry ≤ −150 > −100
Sub-humid ≤ −100 > −50
Humid ≤ −50 > 50
Very humid > 50
Source: Consulted in Climate Classification System (CCM) [16]. https://op.europa.eu/en/publication-detail/-/publication/3edc0da9-f95a-4d53-871a-594267de7956/language-fr (25 March 2024).
Table 3. Average values and coefficient of variation (CV) of the bioclimatic indices for the different periods and selected scenarios.
Bioclimatic IndexCI
(°C Units)
DI
(mm)
HistoricalP0 (1971–2005)Mean14.2−125.1
CV (%)15.847.3
RCP 4.5P1 (2006–2035)Mean15.6−143.1
CV(%)14.842.7
P2 (2036–2065)Mean16.7−170.4
CV(%)14.432.5
P3 (2066–2095)Mean17.4−175.1
CV (%)14.433.6
RCP 8.5P1 (2006–2035)Mean15.9−148.8
CV (%)15.038.8
P2 (2036–2065)Mean17.7−181.8
CV (%)15.030.6
P3 (2066–2095)Mean19.8−209.6
CV (%)14.127.4
Source: own elaboration.
Table 4. Trends of the bioclimatic indices CI and DI, applying the Mann–Kendall test for historical scenarios RCP 4.5 and RCP 8.5 (period 2006–2095) represented in Figure 3.
ScenarioBioclimatic IndexTest Mann–KendallSen’s
ZMKTendenciesQRC (%)
HistoricalCI1.56 0.024.44
DI−1.53 −0.45−12.56
RCP 4.5CI8.39***0.0316.44
DI−6.59***−0.48−26.63
RCP 8.5CI10.86***0.0734.21
DI−9.93***−0.99−49.93
Data: Significance levels: *** Significant trends at 0.001 level; Mann–Kendall test (ZMK); Sen’s slope (Q); Relative change (RC). Source: Mann–Kendall and Sen’s results. Own production.
Table 5. Spatial distribution of the olive grove in each category of the DI (P0, P1, P2 and P3), under the scenarios RCP 4.5 and RCP 8.5.
Historical2006–20352036–20652066–2095
Olive groveP0P1P2P3
DI (mm) RCP 4.5RCP 8.5RCP 4.5RCP 8.5RCP 4.5RCP 8.5
Extremely dry 10.810.620.134.3
Very dry22.450.719.374.272.178.659.1
Moderately dry63.443.769.713.514.81.26.3
Sub-humid12.65.49.61.32.30.10.2
Humid1.60.31.40.10.2
Very humid
SurfaceP0P1P2P3
DI (mm) RCP 4.5RCP 8.5RCP 4.5RCP 8.5RCP 4.5RCP 8.5
Extremely dry 6.617.811.572.8
Very dry13.251.618.573.467.670.420.8
Moderately dry68.135.664.914.311.113.44.2
Sub-humid13.09.412.23.51.72.71.4
Humid3.53.03.92.21.82.10.8
Very humid2.20.30.6
Source: DI index calculation results, 2024. Spatial distribution of olive groves and surface area in each scenario and climate type in the DI index. Self-produced.
Table 6. Spatial distribution of the olive grove in each category of the Night Cold Index (CI), under the scenarios RCP 4.5 and RCP 8.5.
Olive GroveP0P1P2P3
CI (°C) RCP 4.5RCP 8.5RCP 4.5RCP 8.5RCP 4.5RCP 8.5
Extremely cold0.10.10.1
Very cold4.53.33.61.21.2
Cold10.481.131.014.16.58.2
Temperate85.015.565.382.348.674.31.1
Warm 2.443.717.532.6
Very hot 66.3
SurfaceP0P1P2P3
CI (°C) RCP 4.5RCP 8.5RCP 4.5RCP 8.5RCP 4.5RCP 8.5
Extremely cold 1.71.40.7
Very cold2.54.03.21.81.41.8
Cold29.972.755.414.33.44.61.4
Temperate66.521.640.181.567.778.03.2
Warm 1.627.415.661.2
Very hot 34.2
Source: CI calculation results, 2024. Spatial distribution of olive groves and surface area in each scenario and climate type in the CI. Self-produced.
Disclaimer/Publisher’s Note: The statements, opinions and data contained in all publications are solely those of the individual author(s) and contributor(s) and not of MDPI and/or the editor(s). MDPI and/or the editor(s) disclaim responsibility for any injury to people or property resulting from any ideas, methods, instructions or products referred to in the content.