Article

A Record-Breaking Heatwave–Drought Compound Event in Jiangxi, China, During Summer 2022

1
Key Laboratory of Ecosystem Carbon Source and Sink, China Meteorological Administration (ECSS-CMA), Wuxi University, Wuxi 214105, China
2
School of Atmospheric Sciences, Nanjing University, Nanjing 210023, China
3
State Key Laboratory of Climate System Prediction and Risk Management, Nanjing 210044, China
4
School of Atmospheric Sciences, Nanjing University of Information Science and Technology, Nanjing 210044, China
*
Author to whom correspondence should be addressed.
Atmosphere 2026, 17(3), 270; https://doi.org/10.3390/atmos17030270
Submission received: 16 December 2025 / Revised: 28 February 2026 / Accepted: 28 February 2026 / Published: 4 March 2026
(This article belongs to the Section Meteorology)

Abstract

This study analyzes the record-breaking persistent heatwave–drought compound event that occurred in Jiangxi Province, China, from July to September 2022. The results indicate that this event was the most severe in the past 44 years, with heatwave days reaching 43 and cumulative precipitation in most areas being more than 60% below the average for the same period. The analysis suggests that the abnormal eastward extension and strengthening of the South Asian High (SAH), together with the abnormal westward extension and strengthening of the Western Pacific Subtropical High (WPSH), persistently and jointly dominated the Jiangxi region. This led to prevailing subsidence and warming throughout the atmospheric column, along with a divergent water vapor flux pattern, which suppressed the formation of precipitation. Further investigation reveals that this event is closely related to abnormally warmer sea surface temperature (SST) in the southwestern Pacific (with a correlation coefficient of 0.62). This may have triggered the Pacific–Japan (PJ) teleconnection wave train, thereby modulating the anomalies of SAH and WPSH, ultimately leading to the occurrence of this extreme compound event.

1. Introduction

The Sixth Assessment Report of the Intergovernmental Panel on Climate Change (IPCC6) indicates that the global climate system has undergone significant changes characterized primarily by warming over the past century [1]. Against this background, many regions worldwide are facing escalating risks of extreme heat due to the increased occurrence of warm days. Particularly since the end of the 20th century, heat extremes have exhibited significant increasing trends in both frequency and intensity [2]. For instance, in the summer of 2010, Moscow experienced an extreme heatwave during which daily maximum temperature surpassed 30 °C for 33 consecutive days. This event led to more than 15,000 fatalities and approximately $15 billion in economic losses, largely due to associated wildfires and drought [3]. Similarly, from mid-July to early August 2018, 83% of meteorological stations in Northeast China, North China, and eastern Inner Mongolia reported rare high-temperature heatwaves, with local maximum temperature exceeding 40 °C, significantly impacting local livelihoods and the socioeconomic conditions [4].
Heatwaves and droughts are among the most common and impactful natural disasters in China. Against the backdrop of global warming, high-temperature heatwave events in China have also shown a significant intensifying trend since the latter half of the 20th century [5]. Since 1999, China has experienced extreme high-temperature events almost annually, characterized by durations exceeding 10 days, high intensity, and widespread impacts [6]. Research based on CMIP5 and CMIP6 model simulations further reveals that since 1950, against the background of global warming, extreme weather events in China have tended to increase in frequency and intensity, with the occurrence of heatwave–drought compound events also rising [7]. Under future climate scenarios, both the intensity and duration of heatwave–drought disasters in the middle and lower reaches of the Yangtze River are likely to increase [8,9].
Atmospheric circulation anomalies are a primary cause for the formation of droughts and heatwaves. Additional forcing factors, such as the Tibetan Plateau and the northwestern Pacific, also significantly influence the occurrence of these events [10]. Wang et al. [11] pointed out that the primary cause of the high-temperature drought in the middle and lower reaches of the Yangtze River in the summer of 2013 was an anomalously strong Western Pacific Subtropical High (WPSH) influenced by a negative East Asia–Pacific/Pacific–Japan (EAP/PJ) teleconnection pattern. Chen et al. [12] identified that the extreme summer heat in central–southern China in 2017 was caused by an anomalously intensified and westward-extended WPSH, which induced persistent high-pressure anomalies over the region. They further indicated that this WPSH anomaly was primarily driven by warming in the tropical western Pacific and was independent of ENSO. The western Pacific warming enhanced local meridional circulation and convection, resulting in the high-pressure anomaly over central–southern China.
In the summer and autumn of 2022, an extensive and anomalous high-temperature drought event occurred in the Yangtze River Basin of China, causing severe impacts on natural ecosystems and socioeconomic systems, attracting widespread societal attention [13,14]. Xia et al. [13] reported that during the summer of 2022, the maximum, minimum, and average temperatures in the Yangtze River Basin were the highest since 1961 for the same period. During this period, the drought over the Yangtze River Basin reached its maximum extent, covering 94.5% of the entire basin—the largest since 1961. Furthermore, it also recorded the lowest cumulative precipitation and the highest comprehensive intensity of drought since 1961.
Against this regional backdrop, the high-temperature drought that struck Jiangxi Province in 2022 was particularly extreme. The average temperature and number of high-temperature days in Jiangxi both ranked as the highest in the historical record for the period. Moreover, from late June to mid-November 2022, Jiangxi experienced a historically rare meteorological drought. However, the specific dynamical mechanisms and dominant forcing factors that sustained the persistent high-temperature extremes in Jiangxi remain not fully elucidated. Therefore, this study focuses on this persistent heatwave–drought compound event in Jiangxi, China. We first review the basic characteristics of this event in Jiangxi (Section 3.1), then analyze the moisture transport over different regions of Jiangxi (Section 3.2), and finally examine the key atmospheric circulation systems associated with this event, such as WPSH and the South Asian High (SAH). Using conventional climatological analysis methods, including Empirical Orthogonal Function (EOF) analysis, (partial) correlation analysis, and regression analysis, we explore their possible connections with the PJ teleconnection pattern and sea surface temperatures (SST) in the Southwest Pacific. Additionally, a comparison with the high temperature drought event of 2013 reveals certain similarities between the two events. This case study contributes to elucidating the underlying mechanisms and key forcing factors of high temperature drought events in East Asia.

2. Data and Methods

2.1. Data

The data used in this study are as follows:
(1)
The daily ERA5 reanalysis data from 1979 to 2022, released by European Center for Medium-Range Weather Forecasts (ECMWF) [15]. The dataset has a horizontal resolution of 0.25° × 0.25° and includes 37 vertical levels, providing variables such as specific humidity, horizontal winds, geopotential height, and vertical velocity.
(2)
Monthly National Oceanic and Atmospheric Administration (NOAA) high-resolution Blended Analysis of SST. This dataset spans from 1982 to 2022 and has a 0.25° × 0.25° global grid [16].
(3)
Normalized Difference Vegetation Index product (NDVI) obtained from the Global Inventory Modeling and Mapping Studies third-generation version 1.2 (GIMMS-3G+, Pinzon et al. [17]). This dataset covers the period from 1982 to 2022 and has a 0.0833° × 0.0833° spatial resolution.
(4)
El Niño 3.4 data, defined as SST anomalies in the east–central tropical Pacific (5° N–5° S, 170–120° W). are available from https://psl.noaa.gov/data/correlation/nina34.data (accessed on 8 February 2026). And its three-month running mean is defined as El Niño–Southern Oscillation (ENSO) index. Additionally, it should be noted that, according to the latest Public Information Statement from the U.S. National Weather Service, the Relative Oceanic Niño Index (RONI) is used for official monitoring and prediction of the ENSO phenomenon. (RONI data are available from https://www.cpc.ncep.noaa.gov/products/analysis_monitoring/enso/roni (accessed on 8 February 2026)). To assess the potential impact of using different ENSO indices, the correlation coefficient between the two indices was calculated for the summer (JAS) during 1979–2022. The result shows a correlation coefficient of 0.96, indicating that the two indices are nearly identical and have little impact on the results.

2.2. Methods

(1)
The definition of high-temperature drought index in Jiangxi
The number of high-temperature days refers to the regionally averaged daily maximum temperature ≥ 35 °C in Jiangxi (113.5–118° E, 24.5–30° N). A heatwave event is defined as the regionally averaged daily maximum temperature ≥ 35 °C lasting for three or more consecutive days. The high-temperature drought index is defined as the standardized normalized number of high-temperature heatwave days multiplied by the standardized normalized vertically integrated moisture flux divergence over Jiangxi. This is because a greater number of heatwave days combined with stronger moisture flux divergence (>0) typically corresponds to more severe compound extreme heat and drought events. Since a positive value of heatwave days indicates high-temperature conditions and a positive value for vertically integrated moisture flux divergence indicates drought conditions, their multiplicative form is better suited to represent the compound character of concurrent extremes. A higher index value thus indicates a more severe high-temperature and drought event. Additionally, in this study, vertically integrated moisture flux divergence from ERA5 (unit: kg m−2 s−1) is adopted as a drought proxy instead of precipitation or soil moisture, ensuring consistency with the moisture budget analysis. However, it should be noted that this proxy is widely correlated negatively with both precipitation and soil moisture. Corresponding to Step1 in Figure 1.
(2)
Moisture Transport Analysis in Jiangxi
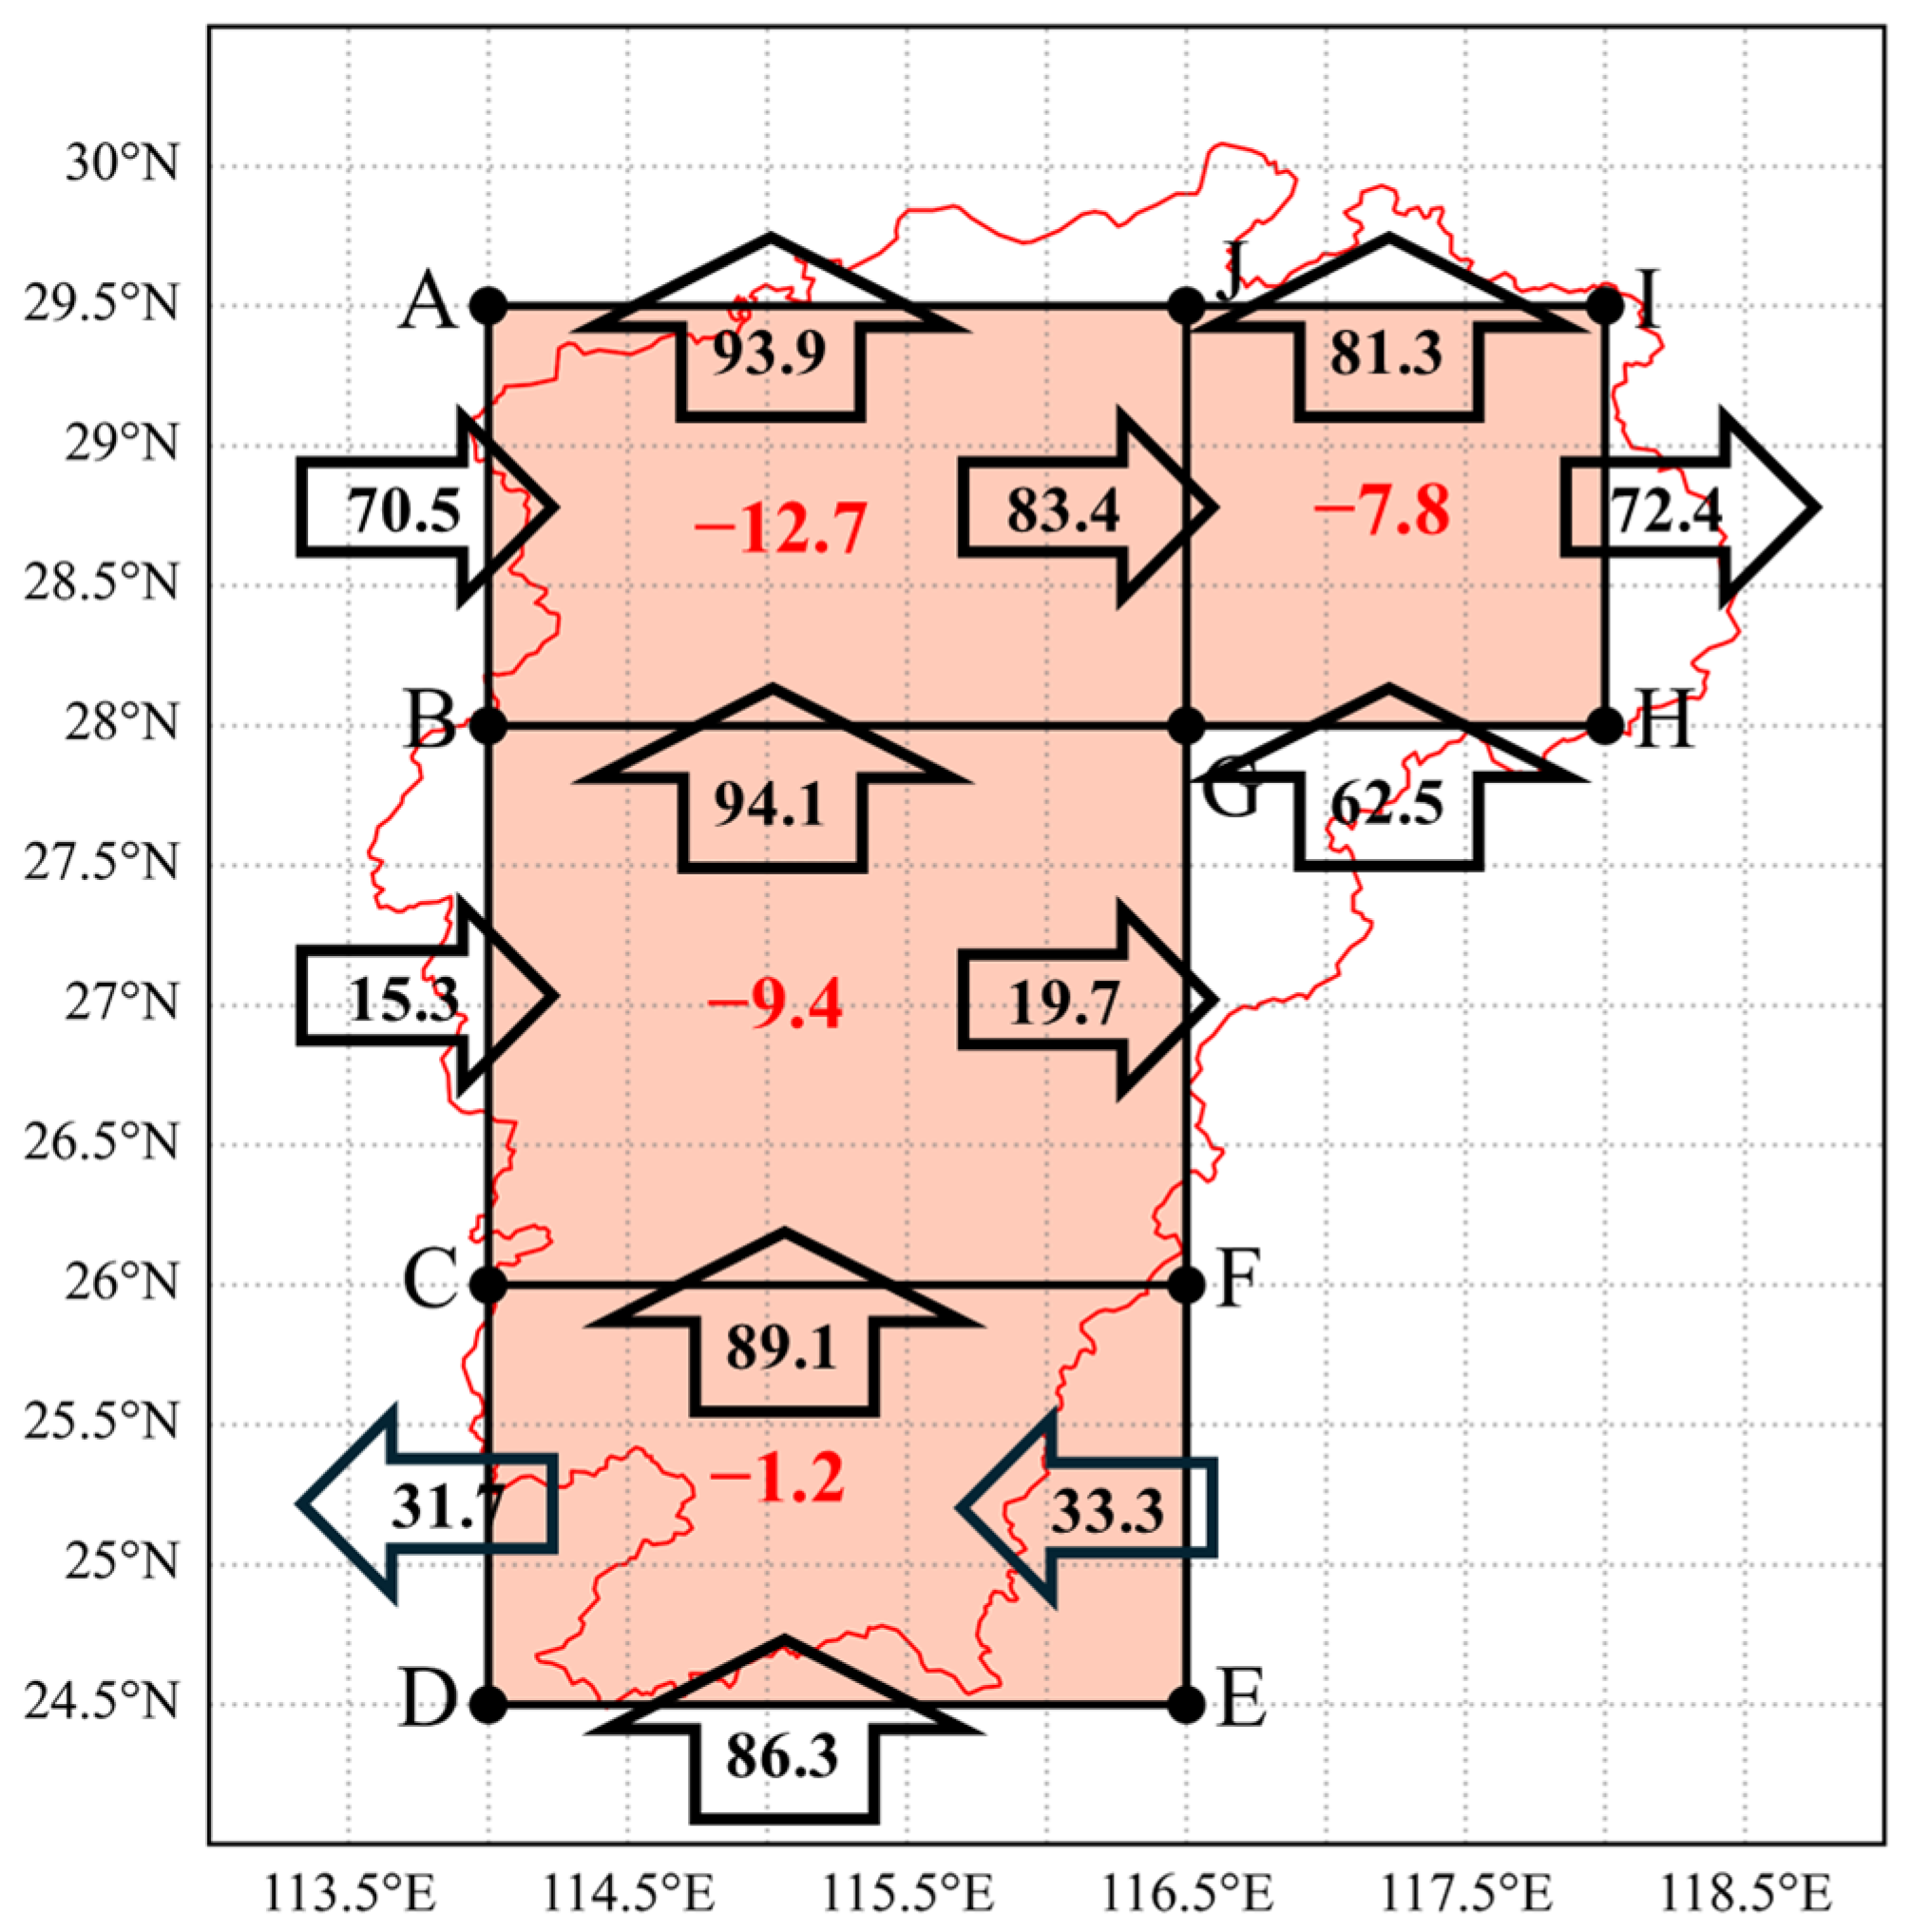
To analyze the moisture transport conditions in Jiangxi during summer 2022, the Jiangxi region was roughly divided into four sub-regions (as shown in the reference map in Figure 1), and the moisture flux across each boundary was calculated separately for each sub-region. Specifically, the vertically integrated moisture flux Q was first computed using Equation (1), and then integrated along each respective boundary (unit: kg·s−1). Corresponding to Step2 in Figure 1.
Q = ( Q u , Q v ) = 1 g p t o p p s u r f a c e q u , v d p
where q is the specific humidity, u and v respectively indicate the zonal and meridional wind components, p is the pressure, p s u r f a c e and p t o p represent 1000 hPa and 0 hPa, respectively.
(3)
PJ teleconnection pattern
The PJ teleconnection index is derived by performing EOF on the summer (July–September) 500 hPa zonal wind anomaly field over the East Asia–northwestern Pacific region (100–180° E, 0–75° N) during 1979–2022. The standardized principal component (PC1) of the first EOF mode is defined as the PJ index (refer to Step 3 in Figure 1).
The indices are not detrended prior to analysis, all results are based on the original time series, including long term trends. The climatological reference period for calculating anomalies is uniformly set to 1979–2022 for the ERA5 reanalysis data, while for NOAA SST data and NDVI data it is set to 1982–2022 (these datasets begin in 1982).

3. Results

3.1. Characteristics of High Temperature and Drought in Jiangxi

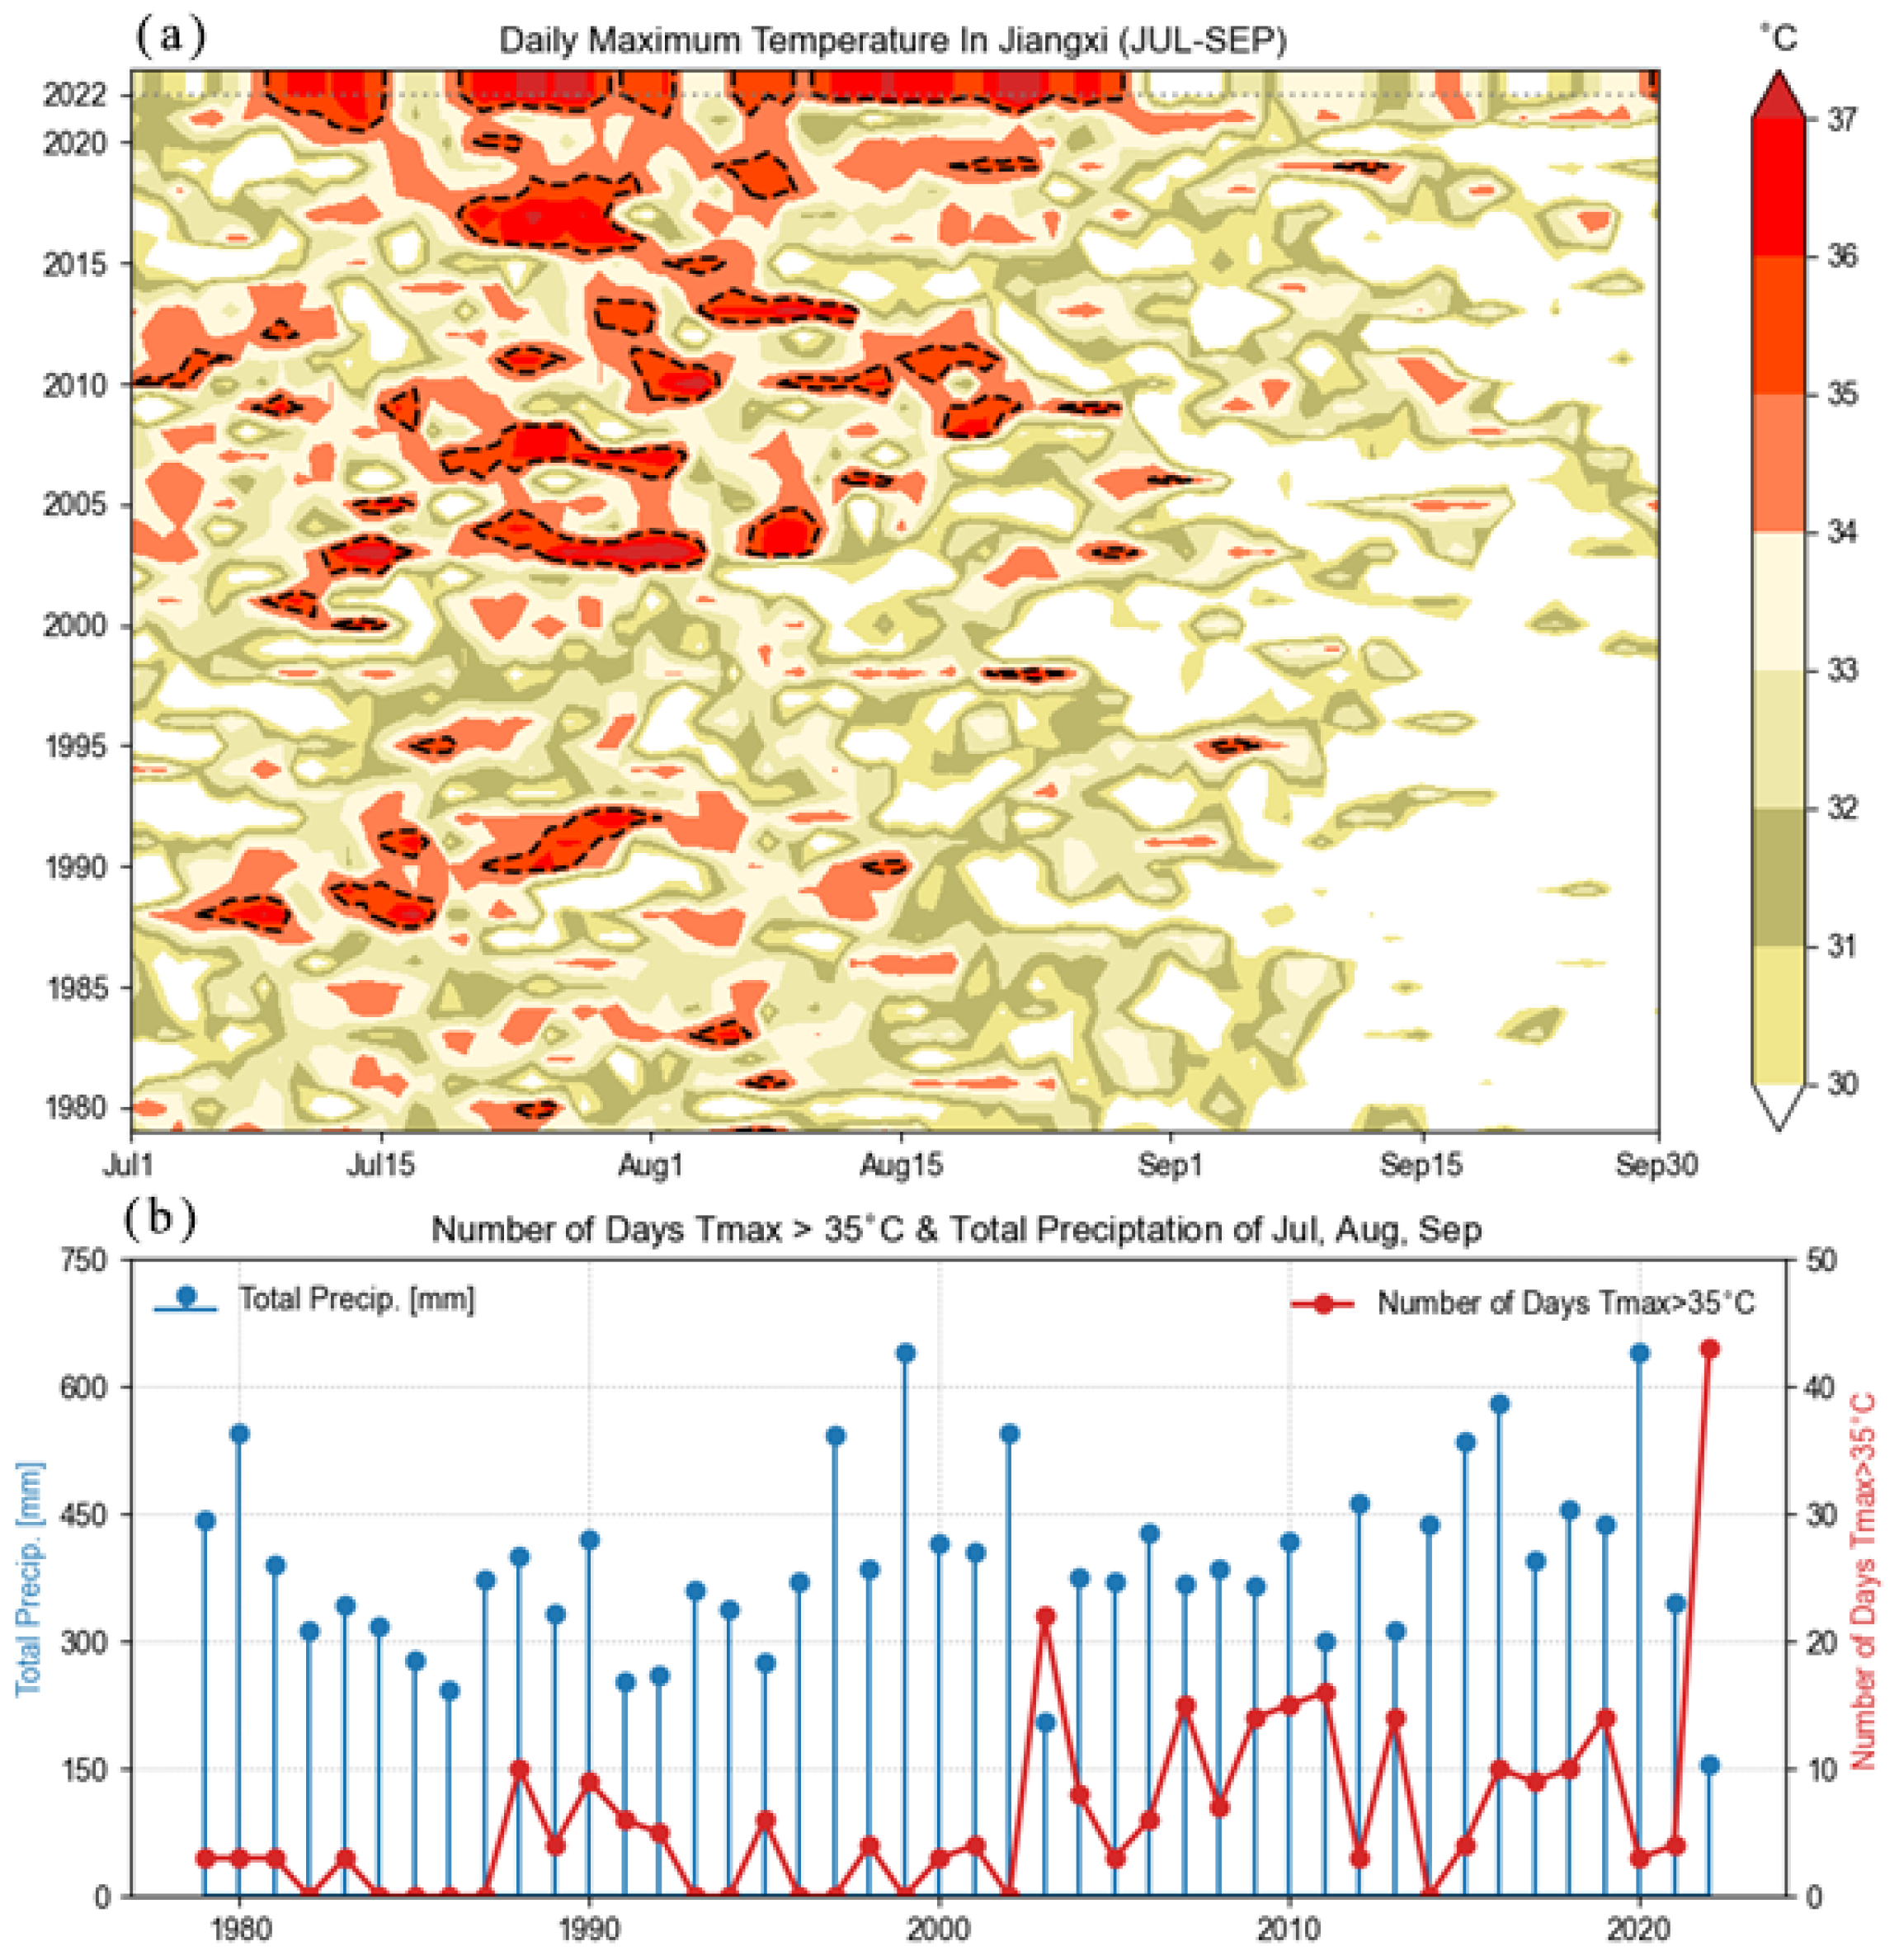
Figure 2a shows the variation in daily maximum temperature in Jiangxi Province during July–September from 1979 to 2022, with heatwave events marked by black dashed contours. Against the background of global warming, high-temperature events in Jiangxi have exhibited a clear increasing and intensifying trend since 2000, with regional heatwave events primarily consisting of short to medium-term events lasting less than 10 days. Superimposed on this overall trend, heatwave activity in Jiangxi also shows pronounced inter-annual oscillations. Among these, the 2022 heatwave event stands out in both duration and sustained intensity. During 2022, Jiangxi experienced three major heatwave episodes: 10–16 July, 21 July to 2 August, and 11–29 August. The number of days with daily maximum temperature ≥ 35 °C reached 43 (Figure 2b), far exceeding the values recorded in other years. Meanwhile, the regionally averaged cumulative precipitation in Jiangxi from July to September 2022 was also the lowest on record for the same period since 1979, reaching only about 156.2 mm (Figure 2b).
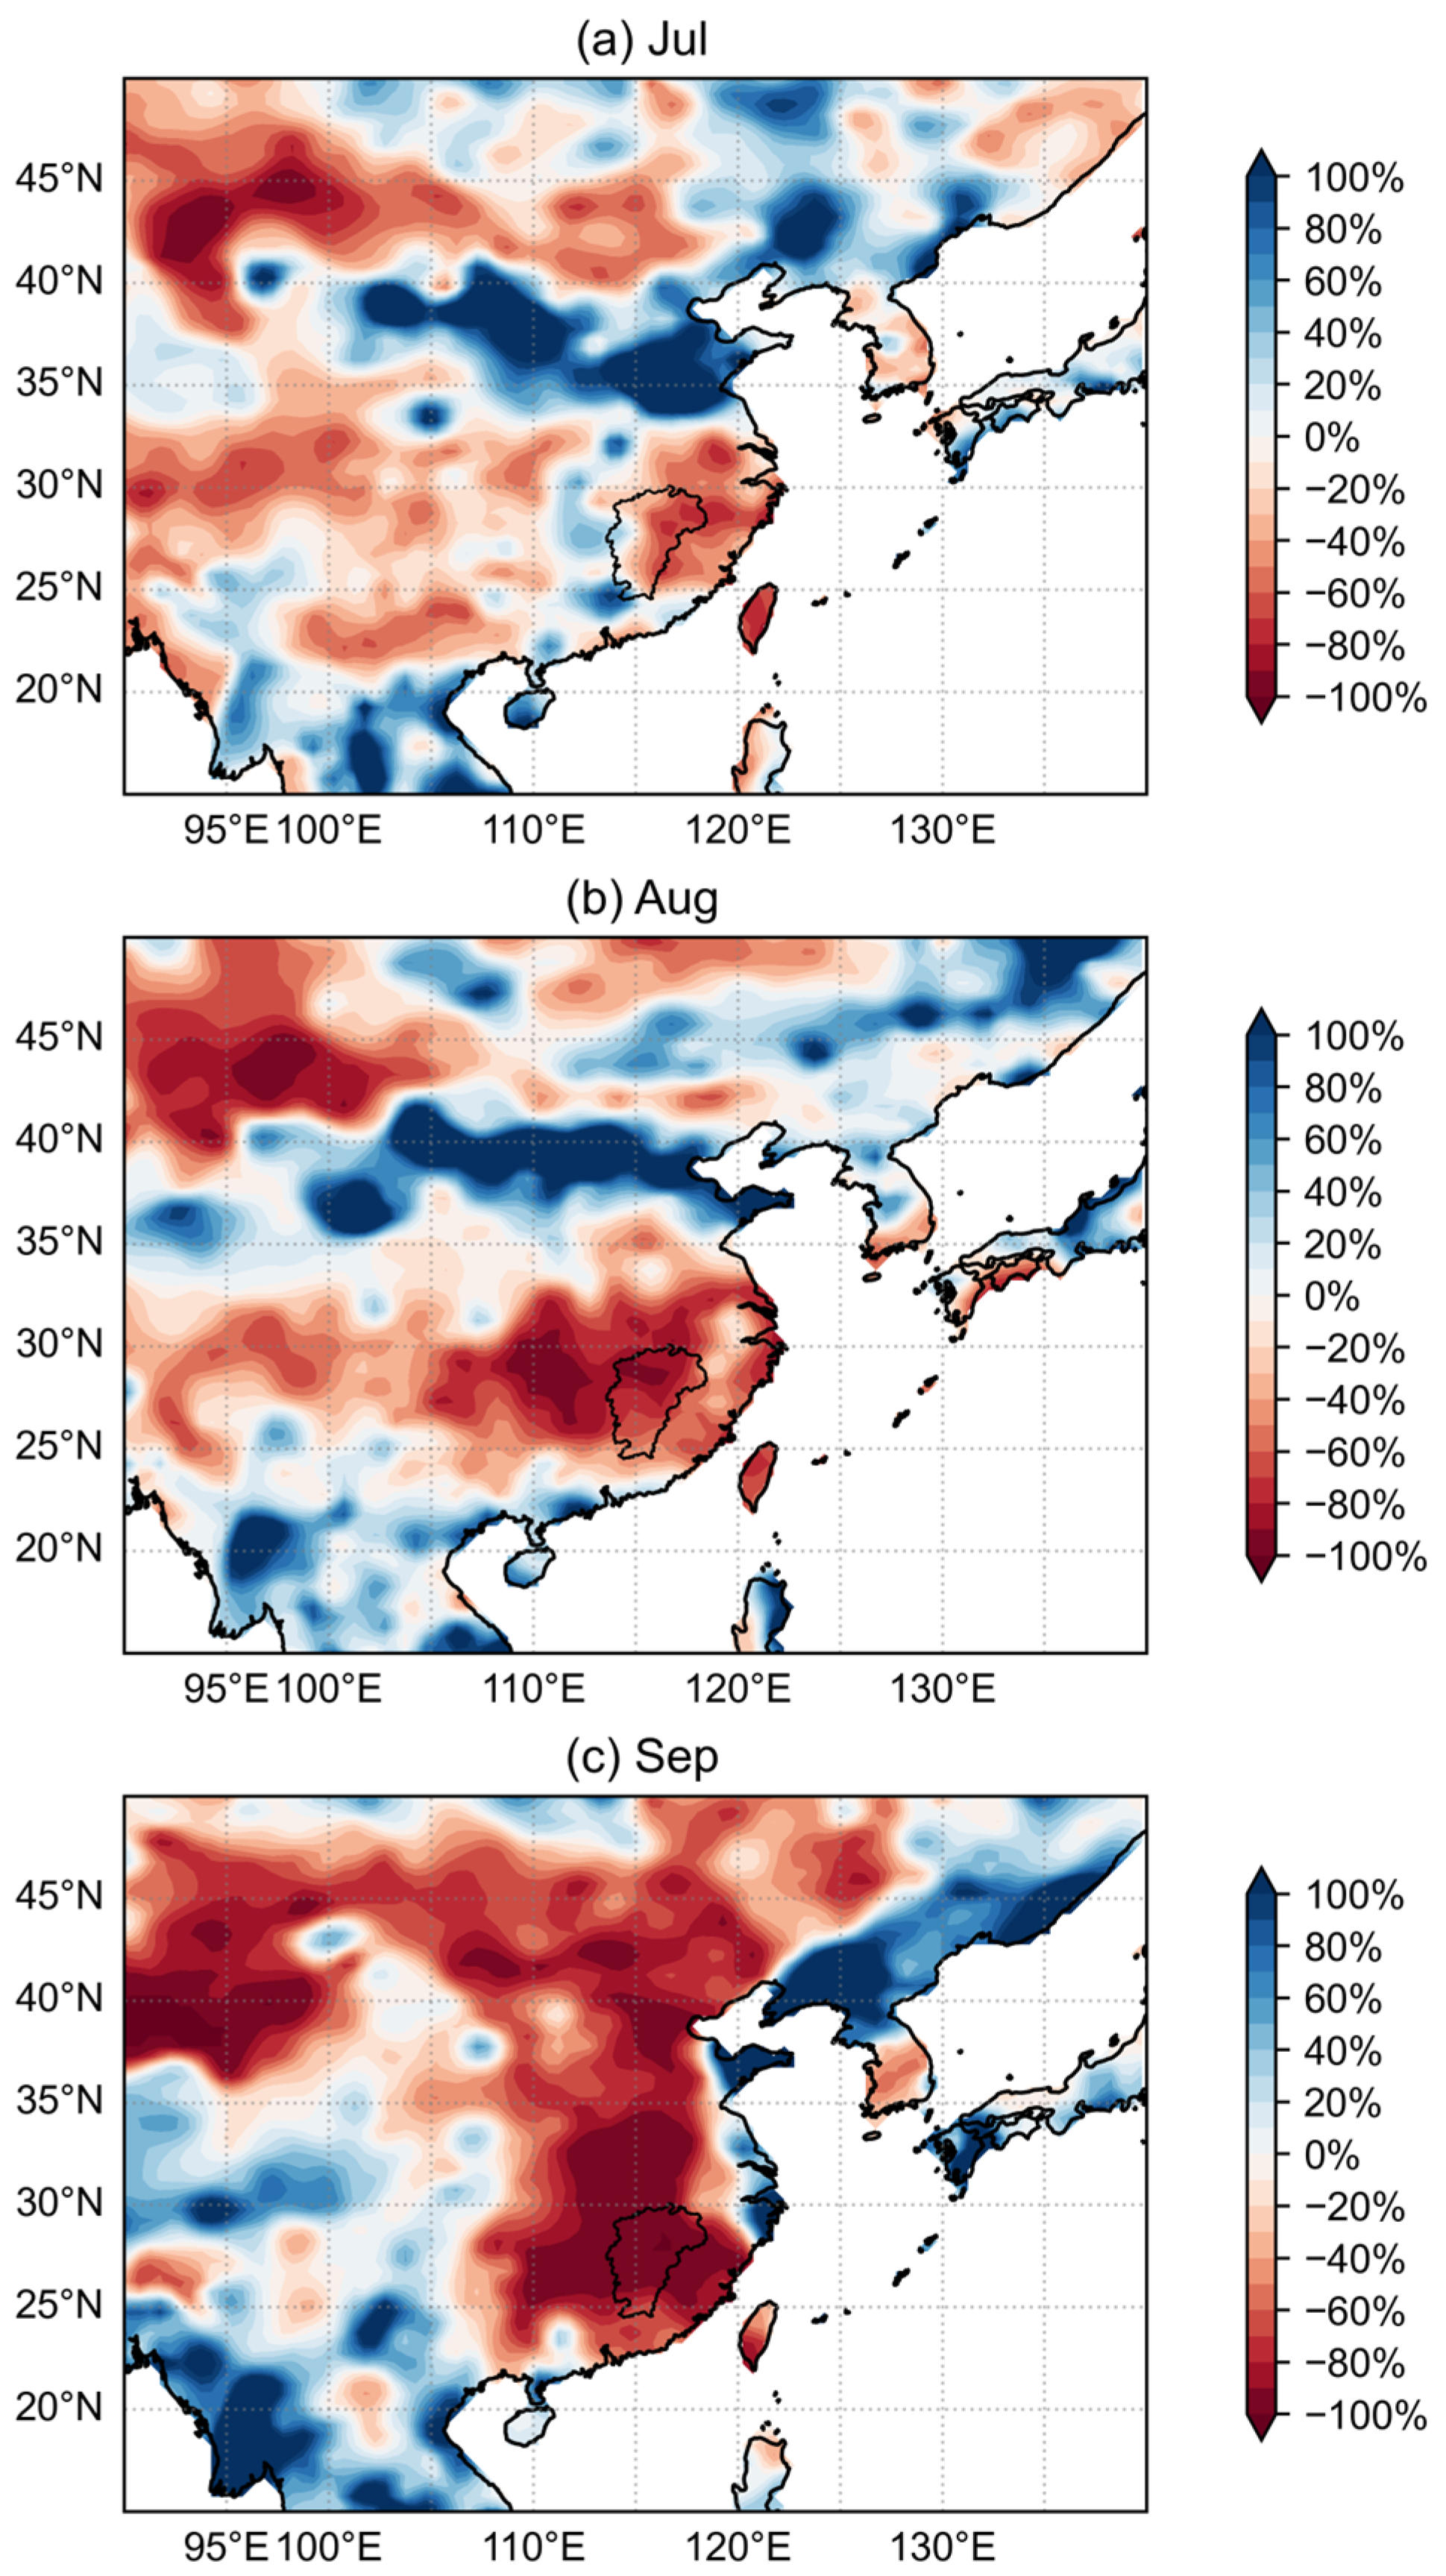
As shown in Figure 3a, in July 2022, the cumulative precipitation anomaly percentage in East Asia was predominantly negative in northwest, southwest, and southeastern coastal regions of China. Most areas of Jiangxi exhibited negative cumulative precipitation anomaly percentages, with precipitation reductions exceeding 40% in the eastern and northeastern parts of Jiangxi. In August (Figure 3b), the negative precipitation anomalies in East Asia were primarily distributed across two belt-shaped regions: one located between 40 and 47° N with a significant negative anomaly center in northwest China, and the other encompassing the middle and lower reaches of the Yangtze River, including Hubei, Hunan, Jiangxi, and Taiwan Province. The area of largest negative anomalies was situated in southeastern China east of 105° E. The entire Jiangxi region exhibited a negative precipitation anomaly exceeding 40%, with northern areas experiencing reductions of more than 90% compared to the same period. In September (Figure 3c), the drought conditions continued to intensify in both the northwest and the middle and lower reaches of the Yangtze River. Widespread areas in the middle and lower reaches of the Yangtze River experienced precipitation reductions of approximately 90%. The entire Jiangxi region fell within areas of significant negative precipitation anomalies. Furthermore, except for a few southern areas where precipitation was 60–70% below normal, most regions of Jiangxi experienced precipitation reductions of around 90%.
Examining the inter-annual evolution of July–September monthly cumulative precipitation (Figure 2b), during the high-temperature drought disaster in 2022, the regionally averaged cumulative precipitation in Jiangxi was only 156.2 mm, the lowest value in the past 44 years and the most severe drought recorded during the same period. Overall, from July to September 2022, the negative precipitation anomaly percentage in Jiangxi gradually expanded from the east to the west, peaking in September. This event represents the most severe high-temperature and drought compound disaster in Jiangxi in recent four decades.
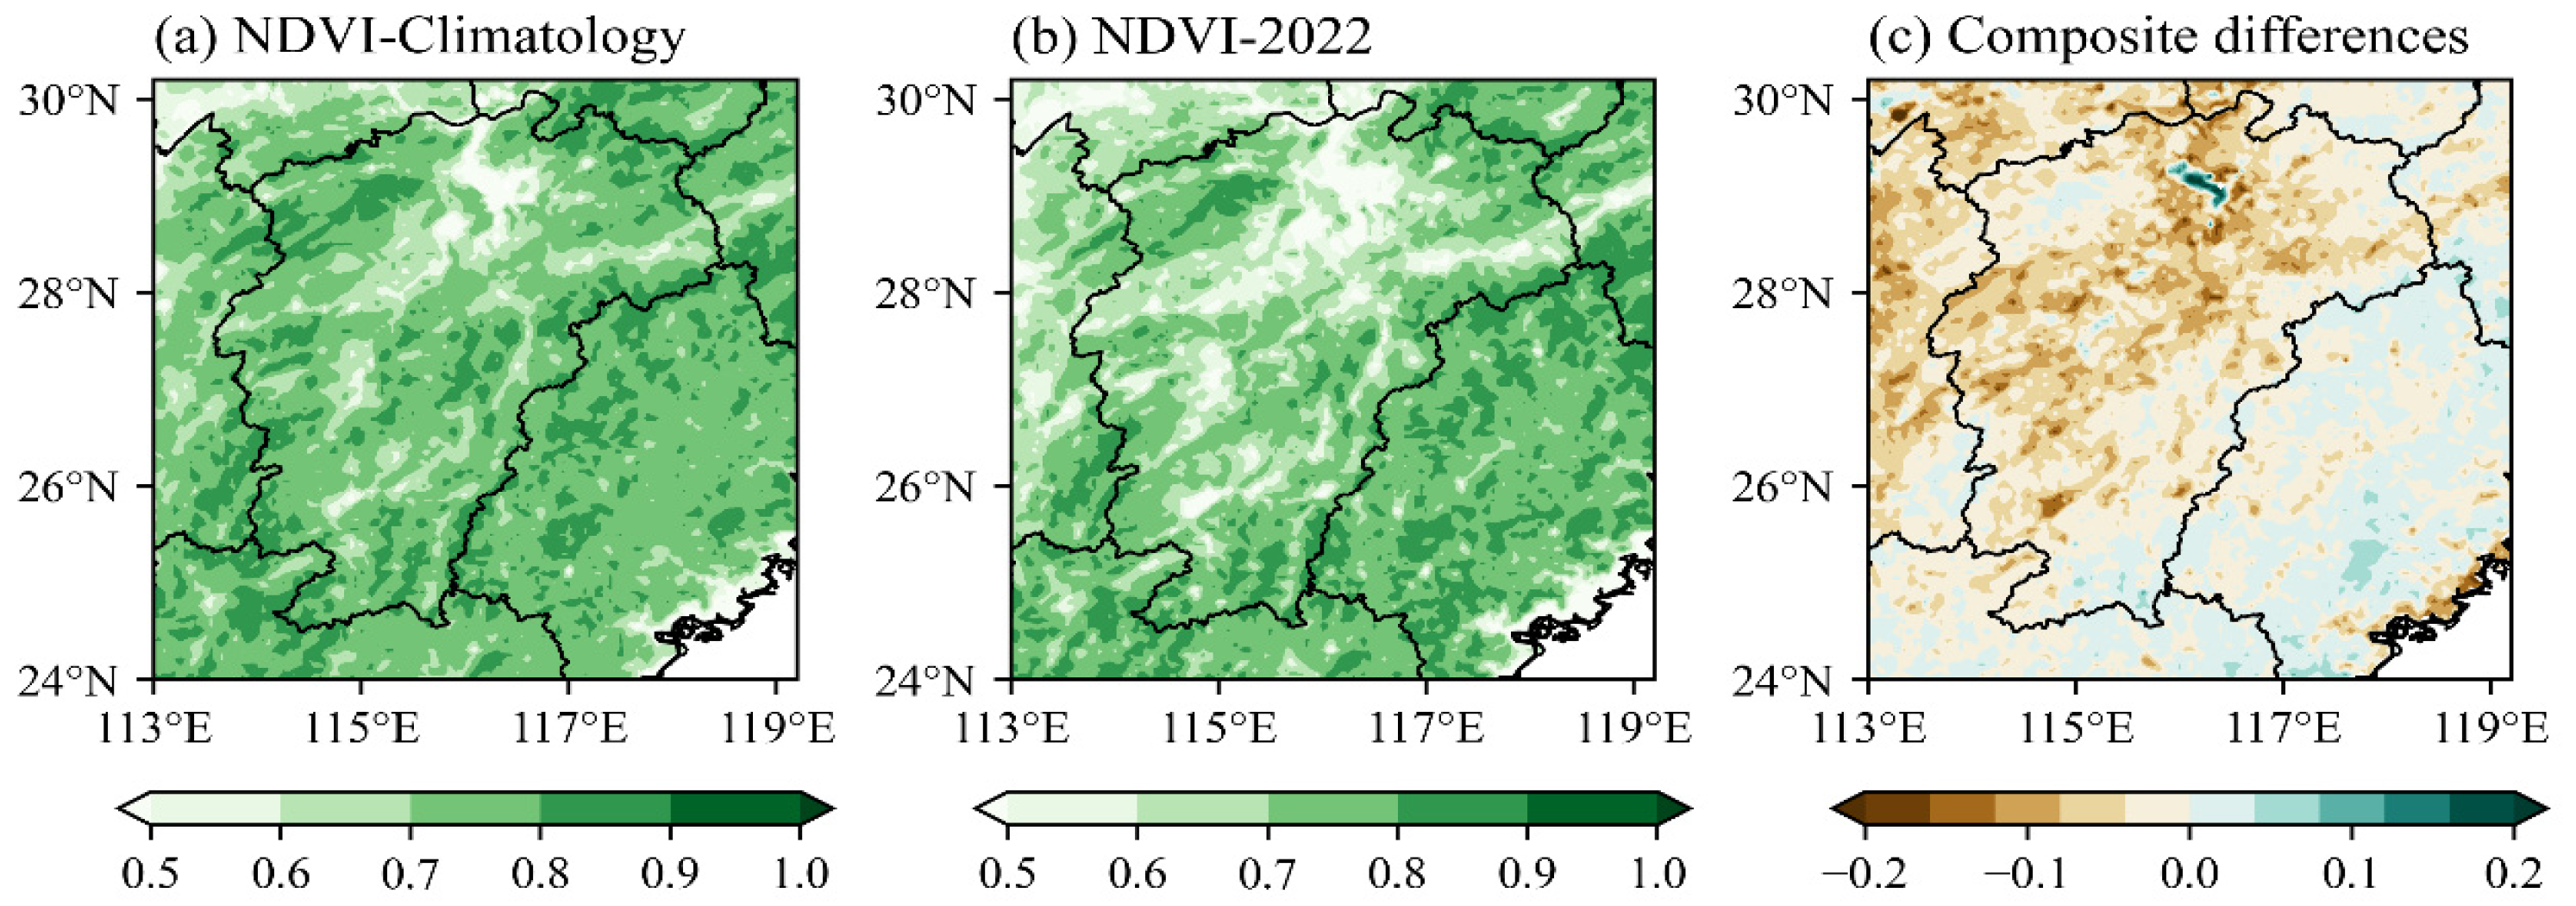
The Normalized Difference Vegetation Index (NDVI) in Jiangxi Province for September is shown in Figure 4. A comparison with the climatological NDVI clearly indicates that in September 2022, NDVI values declined across a large portion of Jiangxi, with over 60% of the area experiencing a decrease greater than 0.05 relative to the climatological mean. Notably, the NDVI in central and northern Jiangxi declined by up to 0.16. This extreme vegetation stress contributed to severe hydrological impacts, including almost 70% reduction in the surface area of Poyang Lake—China’s second largest freshwater lake—compared to the same period in previous rainy seasons [18].
Previous attribution studies have been conducted on this record-breaking extreme heatwave and drought event in the Yangtze River Basin. Hua et al. [19] indicates that the extreme summer heat in the middle and lower reaches of the Yangtze River in 2022 was influenced both by internal climate variability and by anthropogenic forcing. Gong et al. [20] suggests that internal variability contributed approximately 60% to the intensity of the 2022 extreme heat, with atmospheric circulation anomalies playing the dominant role within that contribution.

3.2. Vertical Dynamics and Moisture Transport

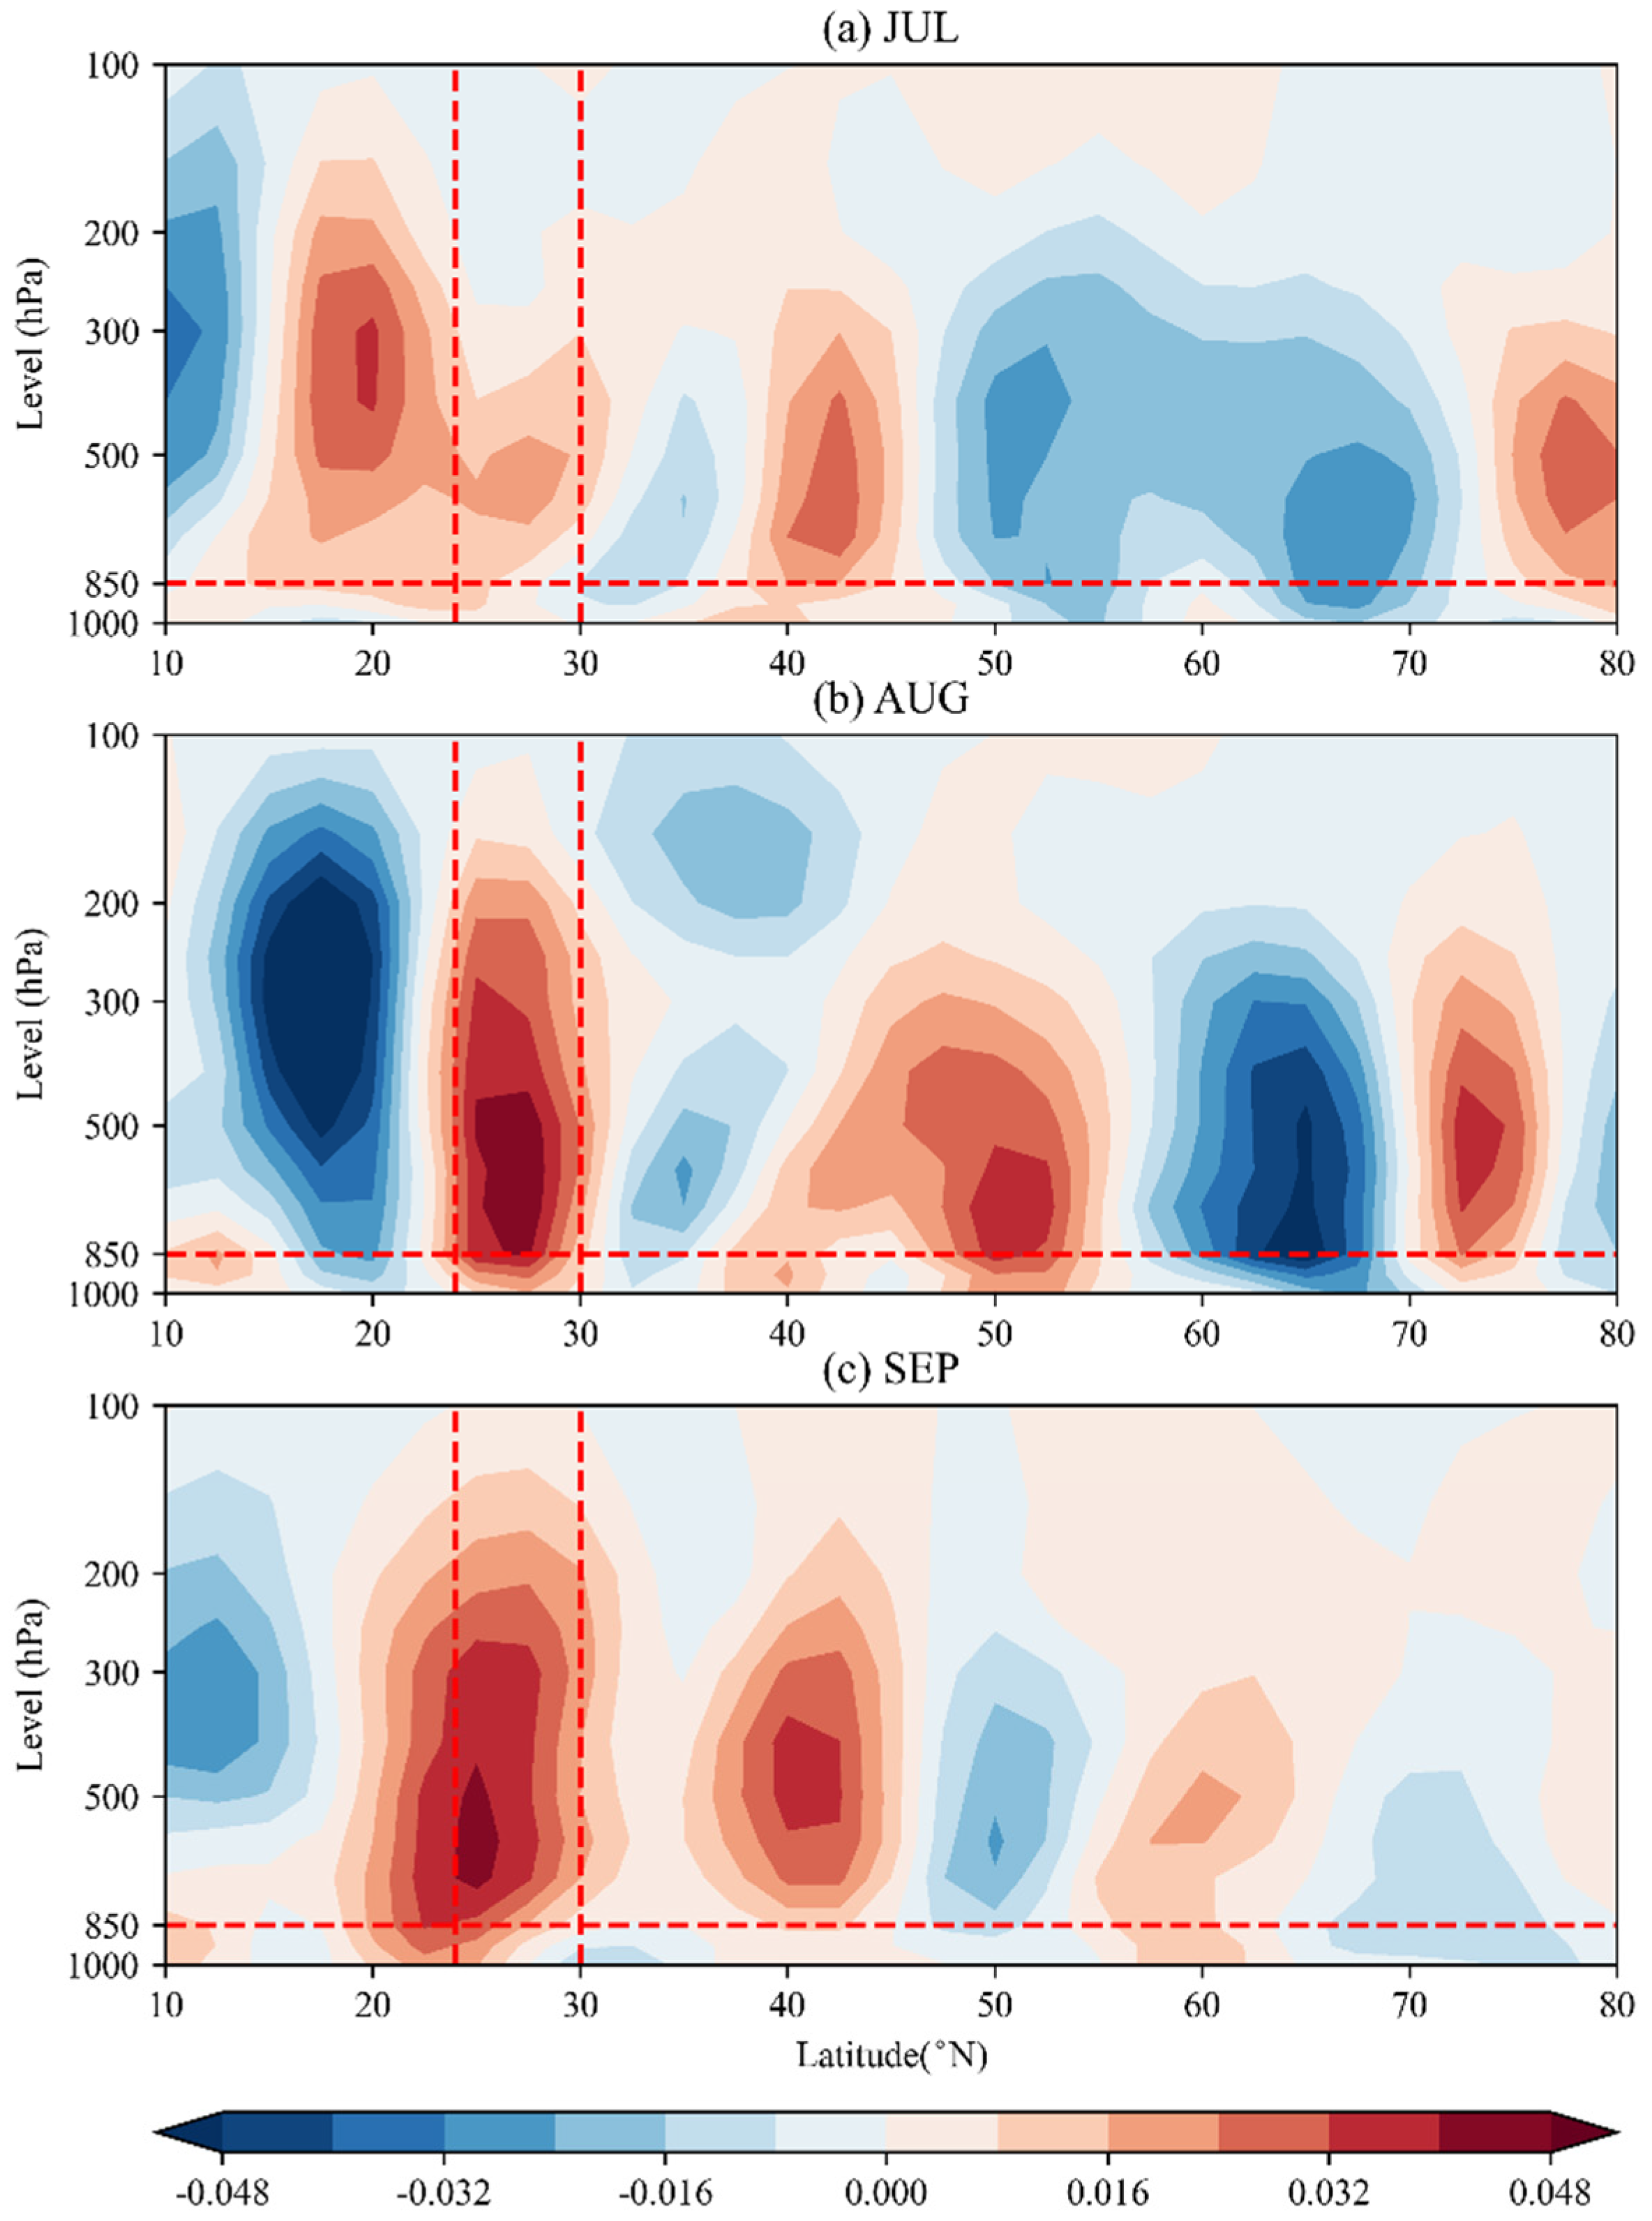
To analyze the causes of this high-temperature and drought compound disaster, Figure 5 depicts the average zonal vertical velocity anomalies between 113.5° and 118° E in Northern Hemisphere. In July, the area above Jiangxi below 300 hPa was dominated by subsidence motion (Figure 5a). This contributed to air warming over the region, corresponding to the persistent high-temperature heatwave observed during the latter half of July in Figure 2a, while simultaneously inhibiting moisture convergence, upward motion, and precipitation formation. In August, the subsidence zone that was initially centered between 15 and 25° N shifted northward to directly over Jiangxi. This led to a significant intensification of subsidence over Jiangxi compared to July, with the atmospheric column exhibiting consistent downward motion. The strongest subsidence, exceeding 0.05 Pa/s, occurred between 500 hPa and 850 hPa (Figure 5b). Correspondingly, a large-scale heatwave event with temperature ≥ 35 °C persisted for over 20 days in August. In September, the subsidence area over Jiangxi in the mid and upper troposphere expanded meridionally, reaching southward to about 20° N and linking northward with the subsidence zone near 40° N (Figure 5c). The strongest subsidence remained between 500 hPa and 850 hPa, although the area of maximum values shrank compared to August. In the lower troposphere (<850 hPa), southern Jiangxi was controlled by subsidence, while weak upward motion appeared in the north. Overall, from July to September, strong subsidence prevailed over Jiangxi. This led to persistent regional high temperature in July and August and significantly suppressed moisture uplift and precipitation formation. Although daily maximum temperature decreased somewhat in September (Figure 2a), strong subsidence persisted, causing the drought disaster to continue.
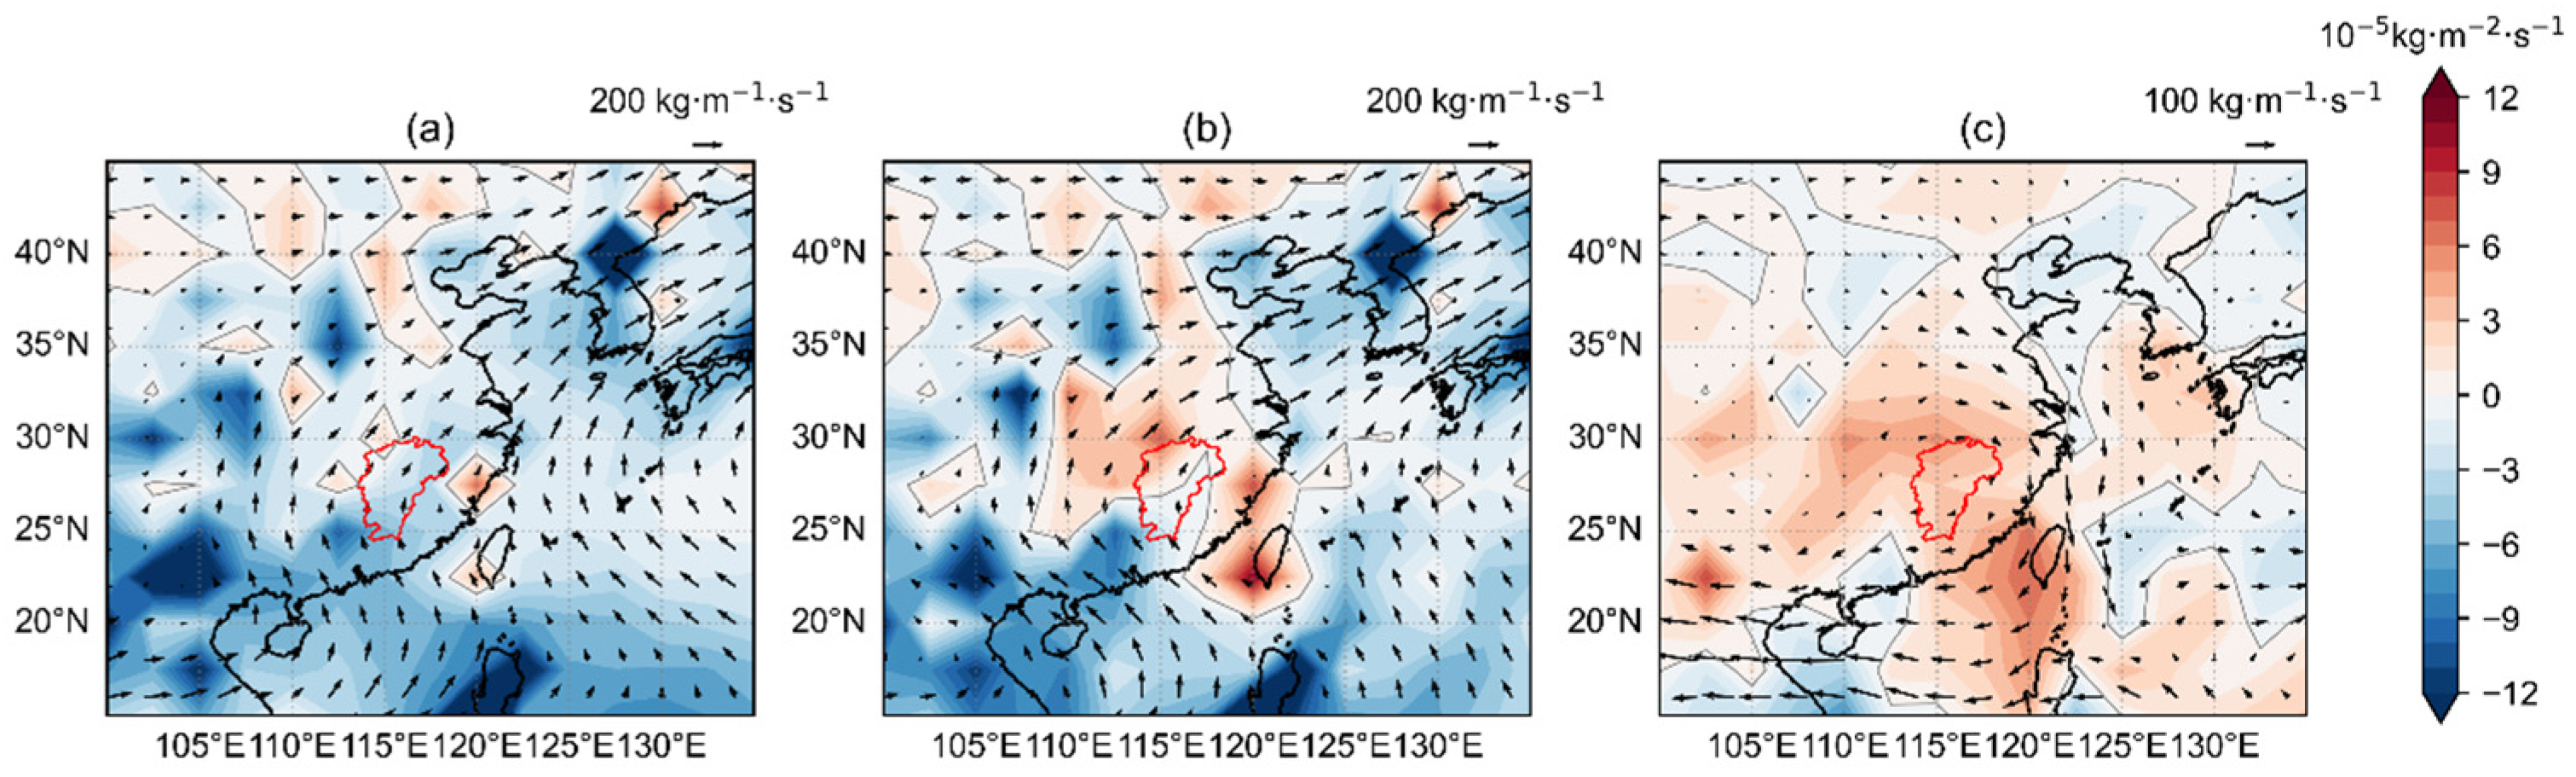
To analyze the moisture transport conditions in Jiangxi during the summer of 2022, the vertically integrated moisture flux and its divergence for July–September 2022 were examined (Figure 6b). Compared to the climatological mean (Figure 6a), the vertically integrated moisture flux divergence over central and northern Jiangxi during July–September 2022 showed predominantly positive anomalies, indicating pronounced anomalous moisture divergence that suppressed precipitation formation. The anomalous moisture flux was mainly concentrated south of 24° N (Figure 6c), with the moisture flux divergence anomaly over Jiangxi reaching 6 × 10⁻⁵ kg·m−2·s−1. Moreover, a distinct anti-cyclonic circulation pattern in vertically integrated moisture flux anomalies was centered over Jiangxi. Together with the prevailing subsidence over the region, this pattern suppressed moisture convergence and ultimately contributed to the historically persistent high-temperature drought compound event in the summer of 2022.
Figure 7 displays the moisture flux across each boundary for various sub-regions, in order to analyze the regional moisture budget over Jiangxi during July–September 2022. It is evident that during July–September 2022, the vertically integrated moisture flux across the whole Jiangxi region and its sub-regions exhibited a net outflow, indicating overall moisture divergence. This condition hindered moisture accumulation and precipitation formation, ultimately contributing to the severe drought in Jiangxi.

3.3. Characteristics of Circulation Patterns

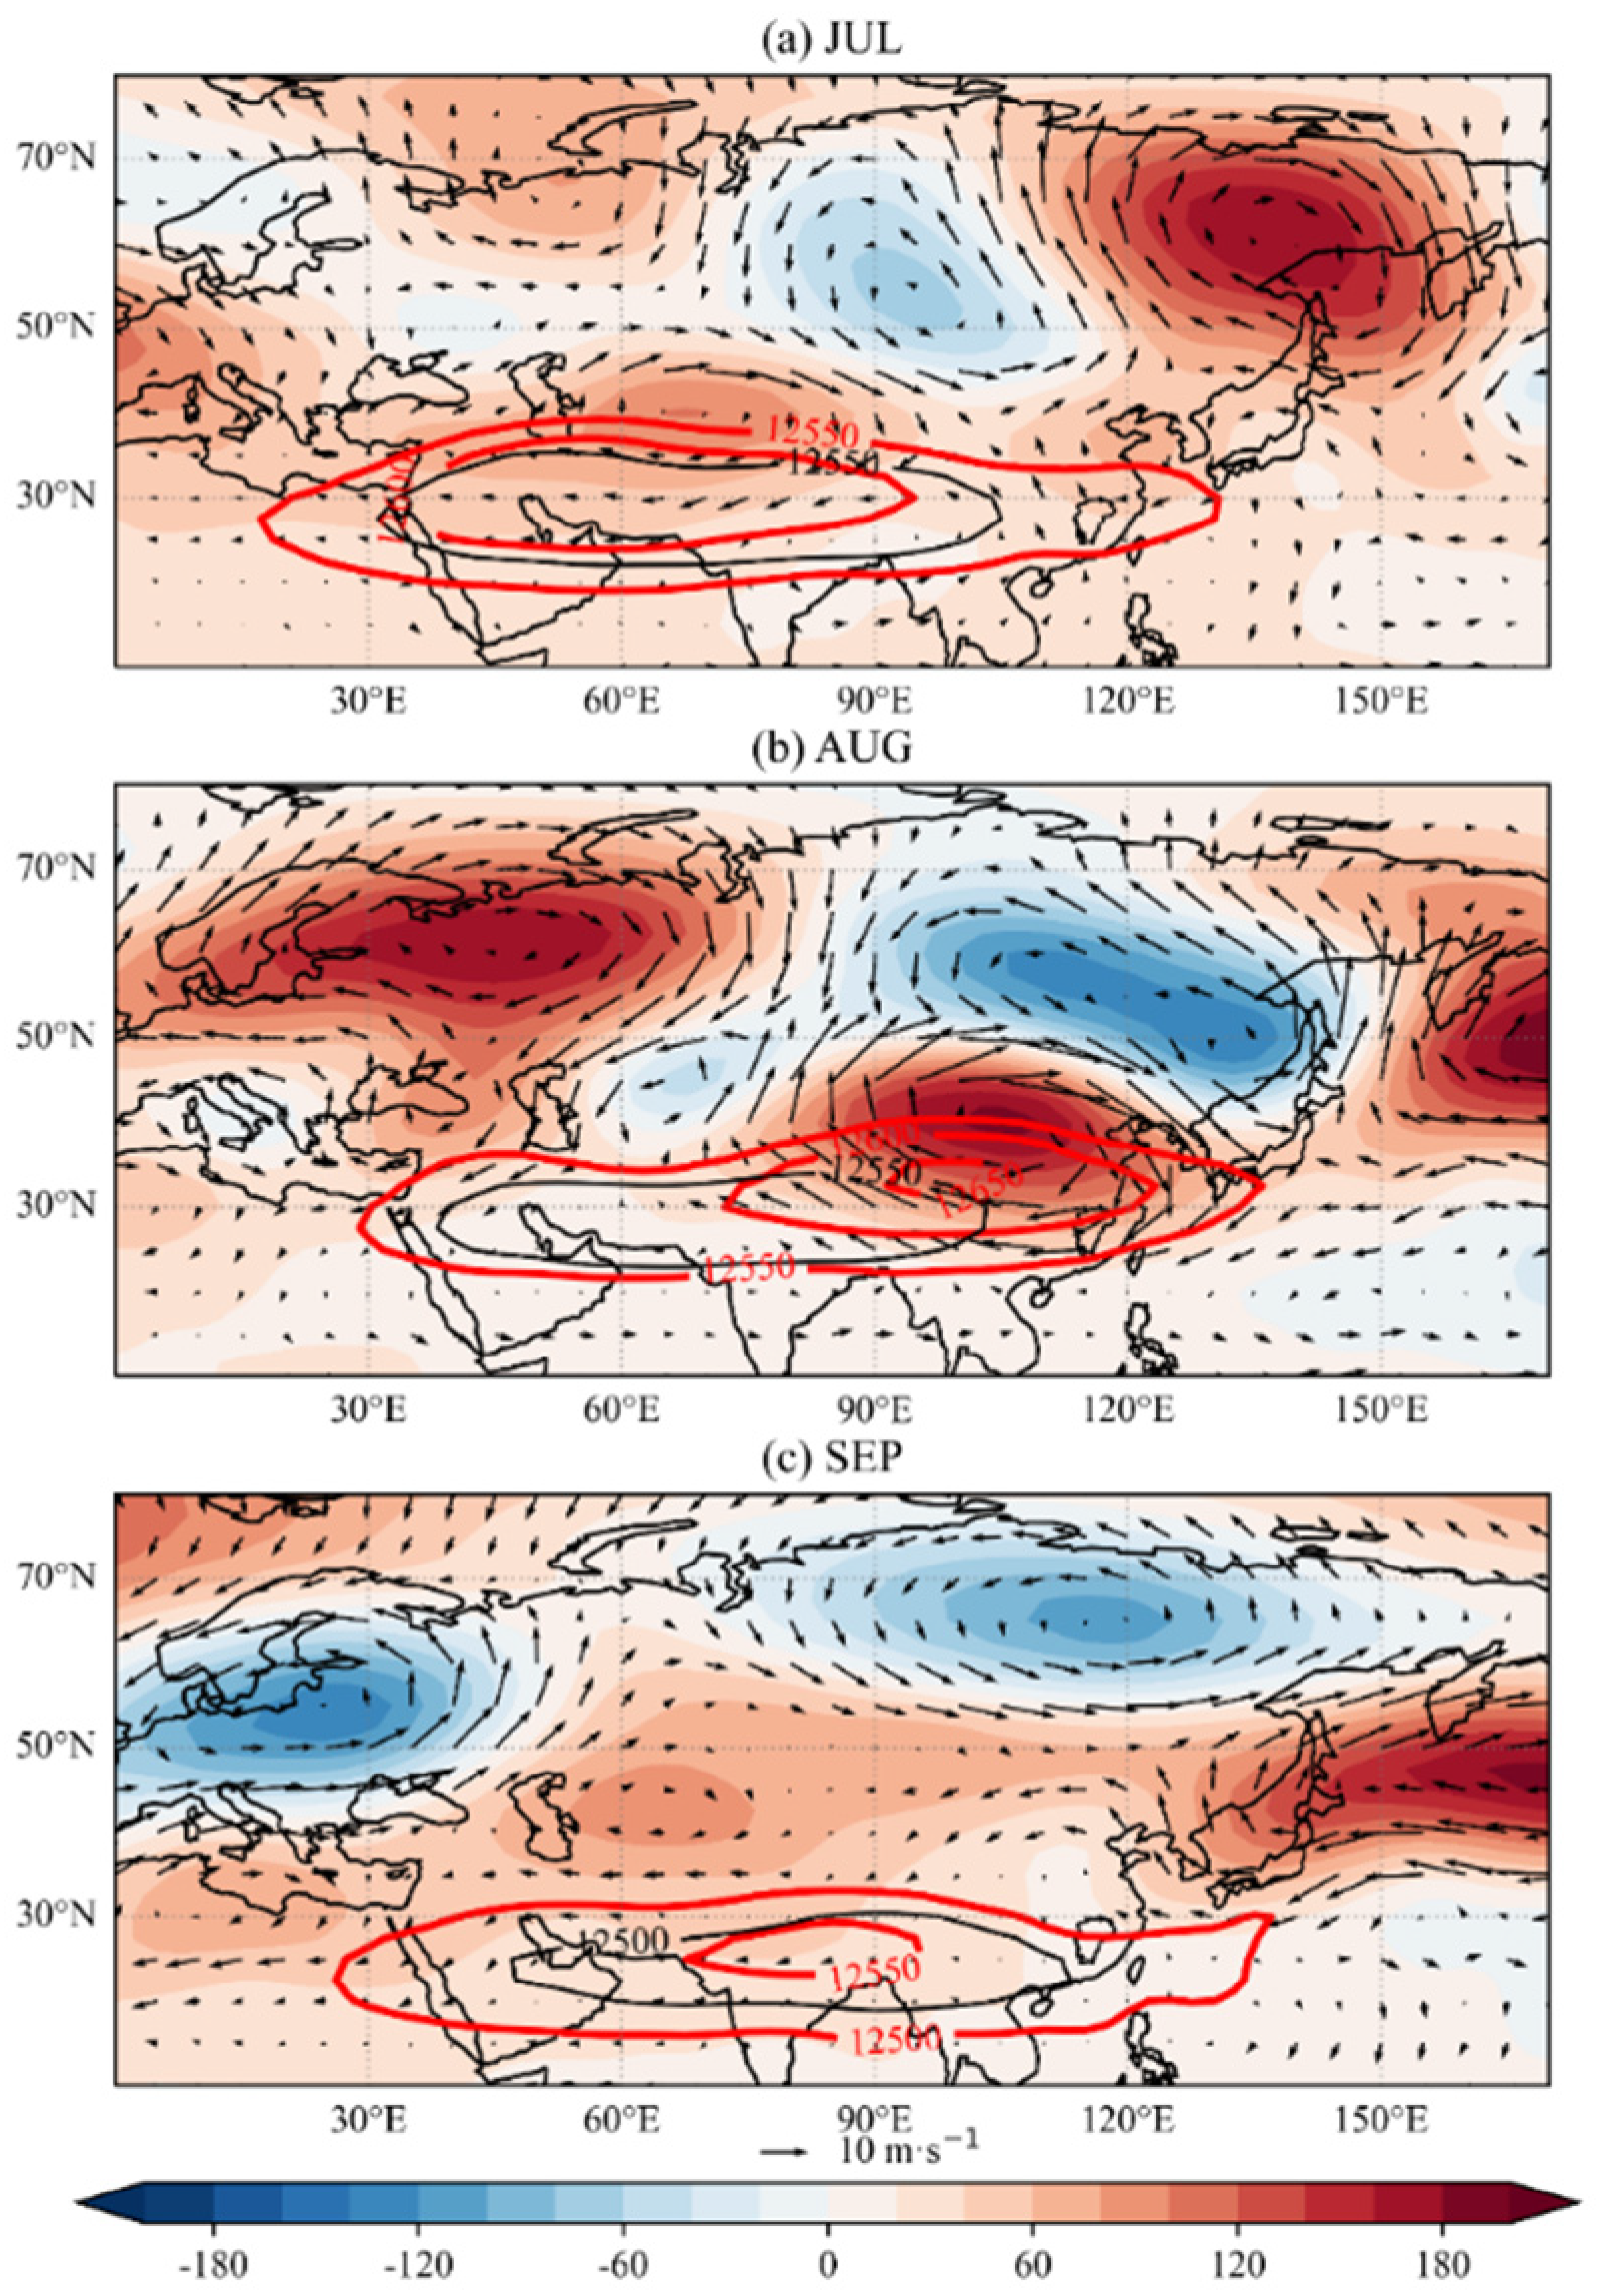
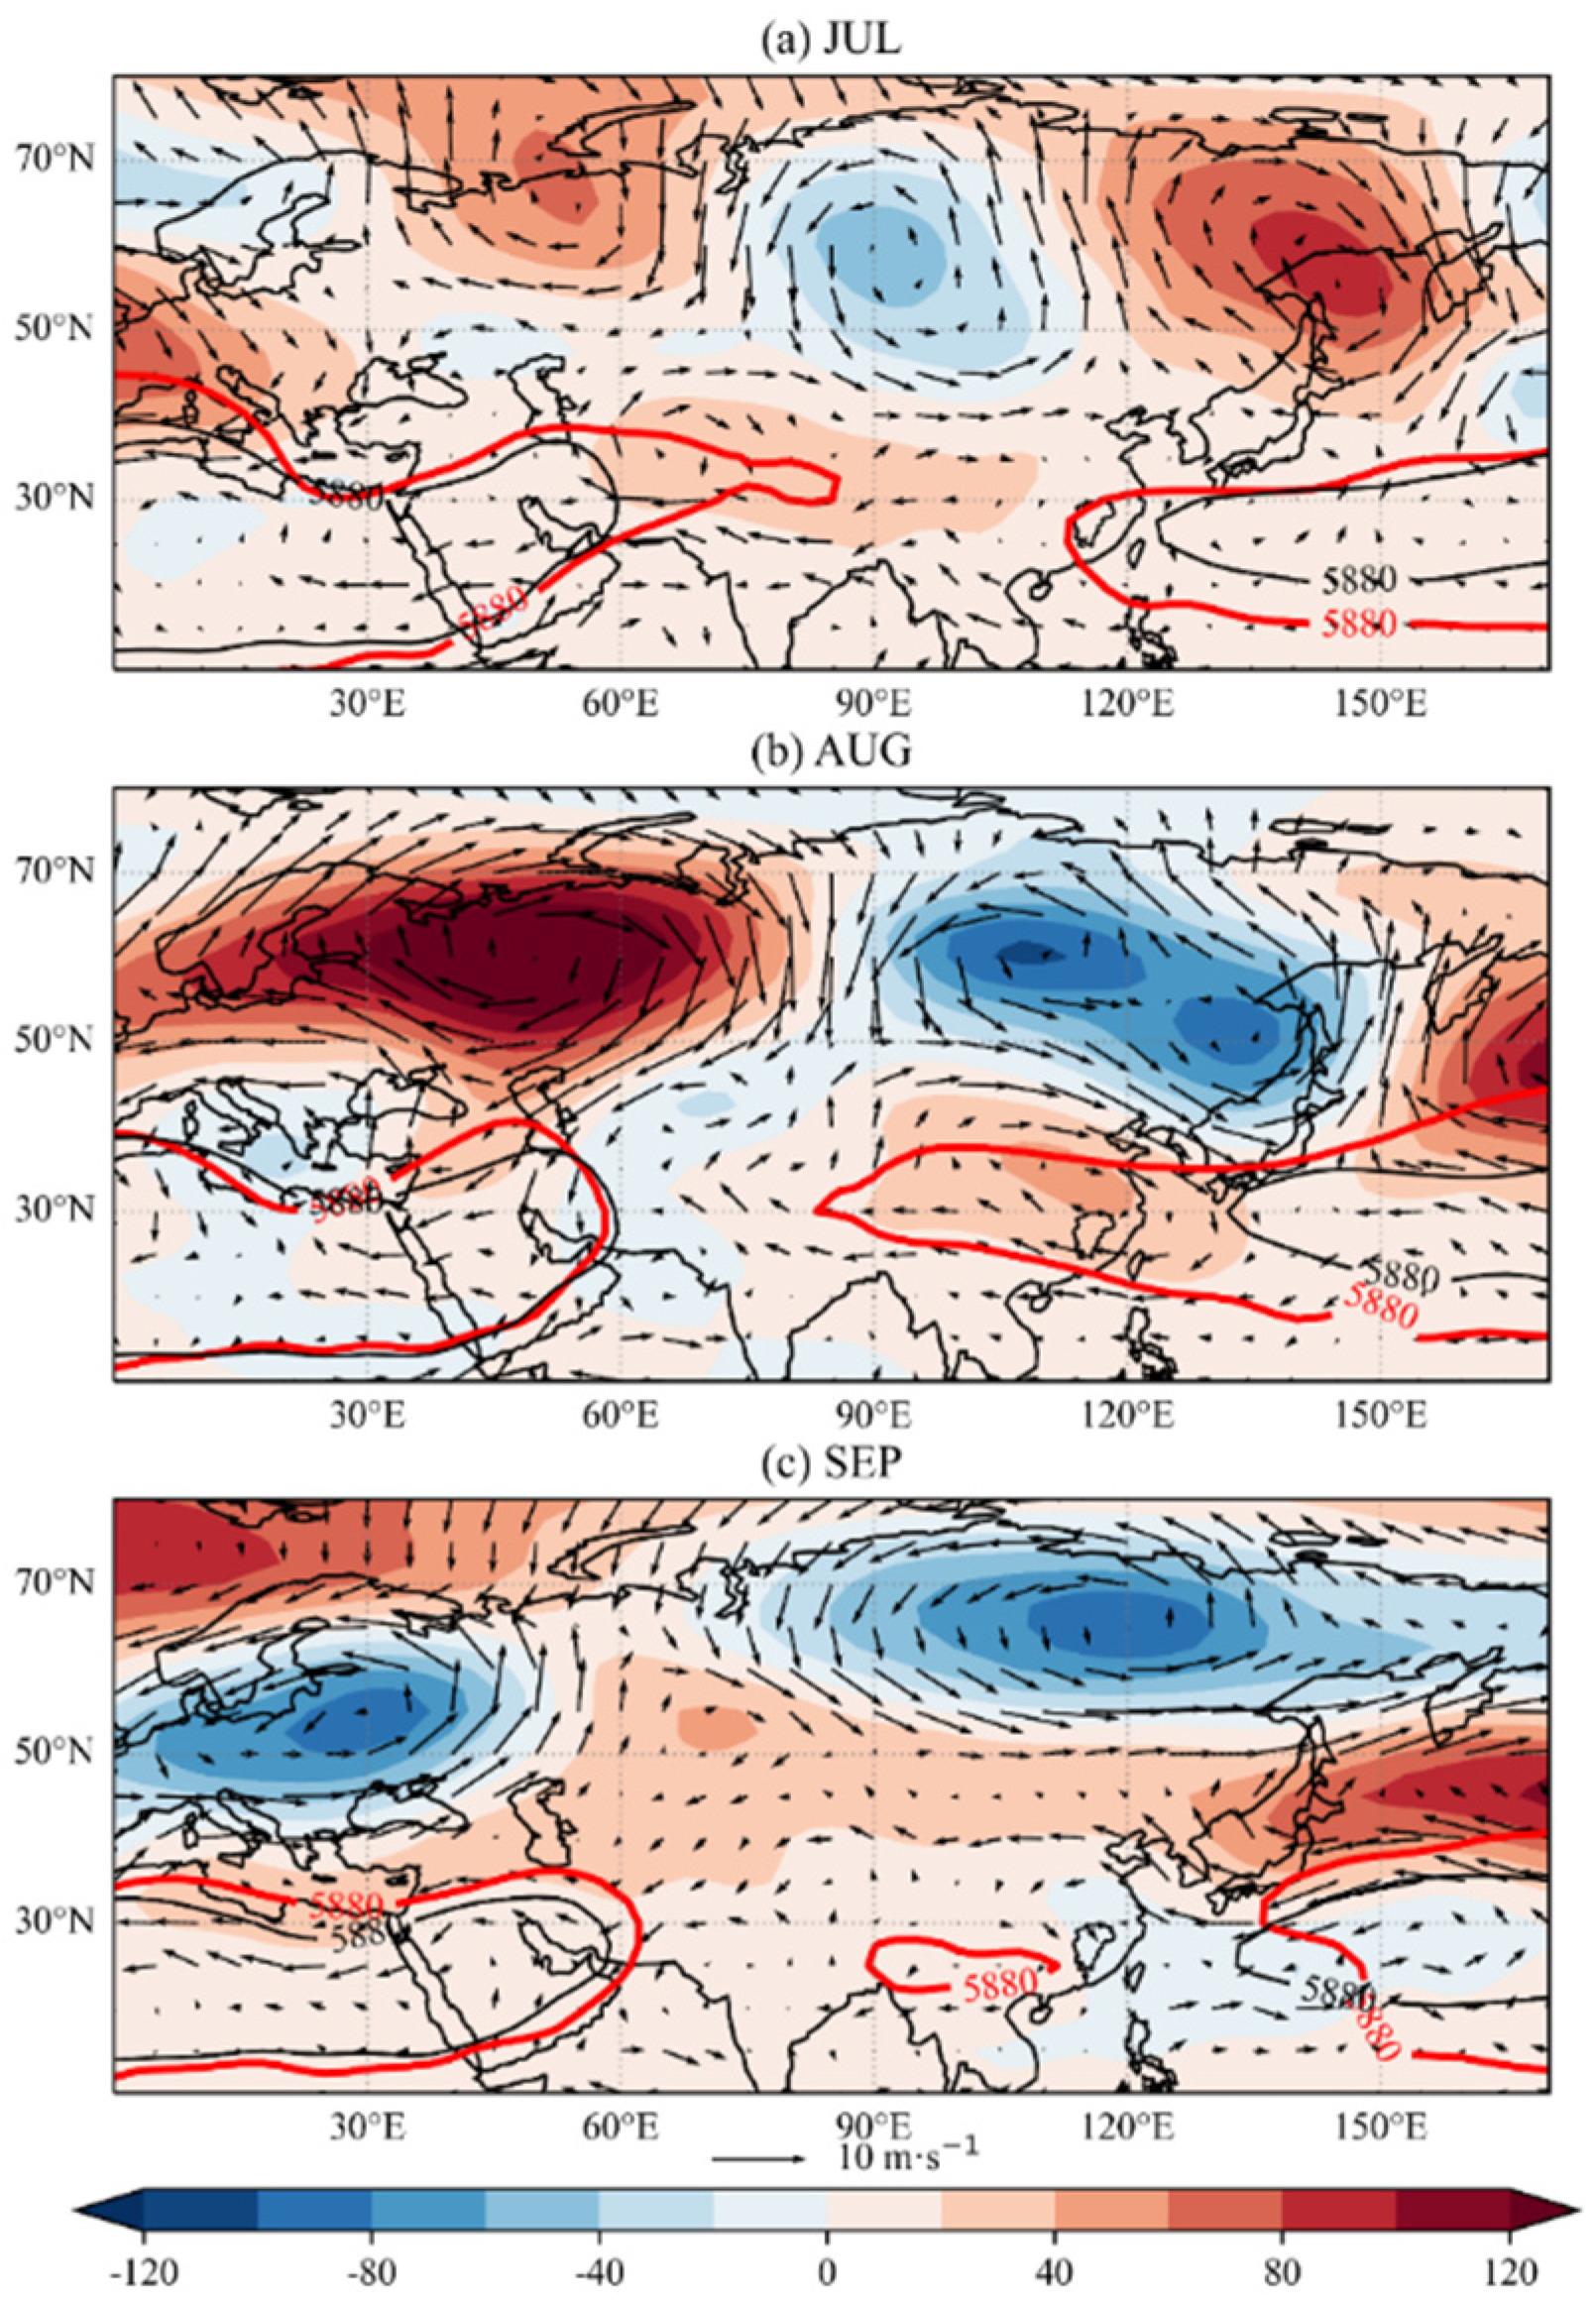
To analyze the upper-tropospheric circulation patterns, Figure 8 displays the monthly circulation anomalies at 200 hPa over the Eurasian continent during the high-temperature and drought disaster in Jiangxi from July to September 2022. The distribution of the 12,550 gpm isoline indicates that SAH was generally stronger than the climatological mean during this period.
In July, the SAH extended from 20° E to 130° E, almost covering southern China. It was located approximately 15 degrees of longitude east of its climatological position. However, its center was biased toward the Iranian Plateau, with a central intensity exceeding 12,600 gpm (Figure 8a). The geopotential height anomaly field reveals a pronounced anti-cyclonic anomaly over the northwestern Tibetan Plateau, indicating that the SAH in July 2022 was displaced northward. Another anti-cyclonic anomaly was present over the Bohai Sea region of China. Jiangxi was located south of this anti-cyclonic anomaly, experiencing weak easterly wind anomalies. In August, the SAH further intensified and its center shifted eastward over China, dominating most of the country. The center was located over central–western China, with a geopotential height reaching 12,650 gpm (Figure 8b). The geopotential height anomaly field shows a significant positive anomaly area over China, indicating that the SAH in August 2022 was more eastward and northward compared to the climatology. Jiangxi was situated in the southeastern part of this SAH. In September, the SAH center weakened somewhat and retreated westward to the south of the Tibetan Plateau (Figure 8c). The anomaly field indicates only weak positive geopotential height anomalies over Jiangxi, with correspondingly weak anomalous wind fields. This corresponds to the alleviation of the heatwave events in Jiangxi during September 2022.
The WPSH is a direct influence system for high-temperature and drought events in eastern China during summer, with its positional and intensity variations exhibiting certain coordinated characteristics with the upper-level SAH [21]. Accordingly, Figure 9 illustrates the monthly circulation anomalies at 500 hPa over the Eurasian continent during the high-temperature and drought period in 2022.
In July, the WPSH was situated farther west than its climatological position. Its ridge extended approximately 10 degrees of longitude westward compared to normal, reaching around 113° E, thereby placing the Jiangxi region under its direct influence (Figure 9a). Correspondingly, the prevailing subsidence developed over Jiangxi, inducing adiabatic heating and clear-sky conditions, which marked the onset of the high-temperature drought event. By August, the WPSH had developed to its peak intensity, extending further westward and northward, thereby dominating the entire Yangtze River Basin in China. Its ridge point shifted 48 degrees of longitude westward compared to the August climatology, reaching 85° E (Figure 9b). Compared to the climatological mean, a positive height anomaly center exceeding 40 gpm appeared over eastern China, indicating that the WPSH in 2022 extended significantly further west than usual. At this time, Jiangxi was entirely under the control of the WPSH, while the center of the SAH above also shifted eastward toward eastern China, forming a deep anomalous high-pressure center. An anti-cyclonic anomaly in the wind field was present over eastern China, with Jiangxi located at the bottom of this anti-cyclonic system. According to the thermal wind principle, heating (cooling) of the air column induces anti-cyclonic (cyclonic) circulation. Thus, the anomalous high-temperature center in the lower troposphere over eastern China contributed to this anti-cyclonic circulation. Correspondingly, consistent subsidence motion occurred over Jiangxi (Figure 4b), leading to persistent high-temperature and drought conditions in August.
In September, the WPSH anomaly split into two parts. The main body was located over the northwestern Pacific to the east, with its ridge position north of the climatological mean and a greater north–south span than usual, extending near Japan in the north. The western portion of WPSH was situated over South China, dominating the Guangxi and Yunnan regions. The geopotential height field over Jiangxi showed a weak negative anomaly relative to the climatology, placing it outside the direct control of the WPSH. Consequently, high-temperature conditions moderated somewhat in September.

3.4. Potential Driving Mechanisms

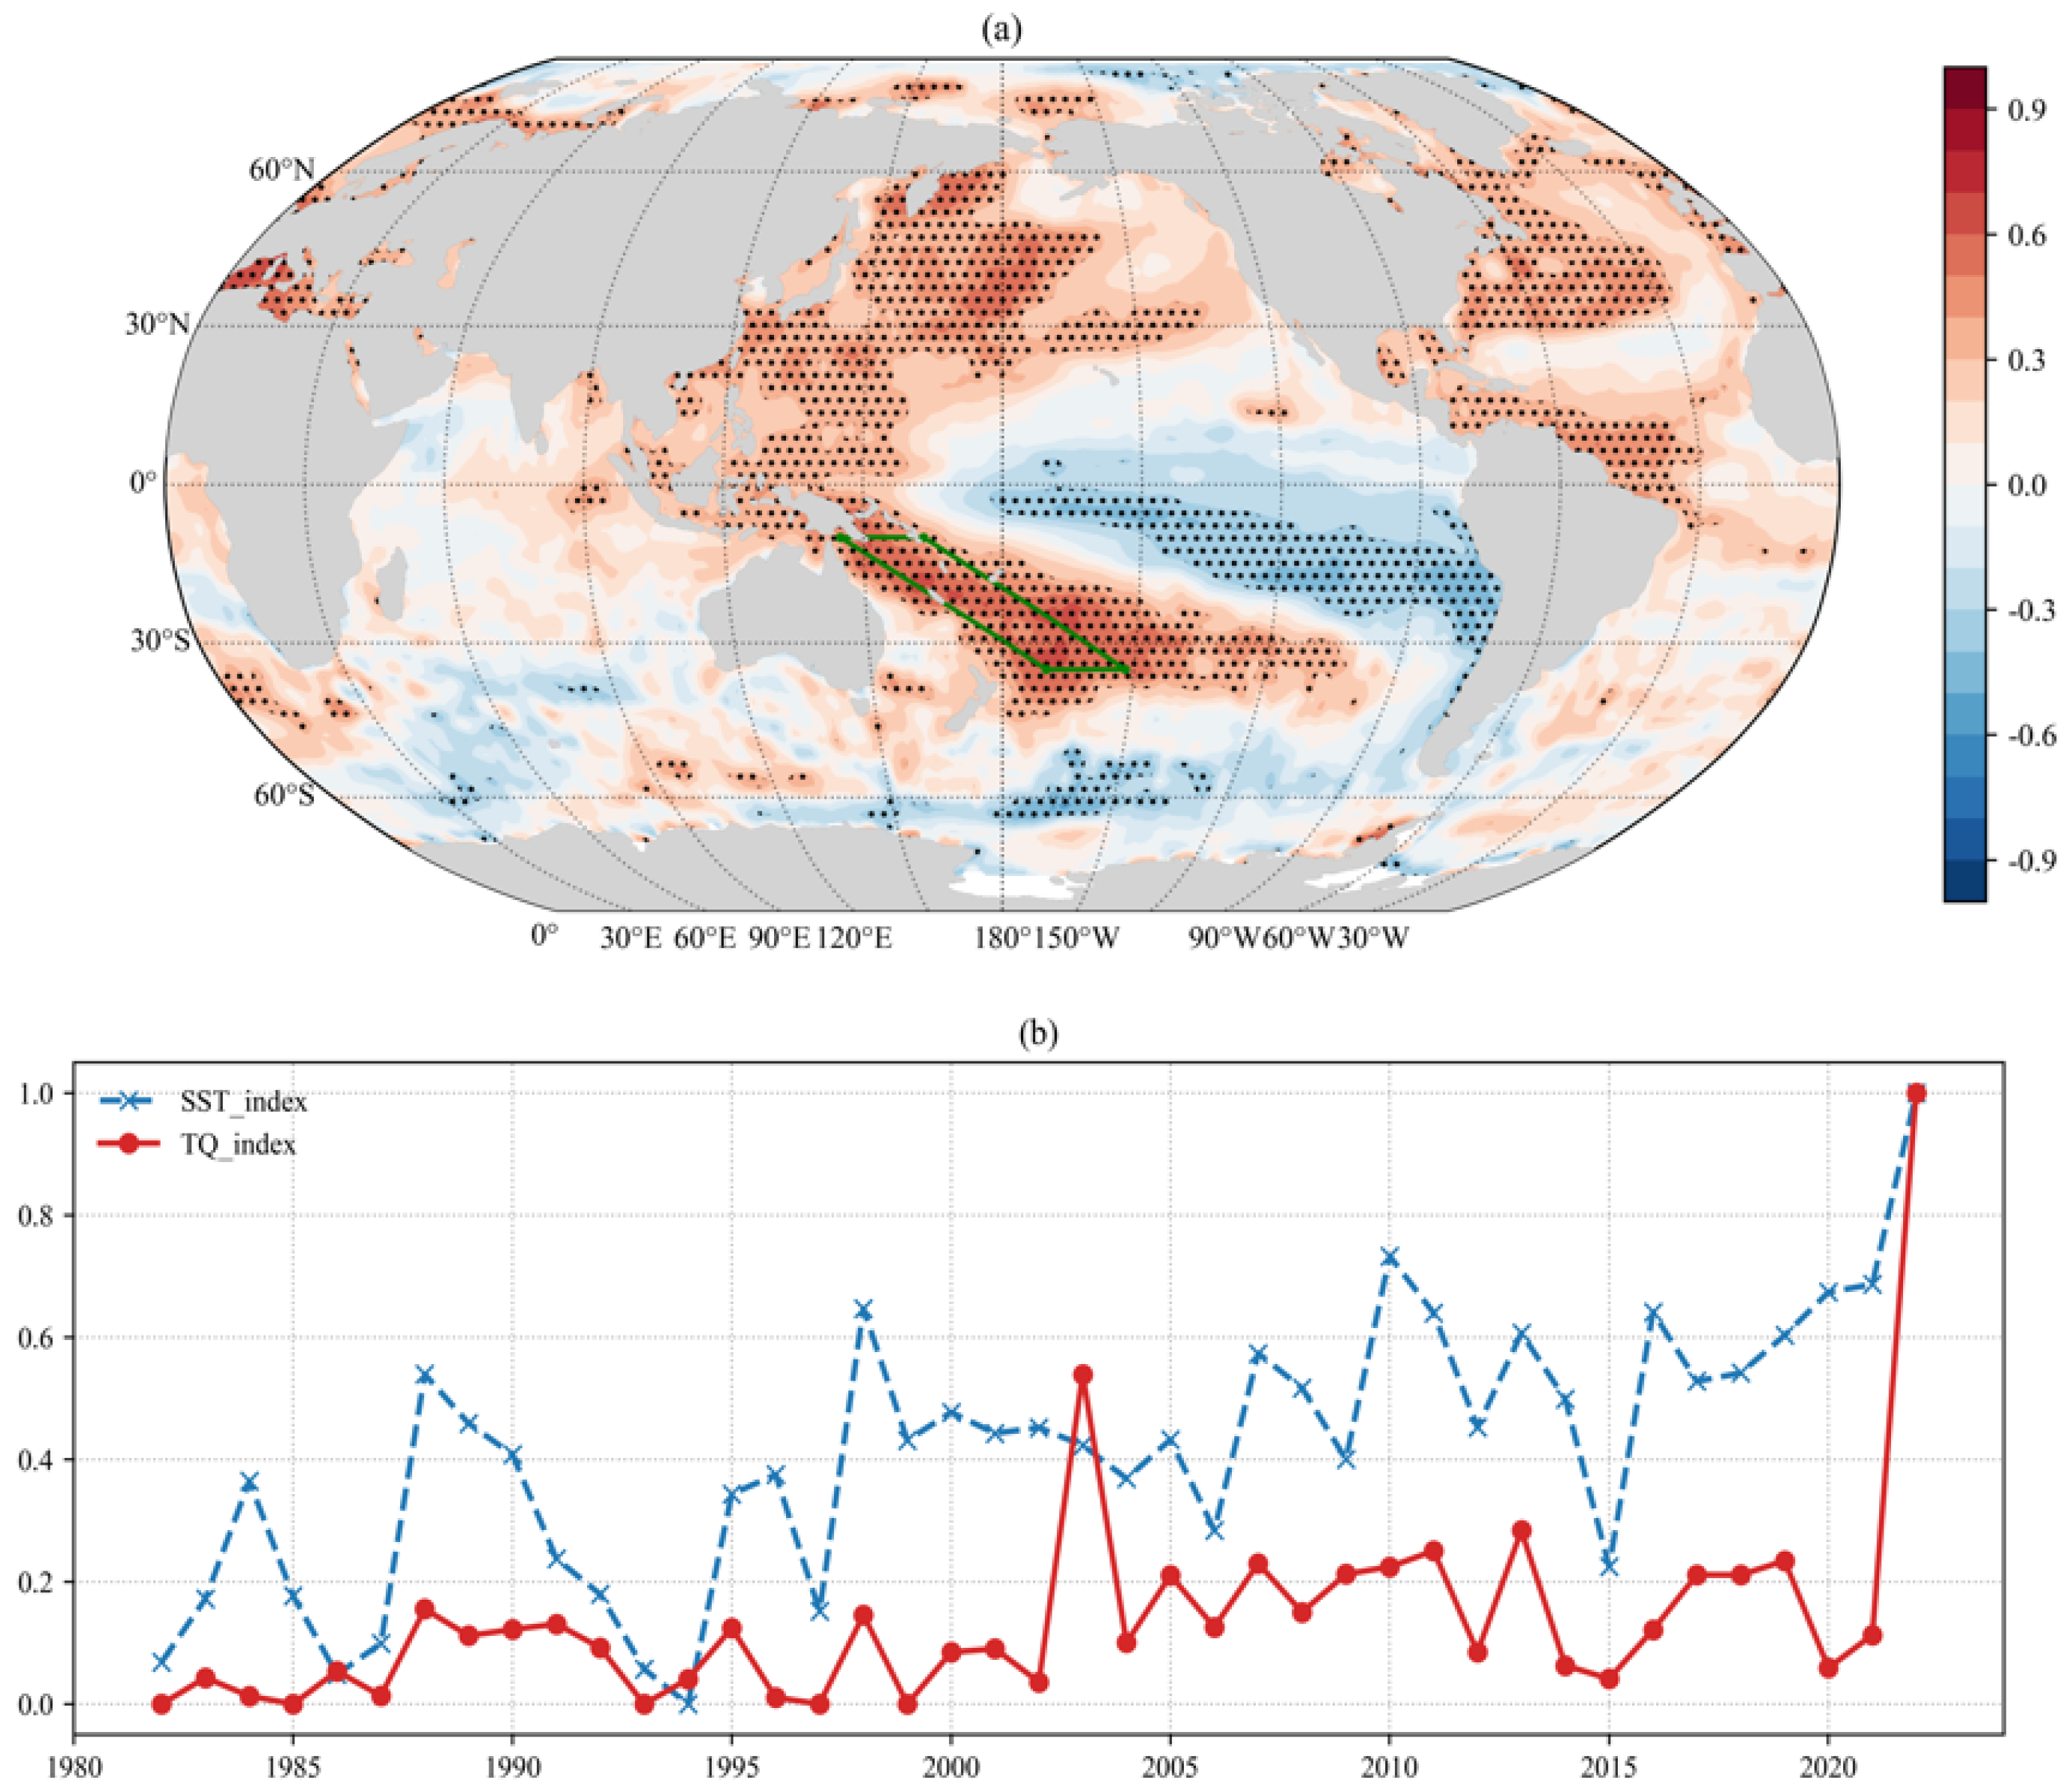
Given the close connection between the anomalous activity of the WPSH in summer and anomalous oceanic thermal conditions [11,22,23], correlation analysis was conducted between the high-temperature drought index for Jiangxi and SST to explore the potential formation mechanisms of this disaster (Figure 10a). The Jiangxi region is defined as 113.5–19° E, 24.5–30° N. Its high-temperature–drought index is defined as the standardized normalized number of high-temperature heatwave days (≥35 °C lasting more than three days) multiplied by the standardized normalized vertically integrated moisture flux divergence over Jiangxi.
Figure 10a shows the correlation analysis between the high-temperature drought index and the global SST field. Regions with significant correlations are primarily located in the Northwest Pacific, Southwest Pacific, Central–Eastern Pacific, Northwest Arctic Ocean, Mediterranean Sea, and other areas. In the western Pacific, the positive correlation area forms a “C” shape, with the highest correlation coefficients found over the Southwest Pacific warm pool region (statistically significant at 95% level). This suggests that the inter-annual variability of SST anomalies in the Southwest Pacific warm pool may be closely linked to the occurrence of summer high-temperature drought events in Jiangxi. The SST anomaly averaged over this region (green box in Figure 10a) was selected as the Southwest Pacific SST index. The temporal evolutions of both the high-temperature drought index and the Southwest Pacific SST index since 1982 are shown. Their inter-annual variations exhibit a strong consistency, with a correlation coefficient of 0.622 (statistically significant at 99% level). This indicates that SST variations in the Southwest Pacific are closely associated with temperature and precipitation changes in Jiangxi. Notably, during July–September 2022, both indices reached their highest values in more than four decades. This implies that the exceptionally high SST in the Southwest Pacific likely played an important role in driving the historically rare high-temperature heatwave and drought event in Jiangxi.
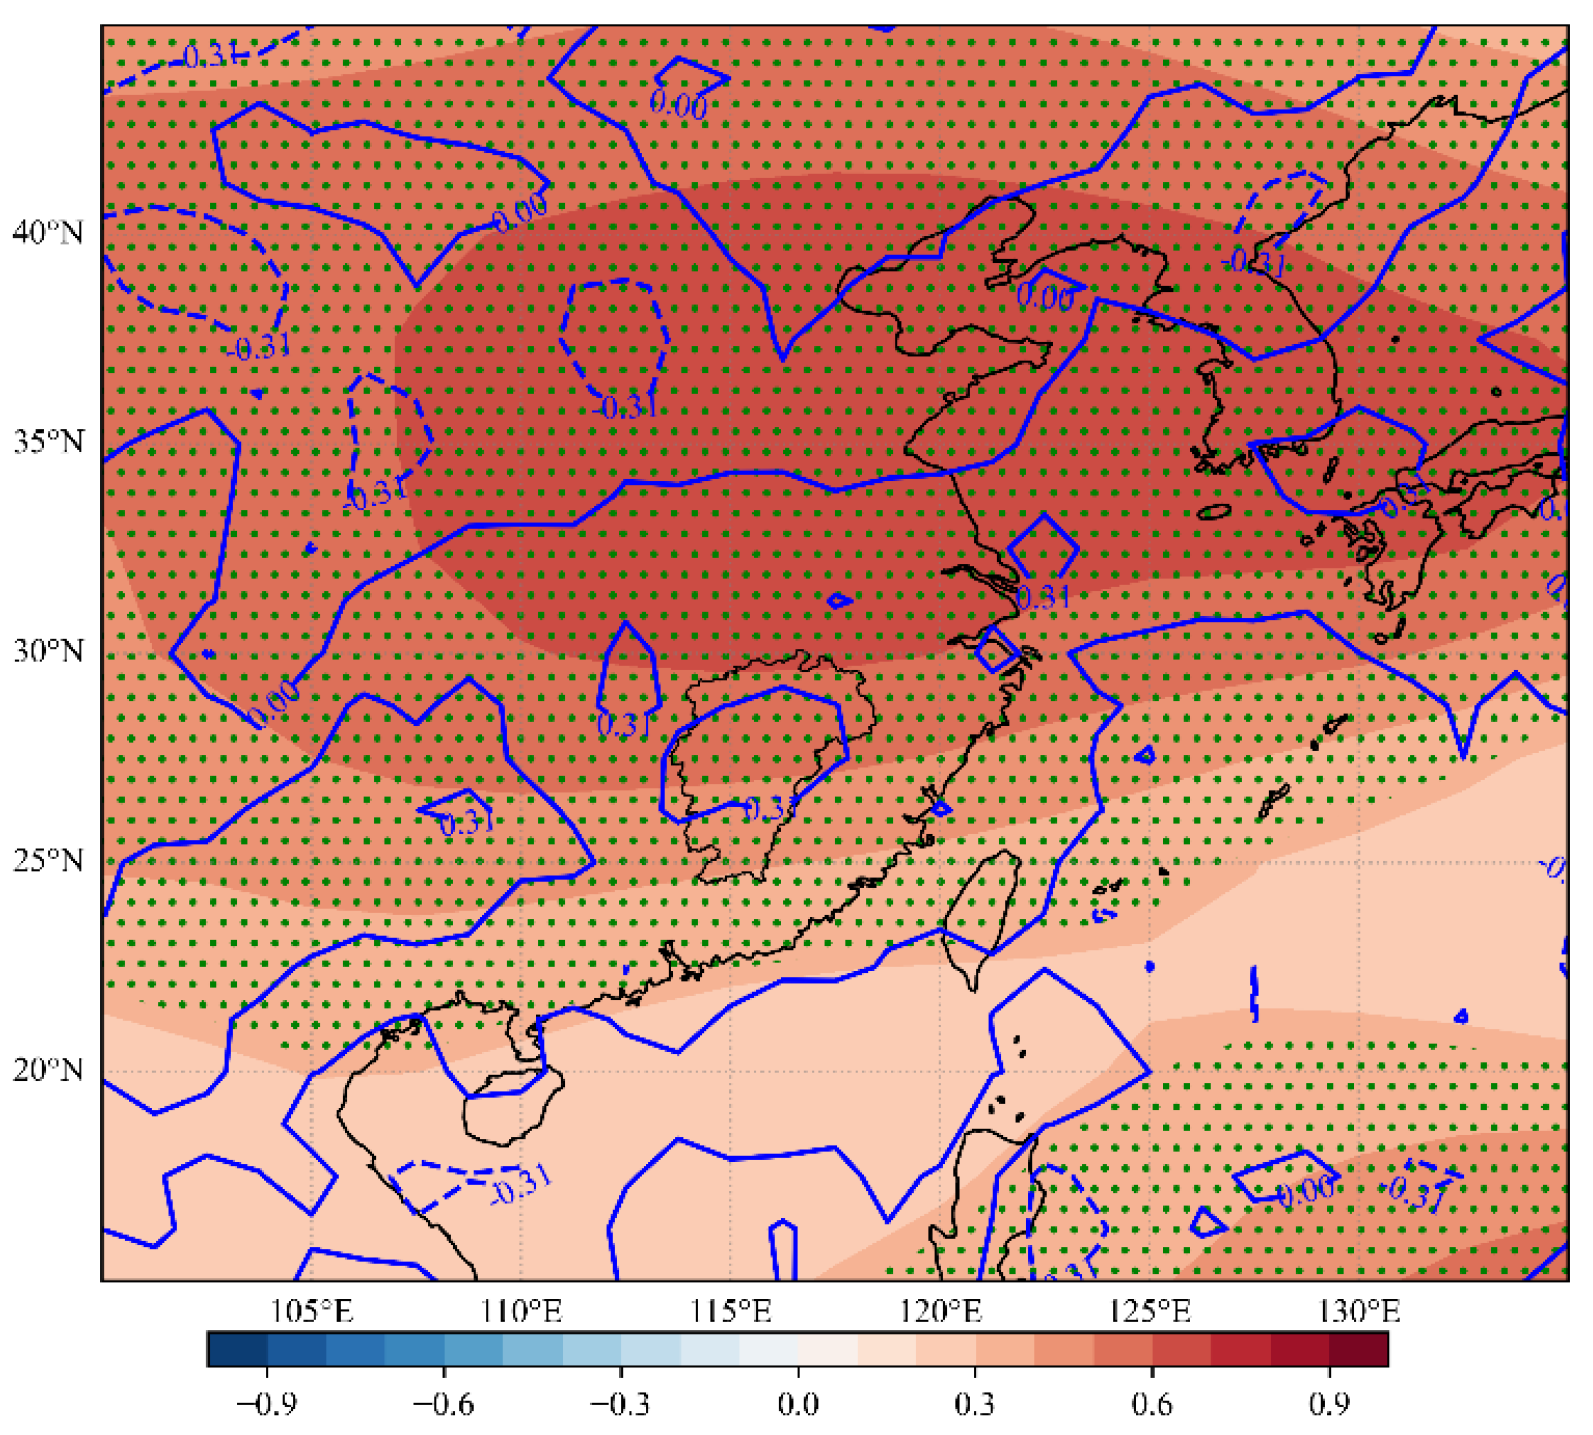
Additionally, the correlation between the Southwest Pacific SST index and the 500 hPa geopotential height field was calculated (Figure 11). The results reveal a significant positive correlation between the Southwest Pacific SST index and the 500 hPa geopotential height over most of eastern China. Specifically, the correlation coefficient reaches 0.6 in northern Jiangxi and 0.5 in southern Jiangxi, both are statistically significant at 90% level. This indicates a close association between the inter-annual variability of the Southwest Pacific SST index and the 500 hPa geopotential height field over China from July to September. When the SST in the Southwest Pacific is higher (lower), positive (negative) anomalies tend to occur in the 500 hPa geopotential height field over eastern China. Meanwhile, the Southwest Pacific SST index also shows a positive correlation with the contemporaneous vertically integrated moisture flux divergence over southern China, including most areas of Jiangxi. This suggests that as the Southwest Pacific SST index rises, moisture divergence over this region intensifies, which suppresses moisture convergence, upward motion, and precipitation formation.
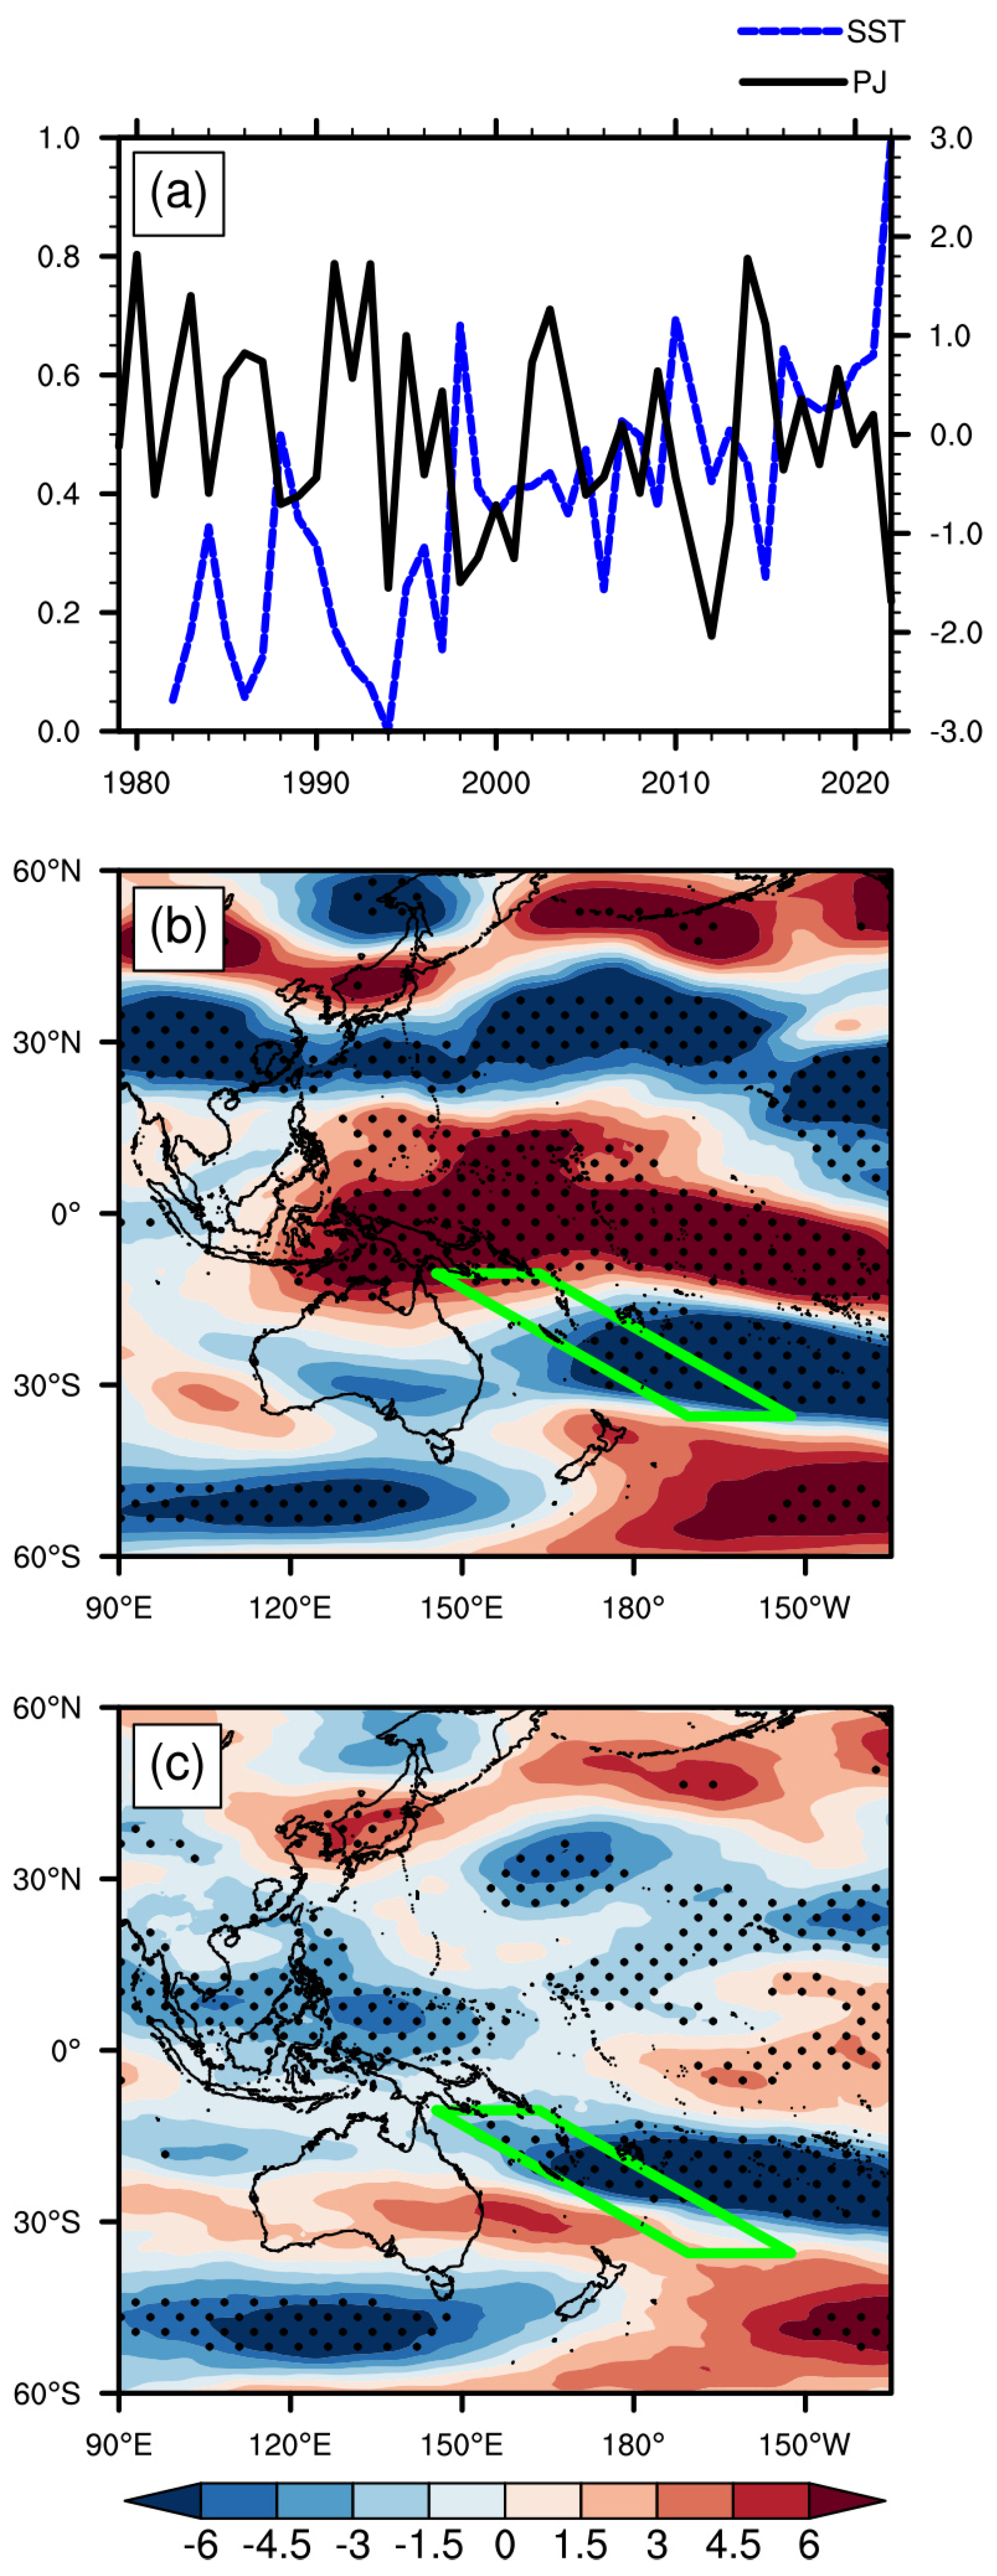
Previous analysis reveals that the summer high-temperature drought index in Jiangxi exhibits the most significant positive correlation with SST in the Southwest Pacific. This linkage may be attributed to anomalous convective heating over the summer warm pool in the Southwest Pacific, which excites the PJ teleconnection pattern [24], thereby modulating the East Asian summer circulation. The inter-annual variations in the summer PJ index and the Southwest Pacific SST index are shown in Figure 12a. The two indices exhibit a clear negative correlation, with a correlation coefficient of −0.44 (statistically significant at the 95% level), indicating a significant negative correlation. Notably, in the summer of 2022, when the Southwest Pacific SST index reached its highest value since 1982, the contemporaneous PJ index also dropped to its second-lowest value during the same period.
In order to examine the relationship between Southwest Pacific SST and the PJ pattern independent of other major climate signals, such as ENSO, we conducted a partial correlation analysis after removing the ENSO signal. The linear regression components associated with this ENSO signal were removed from both the summer PJ index and the Southwest Pacific SST index. Subsequently, the correlation coefficient between the two adjusted indices was calculated. Their correlation coefficient is −0.26 (statistically significant at the 90% level). This result indicates that while the ENSO signal can enhance the relationship between SST and the PJ pattern, these two remain correlated even after removing the ENSO regression component.
Furthermore, we regressed the August 500 hPa zonal wind anomalies onto the Southwest Pacific SST index (Figure 12c). It shows a quasi-meridional wave train of alternating negative and positive zonal wind anomalies (“– + –”) extending from the northwestern Pacific to the Okhotsk Sea. This spatial structure partially resembles the negative phase of PJ teleconnection pattern. Furthermore, positive 500 hPa geopotential height anomalies over the Southwest Pacific, as suggested by the zonal wind anomalies, may be associated with concurrent warm SST anomalies in the region. The result indicates that summer warming anomalies in the Southwest Pacific may significantly modulate PJ anomalous activity, thereby potentially exerting a teleconnection impact on climate anomalies over East Asia and the northwestern Pacific. It should be noted that the alternating negative–positive zonal wind anomalies (“– +”) between 15° N and 45° N correspond to the circulation configuration associated with a westward-extended and intensified WPSH in August—the peak period of the 2022 summer heatwave. As shown by the 200 hPa zonal wind anomalies (Figure 12b), negative geopotential height anomalies are present in the upper troposphere over the Southwest Pacific. This corresponds to the positive geopotential height anomalies in the lower troposphere (500 hPa), which are typically excited by warm SST anomalies. Correspondingly, the SAH intensifies and extends westward, and Jiangxi is thus situated on its southwestern margin. Meanwhile, latent heat released from condensation in subtropical regions can also propagate via stationary waves, contributing to the intensification of the SAH [25]. As a result, both the intensified and eastward-shifted SAH and the strengthened, westward-extended WPSH overlapped over southern China. This led to coherent upper-level geopotential height rises and subsidence warming over the Jiangxi region. Therefore, a potential mechanism for the persistent extreme high-temperature and drought event in Jiangxi from July to September 2022 involves anomalous warming in the Southwest Pacific exciting the PJ wave train. This, in turn, modulates the intensification of both the SAH and the WPSH, ultimately leading to the extreme compound event.
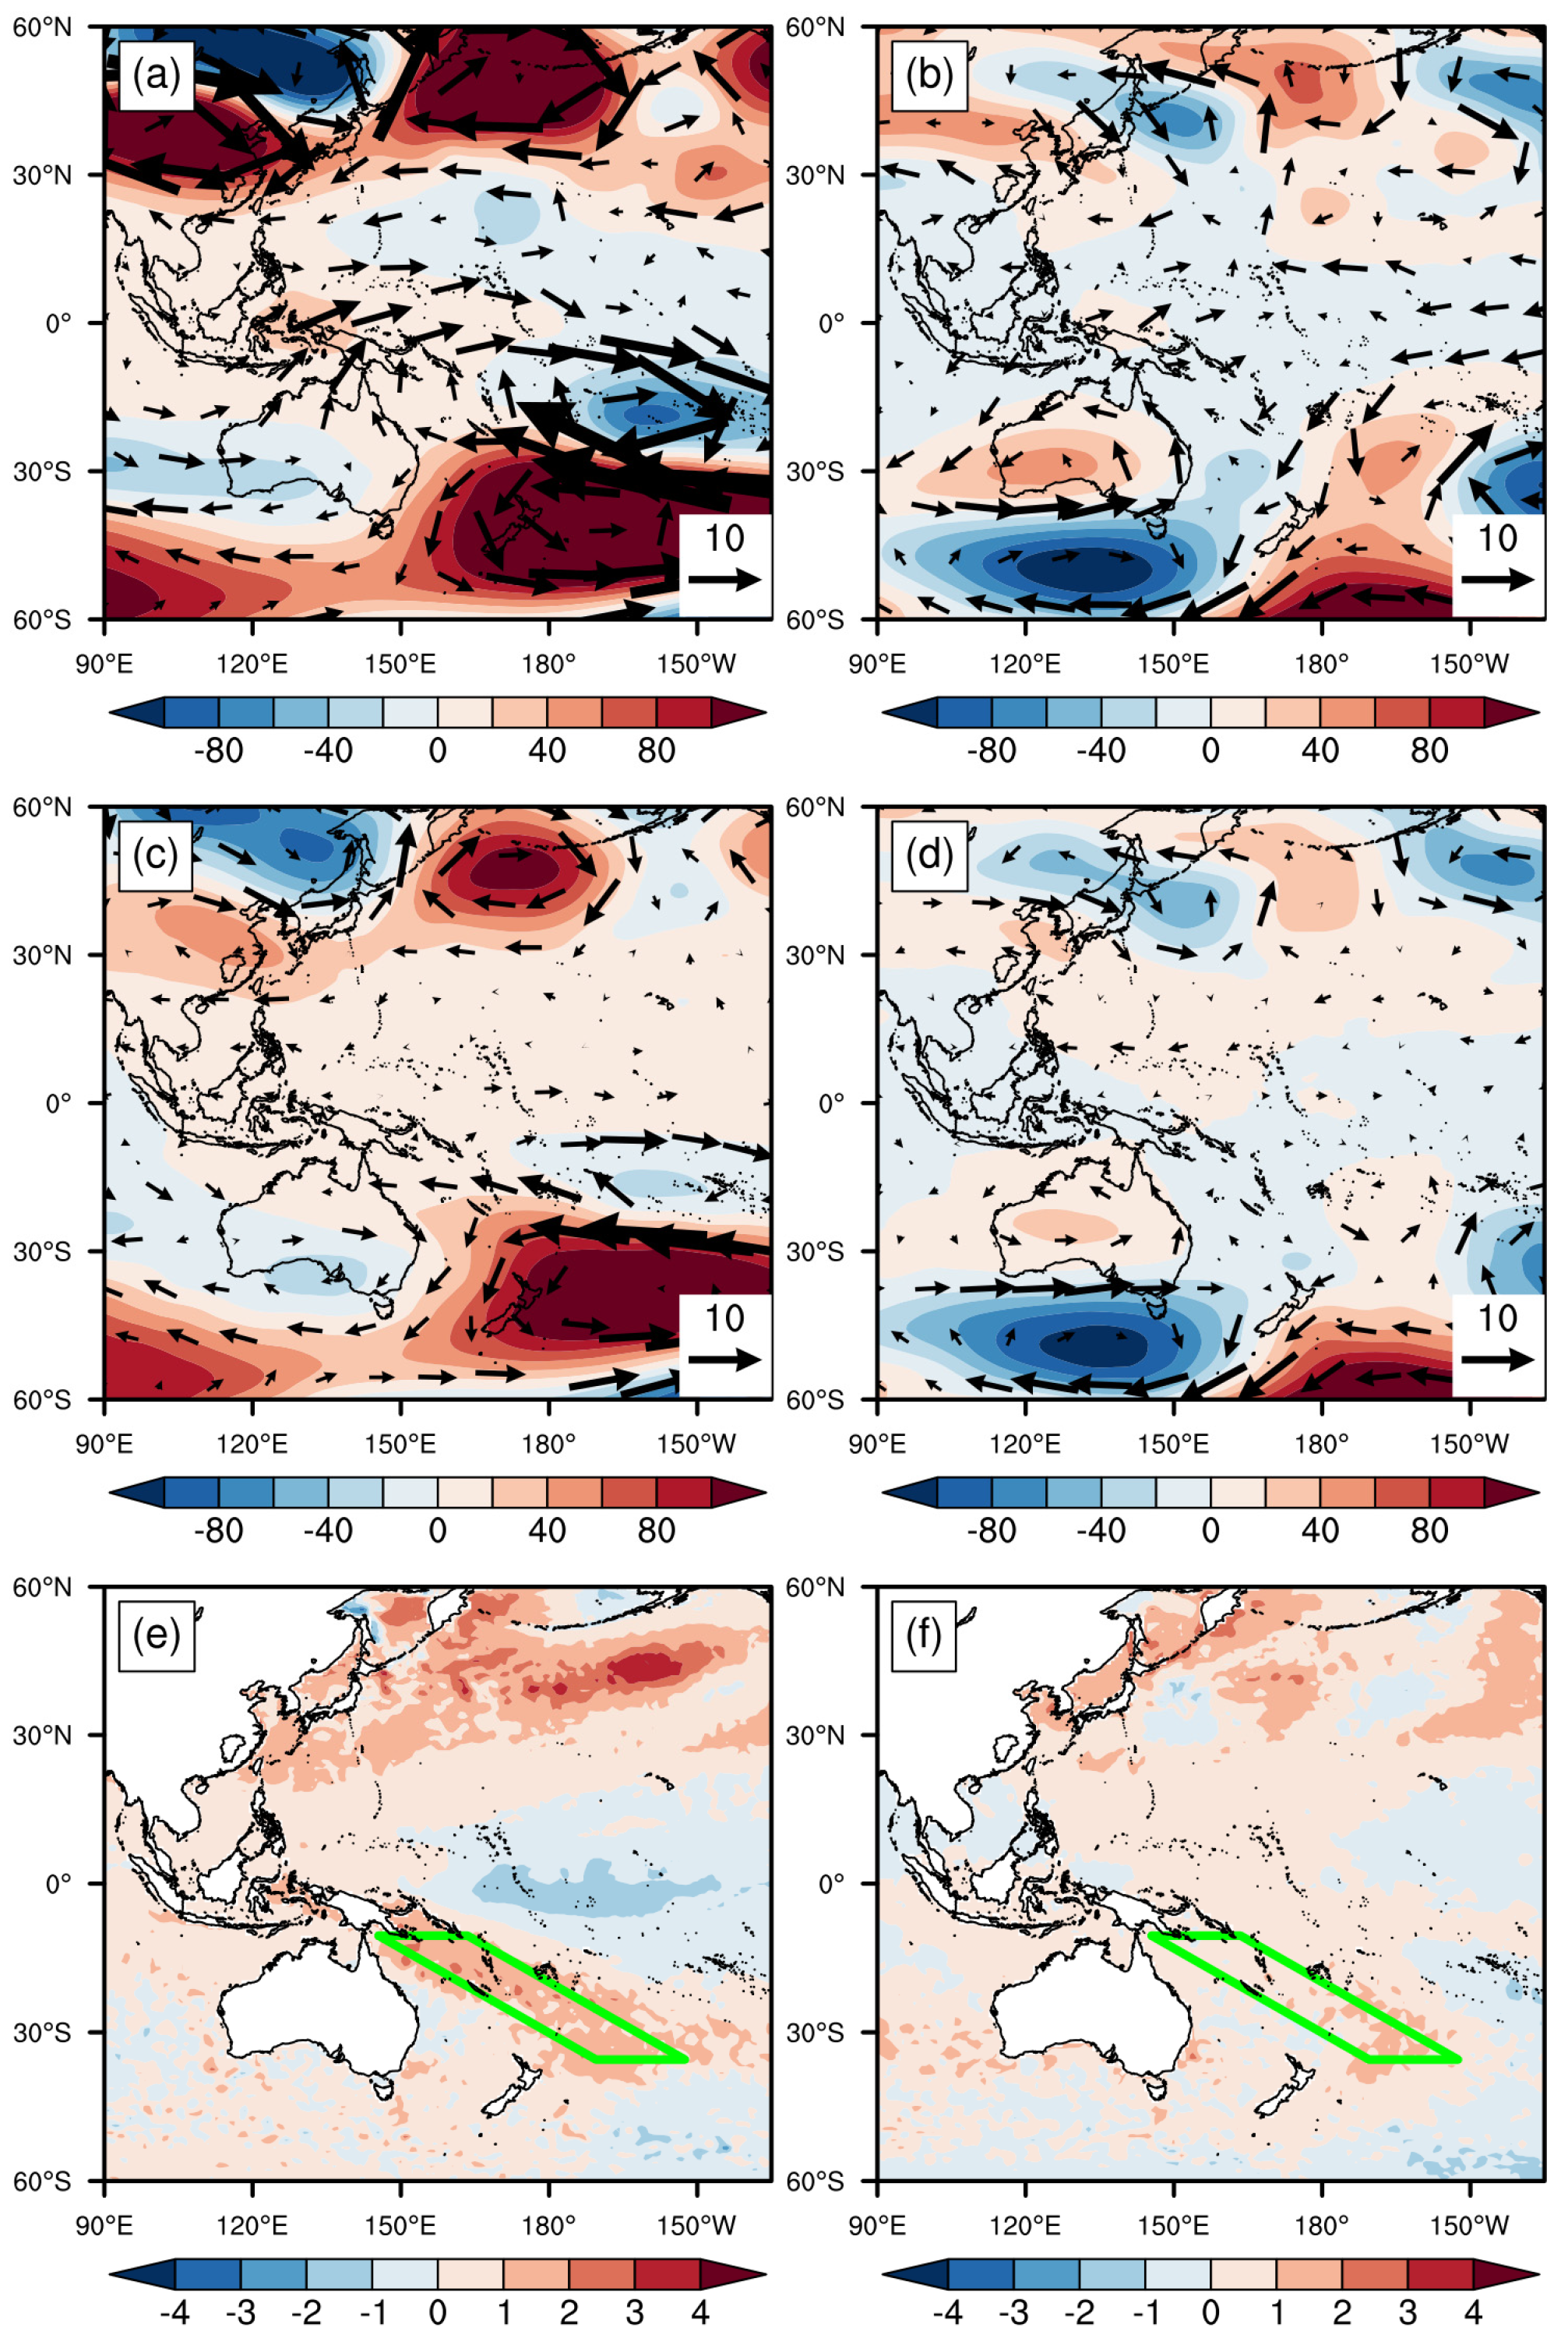
A heavy heatwave–drought compound event also occurred over the middle and lower reaches of the Yangtze River in August 2013. We compared two events, and Figure 13 presents the distributions of geopotential height, wind fields at different levels, and SST anomalies for August 2022 and August 2013. It can be seen that the geopotential height distribution in August 2022 (Figure 13a,c) is relatively consistent with the zonal wind anomaly results in Figure 12b,c. Furthermore, by comparing these two events, it is found that both August 2022 and August 2013 exhibit relatively similar negative phase of PJ patterns. However, in the August 2022 event, the warm SST anomalies over the Southwest Pacific were more pronounced. Wang et al. [11] noted that the high temperature and drought in the middle and lower reaches of the Yangtze River during the summer of 2013 were linked to the negative EAP/PJ teleconnection pattern, and pointed out that the positive SST anomalies in the equatorial western Pacific was an important factor in the long-term maintenance of the EAP/PJ teleconnection.

4. Conclusions and Discussion

From July to September 2022, Jiangxi province experienced a historically rare persistent heatwave and drought compound event. This study analyzed the fundamental characteristics of the high-temperature and drought, atmospheric circulation anomalies at different levels, and the potential driving mechanisms of external forcing on the Jiangxi region during this period. The main conclusions are as follows:
(1)
The high-temperature heatwave event in Jiangxi from July to September 2022 began in mid-July, peaked in August, and slightly moderated in September. The total number of heatwave days over the three months reached 43, far exceeding the historical average for the same period. Cumulative precipitation in most areas of Jiangxi was more than 60% below the climatological mean, with reductions exceeding 80% in eastern and northern Jiangxi. The intensity of the 2022 high-temperature drought disaster was the strongest in the past 44 years.
(2)
During July–September 2022, consistent subsidence and warming prevailed over most of Jiangxi, accompanied by predominantly divergent vertically integrated moisture flux. Moisture divergence was most severe in central and northern Jiangxi, and the anomalous moisture flux pattern exhibited an anti-cyclonic circulation. This configuration inhibited moisture convergence and upward motion, directly contributing to the high-temperature drought disaster.
(3)
Regarding circulation patterns, the SAH was persistently positioned farther east and was stronger than normal, with an anomalously larger area of influence. The 12,550 gpm contour consistently controlled the Jiangxi region. In August, the SAH was exceptionally eastward and northward, forming an anti-cyclonic anomaly over East Asia, with Jiangxi located in its southeastern part. Simultaneously, the WPSH was consistently stronger and located farther west than usual. The 5880 gpm contour controlled Jiangxi in July and August. In August, the WPSH extended over 48 degrees of longitude westward compared to its climatological position, completely covering Jiangxi. This led to strong subsidence anomalies in the middle and lower troposphere. The combined and persistent influence of the SAH and WPSH drove this extreme event.
(4)
A significant positive correlation exists between the Southwest Pacific Sea SST index and the high-temperature drought index for Jiangxi, with a correlation coefficient of 0.622. This indicates that the anomalously high SST in the Southwest Pacific from July to September 2022 may associated to the high-temperature drought conditions in Jiangxi. The high SST in the Southwest Pacific may have excited the anomalous PJ teleconnection wave train, which subsequently modulated and intensified both the SAH and the WPSH. This circulation pattern established prevailing subsidence over Jiangxi and likely limited moisture convergence and ascent, thereby playing a key role in the persistent extreme high-temperature and drought event in the region.
In summary, the unprecedented heatwave–drought compound event in Jiangxi during summer 2022 coincided with the synergistic effects of persistent large-scale circulation anomalies and external forcing, where the SST anomaly pattern over the Southwest Pacific may have played an important modulating role through its potential impact on the PJ teleconnection. Although this study found a possible association between Southwest Pacific warming and the extreme event, the causality involved, as well as its relevance to other heatwave–drought compound events, remain unclear. Future studies could further explore the possible influences of other teleconnection patterns and evaluate their relative contributions.

Author Contributions

Conceptualization, Y.K.; Formal analysis, Y.L., Y.K. and C.W.; Supervision, C.L.; Writing—original draft, Y.K. and C.W., Y.Q. and S.Y. All authors have read and agreed to the published version of the manuscript.

Funding

This research was jointly funded by Open Fund Project of Key Laboratory of Cities’ Mitigation and Adaptation to Climate Change in Shanghai (CMACCOF202505) and Wuxi University Research Start-up Fund for High-level Talents (2025r061).

Institutional Review Board Statement

Not applicable.

Informed Consent Statement

Not applicable.

Data Availability Statement

ERA5 reanalysis data are available from the European Centre for Medium-Range Weather Forecasts (ECMWF, Hersbach et al., 2020 [15], https://cds.climate.copernicus.eu/datasets/reanalysis-era5-single-levels?tab=overview (accessed on 1 January 2025), or https://cds.climate.copernicus.eu/datasets/reanalysis-era5-pressure-levels?tab=overview (accessed on1 January 2025)). Monthly SST data are available from the National Oceanic and Atmospheric Administration (NOAA) high-resolution Blended Analysis (Reynolds et al., 2007 [16], https://psl.noaa.gov/data/gridded/data.noaa.oisst.v2.highres.html (accessed on 1 January 2025)). NDVI data are available from https://doi.org/10.3334/ORNLDAAC/2187 (accessed on 1 January 2025). Niño 3.4 data are available from https://psl.noaa.gov/data/correlation/nina34.data (accessed on 8 February 2026).

Conflicts of Interest

The authors declare no conflicts of interest.

Abbreviations

The following abbreviations are used in this manuscript:
SAHSouth Asian High
WPSHWestern Pacific Subtropical High
PJPacific-Japan teleconnection pattern

References

  1. IPCC. Climate Change 2021: The Physical Science Basis. Contribution of Working Group I to the Sixth Assessment Report of the Intergovernmental Panel on Climate Change; Masson-Delmotte, V., Zhai, P., Pirani, A., Connors, S.L., Péan, C., Berger, S., Caud, N., Chen, Y., Goldfarb, L., Gomis, M.I., et al., Eds.; Cambridge University Press: Cambridge, UK; New York, NY, USA, 2021; in press. [Google Scholar] [CrossRef] [Scilit]
  2. Grotjahn, R.; Barlow, M.; Black, R.; Cavazos, T.; Gutowski, W.; Gyakum, J.; Katz, R.; Kumar, A.; Leung, L.; Schumacher, R.; et al. Workshop on Analyses, Dynamics, and Modeling of Large-Scale Meteorological Patterns Associated with Extreme Temperature and Precipitation Events; NCAR Report: Boulder, CO, USA, 2014. [Google Scholar] [CrossRef] [Scilit]
  3. Alexander, L. Extreme heat rooted in dry soils. Nat. Geosci. 2011, 4, 12–13. [Google Scholar] [CrossRef] [Scilit]
  4. Lu, C.; Ye, J.; Wang, S.; Yang, M.; Li, Q.; He, W.; Qin, Y.; Cai, J.; Mao, J. An unusual heat wave in North China during midsummer, 2018. Front. Earth Sci. 2020, 8, 238. [Google Scholar] [CrossRef] [Scilit]
  5. Ding, T.; Qian, W.; Yan, Z. Changes in hot days and heat waves in China during 1961–2007. Int. J. Climatol. 2010, 30, 1452–1462. [Google Scholar] [CrossRef] [Scilit]
  6. Zhao, Z.-Q.; Li, L.-G.; Wang, H.-B.; Zhao, X.-L.; Wan, Z.-H.; Dong, G.-P. Characteristics of number of high temperature days and heat wave from 1961 to 2010 in Liaoning province. J. Meteorol. Environ. 2014, 30, 57–61. (In Chinese) [Google Scholar] [CrossRef]
  7. Yu, R.; Zhai, P. Changes in compound drought and hot extreme events in summer over populated eastern China. Weather Clim. Extrem. 2020, 30, 100295. [Google Scholar] [CrossRef] [Scilit]
  8. Sun, F.; Mejia, A.; Zeng, P.; Che, Y. Projecting meteorological, hydrological and agricultural droughts for the Yangtze River basin. Sci. Total Environ. 2019, 696, 134076. [Google Scholar] [CrossRef] [Scilit]
  9. Ukkola, A.M.; De Kauwe, M.G.; Roderick, M.L.; Abramowitz, G.; Pitman, A.J. Robust future changes in meteorological drought in CMIP6 projections despite uncertainty in precipitation. Geophys. Res. Lett. 2020, 47, e2020GL087820. [Google Scholar] [CrossRef] [Scilit]
  10. Deng, Z.; Wen, X.; Huang, T.; Zhang, H.; Xi, L.; Xu, J.; Dong, A. The difference and connection between drought and heat waves. Plateau Meteorol. 2009, 28, 702–709. (In Chinese) [Google Scholar]
  11. Wang, W.; Xu, J.; Cai, X.; Sun, C. Analysis of atmospheric circulation characteristics and mechanism of heat wave and drought in summer of 2013 over the middle and lower reaches of Yangtze River Basin. Plateau Meteorol. 2017, 36, 1595–1607. (In Chinese) [Google Scholar] [CrossRef]
  12. Chen, R.; Wen, Z.; Lu, R.; Wang, C. Causes of the extreme hot midsummer in central and South China during 2017: Role of the western tropical Pacific warming. Adv. Atmos. Sci. 2019, 36, 465–478. [Google Scholar] [CrossRef] [Scilit]
  13. Xia, Z.; Liu, M.; Qin, P.; Fan, J.; Feng, Y.; Zhao, X. Assessment of High Temperature and Drought Processes and Their Impact in the Yangtze River Basin in 2022. Yangtze River 2023, 54, 21–28. [Google Scholar] [CrossRef]
  14. Qin, Y.; Qin, Y.; Shen, Y.; Li, Y.; Xiang, B. Numerical study on the effects of intraseasonal oscillations for a persistent drought and hot event in South China summer 2022. Remote Sens. 2023, 15, 892. [Google Scholar] [CrossRef] [Scilit]
  15. Hersbach, H.; Bell, B.; Berrisford, P.; Hirahara, S.; Horányi, A.; Muñoz-Sabater, J.; Nicolas, J.; Peubey, C.; Radu, R.; Schepers, D.; et al. The ERA5 global reanalysis. Q. J. R. Meteorol. Soc. 2020, 146, 1999–2049. [Google Scholar] [CrossRef] [Scilit]
  16. Reynolds, R.W.; Smith, T.M.; Liu, C.; Chelton, D.B.; Casey, K.S.; Schlax, M.G. Daily high-resolution-blended analyses for sea surface temperature. J. Clim. 2007, 20, 5473–5496. [Google Scholar] [CrossRef] [Scilit]
  17. Pinzon, J.E.; Pak, E.W.; Tucker, C.J.; Bhatt, U.S.; Frost, G.V.; Macander, M.J. Global Vegetation Greenness (NDVI) from AVHRR GIMMS-3G+, 1981–2022; ORNL DAAC: Oak Ridge, TN, USA, 2023. [CrossRef]
  18. Zan, Y.; Gao, Y.; Jiang, Y.; Pan, Y.; Li, X.; Su, P. The effects of lake level and area changes of Poyang Lake on the local weather. Atmosphere 2022, 13, 1490. [Google Scholar] [CrossRef] [Scilit]
  19. Hua, W.; Dai, A.; Qin, M.; Hu, Y.; Cui, Y. How unexpected was the 2022 summertime heat extremes in the middle reaches of the Yangtze River? Geophys. Res. Lett. 2023, 50, e2023GL104269. [Google Scholar] [CrossRef] [Scilit]
  20. Gong, H.; Ma, K.; Hu, Z.; Dong, Z.; Ma, Y.; Chen, W.; Wu, R.; Wang, L. Attribution of the August 2022 extreme heatwave in Southern China: Role of dynamical and thermodynamical processes. Bull. Am. Meteorol. Soc. 2024, 105, E193–E199. [Google Scholar] [CrossRef] [Scilit]
  21. Tao, S.Y.; Zhu, F.K. The 100-mb flow patterns in southern Asia in summer and its relation to the advance and retreat of the West-Pacific subtropical anticyclone over the Far East. Acta Meteorol. Sin. 1964, 34, 385–396. (In Chinese) [Google Scholar]
  22. Chang, C.P.; Zhang, Y.; Li, T. Interannual and interdecadal variations of the East Asian summer monsoon and tropical Pacific SSTs. Part I: Roles of the subtropical ridge. J. Clim. 2000, 13, 4310–4325. [Google Scholar] [CrossRef] [Scilit]
  23. Zhou, L.; Xia, Y.; Zhou, C.; Zhao, C.; Xie, F.; Dong, L. Sensitivity of western Pacific subtropical high to regional sea surface temperature changes. Glob. Planet. Change 2024, 242, 104565. [Google Scholar] [CrossRef] [Scilit]
  24. Nitta, T. Convective activities in the tropical western Pacific and their impact on the Northern Hemisphere summer circulation. J. Meteorol. Soc. Jpn. Ser. II 1987, 65, 373–390. [Google Scholar] [CrossRef] [Scilit]
  25. Liu, Y.M.; Wu, G.X.; Liu, H.; Liu, P. The effect of spatially nonuniform heating on the formation and variation of subtropical high part III: Condensation heating and South Asia high and western Pacific subtropical high. Acta Meteor. Sin. 1999, 57, 525–538. (In Chinese) [Google Scholar]
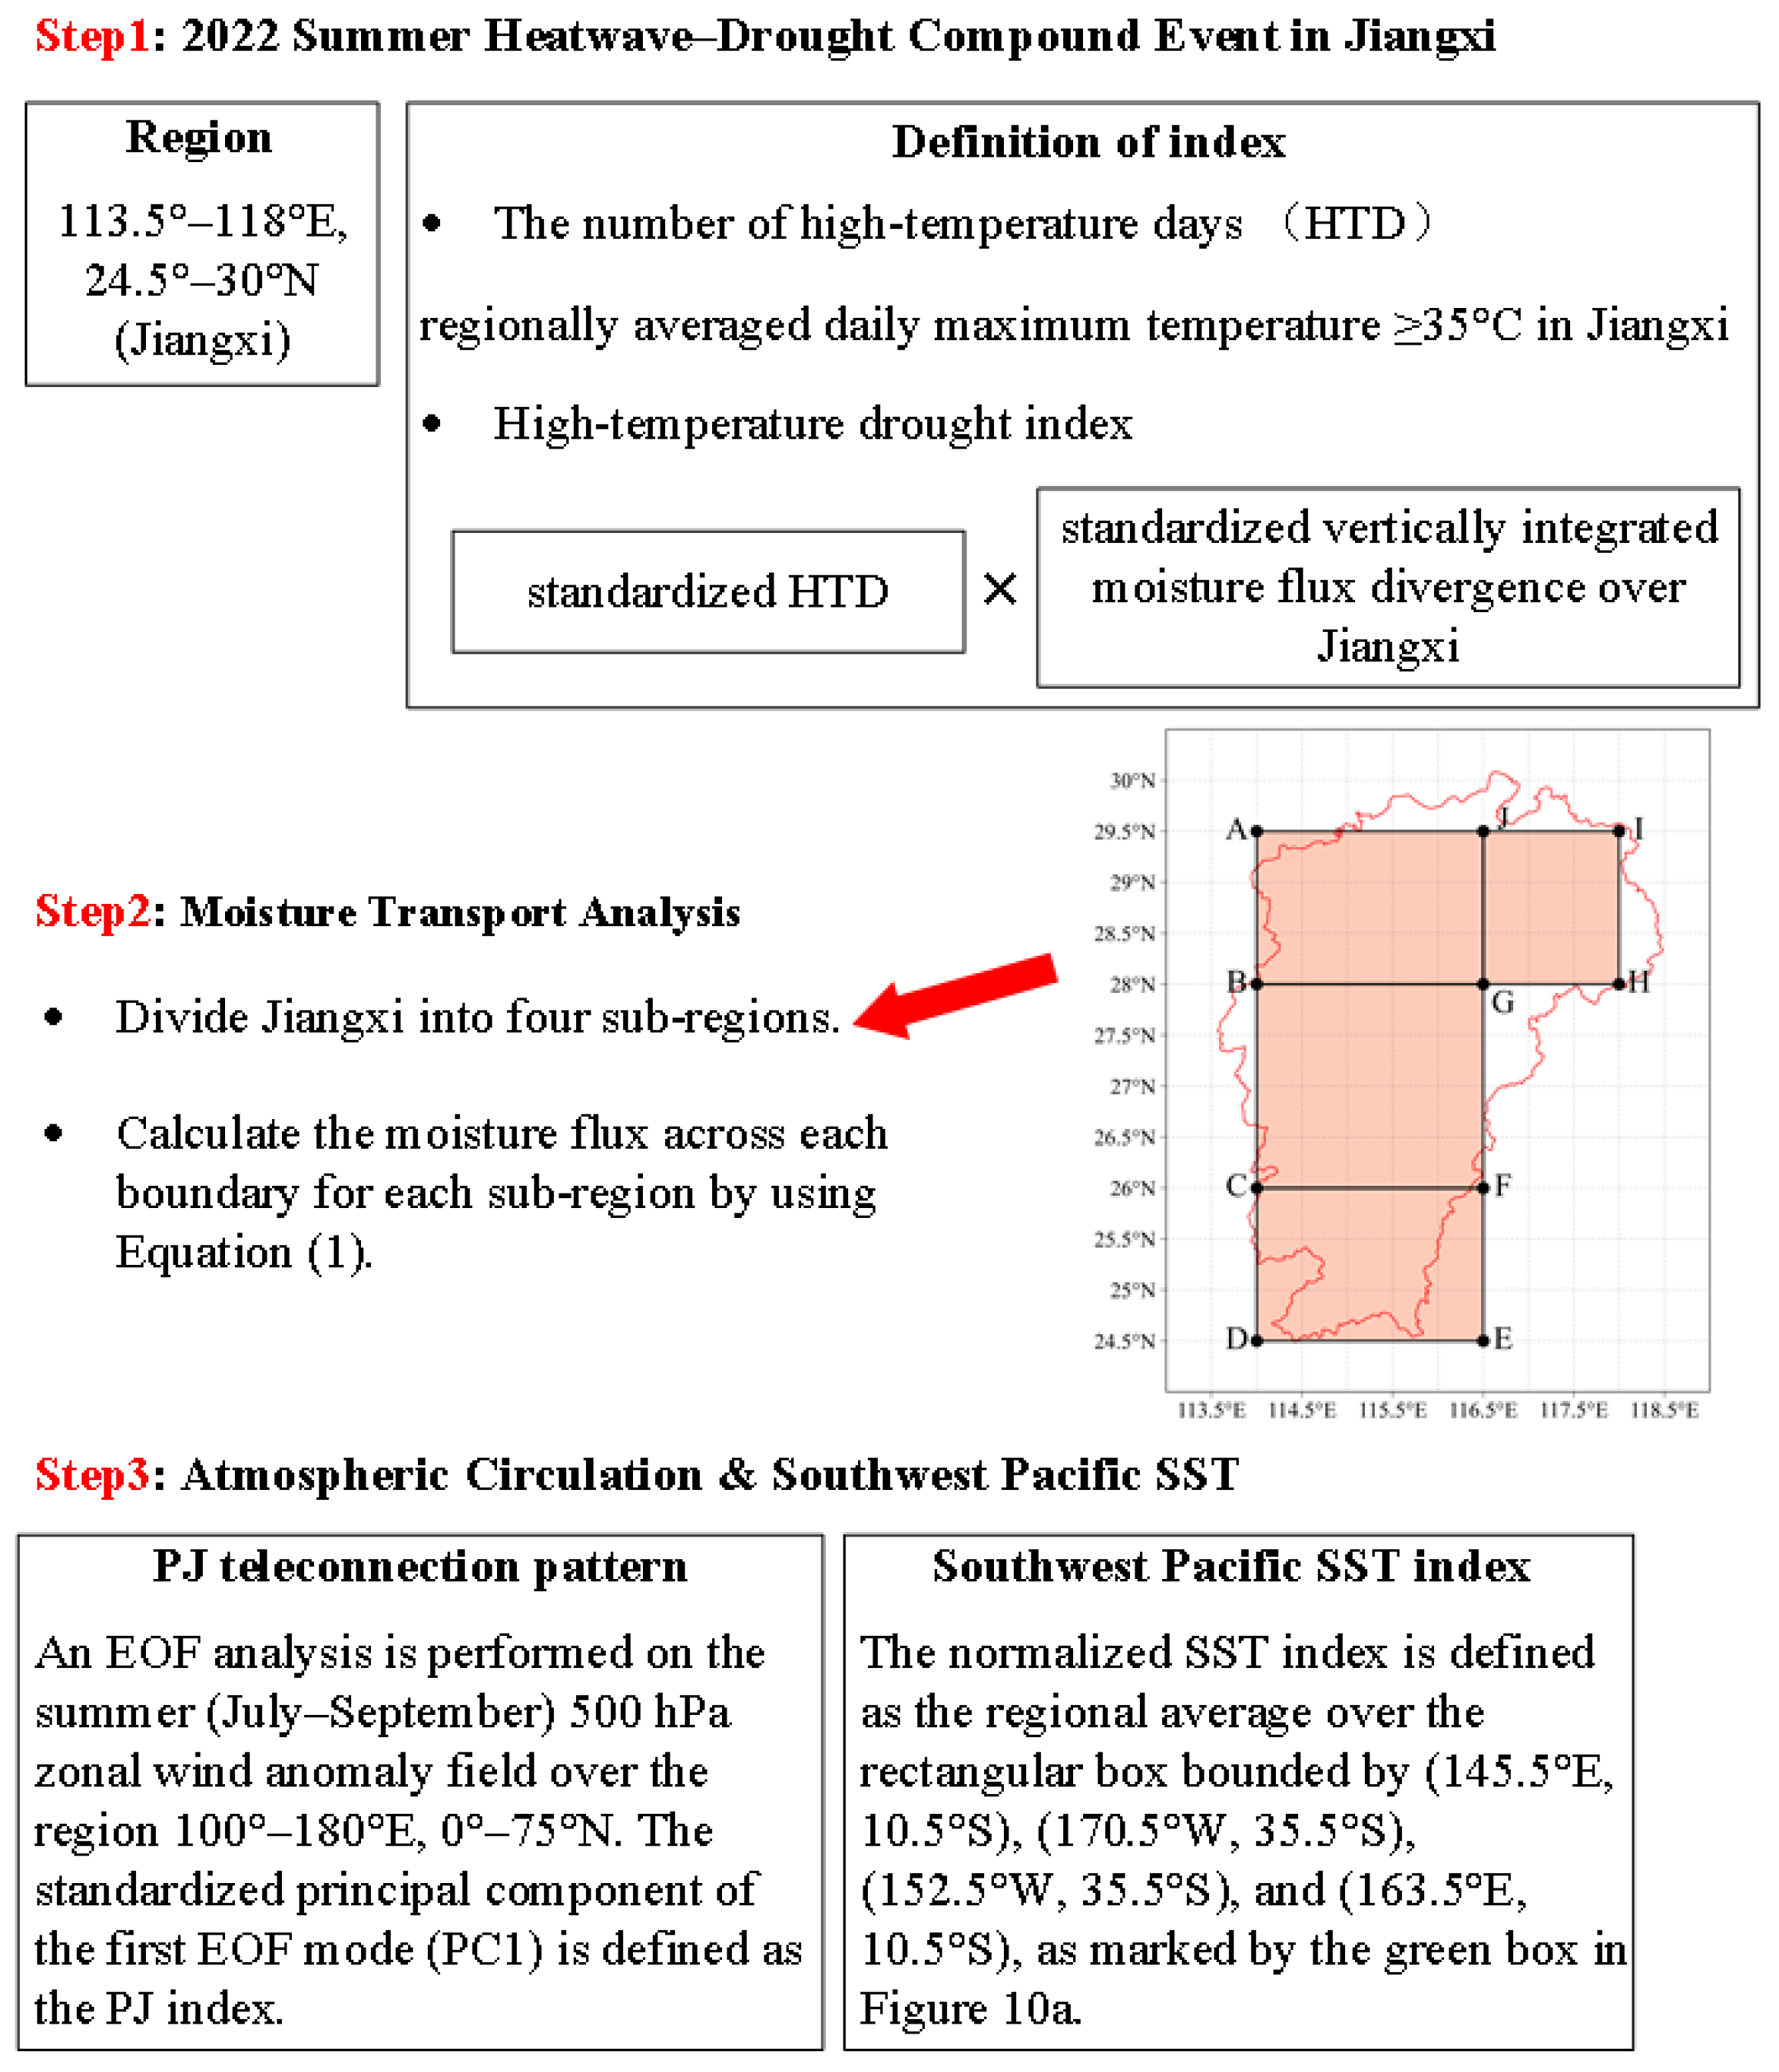
Figure 1. The diagram flow of research design and analysis. The reference map in Figure 1 provides the specific locations of the four sub-regions in Jiangxi, corresponding to the rectangular boxes denoted as ABGJ, BCFG, CDEF, and JGHI, respectively.
Atmosphere 17 00270 g001
Figure 2. (a) Averaged daily maximum temperature (shaded, units: °C) and heatwave events (black dashed contours) over Jiangxi; (b) Regionally averaged number of high-temperature days (red line, units: days) and monthly accumulated precipitation (blue bars, units: mm) during July–September from 1979 to 2022.
Atmosphere 17 00270 g002
Figure 3. Anomaly percentage of regionally averaged monthly cumulative precipitation over East Asia from July to September 2022 (shaded, units: %). (ac) Represent the results from July to September, respectively.
Atmosphere 17 00270 g003
Figure 4. The NDVI in Jiangxi Province for September. (a) 1979–2022 climatological mean, (b) September in 2022, and (c) their differences (September in 2022 minus climatological mean).
Atmosphere 17 00270 g004
Figure 5. Distribution of the zonal averaged vertical velocity anomaly (shaded, units: Pa/s) along 113.5–118° E for (a) July, (b) August and (c) September in 2022. The vertical red dashed lines indicate the Jiangxi area (24.5–30° N). The horizontal dashed line corresponds to the 850 hPa pressure level.
Atmosphere 17 00270 g005
Figure 6. Distribution of vertically integrated moisture flux (black arrows, units: 2 × 10² kg·m−1·s−1) and its divergence (shaded, units: ×10−5 kg·m−2·s−1) over Jiangxi for July–September. (a) 1979–2022 climatological mean, (b) in 2022, and (c) their differences (results of 2022 minus climatological mean).
Atmosphere 17 00270 g006
Figure 7. Moisture budget for various sub-regions of Jiangxi during July–September 2022. The arrows indicate vertically integrated moisture flux across each boundary (shaded, units: ×105 kg·s−1). The rectangular boxes ABGJ, BCFG, CDEF, and JGHI denote the four sub-regions in Jiangxi.
Atmosphere 17 00270 g007
Figure 8. Distribution of 200 hPa geopotential height anomaly (shaded, units: gpm), wind vector anomaly (black arrows, units: m/s) for (a) July, (b) August and (c) September 2022. The black lines indicate the climatological mean position of SAH at 200 hPa, and the red lines indicate the position of SAH at 200 hPa for July–September 2022.
Atmosphere 17 00270 g008
Figure 9. Distribution of 500 hPa geopotential height anomaly (shaded, units: gpm), wind vector anomaly (black arrows, units: m/s) for (a) July, (b) August and (c) September 2022. The black lines indicate the climatological mean position of WPSH at 500 hPa, and the red lines indicate the position of WPSH at 500 hPa for July–September 2022.
Atmosphere 17 00270 g009
Figure 10. (a) Correlation coefficients between the high-temperature drought index of Jiangxi and the global SST field. (b) Time series of the Southwest Pacific SST index (blue line) and the high-temperature drought index (red line) from 1982 to 2022 for July–September. The black dots in Figure 9a indicate that the results are statistically significant at 95% level, and the green box marks the Southwest Pacific region.
Atmosphere 17 00270 g010
Figure 11. Correlations between the Southwest Pacific SST index and the 500 hPa geopotential height field (shaded, the green dots indicate significance at 90% level), and between the same SST index and the vertically integrated moisture flux divergence field (blue contours, the values of ±0.31 denote significance at 90% level).
Atmosphere 17 00270 g011
Figure 12. (a) Time series of PJ index and the Southwest Pacific SST index during July–September. Regression field of the August (b) 200 hPa and (c) 500 hPa zonal wind anomalies onto the Southwest Pacific SST index. The black dots in (b,c) indicate significance at 90% level, and the green box marks the Southwest Pacific region.
Atmosphere 17 00270 g012
Figure 13. Distribution of (a) 200 hPa, (c) 500 hPa geopotential height anomaly (shaded, units: gpm) and (e) SST anomaly (shaded, units: K) in August 2022. (b,d,e) Are similar to (a,c,e), but for anomaly in August 2013. The black arrows in (ad) indicate the corresponding wind vector anomaly, and the green box in (e,f) marks the Southwest Pacific region.
Atmosphere 17 00270 g013
Disclaimer/Publisher’s Note: The statements, opinions and data contained in all publications are solely those of the individual author(s) and contributor(s) and not of MDPI and/or the editor(s). MDPI and/or the editor(s) disclaim responsibility for any injury to people or property resulting from any ideas, methods, instructions or products referred to in the content.