1. Introduction
Windshear is a sustained change in the wind direction or wind speed, resulting in a change in the headwind or tailwind encountered by an aircraft [
1,
2]. Hong Kong International Airport (HKIA) is a reclaimed landmass north of Lantau Island with complex terrain, thus significant low-level windshear often occurs. At HKIA, low-level windshear alerts are defined as a headwind change of 15 knots or more over a distance less than 4 km occurring at a height below 1600 feet or within 3 nautical miles from the runway end. If the headwind changes occur more rapidly over much shorter distances, e.g., in the order of several hundred metres, the rapid fluctuations may be perceived by the pilots as low-level turbulence, which is defined by eddy dissipation rate (EDR) as defined by the International Civil Aviation Organization [
1].
Low-level windshear and turbulence at HKIA are mostly related to terrain disruption of the airflow (around 70% of pilot reports) or sea breeze (around 20% of pilot reports). The remaining 10% may be related to low-level jets, microbursts, gust fronts, etc. [
3]. The majority of the windshear reports are obtained in the spring and summer time [
4], and a large number of studies, both observational and numerical simulation, have been conducted to understand and predict such airflow disruptions [
5]. On the other hand, there are much fewer windshear reports in late autumn to winter at HKIA, but not totally nil. This paper is novel because it provides for the first time a comprehensive study of typical cases of low-level windshear and turbulence at HKIA in late autumn to early winter, namely, October to December of the year.
Moreover, there were further enhancements to the meteorological instrumentation at HKIA for the detection and possible alerting of low-level windshear and turbulence in 2025. With the operation of three to four units of long-range Doppler light detection and ranging (LIDAR) systems for the three runways at HKIA, there would be sufficient time to include additional scanning patterns in their scanning strategies, namely, apart from the glide-path scans (for windshear alerting) and plan position indicator (PPI) scans (for turbulence detection), range–height indicator (RHI) scans have also been performed, which are now mainly used for the post-analysis of windshear (from Doppler velocity pattern) and turbulence (from RHI EDR maps) events in preparation of their use for real-time alerting in the future. The calculation of EDR from LIDAR for an RHI scan, which will be analyzed in this paper, adopts a similar approach as described in Chan [
6]. The detailed algorithm is extracted in
Appendix A for reference.
In addition, a Doppler microwave cloud radar was installed at HKIA in July 2025, which provides reflectivity, Doppler velocity and spectrum width data. The Doppler velocity and spectrum width parameters may give additional insights into windshear and turbulence events when there are liquid clouds in the airport region. Under wet conditions, the LIDARs will suffer beam blockage and reduction in range due to signal attenuation and contamination by hydrometeors. The cloud radar covers the blind detection sector for the LIDARs when liquid clouds are around. Application of microwave cloud radar on cloud observations [
7], low-level windshear modelling [
8] and remote icing detection [
9,
10] have been discussed in the past. There are also studies on combining observations of LIDAR and Ka-band millimetre-wave cloud radar for the detection of cloud boundaries [
11], retrieval of cloud microphysics [
12], and vertical velocity [
13]. For the first time, the observations from such instrumentation enhancements are reported as case studies at an operating airport, HKIA, and this paper presents detailed and valuable analysis of these low-level windshear observations.
2. Low-Level Jets in Wet Northeast Monsoon
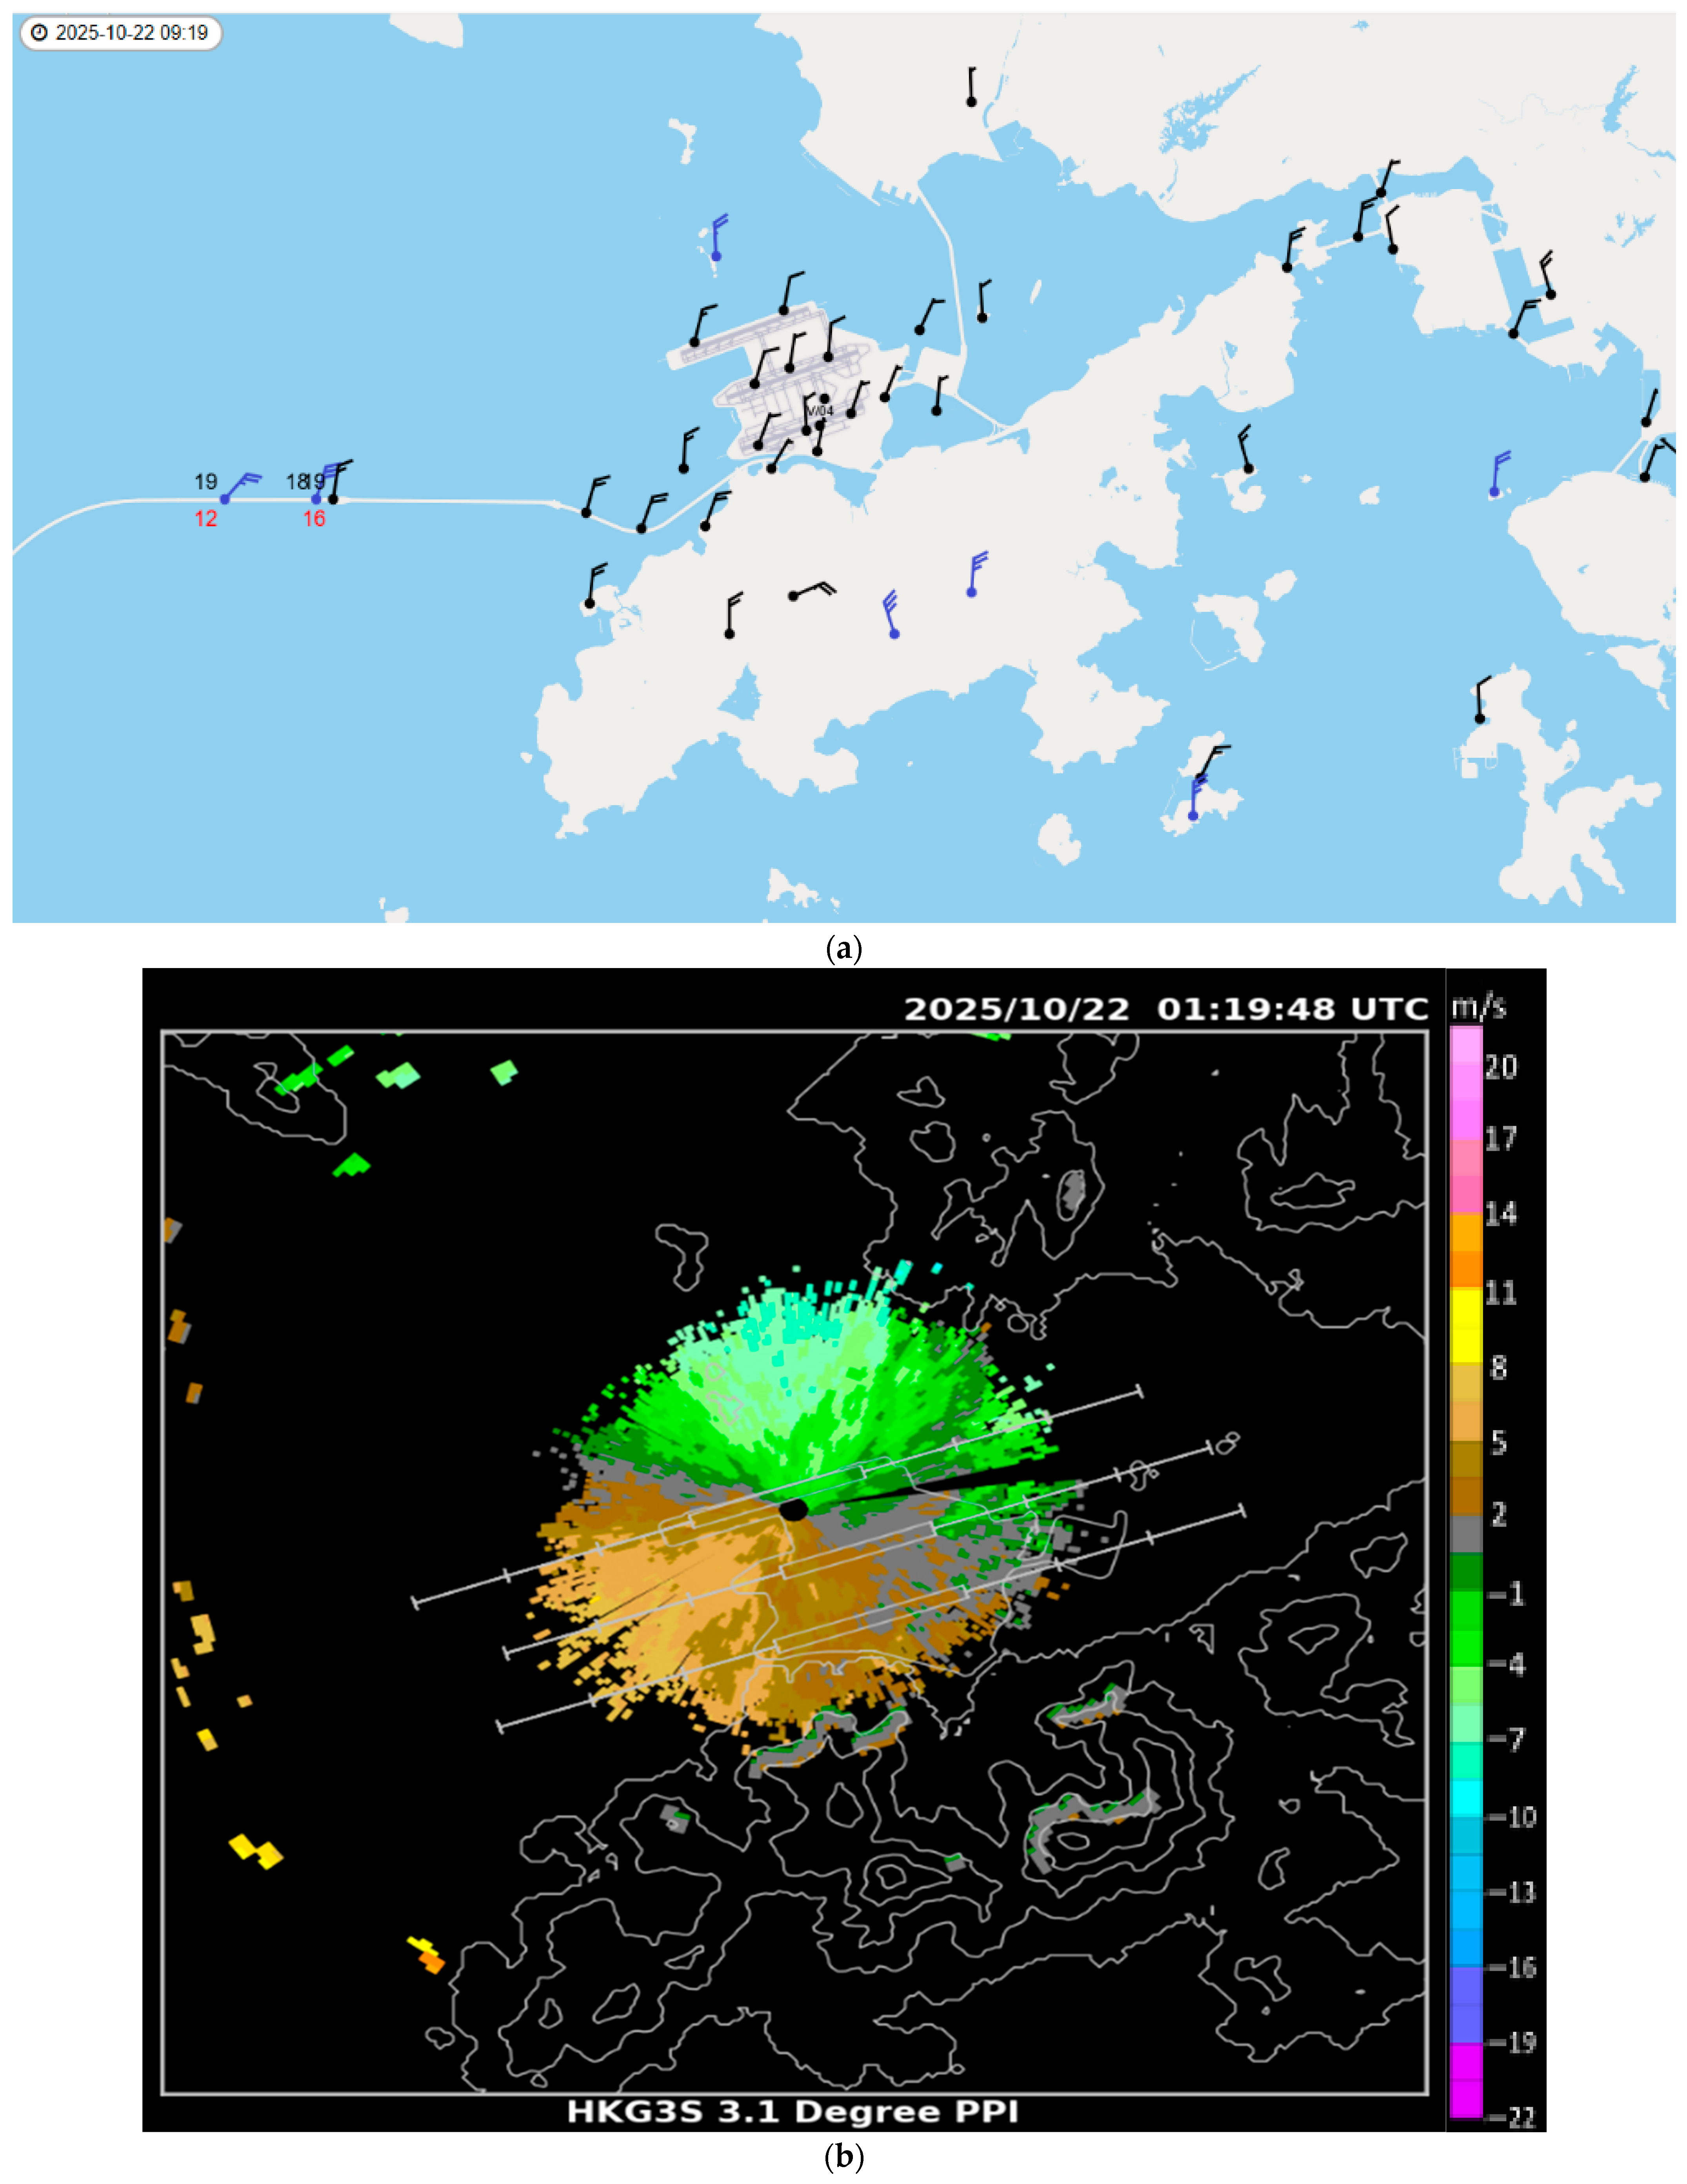
The northeast monsoon prevailed over China on 22 October 2025, which is a typical synoptic pattern in the late autumn to early wintertime. Locally, light to moderate north to northeasterly winds prevailed over HKIA on the surface (
Figure 1a), as shown in the Doppler velocity field of the 3.1-degree PPI scan of the north runway LIDAR (HKG3S,
Figure 1b). However, due to the low cloud base of the liquid clouds, the measurement range of the LIDAR was very much limited, up to around 5 kilometres only (
Figure 1b), and it turns out that at higher altitudes, such as the mountain tops, the winds reached strong force as shown by the surface anemometers (blue wind barbs in
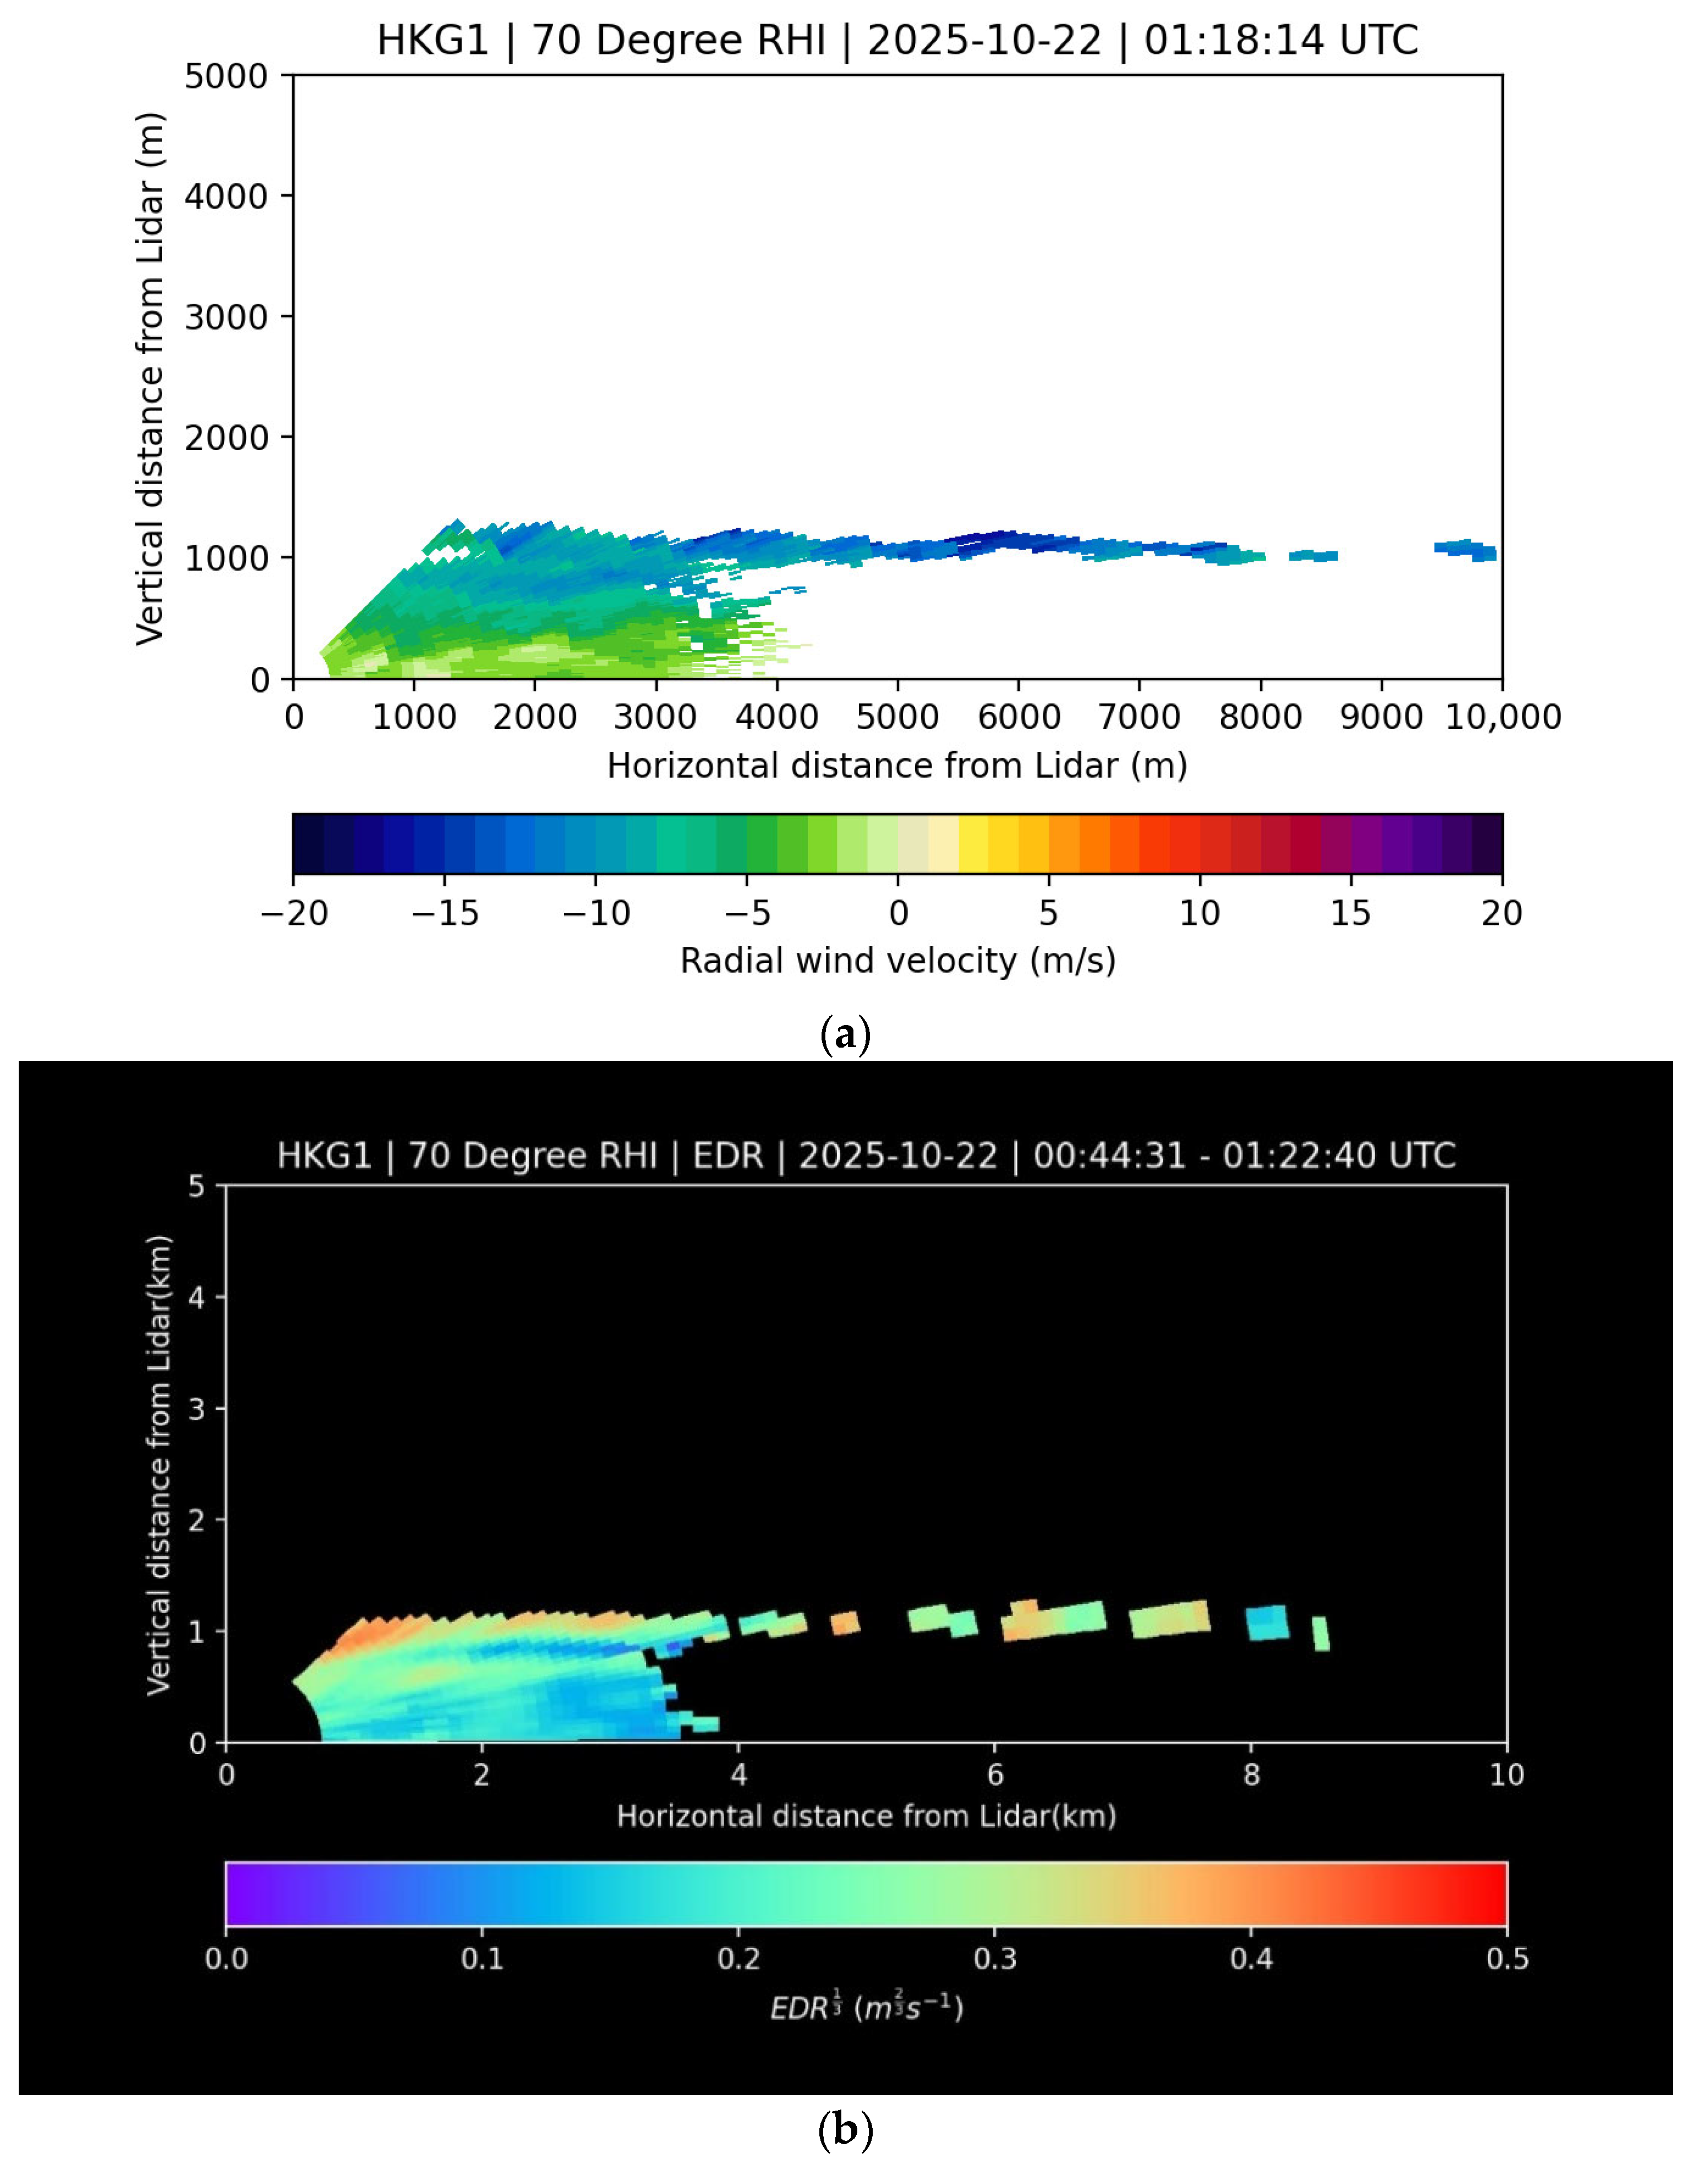
Figure 1a―the anemometer on the top of Yi Tung Shan reaching a 10 min mean wind of around 22 knots from the north, with this mountain being about 900 m above mean sea level). This elevated jet is consistent with the only available LIDAR observations that have not been affected by the liquid clouds, e.g., from the RHI scan of the Doppler velocity of the LIDAR at the southern runway of HKIA (HKG1), showing a thin and elongated layer of jet with higher wind speed (around 10 to 15 m/s) at a height of about 1000 m above sea level (
Figure 2a).
The observed jet is consistent with the pilot windshear report at that time. An aircraft departing from the south runway to the east reported encountering a windshear of −30 knots (i.e., headwind loss of 30 knots) at a height of about 4000 feet above the sea level. This is a severe windshear report (according to [
14]) and may be hazardous to the aircraft if it were close to the ground due to sudden loss of significant lift. At around the location of the jet, the LIDAR RHI EDR map also shows moderate to severe turbulence (in the region of 0.3 to 0.5 m
2/3s
−1,
Figure 2b). However, due to the presence of the liquid clouds, it is not clear from the LIDAR data alone why there could be a severe loss of headwind as reported by the pilot.
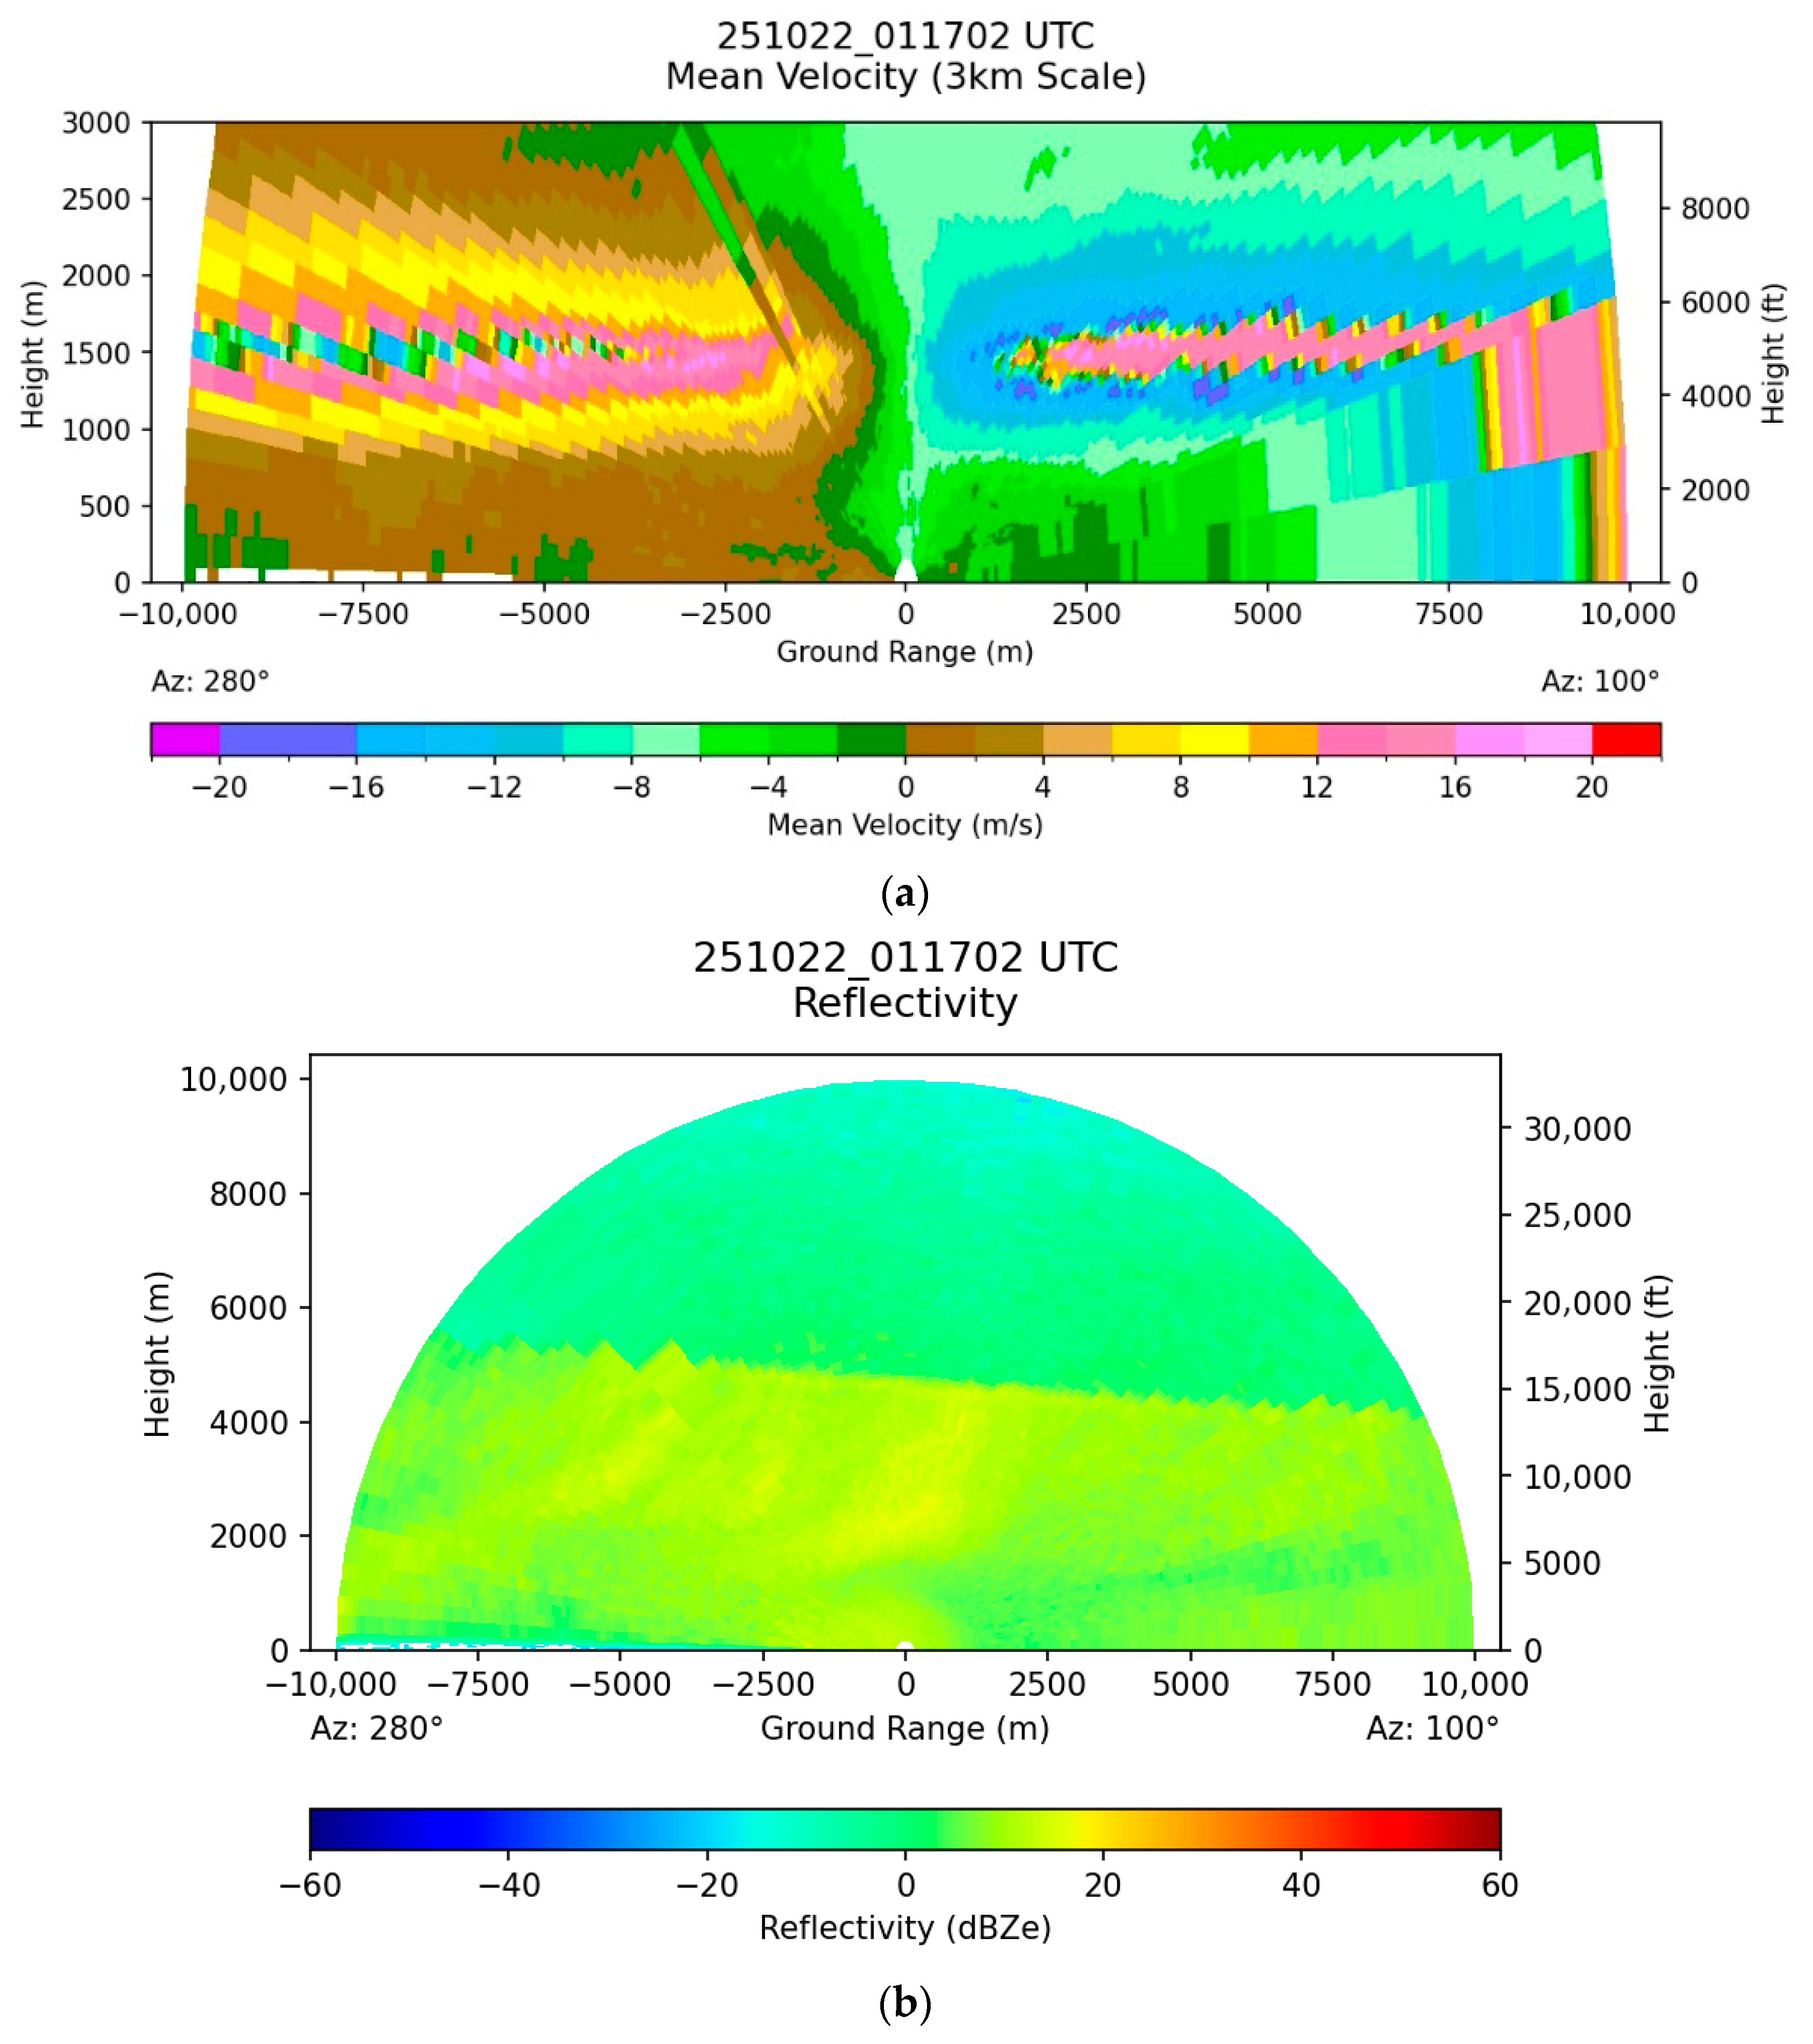
A cloud radar (Ka-band) was working at the northwestern corner of HKIA at that time. In its scanning strategy, an RHI scan was performed regularly in the azimuth angles of 100 degrees and 280 degrees. The cloud radar is configured to use two chirp modes, for the detection range of 150 m to 1600 m, the maximum unambiguous Doppler velocity is 27.5 m/s, and for the range of 1.6 km to 10 km, the maximum unambiguous Doppler velocity is 19 m/s. The Doppler velocity from the cloud radar around the time of the windshear report is shown in
Figure 3a. It could be seen that there is a low-level jet at a height of around 1500 m above sea level, with Doppler velocity exceeding 16 m/s. Though the cloud radar is scanning at the north runway, which is not the south runway where the aircraft reported the severe windshear report, the presence of the low-level jet is captured more clearly by the cloud radar compared to the LIDAR and it is consistent with the pilot report of −30 knot headwind loss; namely, when the aircraft passed through the low-level jet, the headwind decreased significantly with a magnitude in the order of 15 to 20 m/s (or even more). Noting that the low-level jet is evident at around 1500 m while the aircraft reported turbulence at around 1200 m (4000 ft), the observed vertical spacing could be due to the location of the cloud radar, which is scanning the north runway rather than the south runway that the aircraft departed from. The vertical structure of the cloud may have local variation within the aerodrome.
The reflectivity from the cloud radar is shown in
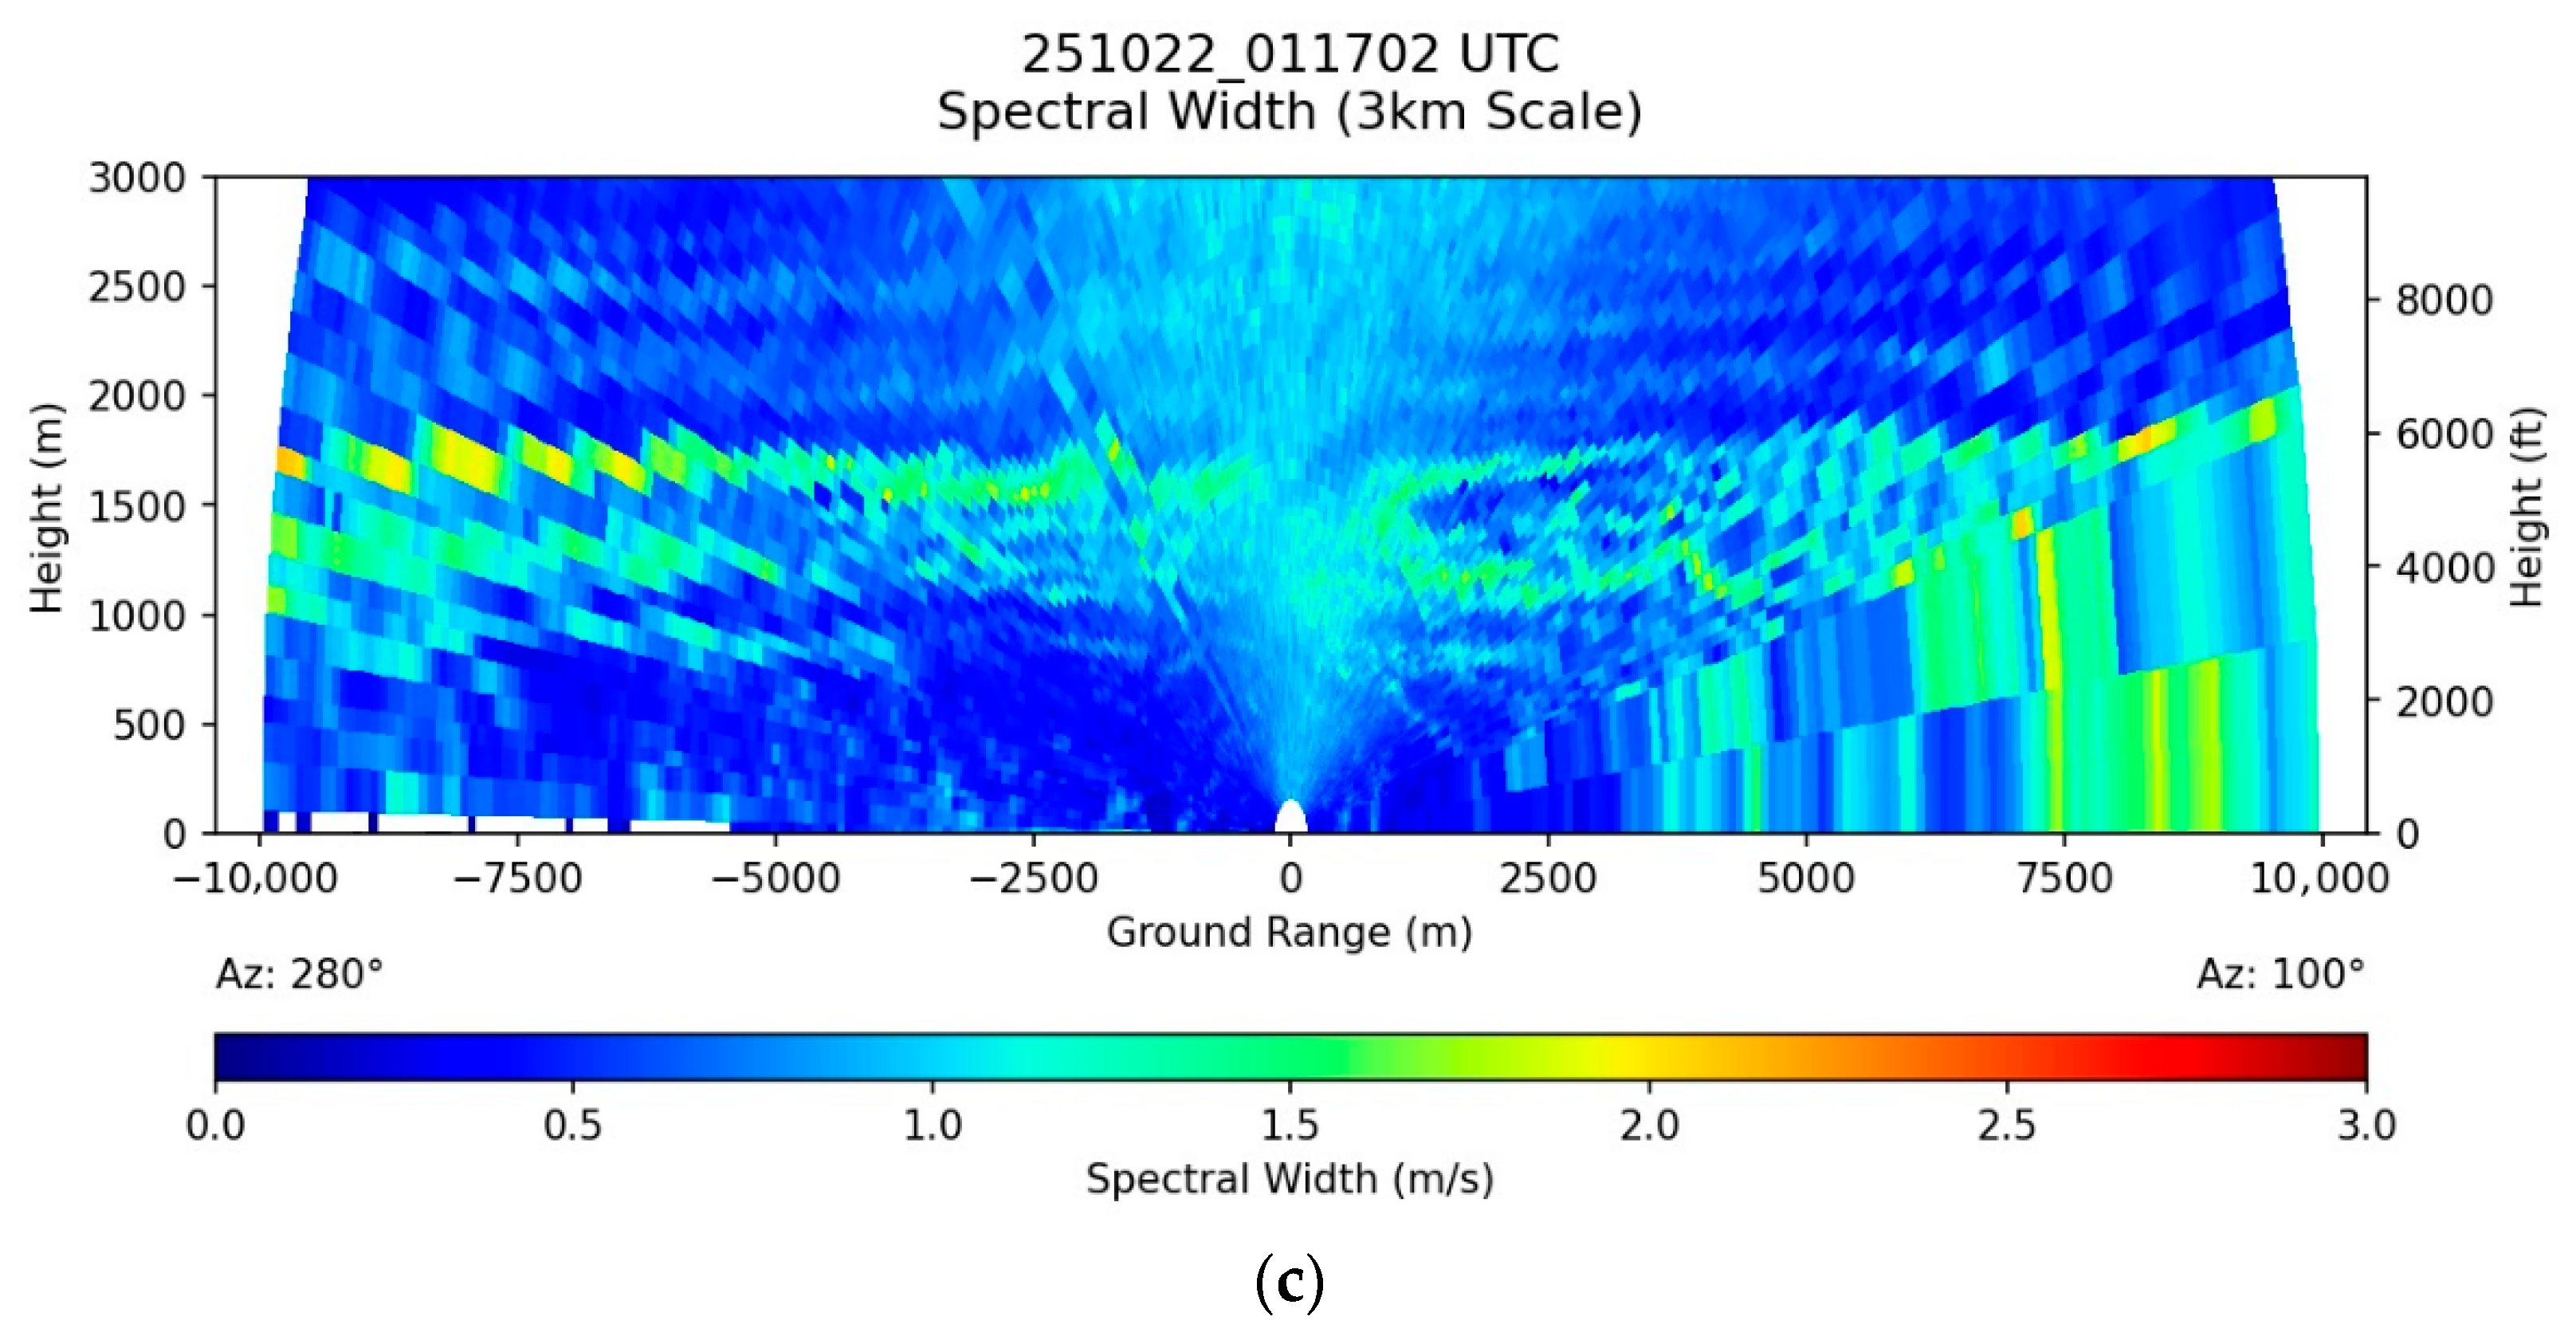
Figure 3b. There is an apparent cloud top between around 4000 m to 6000 m above sea level, with the top rising from the east-southeast to west-northwest. However, the cloud base is not clear, which may be mixed with the light rain patches falling from the clouds. According to the surface synoptic observation (SYNOP) weather reports from the human weather observer at HKIA at 01 UTC and 02 UTC of that day, three layers of clouds had been identified, with cloud base height of 1800 to 2000 feet (1 okta), 3500 feet (4 okta) and 8000 feet (6 okta). The windshear experienced by the pilot most likely occurs at the second layer of clouds just below the low-level jet. Around that region, there is an enhanced area of spectral width (
Figure 3c, around 2 m/s against the “background” of about 1 m/s). From the spectral width, it seems that turbulence is enhanced around and within the medium clouds. In the past, there have been studies on estimating turbulence using spectral width from radar [
15,
16]. Additional quantitative results (EDR) based on cloud radar about turbulence would be the next research step for HKIA.
As shown from this example, the cloud radar supplements LIDAR in the detection of low-level windshear. When it is a clear sky, LIDAR has the best detection capability. When it is raining, microwave radars would be used for windshear detection. But when there are liquid clouds with/without significant rain, cloud radar is the best in capturing the wind changes. Future airports under planning may consider having the combination of LIDAR, microwave cloud radar, and terminal Doppler weather radar to result in all-weather detection of windshear. For turbulence, research is underway to calculate EDR out of the spectral width data of the cloud data so that the LIDAR-based and cloud radar-based EDR may be combined in the future to form a three-dimensional, all-weather EDR grid in the airport region. Together with the surface anemometer-based EDR and the wind profiler EDR, the resulting EDR grid is expected to provide timely, detection-based low-level turbulence alerting to aircraft under all different kinds of weather conditions.
3. Low-Level Jets in Dry Northeast Monsoon
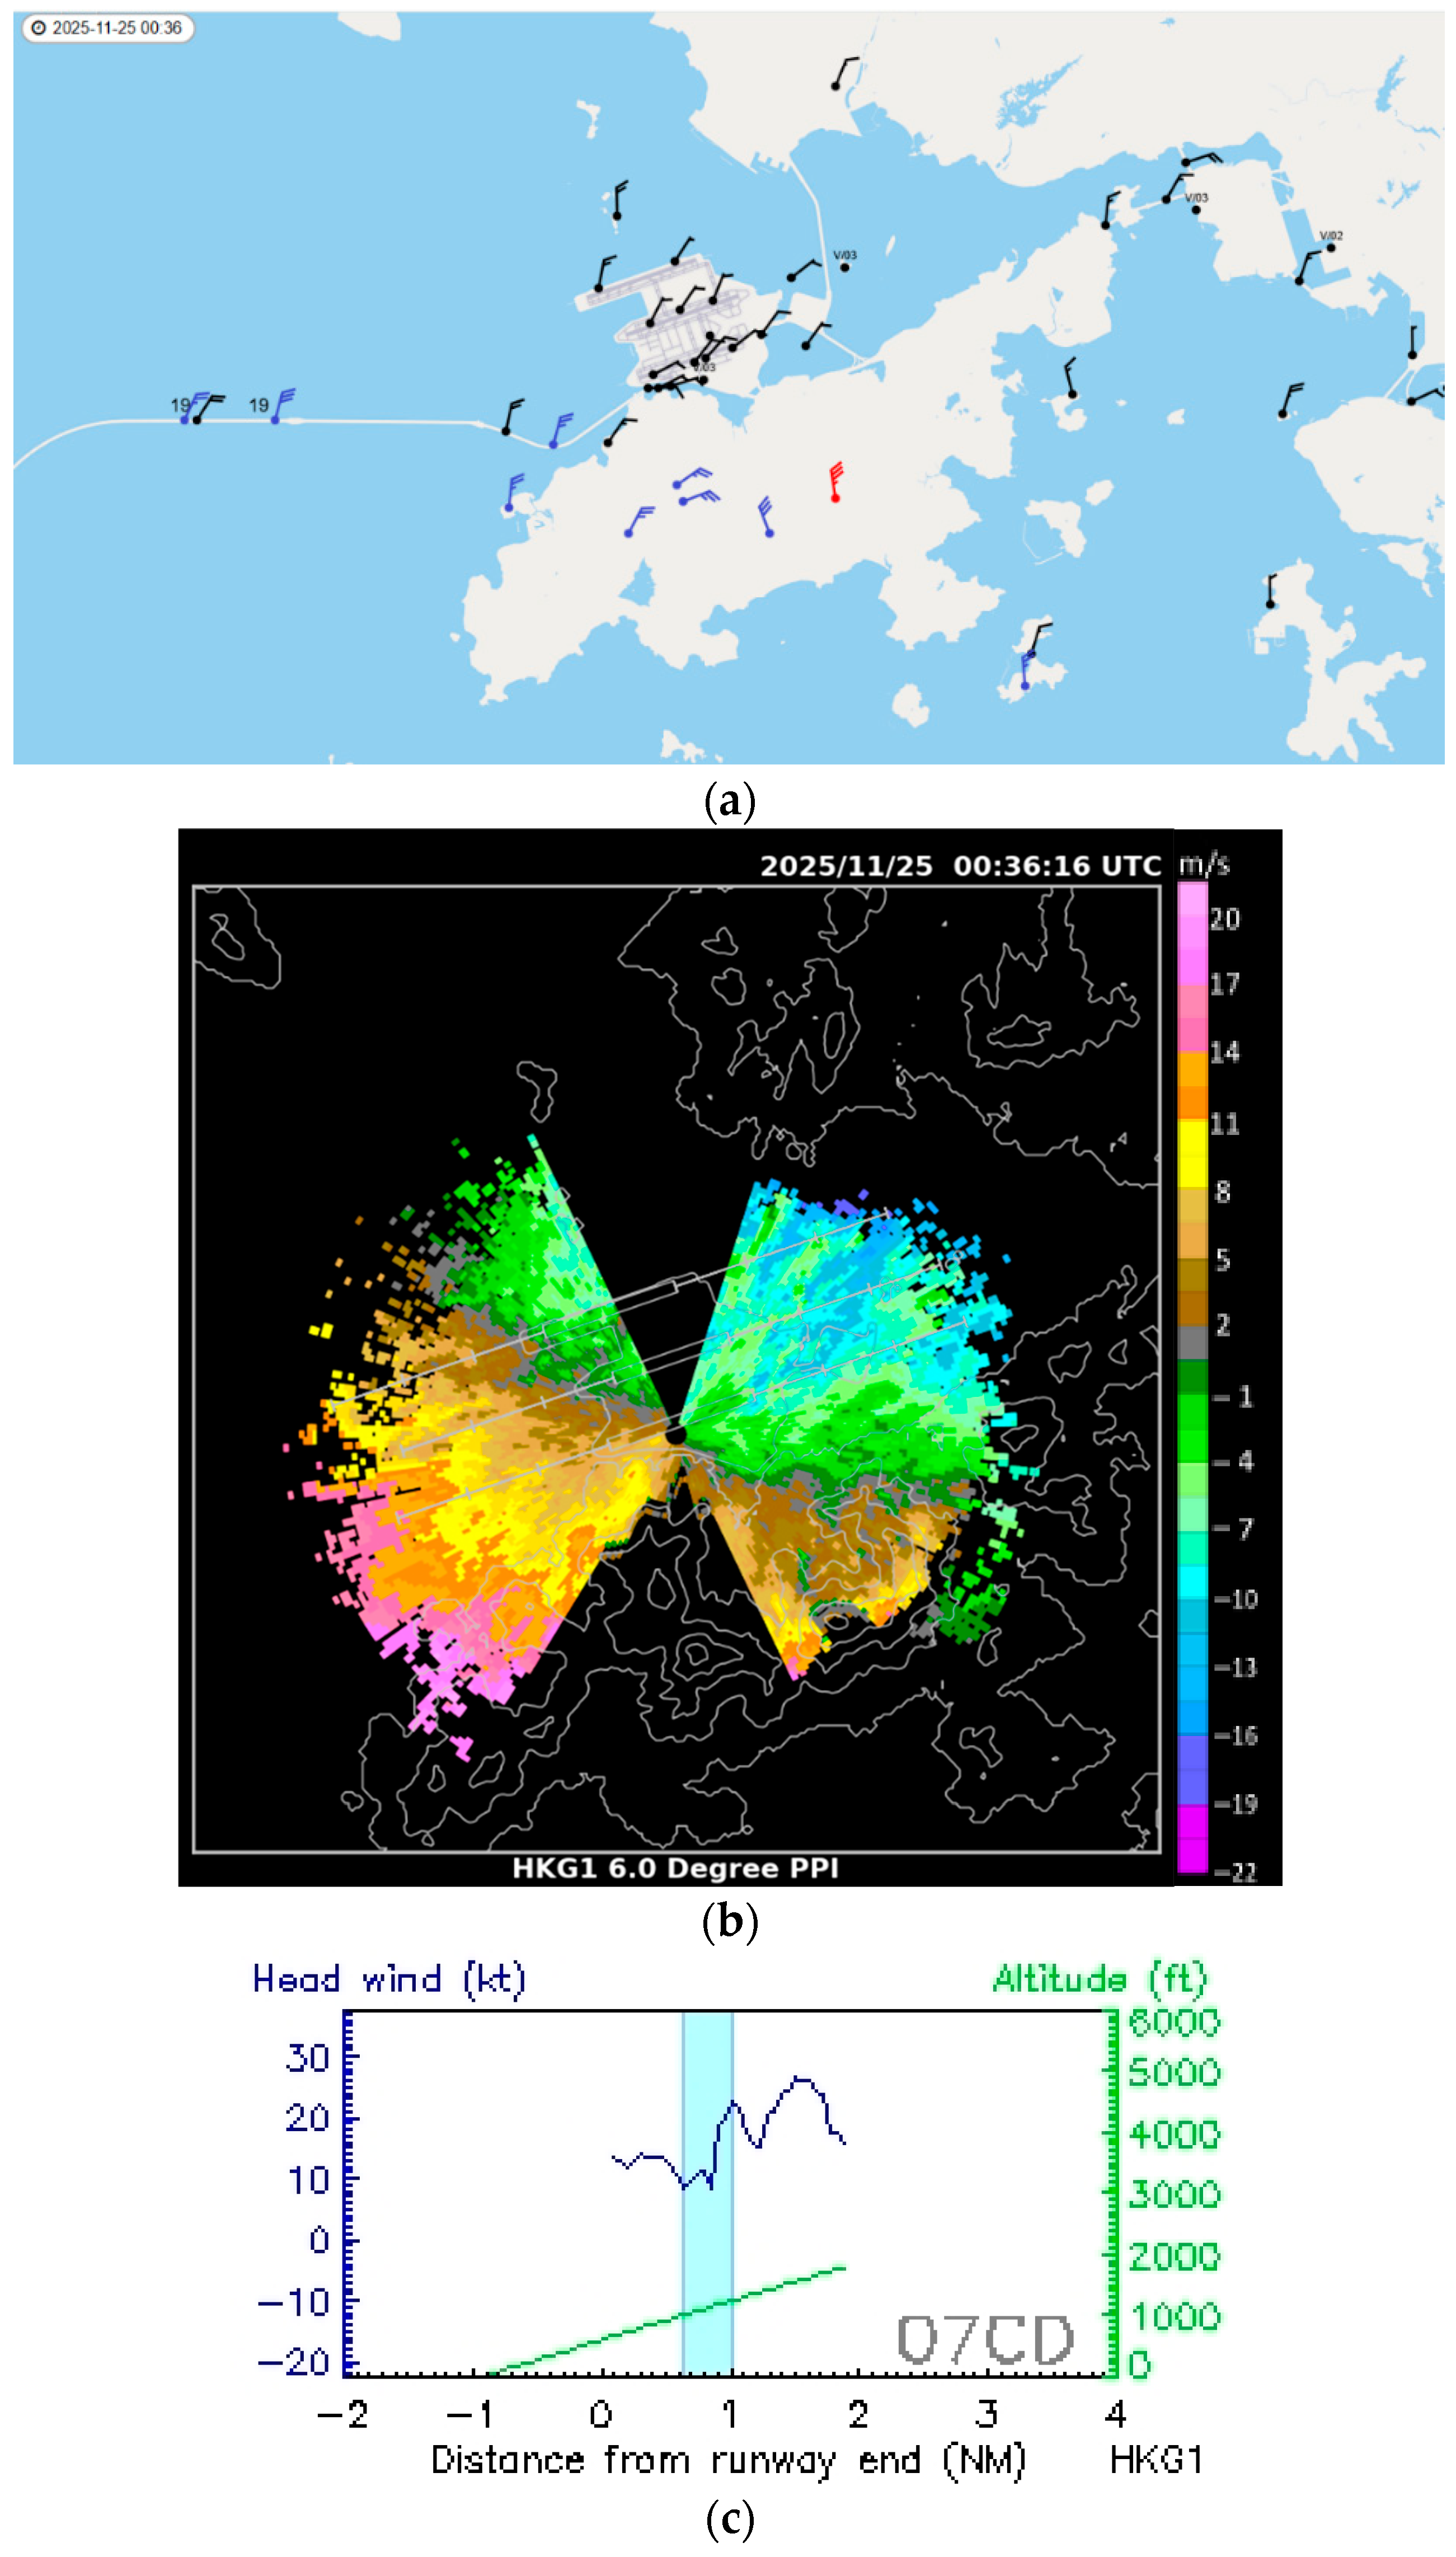
On the morning of 25 November 2025, there was an outbreak of northeast monsoon and this time the monsoon was very dry. On the surface, moderate northeasterly winds were recorded in the airport region (
Figure 4a) and strong (blue wind barbs) to gale (red wind barbs) force winds were measured on the mountain tops and valleys. The surface observations are consistent with the PPI Doppler velocity image from the LIDAR (
Figure 4b). However, due to the relatively clean air in the strong northeast monsoon from the north, the measurement range of the LIDAR is limited to about 8 to 10 km (the long-range LIDAR has a theoretical measurement range of around 15 km). As the monsoon is rather dry, there is no persistent quality signal from the cloud radar. From the upper air observation at King’s Park, Hong Kong, the bulk Richardson number is 0, indicating there is no thermal stratification in the atmosphere and the mechanism for turbulence is mainly shear-driven.
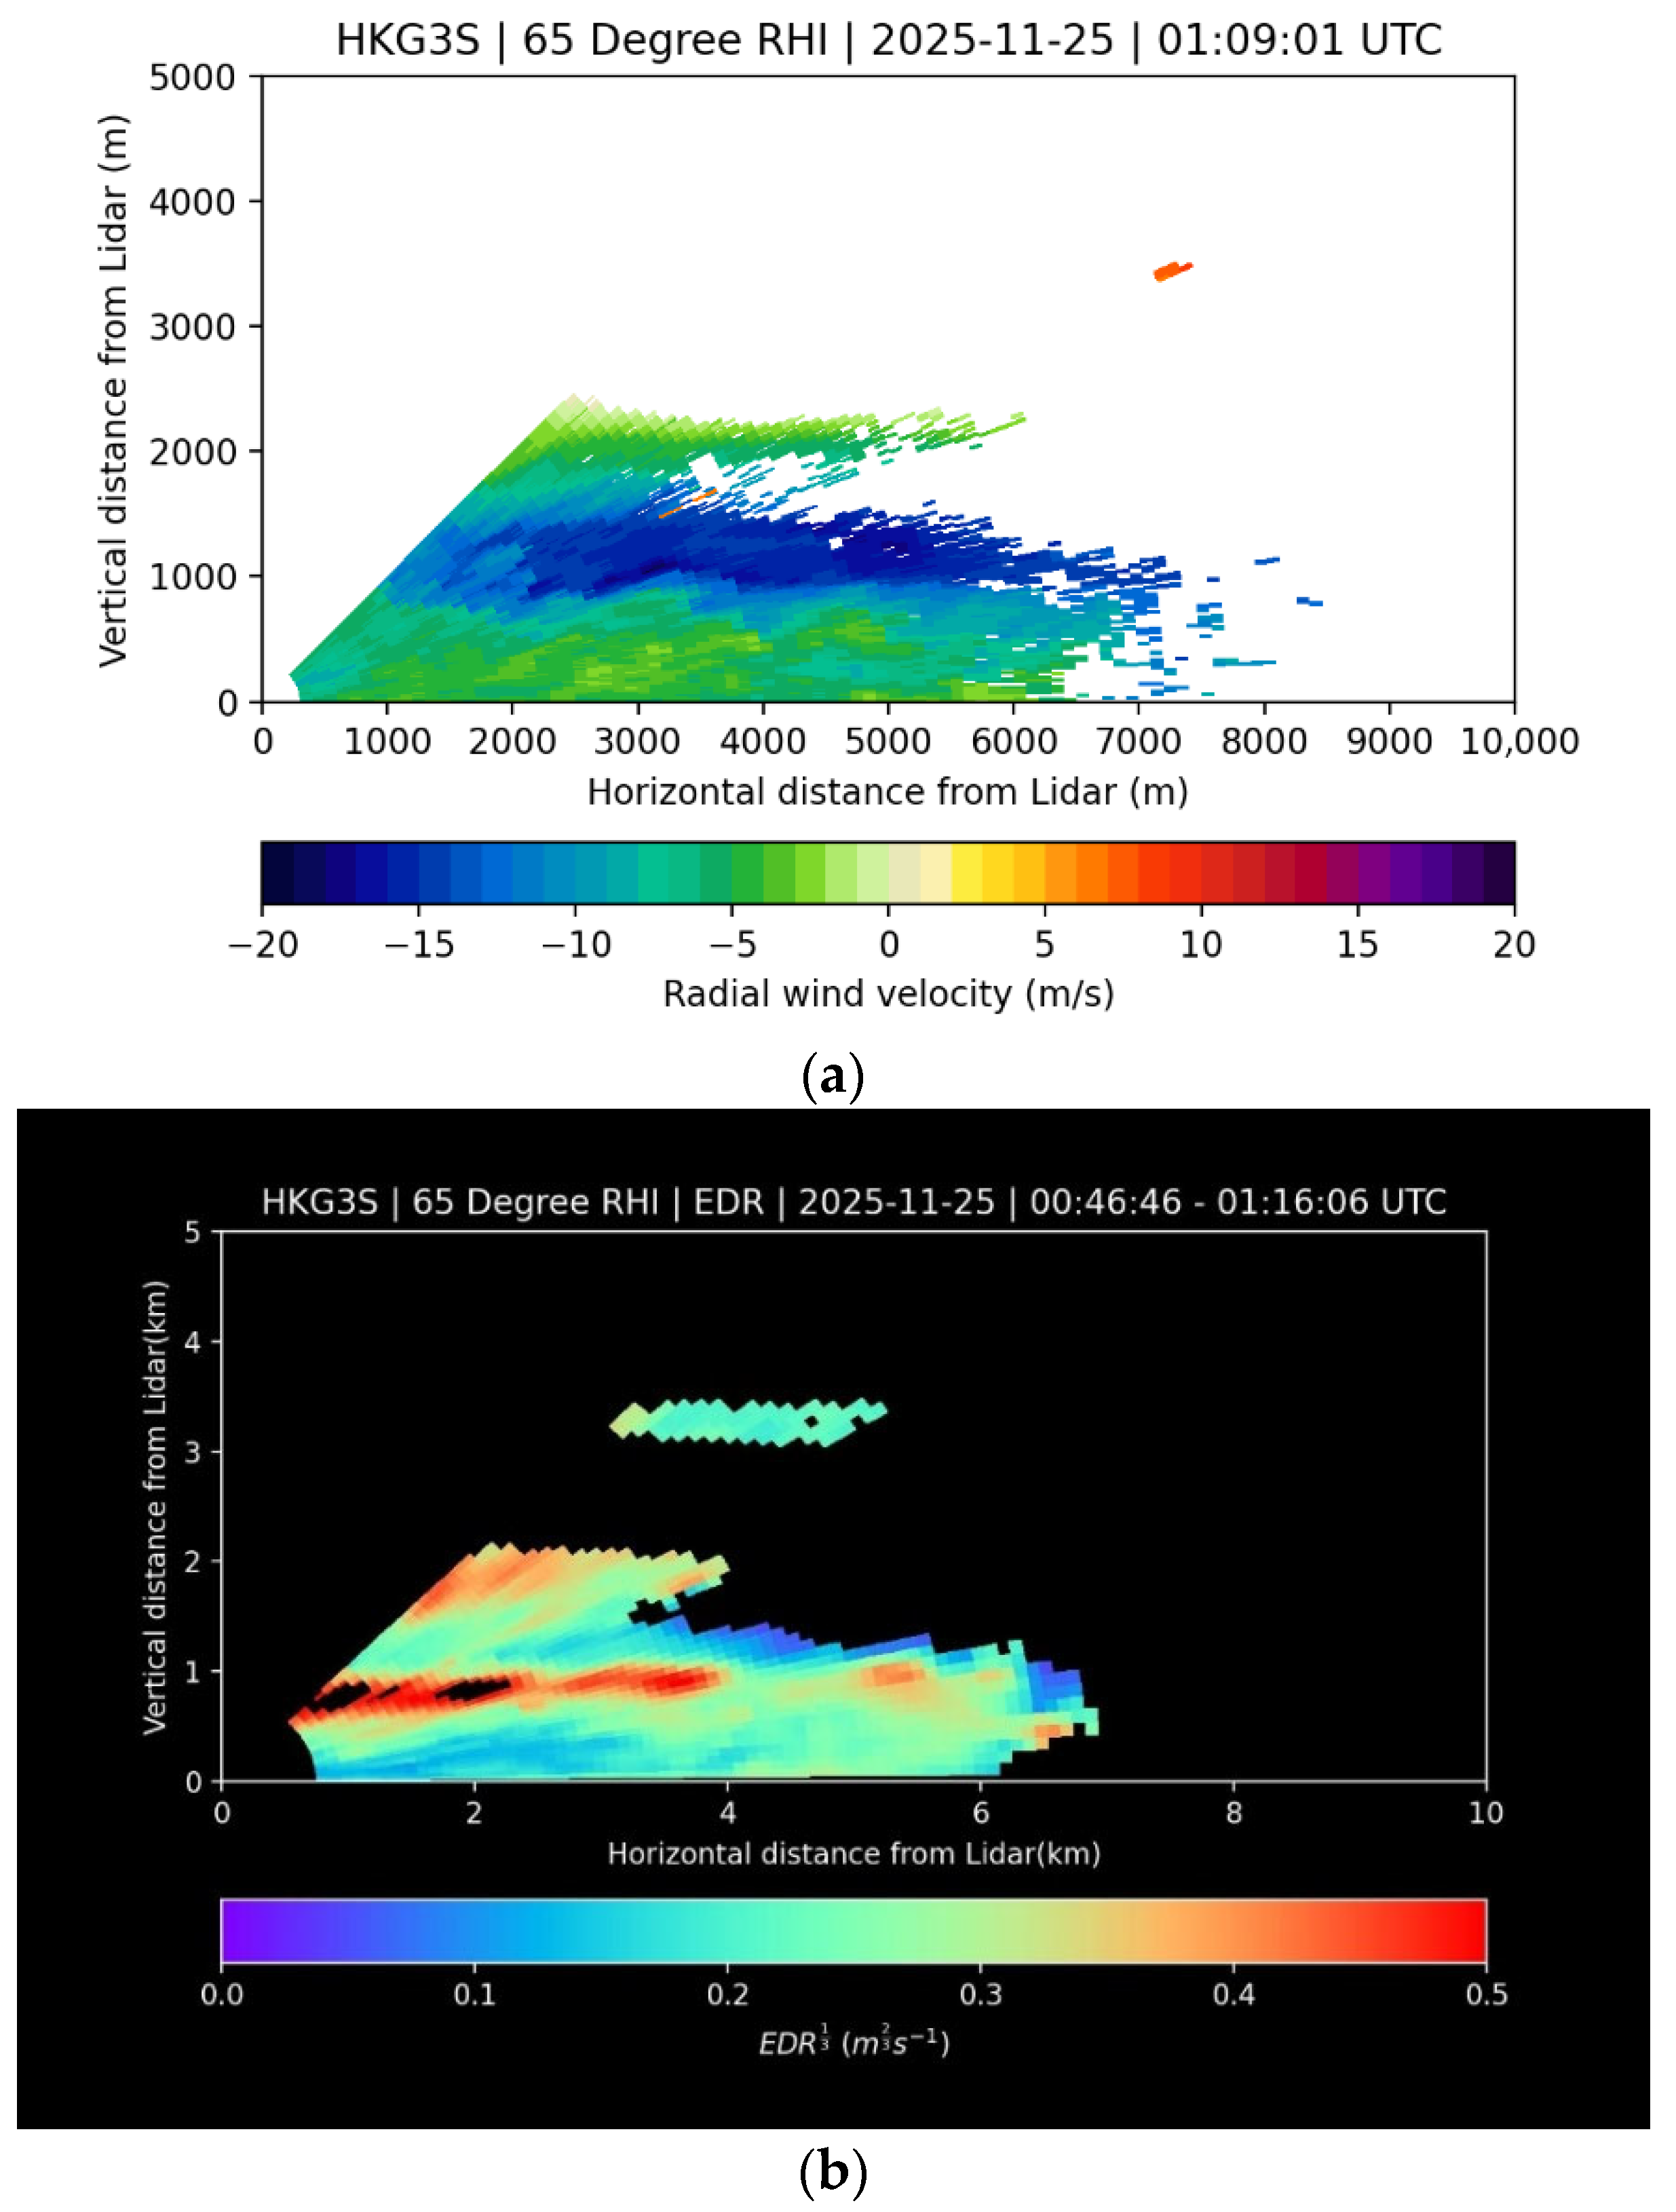
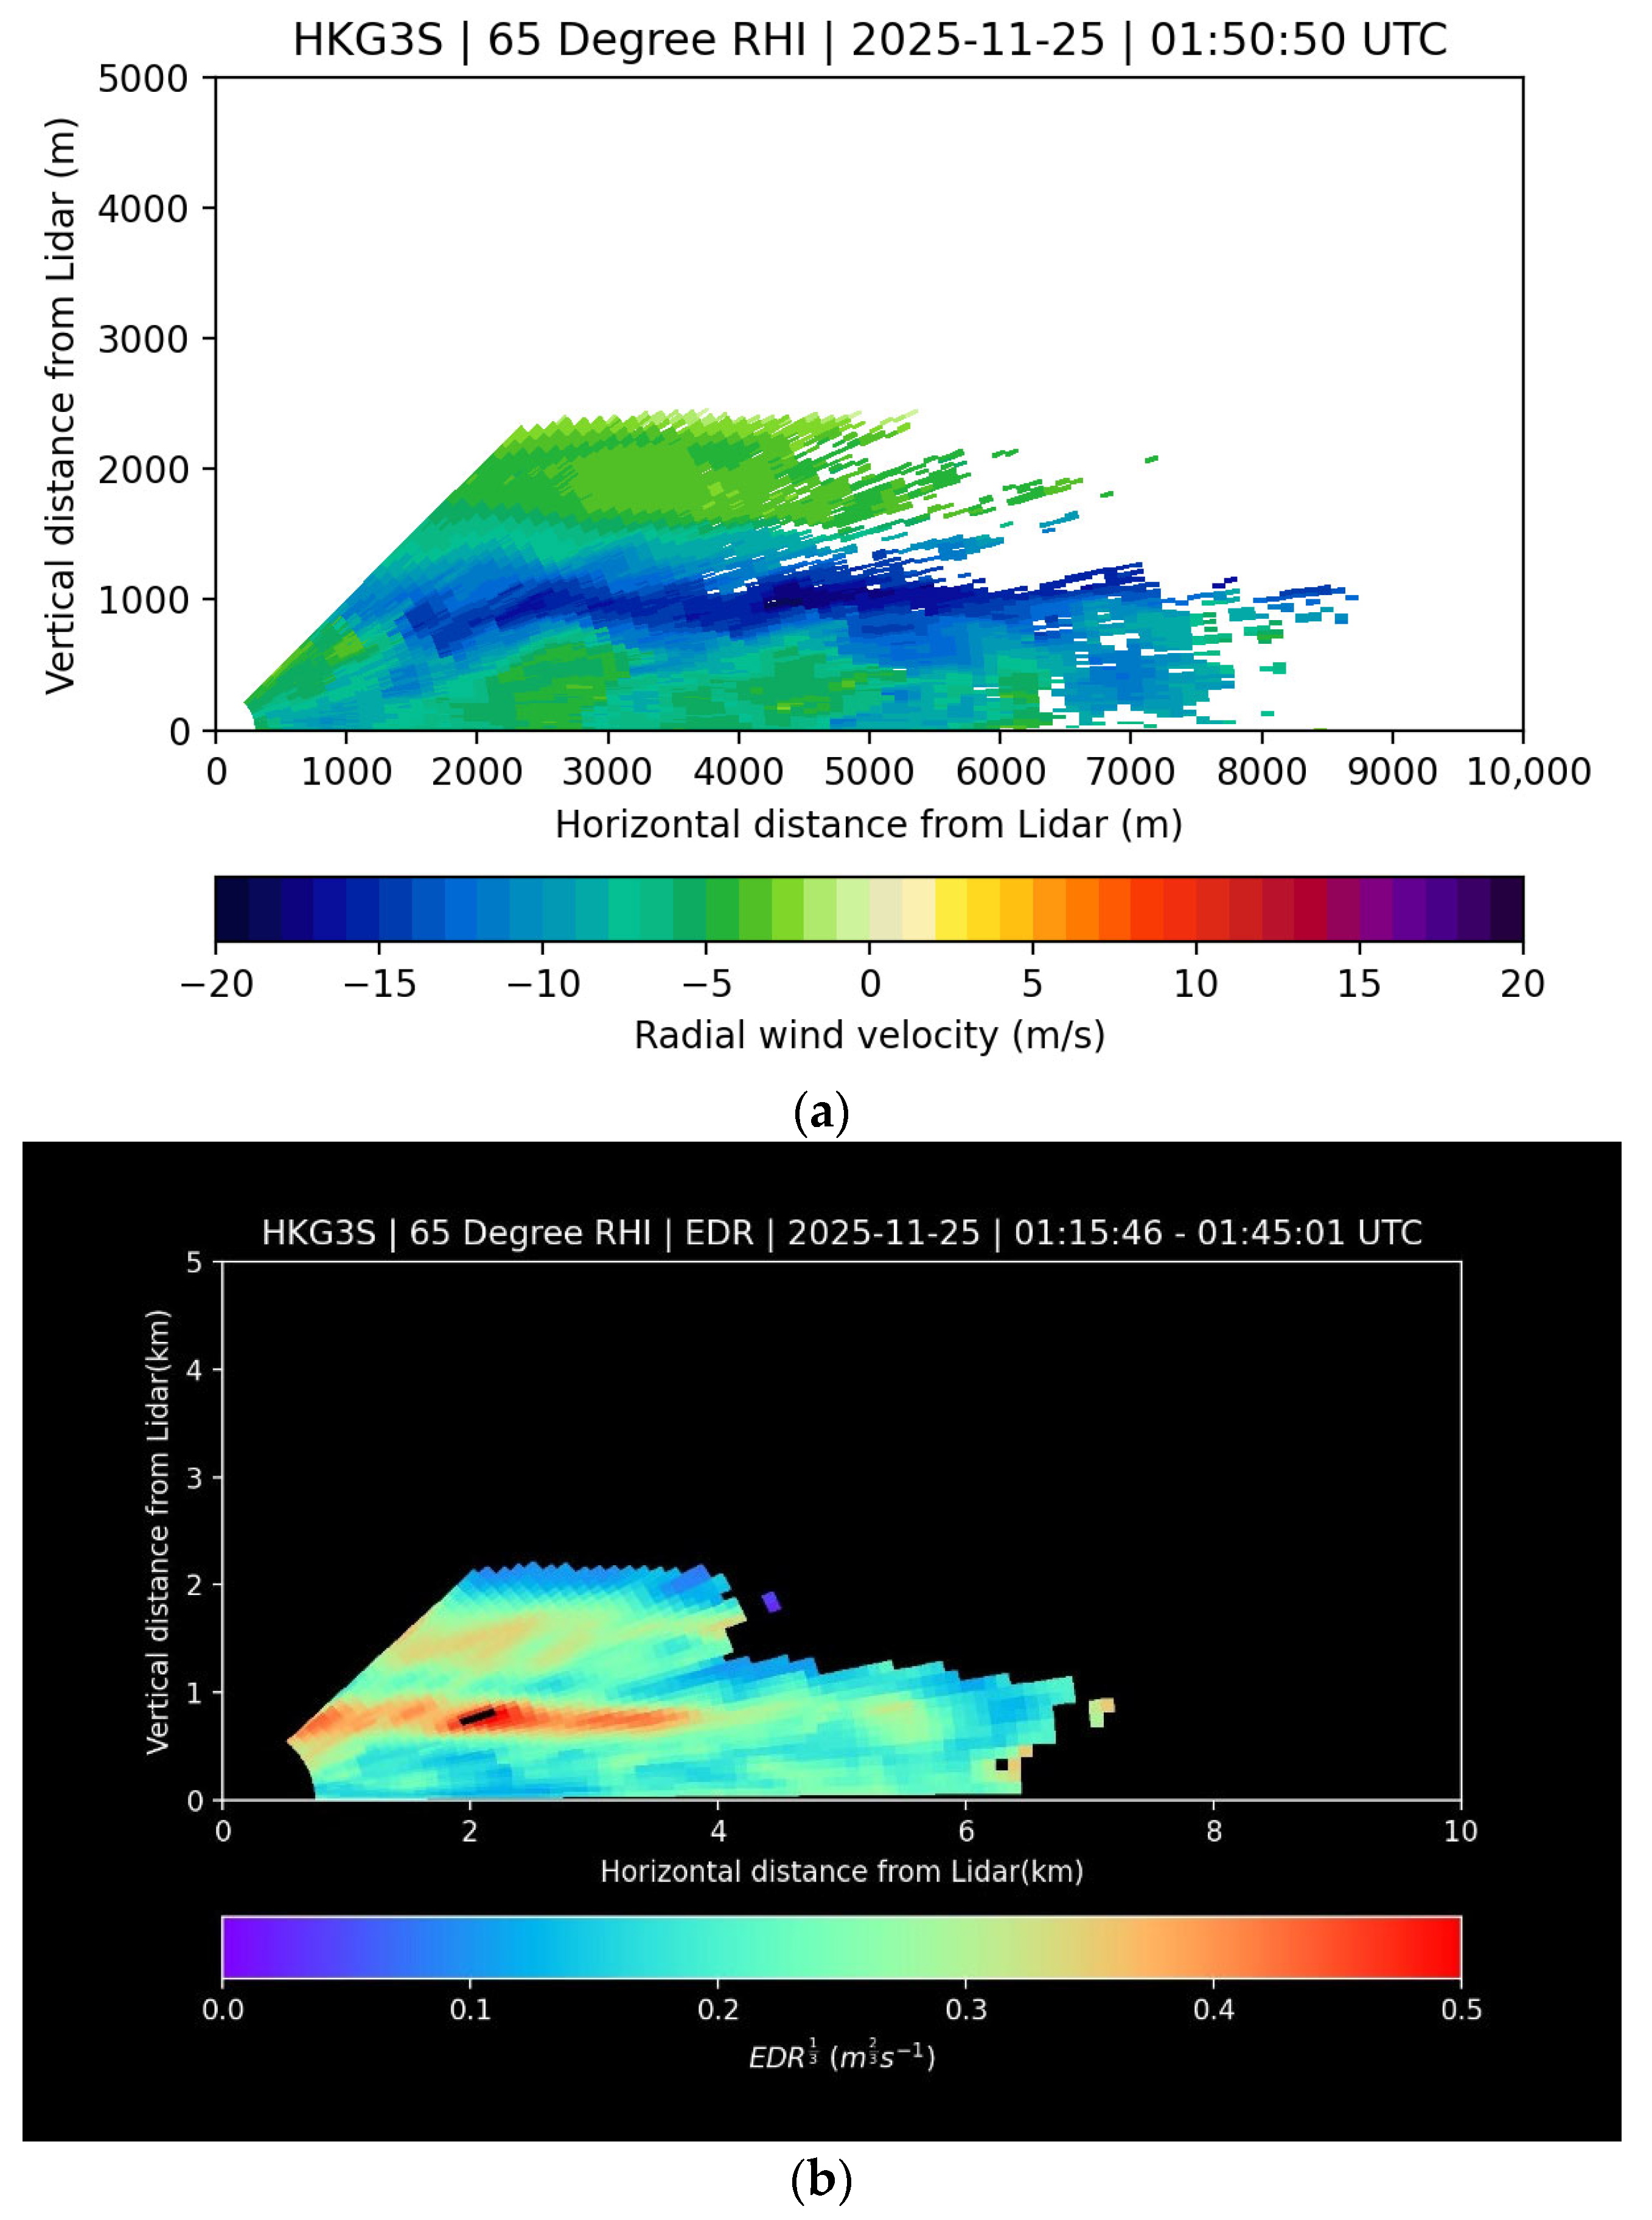
There are a number of pilot windshear and turbulence reports in this episode. Between 00:35 UTC and 02:11 UTC on 25 November 2025, there are seven reports of windshear and turbulence for aircraft departing from the centre runway to the east. More detailed analysis would be performed on two reports, namely, one at 01:10 UTC, headwind gain of 20 knots at a location of 2 nautical miles from the runway end and a height of 2500 feet above sea level; and the second at 01:50 UTC, moderate turbulence at a location of 1 nautical mile from the runway end.
The two events are apparently related to low-level jets again, as shown from the RHI scans of the long-range LIDAR HKG3S. For the first report (windshear), the RHI Doppler velocity image is shown in
Figure 5a, with the corresponding EDR map in
Figure 5b. From
Figure 5, there is a clear signature of a jet at a height of about 1000 m above sea level, with a Doppler velocity of around 10 to 15 m/s showing slight wave features. The corresponding EDR region is rather narrow and occurs at about the same height (
Figure 5b), with the maximum EDR exceeding 0.5 m
2/3s
−1. As the aircraft flies through the jet, windshear could be expected and the magnitude of headwind change is consistent with the Doppler velocity observation by the LIDAR.
For the second report (turbulence), the Doppler velocity image at that time shows a very clear wavy feature (
Figure 6a), with a wavelength of about 2000 m. The jet-related turbulence area persists (
Figure 6b), with the maximum again reaching severe turbulence level (EDR ≥ 0.45 m
2/3s
−1). The turbulence report from the pilot is subjective and thus may not be exactly the same as the RHI EDR map estimation. In general, the pilot turbulence report is found to be consistent with the LIDAR observation.
4. Terrain-Induced Windshear in Easterly
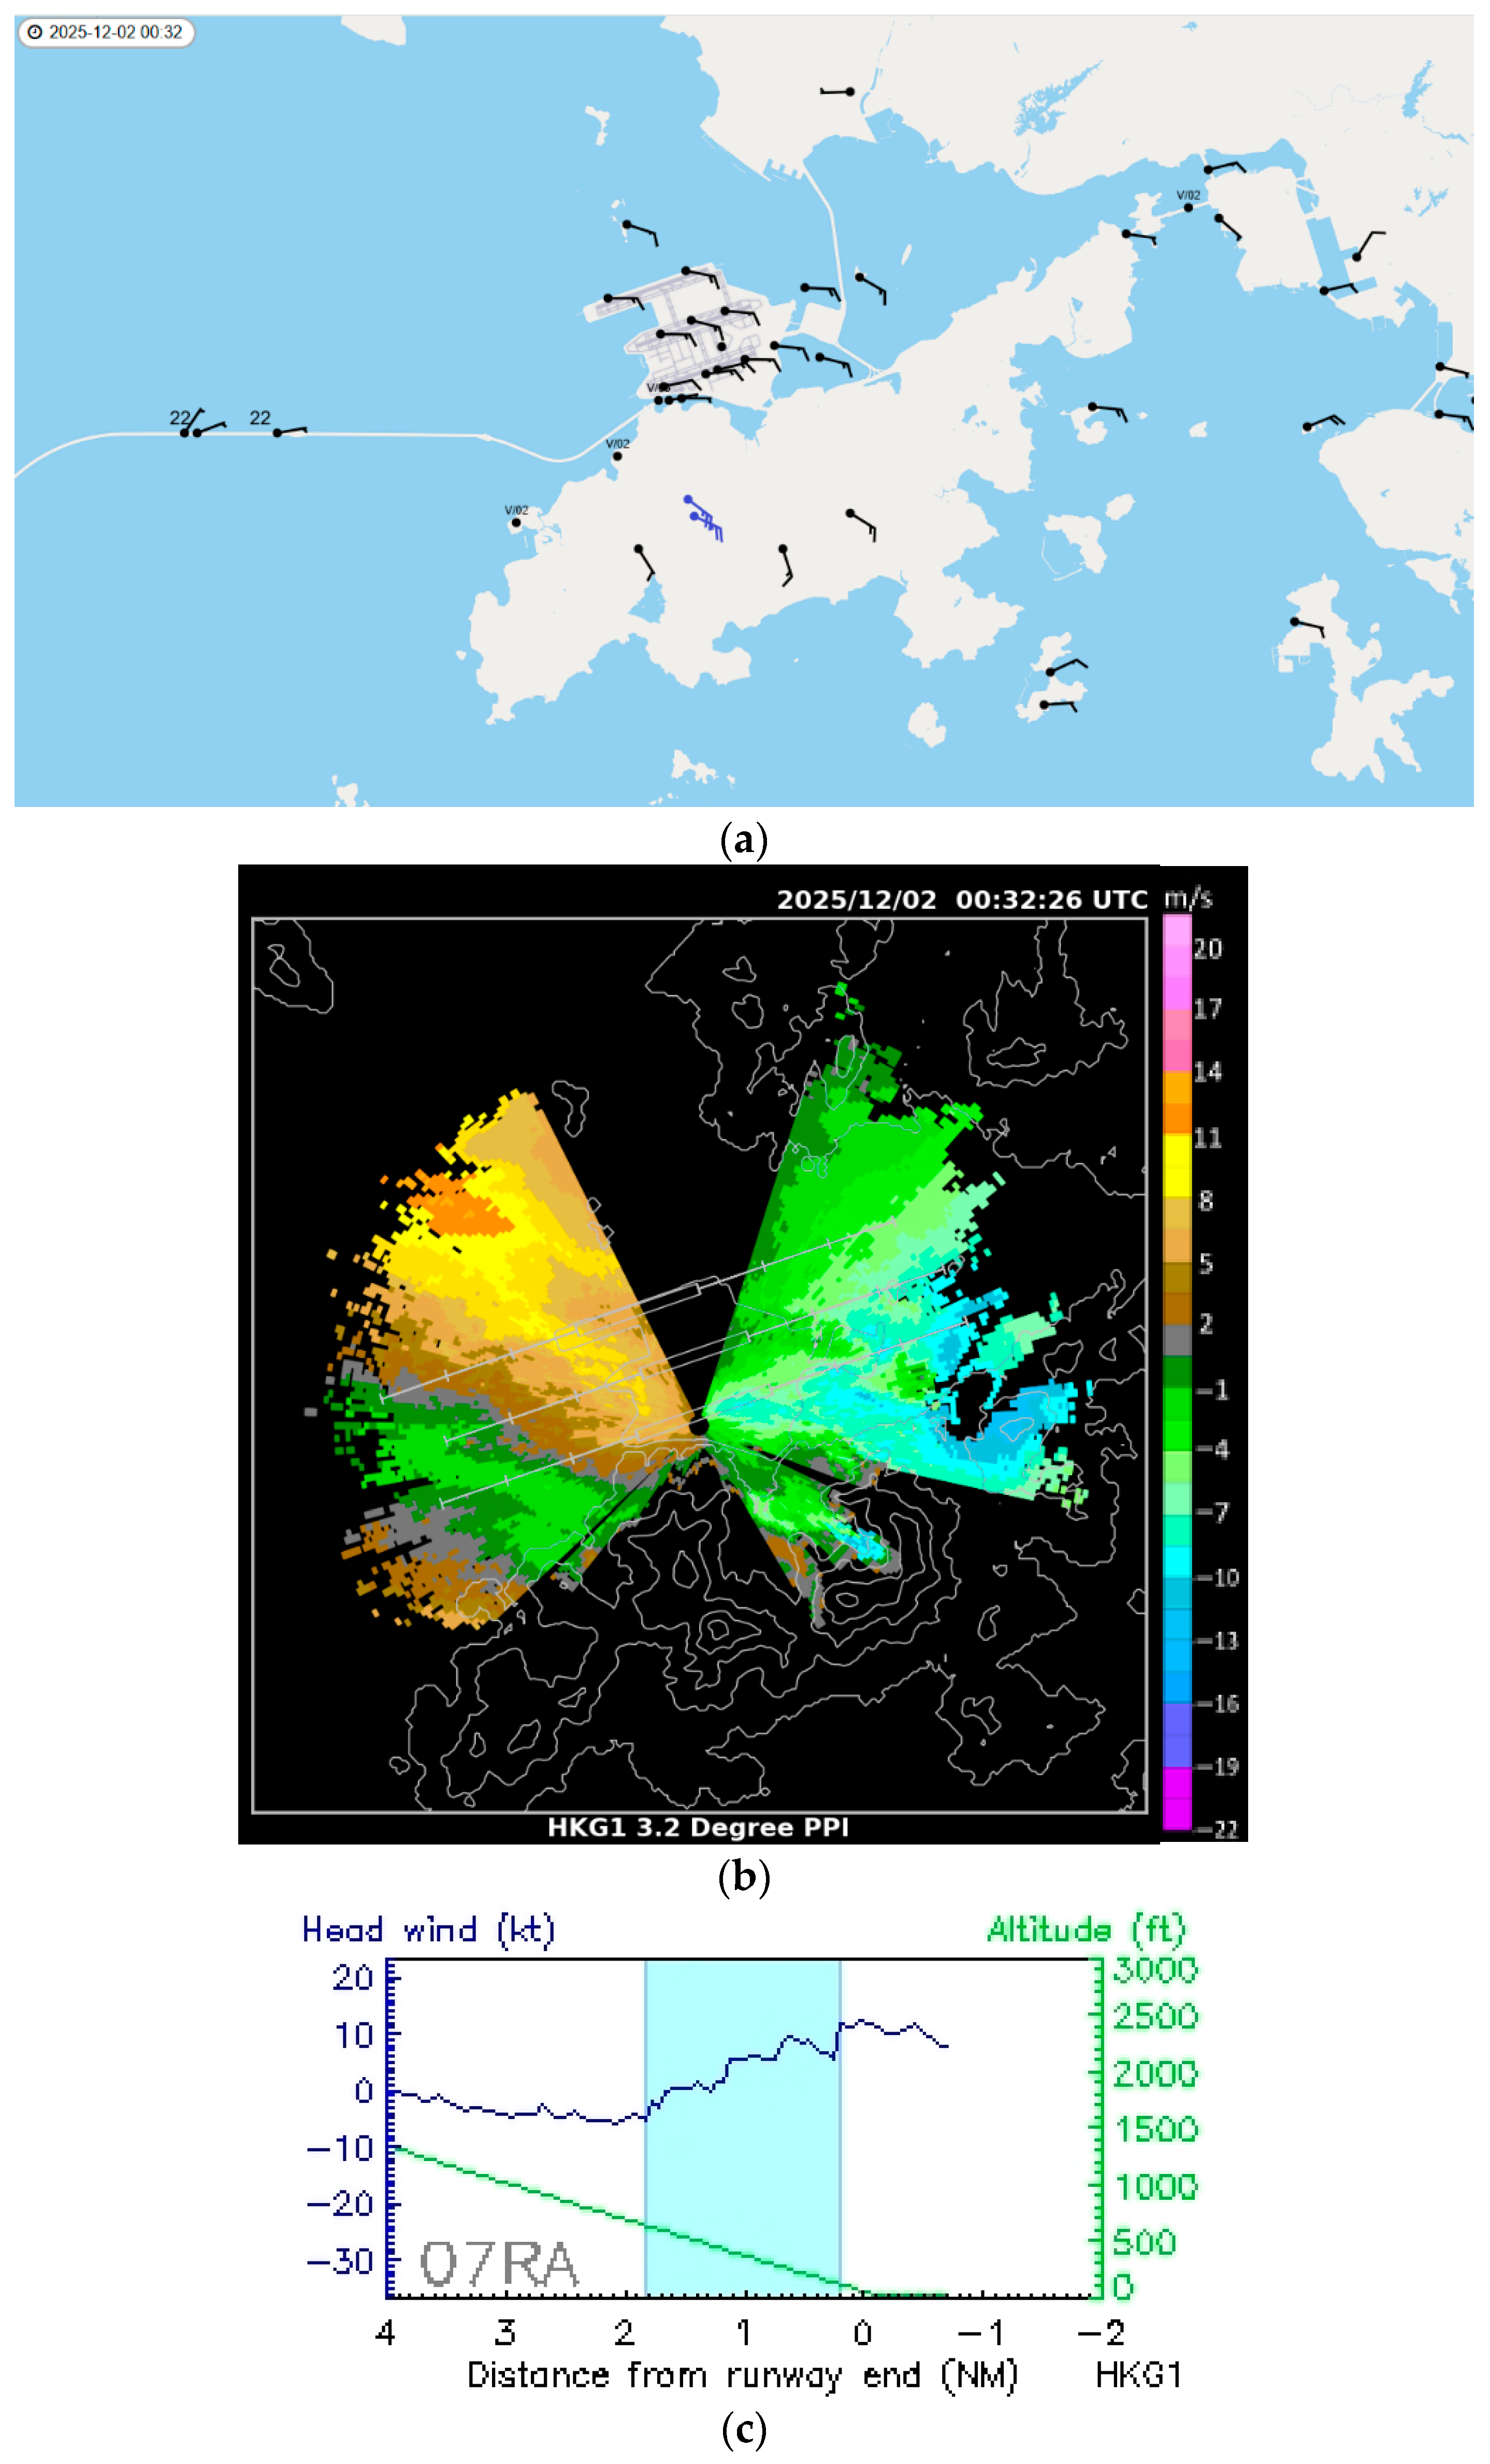
Though it is not very common, easterly winds under a stable boundary layer may occur in the region of HKIA in late autumn to early wintertime, in addition to springtime. One example occurred on the morning of 2 December 2025. The surface observations show moderate to fresh easterly winds prevailing in the airport region (
Figure 7a). On the mountain tops, the wind shows a more southerly component and reaches strong level (blue wind barbs) occasionally.
The wind pattern at the airport region shows up more nicely in the PPI scan of the LIDAR HKG1 (
Figure 7b). That figure also includes the headwind profiles obtained by the LIDAR during the glide-path scans [
17]. Against the prevailing east to southeasterly, there is an extensive area of reverse flow downstream of the mountain (green in colour, in-bound flow with respect to the LIDAR) covering the seas to the west of HKIA. As such, for the aircraft landing at the south runway from the west, significant windshear was alerted based on the LIDAR’s glide-path scan, with the windshear region highlighted in blue in the headwind profile of
Figure 7b for 07RA. This is consistent with a pilot report at that time, namely, at 00:37 UTC, an aircraft over 07RA reported encountering a windshear of headwind gain of 15 knots at a height of 150 feet above sea level.
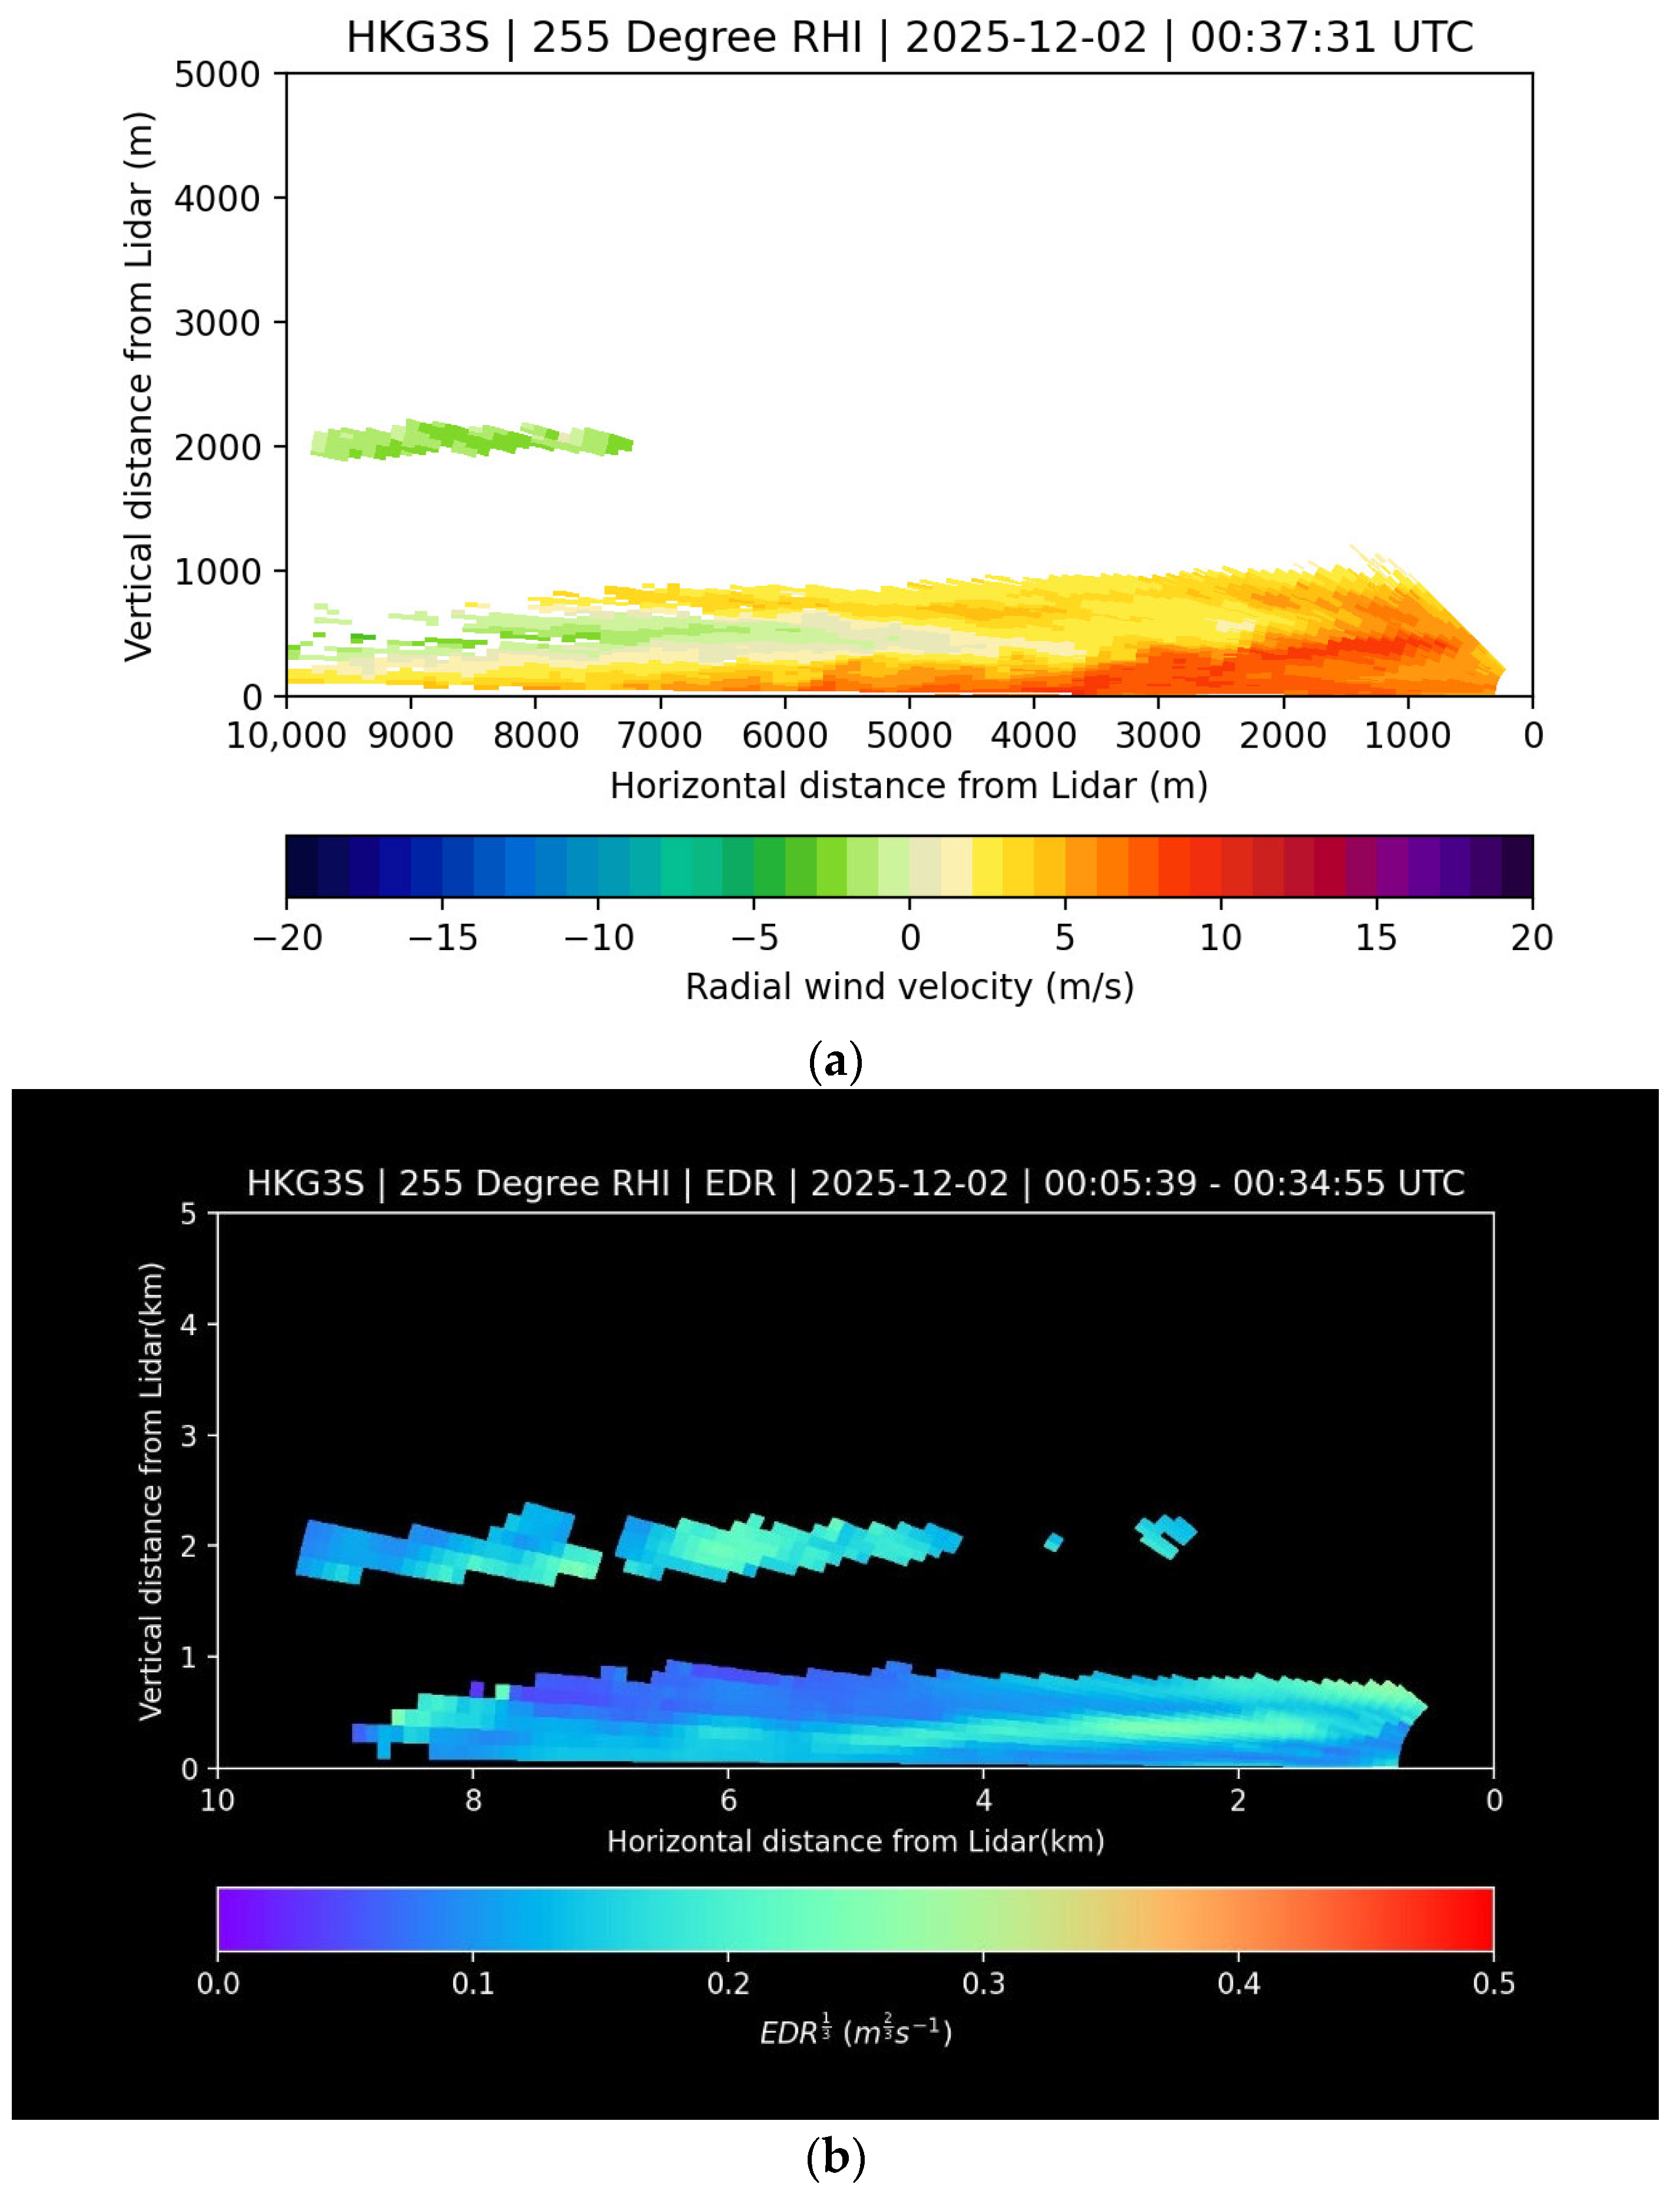
The RHI scans of the LIDARs depict the mountain wake very well. An example is shown in
Figure 8a. Near the surface, the velocity remains out-bound, consistent with the prevailing easterly winds near the surface (
Figure 7a). The same out-bound flow also appears at higher altitude, generally above the tops of the mountains at a height of about 800 to 1000 m above sea level. However, in between these two regions of out-bound flow, there is an extensive region of in-bound flow (coloured green in
Figure 7a, extending from a distance of 3000 to 4000 m from the LIDAR up to about 10,000 m from the LIDAR). This in-bound flow region is related to the mountain wake, as shown in the PPI scan of the LIDAR (
Figure 7b).
From the LIDAR RHI EDR map (
Figure 8b), higher EDR (moderate turbulence in the region of around 0.2 to 0.3 m
2/3s
−1) is analyzed at the interface between the in-bound flow of the wake and the out-bound easterly flow beneath it, and this region generally descends with distance from the LIDAR. This is the first time that an RHI EDR map is obtained for mountain wake under easterly flow at HKIA under a stable boundary layer. Due to the generally weak turbulence at the interface between the wake and the near-surface easterly flow, the turbulence experience may not be significant for the pilot, and thus only one windshear report is provided by a pilot for this event.
5. Terrain-Induced Windshear in Northeasterly
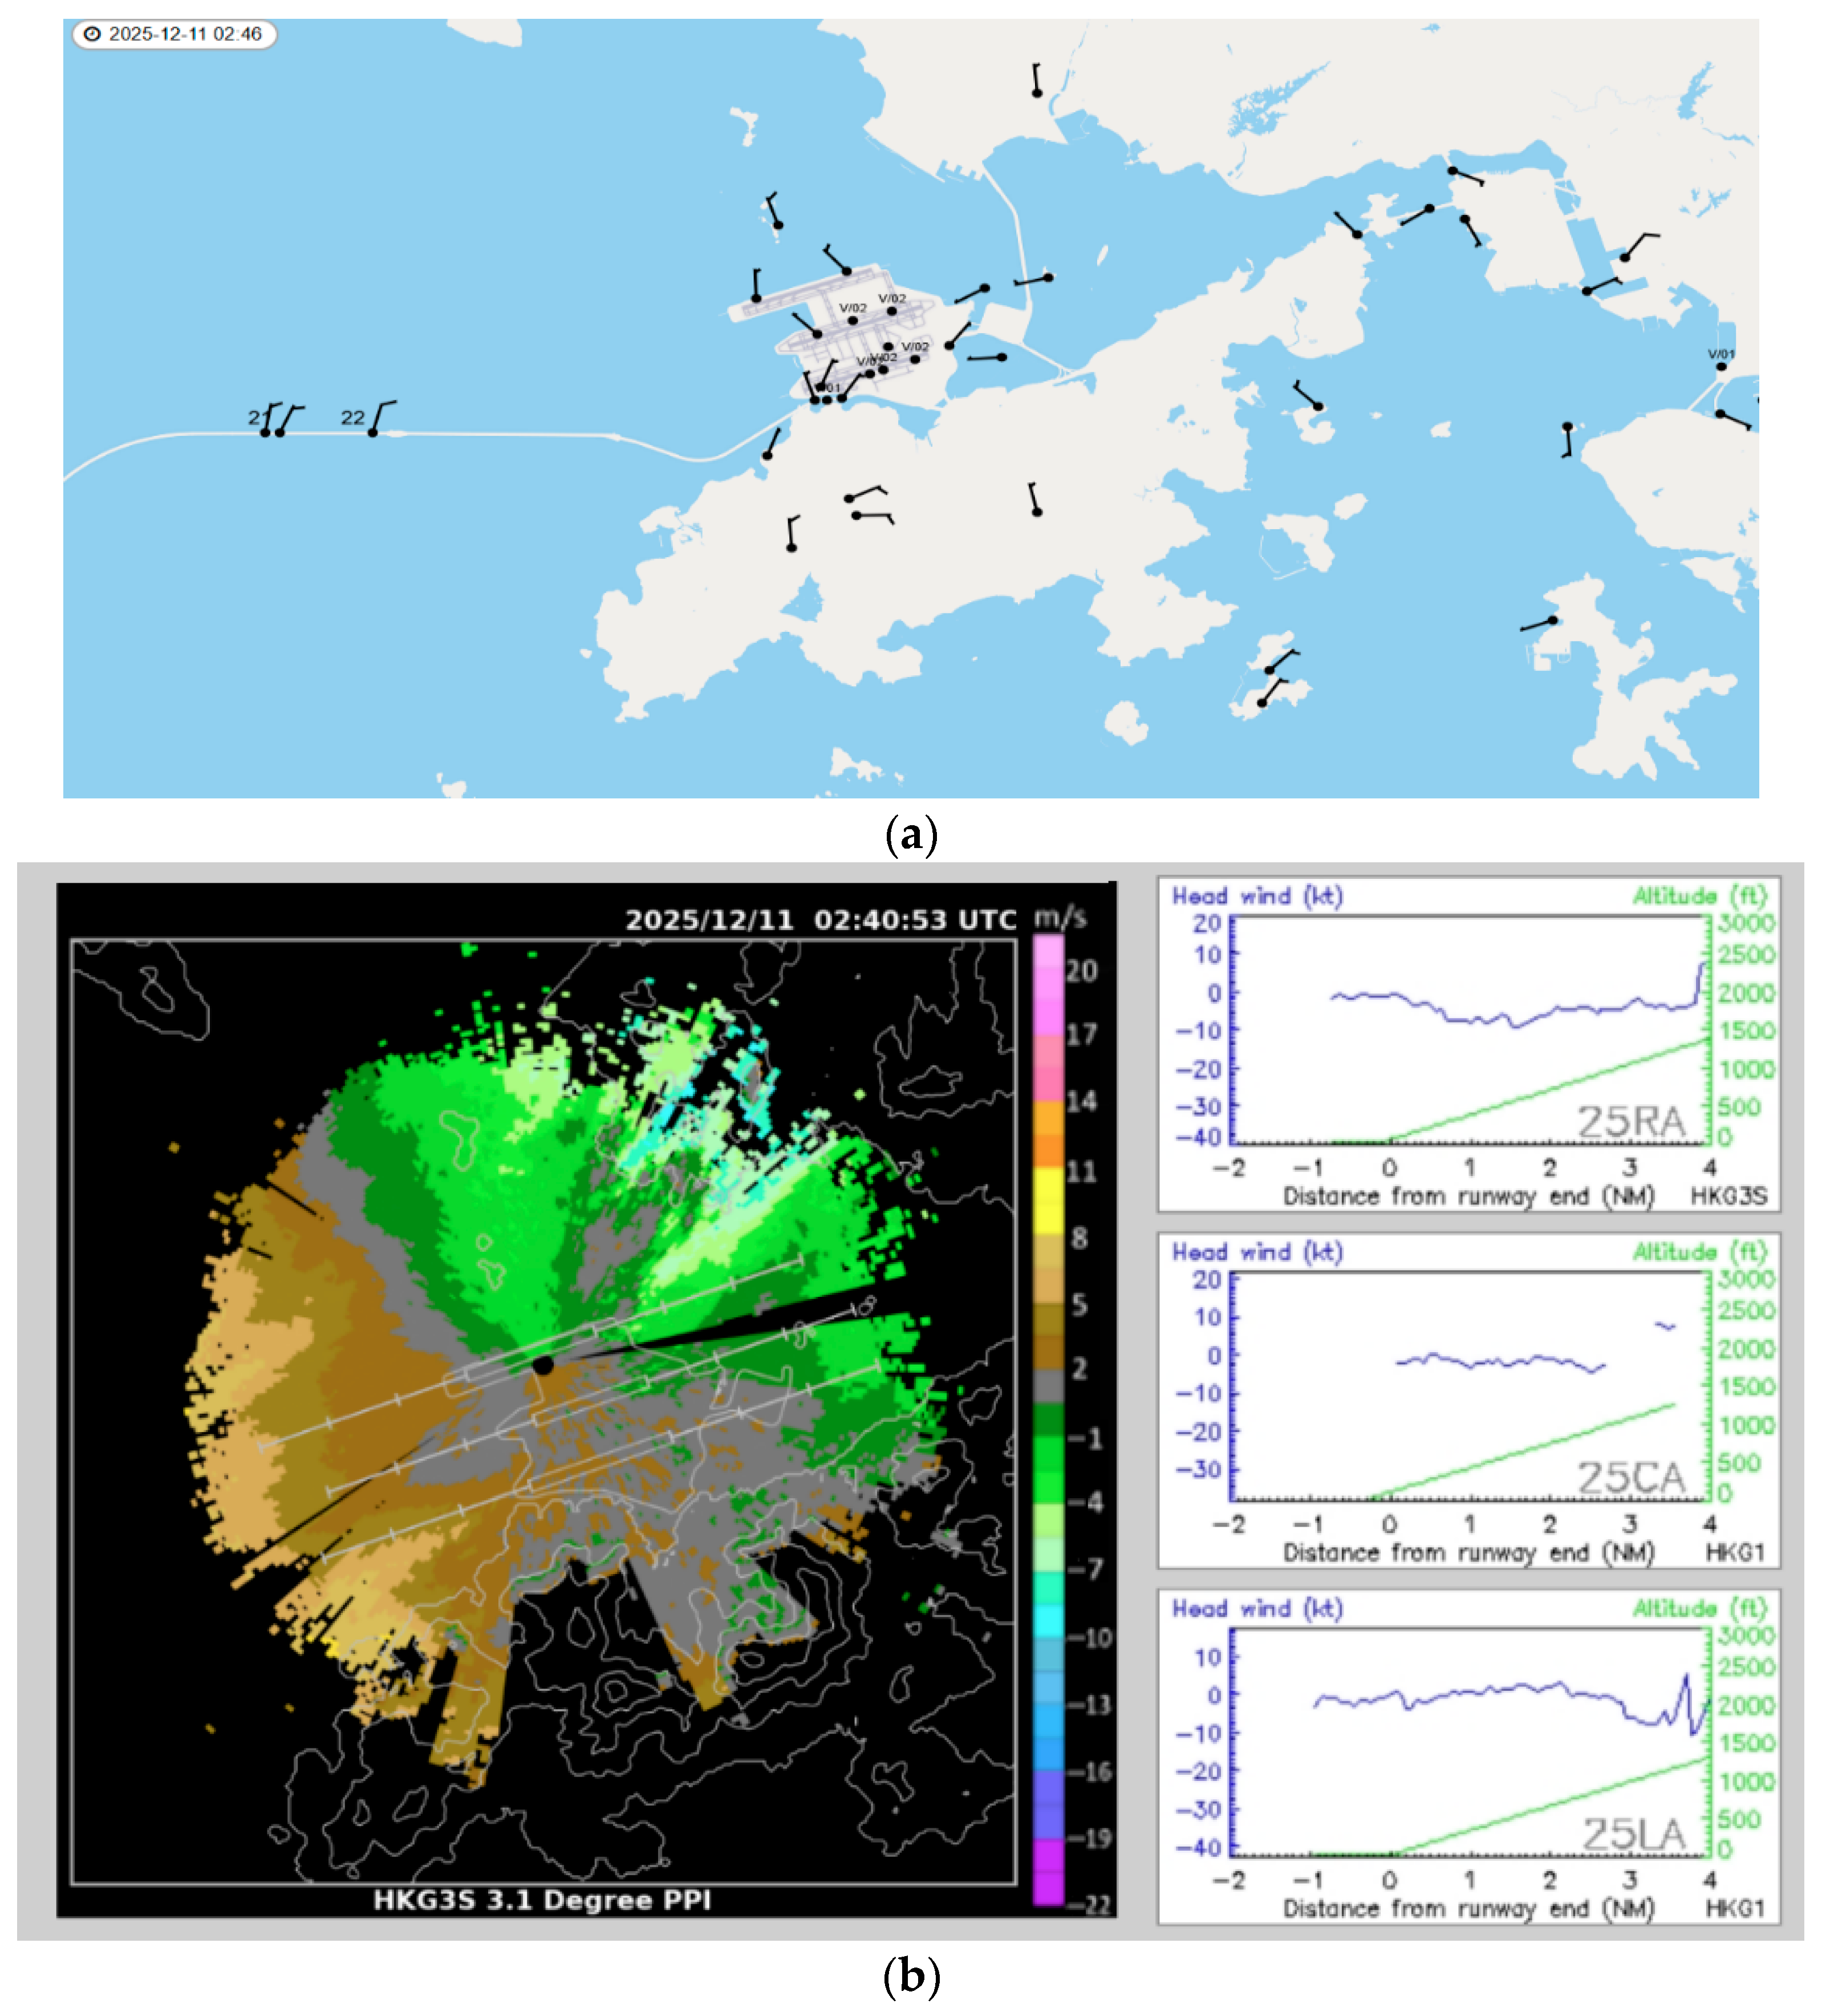
Apart from easterly wind, terrain-induced windshear may also occur in northeasterly wind situations due to the presence of mountains which are about 300 to 400 m above sea level to the north and northeast of the airport and the valleys in between, though such windshear is rather rare. One example occurred on the morning of 11 December 2025, with the prevalence of weak north to northeasterly winds in the region (surface observations in
Figure 9a, and the LIDAR PPI Doppler velocity image in
Figure 9b).
With abundant sunshine, sea breeze set in over the airport at about 02 UTC (10 a.m. local time, with Hong Kong time = UTC + 8 h). Surface winds turned to weak northerlies at the north runway, and light westerlies at the weather buoy and island weather station to the east (
Figure 9a). Based on the surface pattern, 25RA runway corridor had been adopted for landing, namely, landing at the north runway from the east. Under this kind of light wind condition, the chance of terrain-induced windshear may be considered to be rather low [
4]. Moreover, though there was a sea breeze, no converging wind due to a sea breeze front was observed from the surface stations, and thus the chance of sea breeze-related windshear was considered to be rather unlikely.
However, it turns out that there is terrain-induced windshear in this case. A pilot report was received at 02:46 UTC, containing low-level windshear over 25RA at 1 nautical mile away from the runway end and a headwind gain of 15 knots. The LIDAR data shows the origin of this windshear rather clearly. In the PPI scan (
Figure 9b), there was indeed a north-northeasterly jet (Doppler velocity of around 10 m/s) emerging from a valley to the northeast of the airport, and the jet just manages to touch at around 1 nautical mile to the east of the north runway of HKIA. Closer to the runway end, the near-surface winds are light, as shown from both surface anemometer (
Figure 9a) and LIDAR (
Figure 9b) observations. As such, there is a change of tailwind to near-zero headwind when the aircraft flies through the jet and arrives at the airport, as shown in the headwind profile from the glide-path scan of the LIDAR (
Figure 9b). This is consistent with the headwind gain report of the pilot. However, the magnitude of the headwind gain reported by the pilot is larger than the headwind change as detected by the LIDAR, which may be related to (i) the slight difference in timing of the pilot report and the LIDAR scan, (ii) the subjective nature of the estimation of headwind change by the pilot when reporting low-level windshear, and (iii) the lower detection efficiency of the LIDAR towards the runway end.
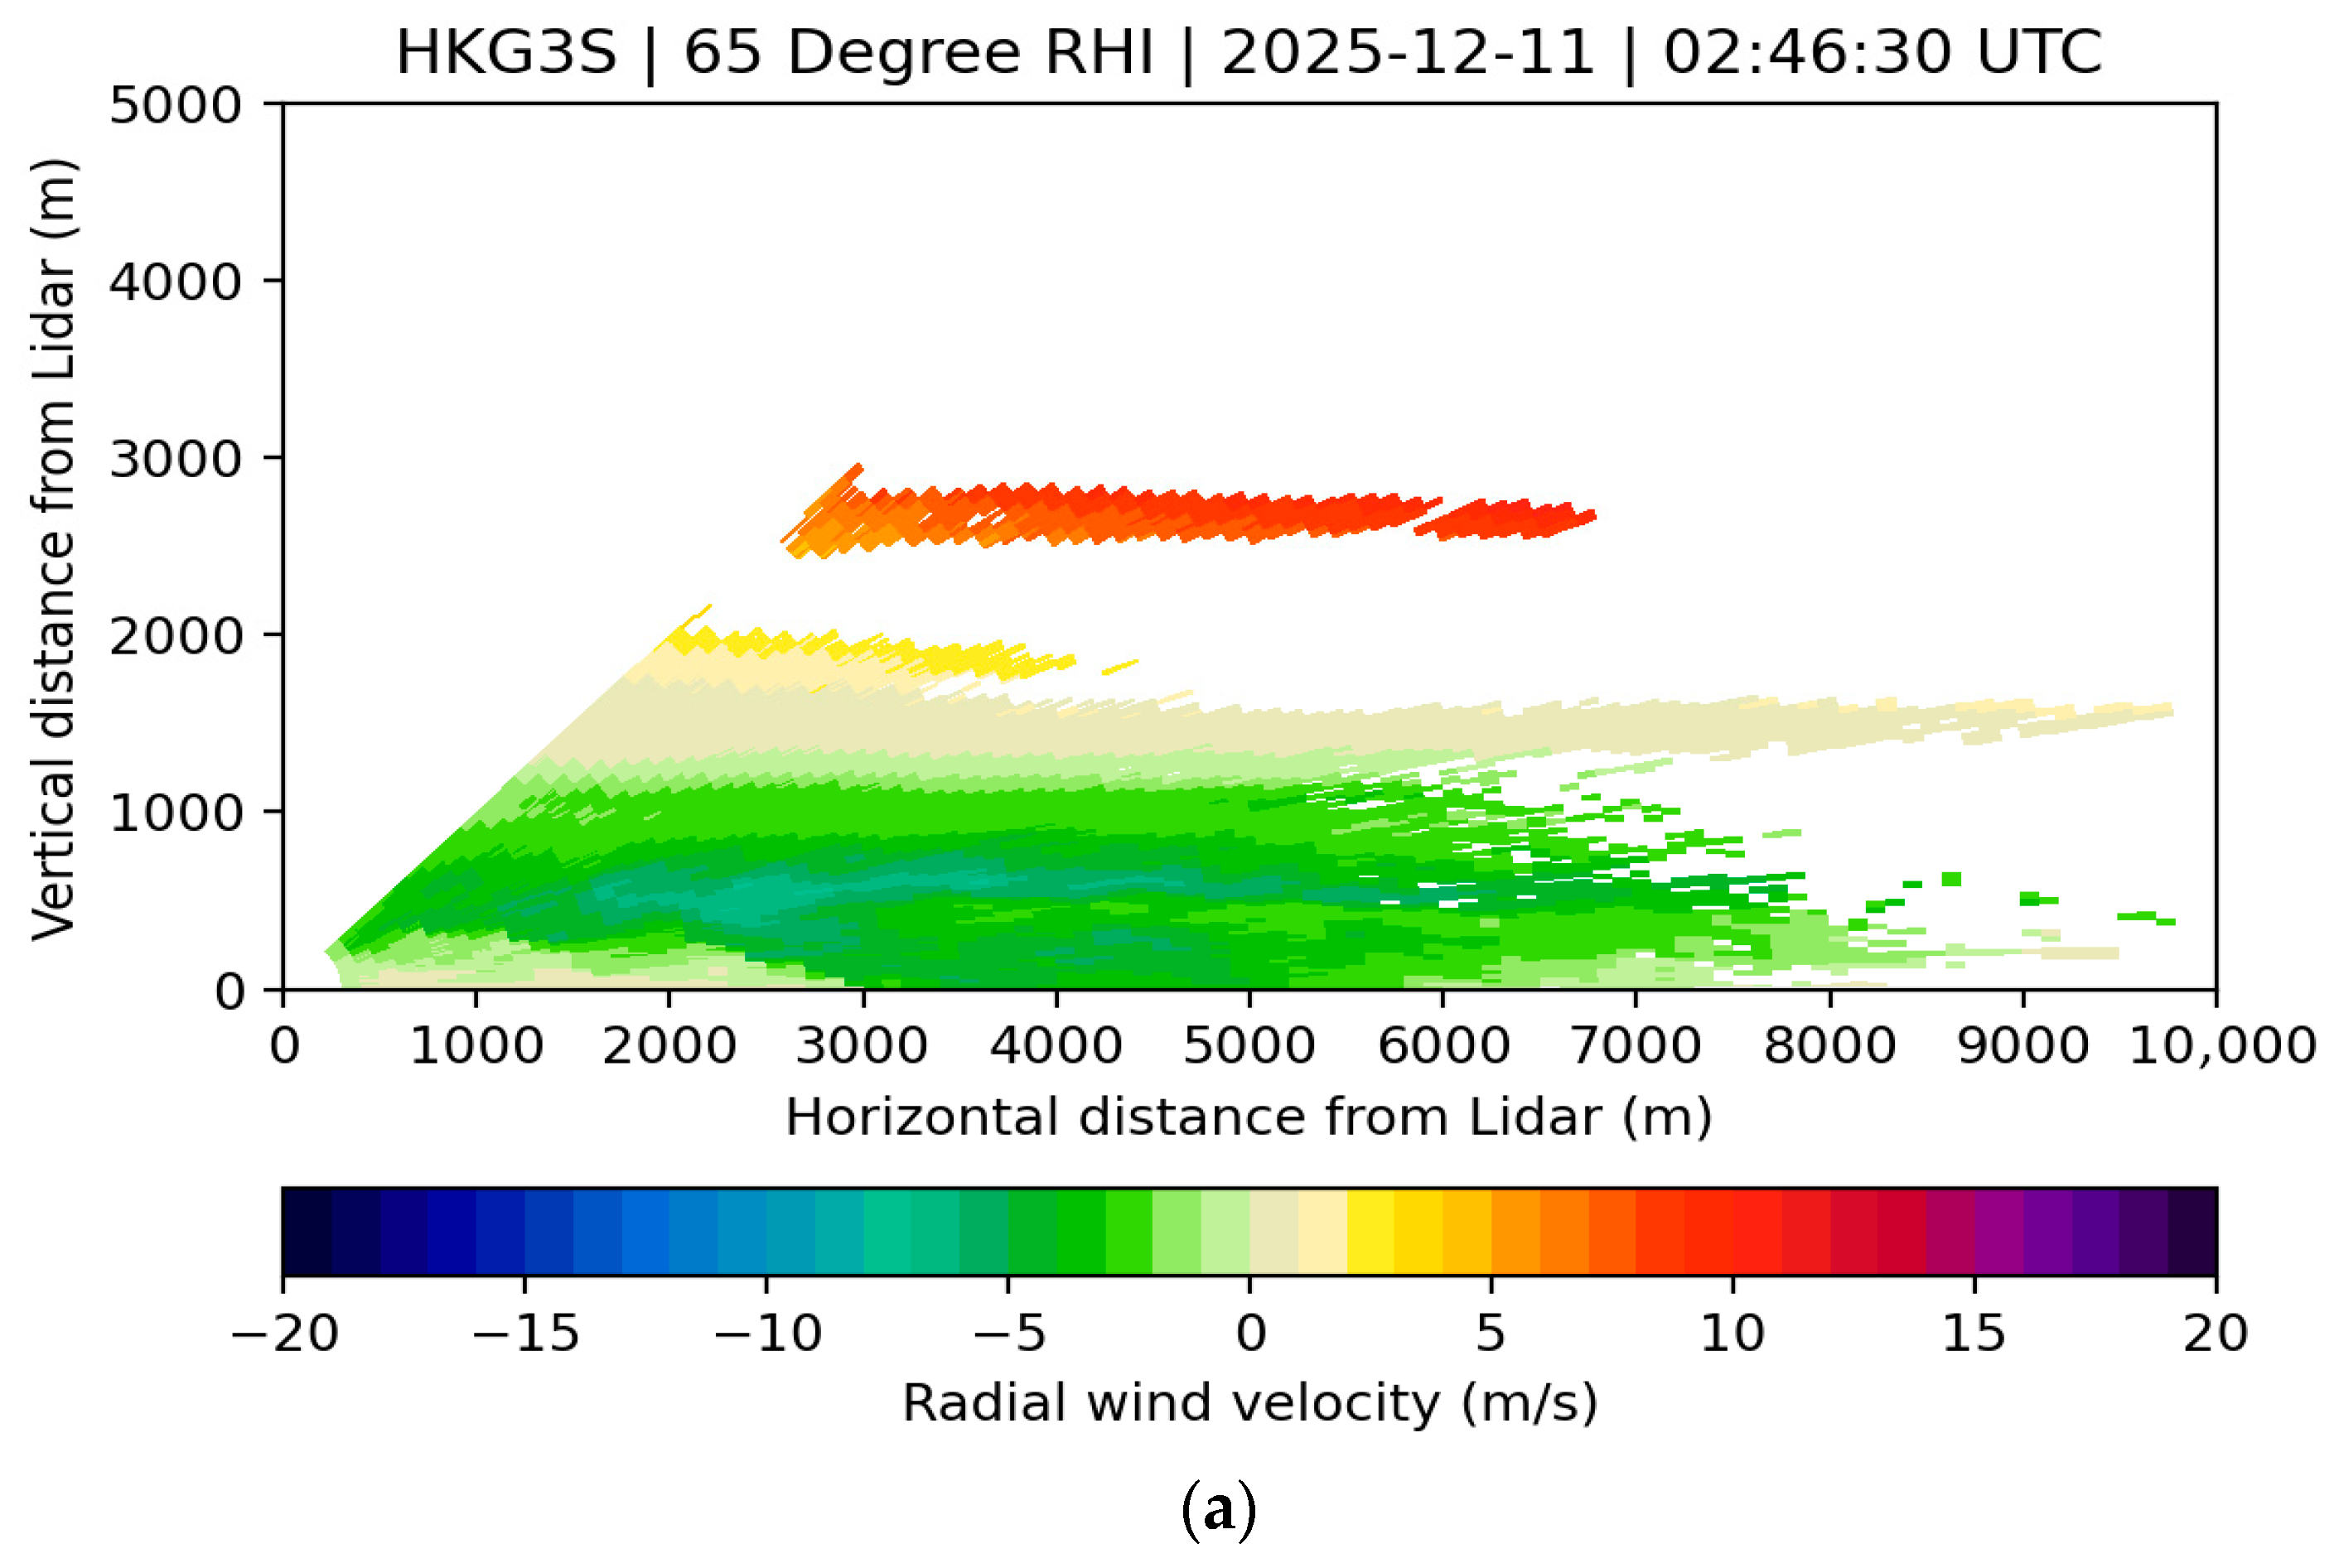
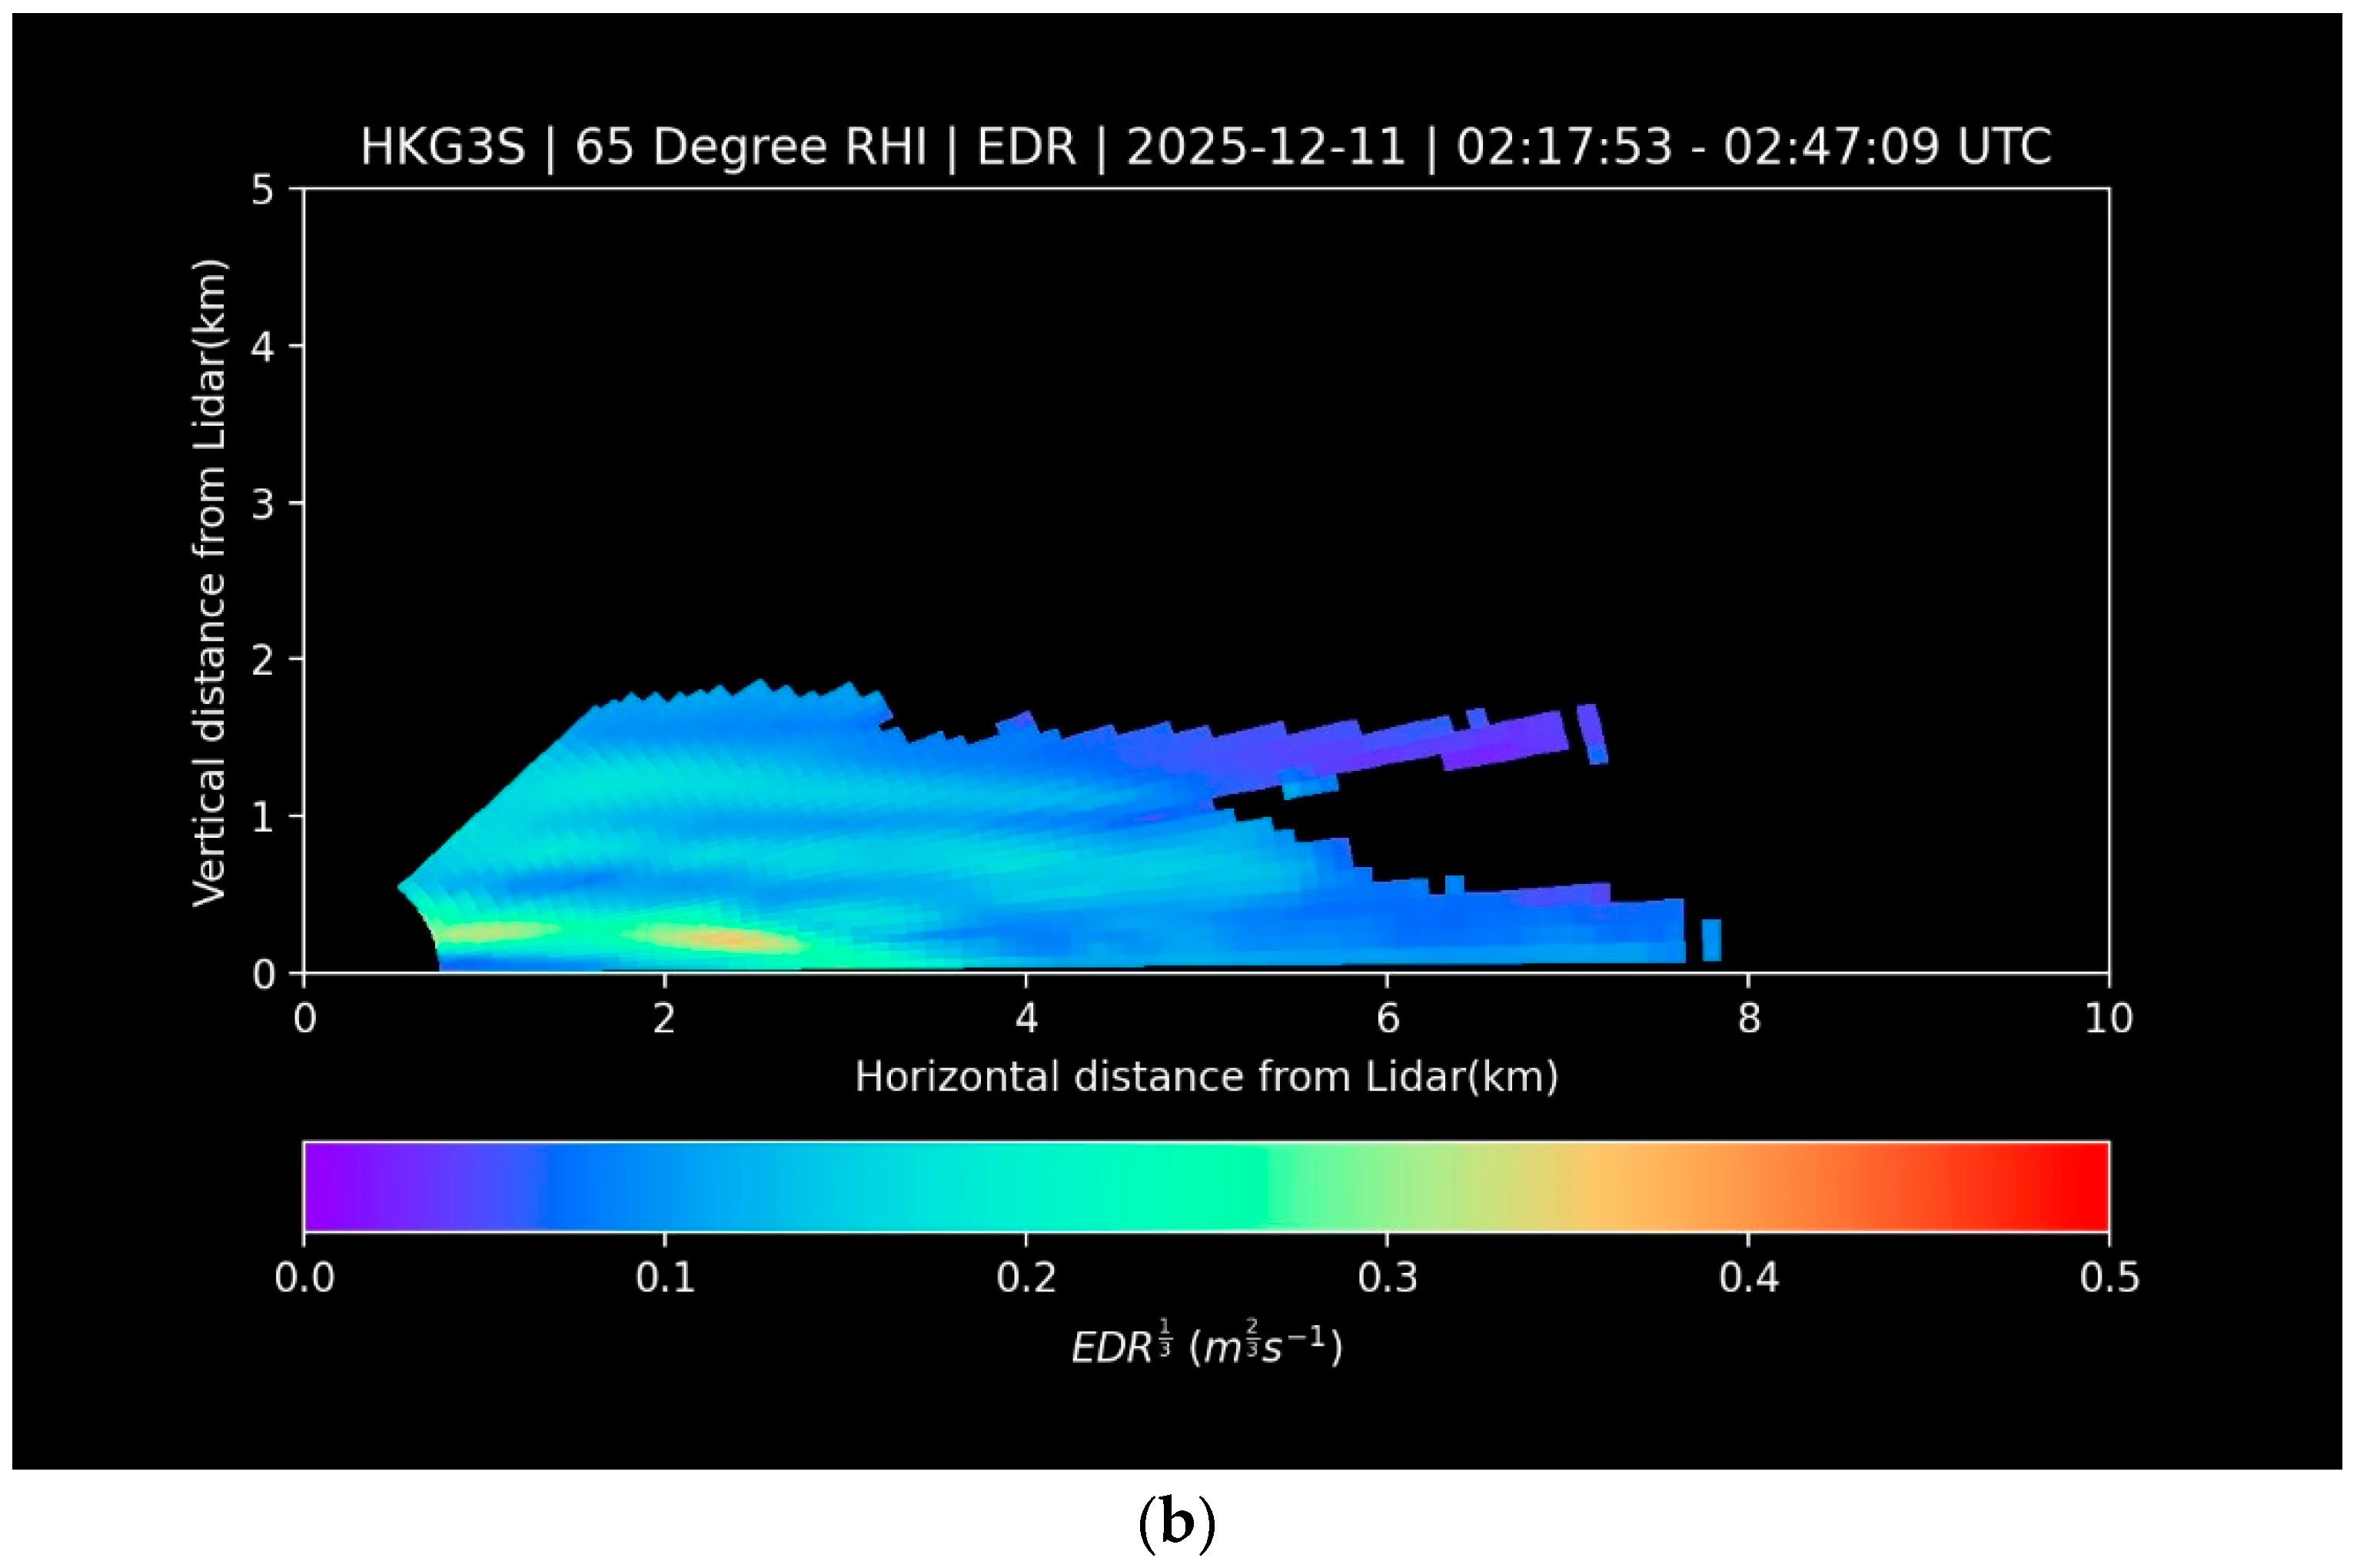
From the RHI scan of HKG3S LIDAR (
Figure 10a), the interface between the in-bound flow from the jet and light out-bound flow over the airport shows up clearly, with the interface near the surface occurring at about 3000 m from the LIDAR where the height of the interface was about 100 to 200 m above sea level. Some waves (with a wavelength of about 1000 m) are also discernible from the interface. At this interface, the EDR is slightly higher than the “background” environment (
Figure 10b), reaching moderate turbulence (around 0.35 m
2/3s
−1, coloured yellow in the figure). The RHI scans of the LIDAR provide additional insight into the nature of the terrain-induced windshear and turbulence in light northerly winds when windshear is not expected.
6. Conclusions
This paper discusses for the first time some case studies of low-level windshear and turbulence at HKIA in late autumn to early winter. The study is made possible with some further enhancements to the meteorological instrumentation at the airport, namely, frequent RHI scans by the long-range LIDARs, and the operation of the Doppler cloud radar. The new instrumentation shows some novel features of windshear and turbulence at the airport, namely, low-level jets, especially in the presence of liquid clouds, elevated and elongated mountain wake in east to southeasterly flow, and terrain-induced windshear in light northerly wind conditions for the north runway of HKIA.
Based on the experience at HKIA, it appears that the combination of LIDAR, cloud radar and terminal Doppler weather radar would be able to work towards all-weather capability for low-level windshear and turbulence for the aircraft pending further algorithm development and statistical evaluation. First of all, there are several limitations about the installation of cloud radar inside the airport due to potential concerns around radiation safety and interference, and as such the siting of this kind of radar is yet to be optimized. The primary concern is around non-ionizing-radiation safety zones, as the cloud radar rely on focused, high-frequency beams that can exceed the maximum permissible exposure limits for humans at close range. To install such equipment in an operating airport to scan for low altitude, in contrast to most weather radars that are elevated on a mountain top, careful planning on the installation location to safeguard ground handling staff and maintenance crews and liaison with airport authorities are required. Also, after the installation, algorithms would need to be developed to use the RHI data from the cloud data to supplement the LIDAR data to build up the all-weather availability of headwind profiles for windshear detection. The spectral width data can be used to calculate EDR based on past research, with verification by aircraft EDR data. Once EDR estimates are made, a combined algorithm would need to be in place to integrate the EDR estimates from all the equipment. The above discussed would be the future research direction for HKIA on low-level windshear and turbulence.