Article

Long-Term In Situ Monitoring of Ambient Gamma Dose Equivalent Rates in Macedonia: Temporal Trends from 2010 to 2020


by
Lambe Barandovski
1,*,
Irena Zlatanovska
1,
Trajče Stafilov
2,3,
Robert Šajn
4 and
Aneta Gacovska-Barandovska
5
1
Institute of Physics, Faculty of Natural Sciences and Mathematics, Ss Cyril and Methodius University in Skopje, P.O. Box 162, 1000 Skopje, Macedonia
2
Institute of Chemistry, Faculty of Natural Sciences and Mathematics, Ss Cyril and Methodius University in Skopje, P.O. Box 162, 1000 Skopje, North Macedonia
3
Research Center for Environment and Materials, Macedonian Academy of Sciences and Arts, Bul. Krste Misirkov 2, 1000 Skopje, North Macedonia
4
Geological Survey of Slovenia, Dimičeva ul. 14, 1000 Ljubljana, Slovenia
5
Institute of Mathematics, Faculty of Natural Sciences and Mathematics, Ss Cyril and Methodius University in Skopje, P.O. Box 162, 1000 Skopje, Macedonia
*
Author to whom correspondence should be addressed.
Atmosphere 2026, 17(1), 104; https://doi.org/10.3390/atmos17010104
Submission received: 30 December 2025 / Revised: 14 January 2026 / Accepted: 15 January 2026 / Published: 19 January 2026
(This article belongs to the Section Atmospheric Techniques, Instruments, and Modeling)

Abstract

In situ measurements of ambient dose equivalent rates were conducted across the territory of Macedonia at five-year intervals in 2010, 2015, and 2020. Data were collected from 68 uniformly distributed locations in 2010 and from 72 locations in both 2015 and 2020, ensuring representative spatial coverage. The main objective of this study was to establish a baseline dataset of outdoor gamma dose rates, evaluate their potential temporal variations, and identify the dominant factors influencing their spatial variability. The results indicate a high degree of temporal stability over the investigated decade, with mean values of 113 nSv/h in 2010 and 110 nSv/h in both 2015 and 2020. Following descriptive statistical analysis, spatial distribution maps were created, revealing that the observed dose rate variability is primarily associated with the country’s diverse geology rather than anthropogenic sources. These findings confirm the reliability of direct in situ monitoring and provide a robust reference framework for assessing environmental and atmospheric contributions to external gamma radiation exposure in Macedonia.

1. Introduction

Human exposure to ionizing radiation from external gamma radiation is a permanent and unavoidable part of everyday life. This exposure originates from radionuclides in the Earth’s crust (rocks, soils, and water) and from cosmic radiation. Although these exposures are generally low, their assessment is fundamentally importance, as prolonged or elevated dose levels may increase the probability of adverse health effects, including cancer [1,2,3].
According to UNSCEAR, the average annual effective dose from external exposure to natural terrestrial radiation is approximately 0.48 mSv, with about 0.41 mSv arising from indoor exposure and 0.07 mSv from outdoor exposure. In most countries, average effective doses from terrestrial external exposure range from 0.3 to 0.6 mSv, indicating relatively moderate global variability [4]. Nevertheless, some regions worldwide have radiation levels that significantly exceed global averages due to specific geological settings, such as radionuclide-rich soils and rocks, resulting in naturally high background radiation areas [5].
In addition, to natural variability, environmental radiation levels may be influenced by anthropogenic factors, including localized industrial activities and large-scale radiological events. Anthropogenic influences can be categorized as (i) large-scale radiological events leading to regional atmospheric dispersion and deposition of artificial radionuclides, and (ii) localized industrial contributions that may affect dose rates near emission sources through redistribution of naturally occurring radioactive materials.
Major radiological events, such as the accidents at the Chernobyl Nuclear Power Plant and the Fukushima Daiichi Nuclear Power Plant, resulted in large-scale atmospheric dispersion and deposition of artificial radionuclides over extensive areas. In Europe, fallout from the Chernobyl accident led to widespread contamination by 137Cs, which has been detected across many countries, including regions far from the accident site [6]. Furthermore, industrial activities such as mining, smelting, and the operation of thermal power plants may locally enhance ambient gamma dose rates through the redistribution of naturally occurring radioactive materials, thereby influencing external exposure pathways [7,8,9,10,11,12].
Given these factors, systematic environmental radiation monitoring is essential to quantify population exposure, identify areas of increased radiological significance, and support evidence-based decision-making in the event of radiological incidents. According to UNSCEAR, two complementary approaches provide reliable estimates of external exposure from radionuclides present in soils: direct in situ measurements and indirect assessments based on activity concentrations of relevant radionuclides in soil. The principal contributors to terrestrial external gamma radiation are 40K and radionuclides belonging to the decay chains of 238U and 232Th, while artificial radionuclides such as 137Cs may locally increase dose rates depending on their deposition history and environmental redistribution. More broadly, environmental monitoring may also employ in situ approaches based on physical proxies or sensor-based indicators to complement exposure assessment, although such methods are not the focus of the present work [5].
Across Europe, direct ambient dose equivalent rate monitoring is conducted continuously through extensive national networks comprising more than 4500 monitoring stations operated by authorities responsible for radiation protection. These networks collectively contribute to the EURDEP system, managed by the Joint Research Centre of the European Commission. Macedonia is among the participating countries, contributing data from 14 monitoring stations distributed across its territory [13]. Beyond emergency response, such long-term datasets provide valuable insight into atmospheric and environmental processes controlling external gamma radiation exposure.
Despite continuous monitoring, detailed spatial assessments of ambient dose equivalent rates in Macedonia remain limited and are available only for selected regions, such as Bitola, Veles, and Kavadarci [14,15]. While these studies provide valuable insight into local radiation levels and contributing factors, they do not offer a comprehensive overview picture of external gamma exposure across the entire country. To address this limitation, the present study includes systematic ambient dose equivalent rate measurements at the same locations where moss samples were collected during the first national moss biomonitoring survey of air pollution with potentially toxic elements [16,17]. Measurements were conducted within a regular 17 × 17 km grid and repeated at five-year intervals between 2010 and 2020. Combining ambient dose equivalent rate data with an independent indicator of atmospheric deposition and pollutant transport, strengthens the environmental interpretation, supporting a more integrated assessment of environmental quality.
The main objective of this study is to establish a national-scale, long-term baseline of ambient gamma dose equivalent rates in Macedonia based on repeated in situ surveys and to evaluate their temporal evolution over a ten-year period. By comparing measurements obtained in 2010, 2015, and 2020, the study aims to determine whether the observed spatial pattern of ambient dose equivalent rates remains stable over time or shows evidence of significant change. The study also compares the results with previous national investigations and examines differences between direct measurements and indirect dose assessment approaches to evaluate their consistency. Additionally, the analysis aims to identify the relative contributions of natural geological factors, anthropogenic influences, and atmospheric deposition processes, to ambient dose equivalent rates.

2. Experimental

2.1. Study Area

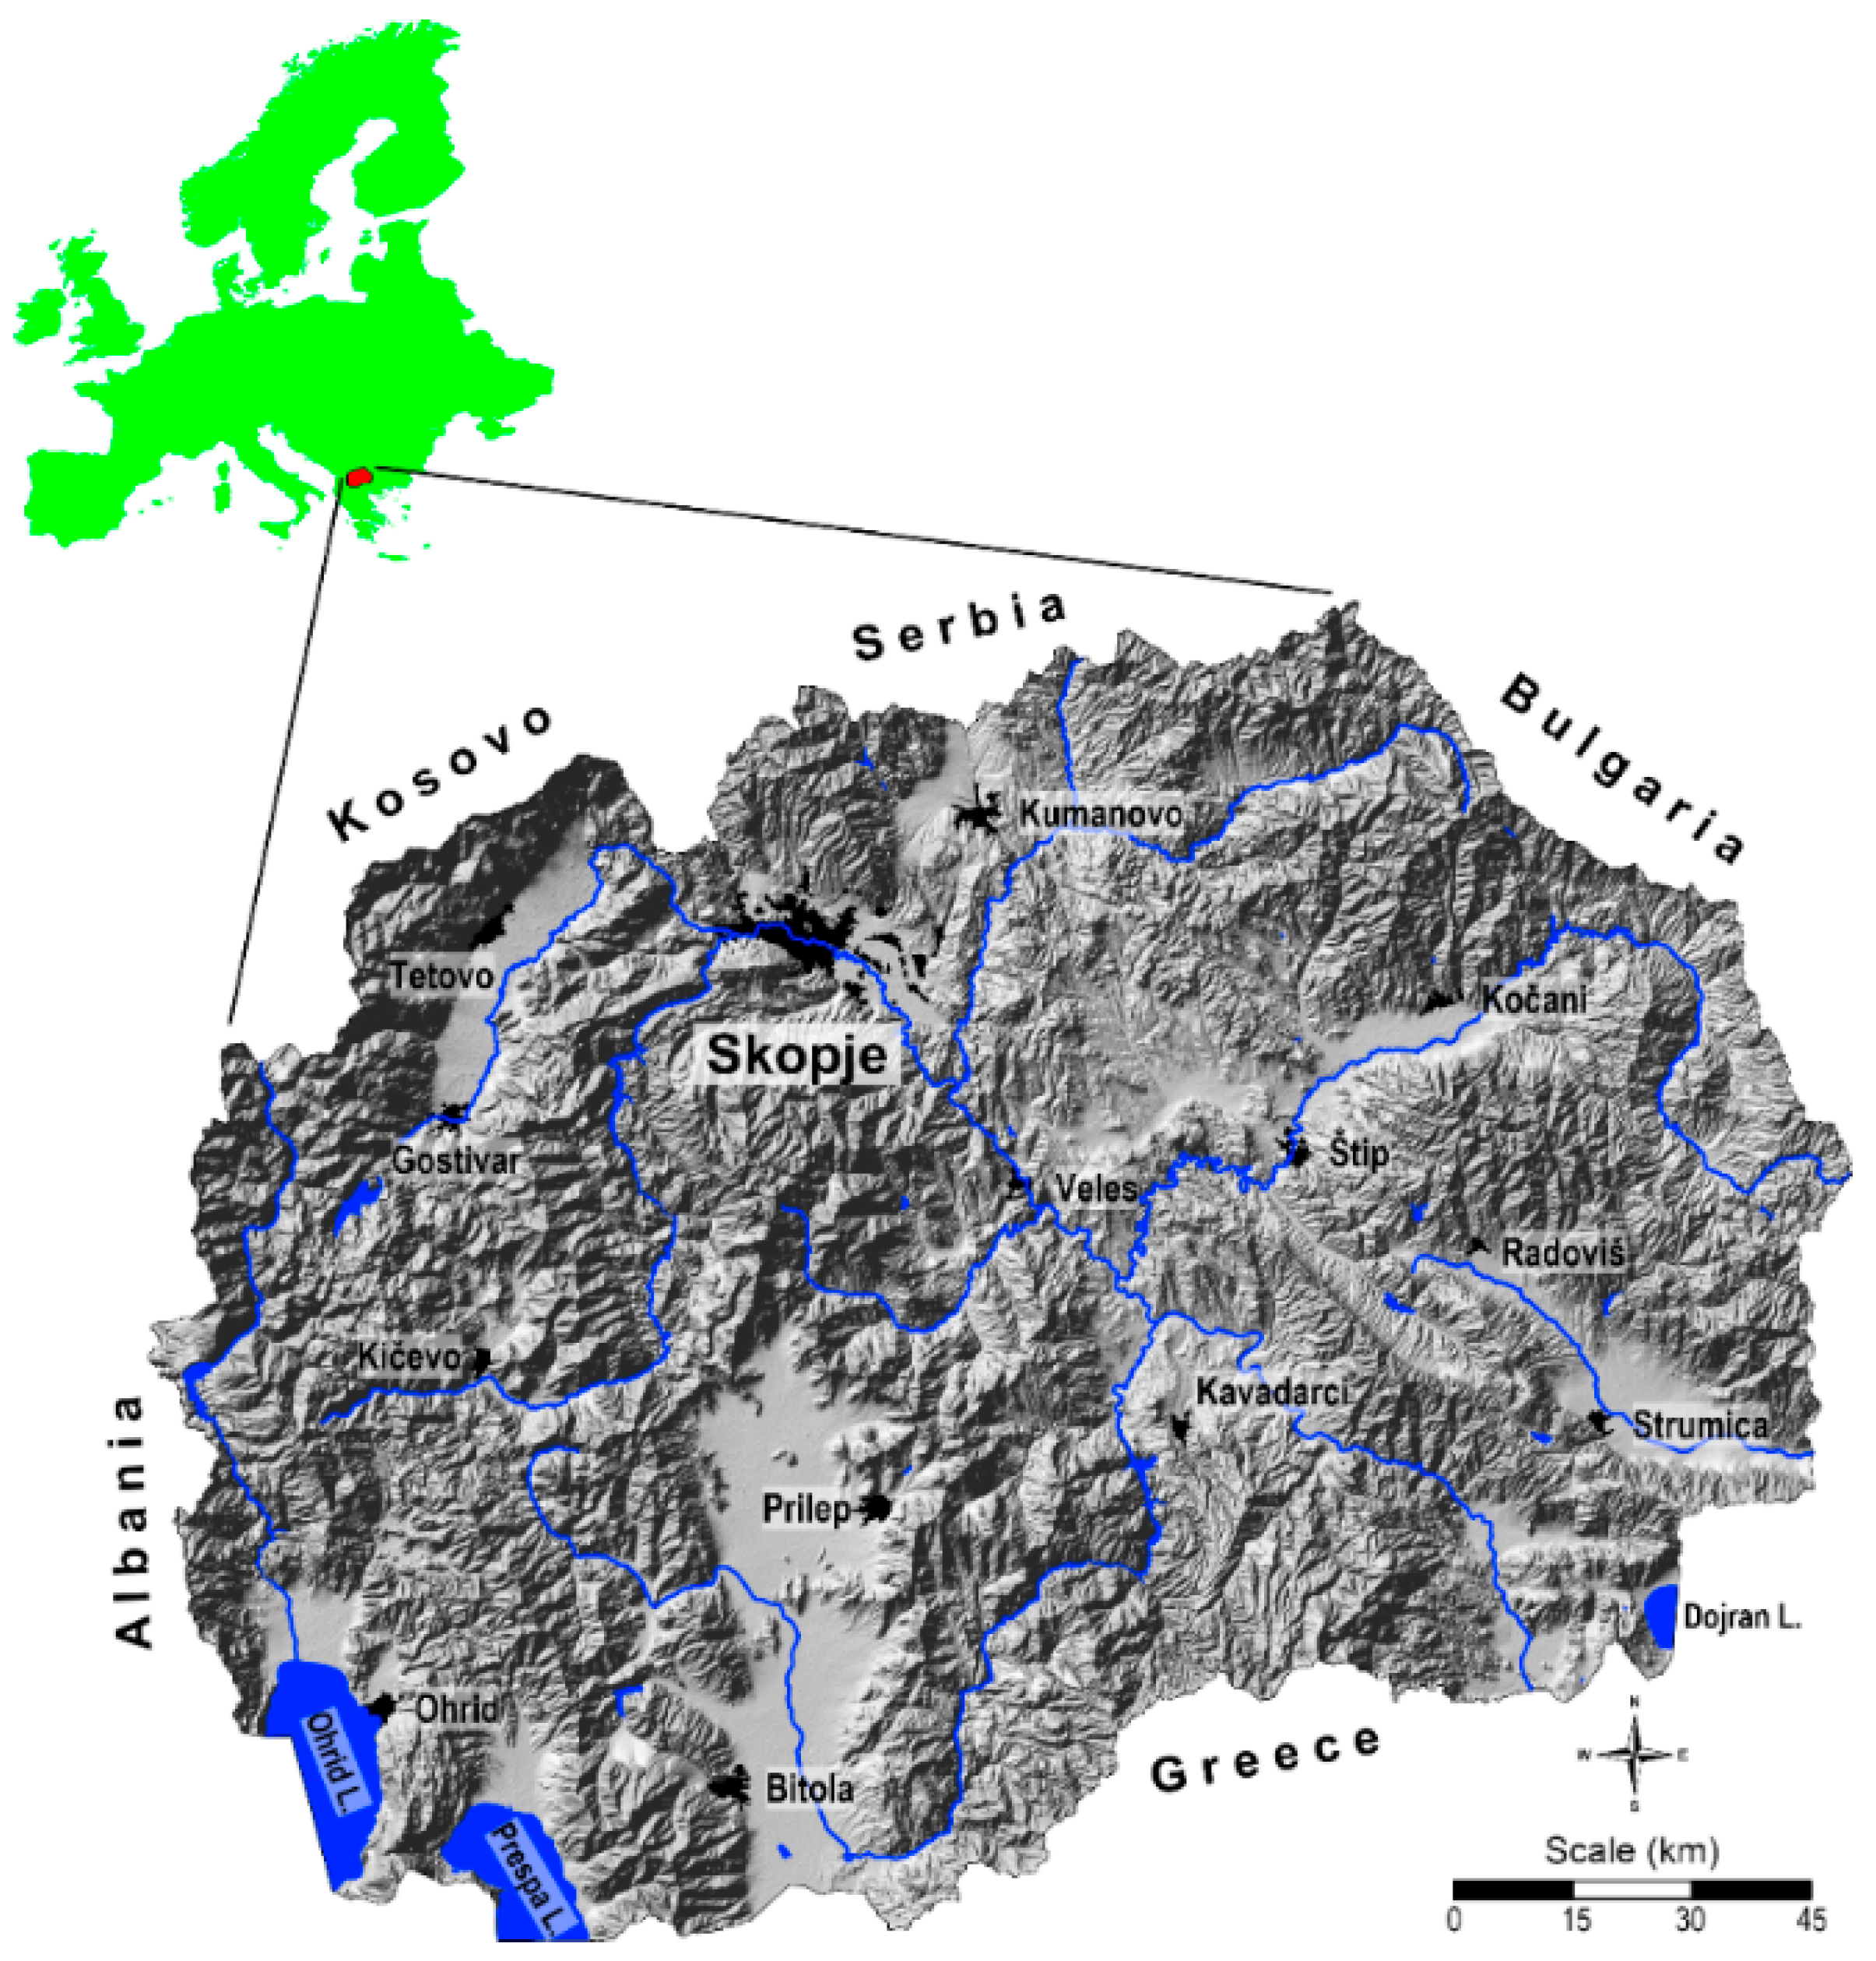
Macedonia is located in southeastern Europe, in the central part of the Balkan Peninsula, between latitudes 40°50′ and 42°20′ N and longitudes 20°27′ and 23°05′ E (Figure 1). The country covers a total area of 25,713 km2 and is bordered by Serbia to the north, Kosovo to the northwest, Bulgaria to the east, Albania to the west, and Greece to the south. The territory of Macedonia is predominantly mountainous, with approximately two-thirds of its area consisting of mountain ranges, which strongly influence its geomorphological and environmental characteristics. Two main climate types can be distinguished, namely a temperate continental climate and a modified Mediterranean climate, whose influence extends along the Vardar River valley. Detailed descriptions of Macedonia’s geographical position, climate, demographic characteristics, and industrial development are available in previous studies [18,19].
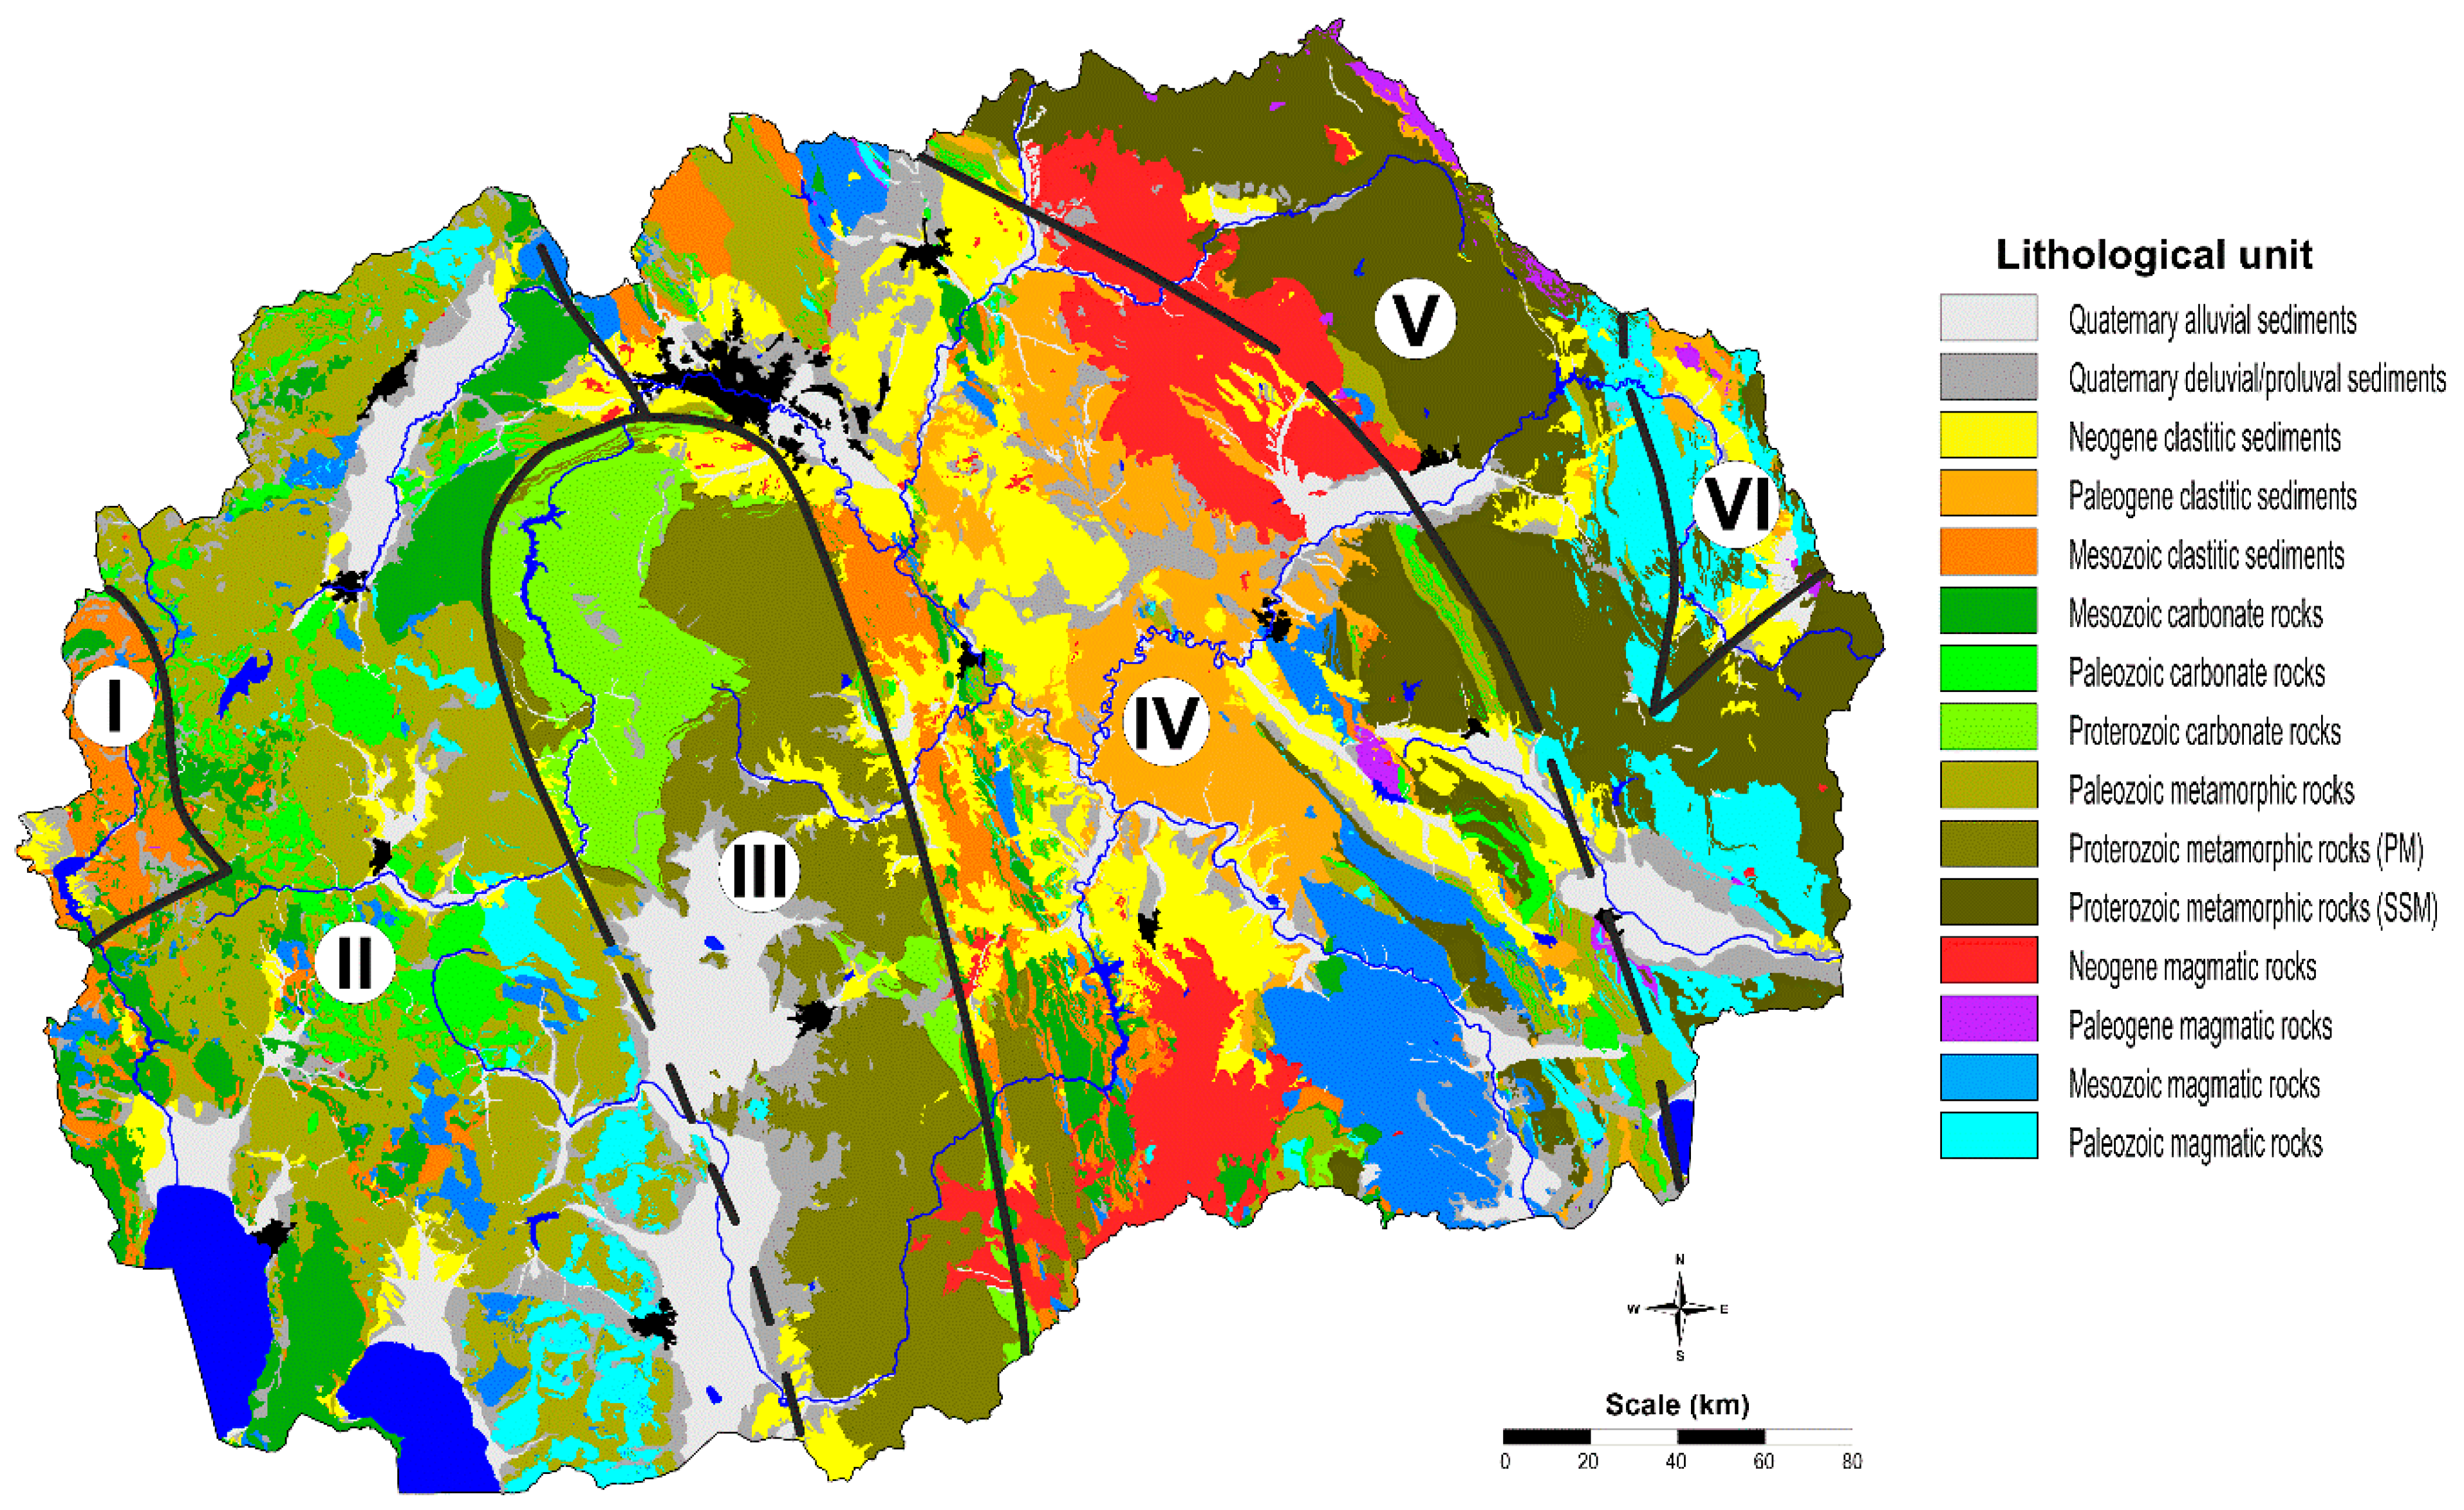
From a geological perspective, Macedonia is characterized by a complex geological structure, with rocks of different ages, origins, and lithological compositions [18], resulting in the formation of a wide variety of soil types across the entire country (Figure 2). Six major geotectonic units are identified in Macedonia [20]. The central part belongs to the Vardar Zone, while the Pelagonian Massif, the West-Macedonian Zone, and the Cukali-Krasta Zone are located to the west. The eastern regions are part of the Serbo-Macedonian Massif and the Kraishtide Zone. Among these units, the Pelagonian Massif and the Serbo-Macedonian Massif contain the oldest rocks, dating back to the Proterozoic era. This pronounced topographic variability is expected to influence ambient dose equivalent rates through variations in cosmic radiation intensity with altitude, as well as differences in terrestrial gamma radiation background across the country.

2.2. Sampling and Analysis

Ambient dose equivalent rates were measured in situ using a portable survey meter ATOMTEX AT1117M equipped with a BDGK-01 Geiger-Mueller probe for X and gamma radiation, calibrated with a 137Cs reference source (662 keV). The instrument operates over an energy range of 60 keV to 3 MeV and measures ambient dose equivalent rates from 0.1 μSv/h to 10 Sv/h. This detector type is well-suited for long-term spatial surveys due to its robustness, portability, stable response under field conditions, and adequate sensitivity in the environmental dose-rate range.
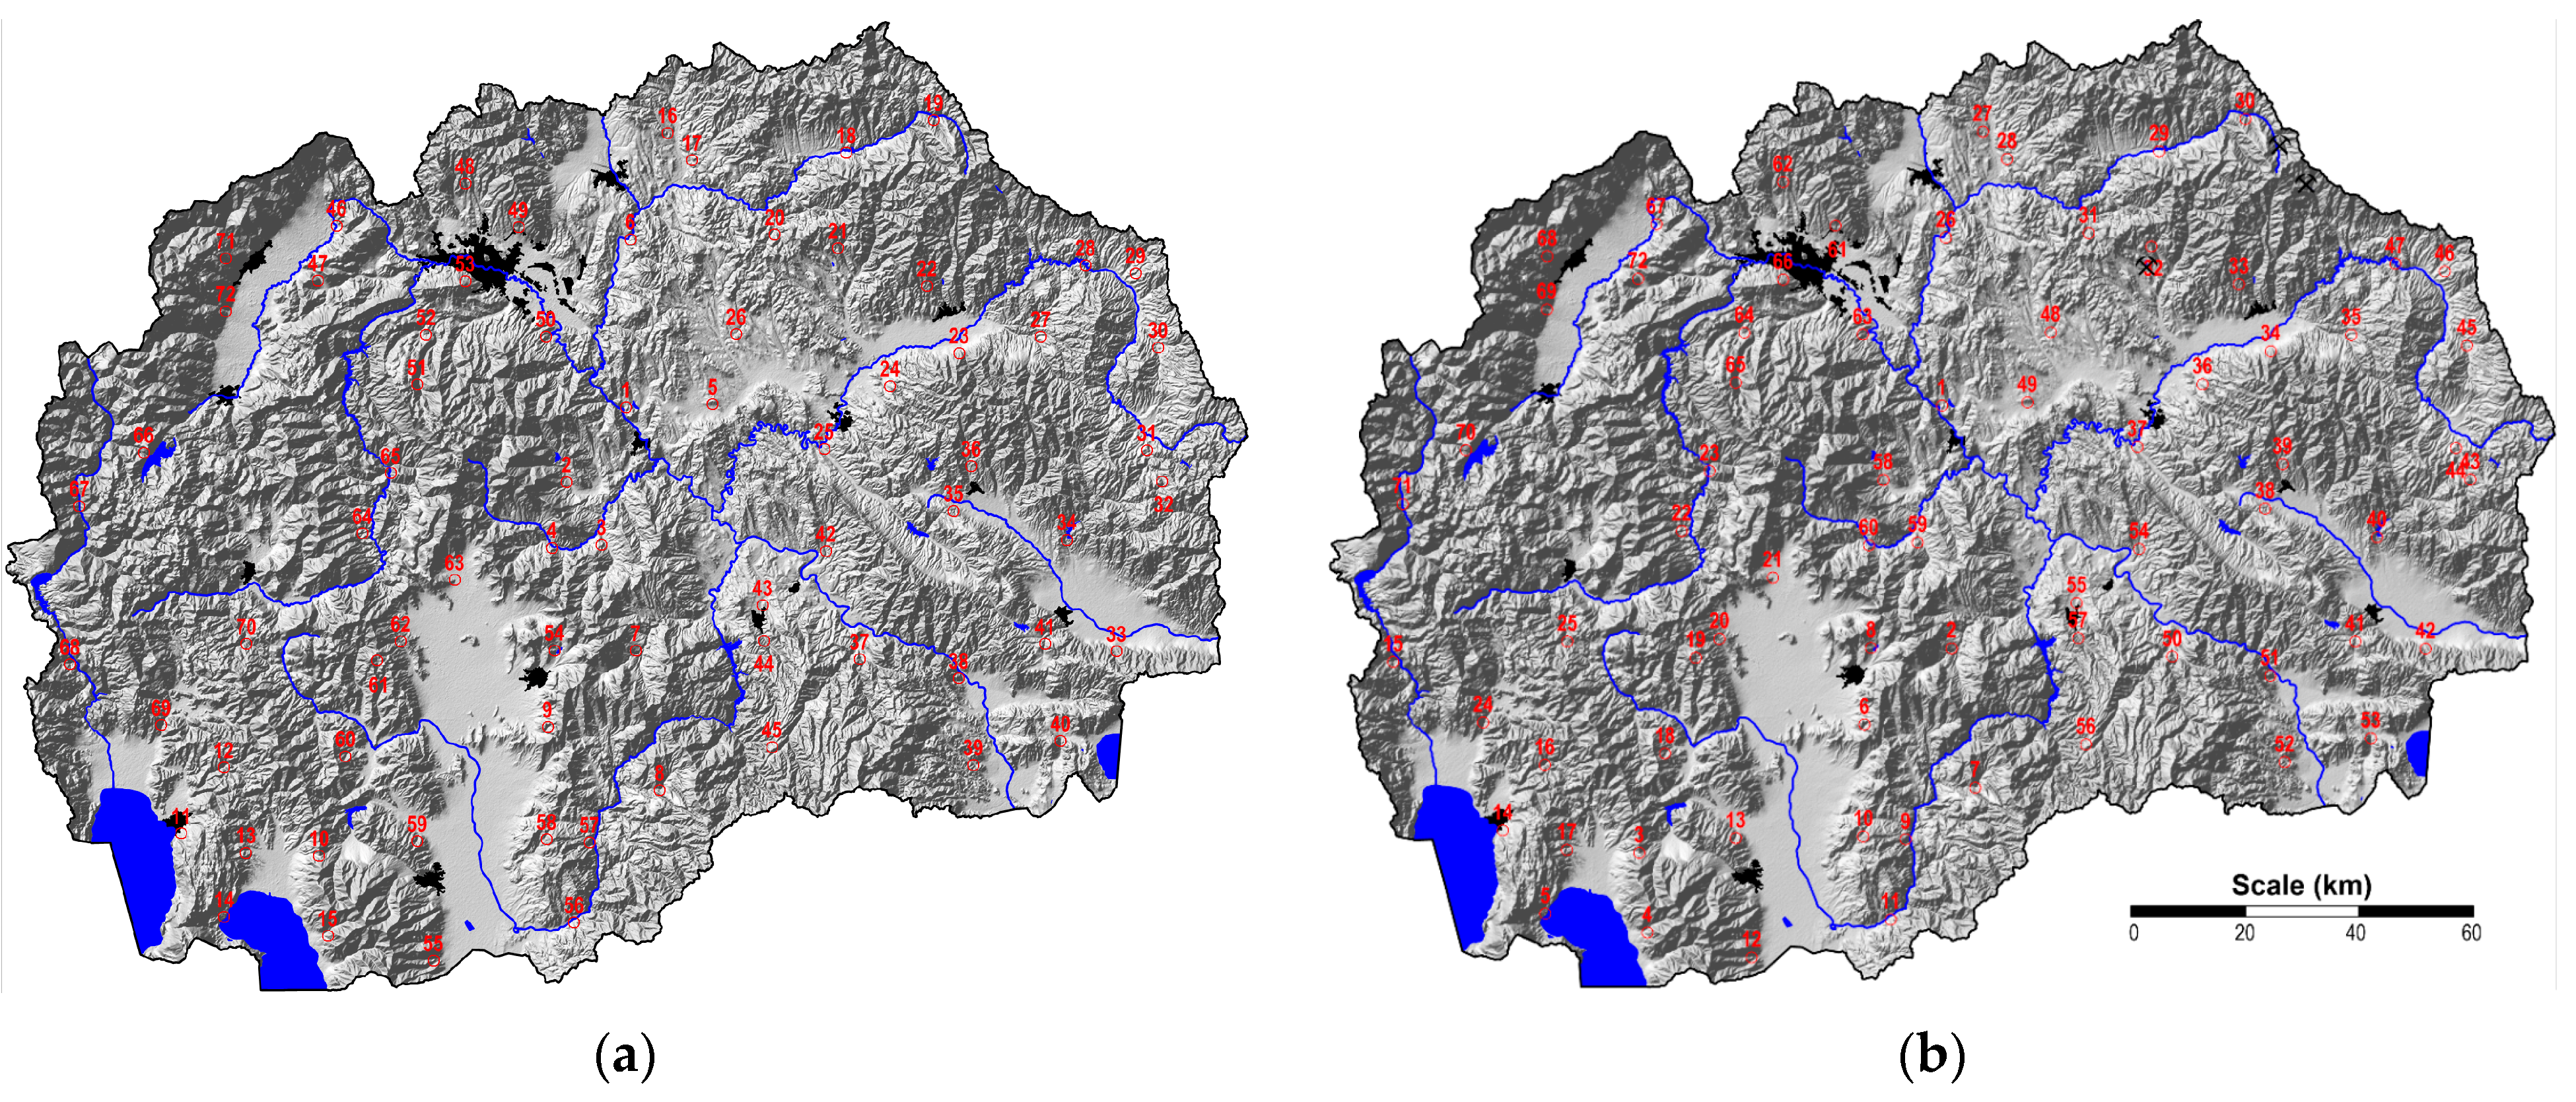
In 2010, measurements were performed at 68 locations, while in 2015 and 2020, measurements were carried out at 72 locations, improving spatial representativeness. To preserve spatial comparability between campaigns, temporal analyses were based on the common set of locations sampled in all years, whereas the additional sites introduced in 2015 and 2020 were used primarily to improve the spatial representativeness of mapping. The measurement sites were selected from a dense and regular 17 × 17 km sampling grid established for a national moss biomonitoring study of atmospheric pollution with potentially toxic elements [16,17], thereby ensuring uniform spatial coverage of the country (Figure 3). In accordance with UNSCEAR, measurements were performed at 1 m above ground level [21,22]. This in situ measurement geometry allows integrated assessment of terrestrial gamma radiation and cosmic radiation contributions, both of which are relevant components of atmospheric external exposure. All measurements were performed during the dry summer period (July–August), thereby reducing short-term meteorological variability, minimizing the influence of precipitation-induced washout of radon progeny, and ensuring representative ambient gamma dose rate values [23]. Since in situ measurements inherently include the cosmic component, ambient dose equivalent rates are expected to increase with altitude due to reduced atmospheric shielding. This effect may contribute to higher values observed in mountainous regions [24].

3. Results and Discussion

Statistical analyses were performed to assess the temporal stability and spatial variability of ambient dose equivalent rates measured in 2010, 2015, and 2020, using Statistica Ver. 14 (Stat Soft, Inc., Tulsa, OK, USA). Descriptive statistics for ambient dose equivalent rates (expressed in nSv/h), measured in 2010, 2015, and 2020, are presented in Table 1. The following basic statistical parameters are provided: arithmetic mean, median, minimum, maximum, 10th, 90th, 25th, and 75th percentiles, standard deviation, coefficient of variation (CV), median absolute deviation (MAD), quartile coefficient of dispersion (QCD), skewness, and kurtosis. To improve the normality of the data distribution, a Box–Cox transformation was applied, and the corresponding transformed parameters are also included [25].
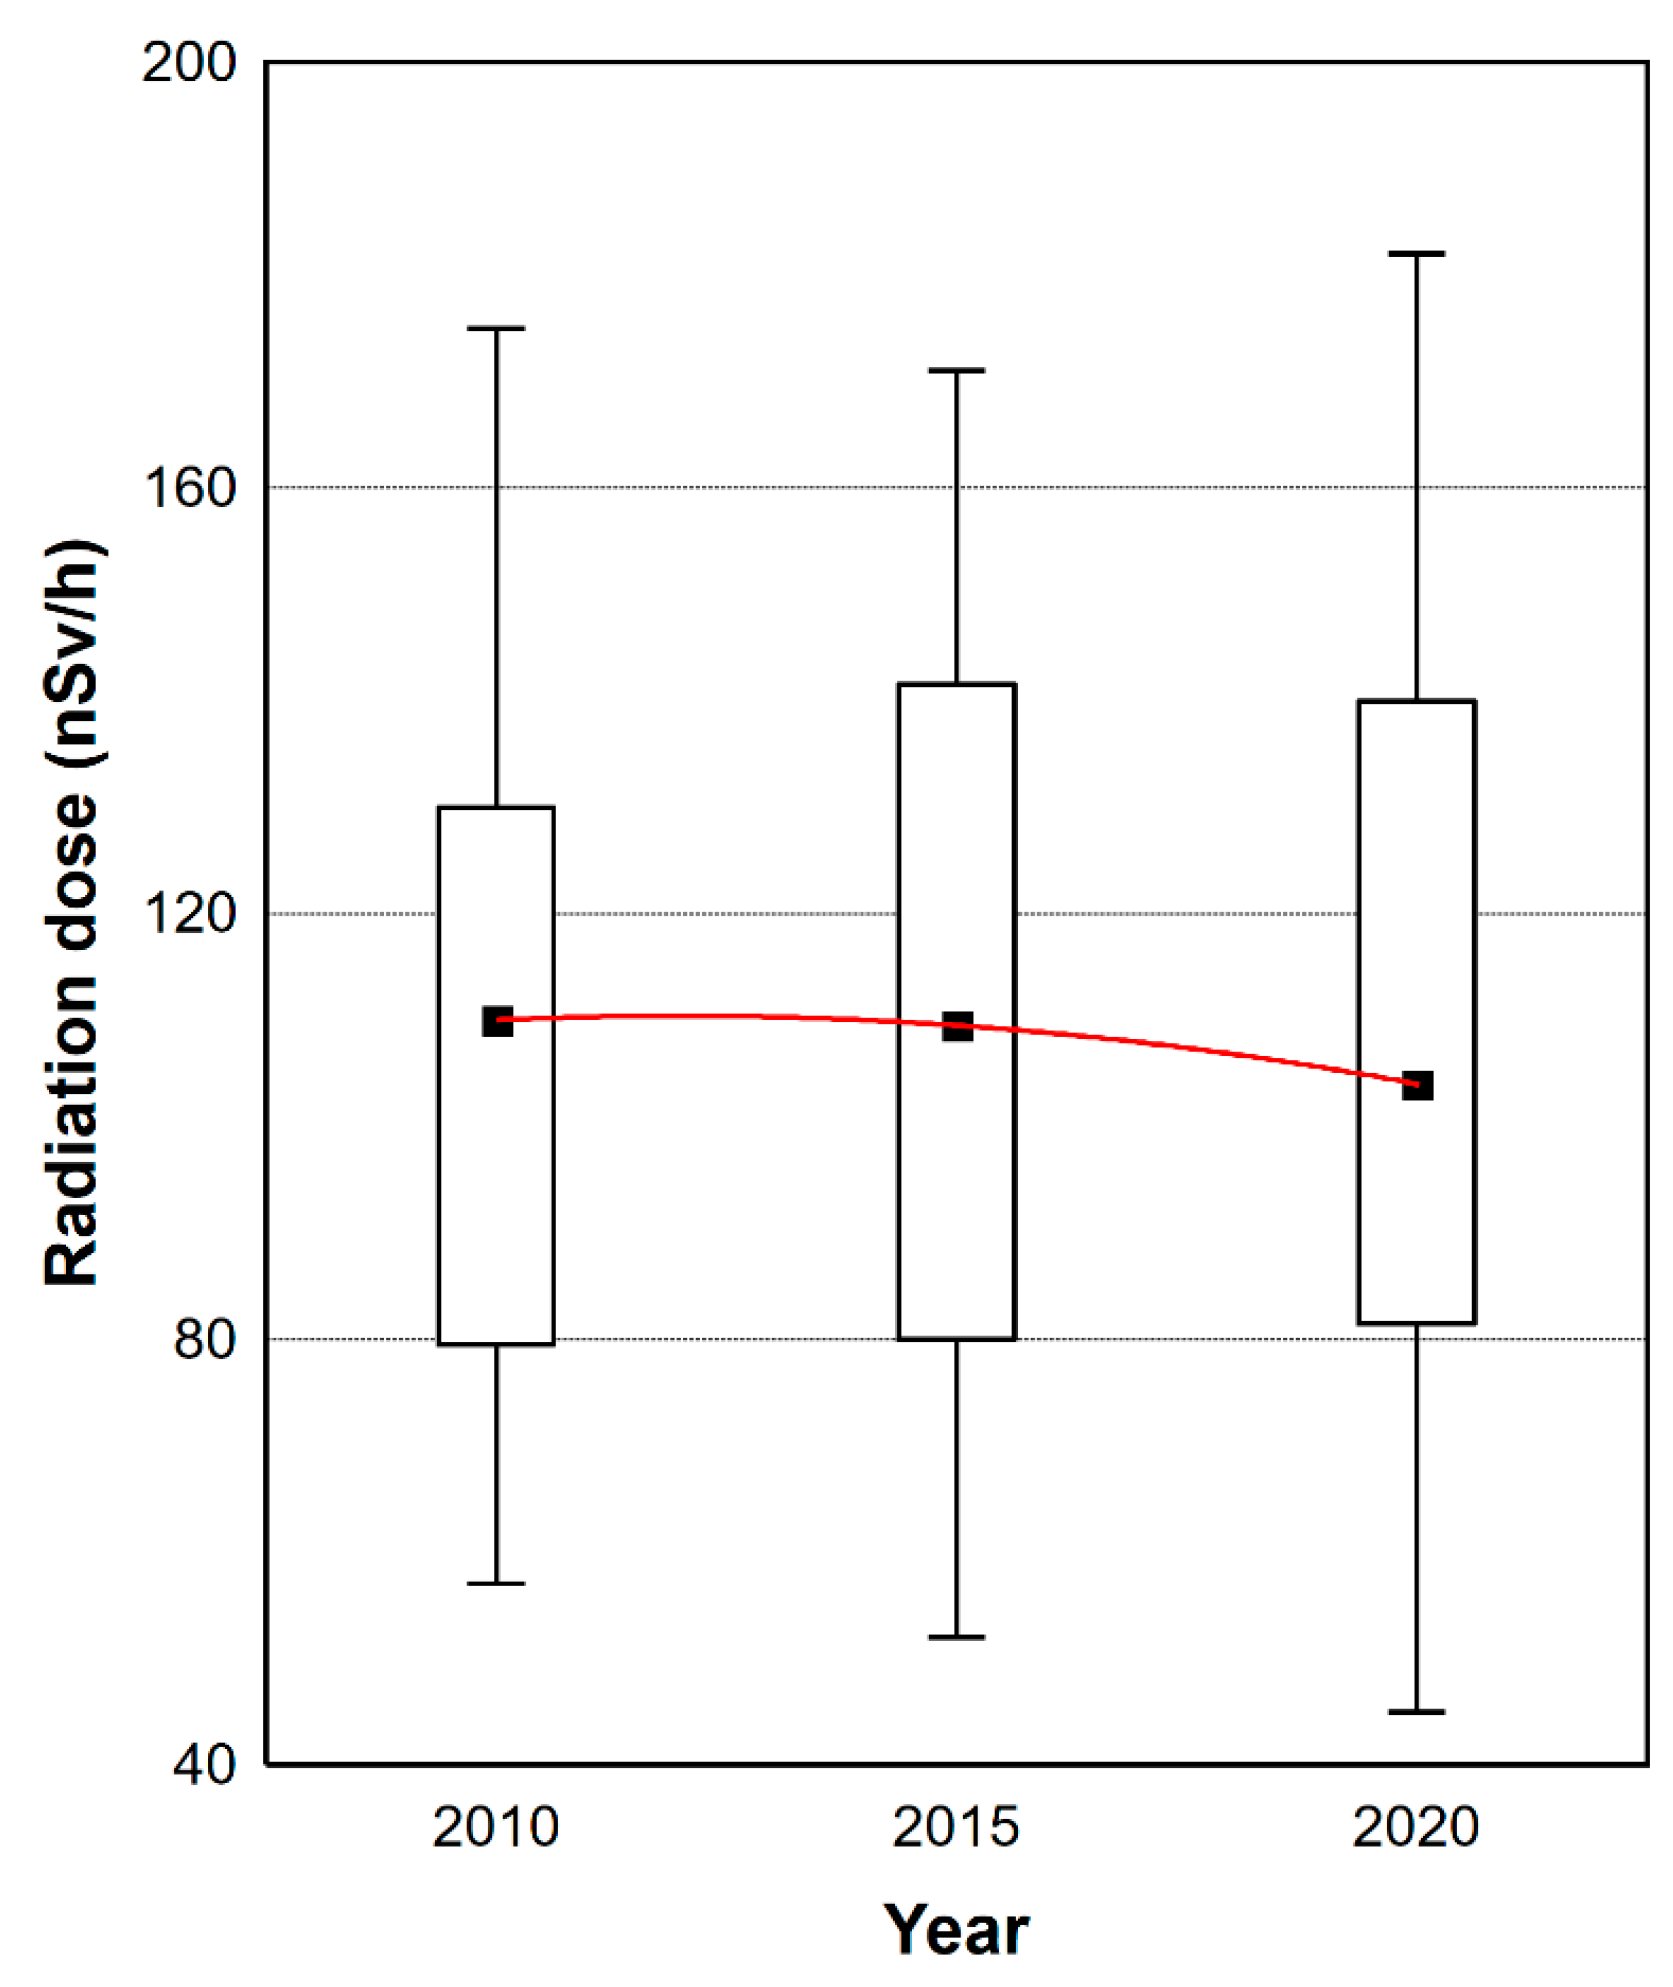
Descriptive statistics are summarized in Table 1; therefore, the text below highlights the main comparative patterns and interpretation. The ambient dose equivalent rates ranged from 53–340 nSv/h in 2010, 38–360 nSv/h in 2015, and 41–300 nSv/h in 2020. Median values were identical in 2010 and 2015 (110 nSv/h) and slightly lower in 2020 (104 nSv/h), indicating that ambient dose equivalent rates remained stable during this period. This is further illustrated by the boxplot in Figure 4, which shows comparable distributions of measured values across the three years. In 2010, the interquartile range extended from 80 to 130 nSv/h, while in 2015 it increased slightly to 80–142 nSv/h. In 2020, the interquartile range remained similar (82–140 nSv/h), although the median shifted marginally towards lower values. The whiskers (P10–P90) ranged from 65–170 nSv/h in 2010, 56–158 nSv/h in 2015, and 55–156 nSv/h in 2020. Overall, the statistical descriptors indicate moderate spatial variability combined with pronounced temporal stability of ambient dose equivalent rates over the investigated decade.
In Table 2, the mean ambient dose equivalent rates for different regions and geological units are presented. In 2010, the highest mean value was measured in the Pelagonian Massif, while in 2015 and 2020, the west-Macedonian zone recorded the highest mean dose rates. Although regional differences are evident in the descriptive summaries, ANOVA shows that these differences are not statistically significant and should be interpreted as descriptive spatial variability.
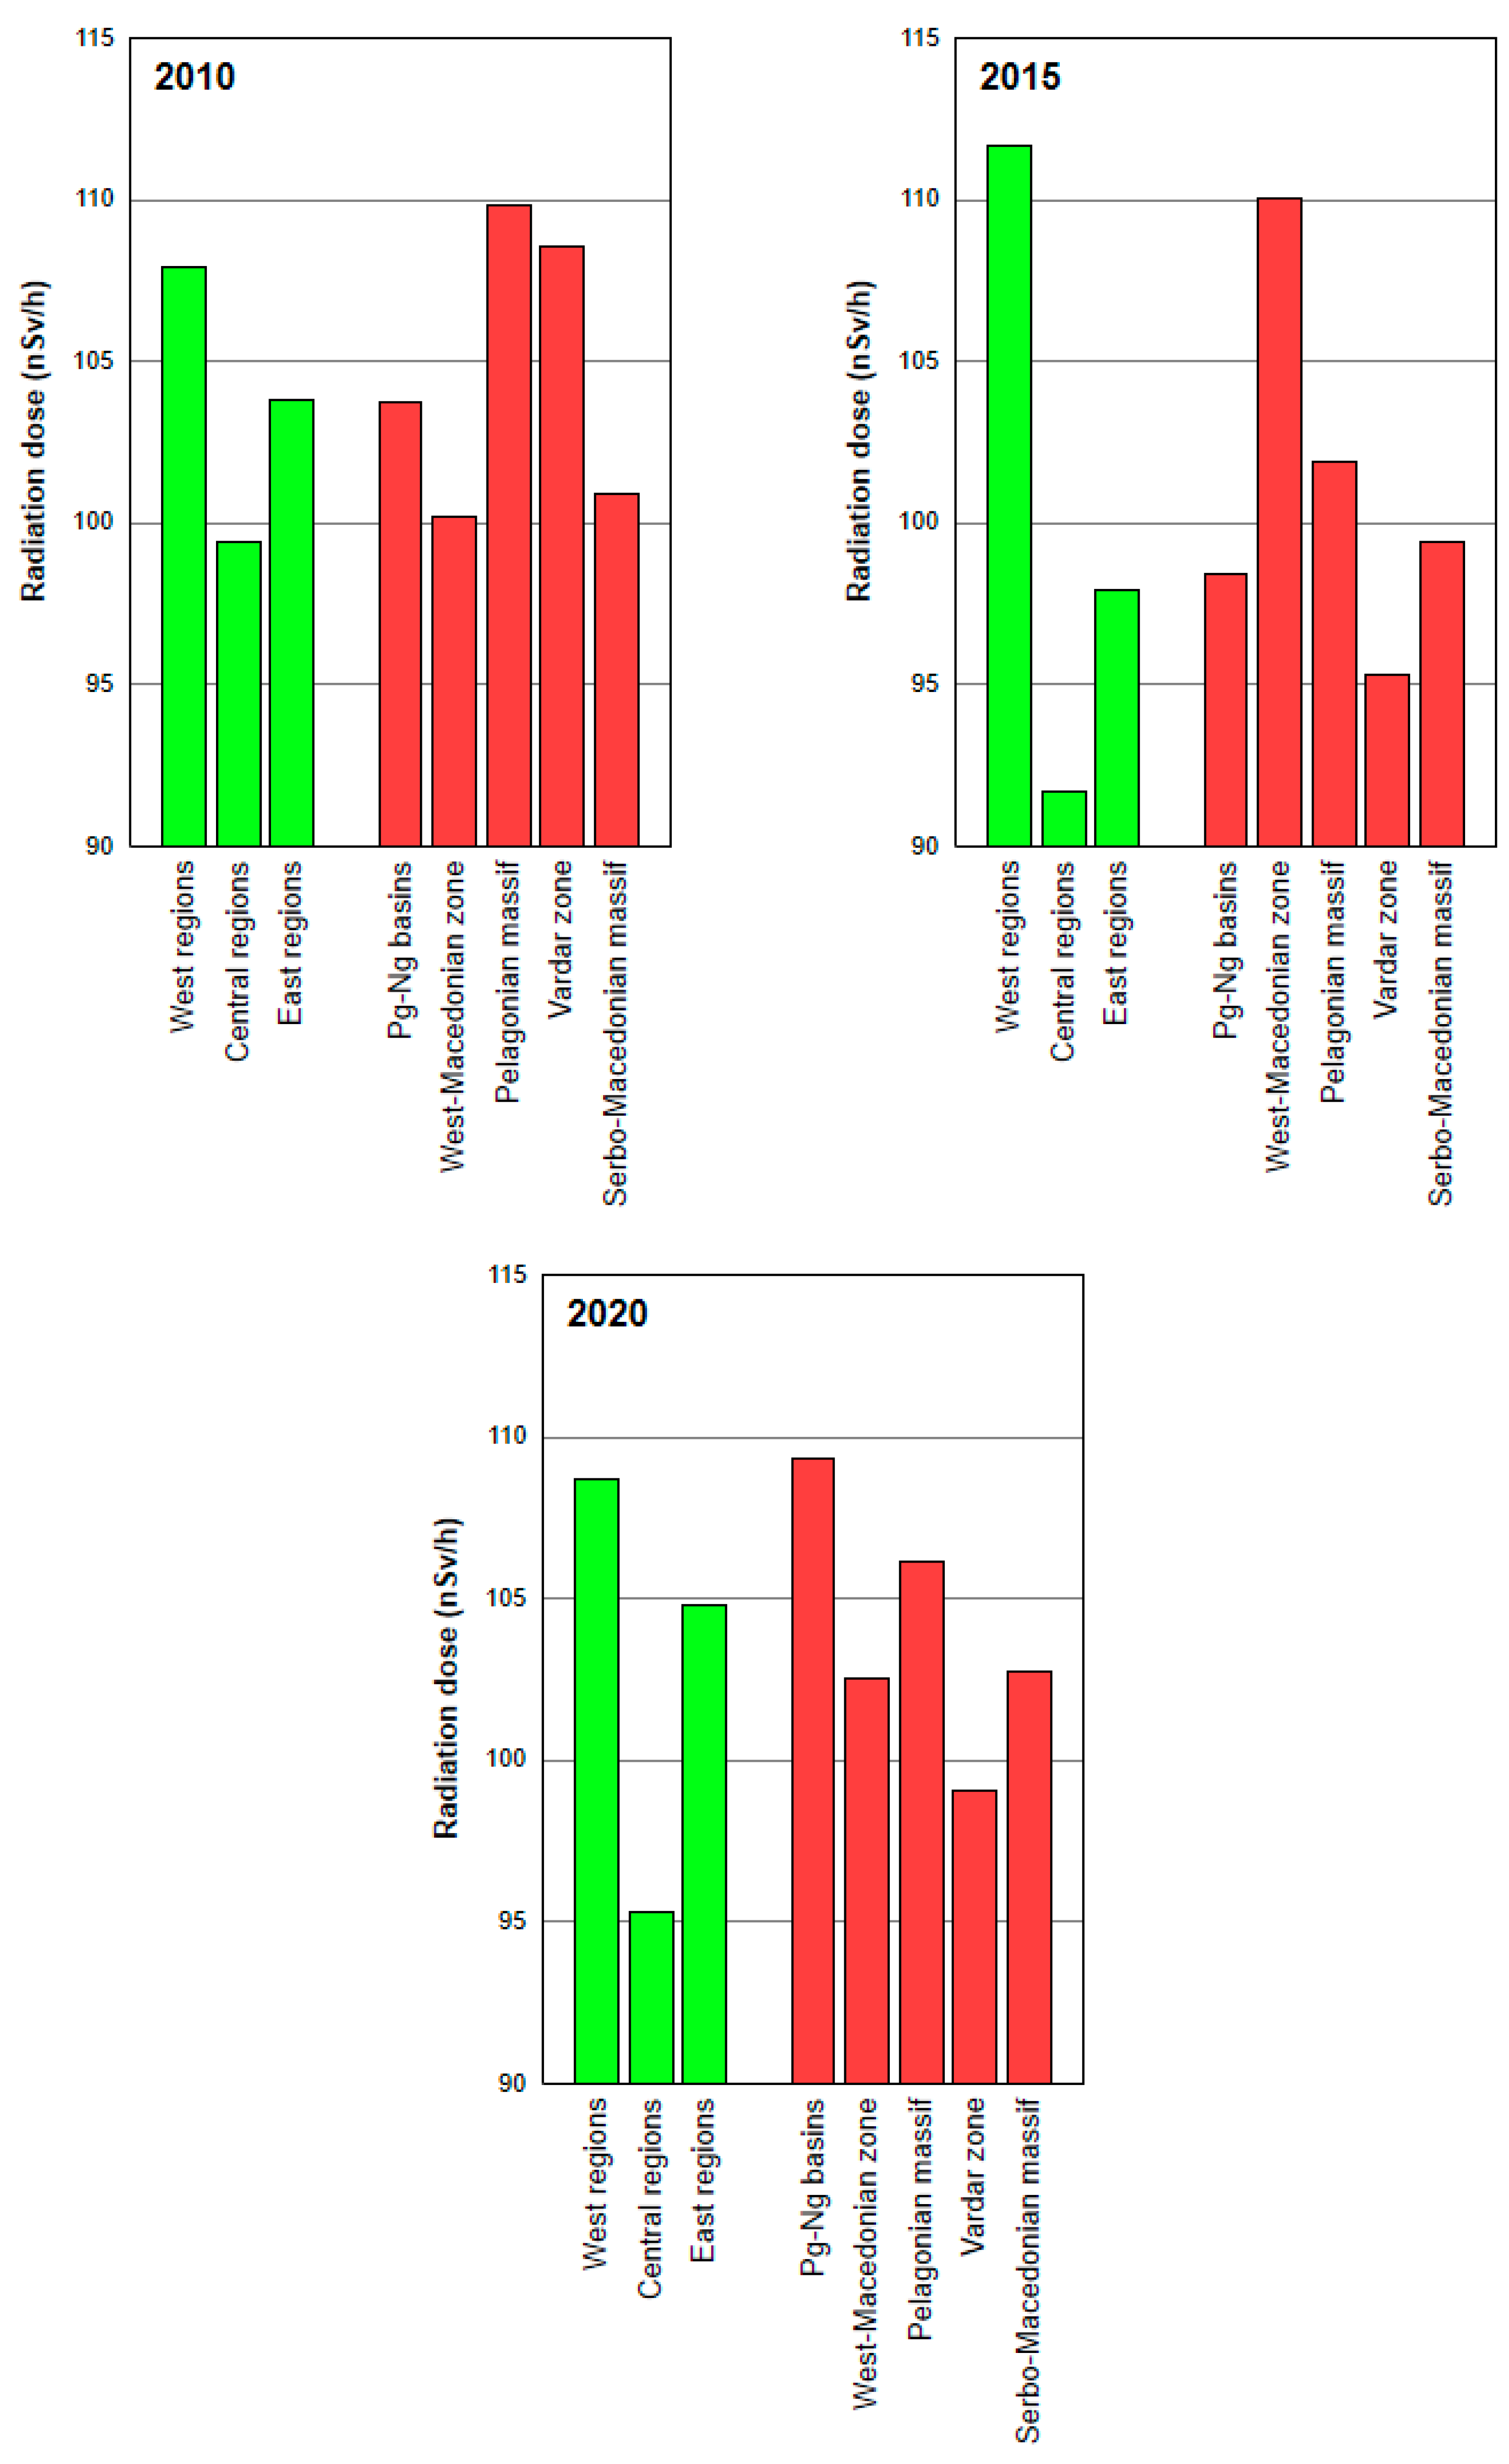
Figure 5 shows the variability of ambient dose equivalent rates by geographical regions, geological units, and measurement campaigns, based on the values reported in Table 2.
A consistent pattern is observed across all three campaigns, corresponding to with the major geological domains (Figure 2), with the lowest mean ambient dose equivalent rates recorded in the central regions of the country. In these regions, the minimum average value of approximately 92 nSv/h was observed in 2015, while the maximum reached about 99 nSv/h in 2010, indicating only minor temporal variations. The Vardar Zone, which largely dominates the central part of Macedonia, shows average ambient dose equivalent rates of 109 nSv/h in 2010, followed by slightly lower values in 2015 and 2020. This pattern is consistent with its geographical position and geological characteristics, supporting the observed trend of reduced dose rates in the central region. In contrast, the western regions exhibit the highest average ambient dose equivalent rates, with a maximum of around 112 nSv/h recorded in 2015. As expected, elevated dose rates in this region are mainly associated with the Pelagonian Massif and the west-Macedonian Zone, which recorded mean values of 102 nSv/h and 110 nSv/h, respectively, during the same campaign. The Pelagonian Massif also shows the highest average value among all geological units in 2010, reaching 110 nSv/h. An exception to this general pattern is observed in the 2020 campaign, where the highest average ambient dose equivalent rate is associated with the Paleogene-Neogene basin, with a value of 109 nSv/h.
Since H*(10) represents a measurable equivalent to the effective dose rate, the mean, minimum, and maximum values obtained in this study were converted to annual effective dose using the same measured dose rate values, without any additional scaling or correction factors. Although conversion coefficients between ambient dose equivalent and effective dose are, in principle, dependent on photon energy, published ICRP conversion data indicate that for photon energies characteristic of terrestrial gamma-emitting radiation from radionuclides in soil, the ratio between effective dose and ambient dose equivalent remains close to unity, introducing only a minimal systematic uncertainty of about 10% [23,26,27]. This conversion was performed in order to enable a comparison with previously published results and internationally recommended values. To assess the reliability and consistency of the derived dose estimates, a comparison was made with earlier studies conducted in Macedonia that employed indirect dose assessment methods based on the activity concentrations of relevant radionuclides in soil samples determined by laboratory gamma-spectrometric measurements. Direct in situ monitoring provides an integrated estimate that includes terrestrial and cosmic components under real field conditions, but offers limited source attribution. In contrast, indirect approaches based on soil radionuclide concentrations support source interpretation, yet may omit cosmic contributions and rely on assumptions regarding geometry and occupancy. The mean, minimum, and maximum annual effective dose values derived from both direct in situ measurements and indirect soil-based assessment, together with the global average reported by UNSCEAR, are summarized in Table 3.
Indirect dose assessments based on soil radioactivity underestimate external exposure, as they do not fully account for contributions from large soil volumes, spatial heterogeneity, or atmospheric components [8]. In contrast, direct measurements inherently include the contribution from cosmic radiation, which is not explicitly separated in the measured ambient dose equivalent rate. Considering these methodological differences, the results obtained using both approaches can be regarded as comparable, and the consistency between them supports the reliability and relevance of the measurements in this study.
When the estimated annual effective doses are compared with the recommended public exposure limit of 1 mSv/y, it can be concluded that the population in Macedonia is exposed to external gamma radiation levels within the range of internationally recommended reference values, reflecting a relatively higher natural background compared to the global average [29].
Results from the ANOVA test (F and p-values) are presented in Table 4.
The statistical analysis using ANOVA revealed no significant differences in ambient dose equivalent rates with respect to the years, regions, or tectonic units investigated. For the period 2010–2020, no significant temporal effect was observed (F = 0.22 and p = 0.80). Regional differences were also not significant. Although the regional comparison in 2015 yielded the highest F-value (F = 1.47), it was still statistically non-significant (p = 0.24). These findings further support the conclusion that ambient dose equivalent rates in Macedonia are determined by stable long-term background conditions rather than short-term temporal or regional variations.
Table 5 presents the correlation matrix, where Pearson’s correlation coefficients (r) quantify the degree of linear correlation among dose equivalent rates measured in different years. The results show that all correlation coefficients are within the range 0.7 < r < 1.0, indicating a strong positive correlation between the datasets. In particular, values from consecutive measurement years show better agreement with r = 0.78 for 2010 and 2015 and r = 0.84 for 2015 and 2020.
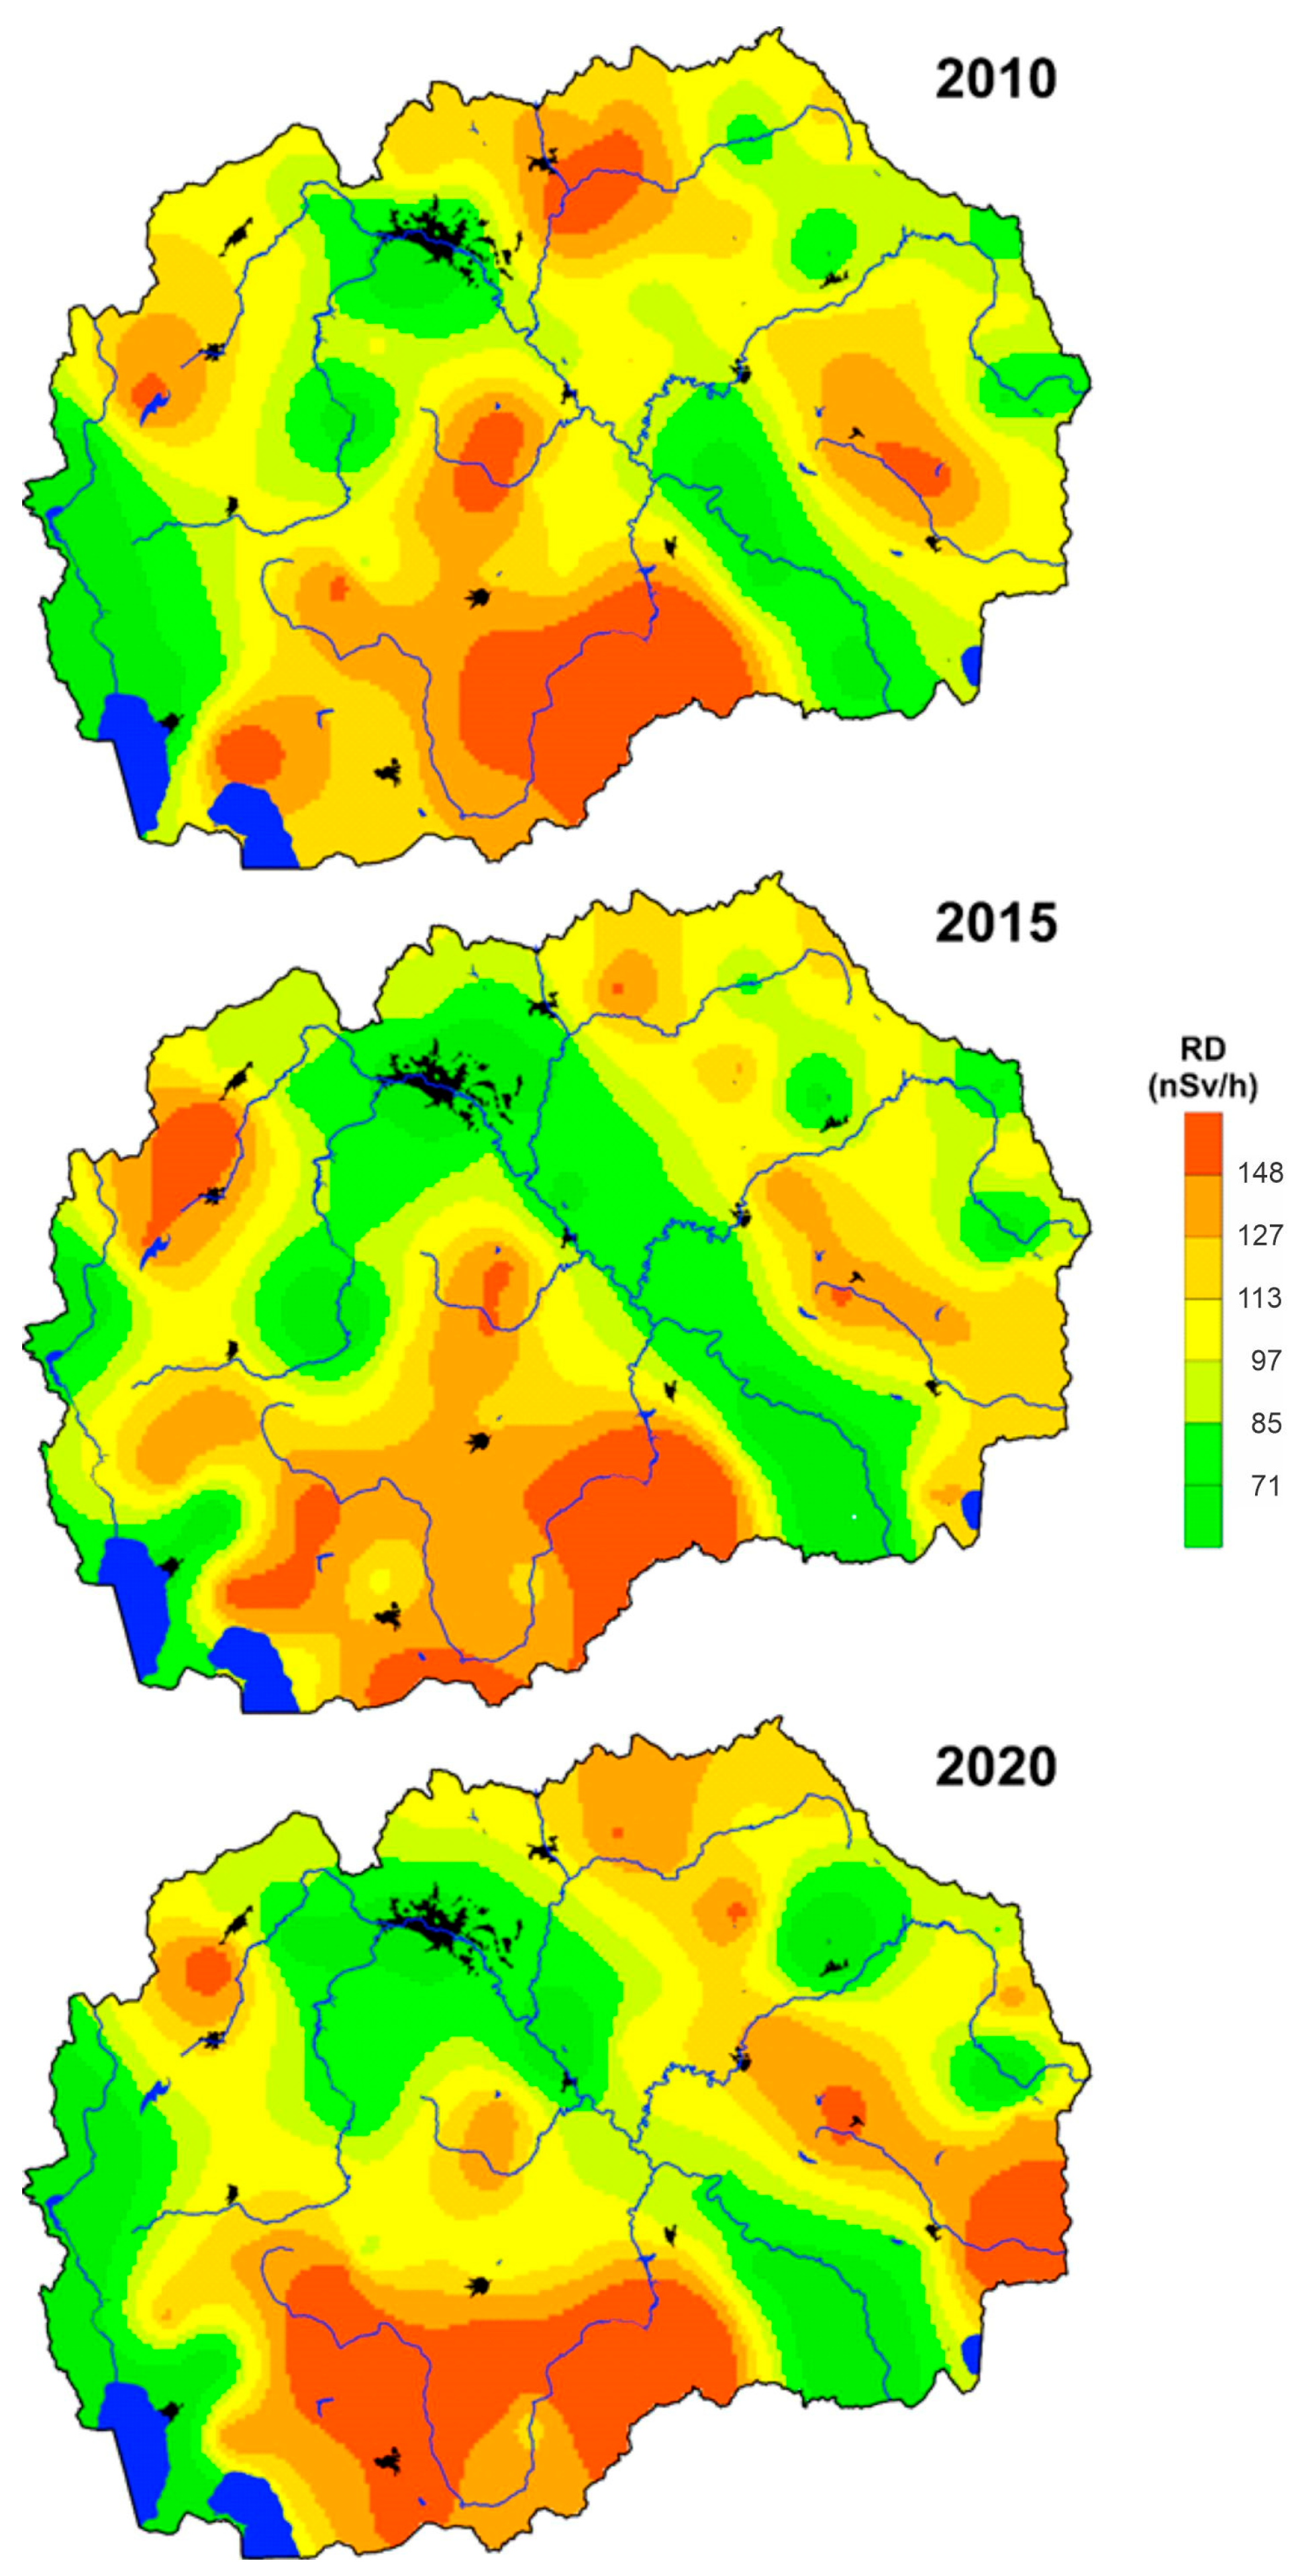
Based on the acquired dataset, spatial distribution maps of the ambient dose equivalent rates were generated using the Surfer software package (Surface Mapping System), Ver. 25. The measured values were interpolated using universal kriging, which is suitable for regional-scale environmental datasets as it can account for a spatially varying trend while providing statistically optimal estimates under the selected linear variogram model [30]. The resulting spatial distribution maps for the measurement campaigns conducted in 2010, 2015, and 2020 are presented in Figure 6.
A comparison between the spatial distribution maps of ambient dose equivalent rates and the geological map of Macedonia (Figure 2), indicates a strong correlation between elevated dose levels and specific geological units. In all three measurement campaigns, the highest ambient dose equivalent rates are consistently observed in the Pelagonian Massif and the Serbo-Macedonian Massif. These regions are predominantly composed of metamorphic rocks, such as gneisses and schists, dating from the Proterozoic era. The spatial distribution aligns with findings from previous studies conducted in Macedonia, thereby reinforcing the reliability of the observed trends. The elevated dose levels in these geological units can be attributed to their mineralogical composition. Rocks in the Pelagonian and Serbo-Macedonian massifs are metamorphic and typically rich in mica minerals, particularly biotite and muscovite, which contain significant amounts of potassium [14,31,32]. Consequently, the naturally occurring radionuclide 40K is a major contributor to the ambient gamma dose in these areas. In addition, these rocks often contain accessory minerals such as monazite, which are known to be enriched in thorium-bearing minerals, further contributing to increased gamma levels through the 232Th decay series [33].
In addition to the clear geological control, the spatial distribution maps show that regions at higher altitudes, which largely coincide with mountainous terrain, tend to exhibit elevated ambient dose equivalent rates compared to lowland areas. Lithological variability mainly affects the terrestrial gamma component through differences in natural radionuclide content. Independently, altitude-related effects influence the cosmic component, which becomes more relevant in high-elevation regions. This altitudinal dependence cannot be explained solely by lithology and points to the influence of fallout radionuclides, particularly 137Cs, which was deposited unevenly following the Chernobyl accident [6]. Although the overall contribution of 137Cs to the total ambient dose is generally small compared to that of naturally occurring radionuclides, its impact becomes more noticeable in mountainous regions where increased precipitation has led to greater deposition and retention [34,35]. Consequently, these areas may show a higher relative 137Cs contribution to the ambient dose compared to lowland regions such as the Vardar Valley. However, the contribution of 137Cs is expected to decrease over time due to its physical half-life of approximately 30.1 years and its gradual downward migration into deeper soil layers, which increases shielding and reduces surface gamma emission [36]. For this reason, temporal analyses based on repeated measurements, such as those performed in the present study, are particularly important in high-altitude regions, as they allow identification of dose rate changes driven by both radioactive decay and soil redistribution processes.
Furthermore, increased ambient dose equivalent rates are observed in parts of northeastern and southeastern Macedonia, where magmatic rocks formed during the Paleogene and Neogene periods are prevalent. These predominantly acidic igneous rocks, including granites, are known to be enriched in uranium, which explains their association with elevated gamma dose rates in these regions [18].
A particularly notable feature is the locally increased dose level observed in the Pelagonian Valley. In this area, the elevated ambient dose equivalent rates cannot be explained solely by geological factors and may be influenced by anthropogenic activities. Potential contributors include the operation of the Thermoelectric power plant Bitola, as well as the long-range transport and deposition of fly ash originating from a thermal power plant located in northern Greece. These findings were further confirmed by complementary environmental monitoring techniques, including moss and soil sampling [14,15].
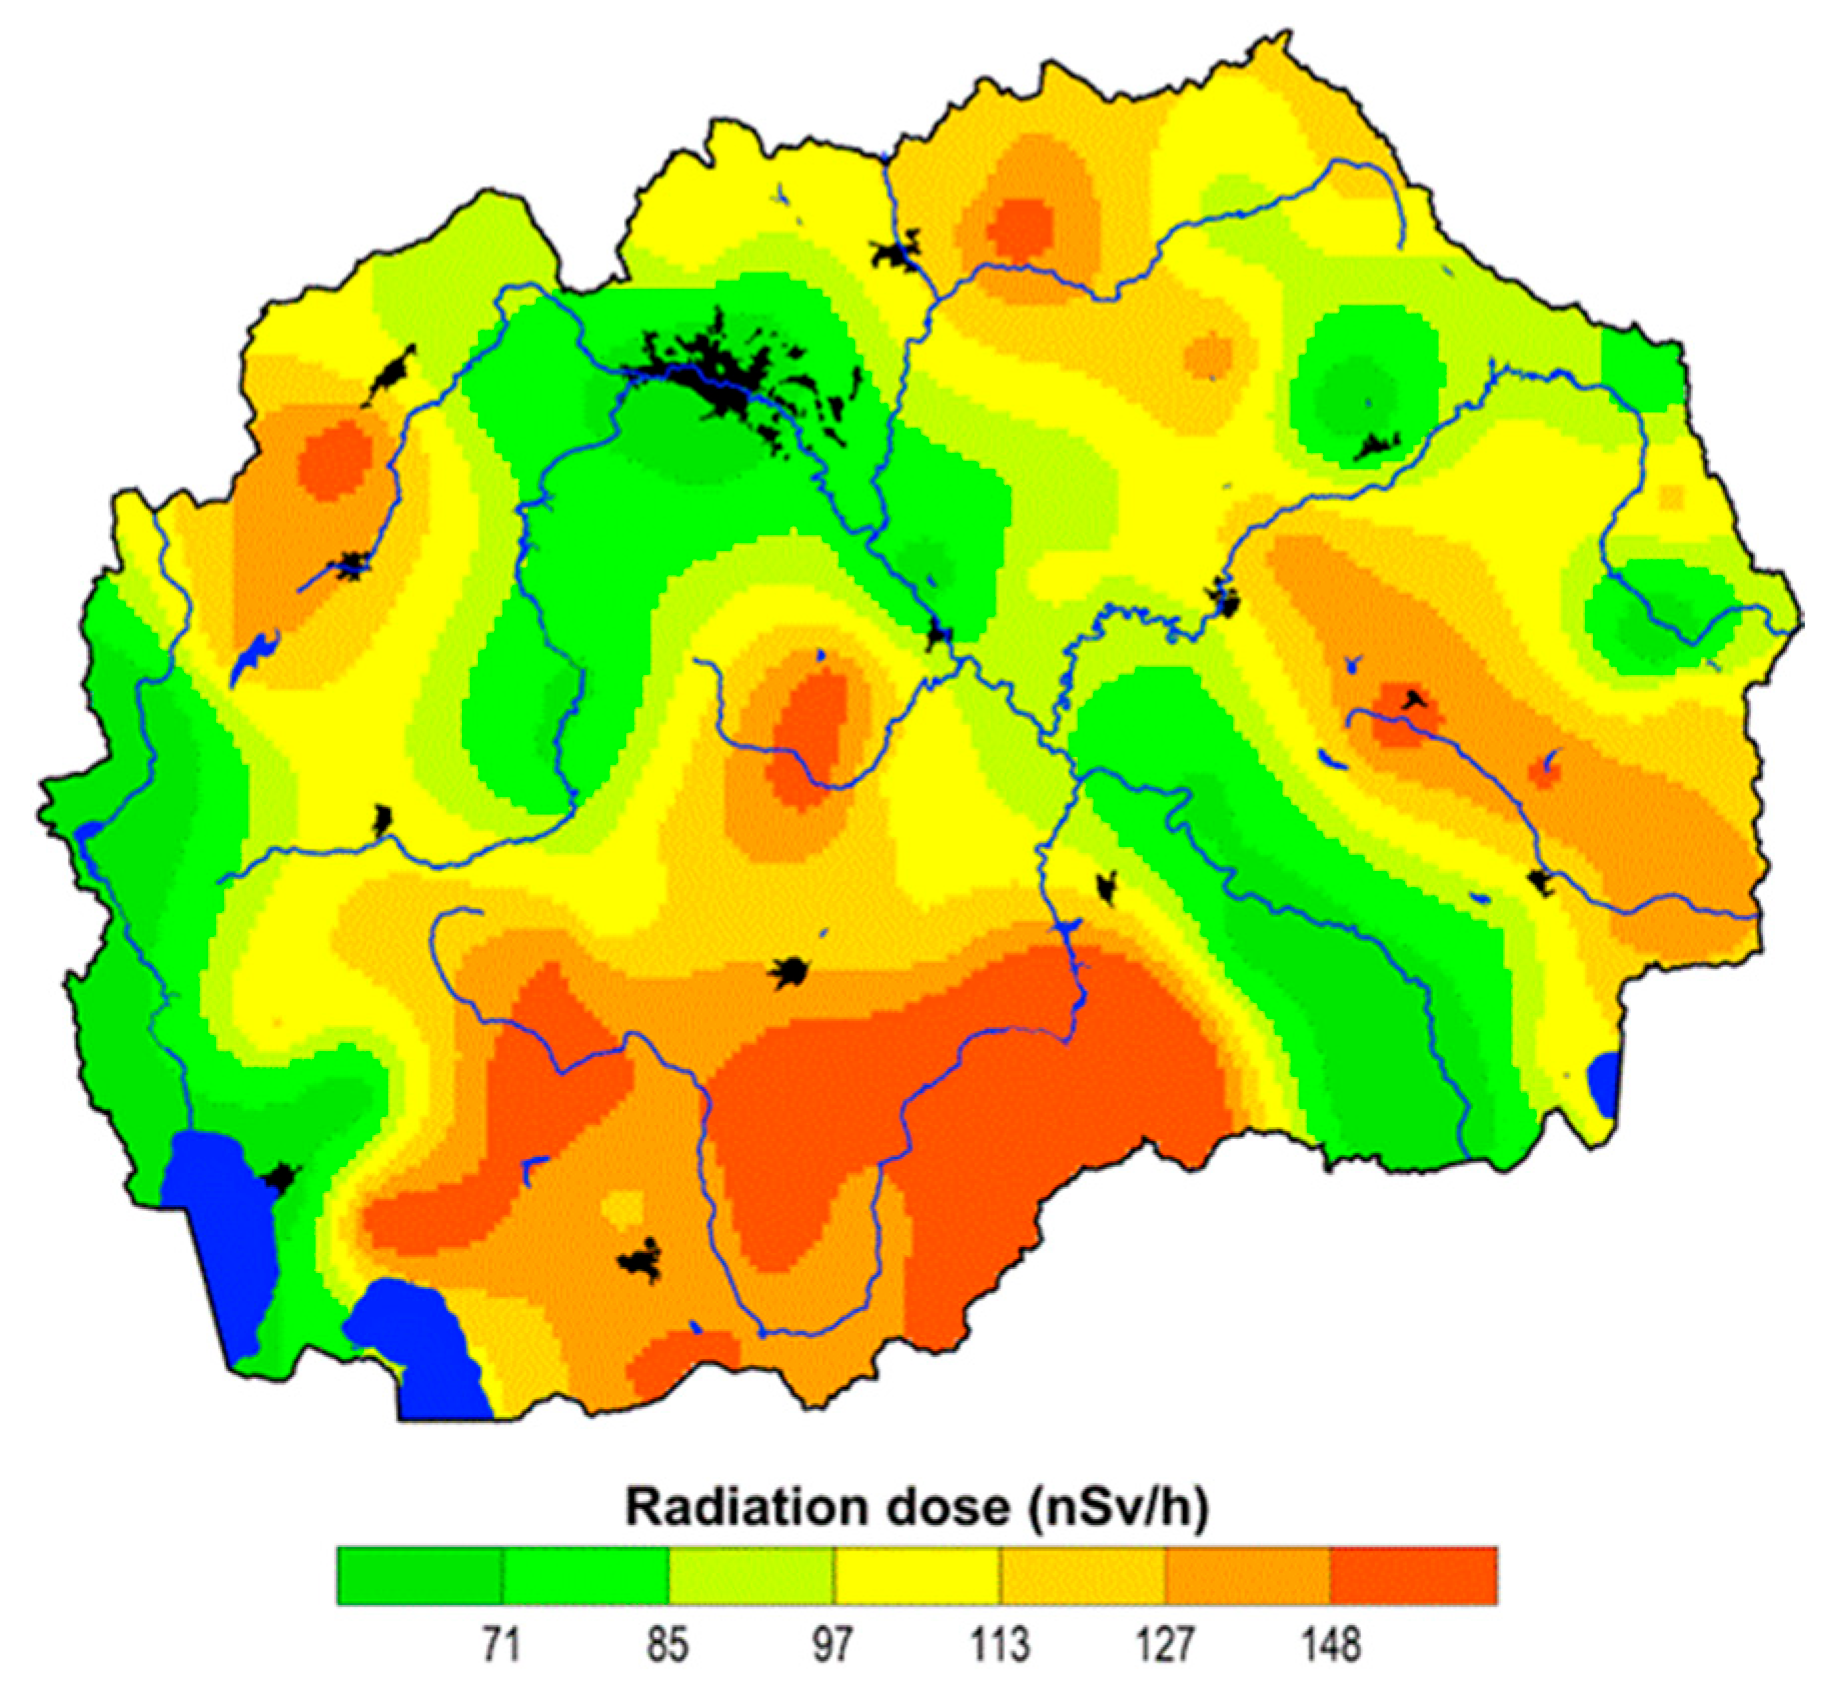
Figure 7 shows the spatial distribution of long-term average ambient dose equivalent rates for 2010–2020. The map reveals well-defined and persistent spatial patterns, with elevated dose levels mainly associated with the Pelagonian and Serbo-Macedonian massifs. The consistency of these features over the decade studied indicates that short-term variations do not influence the observed distribution; instead, stable, long-term environmental and geological factors, such as the area’s geological characteristics, are responsible. Potential anthropogenic influences are spatially limited and appear to contribute only locally, most notably in the Pelagonian Valley, where industrial activities may slightly increase the ambient dose equivalent rates.

4. Conclusions

This study provides a comprehensive analysis of long-term in situ measurements of ambient gamma dose equivalent rates across the entire territory of Macedonia, covering the period from 2010 to 2020. A key contribution of this work is the establishment of a national-scale, long-term baseline of ambient gamma dose equivalent rates based on repeated in situ surveys over a decade. The results show strong agreement between datasets from different years, as confirmed by correlation analysis, indicating a high level of consistency and temporal stability across consecutive measurement campaigns. Statistical testing using ANOVA revealed no significant differences in ambient dose equivalent rates with respect to year of measurement, geographical region, or tectonic unit, further confirming the temporal stability of external gamma radiation levels over the ten-year period investigated.
The reliability of the direct in situ measurements was further confirmed through comparison with previously published results obtained using indirect dose assessment methods based on soil radioactivity, which yielded comparable dose levels despite inherent methodological differences. Spatial distribution maps for all three campaigns reveal a consistent pattern of elevated ambient dose equivalent rates in the Pelagonian Massif, the Serbo-Macedonian Massif, and locally within the west-Macedonian Zone. These areas are associated with geological formations dominated by metamorphic and granitic magmatic rocks, which are known to be enriched in naturally occurring radionuclides. Higher dose rates are also observed in mountainous regions, where altitude-related effects and the contribution of the artificial radionuclide 137Cs, primarily associated with atmospheric deposition, become more pronounced.
A localized anthropogenic influence is identified in the vicinity of the Bitola thermoelectric power plant, where the dispersion of fly ash containing concentrated radionuclides may locally contribute to slightly increased ambient dose equivalent rate levels. However, this anthropogenic influence is highly localized and does not affect the national-scale exposure patterns or the overall long-term baseline.
Overall, the results establish a robust and spatially representative baseline for ambient dose equivalent rates in Macedonia, demonstrating that population exposure to external gamma radiation has remained stable over the analyzed decade and within the range of internationally reported reference values. Future efforts could integrate radiological monitoring with complementary in situ environmental monitoring techniques to support more comprehensive assessments of atmospheric transport, deposition, and external exposure pathways.

Author Contributions

Conceptualization, L.B., I.Z. and T.S.; methodology, L.B. and T.S.; software, R.Š.; validation, L.B., A.G.-B. and T.S.; formal analysis, L.B. and I.Z.; investigation, L.B. and A.G.-B.; data curation, L.B. and R.Š.; writing—original draft preparation, I.Z., L.B. and A.G.-B.; writing—review and editing, L.B., I.Z. and T.S.; visualization, R.Š. All authors have read and agreed to the published version of the manuscript.

Funding

This research received no external funding.

Institutional Review Board Statement

Not applicable.

Informed Consent Statement

Not applicable.

Data Availability Statement

The original contributions presented in this study are included in the article. Further inquiries can be directed to the corresponding authors.

Conflicts of Interest

The authors declare no conflicts of interest.

References

  1. Nair, R.R.K.; Rajan, B.; Akiba, S.; Jayalekshmi, P.; Nair, M.K.; Gangadharan, P.; Koga, T.; Morishima, H.; Nakamura, S.; Sugahara, T. Background radiation and cancer incidence in Kerala, India: Karunagappally cohort study. Health Phys. 2009, 96, 55–66. [Google Scholar] [CrossRef]
  2. Ghiassi-Nejad, M.; Mortazavi, S.M.J.; Cameron, J.R.; Niroomand-Rad, A.; Karam, P.A. Very high background radiation areas of Ramsar, Iran: Preliminary biological studies. Health Phys. 2002, 82, 87–93. [Google Scholar] [CrossRef]
  3. Reisz, J.A.; Bansal, N.; Qian, J.; Zhao, W.; Furdui, C.M. Effects of ionizing radiation on biological molecules—Mechanisms of damage and emerging methods of detection. Antioxid. Redox Signal. 2014, 21, 260–289. [Google Scholar]
  4. United Nations Scientific Committee on the Effects of Atomic Radiation (UNSCEAR). Sources and Effects of Ionizing Radiation. Report to the General Assembly, with Scientific Annexes; United Nations Scientific Committee on the Effects of Atomic Radiation: New York, NY, USA, 2008. [Google Scholar]
  5. United Nations Scientific Committee on the Effects of Atomic Radiation (UNSCEAR). Sources and Effects of Ionizing Radiation. Report to the General Assembly, with Scientific Annexes; United Nations Scientific Committee on the Effects of Atomic Radiation: New York, NY, USA, 2000. [Google Scholar]
  6. United Nations Scientific Committee on the Effects of Atomic Radiation (UNSCEAR). Sources, Effects, and Risks of Ionizing Radiation. Report to the General Assembly, with Scientific Annexes; United Nations Scientific Committee on the Effects of Atomic Radiation: New York, NY, USA, 1988. [Google Scholar]
  7. Wang, Q.; Wang, H.; Ma, Y.; Wang, J.; Su, W.; Xiao, E.; Du, J.; Xiao, T.; Zhong, Q. Geochemical distributions of natural radionuclides in surface soils and sediments impacted by lead–zinc mining activity. Ecotoxicol. Environ. Saf. 2023, 263, 115210. [Google Scholar]
  8. Karunakara, N.; Yashodhara, I.; Sudeep Kumara, K.; Tripathi, R.M.; Menon, S.N.; Kadam, S.; Chougaonkar, M.P. Assessment of ambient gamma dose rate around a prospective uranium mining area of South India—A comparative study of dose by direct methods and soil radioactivity measurements. Results Phys. 2014, 4, 20–27. [Google Scholar]
  9. Gür, F.; Yaprak, G. Natural radionuclide emission from coal-fired power plants in southwestern Turkey and population exposure to external radiation in their vicinity. J. Environ. Sci. Health A Tox. Hazard. Subst. Environ. Eng. 2010, 45, 1900–1908. [Google Scholar]
  10. Papp, Z.; Dezső, Z.; Daróczy, S. Significant radioactive contamination of soil around a coal-fired thermal power plant. J. Environ. Radioact. 2002, 59, 191–205. [Google Scholar] [CrossRef]
  11. Flues, M.; Moraes, V.; Mazzilli, B.P. The influence of a coal-fired power plant operation on radionuclide concentrations in soil. J. Environ. Radioact. 2002, 63, 285–294. [Google Scholar] [CrossRef]
  12. Charro, E.; Pardo, R.; Peña, V. Statistical analysis of the spatial distribution of radionuclides in soils around a coal-fired power plant in Spain. J. Environ. Radioact. 2013, 124, 84–92. [Google Scholar] [CrossRef]
  13. European Commission—Joint Research Centre (JRC). EURDEP Gamma Dose Rates Advanced Map. Available online: https://remap.jrc.ec.europa.eu/Advanced.aspx (accessed on 20 December 2025).
  14. Zlatanovska, I.; Stafilov, T.; Šajn, R.; Dimovska Gonovska, B.; Dimovska, S.; Janusheski, J.; Barandovski, L. Distribution of some natural and artificial radionuclides in soil from the city of Bitola (Macedonia) and its environs. Radiat. Prot. Dosim. 2024, 200, 901–918. [Google Scholar] [CrossRef]
  15. Zlatanovska, I.; Stafilov, T.; Šajn, R.; Dimovska Gonovska, B.; Dimovska, S.; Janusheski, J.; Memeti, S.; Barandovski, L. Assessment of radiological hazards of soils from the city of Bitola (Macedonia) and its environs. Isot. Environ. Health Stud. 2024, 60, 453–470. [Google Scholar]
  16. Barandovski, L.; Frontasyeva, M.V.; Stafilov, T.; Šajn, R.; Ostrovnaya, T.M. Multi-element atmospheric deposition of trace elements in Macedonia studied by the moss biomonitoring technique. Environ. Sci. Pollut. Res. 2015, 22, 16077–16097. [Google Scholar]
  17. Stafilov, T.; Šajn, R.; Barandovski, L.; Bačeva Andonovska, K.; Malinovska, S. Moss biomonitoring of atmospheric deposition of minor and trace elements in Macedonia. Air Qual. Atmos. Health. 2018, 11, 137–152. [Google Scholar] [CrossRef]
  18. Stafilov, T.; Šajn, R. Geochemical Atlas of the Republic of Macedonia; Faculty of Natural Sciences and Mathematics: Skopje, Republic of Macedonia, 2016. [Google Scholar]
  19. Lazarevski, A. Climate in Macedonia; Kultura: Skopje, Republic of Macedonia, 1993. [Google Scholar]
  20. Arsovski, M. Tectonics of Macedonia; Faculty of Mining and Geology: Štip, Republic of Macedonia, 1997. [Google Scholar]
  21. United Nations Scientific Committee on the Effects of Atomic Radiation UNSCEAR. Sources and Effects of Ionizing Radiation. Report to the General Assembly with Scientific Annexes; United Nations Scientific Committee on the Effects of Atomic Radiation: New York, NY, USA, 1993. [Google Scholar]
  22. United Nations Scientific Committee on the Effects of Atomic Radiation UNSCEAR. Sources and Effects of Ionizing Radiation. Report to the General Assembly with Scientific Annexes; United Nations Scientific Committee on the Effects of Atomic Radiation: New York, NY, USA, 1996. [Google Scholar]
  23. Bossew, P.; Cinelli, G.; Hernández-Ceballos, M.; Cernohlawek, N.; Gruber, V.; Dehandschutter, B.; Menneson, F.; Bleher, M.; Stöhlker, U.; Hellmann, I.; et al. Estimating the terrestrial gamma dose rate by decomposition of the ambient dose equivalent rate. J. Environ. Radioact. 2017, 166, 296–308. [Google Scholar] [CrossRef]
  24. Cinelli, G.; De Cort, M.; Tollefsen, T. (Eds.) European Atlas of Natural Radiation; Publications Office of the European Union: Luxembourg, 2019. [Google Scholar]
  25. Box, G.E.P.; Cox, D.R. An Analysis of Transformations. J. R. Stat. Society. Ser. B (Methodol.) 1964, 26, 211–252. [Google Scholar] [CrossRef]
  26. ICRU. Quantities and Units in Radiation Protection Dosimetry; ICRU Report 51; International Commission on Radiation Units and Measurements: Bethesda, MD, USA, 1993. [Google Scholar]
  27. ICRP. Conversion Coefficients for Use in Radiological Protection Against External Radiation; ICRP Publication 74; Ann. ICRP; Elsevier Health Sciences: Amsterdam, The Netherlands, 1996; Volume 26. [Google Scholar]
  28. Stojanovska, Z.; Boev, B.; Ristova, M.; Boev, I.; Ajka, S.; Žunić, Z.S.; Ivanova, K. Risk assessment resulting from radionuclides in soils of the Republic of Macedonia. Contrib. Sect. Nat. Math. Biotech. Sci. MASA 2019, 40, 161–168. [Google Scholar] [CrossRef]
  29. ICRP. The 2007 Recommendations of the International Commission on Radiological Protection; ICRP Publication 103; Ann. ICRP; Elsevier Ltd.: Amsterdam, The Netherlands, 2007; Volume 37. [Google Scholar]
  30. Davis, J.C. Statistics and Data Analysis in Geology; Wiley: New York, NY, USA, 1986. [Google Scholar]
  31. Anjos, R.M.; Veiga, R.; Soares, T.; Santos, A.M.A.; Aguiar, J.G.; Frascá, M.H.B.O.; Brage, J.A.P.; Uzêda, D.; Mangia, L.; Facure, A.; et al. Natural radionuclide distribution in Brazilian commercial granites. Radiat. Meas. 2005, 39, 245–253. [Google Scholar] [CrossRef]
  32. Abd El-Naby, H.H.; Saleh, G.M. Radioelement distributions in the Proterozoic granites and associated pegmatites of the Gabal El Fereyid area, Southeastern Desert, Egypt. Appl. Radiat. Isot. 2003, 59, 289–299. [Google Scholar] [CrossRef]
  33. Overstreet, W.C. The Geologic Occurrence of Monazite; U.S. Government Printing Office: Washington, DC, USA, 1967. [Google Scholar]
  34. Movsisyan, N.; Demirtchyan, G.; Pyuskyulyan, K.; Belyaeva, O. Identification of radionuclides’ altitudinal distribution in soil and mosses in highlands of Armenia. J. Environ. Radioact. 2021, 231, 106550. [Google Scholar] [CrossRef] [PubMed]
  35. Begy, R.C.; Simon, H.; Vasilache, D.; Kelemen, S.; Cosma, C. 137Cs contamination over the Transylvania region (Romania) after the Chernobyl Nuclear Power Plant accident. Sci. Total Environ. 2017, 599–600, 627–636. [Google Scholar] [PubMed]
  36. Bossew, P.; Kirchner, G. Modelling the vertical distribution of radionuclides in soil. Part 1: The convection–dispersion equation revisited. J. Environ. Radioact. 2004, 73, 127–150. [Google Scholar] [CrossRef] [PubMed]
Figure 1. Location and map of Macedonia.
Atmosphere 17 00104 g001
Figure 2. Simplified geological map of North Macedonia. Tectonic units: I—Cukali-Krasta zone (CKZ); II—West-Macedonian zone (WMZ); III—Pelagonian massif (PM); IV—Vardar zone (VZ); V—Serbo-Macedonian massif (SMM); VI—Kraishtide zone (KZ).
Atmosphere 17 00104 g002
Figure 3. Locations of ambient dose equivalent rates measurement points across Macedonia in 2010 (a) and in 2015 and 2020 (b).
Atmosphere 17 00104 g003
Figure 4. Boxplot analysis of ambient dose equivalent rates according to the year of measurement, box (P25–P75) and whisker (P5–P95).
Atmosphere 17 00104 g004
Figure 5. Average ambient dose equivalent rates across regions and different geological units during the study period.
Atmosphere 17 00104 g005
Figure 6. Spatial distribution maps of the ambient equivalent dose rates measured in 2010, 2015, and 2020.
Atmosphere 17 00104 g006
Figure 7. Spatial distribution of long-term average ambient equivalent dose (2010–2020).
Atmosphere 17 00104 g007
Table 1. Descriptive statistics of the obtained data.
YearNXMdXBCMinMaxP10P90P25P75SCVMADQCDAEABCEBC
201068113110104533406517080130464033241.927.610.01−0.18
201572110110102383605615880142484334282.069.370.000.54
202072110104104413005515682140454135261.042.97−0.010.06
N—number of samples; X—average; Md—median; XBC—average of the Box–Cox transformed values; Min—minimum; Max—maximum; P10—10th percentile; P90—90th percentile; P25—25th percentile; P75—75th percentile; S—standard deviation; CV—coefficient of variation; MAD—median absolute deviation; QCD—quartile coefficient of dispersion; ABC—Skewness of the Box–Cox transformed values; EBC—Kurtosis of the Box–Cox transformed values.
Table 2. Comparison of ambient equivalent dose rates at 5-year intervals across regions and zones in Macedonia.
Zone201020152020
C_MKD999295
E_MKD10498105
W_MKD108112109
Ng-Pg10498109
PM110102106
VZ1099599
WMZ100110103
SMM10199103
C_MKD—Central regions; E_MKD—East regions; W_MKD—West regions; Ng-Pg—Paleogene-Neogene basins; PM—Pelagonian Massif; VZ—Vardar Zone; WMZ—West-Macedonian zone; SMM—Serbo-Macedonian Massif.
Table 3. Comparison of annual effective dose values in Macedonia obtained by different assessment methods and compared with global values.
LocationH (mSv/y)References
XMin–Max
20100.990.46–2.98Present study
20150.960.33–3.15
20200.960.36–2.63
Bitola, Macedonia0.110.054–0.16[15]
Veles, Macedonia0.120.049–0.32[15]
Kavadarci, Macedonia0.080.051–0.18[15]
Macedonia0.080.015–0.22[28]
World0.070.029–0.19[5]
X—arithmetic mean; Min—minimum; Max—maximum.
Table 4. Comparison of ANOVA results for ambient dose equivalent rates among years and across different regions and tectonic units.
YearZoneFpSIGN
2010–2020Year0.220.80NS
2010Regions0.210.81NS
2015Regions1.470.24NS
2020Regions0.540.58NS
2010Tectonic unit0.180.95NS
2015Tectonic unit0.280.89NS
2020Tectonic unit0.540.58NS
NS—non-significant.
Table 5. Correlation matrix between survey years.
201020152020
20101.00
20150.781.00
20200.760.841.00
Disclaimer/Publisher’s Note: The statements, opinions and data contained in all publications are solely those of the individual author(s) and contributor(s) and not of MDPI and/or the editor(s). MDPI and/or the editor(s) disclaim responsibility for any injury to people or property resulting from any ideas, methods, instructions or products referred to in the content.