Article

Increased Exposure Risk of Natural Reserves to Rainstorm in the Eastern Monsoon Region of China

1
School of Resource and Environmental Sciences, Wuhan University, Wuhan 430079, China
2
Chinese Academy of Meteorological Sciences, Beijing 100081, China
*
Author to whom correspondence should be addressed.
These authors contributed equally to this work.
Atmosphere 2025, 16(9), 1096; https://doi.org/10.3390/atmos16091096
Submission received: 27 August 2025 / Revised: 9 September 2025 / Accepted: 16 September 2025 / Published: 18 September 2025

Abstract

Due to climate warming, extreme precipitation events have intensified in frequency and intensity. This trend has raised significant concerns about its impact on natural reserves in eastern China’s monsoon region. A risk assessment is, therefore, needed to evaluate the vulnerability of these protected areas. Based on observed and simulated daily precipitation data, this study analyzed the spatiotemporal trends of heavy rainfall in the eastern monsoon region of China and assessed the exposure risk of the protected areas to rainstorm events both in the historical and future periods. Results indicate that the annual average number of heavy rainfall days gradually increases from northwest to southeast, displaying a distinct zonal distribution pattern. The proportion of heavy rainfall days to total precipitation days and the average intensity of heavy rainfall show peak centers in the southeastern coastal areas, western Sichuan region, and North China Plain, with minimum values observed in the northwestern direction. Protected areas in China’s Eastern Monsoon Region display a north–south gradient of precipitation exposure risk that intensifies from historical (1995–2014) to near future (2031–2050) to far future (2081–2100) under SSP245 scenario, with highest vulnerability in southeastern coastal areas. National reserves generally experience lower exposure than provincial and municipal ones, though all categories face increasing precipitation risks over time.

1. Introduction

Against the backdrop of global warming, significantly increased atmospheric water vapor content has accelerated the hydrological cycle, causing heavy rainfall events to exhibit characteristics of increased frequency and intensity [1,2]. Research based on the IPCC Sixth Assessment Report clearly states that for each 1 °C increase in global warming, extreme daily precipitation intensity will increase by approximately 7% [3]. The gradual escalation in rainfall intensity and frequency is threatening biodiversity by altering ecosystem structure and function [4], attracting widespread attention from scholars worldwide. Climate change and anthropogenic pressure represent two major global challenges that pose enormous threats to biodiversity [5].
Heavy rainfall poses significant risks to nature reserves through both direct and indirect impacts, affecting comprehensive management, protected wildlife, and their habitats. In the eastern monsoon region of China, heavy rainfall often triggers a range of secondary disasters such as flash floods, landslides, and debris flows. These occur when intense precipitation rapidly saturates the soil, increases surface runoff, and destabilizes slopes, especially in mountainous and hilly areas common to many nature reserves. As a result, nature reserves in this region face significant challenges in comprehensive management. Monitoring instruments are frequently damaged or rendered inoperable due to flooding or power disruptions, undermining the continuity and accuracy of long-term ecological data collection. Infrastructure such as patrol roads is highly vulnerable to washouts and collapses, impeding routine inspections and delaying emergency response efforts—sometimes isolating entire sections of a reserve. Due to climate change, most species’ habitats demonstrate trends of reduction or stabilization, with animal and plant habitats shifting from integration toward fragmentation [6]. Continuous heavy rainfall creates conditions for the outbreak of animal infectious diseases, reduces vegetation quality for herbivores, and even alters herbivores’ spatial utilization patterns, including migration [7]. Extreme precipitation causes extensive damage to coastal tree species [8], while disasters such as floods caused by heavy rainfall result in mass mortality of species within wetland ecosystems [9,10]. Identifying habitats severely impacted by heavy rainfall and implementing protective measures represents a crucial issue that needs to be addressed currently.
China’s eastern monsoon region is a key area for biodiversity conservation. This region not only nurtures rich wildlife resources [11], but also faces severe challenges from extreme precipitation events [12]. As a highly sensitive area to global climate change, China’s eastern monsoon region faces dual pressure from monsoon circulation anomalies and regional warming. Combined with topographic uplift effects, it makes it a hotspot for intense precipitation events [13,14]. Under global warming, the spatial patterns of precipitation anomalies over eastern China may be altered through amplified influences of tropical sea surface temperature anomalies [15], thereby potentially influencing the background conditions conducive to regional extreme precipitation. Extreme precipitation events have increased significantly in East China, especially in the Yangtze River Basin, with a trend of 10–20% per decade in summer [13]. Particularly during the summer monsoon, the frequent convergence of warm and humid airflows from the tropical western Pacific and Indian Oceans with polar cold air, combined with factors such as topographic uplift, leads to frequent regional heavy precipitation events [14]. Protected Areas (PA) are globally recognized strategies for addressing the survival crisis of rare animals [16,17,18], playing a crucial role in reducing habitat loss and maintaining sustainable population levels of species [19]. To better protect rare flora and fauna, China has established natural reserves to provide habitats for wild animals and plants [20]. However, the current system of protected areas has limitations in responding to precipitation changes and struggles to maintain biodiversity conservation value [21]. It is necessary to identify those with higher rainfall risks and develop relevant response mechanisms. Therefore, approaching from the perspective of heavy rainfall disasters at a more macro scale to systematically evaluate the exposure risks of natural reserves in China’s eastern monsoon region has constructive significance for improving China’s natural reserve system.
Existing related studies mostly focus on specific areas within a certain protected area or on individual heavy rainfall events [20,22], with small spatial scales and short time spans, lacking a macro-level portrayal of natural reserves affected by heavy rainfall over large areas and extended time periods. Based on this, our study selects China’s eastern monsoon region as the research area. The study defines heavy rainfall events as daily precipitation exceeding 50 mm and systematically analyzes the spatiotemporal evolution characteristics of heavy rainfall events in China’s eastern monsoon region from 1971 to 2020. The study assesses nature reserves’ exposure to heavy rainfall disasters and predicts exposure risks for 2031–2050 as the near future and 2081–2100 as the far future based on multi-model ensemble simulation data from CMIP6. This research not only helps deepen the understanding of regional extreme precipitation event evolution patterns but also provides scientific basis for adaptive conservation management of rare wildlife. By constructing a heavy rainfall risk assessment system on a larger spatiotemporal scale, this study offers reference for improving extreme precipitation prevention and protection measures in China’s eastern monsoon region. It provides scientific foundation and reference for future guidance on disaster prevention and mitigation in protected areas and ensuring biodiversity security, with important theoretical and practical significance for enhancing regional biodiversity conservation capacity.

2. Materials and Methods

2.1. Study Area

China’s eastern monsoon region is one of the most typical and unique monsoon regions in the global climate system, spanning a vast geographical area in eastern China with significant climatic, geographical, and ecological characteristics. This region roughly encompasses the eastern Yangtze River, and areas north of the Qinling Mountains-Huaihe River line, including East China, Central China, and parts of North China. It covers part or all of provinces such as Jiangsu, Zhejiang, Shanghai, Anhui, Jiangxi, Hubei, Hunan, Fujian, and Guangdong. The region is densely populated, economically developed, and is also one of the most biodiverse regions in China. The eastern monsoon region is significantly influenced by the East Asian monsoon climate system, exhibiting distinct monsoon climate characteristics. It is one of China’s most biodiverse regions, home to numerous national-level natural reserves. These protected areas provide habitats for rare and endangered species such as giant pandas, Père David’s deer, and white cranes, and contain extremely fragile ecosystems. The complex topography, abundant precipitation, and unique ecological environment of the region have created this treasure trove of biodiversity. It should be noted that, as there are neither meteorological stations nor nature reserves south of 16.8° N latitude in the South China Sea within the dataset used in this study, the eastern monsoon region defined in this research is confined to the north of 16.8° N, as shown in Figure 1.

2.2. Data

We utilize daily rainfall data from 1703 meteorological stations measured from 1971 to 2020 as historical observations. The spatial distribution of meteorology stations is shown in Figure 1a. We also analyze future rainfall using simulations from CMIP6 (the Coupled Model Intercomparison Program in Phase 6) under the SSP2-4.5 scenario.
Since CMIP6 models vary in their applicable domains, we employed multi-model ensemble mean to enhance robustness of results and minimize potential biases from suboptimal regional simulations. We selected eight models with a resolution finer than 2° × 2° from among those commonly used for the China region [23,24], utilizing historical data and future simulation data from SSP2-4.5. The detailed specifications of models are provided in Table 1. Here, SSP2-4.5 represents a scenario that maintains current socioeconomic and scientific technological development trends. Then we reveal both the spatiotemporal distribution of historical rainfall in the eastern monsoon region and the exposure risks to natural reserves under historical and different future periods.
Additionally, this study uses point data of ecological functional zones of natural reserves from ArcGIS online China, with a total of 2005 points located in the eastern monsoon region, including 258 national-level, 563 provincial-level, and 258 city/county-level reserves. The spatial distribution, sizes and levels of natural reserves are shown in Figure 1b. From an administrative classification perspective, national-level reserves generally cover relatively larger areas compared to reserves of other levels, and exhibit a dispersed spatial distribution. In terms of spatial distribution, the southeastern coastal region contains a higher density of reserves, which, although typically smaller in size, are highly clustered. It should be noted that due to the high fragmentation of nature reserves in the eastern monsoon region [25], these reserves are characterized by a large number and relatively small area compared to the region as a whole. To better integrate with the gridded data of heavy rainfall, this study adopted point—based data for the nature reserves.
Table 1. Information on the precipitation data used in this study.
Data NameTime SpanSpatial ResolutionTime ResolutionSource
Precipitation Data1971–2020Meteorological StationDailyChina Meteorological Administration
ACCESS-CM22015–21001.25° × 1.25°Earth System Grid Federation [26]
ACCESS-ESM1-51.25° × 1.25°Earth System Grid Federation [27]
BCC-CSM2-MR1.125° × 1.125°Earth System Grid Federation [28]
EC-EARTH3-VEG0.25° × 0.25°Earth System Grid Federation [29]
GFDL-ESM41° × 1°Earth System Grid Federation [30]
MIROC61.4° × 1.4°Earth System Grid Federation [31]
MPI-ESM1-2-HR0.5° × 0.5°Earth System Grid Federation [32]
MPI-ESM1-2-LR1.9° × 1.9°Earth System Grid Federation [33]

2.3. Methodology

2.3.1. Overview

The technical approach of this research is primarily divided into two parts: First, we explore the spatiotemporal variation characteristics of heavy rainfall events in the eastern monsoon region over the 50-year period from 1971 to 2020. Then, using historical and future precipitation data from simulations of individual CMIP6 models, we calculate the exposure risk of natural reserves to heavy rainfall disasters for both near- and long-term future periods by averaging the results obtained from each model separately. All calculations are implemented in Python 3.11 and ArcMap 10.8.2.
Specifically, this study adopts the definition of extreme rainfall established by the China Meteorological Administration, which classifies a rainfall event as extreme if the daily precipitation exceeds 50 mm. Regarding the selection of heavy rainfall thresholds in CMIP6, given the limited fidelity of climate model simulations in capturing extreme climate events, the scientific community generally adopts 20 mm/day as the threshold for heavy rain, with 10 mm/day serving as a reference [34,35]. Consistent with this established approach, this study utilizes daily precipitation exceeding 10 mm and 20 mm to assess future heavy rainfall hazard.
For individual CMIP6 models, historical simulation data from 1985 to 2014 were used as the historical baseline to compute the mean and standard deviation. These parameters were then applied to historical (1995–2014), near-future (2031–2050) and far-future (2081–2100) analyses. Accordingly, the exposure risk under future scenarios assessed in this study represents a relative risk in comparison to the historical baseline. Following the risk calculation for each individual model, the computed results from all selected CMIP6 models were resampled to match the identical resolution and spatial extent of the BCC-CSM-MR model to ensure comparability, as the models exhibited varying spatial scales. Subsequently, the multi-model ensemble mean was calculated for each grid cell to derive the final risk projections. These standardized projections served as the basis for visualization and subsequent analysis.

2.3.2. Interpolation Calculation

When analyzing spatiotemporal characteristics of heavy rainfall in China’s Eastern Monsoon Region from 1971 to 2020, it was necessary to interpolate station data onto the surface area of this region to visualize and analyze the overall precipitation distribution pattern. Considering that the Kriging interpolation method [36] has demonstrated optimal performance for precipitation interpolation across China [37], this study selected this approach. The spherical variogram model was adopted. For calculating the value of each pixel, the nearest 12 input points were utilized. A pixel size of 5000 m was chosen to ensure sufficient precision for analysis while avoiding overfitting.

2.3.3. Heavy Rainfall Risk Calculation and Exposure Risk Calculation

The assessment of exposure risk for natural reserves is the core component of this research, and its methodological design must balance scientific validity and systematic approach. This study constructs a multi-dimensional, multi-indicator exposure risk assessment system. The central approach is to eliminate dimensional differences between indicators through standardization and to objectively determine the weight of each indicator using information entropy weighting methods.
Specifically, we defined the regional heavy rainfall risk, which was calculated by subtracting the annual mean during the historical baseline period (1985–2014) from the annual mean value during the study period (i.e., 1995–2014, 2031–2050 and 2081–2100), and then dividing by the standard deviation of the historical baseline period, and represents a value of average condition during the study period relative to the historical baseline. It incorporates two input components: the average annual heavy rainfall intensity and the heavy rainfall frequency. The weights of these two components were determined using the entropy weight method before summation, and the result was subsequently standardized to derive the final heavy rainfall risk value. Herein, the study periods involve historical (1995–2014), near-future (2031–2050), and far-future (2081–2100). We defined heavy rainfall intensity as the quotient of the total heavy rainfall amount divided by the total number of heavy rainfall days within the study period, and heavy rainfall frequency as the total number of heavy rainfall days in the same period. Both of these metrics were converted to annual averages by dividing by the number of years in the study period to constitute the elements of the heavy rainfall risk. Then, we employed 30 years (1985–2014) of CMIP6 historical simulation data as the baseline period to calculate heavy rainfall risk across the eastern monsoon region of China for the historical, near-future, and far-future periods relative to this baseline using Z-score standardization method. Risk values from all three periods were collectively normalized using Min-Max Normalization to rescale pixel values to a unified range of 0–1, ensuring comparability across temporal scales.
Regarding exposure risk, to more clearly assess the heavy rainfall exposure risks faced by protected areas and to facilitate statistical analysis of high-risk resources (such as characteristic rare and protected animal species) in the later discussion, we introduced the concept of exposure risk. It was calculated by overlaying the former calculated spatial distribution of heavy rainfall risk with the spatial data of 2005 protected areas, thereby extracting risk values from areal units to each of the 2005 protected areas across the study region. The k-means clustering method was then applied to classify all exposure risk values into five distinct categories: minimal, low, medium, high, and extreme, such that each protected area was assigned an exposure risk level. This approach enables further discussion, integrating the protection level of the reserves and categories of conserved wildlife within them.

2.3.4. Entropy Weight Method

Information entropy is a measure of uncertainty in information, originally derived from information theory. In multi-indicator evaluation, information entropy reflects the informational contribution of each indicator within the overall evaluation system [38]. In this study, the Entropy Weight Method was employed to determine the relative importance of two indicators within the evaluation framework: annual average rainfall intensity and annual average rainfall frequency. After assigning weights to each indicator based on its information entropy, a weighted summation was performed to obtain the final risk score.
The specific calculation process is as follows:
(1) Data normalization:
Since different indicators usually have different units or scales, directly computing entropy can introduce bias. Therefore, the raw data must be normalized, as shown in Equation (1):
x i j = x i j m i n ( x i ) m a x ( x i ) m i n ( x i )
where x i j is the standardized extreme rainfall intensity (intensity), x i j is the extreme rainfall frequency (frequency), and m i n ( x i ) and m a x ( x i ) are the minimum and maximum values of the extreme rainfall intensity (frequency), respectively. This normalizes the values to a range between 0 and 1.
(2) Entropy calculation of each indicator:
Based on the normalized data, the entropy value H j for each indicator (e.g., H 1 for intensity, H 2 for frequency) is calculated using Equation (2):
H j = k i = 1 n p i j l n ( p i j )
where p i j represents the proportion of the i-th sample under the j-th indicator after min-max normalization, it equal to x i j i = 1 n x i j k is a constant equal to 1 l n ( n ) and n is the number of samples. The constant k is introduced to ensure that the final value of information entropy is constrained within the interval [0, 1], as the maximum value of the subsequent calculation is ln(n). According to this formula, a higher entropy implies less useful information from that indicator, while lower entropy indicates a greater informational contribution. The input values for standardization are the raw values of extreme rainfall intensity and frequency from the study.

2.3.5. Z-Score Standardization

Z i = X i σ μ
Here, Z i denotes the standardized extreme rainfall intensity (or frequency), X i represents the raw value of extreme rainfall intensity (or frequency), μ is the mean of extreme rainfall intensity (or frequency) during the historical baseline period (1985–2014), and σ is the corresponding standard deviation during the same period. In the calculation, the input X i is derived from the CMIP6 future rainfall data, while μ and σ are computed based on the CMIP6 historical baseline data. This design allows the standardized extreme rainfall intensity (or frequency) factors to bridge the future and historical periods, meaning that all standardized values are expressed as relative measures with respect to the historical baseline.

3. Result

3.1. Spatiotemporal Characteristics of Heavy Rainfall in China’s Eastern Monsoon Region

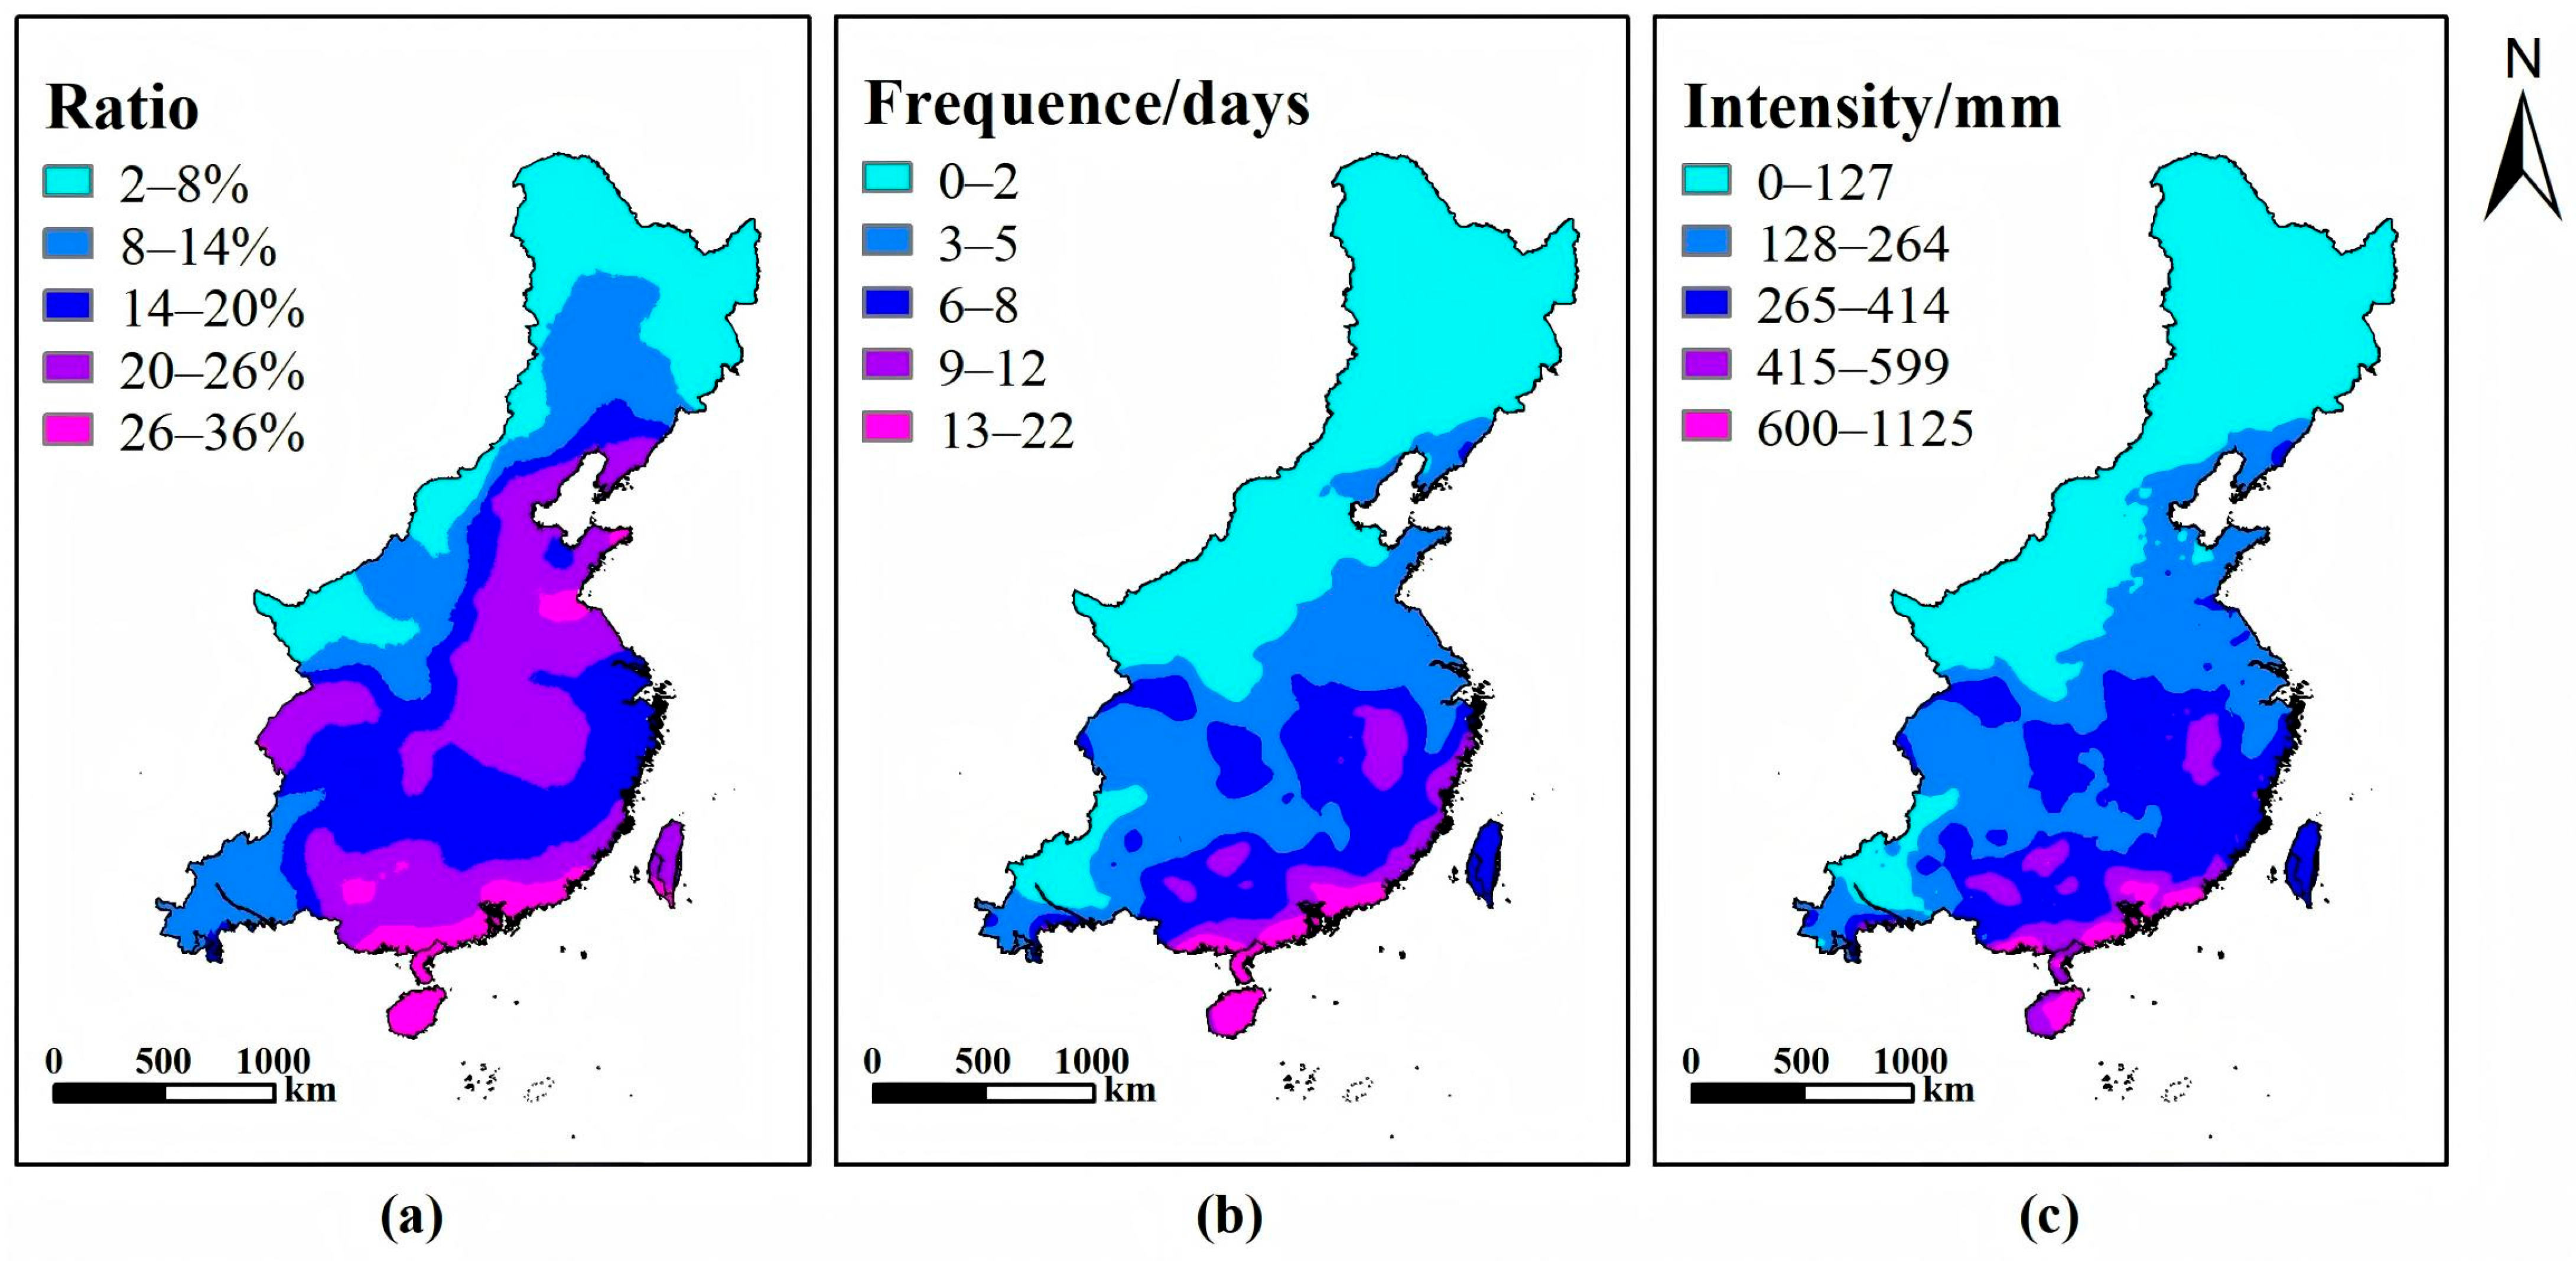
Heavy rainfall characteristics in China’s eastern monsoon region exhibit complex and significantly differentiated spatial distribution patterns (Figure 2). The proportion of heavy rainfall volume, an important indicator measuring the contribution of heavy rainfall to regional precipitation (Figure 2a), presents significant spatial differences. The heavy rainfall proportion in the northeast region is only 2–8%, while regions south of the Yangtze River have proportions as high as 20–30%, highlighting the enormous difference in precipitation characteristics between north and south. The regional variation in annual average heavy rainfall days demonstrates notable geographic gradient characteristics (Figure 2b), also showing a distinct increasing trend from northwest to southeast. Coastal areas and southern regions have significantly higher numbers of heavy rainfall days than inland and northern regions, a distribution pattern closely related to regional topography, land–sea effects, and monsoon circulation. Specifically, the southernmost regions reach peak values in heavy rainfall days, while the northwestern, northeastern, and southwestern marginal areas have relatively fewer heavy rainfall days. The average intensity of heavy rainfall likewise exhibits significant spatial heterogeneity across the eastern monsoon region (Figure 2c). Overall, it shows characteristics of greater intensity in the east than in the west and greater in the south than in the north, with intensity decreasing along the northwest to southeast direction. Maximum values are concentrated in the southernmost areas, with central and eastern regions also showing areas of relatively high intensity. Notably, the eastern edge of the Sichuan-Chongqing region in the western part of the study area exhibits abnormally high heavy rainfall intensity.
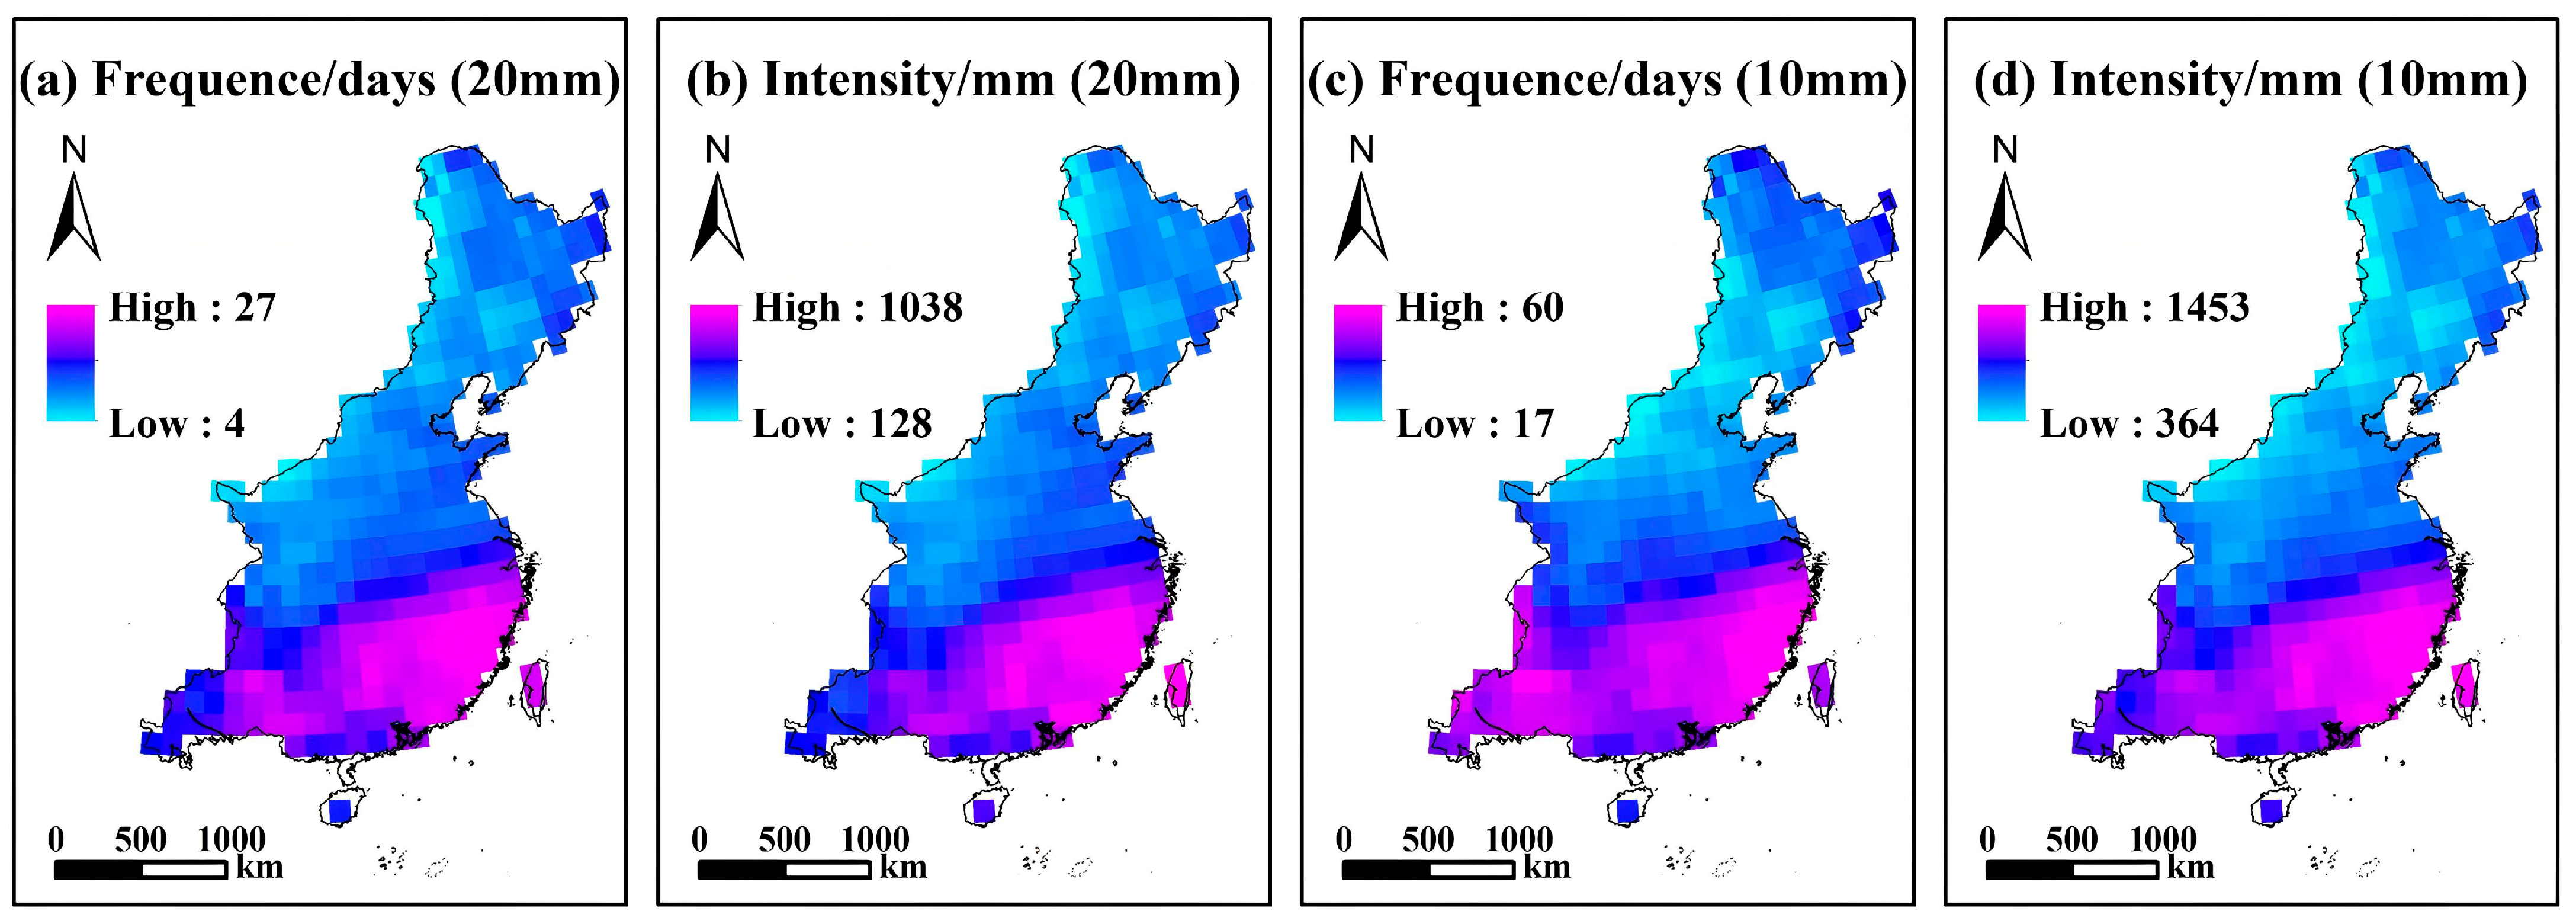
The spatial distribution of heavy rainfall derived from CMIP6 model simulations for the historical period 1995–2014 (Figure 3) exhibits consistency with observational records. Although the models fail to capture fine-scale regional precipitation features, they successfully reproduce the overarching northwest-to-southeast increasing gradient in both heavy rainfall frequency and intensity. Furthermore, this spatial pattern remains consistent across different precipitation thresholds, with higher frequency and intensity of heavy rainfall occurring in southeastern coastal China and reduced occurrences in the northern extents of the eastern monsoon region.
The frequency of heavy rainfall events within the eastern monsoon region, the proportion of frequency among total rainfall events, and intensity all exhibit obvious zonal differences (Figure 4). In tropical and subtropical regions, the frequency and intensity of heavy rainfall events show a steady upward trend and are significantly higher than in temperate regions. In temperate regions, there is no obvious trend in heavy rainfall frequency and intensity over the 50-year period, but there are large fluctuations around the mean value. The proportion of heavy rainfall frequency to total annual rainfall events in tropical and subtropical regions also shows a clear upward trend, while temperate regions show a smaller upward trend. Notably, around 1996, the two regions converged very closely, while in other years, the tropical and subtropical regions were distinctly higher than the temperate regions.
This divergence in trends is further confirmed by the correlation coefficients shown in Figure 4, with the temperate region exhibiting notably higher correlation values, especially for the ratio metric (r = 0.693), suggesting a more consistent long-term increase in the proportion of heavy rainfall events despite the lack of a clear frequency or intensity trend. In contrast, although the tropical and subtropical zones show generally higher absolute values in all three metrics, their correlation coefficients are lower, indicating a more gradual and less consistent upward pattern. This discrepancy may reflect the combined influence of regional climatic variability, monsoon dynamics, and local convective processes, which tend to be more dominant in lower latitudes. The year 1996, when all three indices nearly converge, may signal a transitional phase in large-scale circulation or climate anomalies (e.g., ENSO influence), deserving further investigation.

3.2. Exposure Risk of Natural Reserves to Heavy Rainfall in China’s Eastern Monsoon Region

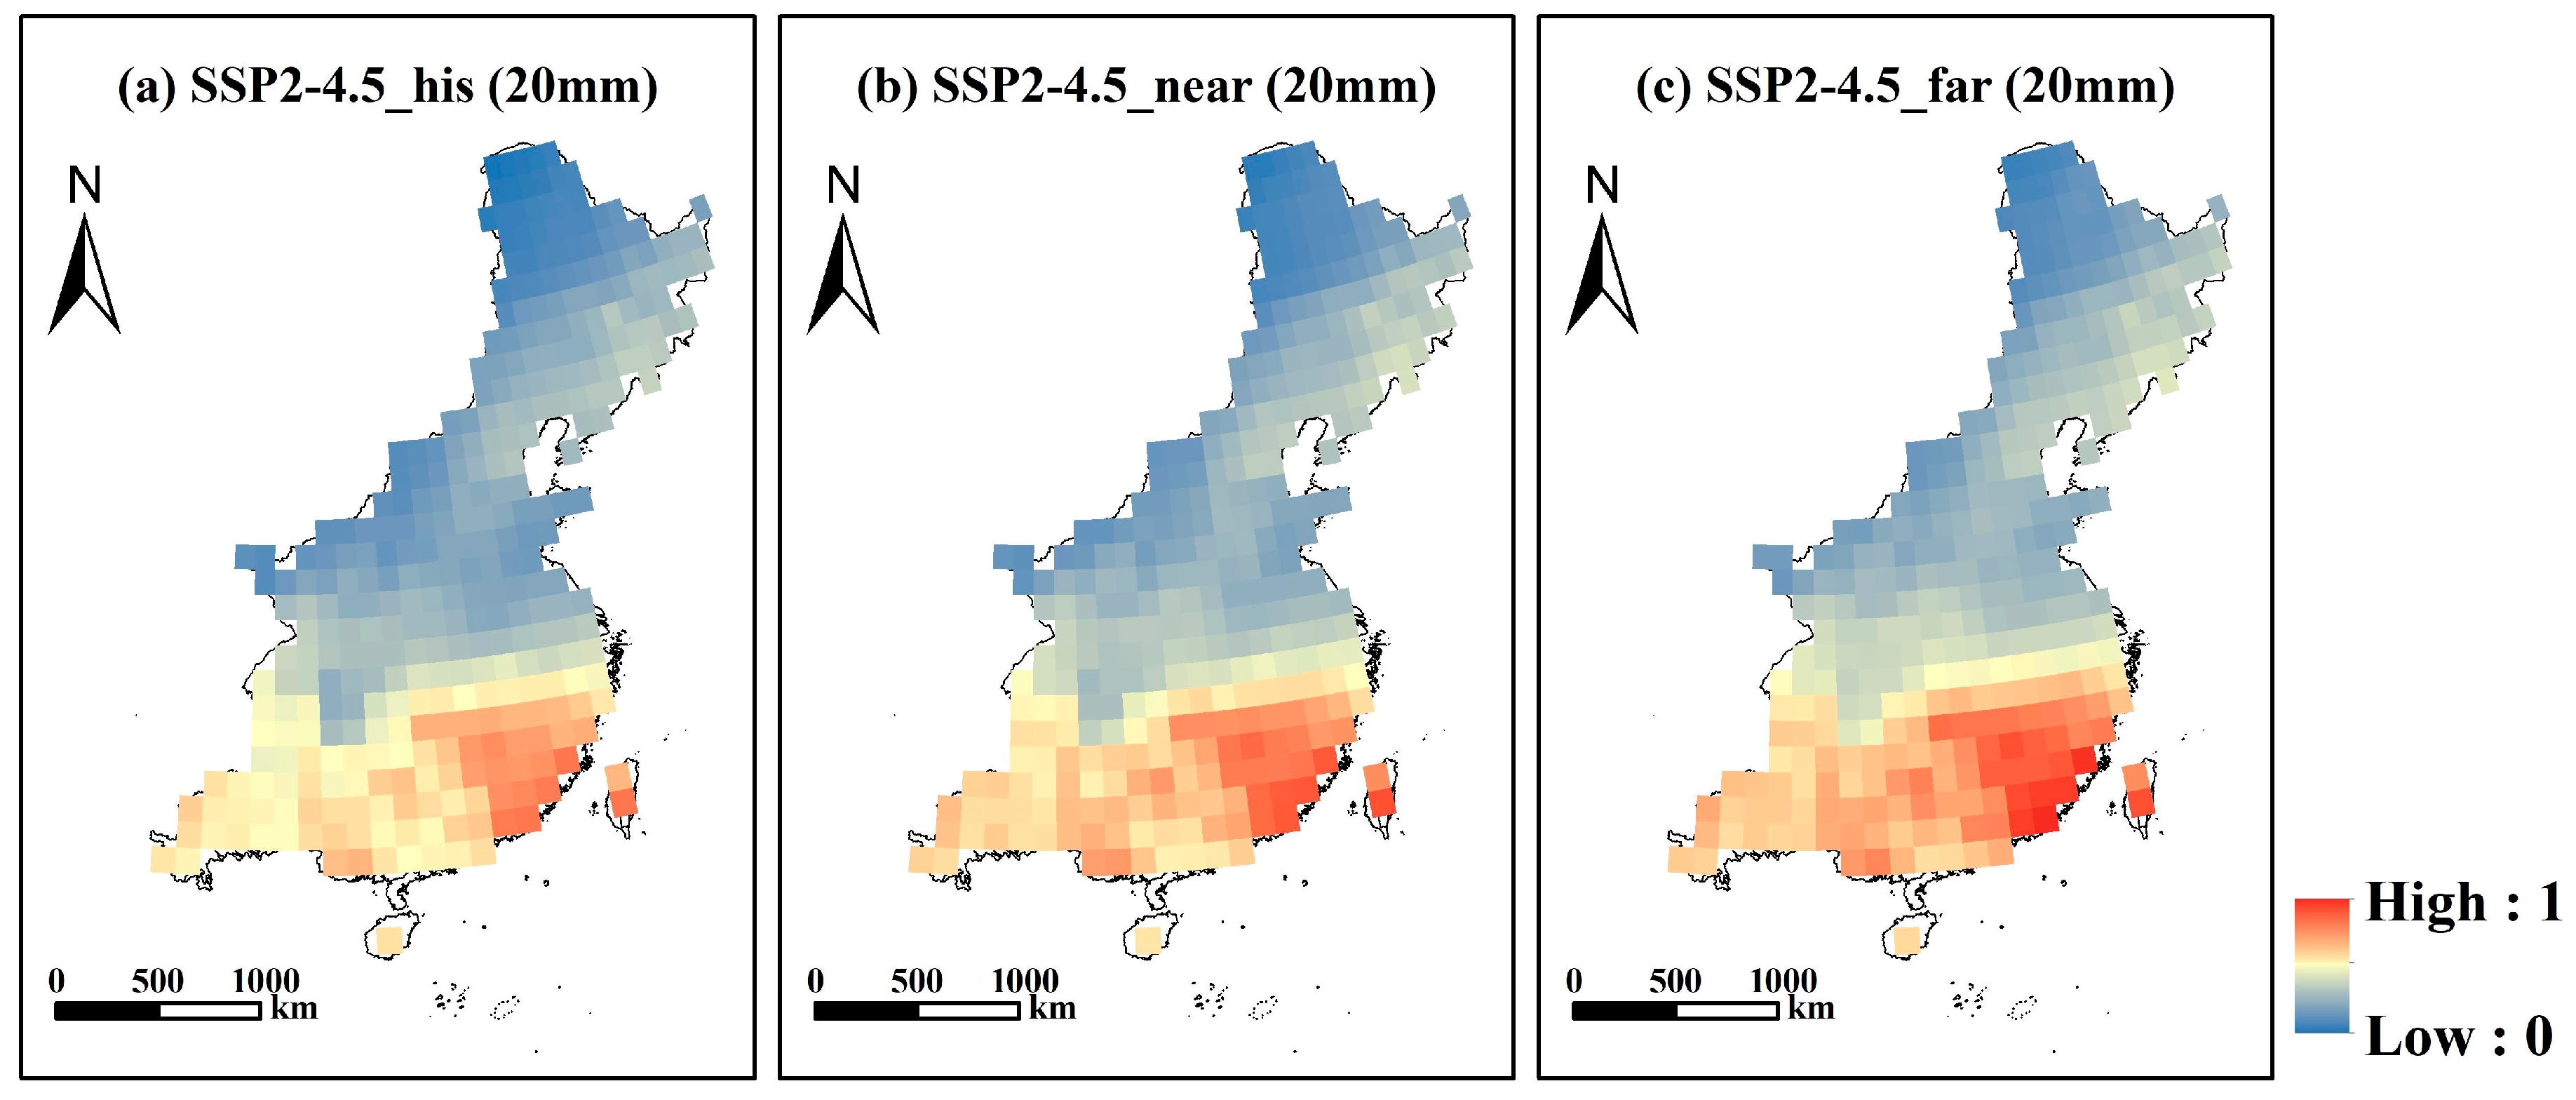
The results reveal a spatial pattern: the northern part of the eastern monsoon region experiences relatively low heavy rainfall risk, with values gradually increasing toward the southeast and peaking in the southeastern coastal zone. We can also see that all temporal horizons consistently show a transition zone between low and high precipitation hazards approximately along the mid-latitudes of the Eastern Monsoon Region. Temporally, the risk under historical (1995–2014) conditions (Figure 5a) is significantly lower than in future scenarios. The far-future period (2081–2100) (Figure 5c) exhibits the greatest risk, with historically middle-risk areas across southern China—particularly the western-southern region—projected to transition into high-risk zones. This shift indicates a likely increase in both the frequency and intensity of heavy rainfall events, suggesting an intensification of monsoon-driven precipitation extremes under continued climate warming. This pattern highlights the differential vulnerability within the Eastern Monsoon Region, with southern provinces facing increasingly severe precipitation hazards while northern areas experience relatively modest changes in extreme precipitation intensity between the two time periods.
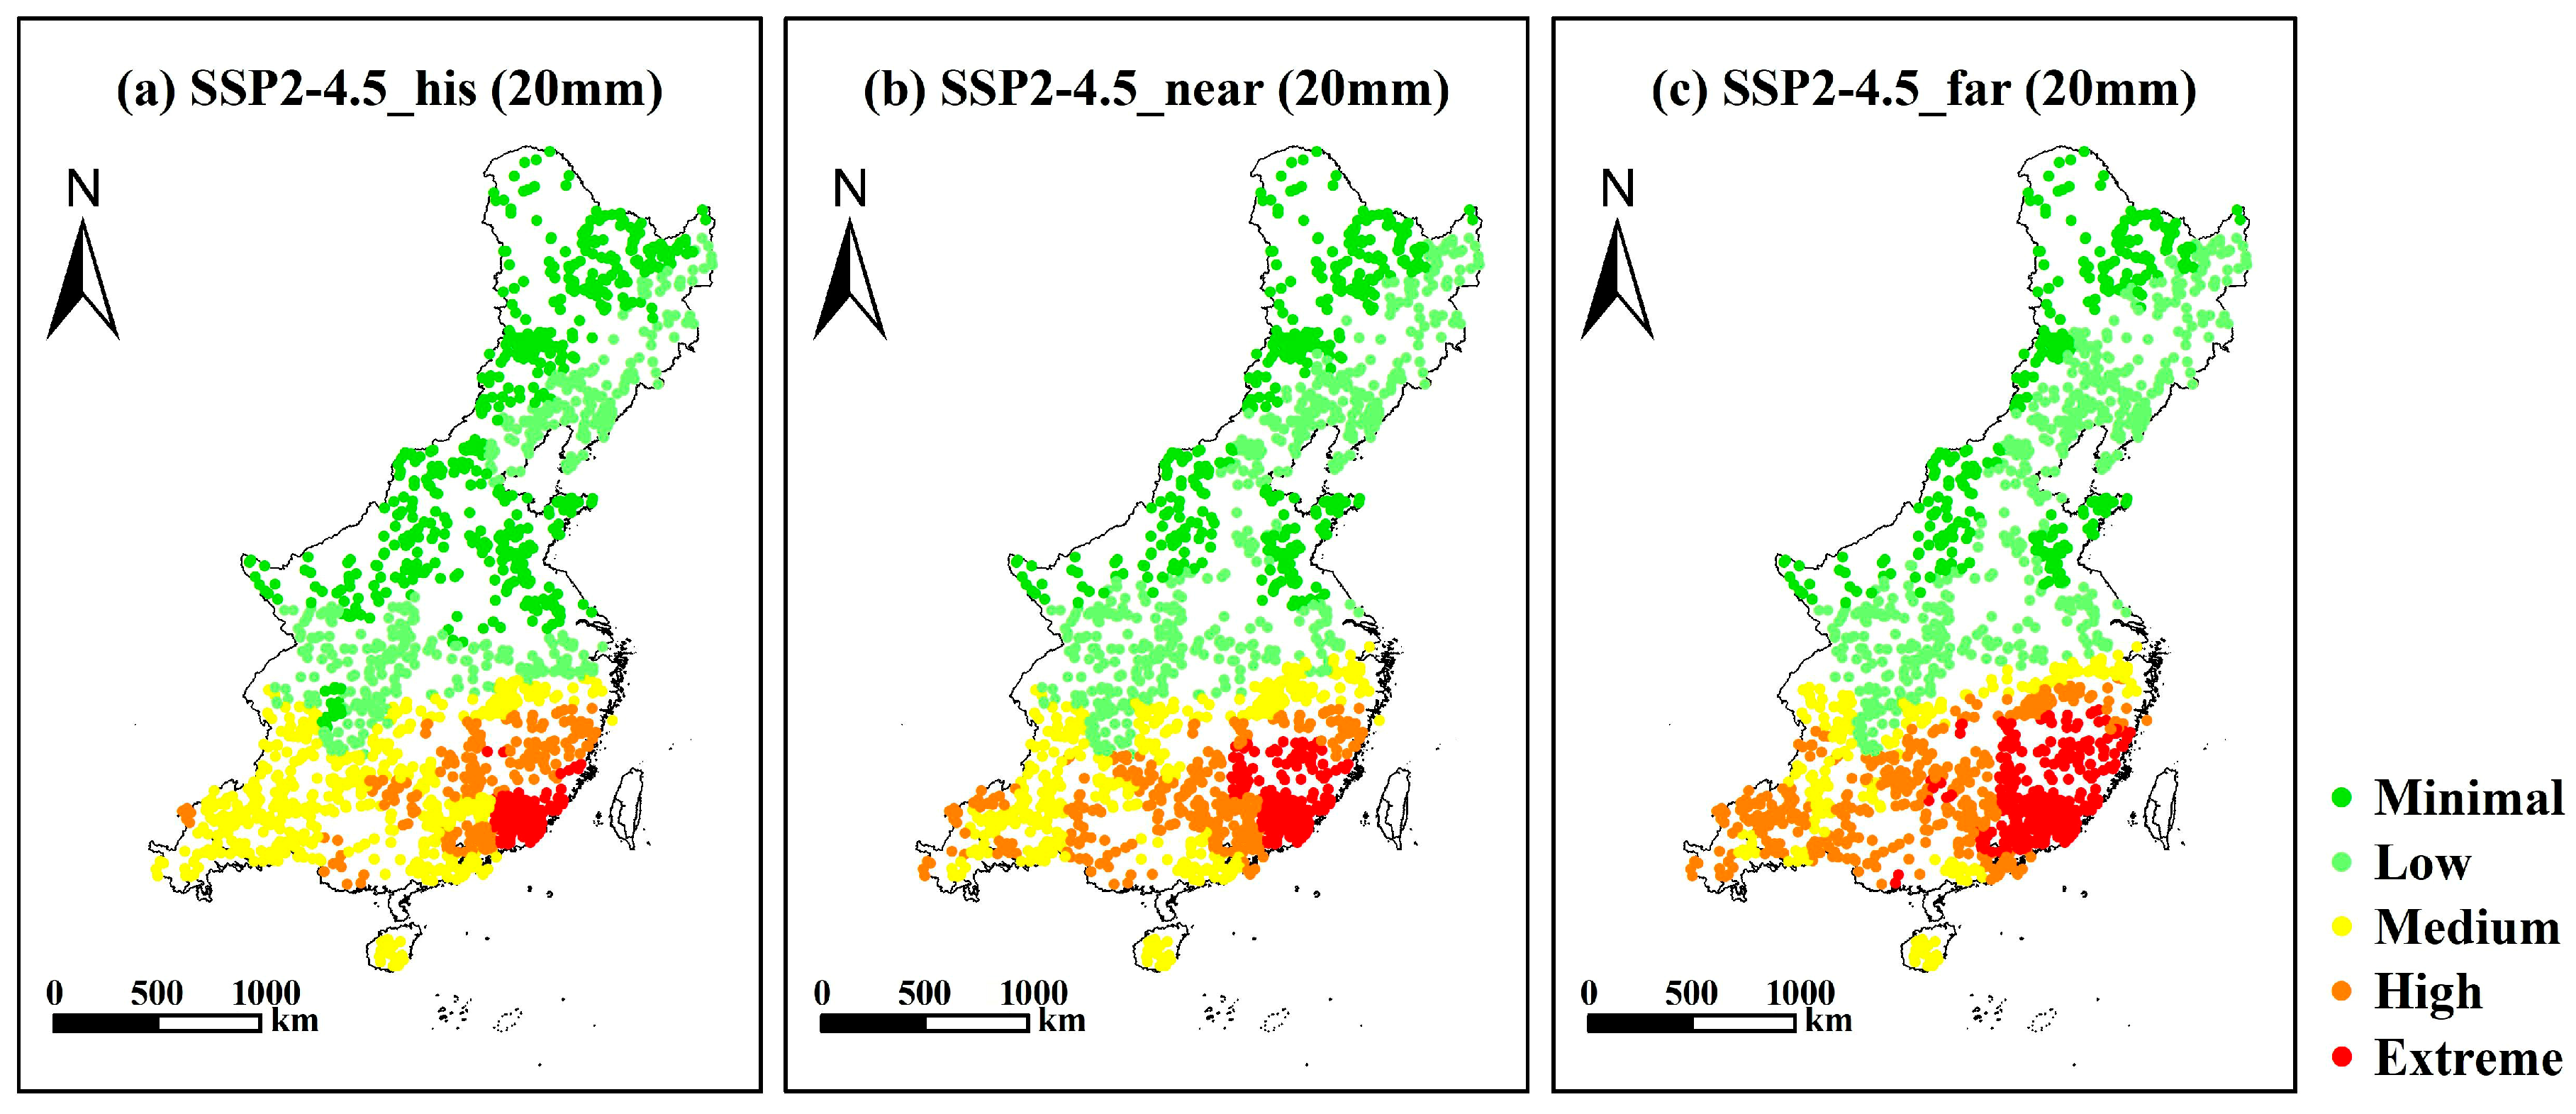
Figure 6 shows the exposure risk of each site in the natural reserves of China’s eastern monsoon region. The extraction results revealed that the spatial distribution of natural protected areas’ exposure to extreme precipitation risks in China’s Eastern Monsoon Region demonstrates clear patterns across different risk levels. In the historical period (Figure 6a), protected areas exhibit a distinctive north–south gradient of exposure, with northern areas predominantly showing minimal to low exposure levels, while southeastern coastal regions display high to extreme exposure levels. The future projection (Figure 6b,c) maintains this spatial pattern but shows an intensification of exposure in the southeastern coastal protected areas, with more sites shifting to extreme exposure categories. Both time periods maintain consistent minimal exposure in northern protected areas, while the transition zone between low and high exposure follows approximately the middle latitudes of the Eastern Monsoon Region. By century’s end, increasing vulnerability of conservation areas to precipitation extremes under continued warming in the SSP245 pathway.
The analysis of precipitation exposure risk across different levels of protected natural reserves in China’s Eastern Monsoon Region reveals distinct patterns of vulnerability. In national-level reserves (Figure 7a), the proportion of reserves with high exposure risk remains relatively low across all periods, indicating an overall safer status, while the low-risk category constitutes the largest share. Notably, however, the proportion of sites experiencing extreme exposure risk surges dramatically from approximately 2% in the historical period to 12% in the future, whereas the share of lowest-risk sites declines correspondingly. Provincial-level reserves (Figure 7b) show a similar pattern to national reserves in the near future, with higher proportions at lower risk levels. Municipal-level reserves (Figure 7c) exhibit a distinctly different pattern, characterized by a more even distribution across risk categories. With the exception of the minimal and medium risk levels, all other categories—particularly high and extreme exposure risks—show a marked increase in the future, exceeding 20%, and show the most substantial increase in high-risk exposure from near to far future scenarios.
Comparing across administrative levels, national reserves appear to maintain relatively better protection from extreme precipitation risks over time compared to provincial and municipal reserves, which show progressively higher vulnerability to extreme risk levels in future scenarios. This hierarchical pattern suggests that higher administrative-level protected areas may have been established in locations inherently less vulnerable to precipitation extremes or may have better adaptive management strategies in place.

4. Discussion

4.1. The Methodology for Constructing a Rainstorm Exposure Risk Assessment System

In the field of risk assessment, understanding the world in relation to risks and how we can and should understand, evaluate, and manage these risks is fundamental. In FEMA’s (National Risk Index), hazard exposure is defined as the representative value of buildings (in dollars), population (in numbers and population-equivalent dollars), or agriculture (in dollars) that may be exposed to natural hazard events. Exposure assessments are conducted to identify areas most vulnerable to the effects of heavy rainfall, as well as potential casualties, property damage, and economic losses that may result from heavy rainfall events. Some studies have also selected land use and rainfall intensity as evaluation factors, basing heavy rainfall disaster exposure assessment on both the probability of being affected by heavy rainfall and potential losses [39].
This study constructs a heavy rainfall exposure risk assessment system primarily based on the frequency of heavy rainfall events and annual heavy rainfall intensity as evaluation factors. After calculating the relevant values of these two evaluation factors for each grid cell within the corresponding research time period, the entropy weight method is used to calculate the weights of these two factors, which are then summed to obtain the hazard distribution. On this basis, the hazard distribution is further overlaid with natural reserves and classified using the k-means clustering method for assessment. Conventional exposure calculation methods typically multiply the disaster frequency within the study period by the carrier area, population, or total GDP value of the region [2]. However, due to the special nature of the disaster-bearing bodies in this study, we cannot accurately quantify the number of various rare animals within natural reserves. Furthermore, since the area of protected reserves does not have a direct relationship with the disaster situation of rare animals within them, using the reserve area directly is not entirely appropriate. Therefore, we adopt a direct overlay approach for statistical analysis.

4.2. Consistency Between the Evaluation Results of Medium-High Risk Areas and Actual Conditions

In China’s eastern monsoon region, the annual average number of heavy rainfall days and intensity generally shows an increasing pattern from northwest to southeast, while the proportion of heavy rainfall is higher in Sichuan and central regions. In the future, China will generally experience an increase in heavy rainfall days, especially in the northeastern regions such as Jilin and Heilongjiang, eastern coastal areas, and parts of Jiangxi and Hunan. From the overall northward migration of heavy rainfall centers, it can be observed that as heavy rainfall increases across the eastern monsoon region, the threat of rainfall growth in northern parts of each region exceeds that in southern parts, consistent with research findings by previous studies [40,41].
Combining historical and future heavy rainfall hazards, it can be found that the overall risk for natural reserves in the eastern monsoon region shows a trend of being safer in the northwest direction and more dangerous in the southeast direction, indicating that historical data calculations and CMIP6 prediction results are relatively coherent and comparable. Both historical and future hazard results show that the risk in central China is relatively larger compared to surrounding areas, which is related to the large proportion of heavy rainfall in total precipitation in this region. The results also show that historical data is more sensitive in the southernmost coastal areas, while the locations of extreme hazards in future predictions are in central China. This may be due to the large differences in historical heavy rainfall intensity, while the CMIP6 dataset’s ability to predict extreme heavy rainfall is insufficient [42], weakening the impact of extremely heavy rainfall intensity in coastal areas of Hainan and Guangdong provinces.
In both the near and far future, the risk to protected areas in central and southern China remains high, with risks in the near future generally lower than in the far future. Among all provinces, Guangdong faces the highest current risk for rare animals. Species such as the macaques on Shangchuan Island and the sika deer on Dazhang Island [43] are under significant threat, which aligns with actual findings [44,45]. The risk to rare animals in Guangxi Zhuang Autonomous Region and Hainan Province is somewhat lower, while rare animals in Gansu Province, Shanxi Province, and Inner Mongolia Autonomous Region are relatively safe. In Guangdong, Guangxi, and Hainan, natural reserves need to improve emergency response mechanisms for heavy rainfall, providing facilities such as shelters for rare animals to rest and seek refuge from the rain to ensure their safety. In the future, natural reserves along the Yangtze River in Central China, particularly in Hunan, Hubei, and Jiangxi, as well as the southwestern regions further west [46,47], will face even greater threats from heavy rainfall. These areas have been severely affected by heavy rainfall disasters in recent years and require enhanced preventive measures.

5. Conclusions

This study finds that heavy rainfall exposure in China’s Eastern Monsoon Region presents a clear spatial pattern, increasing from northwest to southeast, with peak intensity in southeastern coastal areas, the western Sichuan region, and the North China Plain. Under the SSP245 scenario, precipitation exposure risk in natural reserves is projected to intensify over time (from 2031–2050 to 2081–2100), especially in the southeast, forming a pronounced north–south gradient.
Based on integrated literature review and actual heavy rainfall disasters in eastern monsoon region reserves, we argue that impacts require dual consideration: directly, through increased disease risks, reduced herbivore forage quality, and coastal ecosystem damage (e.g., tree species, wetlands); indirectly, via secondary disasters (floods, landslides, debris flows) affecting exposed elements.
Although national reserves generally face lower exposure than provincial and municipal ones, all levels will experience rising risks. These results highlight the need for climate-adaptive conservation planning to protect vulnerable reserves from future extreme rainfall events.

Author Contributions

Conceptualization, L.Z., H.C. and Y.Z.; methodology, L.Z., S.S., Y.Z. and H.C.; software, H.C.; validation, L.Z., Y.Z. and H.C.; formal analysis, Y.Z. and H.C.; investigation, Y.Z. and H.C.; resources, S.S.; writing—original draft preparation, Y.Z. and H.C.; writing—review and editing, L.Z., Y.Z. and H.C.; visualization, Y.Z.; funding acquisition, L.Z. All authors have read and agreed to the published version of the manuscript.

Funding

This research was funded by National Natural Science Foundation of China, grant number 42471085 and U22B2011. And the APC was funded by National Natural Science Foundation of China, grant number 42471085.

Institutional Review Board Statement

Not applicable.

Informed Consent Statement

Not applicable.

Data Availability Statement

The future rainfall data used in this study are publicly available from the Earth System Grid Federation (ESGF) website at https://aims2.llnl.gov/search/cmip6/ (accessed on 26 August 2025). The historical site-measured rainfall data that support the findings of this study are available from the co-author, Sun Shao, from the Chinese Academy of Meteorological Sciences, upon reasonable request. The nature reserve sites analyzed in this study and detailed data can be found at https://mp.weixin.qq.com/s/YtfrODTKUwPFoibTrGFm1Q (accessed on 26 August 2025).

Conflicts of Interest

The authors declare no conflicts of interest.

References

  1. Myhre, G.; Alterskjær, K.; Stjern, C.W.; Hodnebrog, Ø.; Marelle, L.; Samset, B.H.; Sillmann, J.; Schaller, N.; Fischer, E.; Schulz, M.; et al. Frequency of extreme precipitation increases extensively with event rareness under global warming. Sci. Rep. 2019, 9, 16063. [Google Scholar] [CrossRef]
  2. Tabari, H. Climate change impact on flood and extreme precipitation increases with water availability. Sci. Rep. 2020, 10, 13768. [Google Scholar] [CrossRef]
  3. Li, C.; Zwiers, F.; Zhang, X.; Li, G.; Sun, Y.; Wehner, M. Changes in annual extremes of daily temperature and precipitation in CMIP6 models. J. Clim. 2021, 34, 3441–3460. [Google Scholar] [CrossRef]
  4. Pawson, S.M.; Brin, A.; Brockerhoff, E.G.; Lamb, D.; Payn, T.W.; Paquette, A.; Parrotta, J. Plantation forests, climate change and biodiversity. Biodivers. Conserv. 2013, 22, 1203–1227. [Google Scholar] [CrossRef]
  5. Wan, X.; Jiang, G.; Yan, C.; He, F.; Wen, R.; Gu, J.; Li, X.; Ma, J.; Stenseth, N.C.; Zhang, Z. Historical records reveal the distinctive associations of human disturbance and extreme climate change with local extinction of mammals. Proc. Natl. Acad. Sci. USA 2019, 116, 19001–19008. [Google Scholar] [CrossRef] [PubMed]
  6. Yuan, R.; Zhang, N.; Zhang, Q. The impact of habitat loss and fragmentation on biodiversity in global protected areas. Sci. Total Environ. 2024, 931, 173004. [Google Scholar] [CrossRef] [PubMed]
  7. Bartzke, G.S.; Ogutu, J.O.; Mukhopadhyay, S.; Mtui, D.; Dublin, H.T.; Piepho, H.-P. Rainfall trends and variation in the Maasai Mara ecosystem and their implications for animal population and biodiversity dynamics. PLoS ONE 2018, 13, e0202814. [Google Scholar] [CrossRef]
  8. Kramer, K.; Vreugdenhil, S.J.; Van Der Werf, D. Effects of flooding on the recruitment, damage and mortality of riparian tree species: A field and simulation study on the Rhine floodplain. For. Ecol. Manag. 2008, 255, 3893–3903. [Google Scholar] [CrossRef]
  9. Vretare, V.; Weisner, S.E.; Strand, J.A.; Granéli, W. Phenotypic plasticity in Phragmites australis as a functional response to water depth. Aquat. Bot. 2001, 69, 127–145. [Google Scholar] [CrossRef]
  10. Asaeda, T.; Hung, L.Q. Internal heterogeneity of ramet and flower densities of Typha angustifolia near the boundary of the stand. Wetl. Ecol. Manag. 2007, 15, 155–164. [Google Scholar] [CrossRef]
  11. Wen, C.; Gu, L.; Wang, H.; Lv, Z.; Hu, R.; Zhong, J. GAP analysis on national nature reserves in China based on the distribution of endangered species. Biodivers. Sci. 2015, 23, 591–600. [Google Scholar] [CrossRef]
  12. Shrestha, N.; Xu, X.; Meng, J.; Wang, Z. Vulnerabilities of protected lands in the face of climate and human footprint changes. Nat. Commun. 2021, 12, 1632. [Google Scholar] [CrossRef]
  13. Wang, Y.; Zhou, L. Observed trends in extreme precipitation events in China during 1961–2001 and the associated changes in large-scale circulation. Geophys. Res. Lett. 2005, 32. [Google Scholar] [CrossRef]
  14. Dong, C.; Noyelle, R.; Messori, G.; Gualandi, A.; Fery, L.; Yiou, P.; Vrac, M.; D’andrea, F.; Camargo, S.J.; Coppola, E.; et al. Indo-Pacific regional extremes aggravated by changes in tropical weather patterns. Nat. Geosci. 2024, 17, 979–986. [Google Scholar] [CrossRef]
  15. Duan, Y.; Wu, P.; Chen, X.; Ma, Z. Assessing Global Warming Induced Changes in Summer Rainfall Variability over Eastern China Using the Latest Hadley Centre Climate Model HadGEM3-GC2. Adv. Atmos. Sci. 2018, 35, 1077–1093. [Google Scholar] [CrossRef]
  16. Hoekstra, J.M.; Boucher, T.M.; Ricketts, T.H.; Roberts, C. Confronting a biome crisis: Global disparities of habitat loss and protection. Ecol. Lett. 2005, 8, 23–29. [Google Scholar] [CrossRef]
  17. Geldmann, J.; Joppa, L.N.; Burgess, N.D. Mapping Change in Human Pressure Globally on Land and within Protected Areas. Conserv. Biol. 2014, 28, 1604–1616. [Google Scholar] [CrossRef]
  18. Lewis, E.; MacSharry, B.; Juffe-Bignoli, D.; Harris, N.; Burrows, G.; Kingston, N.; Burgess, N.D. Dynamics in the global protected-area estate since 2004. Conserv. Biol. 2019, 33, 570–579. [Google Scholar] [CrossRef]
  19. Gray, C.L.; Hill, S.L.L.; Newbold, T.; Hudson, L.N.; Borger, L.; Contu, S.; Hoskins, A.J.; Ferrier, S.; Purvis, A.; Scharlemann, J.P.W. Local biodiversity is higher inside than outside terrestrial protected areas worldwide. Nat. Commun. 2016, 7, 12306. [Google Scholar] [CrossRef]
  20. Wang, W.; Feng, C.; Liu, F.; Li, J. Biodiversity conservation in China: A review of recent studies and practices. Environ. Sci. Ecotechnology 2020, 2, 100025. [Google Scholar] [CrossRef]
  21. Xu, B.; Wu, X. A comprehensive analysis to optimizing national-scale protected area systems under climate change. J. Environ. Manag. 2024, 363, 121408. [Google Scholar] [CrossRef]
  22. Liu, M.; Yuan, H.; Zhou, S. Influence of Climate Change on Wolong Nature Reserve. For. Sci. Technol. 2022, 8, 79–82. [Google Scholar] [CrossRef]
  23. Wu, X.; Wang, L.; Niu, Z.; Jiang, W.; Cao, Q. More extreme precipitation over the Yangtze River Basin, China: Insights from historical and projected perspectives. Atmos. Res. 2023, 292, 106883. [Google Scholar] [CrossRef]
  24. Tian, J.; Zhang, Z.; Ahmed, Z.; Zhang, L.; Su, B.; Tao, H.; Jiang, T. Projections of precipitation over China based on CMIP6 models. Stoch. Environ. Res. Risk Assess. 2021, 35, 831–848. [Google Scholar] [CrossRef]
  25. Zhao, W.; Zong, L.; Wang, M. Spatial distribution of nature reserves in China. Acta Ecol. Sin. 2024, 44, 2786–2799. [Google Scholar] [CrossRef]
  26. Bi, D.; Dix, M.; Marsland, S.; O’farrell, S.; Sullivan, A.; Bodman, R.; Law, R.; Harman, I.; Srbinovsky, J.; Rashid, H.A. Configuration and spin-up of ACCESS-CM2, the new generation Australian community climate and earth system simulator coupled model. J. South. Hemisph. Earth Syst. Sci. 2020, 70, 225–251. [Google Scholar] [CrossRef]
  27. Ziehn, T.; Chamberlain, M.A.; Law, R.M.; Lenton, A.; Bodman, R.W.; Dix, M.; Stevens, L.; Wang, Y.-P.; Srbinovsky, J. The Australian earth system model: ACCESS-ESM1. 5. J. South. Hemisph. Earth Syst. Sci. 2020, 70, 193–214. [Google Scholar] [CrossRef]
  28. Wu, T.; Lu, Y.; Fang, Y.; Xin, X.; Li, L.; Li, W.; Jie, W.; Zhang, J.; Liu, Y.; Zhang, L.; et al. The Beijing climate center climate system model (BCC-CSM): The main progress from CMIP5 to CMIP6. Geosci. Model. Dev. 2019, 12, 1573–1600. [Google Scholar] [CrossRef]
  29. Döscher, R.; Acosta, M.; Alessandri, A.; Anthoni, P.; Arneth, A.; Arsouze, T.; Bergmann, T.; Bernadello, R.; Bousetta, S.; Caron, L.-P. The EC-earth3 Earth system model for the climate model intercomparison project 6. Geosci. Model. Dev. Discuss. 2021, 2021, 1–90. [Google Scholar]
  30. Dunne, J.P.; Horowitz, L.; Adcroft, A.; Ginoux, P.; Held, I.; John, J.; Krasting, J.P.; Malyshev, S.; Naik, V.; Paulot, F.; et al. The GFDL Earth System Model version 4.1 (GFDL-ESM 4.1): Overall coupled model description and simulation characteristics. J. Adv. Model. Earth Syst. 2020, 12, e2019MS002015. [Google Scholar] [CrossRef]
  31. Tatebe, H.; Ogura, T.; Nitta, T.; Komuro, Y.; Ogochi, K.; Takemura, T.; Sudo, K.; Sekiguchi, M.; Abe, M.; Saito, F.; et al. Description and basic evaluation of simulated mean state, internal variability, and climate sensitivity in MIROC6. Geosci. Model. Dev. 2019, 12, 2727–2765. [Google Scholar] [CrossRef]
  32. Müller, W.A.; Jungclaus, J.H.; Mauritsen, T.; Baehr, J.; Bittner, M.; Budich, R.; Bunzel, F.; Esch, M.; Ghosh, R.; Haak, H. A higher-resolution version of the max planck institute earth system model (MPI-ESM1. 2-HR). J. Adv. Model. Earth Syst. 2018, 10, 1383–1413. [Google Scholar] [CrossRef]
  33. Mauritsen, T.; Bader, J.; Becker, T.; Behrens, J.; Bittner, M.; Brokopf, R.; Brovkin, V.; Claussen, M.; Crueger, T.; Esch, M. Developments in the MPI-M Earth System Model version 1.2 (MPI-ESM1. 2) and its response to increasing CO2. J. Adv. Model. Earth Syst. 2019, 11, 998–1038. [Google Scholar] [CrossRef]
  34. Donat, M.; Alexander, L.V.; Yang, H.; Durre, I.; Vose, R.; Dunn, R.J.; Willett, K.M.; Aguilar, E.; Brunet, M.; Caesar, J.; et al. Updated analyses of temperature and precipitation extreme indices since the beginning of the twentieth century: The HadEX2 dataset. J. Geophys. Res. Atmos. 2013, 118, 2098–2118. [Google Scholar] [CrossRef]
  35. Zhang, B.; Song, S.; Wang, H.; Guo, T.; Ding, Y. Evaluation of the performance of CMIP6 models in simulating extreme precipitation and its projected changes in global climate regions. Nat. Hazards 2025, 121, 1737–1763. [Google Scholar] [CrossRef]
  36. Krige, D.G. A Statistical Approach to Some Mine Valuation and Allied Problems on the Witwatersrand. J. Chem. Metall. Min. Soc. S. Afr. 1951, 5, 6. [Google Scholar]
  37. Chen, D.L.; Ou, T.H.; Gong, L.B.; Xu, C.Y.; Li, W.J.; Ho, C.H.; Qian, W.H. Spatial Interpolation of Daily Precipitation in China: 1951–2005. Adv. Atmos. Sci. 2010, 27, 1221–1232. [Google Scholar] [CrossRef]
  38. Ma, Z.; Li, W.; Peng, J. Application of Entropy Weight Theory in Evaluation of Rainstorm Risk. In Proceedings of the 2017 International Conference on Applied Mathematics, Modelling and Statistics Application (AMMSA 2017); Atlantis Press: Dordrecht, The Netherlands, 2017; pp. 286–289. [Google Scholar]
  39. Yao, S.; Zhong, S. Exposure Assessment of Rainstorm Disaster Based on Land Use and Precipitation Extreme: A Case Study of Beijing, China. In Proceedings of the ISCRAM 2015 Conference Proceedings—12th International Conference on Information Systems for Crisis Response and Management, Kristiansand, Norway, 24–27 May 2015. [Google Scholar]
  40. Li, Y.; Zhao, S.-S. Floods losses and hazards in China from 2001 to 2020. Clim. Change Res. 2022, 18, 154–165. [Google Scholar] [CrossRef]
  41. Hu, J.; Dong, S.; Leibin, W.; Li, W.; Li, Q. Impact of Human Activities on Seasonal Changes in Precipitation in China. Clim. Environ. Res. 2024, 29, 643–655. [Google Scholar] [CrossRef]
  42. Dong, T.Y.; Dong, W.J. Evaluation of extreme precipitation over Asia in CMIP6 models. Clim. Dyn. 2021, 57, 1751–1769. [Google Scholar] [CrossRef]
  43. Zhang, T. A rare animal breeding experimental base was established on Daman Island. Chin. J. Wildl. 1985, 2, 49. [Google Scholar] [CrossRef]
  44. Daily, N.M. Jiangmen Taishan Shangchuan Island Suffered Heavy Rainfall and “Flooded Streets”, Residents Said They Have Long been Accustomed to It. Available online: https://static.nfapp.southcn.com/apptpl/videoToShare/index.html?id=3561372#/ (accessed on 26 August 2025).
  45. Zheng, W.; Huang, X.; Xu, B. Analysis on the Characteristics and Impact of Meteorological Disasters in Jiangmen City. Available online: https://kns.cnki.net/kcms2/article/abstract?v=YvzTZTPVeK7a4rPRUgjOGHeDZJsTKysstkeNLrDwRn7Z-J8XfbpnIajmGczLszBCHQ4t6eaebXoOoGP07BflZaS3FVwk55lKPGbjgHyCyRjw2sY-HxRyj6V1injhf4hwmqIWF2PfGPHxr5nm313oEGsFQUIApAZMo5_FvjYwFLOSWHsDwF9oRdIo0UVxyp7hnPWeoMb1gNk=&uniplatform=NZKPT&language=CHS (accessed on 26 August 2025).
  46. Yang, X.; Gao, D.; Wang, P. Characteristics of Temperature and Precipitation Changes in Wumeng Mountain Natural Reserve in 57 Years. IOP Conf. Ser. Earth Environ. Sci. 2019, 237, 022013. [Google Scholar] [CrossRef]
  47. Wang, P.; Cheng, Q.; Jin, H. Divergent vegetation variation and the response to extreme climate events in the National Nature Reserves in Southwest China, 1961–2019. Ecol. Indic. 2023, 150, 110247. [Google Scholar] [CrossRef]
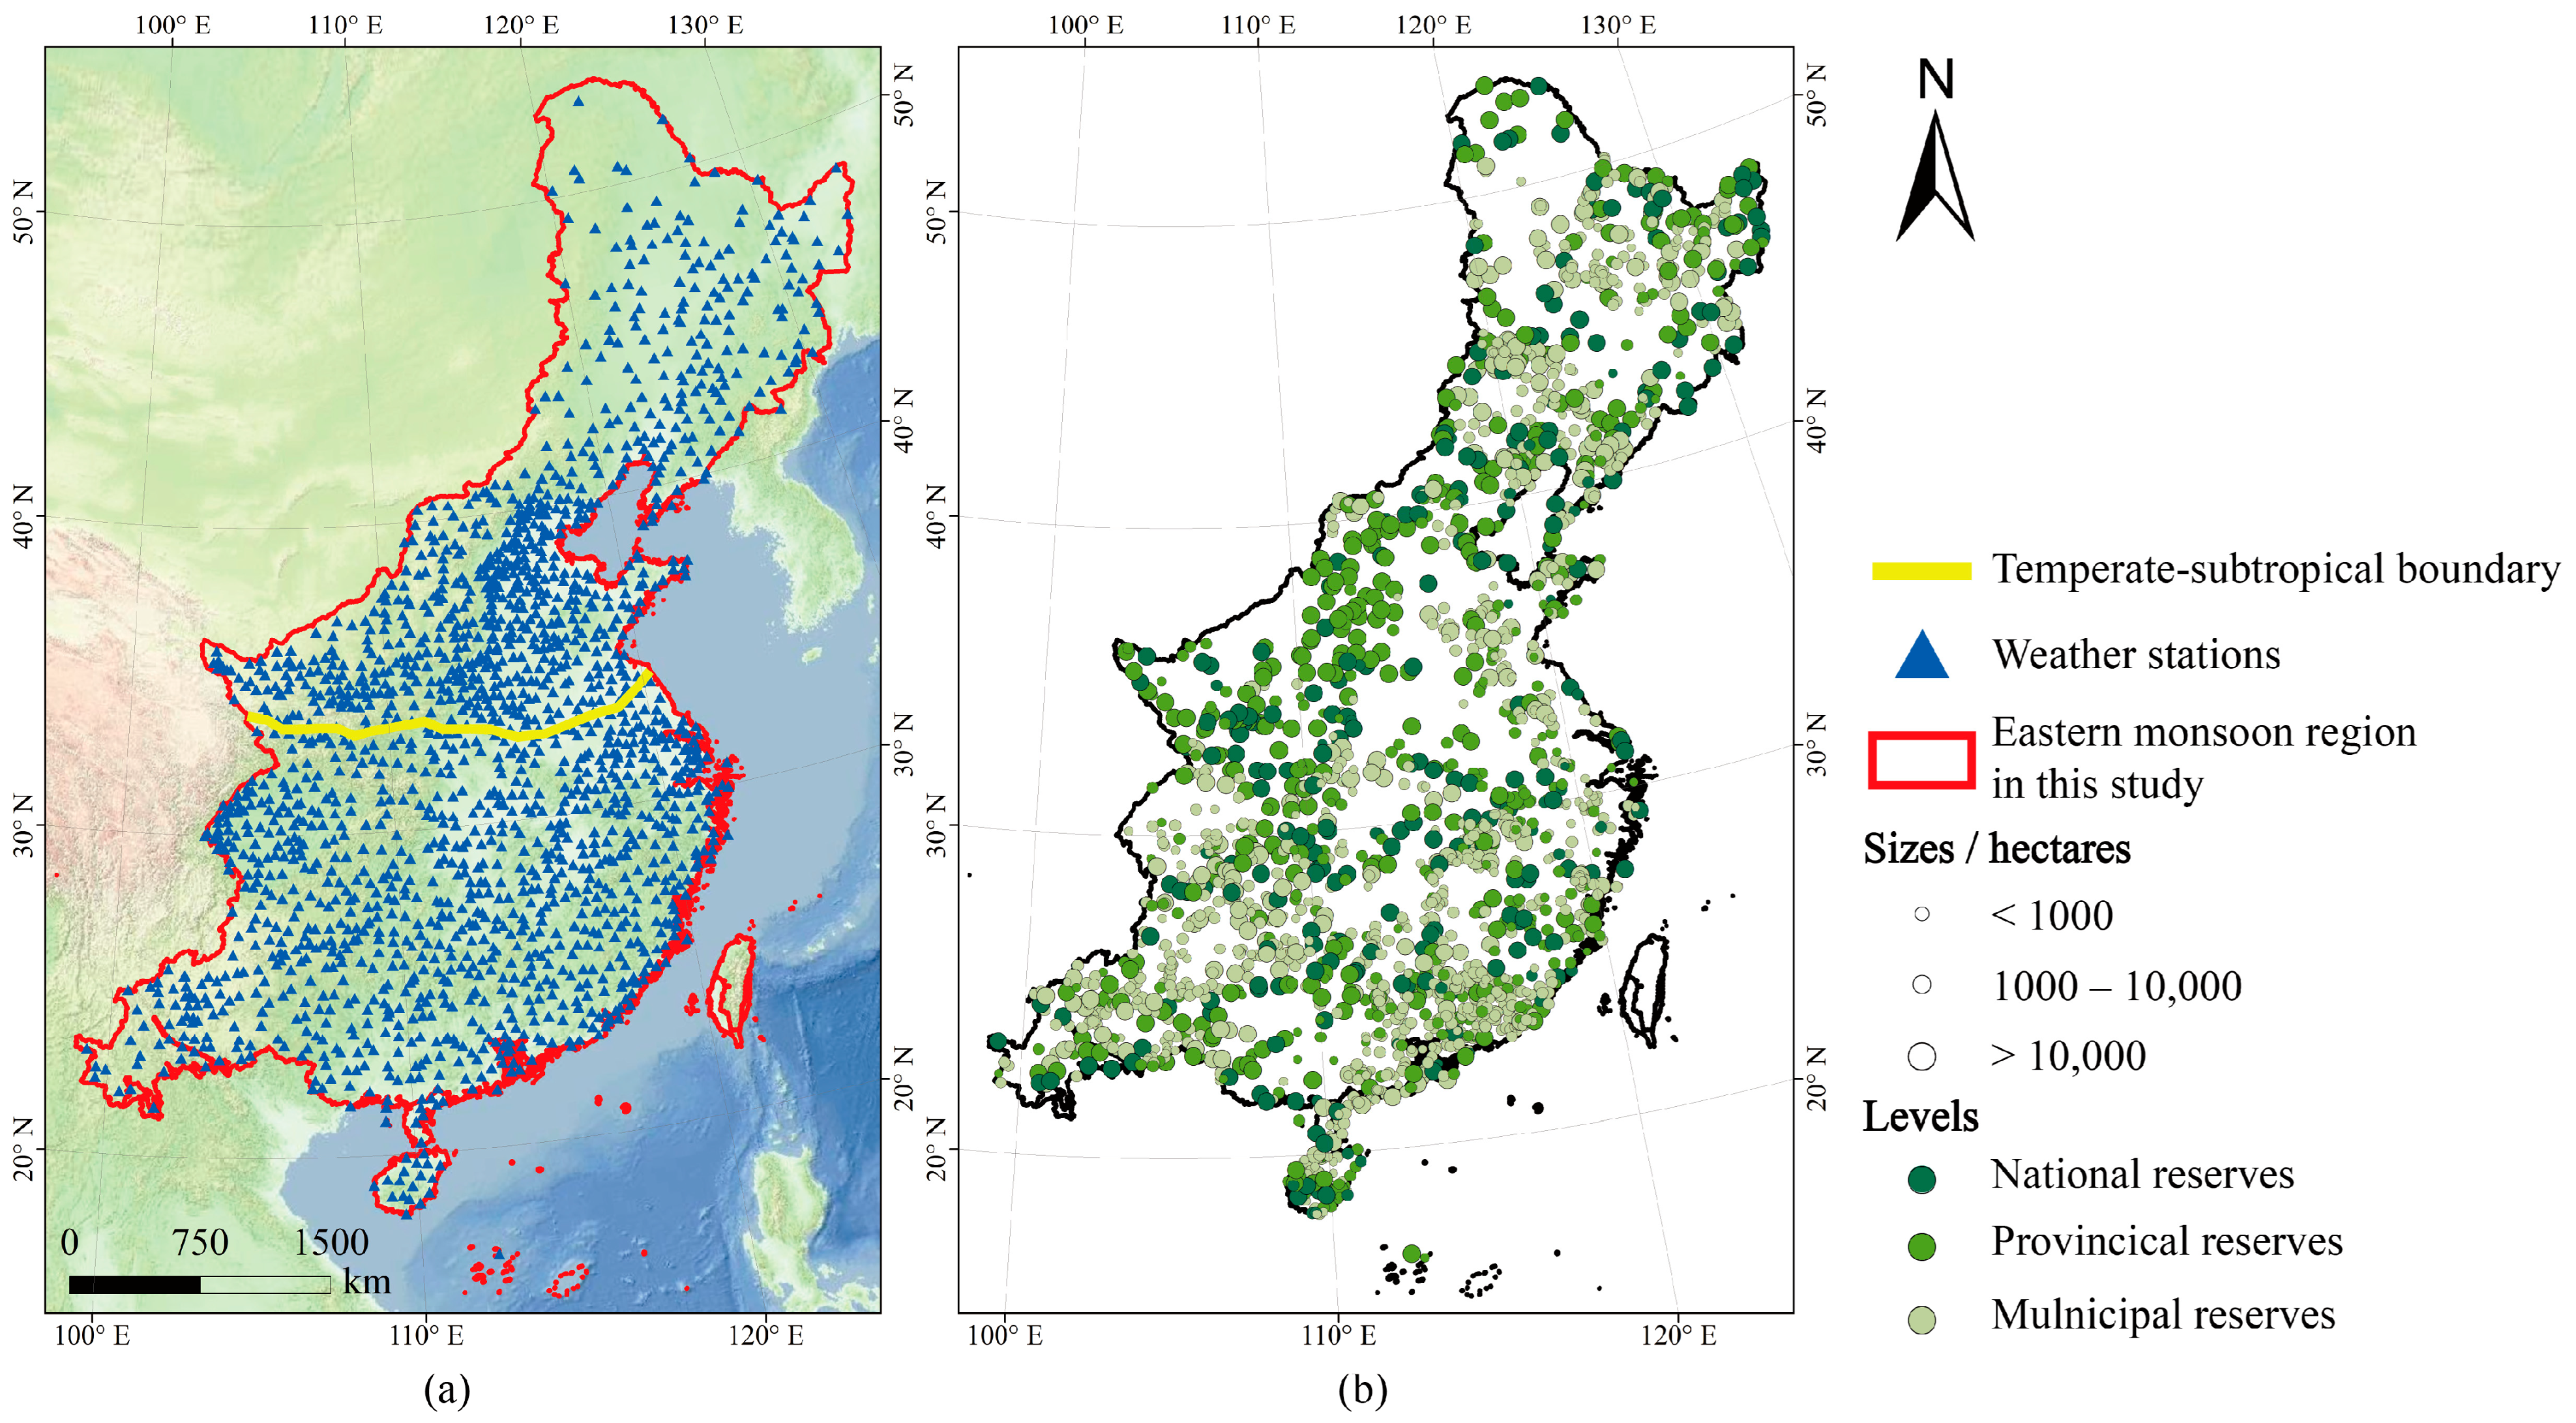
Figure 1. Map (a) shows the boundary of eastern China Monsoon Region and the locations of the meteorology stations, a total of 1703 used in this study; (b) shows the locations, sizes and levels of the natural reserves, a total of 2005 used in this study.
Atmosphere 16 01096 g001
Figure 2. The proportion of annual heavy rainfall frequency to total annual rainfall events (a), spatial distribution of heavy rainfall in annual average frequency (b), and the annual average intensity (c) based on observation data during 1971–2020.
Atmosphere 16 01096 g002
Figure 3. Spatial distribution of heavy rainfall in annual average frequency (a,c), and annual average intensity (b,d) based on CMIP6 simulation data. Spatial distributions presented in (a,b) were calculated at the 20 mm thresholds, while (c,d) represent those at 10 mm.
Atmosphere 16 01096 g003
Figure 4. LOESS regression results of annual variability of rainstorms in ratio (a), frequency (b), and intensity (c) in the eastern monsoon region during 1971–2020. Here, the red line represents the LOESS fitting result for the tropical and subtropical regions, while the blue line indicates the fitting result for the temperate region.
Atmosphere 16 01096 g004
Figure 5. Spatial pattern of heavy rainfall risk in the eastern monsoon region of China in the historical period 1995–2014 (a), near future period 2031–2050 (b), and the far future period 2081–2100 (c).
Atmosphere 16 01096 g005
Figure 6. Exposure risk of heavy rainfall in the eastern monsoon region of China in the historical period 1995–2014 (a), near future period 2031–2050 (b), and the far future period 2081–2100 (c).
Atmosphere 16 01096 g006
Figure 7. Proportion of future exposure risks of natural reserves to rainstorms in the national-level protected areas (a), provincial-level protected areas (b), and municipal-level protected areas (c).
Atmosphere 16 01096 g007
Disclaimer/Publisher’s Note: The statements, opinions and data contained in all publications are solely those of the individual author(s) and contributor(s) and not of MDPI and/or the editor(s). MDPI and/or the editor(s) disclaim responsibility for any injury to people or property resulting from any ideas, methods, instructions or products referred to in the content.