Abstract
Knowledge of dry–wet variations in arid Central Asia (ACA) during the mid-Pliocene warm period (mPWP; ~3.3–3.0 Ma) is instructive to understanding the future variations in this fragile ecosystem region. However, the dry–wet variations in ACA during the mPWP remain controversial. Here, we present high-resolution evaporite mineralogy records from the Gansen (GS) section of the western Qaidam Basin during 3.25–2.95 Ma. Based on the similar periodic variations between the calcite content and χfd/HIRM value-based precipitation records, we infer that the calcite content has the potential to reflect precipitation variations. The results suggest that the calcite content reveals dominant 20 kyr precessional cycles and strong 40 kyr non-obliquity cycles, consistent with the χfd/HIRM values from the GS section, further demonstrating that Qaidam precipitation was affected by the intensified East Asian summer monsoon during the mPWP. However, the occurrence of gypsum beds reveals that the Qaidam Basin still experienced relatively arid climatic conditions despite the increased precipitation during this warm interval. Furthermore, halite and gypsum records suggest that the degree of aridification was relatively moderate during 3.25–3.06 Ma but intensified during 3.06–2.95 Ma. For the intensified aridification, we infer that the further global cooling, which induced a relative decrease in water vapor, played an important role at ~3.06 Ma. Taking the mPWP as the reference, our findings indicate that under continued warming the East Asian summer monsoon will bring abundant water vapor to the inland basin and alleviate aridification in ACA. However, the increased precipitation will have difficulty reversing the aridification trend in the short term. This requires us to evaluate the warming and wetting trend in ACA from a dialectical perspective.
1. Introduction
As one of the most frequent natural disasters globally, drought poses a severe threat to human survival and economic development. It is statistically indicated that among the economic losses caused by various meteorological disasters those induced by drought are the most significant, with direct annual economic loss resulting from drought worldwide reaching as high as USD 8 billion [1]. Moreover, all kinds of climate model simulations and historical observations suggest that global warming caused by human activities may exacerbate the expansion of drylands worldwide, and drylands are projected to cover 50 percent of the Earth’s land surface by the end of this century [2,3,4,5,6,7,8,9,10]. This trend will seriously affect the hydrological cycle, agricultural production, and socio-economic development on a global scale [9,11].
Arid Central Asia (ACA) is the largest arid region in the mid-latitudes of the Northern Hemisphere, encompassing forest steppes, steppes, deserts, and oases, as well as the central sections of the ancient overland Silk Road [12,13,14,15,16,17]. With China’s proposal of the “Silk Road Economic Belt” initiative, ACA has once again become a necessary passage of the overland Silk Road. In recent years, climate model simulations predict that global warming will result in an increase in both precipitation and evaporation, but the increase in precipitation will exceed that in evaporation thus leading to an improvement in the ecological environment in ACA [18,19,20,21]. Conversely, other simulations suggest evaporation will outpace precipitation despite overall increases under continued warming in ACA, thereby causing ecological degradation [5,7,22,23]. Hence, the dry–wet variations in ACA still remain unclear in future warming.
Knowledge on dry–wet variations in ACA during the past warm periods in geological history has major implications for understanding the future variations in this fragile ecosystem region. The mid-Pliocene warm period (mPWP; ~3.3–3.0 Ma) is widely considered an ideal geological analog for predicting future climate variations because of its similar atmospheric carbon dioxide levels (400–450 ppmv), global annual mean surface temperatures, and geographical patterns to those of today [24,25,26,27,28,29,30]. Accordingly, the geologic records from ACA during the mPWP are particularly necessary in order to understand dry–wet variations in ACA under the continued warming. Recently, several geological records from the western Qaidam Basin in ACA suggest that more water vapor would have been brought to this basin by the East Asian summer monsoon (EASM) during the mPWP, thereby improving the hydrological conditions in this region [31,32,33,34]. However, due to the lack of high-resolution evaporation records, it remains uncertain whether increased precipitation exceeded evaporation, thereby resulting in a humid climate in the Qaidam Basin during the mPWP.
To investigate the dry–wet variations in the Qaidam Basin during the mPWP, we present high-resolution evaporite mineralogy records from the Gansen (GS) section in the western Qaidam Basin. These results provide insight into the dry–wet variations in the Qaidam Basin during the mPWP.
2. Geologic Setting
The Qaidam Basin (35.9–39.3° N, 90.3–99.3° E), a typical continental plateau basin on the northeastern Tibetan Plateau, is an important part of ACA (Figure 1). The surrounding Kunlun Mts. to the south, the Altyn Tagh Mts. to the northwest, the Qilian Mts. to the northeast, and the Ela Mts. to the east make the basin form a triangle region [35,36]. Moreover, the triangle region is bounded by Kunlun fault, Altyn fault, and North Qaidam fault [35,36]. The relatively high elevation (2800–3000 m a.s.l.) and peculiar geographical location mean that the basin is under the temperate continental climate, with cold, windy, and dry conditions [37,38,39,40]. From southeast to northwest within the basin the average annual precipitation ranges from 200 to 50 mm, although the southeastern part of the basin is close to the northern boundary of the modern East Asian summer monsoon (Figure 1) [34,40,41,42]. In the western basin, large amounts of evaporites (e.g., halite, gypsum, carbonate) are widely distributed in the playa lakes [37,40].
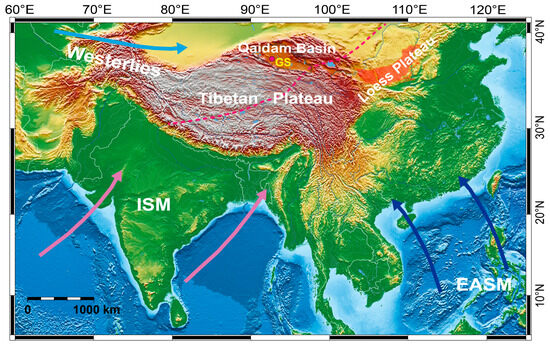
Figure 1.
Location of the study Gansen (GS) site and the modern summer atmospheric circulation pattern of Asia (modified from [34]). The red dashed line is the modern Asian summer monsoon fringe. The bule arrow is the East Asian summer monsoon and the pink arrow is the Indian summer monsoon. EASM: East Asian summer monsoon. ISM: Indian summer monsoon.
In contrast to the playa lakes present on the western side of the Qaidam Basin today, it contained a single massive lake, or a system of large lakes, with active shorelines near the surrounding mountains along the boundaries of the basin during the warm and wet climatic conditions of the early-middle Miocene [40,43]. The shift from greenhouse to icehouse conditions in the late Miocene to early Pliocene resulted in a trend towards more arid conditions, which caused this large lake to slowly dwindle and shift southeast [40,43]. By the late Pliocene, the western Qaidam Basin was host to multiple small playa lakes [43,44]. Most playa lake settings within the northern Qaidam Basin completely dried up in the Holocene [40,43].
3. Materials and Methods
The studied GS section is a composite depositional sequence, where the lower and upper segments overlap within the depth range of 201 m and 226 m. In this section, the effective sampling distance is 453 m (Figure 2). The lithology of the section consists of massive and laminated siltstone, interbedded with gypsum-rich siltstone and occasional sandstone beds (Figure 2). Gypsum beds occur throughout the sedimentary sequence but their frequency decreases in depth intervals of 117–190 m. Additionally, halite beds are only present within the depth intervals of 0 to 105 m and 262 to 453 m in the sedimentary sequence (Figure 2). The age model of the studied section has been constrained by magnetostratigraphy to ~3.6–1.8 Ma, with seven geomagnetic reversals (C2r.1r, C2r.1n, C2r.2r, C2An.1n, C2An.1r, C2An.2n, and C2An.2r) and four tie points (3.33 Ma, 3.207 Ma, 3.116 Ma, 3.032 Ma, and 2.581 Ma) during the ~3.3–2.5 Ma interval [34]. To reconstruct the dry–wet variations in the Qaidam Basin during the mPWP, the age model we present primarily focuses on the ~3.25–~2.95 Ma interval. The ~3.25–~2.95 Ma interval corresponds to the depth intervals of 117–220 m. The average sampling interval is ~1 m, corresponding to a ~ 3 kyr resolution during this warm interval.
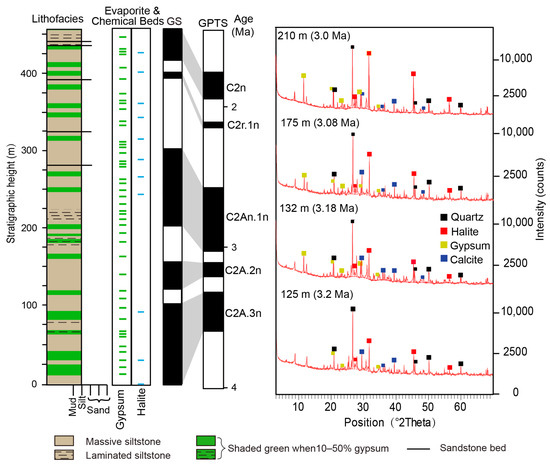
Figure 2.
Lithology, age model, and X-ray diffraction results of representative samples of the GS section.
For evaporite mineral analysis, a total of 95 evaporite samples were ground into fine power and then were sieved through a 200-mesh sieve. After removing coarse particles, these samples were placed on a slide. Finally, 95 samples were examined by an X-ray diffractometer (PANalytical X’Pert Pro MPD diffractometer produced by PANalytical B. V., a company based in Almelo, The Netherlands). The X-ray diffractometer was set with a CuKα and Ni filter at a voltage of 40 kV and an intensity of 40 mA. In addition, diffraction patterns were scanned from 3° to 70° with a step size of 0.016711° and a scanning time of 17 min. When all samples finished the examination, the relative content of evaporite minerals was estimated based on X’Pert HighScore Plus software (Version 3.0.5), which was produced by PANalytical B.V. This experiment was carried out at the Institute of Earth Environment, Chinese Academy of Sciences, Xi’an, China.
4. Results
Analyses of X-ray diffractograms reveal that quartz (SiO2) is the dominant detrital mineral and calcite (CaCO3), gypsum (CaSO4·2H2O), and halite (NaCl) are the main evaporite minerals (right in Figure 2). Figure 3 shows the relative content variations in these evaporite minerals, which were determined by X’Pert HighScore software. The relative content of calcite shows the rhythmic fluctuations, ranging from 15 to 33 wt.%, with an average of 25 wt.%. However, the relative content of halite and gypsum can be divided into two stages (Figure 3). At the first stage, the relative content of halite ranges from 1 to 4 wt.%, with an average 2 wt.%, and the relative content of gypsum ranges from 10 to 20 wt.%, with an average 14 wt.%. At the second stage, the relative content of halite ranges from 1 to 12 wt.%, with an average 6 wt.%, and the relative content of gypsum ranges from 12 to 36 wt.%, with an average 19 wt.%. This pattern suggests that the climatic variations indicated by calcite are different from those of gypsum and halite (Figure 3). Moreover, the variations in the relative content of gypsum are consistent with the occurrence frequency of gypsum beds in lithology, and both exhibit a similar pattern: initial low values followed by a gradual increase (Figure 3). Halite shows relatively low content variations, in accordance with the absence of halite beds in lithology (Figure 2).
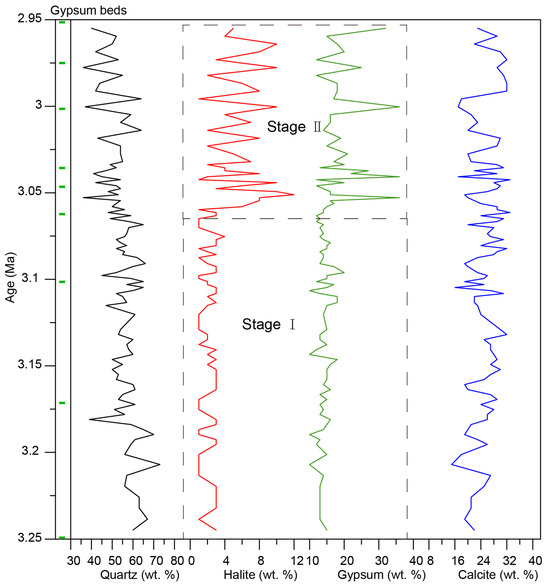
Figure 3.
The relative content of quartz, halite, gypsum, and calcite in the GS section versus age model and gypsum beds.
Due to the rhythmic fluctuations in its relative content, spectral analysis was performed on the calcite. The calcite records show dominant 20 kyr cycles during 3.25–2.95 Ma (Figure 4g). Moreover, a comparison of the calcite data with the June insolation gradient between 30° N and 30° S [45] reveals that high calcite values are observed in nine insolation peak values (Figure 4). This observation is supported by an in-phase relationship between the insolation and the calcite data at the 20 kyr band (Figure 5b), showing that the calcite formation was influenced by insolation at this site. However, six high values of calcite (highlighted by narrow pink bands in Figure 4) do not correspond to high values of insolation but instead correspond to high values of benthic oxygen isotope stack [46]. This observation is supported by the comparison of the 40 kyr band variations (Figure 5c), suggesting that ice sheets also influenced the calcite formation. These periodic variations indicated by the calcite records are consistent with the χfd/HIRM records from the GS section (Figure 4) [34], suggesting that these two proxies may have recorded consistent paleoclimate variations in this site during this warm interval. However, in terms of variation trends, the calcite and χfd/HIRM records are inconsistent (Figure 4).
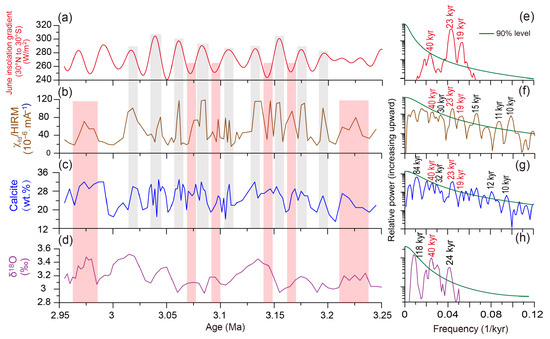
Figure 4.
GS calcite, published χfd/HIRM records, and their comparison with insolation and benthic oxygen isotope stack. (a) June insolation gradient [45]. (b) GS published χfd/HIRM. (c) GS calcite. (d) Benthic δ18O stack [46]. (e–h) Power spectra of (a–d), respectively. The y-axes of the spectral plots are on a log 10 scale.
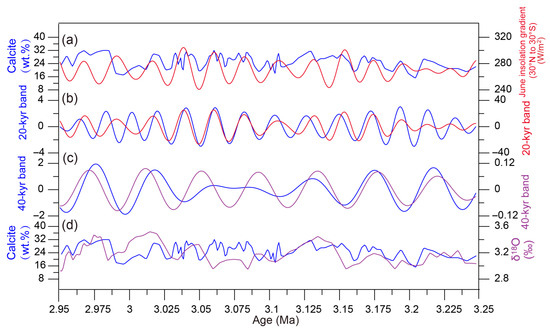
Figure 5.
Comparison of calcite records from the GS section with the June insolation gradient and benthic oxygen isotope stack. (a) Calcite with June insolation gradient [45]. (b) Calcite and June insolation gradient at the filtered 20 kyr band. (c) Calcite and benthic δ18O stack at the filtered 40 kyr band. (d) Calcite with the benthic δ18O stack [46]. The 20 kyr central frequency = 0.05 kyr−1, and the bandwidth = 0.012 kyr−1. The 40 kyr central frequency = 0.024 kyr−1, and the bandwidth = 0.004 kyr−1.
5. Discussion
5.1. Environmental Implications of Evaporite Minerals Records
Evaporite minerals, including calcite (CaCO3), gypsum (CaSO4·2H2O), and halite (NaCl), are common chemical products formed under different degrees of arid climatic conditions [47,48,49]. In arid regions the evaporite minerals will deposit in the closed lake when evaporation exceeds precipitation [50,51,52]. With intensified evaporation or decreased precipitation, a freshwater lake turns into a brackish lake, and carbonate minerals (e.g., calcite) begin to deposit. Further evaporation or reduced precipitation will condense brackish water until it reaches the solubility threshold for sulphates, prompting the deposition of sulphate minerals (e.g., gypsum). Finally, extremely intensified evaporation or severe precipitation decline will further concentrate the saline solution, leading to the deposition of chloride minerals (e.g., halite) [50,51,52]. Thus, the increasing contents of evaporite minerals and their deposition sequence (carbonates–sulphates–chlorites) generally reflect the degree of increasing aridity [47,49,53]. The contents of these evaporite minerals have been widely used as sensitive indicators of various degrees of aridity [47,49,53,54,55]. In the Qaidam Basin, the evaporite mineral records from the SG-1b core, Yahu, and HTG sections suggest that an increasing evaporite mineral content reflects an intensified drying since the late Miocene [49,53,56]. However, several studies focusing on the evaporite minerals reveal that the carbonate minerals are likely to be sensitive to precipitation rather than evaporation. For example, the CaCO3 records from middle Miocene–early Pliocene sedimentary sequence in the western Qaidam Basin suggest that the high values of CaCO3 correspond to more water being supplied by high precipitation [47]. Similarly, late-Miocene CaCO3 records from the Tarim Basin further confirm that the carbonate minerals hold significant potential for reconstructing precipitation variations in an inland basin [55]. Moreover, the mineralogical records from the surface sediments of 86 modern inland lakes in East Asia reveal carbonate minerals deposit with low salinity in relatively wet environment conditions, whereas sulphates and chlorides deposit with high salinity in the arid environment condition [48]. In the GS section, because the χfd/HIRM proxy has been successfully applied in reconstructing precipitation variations in the GS section [34], the consistent periodic variations between calcite and χfd/HIRM records suggest that the calcite content can be used to reflect the precipitation variations. However, the inconsistent variation trends between them (e.g., the χfd/HIRM records show a decrease in precipitation, while the calcite records do not, since ~3.06 Ma) indicate that calcite cannot be used independently as a precipitation proxy and requires supplementation with other precipitation proxies, though it has the potential to reflect precipitation variations.
For the sulphate and chlorite minerals, the similar variation trends between the lithology of the GS section and the gypsum and halite content suggest that these two proxies can be applied when reconstructing the dry–wet variations [37,47,48,49,54].
5.2. The Dry–Wet Variations in the Qaidam Basin During the Mid-Pliocene Warm Period
Recent geological records and climatic simulations from the Qaidam Basin suggest that the EASM intensified and migrated westward into the basin interior during the mPWP, bringing relatively more water vapor to this region [31,33,34]. In the GS section, our calcite records together with the published χfd/HIRM records show that Qaidam precipitation was extremely sensitive to the June insolation gradient and ice sheets during the mPWP, which is consistent with precipitation records from the Chinese Loess Plateau and the South China Sea [57,58,59]. This further demonstrates that the EASM affected precipitation in the Qaidam Basin during the mPWP. However, an increase in water vapor did not lead to the development of a humid climate during this warm period. The occurrence of gypsum beds reveals that the Qaidam Basin was under relatively arid environmental conditions (Figure 2 and Figure 3). This is different from the wet climate on most continents during this warm period [26,60,61,62,63,64]. The reason was likely that the evaporation still exceeded increased precipitation during this warm interval. The evidence from pedogenic carbonate oxygen isotope records on the Chinese Loess Plateau suggests that during the middle Piacenzian warm period precipitation and evaporation both increased, but the increase in precipitation was obviously not significant enough to overcome the increase in evaporation potential associated with warming [65], implying that the climate was likely arid during this warm period. Moreover, the simultaneous increase in precipitation and thick gypsum deposits could also be found in the adjacent sections (e.g., the HTG and SG-1b core) [17,33], suggesting that increasing precipitation could not prevent gypsum deposition in the western Qaidam Basin due to the fact that evaporation remained greater than precipitation during the middle Piacenzian. These findings indicate that under continued warming increased precipitation will alleviate aridification in ACA, but it will not reverse the trend in the short term.
Interestingly, the relative arid climate in the GS section during the mPWP can be divided into two stages. At the first stage (3.25–3.06 Ma), the arid climate was relatively stable, with no significant changes (Figure 3). Moreover, the degree of aridification was relatively moderate (Figure 3). At the second stage (3.06–2.95 Ma), the arid climate intensified, accompanied by significant fluctuations (Figure 3). For the intensified arid climate, we infer that the further global cooling-induced relative weakening of precipitation intensity played an important role at ~3.06 Ma, although the EASM brought abundant water vapor to the inland basin during the mPWP [34]. That is, further global cooling at ~3.06 Ma lowered surface and atmospheric temperatures, causing evaporation rates and the concentration of water vapor in the atmosphere to decrease. This resulted in a relative decrease in the water vapor transported by the EASM to the inland basin. Meanwhile, as the rate of precipitation reduction was greater than the rate of evaporation reduction this imbalance accelerated the intensification of aridification in the basin, which in turn led to the deposition of more evaporite minerals. This inference can be supported by the GS χfd/HIRM and benthic δ18O stack records, which show a relative decrease in precipitation and an expansion of the ice sheets since ~3.06 Ma (Figure 4b,d). Moreover, the pollen and salinity records from the KC-1b core in the Qaidam Basin indicate an intensified dry climate since ~3.1 Ma due to further cooling [66]. However, in comparison with global cooling, there are no obvious geological records to support the premise that the Tibetan Plateau uplift also drove the intensified aridification in the Qaidam Basin at ~3.06 Ma [38,67,68]. Thus, the Tibetan Plateau uplift was excluded as an important factor contributing to the intensified aridification in the Qaidam Basin.
Our evaporite records provide an opportunity to recognize that the aridification of the Qaidam Basin during the mPWP differed between the early and late stages. In the early stage (3.25–3.06 Ma), enhanced precipitation brought by the EASM weakened aridification, resulting in less deposition of evaporite minerals. In the late stage (3.06–2.95 Ma), however, global cooling led to a relative reduction in precipitation intensity, which strengthened aridification and promoted more deposition of evaporite minerals. These results are of great significance for our understanding of mid-Piacenzian climate variations.
6. Conclusions
The analysis of evaporite mineral records from the GS section in the western Qaidam Basin suggests that calcite content has the potential to reflect precipitation variations, and gypsum and halite contents are sensitive to the degree of aridification. During 3.25–2.95 Ma, the dominant 20 kyr precession cycles and strong 40 kyr non-obliquity cycles revealed by the calcite records further demonstrate that Qaidam precipitation was affected by the EASM. However, gypsum and halite records suggest that the Qaidam Basin experienced a relatively arid climate during this warm interval. Moreover, the relatively arid climate can be divided into two stages, stable moderate aridity (3.25–3.06 Ma) and intensified aridity (3.06–2.95 Ma), with the latter linked to global cooling-induced relative weakening of precipitation intensity.
Our results suggest that during the mPWP, the Qaidam Basin was still under the control of an arid climate because the increased precipitation did not exceed the evaporation, which clarifies the contradiction in previous studies regarding the enhanced precipitation and aridification of the Qaidam Basin. Moreover, our study provides the first evidence that the dry–wet variations in the Qaidam Basin can be subdivided into two stages characterized by different aridity intensities through the mPWP, thereby further improving our understanding of climate variations in ACA during this warm period. Using the mPWP as an analog, our findings suggest that increased water vapor brought by the EASM will alleviate aridification in ACA, but it will not reverse the trend in the short term under global warming.
Author Contributions
Conceptualization, S.H. and Z.L.; formal analysis, S.H.; data curation, S.H. and Z.L.; writing—original draft preparation, S.H.; funding acquisition, Z.L.; writing—review and editing, Z.L., R.X., and H.W. All authors have read and agreed to the published version of the manuscript.
Funding
The author(s) declare that financial support was received for the research, authorship, and/or publication of this article. This research was financially supported by the National Natural Science Foundation of China (grants 42302213), the Key Foundation of the Education Department of Hunan Province (21A0424), the Fund of Geography Subject ([2022]351), the Open Foundation of MOE Key Laboratory of Western China’s Environmental System, Lanzhou University, and the Fundamental Research Funds for the Central Universities (lzujbky-2021-kb01).
Institutional Review Board Statement
Not applicable.
Informed Consent Statement
Not applicable.
Data Availability Statement
The original contributions presented in this study are included in the article. Further inquiries can be directed to the corresponding author(s).
Acknowledgments
The authors would like to thank Xiaoli Yu for field assistance.
Conflicts of Interest
The authors declare that the research was conducted in the absence of any commercial or financial relationships that could be construed as a potential conflict of interest.
References
- Qu, Y.P.; Lv, J.; Su, Z.C.; Sun, H.Q.; Ma, M.M. Research review and perspective of drought mitigation. J. Hydraul. Eng. 2018, 49, 115–125. (In Chinese) [Google Scholar]
- Held, I.M.; Soden, B.J. Robust Responses of the Hydrological Cycle to Global Warming. J. Clim. 2006, 19, 5686–5699. [Google Scholar] [CrossRef]
- Seager, R.; Ting, M.; Held, I.; Kushnir, Y.; Lu, J.; Vecchi, G.; Huang, H.P.; Harnik, N.; Leetmaa, A.; Lau, N.C.; et al. Model projections of an imminent transition to a more arid climate in southwestern North America. Science 2007, 316, 1181–1184. [Google Scholar] [CrossRef]
- Zeng, N.; Yoon, J. Expansion of the world’s deserts due to vegetation-albedo feedback under global warming. Geophys. Res. Lett. 2009, 36, L17401. [Google Scholar] [CrossRef]
- Overpeck, J.; Udall, B. Dry Times Ahead. Science 2010, 328, 1642–1643. [Google Scholar] [CrossRef]
- Feng, S.; Fu, Q. Expansion of global drylands under a warming climate. Atmos. Chem. Phys. 2013, 13, 10081–10094. [Google Scholar] [CrossRef]
- Sherwood, S.; Fu, Q. A Drier Future? Science 2014, 343, 737–739. [Google Scholar] [CrossRef]
- Li, Y.; Huang, J.P.; Ji, M.X.; Ran, J.J. Dryland Expansion in Northern China from 1948 to 2008. Adv. Atmos. Sci. 2015, 32, 870–876. [Google Scholar] [CrossRef]
- Huang, J.P.; Yu, H.P.; Guan, X.D.; Wang, G.Y.; Guo, R.X. Accelerated Dryland Expansion under Climate Change. Nat. Clim. Change 2016, 6, 166–171. [Google Scholar] [CrossRef]
- Miao, L.J.; Li, S.Y.; Zhang, F.; Chen, T.X.; Shan, Y.P.; Zhang, Y.S. Future drought in the dry lands of Asia under the 1.5 and 2.0 °C warming scenarios. Earths Future 2020, 8, e2019EF001337. [Google Scholar] [CrossRef]
- Li, G.Q.; Chen, F.H.; Xia, D.S.; Yang, H.; Zhang, X.J.; Madsen, D.B.; Oldknow, C.; Wei, H.; Rao, Z.; Qiang, M. A Tianshan Mountains Loess–Paleosol Sequence Indicates Anti-Phase Climatic Variations between Arid Central Asia and East Asia. Earth Planet. Sci. Lett. 2018, 494, 153–163. [Google Scholar] [CrossRef]
- Liu, Y.; Li, L.H.; Chen, X.; Zhang, R.; Yang, J.M. Temporal–Spatial Variations and Influencing Factors of Vegetation Cover in Xinjiang from 1982 to 2013 Based on GIMMS-NDVI3g. Glob. Planet. Change 2018, 169, 145–155. [Google Scholar] [CrossRef]
- Liu, X.K.; Chen, J.H.; Chen, S.Q.; Wang, H.P.; Huang, W.; Feng, S.; Chen, F. Abrupt Climate Change in Arid Central Asia during the Holocene: A Review. Earth Sci. Rev. 2023, 242, 104450. [Google Scholar] [CrossRef]
- Ding, G.Q.; Chen, J.H.; Lei, Y.B.; Lv, F.Y.; Ma, R.; Chen, S.Q.; Ma, S.; Sun, Y.; Li, Y.; Wang, H.; et al. Precipitation variations in arid central Asia over past 2500 years: Possible effects of climate change on development of Silk Road civilization. Glob. Planet. Change 2023, 226, 104142. [Google Scholar] [CrossRef]
- Re, Y.; Yu, H.P.; Liu, C.X.; He, Y.L.; Huang, J.P.; Zhang, L.X.; Hu, H.; Zhang, Q.; Chen, S.; Liu, X.; et al. Attribution of Dry and Wet Climatic Changes over Central Asia. J. Clim. 2022, 35, 1399–1421. [Google Scholar] [CrossRef]
- Su, Q.D.; Nie, J.S. Intensified Central Asian Aridification Accompanied by Strengthened Asian Summer Monsoons at the 400-kyr Band during 4–2 Ma. Palaeogeogr. Palaeoclimatol. Palaeoecol. 2024, 649, 112342. [Google Scholar] [CrossRef]
- Reynolds, J.F.; Smith, D.M.S.; Lambin, E.F.; Turner, B.L.; Mortimore, M.; Batterbury, S.P.J.; Downing, T.E.; Dowlatabadi, H.; Fernández, R.J.; Herrick, J.E.; et al. Global Desertification: Building a Science for dryland Development. Science 2007, 316, 847–851. [Google Scholar] [CrossRef]
- Hu, Z.Y.; Chen, X.; Chen, D.L.; Li, J.F.; Wang, S.; Zhou, Q.M.; Yin, G.; Guo, M. “Dry Gets Drier, Wet Gets Wetter”: A Case Study over the Arid Regions of Central Asia. Int. J. Climatol. 2019, 39, 1072–1091. [Google Scholar] [CrossRef]
- Yao, J.Q.; Chen, Y.N.; Chen, J.; Zhao, Y.; Tuoliewubieke, D.; Li, J.G.; Yang, L.; Mao, W. Intensification of Extreme Precipitation in Arid Central Asia. J. Hydrol. 2021, 598, 125760. [Google Scholar] [CrossRef]
- Tian, J.X.; Zhang, Z.X.; Zhao, T.B.; Tao, H.; Zhu, B. Warmer and Wetter Climate Induced by the Continual Increase in Atmospheric Temperature and Precipitable Water Vapor over the Arid and Semi-Arid Regions of Northwest China. J. Hydrol. Reg. Stud. 2022, 42, 101151. [Google Scholar] [CrossRef]
- Cao, L.L.; Xu, C.C.; Suo, N.J.; Song, L.L.; Lei, X.N. Future Dry–Wet Climatic Characteristics and Drought Trends over Arid Central Asia. Front. Earth Sci. 2023, 11, 1102633. [Google Scholar] [CrossRef]
- Hua, L.J.; Zhao, T.B.; Zhong, L.H. Future Changes in Drought over Central Asia under CMIP6 Forcing Scenarios. J. Hydrol. Reg. Stud. 2022, 43, 101191. [Google Scholar] [CrossRef]
- Yan, X.Y.; Zhang, Q.; Ren, X.Y.; Wang, X.Y.; Yan, X.M.; Li, X.Q.; Wang, L.; Bao, L. Climatic Change Characteristics towards the “Warming–Wetting” Trend in the Pan-Central-Asia Arid Region. Atmosphere 2022, 13, 467. [Google Scholar] [CrossRef]
- Ravelo, A.C.; Andreasen, D.H.; Lyle, M.; Olivarez, L.A.; Wara, M.W. Regional Climate Shifts Caused by Gradual Global Cooling in the Pliocene Epoch. Nature 2004, 429, 263–267. [Google Scholar] [CrossRef]
- Salzmann, U.; Haywood, A.M.; Lunt, D.J. The Past Is a Guide to the Future? Comparing Middle Pliocene Vegetation with Predicted Biome Distributions for the Twenty-First Century. Philos. Trans. R. Soc. A 2009, 367, 189–204. [Google Scholar] [CrossRef]
- Salzmann, U.; Williams, M.; Haywood, A.M.; Johnson, A.L.A.; Kender, S.; Zalasiewicz, J. Climate and Environment of a Pliocene Warm World. Palaeogeogr. Palaeoclimatol. Palaeoecol. 2011, 309, 1–8. [Google Scholar] [CrossRef]
- Haywood, A.M.; Ridgwell, A.; Lunt, D.J.; Hill, D.J.; Pound, M.J.; Dowsett, H.J.; Dolan, A.M.; Francis, J.E.; Williams, M. Are There Pre-Quaternary Geological Analogues for a Future Greenhouse Warming? Philos. Trans. R. Soc. A 2011, 369, 933–956. [Google Scholar] [CrossRef]
- Lunt, D.J.; Haywood, A.M.; Schmidt, G.A.; Salzmann, U.; Dowsett, H.J.; Loptson, C.A. On the Causes of Mid-Pliocene Warmth and Polar Amplification. Earth Planet. Sci. Lett. 2012, 321–322, 128–138. [Google Scholar] [CrossRef]
- Burke, K.D.; Williams, J.W.; Chandler, M.A.; Haywood, A.M.; Lunt, D.J.; Otto-Bliesner, B.L. Pliocene and Eocene Provide Best Analogs for Near-Future Climates. Proc. Natl. Acad. Sci. USA 2018, 115, 13288–13293. [Google Scholar] [CrossRef]
- Liu, C.F.; Zhang, Z.; Li, Y.C.; Wang, Y.; Dong, J.; Chi, Z.Q.; Cao, Y.; Zhang, L. Geochemical Characterization Evidence for the Climate Variability of the Mid-Pliocene Warm Period in the Nihewan Basin, North China. Palaeogeogr. Palaeoclimatol. Palaeoecol. 2023, 625, 111668. [Google Scholar] [CrossRef]
- Huang, X.F.; Jiang, D.B.; Dong, X.X.; Yang, S.L.; Su, B.H.; Li, X.Y.; Tang, Z.; Wang, Y. Northwestward Migration of the Northern Edge of the East Asian Summer Monsoon during the Mid-Pliocene Warm Period: Simulations and Reconstructions. J. Geophys. Res. 2019, 124, 1392–1404. [Google Scholar] [CrossRef]
- Huang, X.F.; Yang, S.L.; Haywood, A.; Jiang, D.B.; Wang, Y.D.; Sun, M.M.; Tang, Z.; Ding, Z. Warming-Induced Northwestward Migration of the Asian Summer Monsoon in the Geological Past: Evidence from Climate Simulations and Geological Reconstructions. J. Geophys. Res. Atmos. 2021, 126, e2021JD035190. [Google Scholar] [CrossRef]
- Schwarz, F.; Salzmann, U.; Koutsodendris, A.; Nie, J.S.; Friedrich, O.; Ni, J.; Garzione, C.; Fang, X.; Wu, F.; Woodward, J.; et al. Controls of Precipitation and Vegetation Variability on the NE Tibetan Plateau during the Late Pliocene Warmth (~3.5–3.0 Ma). Glob. Planet. Change 2022, 208, 103707. [Google Scholar] [CrossRef]
- Luo, Z.; Wang, H.S.; Heermance, R.V.; Nie, J.S.; Yang, J.; Yu, X.L.; Wang, Z.; Zhang, R.; Su, Q. June Insolation Gradient and Ice-Sheet Forcing on Qaidam Precipitation during the Middle Piacenzian Warm Period. Palaeogeogr. Palaeoclimatol. Palaeoecol. 2024, 648, 112277. [Google Scholar] [CrossRef]
- Fang, X.M.; Zhang, W.L.; Meng, Q.Q.; Gao, J.J.; Wang, X.M.; King, J.; Song, C.; Dai, S.; Miao, Y. High-Resolution Magnetostratigraphy of the Neogene Huaitoutala Section in the Eastern Qaidam Basin on the NE Tibetan Plateau, Qinghai Province, China and Its Implication on Tectonic Uplift of the NE Tibetan Plateau. Earth Planet. Sci. Lett. 2007, 258, 293–306. [Google Scholar] [CrossRef]
- Bush, M.A.; Saylor, J.E.; Horton, B.K.; Nie, J.S. Growth of the Qaidam Basin during Cenozoic Exhumation in the Northern Tibetan Plateau: Inferences from Depositional Patterns and Multiproxy Detrital Provenance Signatures. Lithosphere 2016, 8, 58–82. [Google Scholar] [CrossRef]
- Li, M.H.; Fang, X.M.; Yi, C.L.; Gao, S.P.; Zhang, W.L.; Galy, A. Evaporite Minerals and Geochemistry of the Upper 400 m Sediments in a Core from the Western Qaidam Basin, Tibet. Quat. Int. 2010, 218, 176–189. [Google Scholar] [CrossRef]
- Wu, F.L.; Fang, X.M.; Herrmann, M.; Mosbrugger, V.; Miao, Y.F. Extended Drought in the Interior of Central Asia since the Pliocene Reconstructed from Sporopollen Records. Glob. Planet. Change 2011, 76, 16–21. [Google Scholar] [CrossRef]
- Wang, J.Y.; Fang, X.M.; Appel, E.; Song, C.H. Pliocene–Pleistocene Climate Change at the NE Tibetan Plateau Deduced from Lithofacies Variation in the Drill Core SG-1, Western Qaidam Basin, China. J. Sediment. Res. 2012, 82, 933–952. [Google Scholar] [CrossRef]
- Wang, J.Y.; Fang, X.M.; Appel, E.; Zhang, W.L. Magnetostratigraphic and Radiometric Constraints on Salt Formation in the Qaidam Basin, NE Tibetan Plateau. Quat. Sci. Rev. 2013, 78, 53–64. [Google Scholar] [CrossRef]
- Cai, M.T.; Fang, X.M.; Wu, F.L.; Miao, Y.F.; Appel, E. Pliocene–Pleistocene Stepwise Drying of Central Asia: Evidence from Paleomagnetism and Sporopollen Record of the Deep Borehole SG-3 in the Western Qaidam Basin, NE Tibetan Plateau. Glob. Planet. Change 2012, 94–95, 72–81. [Google Scholar] [CrossRef]
- Yang, L.Y.; Zhang, W.L.; Fang, X.M.; Cai, M.T.; Lu, Y. Aridification Recorded by Lithofacies and Grain Size in a Continuous Pliocene–Quaternary Lacustrine Sediment Record in the Western Qaidam Basin, NE Tibetan Plateau. Palaeogeogr. Palaeoclimatol. Palaeoecol. 2020, 556, 109903. [Google Scholar] [CrossRef]
- Kezao, C.; Bowler, J.M. Late Pleistocene Evolution of Salt Lakes in the Qaidam Basin, Qinghai Province, China. Palaeogeogr. Palaeoclimatol. Palaeoecol. 1986, 54, 87–104. [Google Scholar] [CrossRef]
- Heermance, R.V.; Pullen, A.; Kapp, P.; Garzione, C.N.; Bogue, S.; Ding, L.; Song, P. Climatic and Tectonic Controls on Sedimentation and Erosion during the Pliocene–Quaternary in the Qaidam Basin (China). Geol. Soc. Am. Bull. 2013, 125, 833–856. [Google Scholar] [CrossRef]
- Laskar, J.; Robutel, P.; Joutel, F.; Gastineau, M.; Correia, A.C.M.; Levrard, B. A Long-Term Numerical Solution for the Insolation Quantities of the Earth. Astron. Astrophys. 2004, 428, 261–285. [Google Scholar] [CrossRef]
- Lisiecki, L.E.; Raymo, M.E. A Pliocene–Pleistocene Stack of 57 Globally Distributed Benthic δ18O Records. Paleoceanography 2005, 20, PA1003. [Google Scholar] [CrossRef]
- Song, C.H.; Hu, S.H.; Han, W.X.; Zhang, T.; Fang, X.M.; Gao, J.P.; Wu, F. Middle Miocene to Earliest Pliocene Sedimentological and Geochemical Records of Climate Change in the Western Qaidam Basin on the NE Tibetan Plateau. Palaeogeogr. Palaeoclimatol. Palaeoecol. 2013, 395, 67–76. [Google Scholar]
- Gu, N.; Jiang, W.Y.; Wang, L.; Zhang, E.L.; Yang, S.L.; Xiong, S.F. Rainfall Thresholds for the Precipitation of Carbonate and Evaporite Minerals in Modern Lakes in Northern China. Geophys. Res. Lett. 2015, 42, 5895–5901. [Google Scholar] [CrossRef]
- Luo, Z.; Su, Q.D.; Wang, Z.; Heermance, R.V.; Garzione, C.N.; Li, M.; Ren, X.; Song, Y.; Nie, J. Orbital Forcing of Plio–Pleistocene Climate Variation in a Qaidam Basin Lake Based on Paleomagnetic and Evaporite Mineralogic Analysis. Palaeogeogr. Palaeoclimatol. Palaeoecol. 2018, 510, 31–39. [Google Scholar] [CrossRef]
- Eugster, H.P.; Hardie, L.A. Saline Lakes. In Lakes; Lerman, A., Ed.; Springer: New York, NY, USA, 1978; pp. 237–293. [Google Scholar]
- Warren, J.K. Evaporites: Sediments, Resources and Hydrocarbons; Springer: Berlin, Germany, 2006. [Google Scholar]
- Warren, J.K. Evaporites Through Time: Tectonic, Climatic and Eustatic Controls in Marine and Nonmarine Deposits. Earth Sci. Rev. 2010, 98, 217–268. [Google Scholar] [CrossRef]
- Fang, X.M.; Li, M.H.; Wang, Z.R.; Wang, J.Y.; Li, J.; Liu, X.M.; Zan, J. Oscillation of Mineral Compositions in Core SG-1b, Western Qaidam Basin, NE Tibetan Plateau. Sci. Rep. 2016, 6, 32848. [Google Scholar] [CrossRef]
- Nie, J.S.; Garzione, C.N.; Su, Q.D.; Liu, Q.S.; Zhang, R.; Heslop, D.; Necula, C.; Zhang, S.; Song, Y.; Luo, Z. Dominant 100,000-Year Precipitation Cyclicity in a Late Miocene Lake from Northeast Tibet. Sci. Adv. 2017, 3, e1600762. [Google Scholar] [CrossRef]
- Zhang, Z.G.; Han, W.X.; Fang, X.M.; Song, C.H.; Li, X.Y. Late Miocene–Pleistocene Aridification of Asian Inland Revealed by Geochemical Records of Lacustrine–Fan Delta Sediments from the Western Tarim Basin, NW China. Palaeogeogr. Palaeoclimatol. Palaeoecol. 2013, 377, 52–61. [Google Scholar] [CrossRef]
- Fang, X.M.; Wu, F.L.; Han, W.X.; Wang, Y.D.; Zhang, X.Z.; Zhang, W.L. Plio-Pleistocene drying process of Asian inland—Sporopollen and salinity records from Yahu section the central Qaidam Basin. Quat. Sci. 2008, 28, 874–882. (In Chinese) [Google Scholar]
- Wehausen, R.; Brumsack, H.J. Astronomical Forcing of the East Asian Monsoon Mirrored by the Composition of Pliocene South China Sea Sediments. Earth Planet. Sci. Lett. 2002, 201, 621–636. [Google Scholar] [CrossRef]
- Wan, S.M.; Tian, J.; Steinke, S.; Li, A.C.; Li, T.G. Evolution and Variability of the East Asian Summer Monsoon during the Pliocene: Evidence from Clay Mineral Records of the South China Sea. Palaeogeogr. Palaeoclimatol. Palaeoecol. 2010, 293, 237–247. [Google Scholar] [CrossRef]
- Luo, Z.; Nie, J.S.; Moe, A.E.; Heermance, R.V.; Garzione, C.N.; Herbert, T.D.; Wang, Z.; Li, H.; Zhang, R.; Zhao, X.; et al. Joint Insolation and Ice-Sheet/CO2 Forcing on Northern China Precipitation during Pliocene Warmth. Sci. Bull. 2021, 66, 319–322. [Google Scholar] [CrossRef] [PubMed]
- Brigham-Grette, J.; Melles, M.; Minyuk, P.; Andreev, A.; Tarasov, P.; DeConto, R.; Koenig, S.; Nowaczyk, N.; Wennrich, V.; Rosén, P.; et al. Pliocene Warmth, Polar Amplification, and Stepped Pleistocene Cooling Recorded in NE Arctic Russia. Science 2013, 340, 1421–1427. [Google Scholar] [CrossRef]
- Herbert, T.D.; Lawrence, K.T.; Tzanova, A.; Peterson, L.C.; Caballero-Gill, R.; Kelly, C.S. Late Miocene Global Cooling and the Rise of Modern Ecosystems. Nat. Geosci. 2016, 9, 843–847. [Google Scholar] [CrossRef]
- Yang, S.L.; Ding, Z.L.; Feng, S.H.; Jiang, W.Y.; Huang, X.F.; Guo, L.C. A Strengthened East Asian Summer Monsoon during Pliocene Warmth: Evidence from “Red Clay” Sediments at Pianguan, Northern China. J. Asian Earth Sci. 2018, 155, 124–133. [Google Scholar] [CrossRef]
- Vieira, M.; Pound, M.J.; Pereira, D.I. The Late Pliocene Palaeoenvironments and Palaeoclimates of the Western Iberian Atlantic Margin from the Rio Maior Flora. Palaeogeogr. Palaeoclimatol. Palaeoecol. 2018, 495, 245–258. [Google Scholar] [CrossRef]
- Zhou, X.Q.; Liu, C.L. Mid-Piacenzian and Future Changes in South Asian Precipitation under Global Warming. Glob. Planet. Change 2025, 248, 104760. [Google Scholar] [CrossRef]
- Ji, S.C.; Nie, J.S.; Breecker, D.O.; Luo, Z.; Song, Y.G. Intensified Aridity in Northern China during the Middle Piacenzian Warm Period. J. Asian Earth Sci. 2017, 147, 222–225. [Google Scholar] [CrossRef]
- Miao, Y.F.; Fang, X.M.; Wu, F.L.; Cai, M.T.; Song, C.H.; Meng, Q.Q.; Xu, L. Late Cenozoic Continuous Aridification in the Western Qaidam Basin: Evidence from Sporopollen Records. Clim. Past 2013, 9, 1863–1877. [Google Scholar] [CrossRef]
- Li, J.J.; Fang, X.M.; Song, C.H.; Pan, B.T.; Ma, Y.Z.; Yan, M.D. Late Miocene–Quaternary rapid stepwise uplift of the NE Tibetan Plateau and its effects on climatic and environmental changes. Quat. Res. 2014, 81, 400–423. [Google Scholar] [CrossRef]
- Ge, J.Y.; Dai, Y.; Zhang, Z.S.; Zhao, D.A.; Li, Q.; Zhang, Y.; Yi, L.; Wu, H.; Oldfield, F.; Guo, Z. Major changes in East Asian climate in the mid-Pliocene: Triggered by the uplift of the Tibetan Plateau or global cooling? J. Asian Earth Sci. 2013, 69, 48–59. [Google Scholar] [CrossRef]
Disclaimer/Publisher’s Note: The statements, opinions and data contained in all publications are solely those of the individual author(s) and contributor(s) and not of MDPI and/or the editor(s). MDPI and/or the editor(s) disclaim responsibility for any injury to people or property resulting from any ideas, methods, instructions or products referred to in the content. |
© 2025 by the authors. Licensee MDPI, Basel, Switzerland. This article is an open access article distributed under the terms and conditions of the Creative Commons Attribution (CC BY) license (https://creativecommons.org/licenses/by/4.0/).