Selection of a Universal Method for Measuring Nitrogen Oxides in Underground Mines: A Literature Review and SWOT Analysis
Abstract
1. Introduction
2. Methods of Measuerement NOx Concentrations
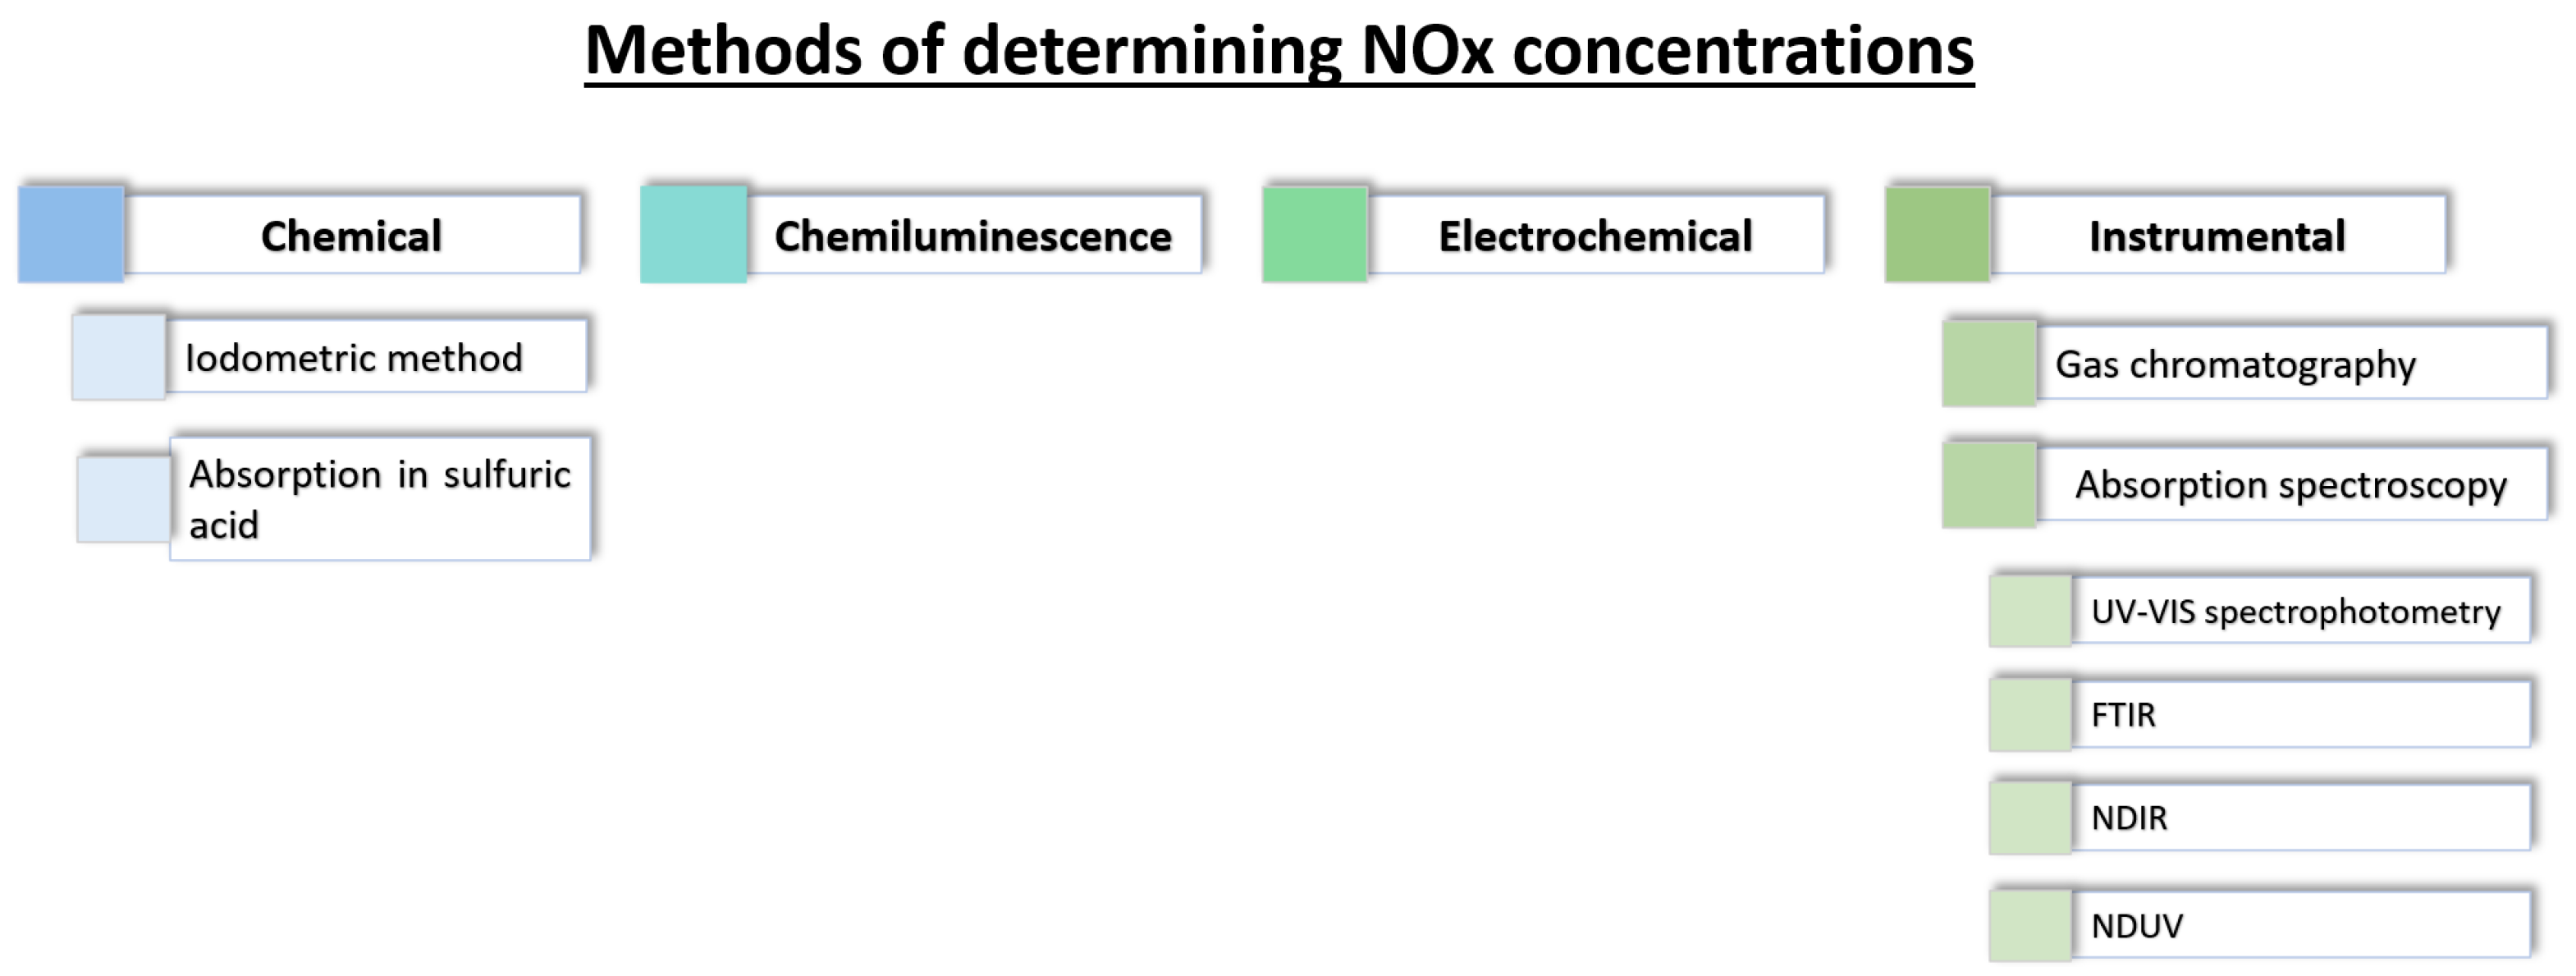
- chemical methods—based on specific chemical reactions of NO and NO2;
- chemiluminescence methods—which utilize the phenomenon of light emission during chemical reactions;
- electrochemical methods—relying on the reaction of the target gas with an electrode;
- instrumental methods—including, among others, chromatography and spectrometry techniques.
2.1. Chemical
2.1.1. Iodometric (Titration) Method
2.1.2. Absorption Method in Sulfuric Acid
2.2. Chemiluminescence
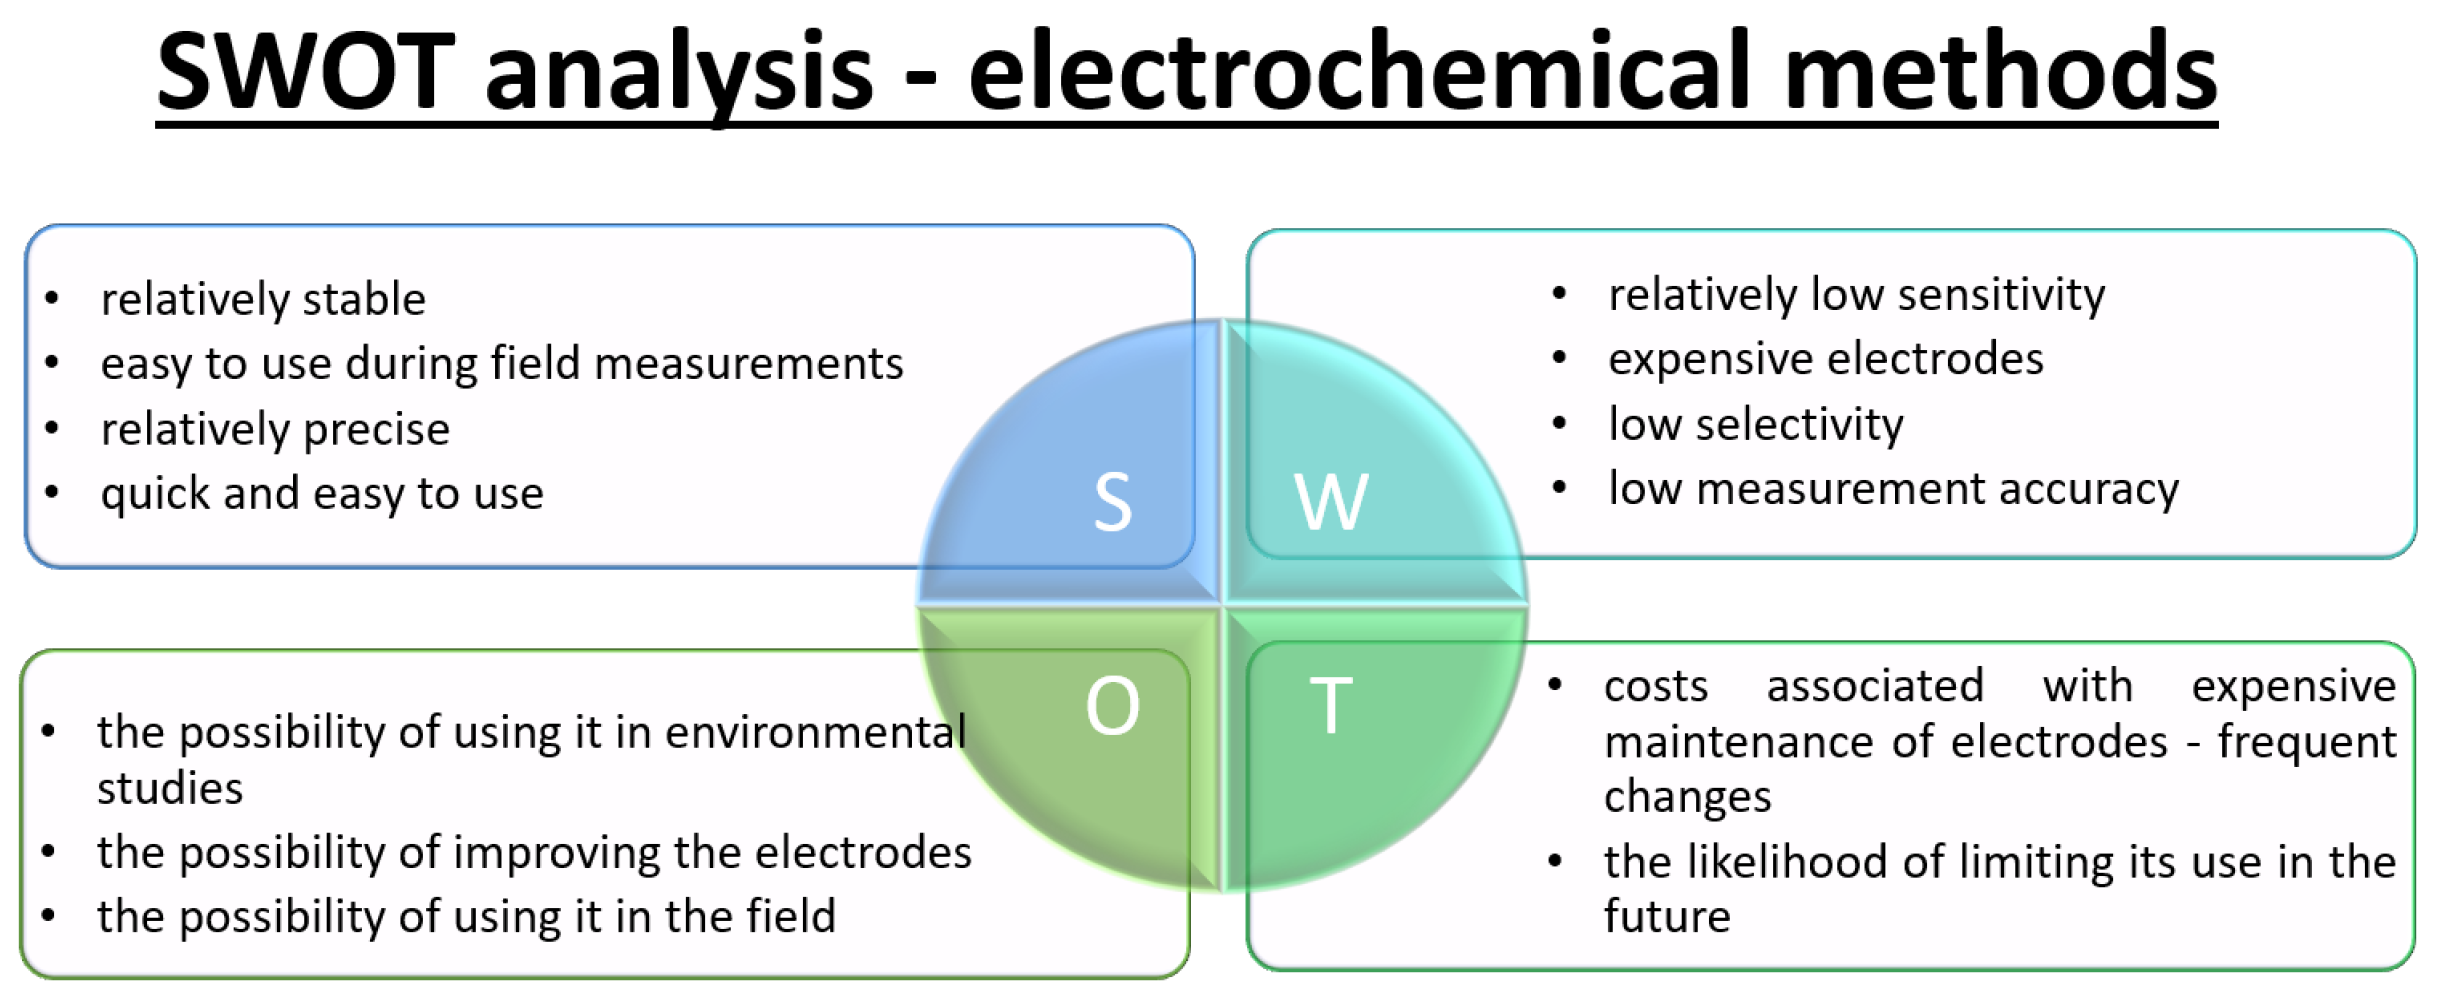
2.3. Electrochemical
2.4. Instrumental Method
2.4.1. Gas Chromatography
2.4.2. Absorption Spectroscopy
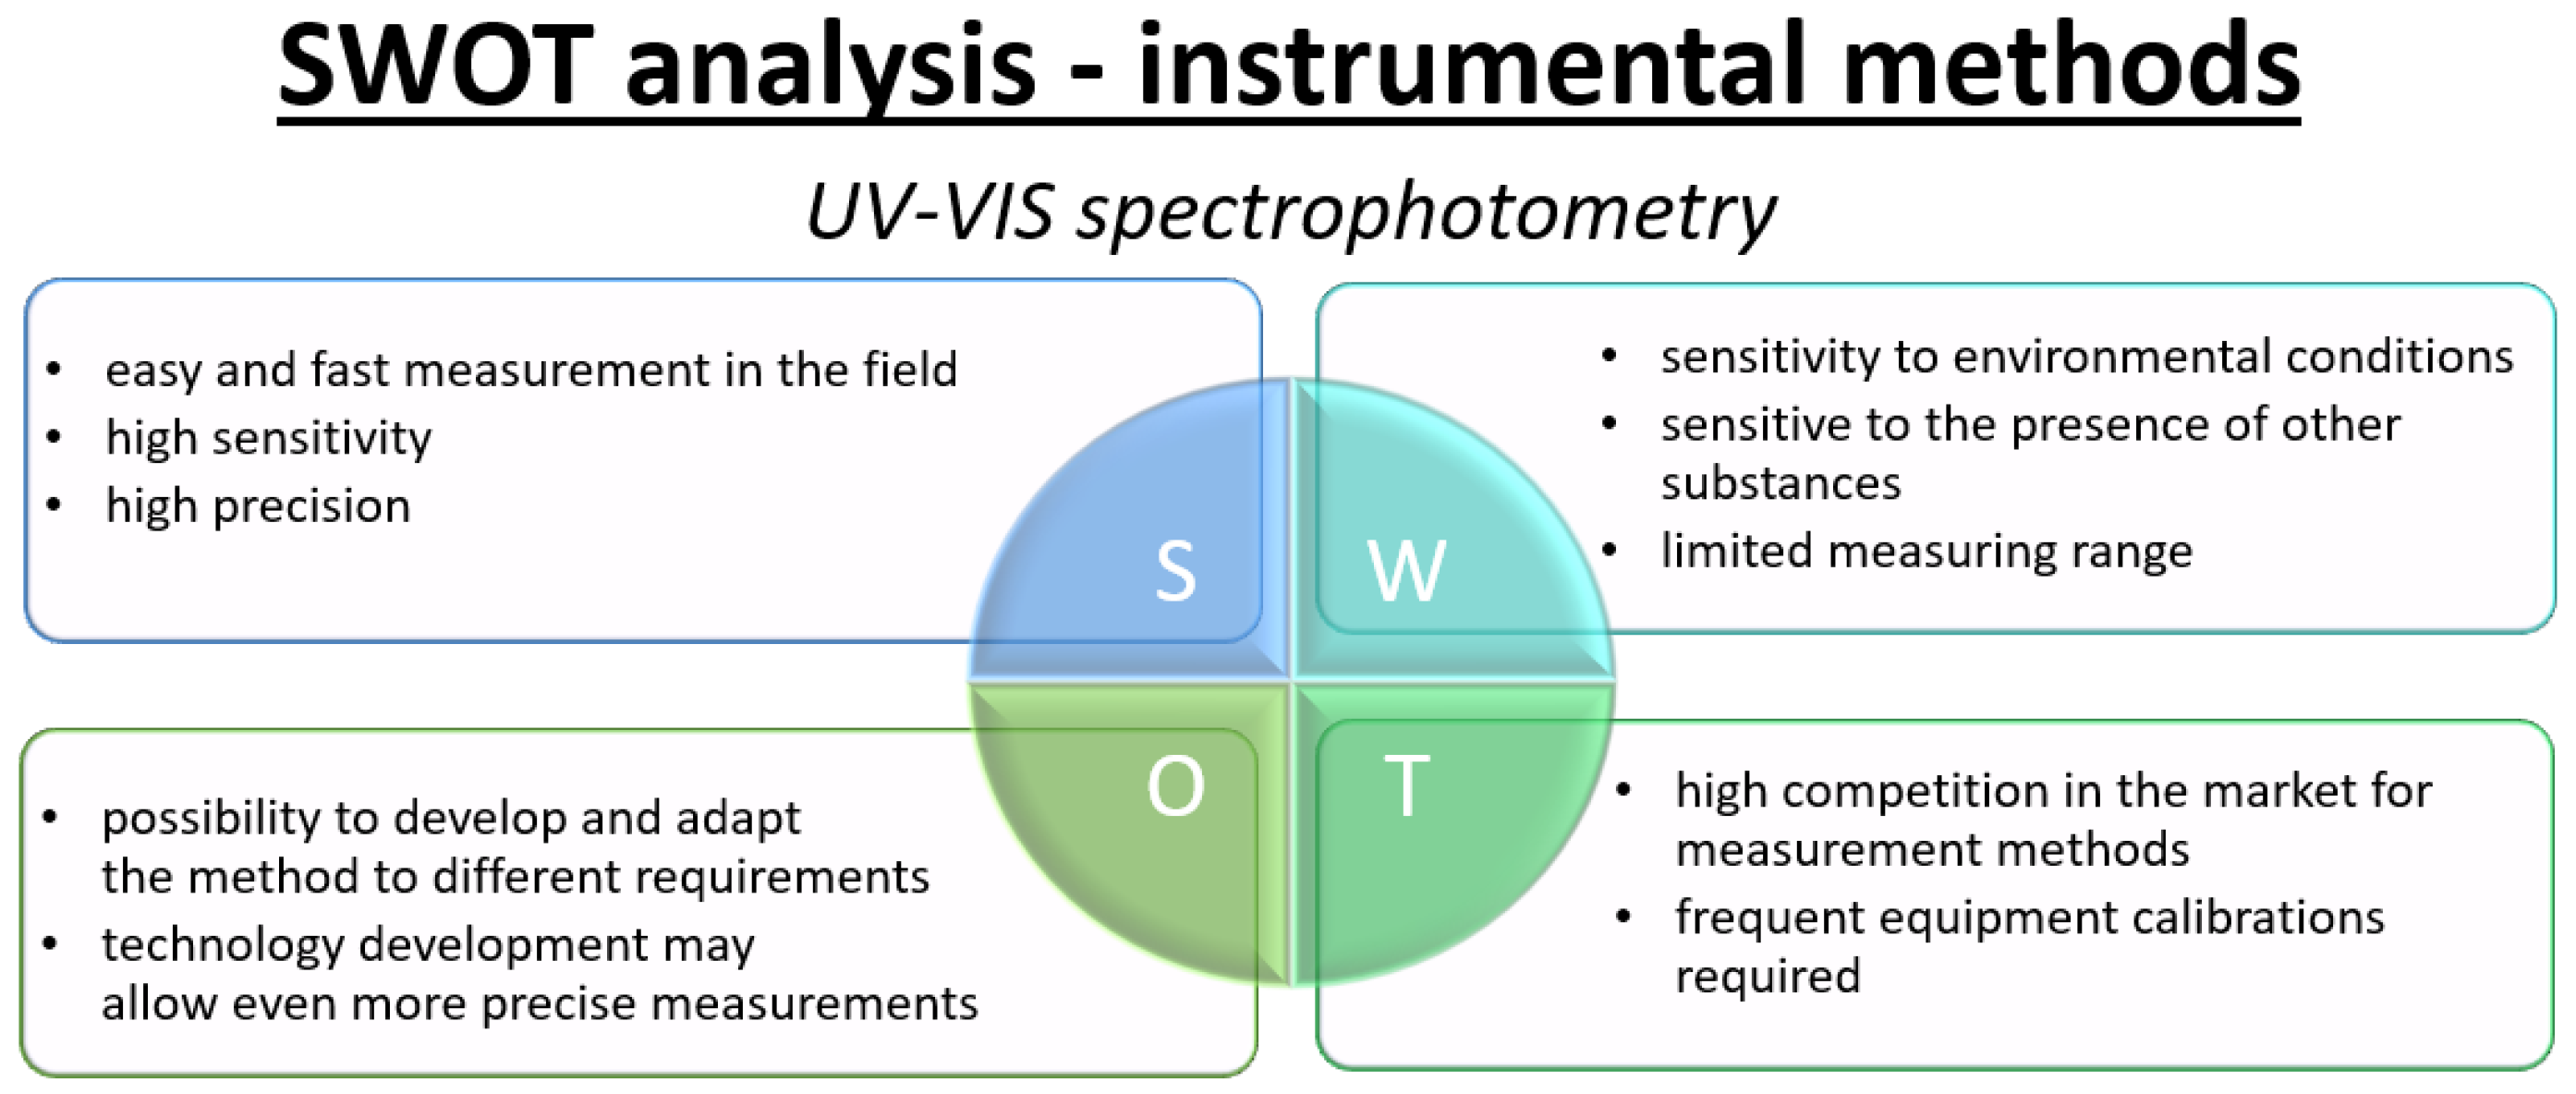
- UV–Vis spectrophotometryUV–Vis spectrophotometry is an analytical technique that utilizes ultraviolet (UV) and visible (VIS) radiation to determine the quantity and identity of substances present in a sample. This method is based on measuring the absorption of light by the analyte across a specific wavelength range [62,96]. The phenomenon of light absorption is described by the Lambert–Beer law, according to which the absorbance of a sample is proportional to the concentration of the absorbing species and the optical path length [97]. A typical UV–Vis spectrophotometer consists of a light source, a monochromator, a sample chamber, and a detector. Light sources may include deuterium, xenon, or LED lamps emitting radiation in the UV–Vis range, while the monochromator allows for the selective choice of a specific wavelength of light that illuminates the sample. The sample chamber usually contains a solution or gas sample, and a detector, such as a photodiode or photomultiplier, records the amount of light absorbed by the sample. The measurement data is presented in the form of an absorption spectrum, which allows the identification and quantification of analytes [62,97]. UV–Vis spectrophotometry is widely used for the determination of NOx, both in the gas phase and in solution. The analysis of NO and NO2 is particularly important for air quality monitoring, as these compounds exhibit characteristic absorption bands in the 200–400 nm range [63,98]. Nitrogen dioxide exhibits an intense absorption maximum around 400 nm, while nitrogen monoxide absorbs in the lower UV range, near 214 nm [63,64].Accurate quantification of NOx using UV–Vis spectrophotometry often requires calibration with standard solutions and selection of appropriate wavelengths, depending on the analyte being measured. The sensitivity of this method allows for the detection of very low NOx concentrations, even at parts per billion (ppb) levels, making it particularly useful in environmental and atmospheric analyses [96]. This technique can be successfully used for direct gas analysis, as well as after preliminary absorption of gases in solution, where the resulting nitrate and nitrite ions can be determined spectrophotometrically after a colorimetric reaction [62,64]. The high sensitivity, repeatability, automation potential, and relatively low operational costs contribute to the widespread use of UV–Vis spectrophotometry as one of the most common analytical methods for NOx determination in air and other environmental matrices [64,96].
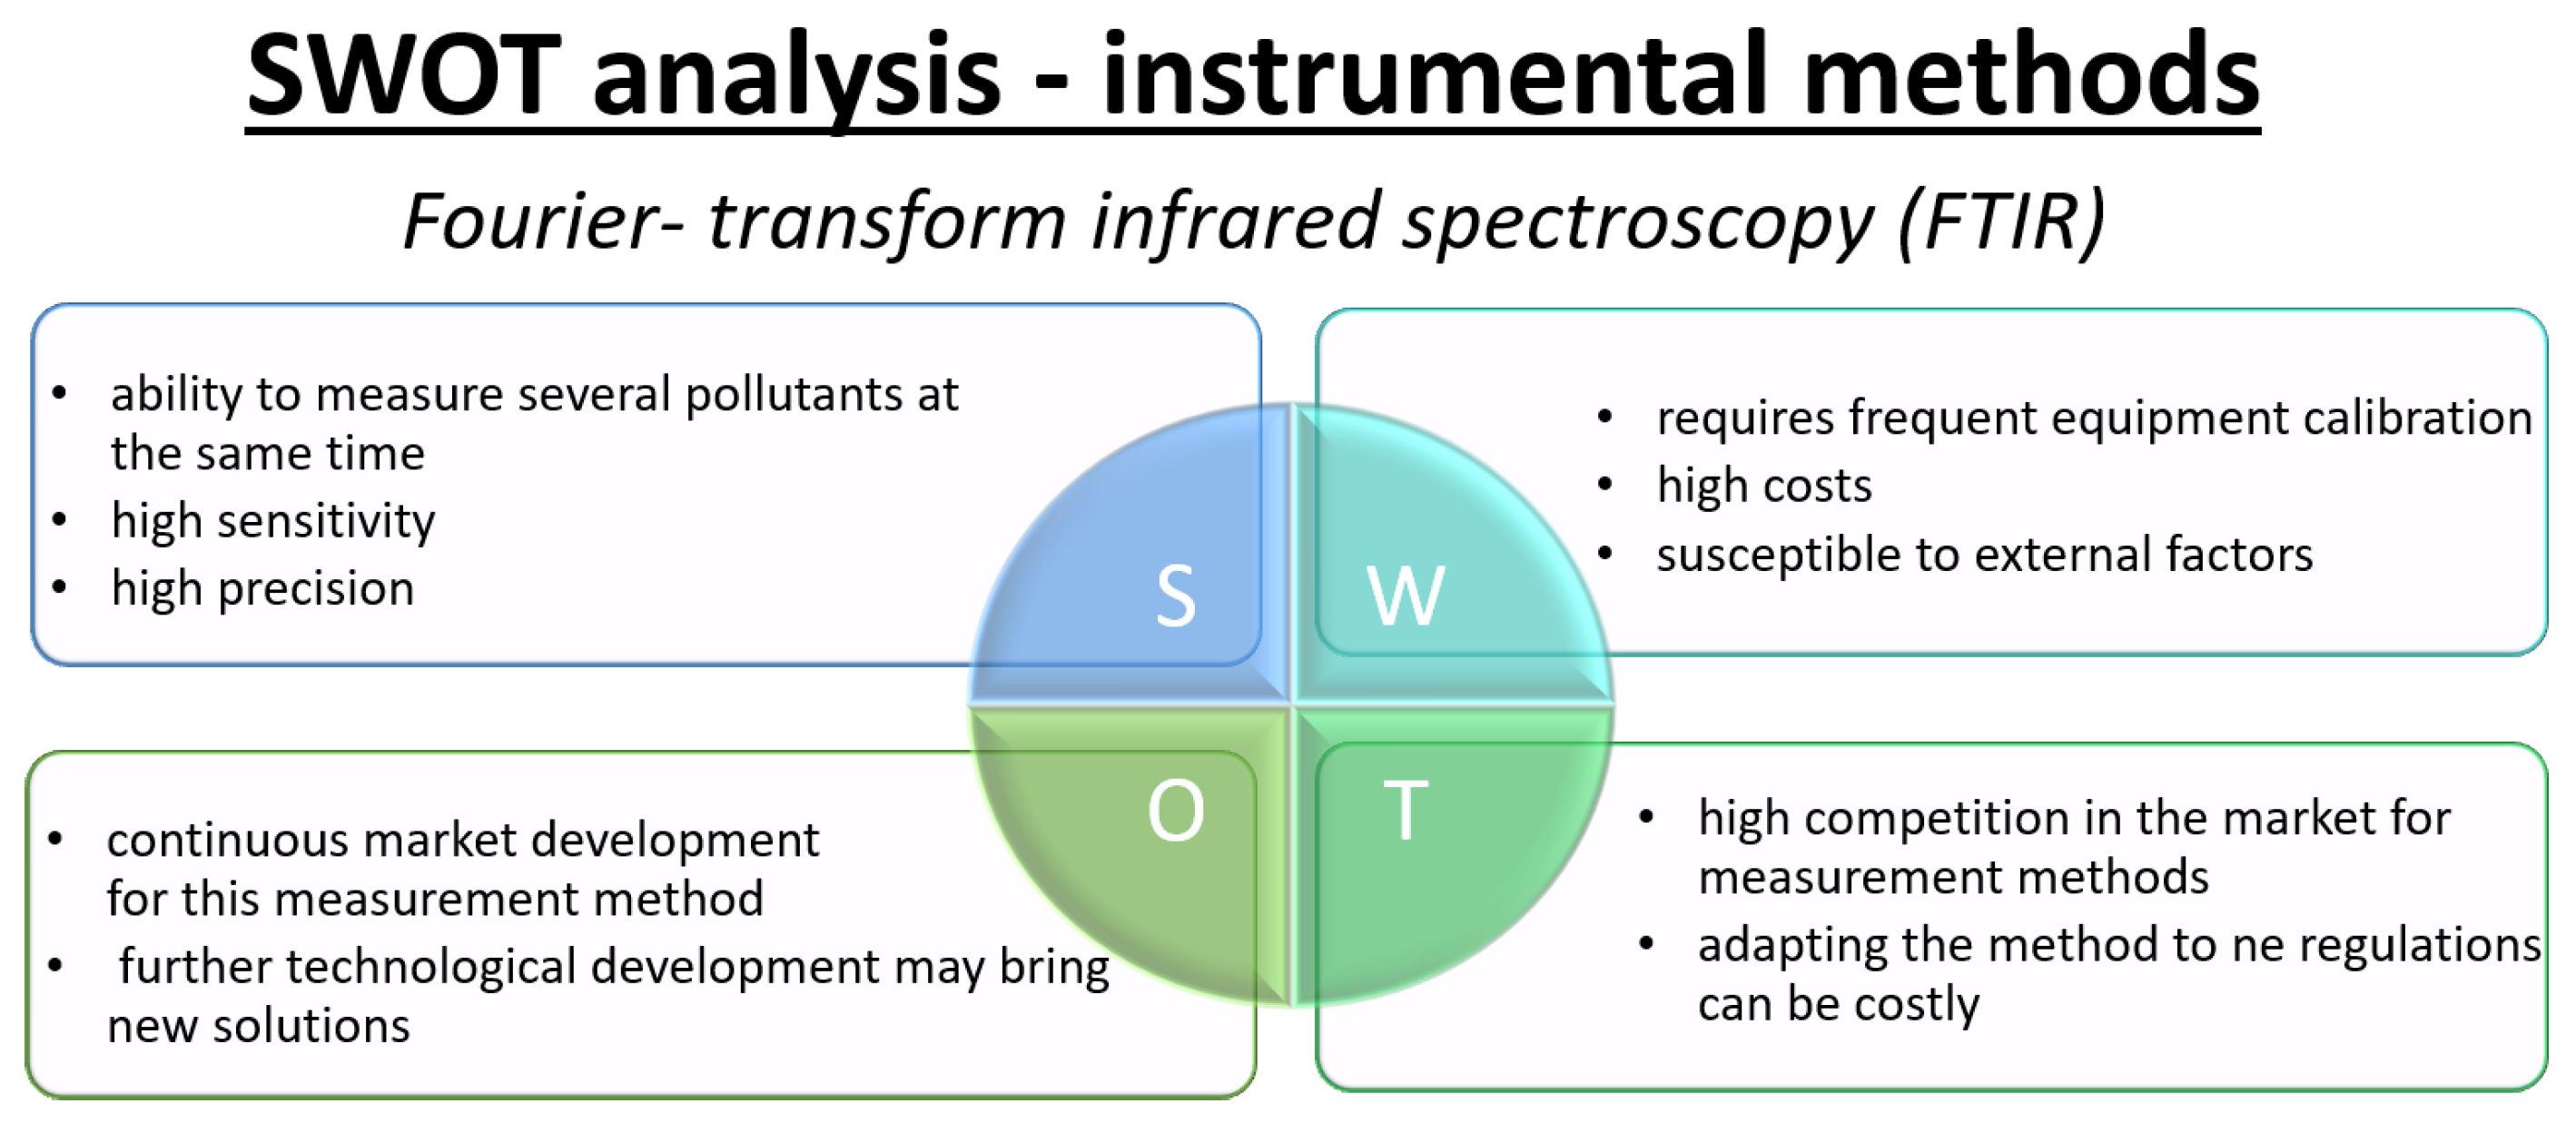
- Fourier transform infrared (FTIR)Fourier transform infrared spectroscopy (FTIR) is a type of infrared absorption spectroscopy that, unlike classical dispersive methods, measures the intensity of light from a broad-spectrum source passing through a scanning interferometer as a function of the optical path difference. Applying a Fourier transform to the recorded interferogram yields a complete absorption spectrum. The development of faster computational speeds and advanced interferometer technology has significantly improved the signal-to-noise ratio and shortened measurement times, leading to FTIR spectroscopy increasingly replacing traditional infrared absorption techniques in laboratories and industrial applications [65]. When measuring NO and NO2, a gas sample is passed through an optical gas cell, where infrared radiation passes through the sample and a portion of it is absorbed by NO and NO2 molecules at characteristic wavelengths. The transmitted light is then analyzed by an FTIR spectrometer, yielding an absorption spectrum unique to the molecular structure of the sampled gases [66]. Specific absorption bands in the infrared region correspond to the fundamental vibrational transitions of NO and NO2, enabling characteristic identification as well as quantification of concentration.Calibration of FTIR analyzers is achieved by analyzing reference gas mixtures of known NO and NO2 concentrations, creating precise relationships between absorption band intensity and analyte concentration. Advanced software solutions facilitate spectral fitting and multicomponent analysis even in complex gas mixtures, providing highly selective and robust results even in the presence of water vapor, CO2, or other common interferences [67].The FTIR method is considered one of the most precise and selective methods for detecting trace amounts of NO and NO2 in atmospheric, flue gas and process gas streams. It is widely used for air quality monitoring, laboratory analysis and emission compliance due to its multi-component capability, fast response and non-destructive nature [65,67]. However, its implementation requires specialized, high-quality instrumentation, careful calibration and operator expertise, resulting in higher operating costs and technical complexity compared to simpler analytical methods [67].
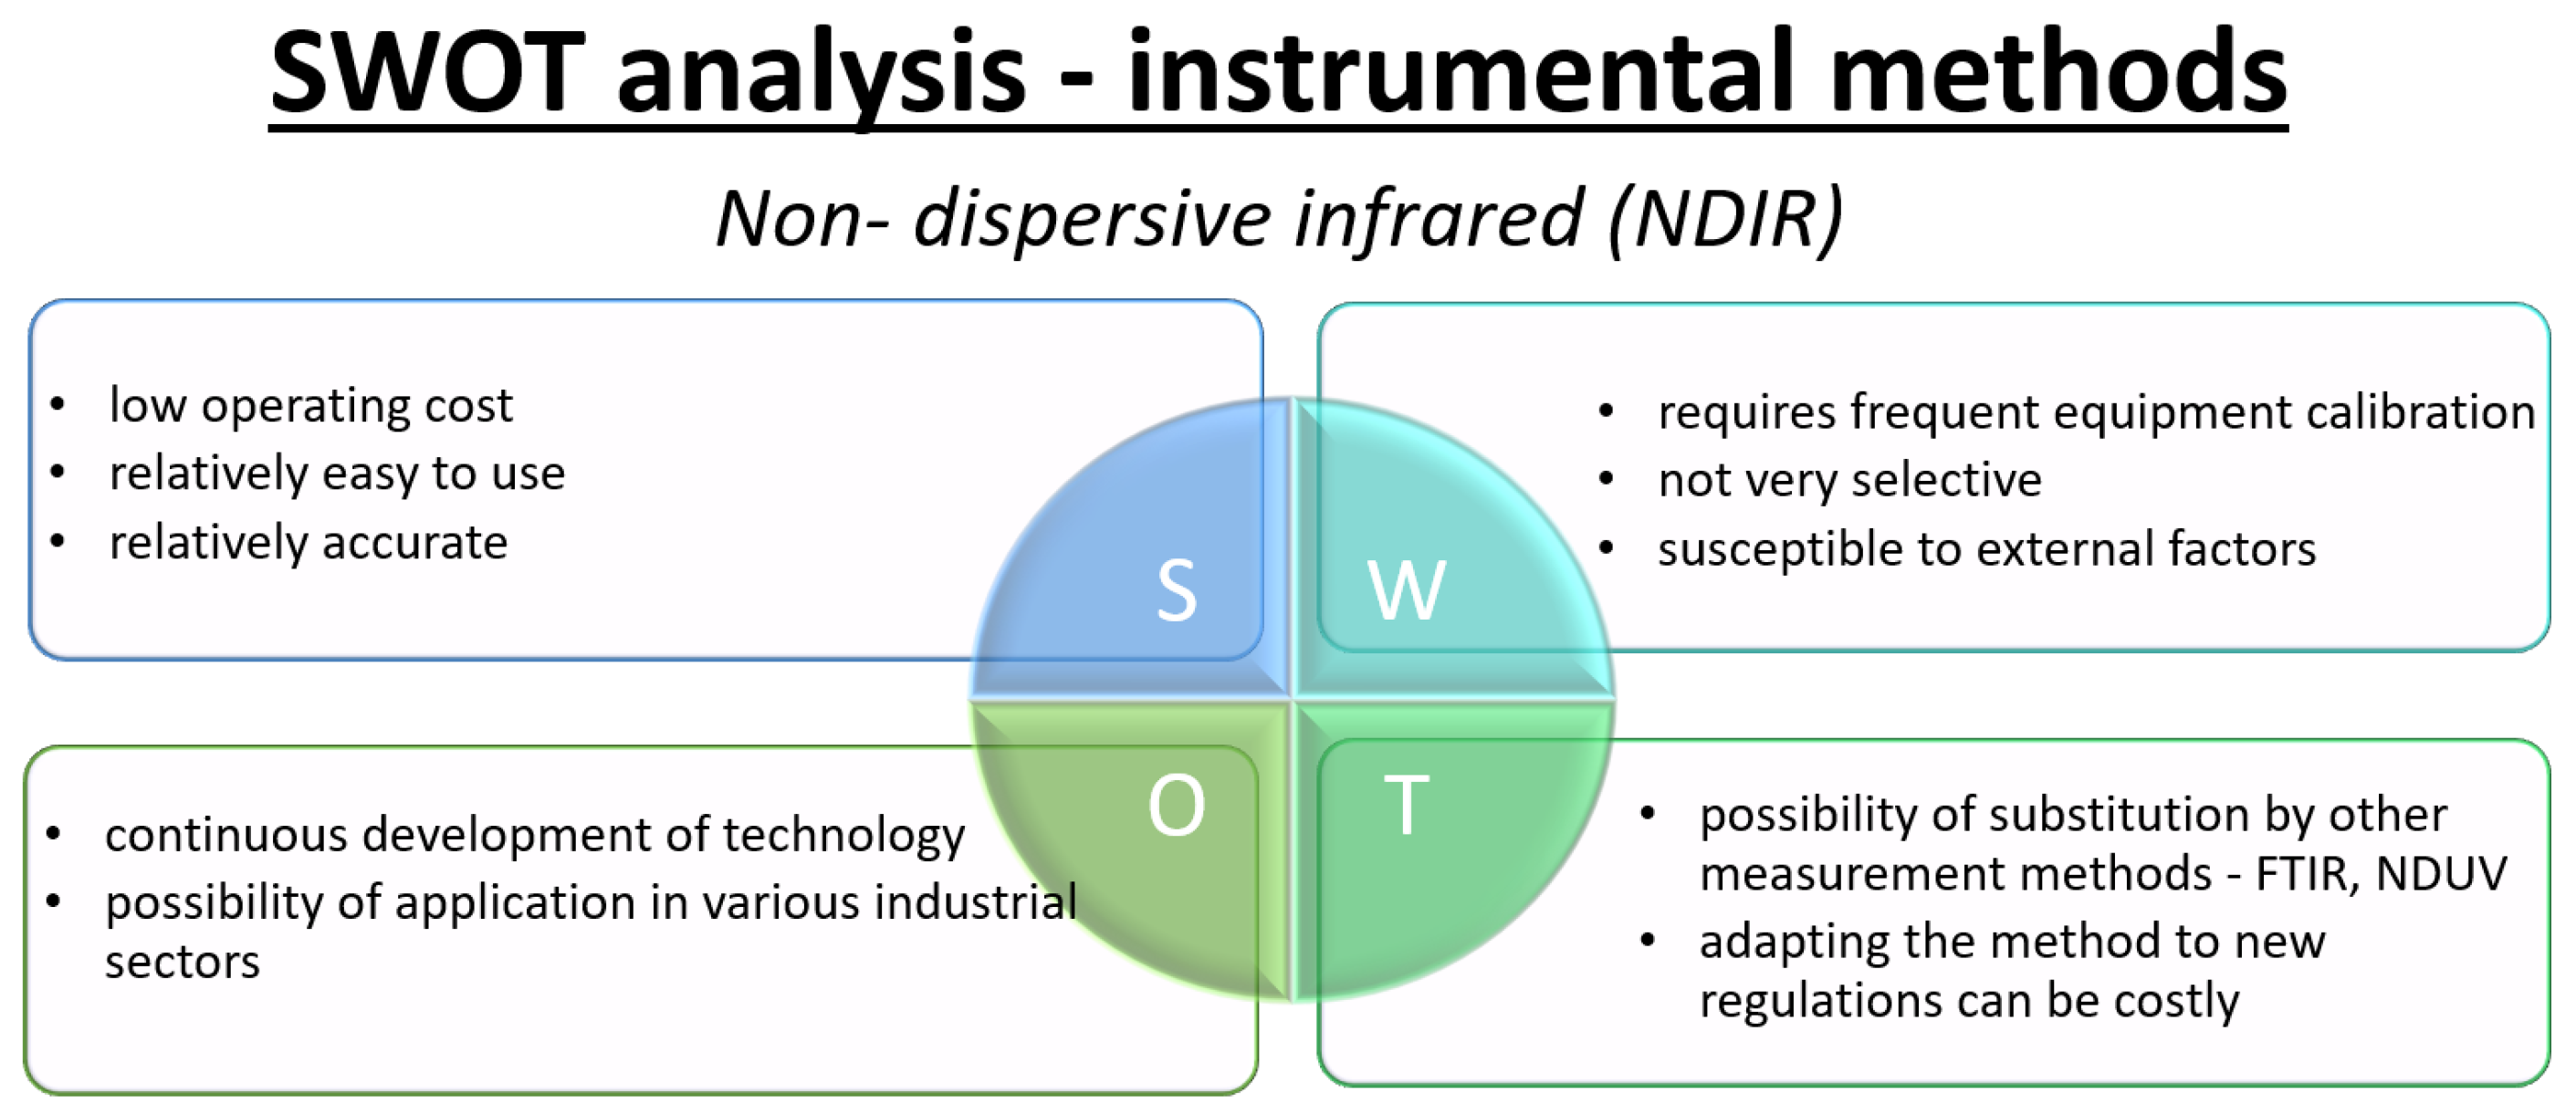
- Non-dispersive infrared (NDIR)The non-dispersive infrared (NDIR) method is one of the most widely used optical techniques for the determination of gaseous nitrogen oxides, relying on the selective absorption of infrared (IR) radiation by gas molecules containing more than two different atoms [68,70]. The spectral characteristics of such gases are due to their permanent or induced dipole moments, which enable them to undergo vibrational or bending transitions upon absorption of IR radiation of the appropriate wavelength, resulting in the absorption of photon energy [70]. As described by Tang et al. [99], a typical NDIR setup involves passing a gas sample through a measurement chamber containing an IR radiation source. An appropriately selected detector and optical filter enable selective measurement of light intensity reduction at a wavelength characteristic of the target gas that is proportional to its concentration. This approach is particularly useful for gases such as CO2, CO, N2O, SO2, NO and NO2 and is used in both laboratory analysis and environmental monitoring [69,70,100].Significant technical advances have been made in NDIR sensors in recent years, including the integration of advanced filters, miniaturization of detectors, and the use of multi-channel detection. These innovations have led to lower detection limits and better compensation of interfering species—such as water vapor or CO2 in exhaust gases—through multiplexing or implementation of advanced signal processing algorithms [69,70,100]. For example, the use of plasmonic metamaterial absorbers or piezoelectric arrays improves the detection and selectivity of many components [100]. For NOx quantification, important challenges include the separation of NO and NO2 signals and potential interference from other gases with overlapping infrared absorption bands. Consequently, the efficiency of calibration, the choice of optical filters, and the development of appropriate signal-processing algorithms are all critical to obtaining accurate results [69,70,101]. The relative simplicity and miniaturization potential of NDIR configurations contribute to the widespread use of these sensors as distributed monitoring systems in industry, meteorology, transportation, and environmental research [69,100]. Review articles indicate that the NDIR technique offers a good compromise among sensitivity, rapid response, and constructional simplicity, remaining one of the most economical and convenient methods for monitoring trace gases such as NOx [69,70]. At the same time, the fast-paced development of new detectors, IR sources, and algorithms for compensation of interfering factors ensures the increasing significance of this method in the coming years [70,100].
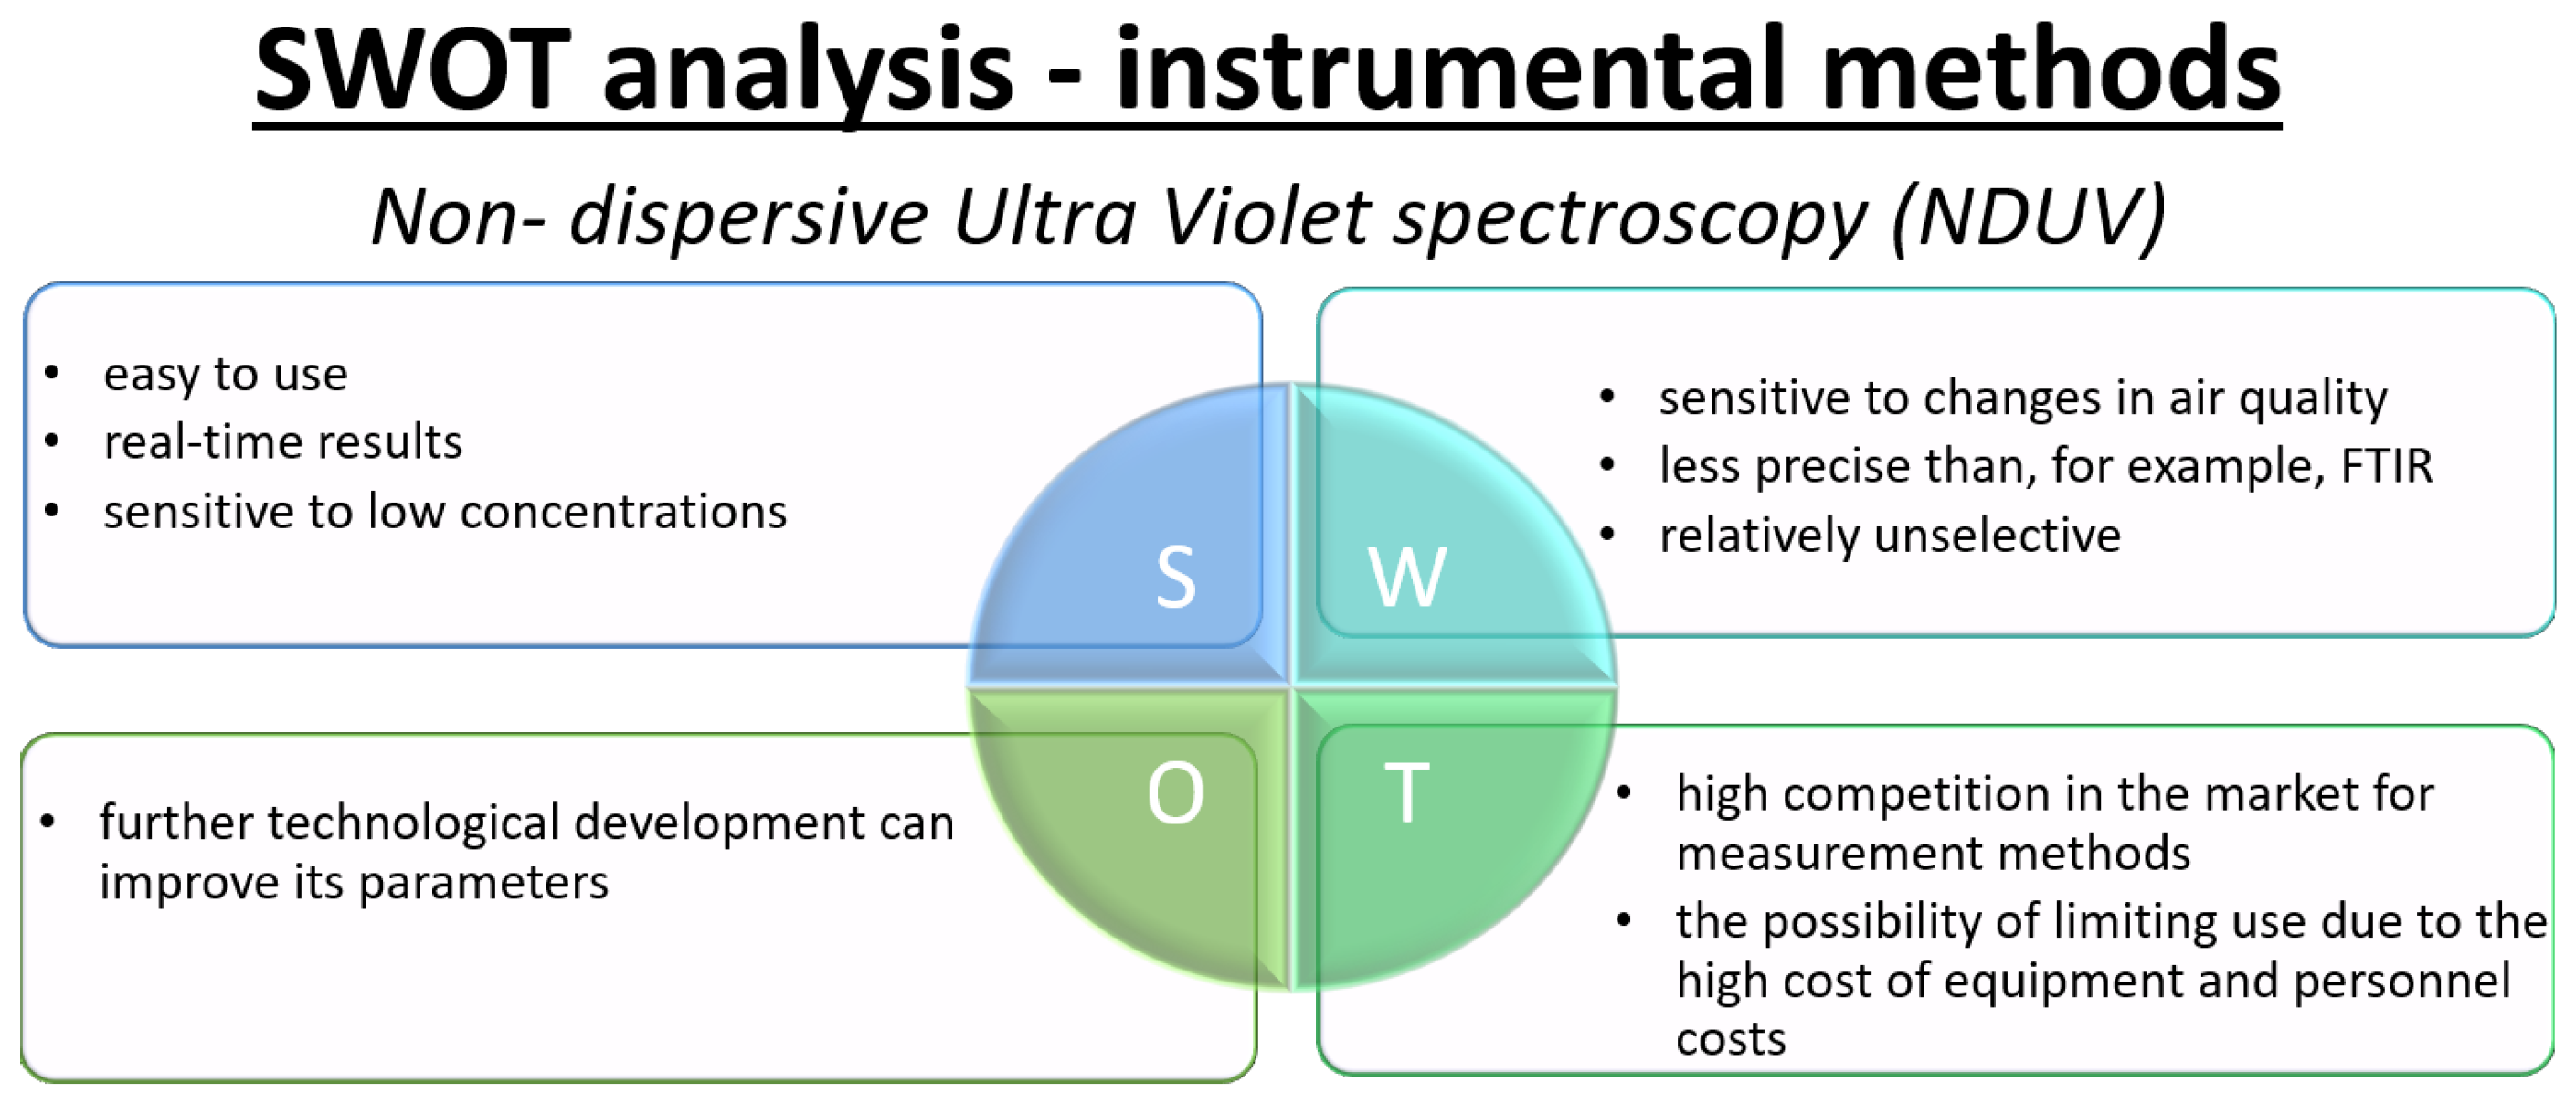
- Non-dispersive ultraviolet (NDUV)The non-dispersive ultraviolet (NDUV) method takes advantage of the fact that various gaseous compounds selectively absorb ultraviolet (UV) light at specific wavelengths. By passing UV light through a gas sample and measuring attenuation at the corresponding wavelengths, individual components can be identified and quantified based on their unique absorption signatures [72]. In NDUV, UV absorption by target gas molecules—such as NO and NO2—is measured over carefully selected wavelength ranges. The gas sample is introduced into a measuring cell, where it is irradiated with ultraviolet light. The absorption profile is determined by comparing the intensity of the light before and after it passes through the gas, allowing both qualitative identification and quantification of NO and NO2 levels.A typical NDUV system uses two detection channels; one measures the absorption of UV light by the gas sample, while the other monitors the absorption by a reference gas, which is a chemically defined composition free of the analyte(s) of interest. Comparing the two signals allows for accurate compensation for baseline shifts, lamp fluctuations, and interference from other absorbing species [102,103]. Using the measured absorption values for both the sample and the reference, along with known absorption coefficients for the target analytes, the concentration of NOx can be calculated according to the Beer–Lambert law. Advanced implementations can utilize multi-wavelength analysis and spectral deconvolution algorithms to further reduce interference and improve selectivity for NO and NO2, even in complex or humid gas mixtures.NDUV analyzers are widely used for online and real-time monitoring of NO and NO2 in emissions (e.g., vehicle exhaust, industrial stacks), ambient air, and process gases because of their high precision, fast response, and low maintenance requirements. Limitations primarily relate to potential spectral overlap with other UV-absorbing compounds and the need for regular calibration, but the development of advanced optics and algorithms has greatly mitigated these challenges [104]. The NDUV method operates on the principle ofEquation (4) shows NO/NO2 generation and photon emission, while Equation (5) shows NO decay. These processes form the basis of detection in the NDUV method.The NDUV method offers many advantages, such as speed of measurement, low equipment cost, and high selectivity of measurements. However, the method is susceptible to the influence of interferences, such as changes in temperature, humidity, or the presence of other gas absorbance in similar wavelength ranges, which can affect measurement results.The NDUV method is widely used in industry, air quality monitoring, and laboratories to measure NO and NO2 concentrations in air and industrial gases.
3. Comparison of Methods
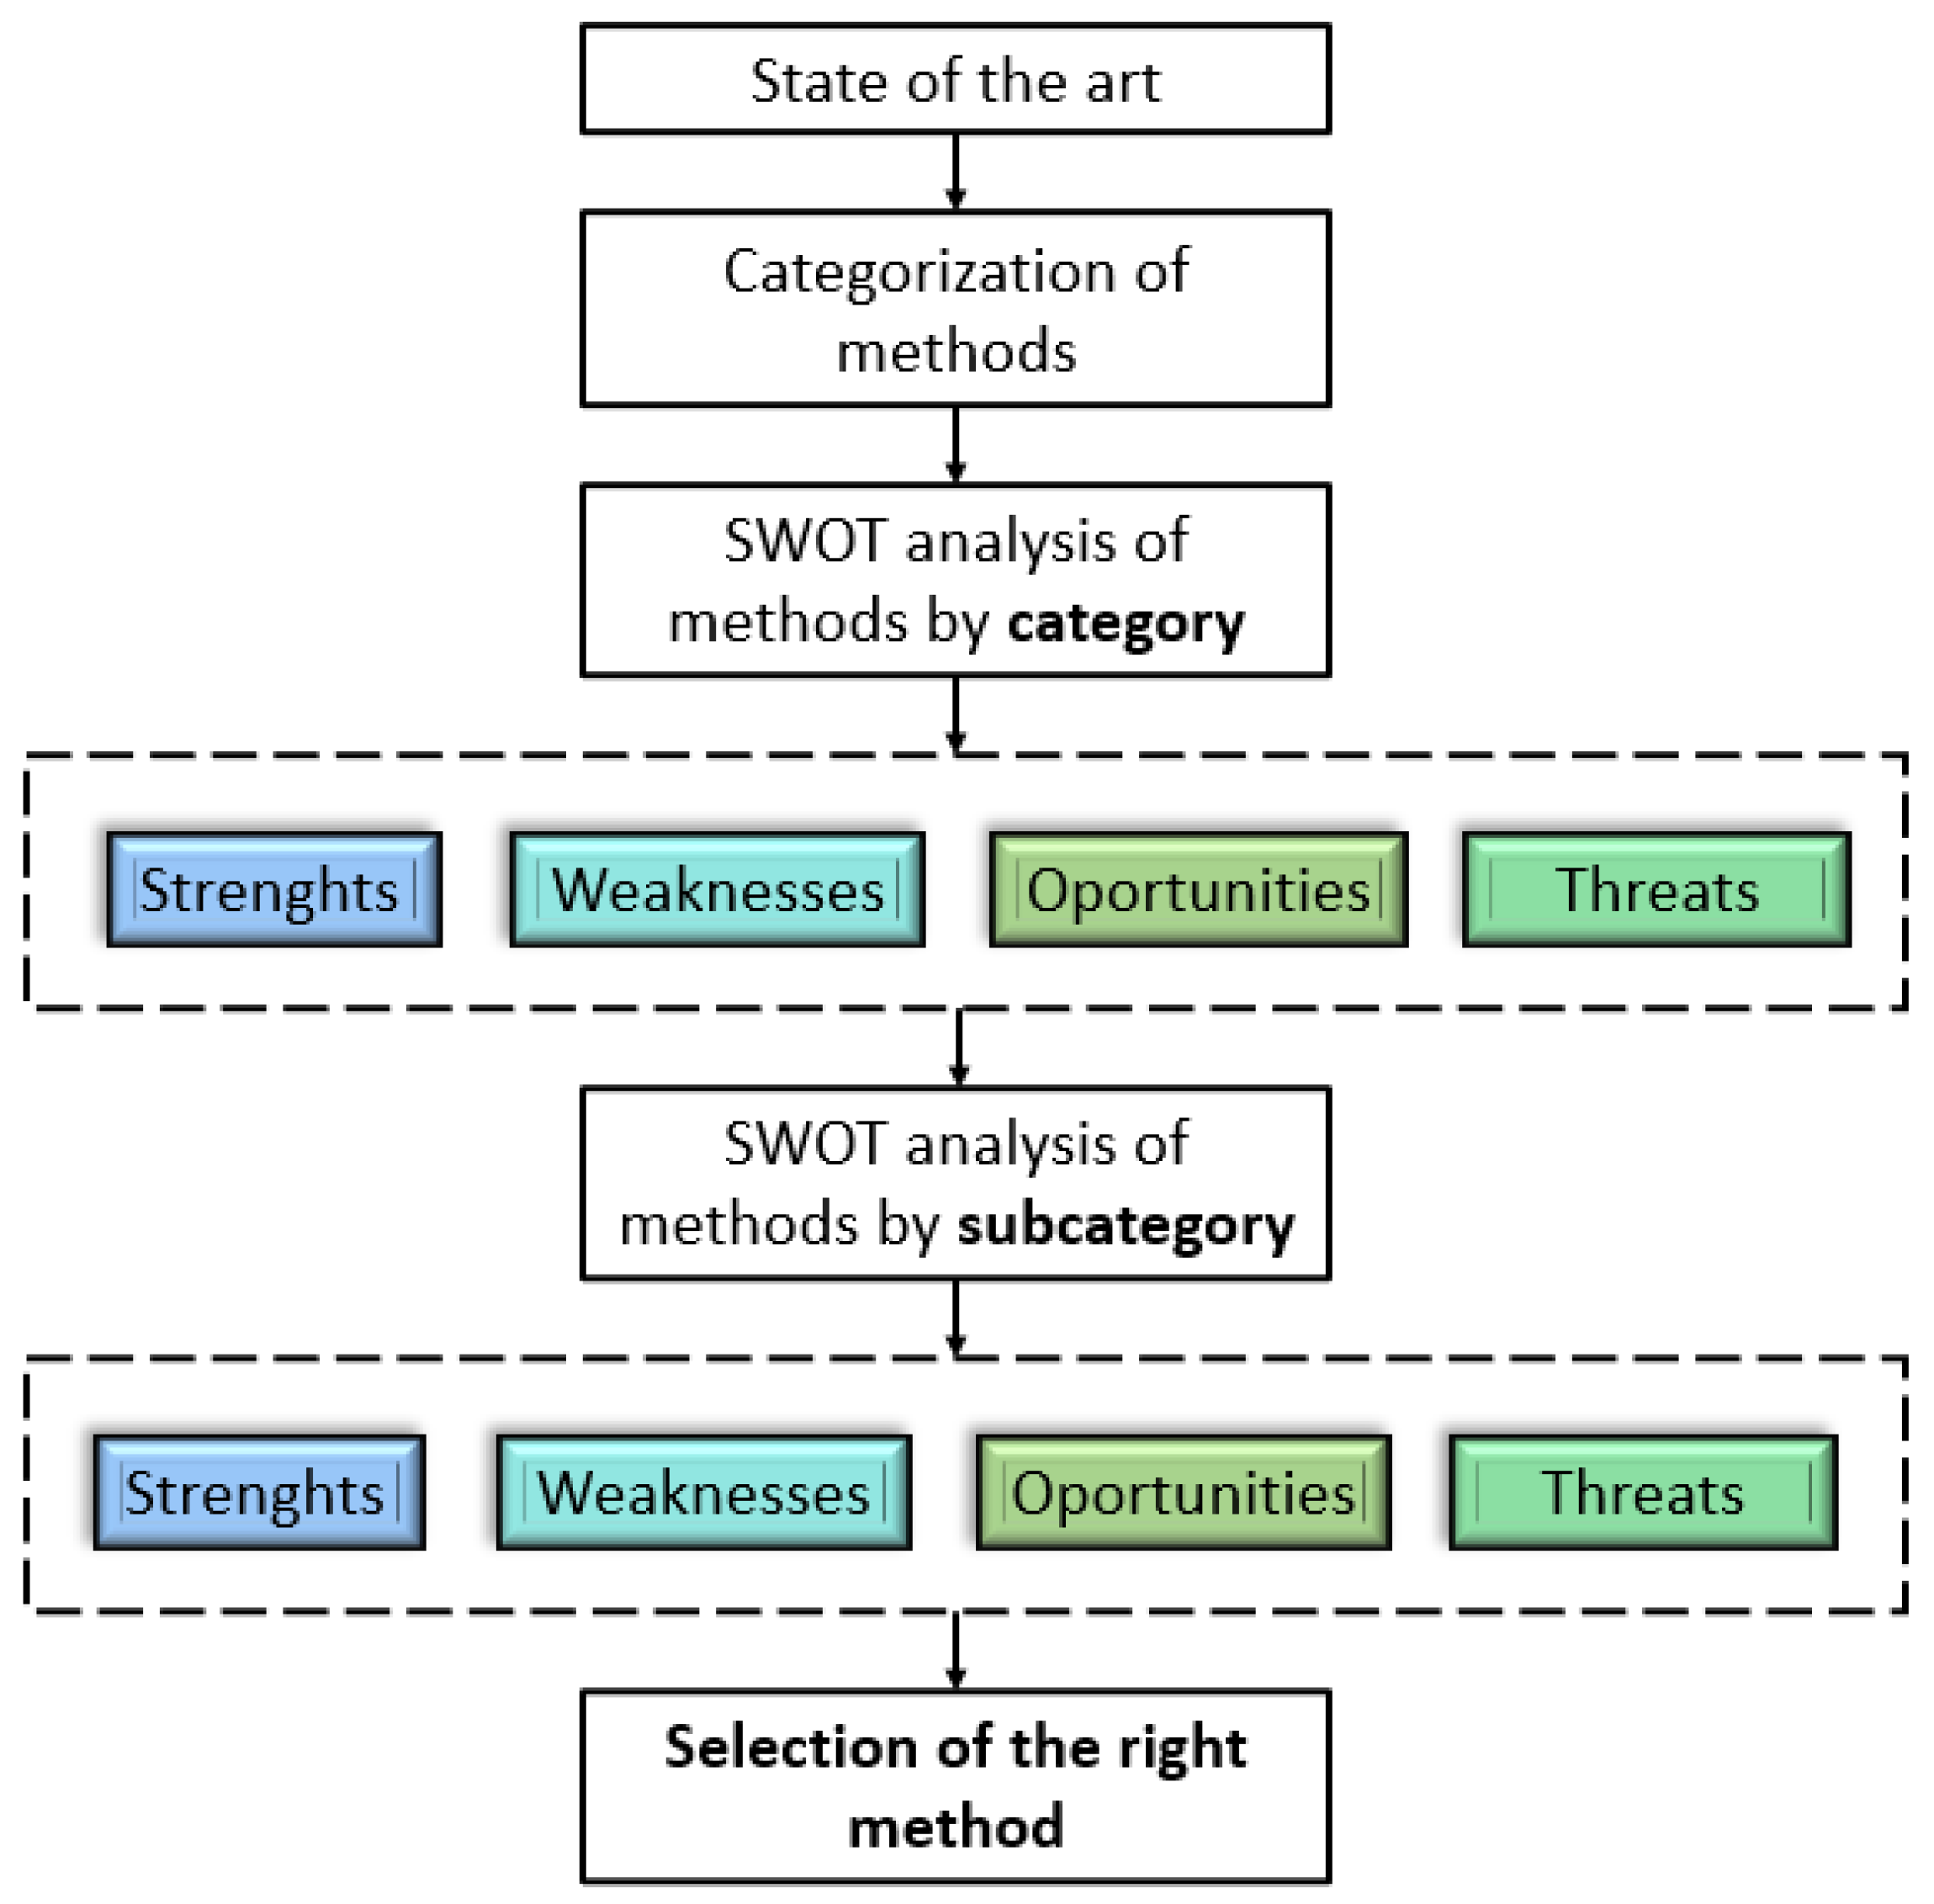
3.1. SWOT Analysis—Methods for Measuring NOx
- Sensitivity: The minimum detectable concentration of NOx and the method’s linear working range.
- Price: Both the investment cost of devices/analytical systems and ongoing operational expenses.
- Selectivity: The ability to distinguish NOx from other gases typically present in the mine atmosphere.
- Stability: The resilience of the method/instrument to changing environmental conditions and long-term use.
- Precision: The repeatability and reliability of measurement results.
- Validation: Availability of standards and the possibility of regular verification of analytical performance.
- Ease of use in the field: Mobility, device size, and suitability for operation by non-specialist personnel.
- Ease of sampling/Measurement: Directness, potential for continuous monitoring, and minimization of errors related to sample collection.
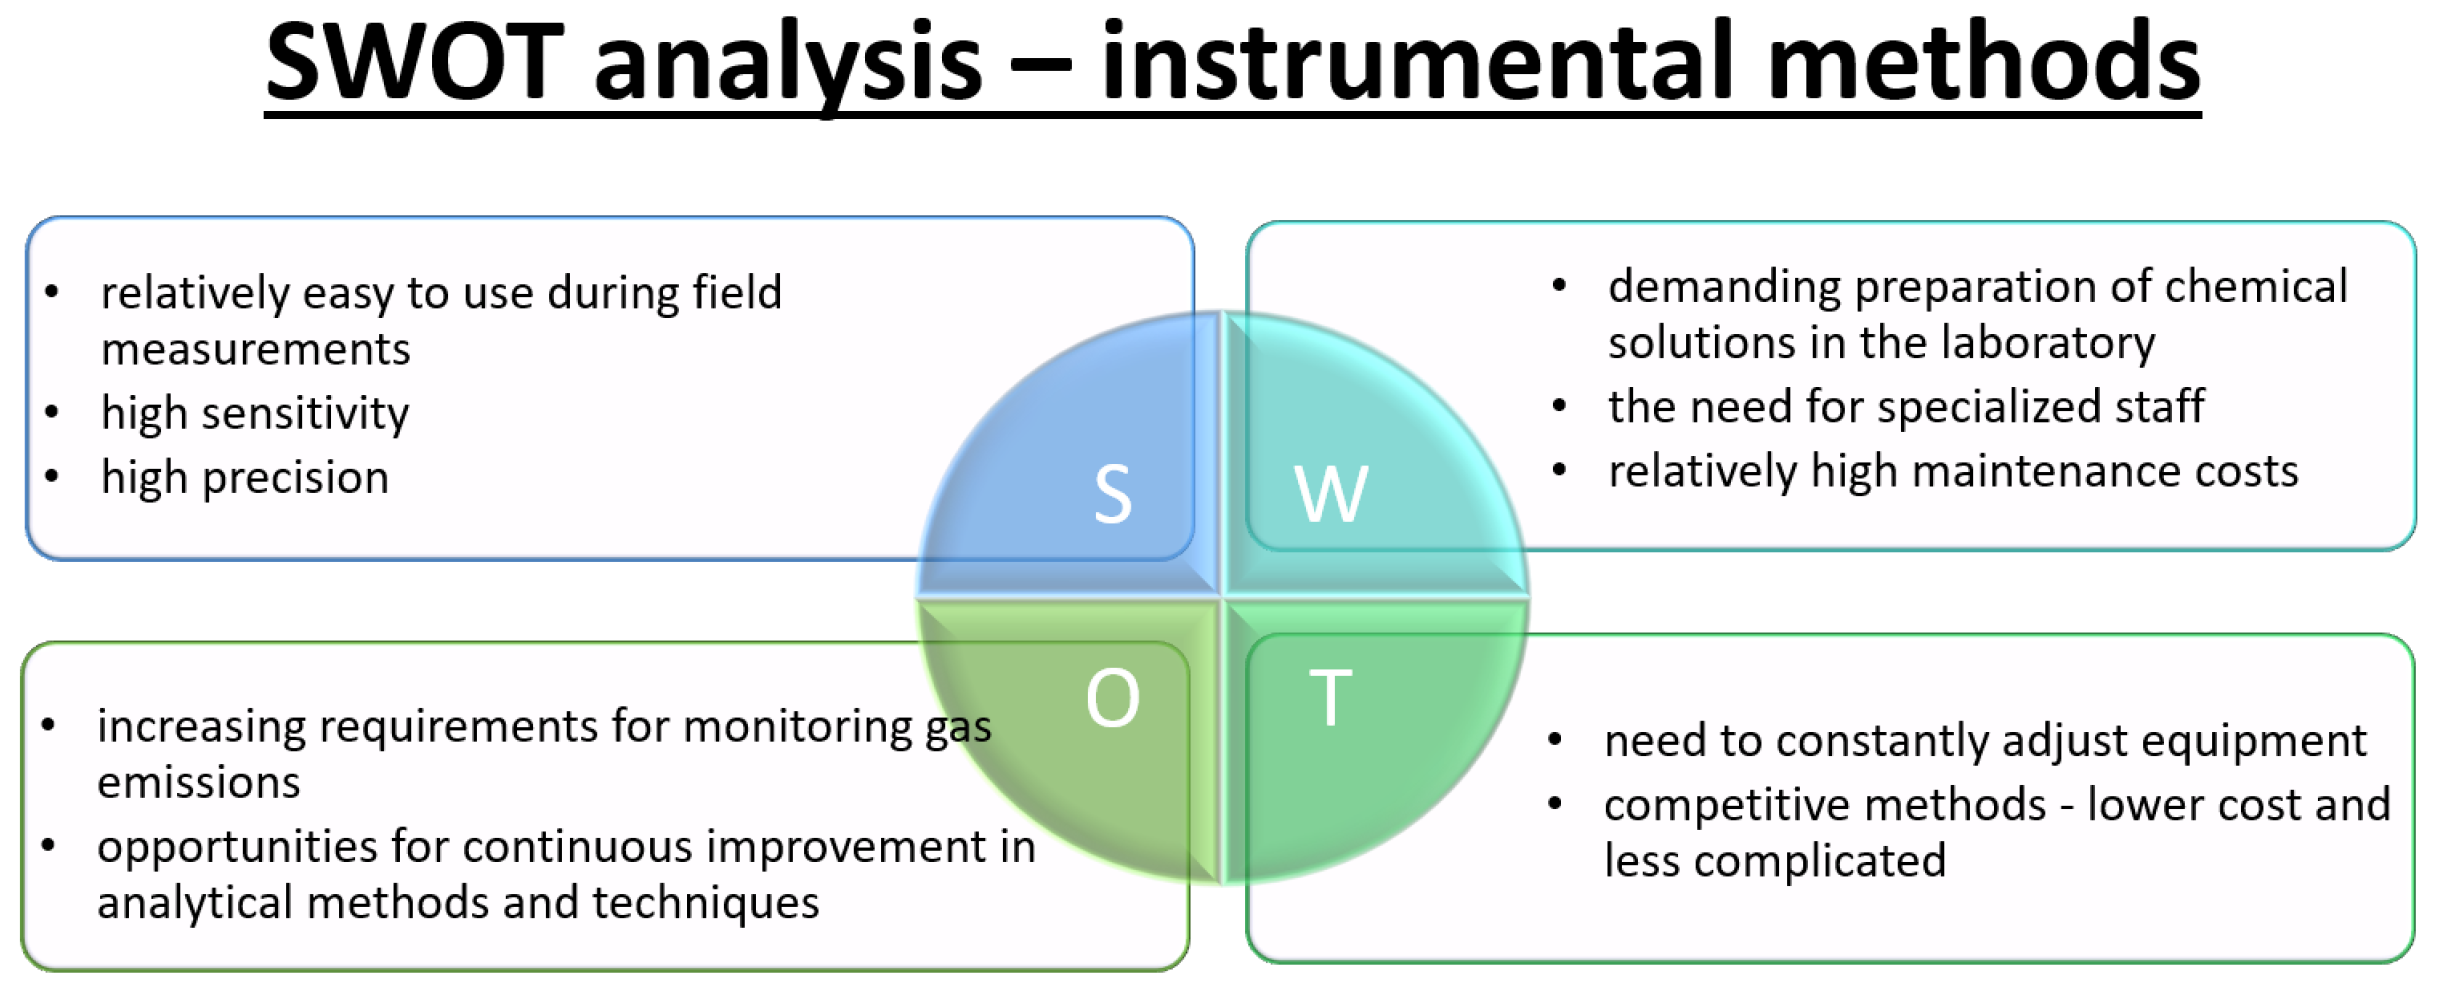
3.2. SWOT Analysis—Instrumental Methods for NOx Determination
4. Conclusions
- The UV–Vis spectrophotometry method was identified, based on a literature review and SWOT analysis, as the most advantageous technique for measuring NOx concentrations under real underground mine conditions. Based on the SWOT assessment, two methods were distinguished: gas chromatography and UV–Vis spectrophotometry. Although gas chromatography offers superior selectivity and sensitivity, its significant capital and operating costs, requirements for specialized personnel, and the need for expensive columns for separation of nitrogen compounds limit its use, especially in smaller laboratories and field measurements. UV–Vis spectrophotometry, on the other hand, combines high sensitivity, a wide measurement range (suitable for both low and high NOx concentrations), simplicity of operation, and relatively low acquisition and maintenance costs, making it a more versatile and practical choice in underground mining environments.
- Accurate knowledge and control of NOx concentration levels are essential to ensure safe working conditions underground and to effectively manage gas hazards. By precisely monitoring emissions from mining machinery along with average NOx levels in the mine atmosphere and taking into account the volume of air flow through underground workings, site managers can reliably assess workers’ exposure to harmful gases. This makes it possible to make timely interventions to reduce risks, such as improving ventilation or limiting the duration of exposure, thereby reducing the incidence of occupational diseases and accidents associated with long-term exposure to toxic atmospheres.
- Real-world measurement data indicate that UV–Vis spectrophotometry enables direct measurement of NO and NO2 concentrations with high accuracy and stability. These methods rely on the Beer–Lambert law, which reduces the frequency of calibration. For example, Hu et al. [108] applied dual-channel cavity ring-down spectroscopy for simultaneous measurement of NO and NO2, achieving precision on the order of 1 ppb. Field and laboratory studies [109] demonstrate that UV–Vis performs well in various environments, including low-concentration scenarios, although environmental factors such as humidity, particulates, and temperature fluctuations may affect signal stability. In underground mines, advanced measurement systems such as MONOKS [107] enable monitoring of a wide range of NOx concentrations, from low ambient air levels to high exhaust levels from mining machinery. These systems account for challenging mine conditions, including dust, temperature variations, and humidity, confirming the practical applicability of UV–Vis spectrophotometry in field conditions.
- Future research will focus on practical testing and comparative evaluation of selected measurement methods under actual deep underground mine conditions. The next phase involves the implementation of these methods for measuring NO and NO2 concentrations in both ambient mine air (characterized by low concentrations) and in mining machinery exhausts (where concentrations are much higher). Special emphasis will be placed on field testing the UV–Vis spectrophotometry method, which has shown the greatest practical potential in theoretical analyses. The study will evaluate the method’s accuracy, stability, ease of use, and robustness under the harsh environmental conditions typical of deep underground mines, including factors such as humidity, the presence of particulates, and temperature fluctuations. The results will enable optimization of measurement procedures and provide practical recommendations for the mining industry in the selection and application of NOx-monitoring techniques.
Author Contributions
Funding
Institutional Review Board Statement
Informed Consent Statement
Data Availability Statement
Conflicts of Interest
References
- Feng, J.; Wang, E.; Ding, H.; Huang, Q.; Chen, X. Deterministic seismic hazard assessment of coal fractures in underground coal mine: A case study. Soil Dyn. Earthq. Eng. 2020, 129, 105921. [Google Scholar] [CrossRef]
- Slazak, N.; Obracaj, D.; Borowski, M. Methods for controlling temperature hazard in Polish coal mines. Arch. Min. Sci. 2008, 53, 497–510. [Google Scholar]
- Tutak, M.; Brodny, J.; Szurgacz, D.; Sobik, L.; Zhironkin, S. The impact of the ventilation system on the methane release hazard and spontaneous combustion of coal in the area of exploitation—A case study. Energies 2020, 13, 4891. [Google Scholar] [CrossRef]
- Fijałkowska-Lichwa, L.; Przylibski, T.A. Monthly and quarterly correction factors for determining the mean annual radon concentration in the atmosphere of underground workplaces in Poland. Environ. Geochem. Health 2023, 45, 1475–1498. [Google Scholar] [CrossRef] [PubMed]
- Wallace, K.; Prosser, B.; Stinnette, J.D. The practice of mine ventilation engineering. Int. J. Min. Sci. Technol. 2015, 25, 165–169. [Google Scholar] [CrossRef]
- Paola Parra, O.; Marcos Quispe, P.; Bladimir Mamani, Z.; Juan Salvador, A. Toxic Gases in Mining. Int. J. Eng. Manag. Res. 2021, 11, 239–241. [Google Scholar] [CrossRef]
- Banasiewicz, A.; Janicka, A.; Michalak, A.; Włostowski, R. Photocatalysis as a method for reduction of ambient NOx in deep underground mines. Measurement 2022, 200, 111453. [Google Scholar] [CrossRef]
- Dong, L.; Tong, X.; Li, X.; Zhou, J.; Wang, S.; Liu, B. Some developments and new insights of environmental problems and deep mining strategy for cleaner production in mines. J. Clean. Prod. 2019, 210, 1562–1578. [Google Scholar] [CrossRef]
- Onederra, I.; Bailey, V.; Cavanough, G.; Torrance, A. Understanding main causes of nitrogen oxide fumes in surface blasting. Min. Technol. 2012, 121, 151–159. [Google Scholar] [CrossRef]
- Zhao, Z.; Cao, Y.; Dong, F.; Wu, F.; Li, B.; Zhang, Q.; Zhou, Y. The activation of oxygen through oxygen vacancies in BiOCl/PPy to inhibit toxic intermediates and enhance the activity of photocatalytic nitric oxide removal. Nanoscale 2019, 11, 6360–6367. [Google Scholar] [CrossRef]
- McCray, R.B. Utilization of a Small Unmanned Aircraft System for Direct Sampling of Nitrogen Oxides Produced by Full-Scale Surface Mine Blasting. Master’s Thesis, University of Kentucky, Lexington, Kentucky, 2016. [Google Scholar]
- Cauda, E.; Bugarski, A.; Patts, L. Diesel aftertreatment control technologies in underground mines: The NO2 issue. In Proceedings of the 13th US/North American Mine Ventilation Symposium, Sudbury, ON, Canada, 13–16 June 2010; pp. 17–24. [Google Scholar]
- Banasiewicz, A.; Moosavi, F.; Kotyla, M.; Śliwiński, P.; Krot, P.; Wodecki, J.; Zimroz, R. Forecasting of NOx emissions of diesel LHD vehicles in underground mines—An ANN-based regression approach. Appl. Sci. 2023, 13, 9965. [Google Scholar] [CrossRef]
- Bugarski, A.D.; Ritter, D.A. Advanced Diesel Powertrains for Underground Mining Mobile Equipment. Min. Metall. Explor. 2025, 42, 449–464. [Google Scholar] [CrossRef] [PubMed]
- Bugarski, A.D.; Cauda, E.G.; Janisko, S.J.; Hummer, J.A.; Patts, L.D. Aerosols emitted in underground mine air by diesel engine fueled with biodiesel. J. Air Waste Manag. Assoc. 2010, 60, 237–244. [Google Scholar] [CrossRef] [PubMed]
- Zhou, G.; Liu, Y.; Yang, Y.; Luan, G.; Xu, Z.; Sun, B. Transport characteristics and dispersion evolution of CO-NOx mixture exhaust for shuttle movement emission in short-wall continuous mining face. Environ. Sci. Pollut. Res. 2024, 31, 61191–61209. [Google Scholar] [CrossRef] [PubMed]
- Menéndez, J.; Merlé, N.; Fernández-Oro, J.M.; Galdo, M.; de Prado, L.Á.; Loredo, J.; Bernardo-Sánchez, A. Concentration, propagation and dilution of toxic gases in underground excavations under different ventilation modes. Int. J. Environ. Res. Public Health 2022, 19, 7092. [Google Scholar] [CrossRef]
- Xiao, M.; Du, C.; Wang, Y.; Wang, J.; Lu, Y. Development and mechanism of composite dust and toxic gas suppressant for tunnel blasting construction. Powder Technol. 2025, 454, 120730. [Google Scholar] [CrossRef]
- Varshney, C.; Singh, A.P. Passive samplers for NOx monitoring: A critical review. Environmentalist 2003, 23, 127–136. [Google Scholar] [CrossRef]
- Clapp, L.J.; Jenkin, M.E. Analysis of the relationship between ambient levels of O3, NO2 and NO as a function of NOx in the UK. Atmos. Environ. 2001, 35, 6391–6405. [Google Scholar] [CrossRef]
- Huerta, S.; Chilka, S.; Bonavida, B. Nitric oxide donors: Novel cancer therapeutics. Int. J. Oncol. 2008, 33, 909–927. [Google Scholar] [CrossRef]
- Griffiths, M.J.; Evans, T.W. Inhaled nitric oxide therapy in adults. N. Engl. J. Med. 2005, 353, 2683–2695. [Google Scholar] [CrossRef]
- Behrendt, T.; Agam, N.; Horn, M.A. Microbial Nitric Oxide, Nitrous Oxide, and Nitrous Acid Emissions from Drylands. In Dryland Ecohydrology; Springer International Publishing: Berlin/Heidelberg, Germany, 2019; pp. 335–365. [Google Scholar] [CrossRef]
- Singh, P.; Simanjuntak, F.M.; Hu, L.L.; Tseng, T.Y.; Zan, H.W.; Chu, J.P. Negative Effects of Annealed Seed Layer on the Performance of ZnO-Nanorods Based Nitric Oxide Gas Sensor. Sensors 2022, 22, 390. [Google Scholar] [CrossRef] [PubMed]
- Sonker, R.K.; Yadav, B. Low temperature study of nanostructured Fe2O3 thin films as NO2 sensor. Mater. Today Proc. 2016, 3, 2315–2320. [Google Scholar] [CrossRef]
- Khan, M.A.H.; Rao, M.V.; Li, Q. Recent advances in electrochemical sensors for detecting toxic gases: NO2, SO2 and H2S. Sensors 2019, 19, 905. [Google Scholar] [CrossRef] [PubMed]
- Manisalidis, I.; Stavropoulou, E.; Stavropoulos, A.; Bezirtzoglou, E. Environmental and Health Impacts of Air Pollution: A Review. Front. Public Health 2020, 8, 14. [Google Scholar] [CrossRef]
- Kampa, M.; Castanas, E. Human health effects of air pollution. Environ. Pollut. 2008, 151, 362–367. [Google Scholar] [CrossRef]
- Sun, Y.; Zwolińska, E.; Chmielewski, A.G. Abatement technologies for high concentrations of NOx and SO2 removal from exhaust gases: A review. Crit. Rev. Environ. Sci. Technol. 2015, 46, 119–142. [Google Scholar] [CrossRef]
- Khan, T.T.; Bari, G.A.R.; Kang, H.J.; Lee, T.G.; Park, J.W.; Hwang, H.J.; Hossain, S.M.; Mun, J.S.; Suzuki, N.; Fujishima, A.; et al. Synthesis of N-doped TiO2 for efficient photocatalytic degradation of atmospheric NOx. Catalysts 2021, 11, 109. [Google Scholar] [CrossRef]
- Oluwoye, I.; Dlugogorski, B.Z.; Gore, J.; Oskierski, H.C.; Altarawneh, M. Atmospheric emission of NO from mining explosives: A critical review. Atmos. Environ. 2017, 167, 81–96. [Google Scholar] [CrossRef]
- Ghose, M.; Majee, S. Sources of air pollution due to coal mining and their impacts in Jharia coalfield. Environ. Int. 2000, 26, 81–85. [Google Scholar] [CrossRef]
- Banasiewicz, A.; Sliwinski, P.; Krot, P.; Wodecki, J.; Zimroz, R. Prediction of NOx Emission Based on Data of LHD On-Board Monitoring System in a Deep Underground Mine. Energies 2023, 16, 2149. [Google Scholar] [CrossRef]
- Zawadzka-Małota, I. Testing of mining explosives with regard to the content of carbon oxides and nitrogen oxides in their detonation products. J. Sustain. Min. 2015, 14, 173–178. [Google Scholar] [CrossRef]
- Sabbaghi, A.; Vaidyanathan, G. SWOT analysis and theory of constraint in information technology projects. Inf. Syst. Educ. J. 2004, 2, 23. [Google Scholar]
- Leiber, T.; Stensaker, B.; Harvey, L.C. Bridging theory and practice of impact evaluation of quality management in higher education institutions: A SWOT analysis. Eur. J. High. Educ. 2018, 8, 351–365. [Google Scholar] [CrossRef]
- Benzaghta, M.A.; Elwalda, A.; Mousa, M.; Erkan, I.; Rahman, M. SWOT analysis applications: An integrative literature review. J. Glob. Bus. Insights 2021, 6, 55–73. [Google Scholar] [CrossRef]
- In Proceedings of the COMMISSION DIRECTIVE (EU) 2017/164 of 31 January 2017 Establishing a Fourth List of Indicative Occupational Exposure Limit Values Pursuant to Council Directive 98/24/EC, and Amending Commission Directives 91/322/EEC, 2000/39/EC and 2009/161/EU, 2017. Available online: https://eur-lex.europa.eu/eli/dir/2017/164/oj/eng (accessed on 29 August 2025).
- Diogo, M.T. European legal framework related to underground mining and tunnelling concerning commission directive (EU) 2017/164, 31 January establishing a fourth list of indicative occupational exposure limit values. Int. J. Min. Sci. Technol. 2020, 30, 541–545. [Google Scholar] [CrossRef]
- Dz. U. z 2017r.,poz. 1118; Regulation of the Minister of Energy Related to Operations of Underground Mining (Available in Polish: Rozporzadzenie Ministra Energii z Dnia 23 Listopada 2016r.,w Sprawie Szczegółowych Wymagań Dotyczacych Prowadzenia Ruchu Podziemnych Zakładów Górniczych. Ministry of Energy (Poland): Warsaw, Poland, 2017.
- Bartels, T.; Eichler, B.; Zimmermann, P.; Gäggeler, H.W.; Ammann, M. The adsorption of nitrogen oxides on crystalline ice. Atmos. Chem. Phys. 2002, 2, 235–247. [Google Scholar] [CrossRef]
- Kain, M.; Commins, B.; Dixon-Lewis, G.; Nunn, J. Detection and determination of higher oxides of nitrogen. Br. J. Anaesth. 1967, 39, 425–431. [Google Scholar] [CrossRef][Green Version]
- Salem, A.A.; Soliman, A.A.; El-Haty, I.A. Determination of nitrogen dioxide, sulfur dioxide, ozone, and ammonia in ambient air using the passive sampling method associated with ion chromatographic and potentiometric analyses. Air Qual. Atmos. Health 2009, 2, 133–145. [Google Scholar] [CrossRef]
- Karlsson, R.; Torstensson, L.G. Controlled-potential iodometric titration of nitrite. Application to the determination of nitrite in meat products. Talanta 1974, 21, 945–950. [Google Scholar] [CrossRef]
- Pankivskyi, Y.I.; Wang, L.K.; Wang, M.H.S. Ozone residual determination or total oxidant determination by iodometric titration-assisted spectrophotometry. In Environmental Science, Technology, Engineering, and Mathematics (STEM); Lenox Institute Press: Richardson, TX, USA, 2022. [Google Scholar] [CrossRef]
- Sun, Y.; Hong, X.; Zhu, T.; Guo, X.; Xie, D. The chemical behaviors of nitrogen dioxide absorption in sulfite solution. Appl. Sci. 2017, 7, 377. [Google Scholar] [CrossRef]
- Alexa, L.; Mikuška, P.; Večeřa, Z. Determination of nitrogen dioxide and ozone in ambient air using modified chemiluminescent online analysers. Microchem. J. 2025, 215, 114227. [Google Scholar] [CrossRef]
- García-Robledo, E.; Corzo, A.; Papaspyrou, S. A fast and direct spectrophotometric method for the sequential determination of nitrate and nitrite at low concentrations in small volumes. Mar. Chem. 2014, 162, 30–36. [Google Scholar] [CrossRef]
- Tzani, M.A.; Gioftsidou, D.K.; Kallitsakis, M.G.; Pliatsios, N.V.; Kalogiouri, N.P.; Angaridis, P.A.; Lykakis, I.N.; Terzidis, M.A. Direct and Indirect Chemiluminescence: Reactions, Mechanisms and Challenges. Molecules 2021, 26, 7664. [Google Scholar] [CrossRef] [PubMed]
- Dunlea, E.; Herndon, S.; Nelson, D.; Volkamer, R.; San Martini, F.; Sheehy, P.; Zahniser, M.; Shorter, J.; Wormhoudt, J.; Lamb, B.; et al. Evaluation of nitrogen dioxide chemiluminescence monitors in a polluted urban environment. Atmos. Chem. Phys. 2007, 7, 2691–2704. [Google Scholar] [CrossRef]
- Wang, Y.; Fan, S.H.; Wang, S.L. Chemiluminescence determination of nitrogen oxide in air with a sequential injection method. Anal. Chim. Acta 2005, 541, 129–134. [Google Scholar] [CrossRef]
- Navas, M.; Jiménez, A.; Galán, G. Air analysis: Determination of nitrogen compounds by chemiluminescence. Atmos. Environ. 1997, 31, 3603–3608. [Google Scholar] [CrossRef]
- Oh, K.S.; Woo, S.I. Chemiluminescence analyzer of NOx as a high-throughput screening tool in selective catalytic reduction of NO. Sci. Technol. Adv. Mater. 2011, 12, 054211. [Google Scholar] [CrossRef]
- Dickerson, R.R.; Anderson, D.C.; Ren, X. On the use of data from commercial NOx analyzers for air pollution studies. Atmos. Environ. 2019, 214, 116873. [Google Scholar] [CrossRef]
- Ryu, H.; Thompson, D.; Huang, Y.; Li, B.; Lei, Y. Electrochemical sensors for nitrogen species: A review. Sens. Actuators Rep. 2020, 2, 100022. [Google Scholar] [CrossRef]
- Bedioui, F.; Griveau, S. Electrochemical Detection of Nitric Oxide: Assessement of Twenty Years of Strategies. Electroanalysis 2012, 25, 587–600. [Google Scholar] [CrossRef]
- Schmitz, S.; Caseiro, A.; von Schneidemesser, E. How electrochemical sensors measure up to reference-grade nitrogen dioxide monitors across temporal scales. Sci. Total Environ. 2025, 980, 179476. [Google Scholar] [CrossRef]
- Coskun, O. Separation Tecniques: Chromatography. North. Clin. Istanb. 2016, 3, 156–160. [Google Scholar] [CrossRef]
- Marley, N.A.; Gaffney, J.S.; White, R.V.; Rodriguez-Cuadra, L.; Herndon, S.E.; Dunlea, E.; Volkamer, R.M.; Molina, L.T.; Molina, M.J. Fast gas chromatography with luminol chemiluminescence detection for the simultaneous determination of nitrogen dioxide and peroxyacetyl nitrate in the atmosphere. Rev. Sci. Instruments 2004, 75, 4595–4605. [Google Scholar] [CrossRef]
- Li, Q.; Zhang, Y.; Guo, Z.; Wang, S.; Wang, H. Analysis of trace NO and NO2 in atmosphere using gas chromatography with chemiluminescence detection. Talanta 2012, 97, 256–260. [Google Scholar] [CrossRef][Green Version]
- Althannas, D.; Ferreira, A.J.S.; Ceriani, F.S.; da Costa, G.P. Potential of GC-Combustion-MS as a Powerful and Versatile Nitrogen-Selective Detector in Gas Chromatography. Anal. Chem. 2023, 95, 11761–11768. [Google Scholar] [CrossRef]
- Pratiwi, R.A.; Nandiyanto, A.B.D. How to read and interpret UV-VIS spectrophotometric results in determining the structure of chemical compounds. Indones. J. Educ. Res. Technol. 2021, 2, 1–20. [Google Scholar] [CrossRef]
- Schneider, W.; Moortgat, G.K.; Tyndall, G.S.; Burrows, J.P. Absorption cross-sections of NO2 in the UV and visible region (200–700 nm) at 298 K. J. Photochem. Photobiol. A Chem. 1987, 40, 195–217. [Google Scholar] [CrossRef]
- Platt, U.; Stutz, J. Differential Optical Absorption Spectroscopy: Principles and Applications; Springer: Berlin/Heidelberg, Germany, 2007. [Google Scholar] [CrossRef]
- Vojtíšek, M.; Pechout, M. 2.26 Portable, on-board FTIR spectrometers: A universal tool for real-world monitoring of greenhouse gases, reactive nitrogen compounds, and other gaseous pollutants? In Proceedings of the Transport and Air Pollution (TAP) Conference, Luxembourg; 2022; p. 267. [Google Scholar]
- Bacsik, Z.; Mink, J.; Keresztury, G. FTIR spectroscopy of the atmosphere. I. Principles and methods. Appl. Spectrosc. Rev. 2004, 39, 295–363. [Google Scholar] [CrossRef]
- Smith, K.R.; Uymin, G. Quantitative gas-phase FTIR spectroscopy for gas mixture analysis: Accuracy, precision, and metrological traceability. J. Quant. Spectrosc. Radiat. Transf. 2011, 112, 1040–1050. [Google Scholar] [CrossRef]
- Hussain, H.; Kim, J.; Yi, S. Characteristics and Temperature Compensation of Non-Dispersive Infrared (NDIR) Alcohol Gas Sensors According to Incident Light Intensity. Sensors 2018, 18, 2911. [Google Scholar] [CrossRef]
- Niklas, C.; Bauke, S.; Müller, F.; Golibrzuch, K.; Wackerbarth, H.; Ctistis, G. Quantitative measurement of combustion gases in harsh environments using NDIR spectroscopy. J. Sens. Sens. Syst. 2019, 8, 123–132. [Google Scholar] [CrossRef]
- Xu, M.; Gao, C.; Guo, Y. Design of nitrogen oxide detection system based on non-dispersive infrared technology. Optik 2022, 262, 169351. [Google Scholar] [CrossRef]
- Park, J.H.; Ha, S.; Chae, H.K.; Kim, K.S. A multi-gas detector using NDUV and NDIR methods for real-time measurements in automotive exhausts. Sensors 2019, 19, 2783. [Google Scholar] [CrossRef]
- Zhang, K.; Zhang, Y.; He, Y.; You, K.; Gao, Y.; Chen, C.; Liu, G.; He, C.; Lu, Y.; Liu, W. Design of the NDUV detection circuit for the NO concentration of the vehicle exhaust emissions. In Proceedings of the International Symposium on Optoelectronic Technology and Application 2016, Beijing, China, 9–11 May 2016; SPIE: Bellingham, WA, USA, 2016. [Google Scholar] [CrossRef]
- Liu, D.; Du, Q.; Nie, B.; Ma , Y.; Sun, J.; Li, Y.; Zhang, X.; Gong, Z.; Zhang, Y.; Ma, W.; et al. Advanced multi-gas detection based on cavity-enhanced NDUV absorption spectroscopy. Sens. Actuators B Chem. 2023, 376, 133048. [Google Scholar] [CrossRef]
- Favre, L.; Rosu, S.; Robert, L.; Grisch, F.; Joly, F. Simultaneous Online Measurement of NO, NO2, and NOx with a High-Time Resolution NDUV Analyzer. Anal. Chem. 2019, 91, 15344–15350. [Google Scholar]
- Smirnioudi, V.; Siskos, P. Chemical composition of wet and dust deposition in Athens, Greece. Atmos. Environ. Part B Urban Atmos. 1992, 26, 483–490. [Google Scholar] [CrossRef]
- Rao, P.; Clarke, S.; Brown, R.; Wu, K.S. Influence of iodine value on combustion and NOx emission characteristics of a DI diesel engine. In Proceedings of the Chemeca 2010: The 40th Australasian Chemical Engineering Conference, Adelaide, Australia, 26–29 September 2010; p. 12. [Google Scholar]
- Joshi, J.; Mahajani, V.; Juvekar, V. Invited review absorption of Nox gases. Chem. Eng. Commun. 1985, 33, 1–92. [Google Scholar] [CrossRef]
- Liémans, I.; Alban, B.; Tranier, J.P.; Thomas, D. SOx and NOx absorption based removal into acidic conditions for the flue gas treatment in oxy-fuel combustion. Energy Procedia 2011, 4, 2847–2854. [Google Scholar] [CrossRef]
- de Haan, A.; Kooijman, H.; Górak, A. Effect of nitric and sulfuric acids on Nox and Sox absorption into oxido-acidic solutions. Chemistry 2021, 325–330. Available online: https://skoge.folk.ntnu.no/prost/proceedings/distillation10/DA2010%20Conference%20Proceedings/4.%20Basic%20Data/OR23%20Liemans%20Effect%20of%20Nitric%20and%20Sulfuric%20Acids.pdf (accessed on 29 August 2025).
- Gao, J.; Chen, Z.; Li, X.; Yang, M.; Lv, J.; Li, H.; Yuan, Z. Chemiluminescence in Combination with Organic Photosensitizers: Beyond the Light Penetration Depth Limit of Photodynamic Therapy. Int. J. Mol. Sci. 2022, 23, 12556. [Google Scholar] [CrossRef]
- Stedman, D.H.; Fraser, M.E. Analytical applications of gas phase chemiluminescence. In Chemi-and Bioluminescence; CRC Press: Boca Raton, FL, USA, 2020; pp. 439–468. [Google Scholar]
- Alam, M.S.; Crilley, L.R.; Lee, J.D.; Kramer, L.J.; Pfrang, C.; Vázquez-Moreno, M.; Ródenas, M.; Muñoz, A.; Bloss, W.J. Interference from alkenes in chemiluminescent NOx measurements. Atmos. Meas. Tech. 2020, 13, 5977–5991. [Google Scholar] [CrossRef]
- Grosjean, D.; Harrison, J. Response of chemiluminescence NOx analyzers and ultraviolet ozone analyzers to organic air pollutants. Environ. Sci. Technol. 1985, 19, 862–865. [Google Scholar] [CrossRef]
- Gluck, S.; Glenn, C.; Logan, T.; Vu, B.; Walsh, M.; Williams, P. Evaluation of NOx flue gas analyzers for accuracy and their applicability for low-concentration measurements. J. Air Waste Manag. Assoc. 2003, 53, 749–758. [Google Scholar] [CrossRef]
- Worthington, B.; von Hoersten, H. Novel Differential Ultra-violet Resonance Absorption Gas Analyzer for NOx Measurements in Continuous Emission Monitoring Systems. In ABB Analytical Products, SC7-54-402; ABB Library: Zurich, Switzerland, 2002. [Google Scholar]
- Wang, Z.; Deng, Z.H.; Zhu, R.J.; Zhou, Y.H.; Li, X. Modeling and analysis of pumping cell of NOx sensor—Part Ⅰ: Main oxygen pumping cell. Sens. Actuators B Chem. 2022, 359, 131622. [Google Scholar] [CrossRef]
- Privett, B.J.; Shin, J.H.; Schoenfisch, M.H. Electrochemical nitric oxide sensors for physiological measurements. Chem. Soc. Rev. 2010, 39, 1925. [Google Scholar] [CrossRef]
- Arokia, R.; Kennedy, A.; Lim, H.N.; Ibrahim, I.; Huang, N.M.; Zainal, Z.; Ahmad, S.A.A. Significance of nanomaterials in electrochemical sensors for nitrate detection: A review. Trends Environ. Anal. Chem. 2021, 31, e00135. [Google Scholar] [CrossRef]
- Hoherčáková, Z.; Opekar, F. Au/PVC composite—A new material for solid-state gas sensors. Sens. Actuators B Chem. 2004, 97, 379–386. [Google Scholar] [CrossRef]
- Ménil, F.; Coillard, V.; Lucat, C. Critical review of nitrogen monoxide sensors for exhaust gases of lean burn engines. Sens. Actuators B Chem. 2000, 67, 1–23. [Google Scholar] [CrossRef]
- Khan, M.A.; Qazi, F.; Hussain, Z.; Idrees, M.U.; Soomro, S.; Soomro, S. Recent Trends in Electrochemical Detection of NH3, H2S and NOx Gases. Int. J. Electrochem. Sci. 2017, 12, 1711–1733. [Google Scholar] [CrossRef]
- Li, X.; Tang, X.; Chen, H.; Wu, T.; Wang, B. Quantitative analysis method for the Fourier transform Infrared spectroscopy of gases. In Proceedings of the International Academic Conference on Optics and Photonics (IACOP 2023), Wuhan, China, 29–31 October 2023; SPIE: Bellingham, WA, USA, 2024; Volume 12972, pp. 126–132. [Google Scholar]
- Dong, Y.; Li, B.; Wang, H.; Wu, Q.; Wang, S.; Hu, S. A Review on Recent Trends and Future Developments in Electrochemical Sensing. ACS Omega 2024, 9, 5340–5365. [Google Scholar] [CrossRef]
- Zhou, Y.; Liu, X.; Li, G.; Wang, S. An effective method for detecting nitrous oxide using alkaline washing and GC-MS. Anal. Methods 2025, 17, 816–822. [Google Scholar] [CrossRef]
- Borges, J.A.R.; França, M.C.; Machado, L.V.C.; Junior, J.L.S.; Barbosa, A.L.D. Measurement of nitrous oxide in a nitrogen matrix using gas chromatography with microelectron capture detection: Validation of analytical method. J. Eng. Exact Sci. 2017, 3, 381–394. [Google Scholar] [CrossRef][Green Version]
- Dadi, M.; Yasir, M. Spectroscopy and Spectrophotometry: Principles and Applications for Colorimetric and Related Other Analysis. In Colorimetry; IntechOpen: London, UK, 2022. [Google Scholar] [CrossRef]
- Ashfaque-E-Alam, M.; Islam, M.R.; Faria, I.J. Development and validation of a low-cost visible light spectrophotometer. In Proceedings of the 2017 4th International Conference on Advances in Electrical Engineering (ICAEE), Dhaka, Bangladesh, 28–30 September 2017; IEEE: Piscataway, NJ, USA, 2017. [Google Scholar] [CrossRef]
- Jamróz, P.; Gręda, K.; Pohl, P.; Żyrnicki, W. Atmospheric Pressure Glow Discharges Generated in Contact with Flowing Liquid Cathode: Production of Active Species and Application in Wastewater Purification Processes. Plasma Chem. Plasma Process. 2013, 34, 25–37. [Google Scholar] [CrossRef]
- Tang, Y.Y.; Liu, W.Q.; Kan, R.F.; Liu, J.G.; He, Y.B.; Zhang, Y.J.; Xu, Z.Y.; Ruan, J.; Geng, H. Measurements of NO and CO in Shanghai urban atmosphere by using quantum cascade lasers. Opt. Express 2011, 19, 20224–20232. [Google Scholar] [CrossRef]
- Jia, Y.; Zhang, Y.; Li, J.; Wan, H.; Guo, Q.; Zhu, H.; Liu, H.; Yi, F. Non-dispersive infrared multi-gas sensing via nanoantenna-enabled detectors. Nat. Commun. 2020, 11, 5245. [Google Scholar] [CrossRef]
- Li, J.; Li, R.; Liu, Y.; Li, F.; Lin, X.; Yu, X.; Shao, W.; Xu, X. In Situ Measurement of NO, NO2, and H2O in Combustion Gases Based on Near/Mid-Infrared Laser Absorption Spectroscopy. Sensors 2022, 22, 5729. [Google Scholar] [CrossRef] [PubMed]
- Li, D.; Zan, L.; Chen, S.; Shi, Z.J.; Chen, P.; Xi, Z.; Deng, D. Direct conversion of N2 and O2: Status, challenge and perspective. Natl. Sci. Rev. 2022, 9, nwac042. [Google Scholar] [CrossRef]
- Merkisz, J.; Fuć, P.; Lijewski, P.; Pielecha, J. Actual Emissions from Urban Buses Powered with Diesel and Gas Engines. Transp. Res. Procedia 2016, 14, 3070–3078. [Google Scholar] [CrossRef]
- He, C.; Li, J.; Ma, Z.; Tan, J.; Zhao, L. High NO2/NOx emissions downstream of the catalytic diesel particulate filter: An influencing factor study. J. Environ. Sci. 2015, 35, 55–61. [Google Scholar] [CrossRef]
- Sharma, A.; Singh, M.; Sharma, S. Influence of fuel consumption and instantaneous exhaust pollutants on euro 4 gasoline vehicles at traffic signalized intersections: Idling and Start/Restart manoeuvre. Int. J. Veh. Struct. Syst. 2017, 9, 27. [Google Scholar] [CrossRef]
- Su, S.; Ge, Y.; Zhang, Y. NOx Emission from Diesel Vehicle with SCR System Failure Characterized Using Portable Emissions Measurement Systems. Energies 2021, 14, 3989. [Google Scholar] [CrossRef]
- Banasiewicz, A.; Kotyla, M.; Janicka, A.; Matla, J. MONOKS: A universal measurement system for low to high NOx concentrations in underground mines. Measurement 2025, 257, 118678. [Google Scholar] [CrossRef]
- Hu, R.; Li, Z.; Xie, P.; Chen, H.; Liu, X.; Liang, S.; Wang, D.; Wang, F.; Wang, Y.; Lin, C.; et al. Simultaneous measurement of NO and NO2 by dual-channel cavity ring down spectroscopy technique. Atmos. Meas. Tech. Discuss. 2019, 12, 3223–3236. [Google Scholar]
- Birks, J.W.; Andersen, P.C.; Williford, C.J.; Turnipseed, A.A.; Strunk, S.E.; Ennis, C.A.; Mattson, E. Folded tubular photometer for atmospheric measurements of NO2 and NO. Atmos. Meas. Tech. 2018, 11, 2821–2835. [Google Scholar] [CrossRef]



| Category | Method/Technique | Description | Examples and References |
|---|---|---|---|
| Chemical | Chemical methods rely on reactions between the target gas and specific reagents. The resulting chemical changes are analyzed to determine gas concentration. | Kain et al. (1967) [42]; Salem et al. (2009) [43]; Karlsson & Torstensson (1974) [44]; Pankivskyi et al. (2022) [45]; Sun et al. (2017) [46] | |
| Chemiluminescence | Measures light emitted during a chemical reaction. The intensity of emitted light correlates with gas concentration. | Alexa et al. (2025) [47]; García-Robledo et al. (2014) [48]; Tzani et al. (2021) [49]; Dunlea et al. (2007) [50]; Wang et al. (2005) [51]; Navas et al. (1997) [52]; Oh & Woo (2011) [53]; Dickerson et al. (2019) [54]) | |
| Electrochemical | Detects changes in voltage or current caused by the presence of target gases. | Khan et al. (2019) [26]; Ryu et al. (2020) [55]; Bedioui et al. (2012) [56]; Schmitz et al. (2025) [57] | |
| Instrumental | Gas Chromatography | Separates and identifies components in gas mixtures. Accurate, but often limited to labs. | Coskun (2016) [58]; Marley et al. (2004) [59]; Li et al. (2012) [60]; Althannas et al. (2023) [61] |
| UV–Vis Spectrophotometry | Uses UV and visible light absorption to quantify gases. Suitable for field use. | Pratiwi & Nandiyanto (2021) [62]; Schneider et al. (1987) [63]; Platt & Stutz (2007) [64] | |
| FTIR | Detects gases via infrared absorption spectra. Allows multi-gas detection. | Vojtíšek & Pechout (2022) [65]; Bacsik et al. (2004) [66]; Smith et al. (2011) [67] | |
| NDIR | Non-dispersive IR sensors measure gas absorption of IR light, commonly used for CO2. | Hussain et al. (2018) [68]; Niklas et al. (2019) [69]; Xu et al. (2022) [70]; Park et al. (2019) [71] | |
| NDUV | Uses UV absorption to detect gases like NO2; high selectivity but can be interfered by other UV-absorbing gases. | Platt & Stutz (2007) [64]; Zhang et al. (2016) [72]; Park et al. (2019) [71]; Liu et al. (2023) [73]; Favre et al. (2019) [74] | |
| Criteria | Strengths | Weaknesses |
|---|---|---|
| Sensitivity | Sufficient for standard applications (ppm) | Low for trace levels (ppb) |
| Cost | Very low; cheap reagents and equipment | – |
| Selectivity | Good with proper reagent selection | Matrix interferences |
| Stability | Stable in laboratory conditions | Sensitive to field conditions (light, temperature) |
| Precision | Good in optimized procedures | Degrades at low concentrations |
| Validation | Well described in the literature; standards available | Requires matrix/sample-specific adaptation |
| Field usability | Simple equipment; no power supply needed | Manual process; time-consuming |
| Measurement | Quick sample collection possible | No continuous monitoring; off-line analysis |
| Criteria | Strengths | Weaknesses |
|---|---|---|
| Sensitivity | Very high; meets EPA/EU reference levels (ppb) | – |
| Cost | - | Very high (purchase/maintenance) |
| Selectivity | Excellent for NO/NOx; reference method | Ozone interference; NO2 needs converters |
| Stability | Excellent in lab/stationary use | Challenging in field use; filters/ozone systems required |
| Precision | Excellent; reference-grade | – |
| Validation | Fully validated; meets EPA/EN norms | – |
| Field usability | Fully automated; continuous | Heavy, non-portable |
| Measurement | Automatic gas measurement | Requires drying and filtration systems |
| Criteria | Strengths | Weaknesses |
|---|---|---|
| Sensitivity | Very good (ppb–ppm), fast response | Sensor saturation at high levels |
| Cost | Low to moderate; compact devices | Sensor replacement cost; calibration needed |
| Selectivity | Improving with better electrodes and algorithms | Interference (e.g., SO2, CO); needs compensation |
| Stability | Good in the short to mid term | Drift and degradation under harsh conditions |
| Precision | Good after calibration | Requires frequent recalibration in the field |
| Validation | Factory/field validation, norm-compliant | Strongly affected by environmental conditions |
| Field usability | Highly convenient – portable sensors | Needs regular calibration/maintenance |
| Measurement | Real-time, direct gas detection | – |
| Criteria | Strengths | Weaknesses |
|---|---|---|
| Sensitivity | Very good (to ppb); wide range | High cost of advanced instruments |
| Cost | Medium (NDIR/UV–Vis); high (FTIR/GC) | Spare parts, service costs |
| Selectivity | Excellent; multi-gas capability (NDIR, FTIR, GC) | Background interferences (e.g., water vapor, CO2) |
| Stability | High after calibration | Requires regular maintenance |
| Precision | Very good with calibration | – |
| Validation | ISO/EPA standards; widely used | Needs environment-specific validation |
| Field usability | Portable versions in development | Advanced versions need trained operators |
| Measurement | Fast/continuous (NDIR, UV–Vis); offline (GC) | FTIR/GC mostly lab-based, less mobile |
| Parameter | Strengths | Weaknesses |
|---|---|---|
| Sensitivity | Very good (ppb–ppm), reference method | Analysis time typically in the order of tens of minutes; quasi-real-time possible but not continuous |
| Cost | Compatible with various detectors, standardized | High cost, requires carrier gases |
| Selectivity | Excellent for multi-component analysis | Time-consuming, less suitable for continuous online use |
| Stability | Excellent in lab conditions | Needs stable power, carrier gases, regular service |
| Precision | Very high after calibration | Column degradation possible in complex matrices |
| Validation | Easy via gas standards and protocols | Temperature/pressure fluctuations may require recalibration |
| Field usability | Low—lab-based, skilled operation required | Limited portability for mining/field environments |
| Measurement | Very selective with small samples | Sample collection and preparation may be time-consuming |
| Parameter | Strengths | Weaknesses |
|---|---|---|
| Sensitivity | Can detect very low (ppb/ppm) and high concentrations | Depends on scrubber efficiency and colorimetric reaction |
| Cost | Low to medium – analyzers and reagents affordable | Cost increases with automation or flow-integration |
| Selectivity | Good due to selective chemical reactions | Possible interferences from substances absorbing at same wavelength |
| Stability | Good post-calibration, long-term use possible | Reagents need regular replacement; scrubbers need cleaning |
| Precision | Very good with repeatable reactions and automation | Affected by dosing precision and reagent degradation |
| Validation | Easy using reference solutions, standard protocols | Limited validation for online/portable non-automated setups |
| Field usability | Available in lab/portable analyzers | Manual versions are time-consuming; reagent handling needed |
| Measurement | Automated (flow analyzers) or manual, multiparameter | Manual sampling may introduce measurement errors |
| Parameter | Strengths | Weaknesses |
|---|---|---|
| Sensitivity | Very high, detection down to ppb | May lose sensitivity in presence of water vapor and CO2 |
| Cost | Multi-gas capability justifies investment | High purchase and service costs |
| Selectivity | Spectral analysis allows simultaneous detection of many gases | Overlapping IR bands may complicate results, matrix calibration needed |
| Stability | Good after calibration, stable optical components | Requires cleanliness of optics (e.g., window contamination) |
| Precision | Very good, enables multipoint calibration | Environmental conditions may affect readings |
| Validation | International standards, easy auditability | Needs periodic calibration validation |
| Field usability | Portable versions available, fast analysis | Weight and power demand reduce mobility |
| Measurement | Direct, continuous measurement | Sample prep required under high dust conditions |
| Parameter | Strengths | Weaknesses |
|---|---|---|
| Sensitivity | Good (ppm), fast detection, continuous | Less sensitive than FTIR for low concentrations |
| Cost | Affordable, wide range of devices, low operation cost | Requires regular calibration and replacement of parts |
| Selectivity | Adequate for common gases (NO, NO2) | Interference from strong IR absorbers |
| Stability | Good, temperature-resistant | Gradual detector drift, optical contamination effects |
| Precision | High for medium/high concentrations | Average at very low concentrations |
| Validation | Standard procedures, in-house calibration easy | Mixed gas validation requires reference testing |
| Field usability | Portable versions, easy to use | Requires regular maintenance |
| Measurement | Direct, fast reading | Dust filtration needed in high-dust environments |
| Parameter | Strengths | Weaknesses |
|---|---|---|
| Sensitivity | High, ppb–ppm detection, fast response | May be affected by UV-absorbing species |
| Cost | Lower than FTIR, portable analyzers available | More expensive than electrochemical sensors |
| Selectivity | Very good for NO, NO2, can distinguish them | Potential interference under high dust or other UV-absorbing compounds |
| Stability | Stable across wide temperatures and conditions | Requires stable light sources and regular optics maintenance |
| Precision | Very high in continuous measurements | – |
| Validation | Accredited procedures, easy gas standard calibration | Must be validated against potential interferences |
| Field usability | Small, compact analyzers, fast installation | Sensitive to difficult optical conditions |
| Measurement | Direct, continuous, online monitoring possible | Periodic optics cleaning required |
| Method | Sensitivity | Selectivity | Cost | Mobility | Comment |
|---|---|---|---|---|---|
| UV–Vis | High | High | Low/Med | High | Balanced across all criteria. |
| NDIR/NDUV | Med/High | Good/Very good | Medium | Very high | Good for mobile use, IR/UV-sensitive. |
| FTIR | Very high | Very high | Very high | Low | Reference method; expensive, less field-suitable. |
| GC | Very high | Very high | Very high | Very low | Lab use only; not for the field. |
Disclaimer/Publisher’s Note: The statements, opinions and data contained in all publications are solely those of the individual author(s) and contributor(s) and not of MDPI and/or the editor(s). MDPI and/or the editor(s) disclaim responsibility for any injury to people or property resulting from any ideas, methods, instructions or products referred to in the content. |
© 2025 by the authors. Licensee MDPI, Basel, Switzerland. This article is an open access article distributed under the terms and conditions of the Creative Commons Attribution (CC BY) license (https://creativecommons.org/licenses/by/4.0/).
Share and Cite
Banasiewicz, A.; Janicka, A. Selection of a Universal Method for Measuring Nitrogen Oxides in Underground Mines: A Literature Review and SWOT Analysis. Atmosphere 2025, 16, 1051. https://doi.org/10.3390/atmos16091051
Banasiewicz A, Janicka A. Selection of a Universal Method for Measuring Nitrogen Oxides in Underground Mines: A Literature Review and SWOT Analysis. Atmosphere. 2025; 16(9):1051. https://doi.org/10.3390/atmos16091051
Chicago/Turabian StyleBanasiewicz, Aleksandra, and Anna Janicka. 2025. "Selection of a Universal Method for Measuring Nitrogen Oxides in Underground Mines: A Literature Review and SWOT Analysis" Atmosphere 16, no. 9: 1051. https://doi.org/10.3390/atmos16091051
APA StyleBanasiewicz, A., & Janicka, A. (2025). Selection of a Universal Method for Measuring Nitrogen Oxides in Underground Mines: A Literature Review and SWOT Analysis. Atmosphere, 16(9), 1051. https://doi.org/10.3390/atmos16091051


