Abstract
This study examines the ionospheric response to the intense geomagnetic storm of 9–12 October 2024 over the European sector. Digisonde data from mid-latitude European stations and in situ electron density measurements from Swarm A and B satellites were used to analyze variations in key ionospheric characteristics, including the critical frequency (foF2), peak height (hmF2) and plasma drift velocities. Significant uplift of the F2 layer and a corresponding reduction in foF2 were observed across latitudes, primarily driven by prompt penetration electric fields (PPEFs) and storm-induced thermospheric winds. Horizontal and vertical ion drifts showed large asymmetries and reversals, with zonal drift velocities exceeding 1000 m/s at some stations. Swarm observations confirmed plasma density enhancements during the main phase and notable depletions during recovery, particularly after 1:00 UT on 11 October. The midlatitude ionospheric trough (MIT) intensified during the recovery phase, as can be seen from Swarm B. These variations were shaped by electrodynamic forcing, compositional changes and disturbance dynamo electric fields (DDEFs). The results emphasize the role of solar wind drivers, latitude-dependent electrodynamic coupling and thermospheric dynamics in mid-latitude ionospheric variability during geomagnetic storms.
1. Introduction
Geomagnetic storms are major disturbances in Earth’s magnetosphere triggered by the transfer of energy from the solar wind into Earth’s space environment. These storms occur when fluctuations in the solar wind interact with the interplanetary magnetic field (IMF). This interaction leads to significant changes in the magnetospheric structure, affecting currents, plasma dynamics and the magnetic field configuration. The variability in the geospace environment is driven by energetic solar events, collectively known as solar transients. These include solar flares, coronal mass ejections (CMEs) and solar energetic particles, phenomena that stem from magnetic reconnection in the Sun’s corona [1,2]. Once released, the associated radiation and plasma propagate through space and reach Earth. Among these events, CMEs are particularly potent; when Earth-directed, they often generate strong interactions with the magnetosphere, frequently leading to intense geomagnetic activity [3,4]. Geomagnetic storms compress the magnetosphere, particularly through the polar regions, enhancing the ring current during the storm’s main phase, followed by its decay in the recovery phase [5]. The disturbance storm time index () is used to measure this variation and classify storms into three categories: intense ( nT), moderate ( nT) and weak ( nT) [5,6,7].
Solar activity drives space weather, affecting ionospheric variability. The solar wind velocity, density and IMF carried by the solar wind are key drivers of space weather dynamics [8]. When a coronal mass ejection (CME) reaches Earth’s space environment—often referred to as an ICME—it interacts with various magnetic structures, such as magnetic clouds (MCs), co-rotating interaction regions (CIRs) and combinations like SH + ICME and SH + MC. These interactions significantly impact the ionosphere, with noticeable fluctuations of ionospheric characteristics during geomagnetic storms [9]. The energy influx from these storms strongly ionizes the upper atmosphere, particularly the F2 layer, leading to an enhancement in electron density. The impact of geomagnetic storms on the ionospheric electron density differs depending on the latitude and altitude, exhibiting both enhancements and depletions [7,10,11].
Additionally, chemical and electrodynamic interactions within the ionosphere-thermosphere system at high latitudes lead to variations in the neutral composition and global thermospheric wind circulation. The increased energy input in these regions, driven by particle precipitation and the equatorward transport of thermospheric winds, influences the ionospheric conditions at middle and low latitudes. These changes alter the chemical composition and electrodynamic behavior, resulting in notable variations in plasma density and drift patterns [12,13,14].
The second-strongest superstorm of this solar cycle was observed on 10 October 2024, with a peak of −333 nT on 11 October 2024. Picanco et al. (2024) reported a reversed C-shaped ionospheric depletion band linking equatorial and auroral latitudes, with mid-latitude convergence of equatorial and polar irregularities driven by drift velocity enhancements and electric field asymmetries [15]. In a recent publication, Pierrard et al. (2025) reported a rapid rise and prolonged drop in ionospheric ionization observed through vertical total electron content and ionosonde data from Europe, the USA, and South Korea, with recovery beginning on the second day. This was driven by F-layer disturbances and severe plasmaspheric erosion, including a plasmapause below 2 during the October event [16]. Ram Singh et al. (2025) reported that this G5-class geomagnetic storm induced strong eastward electric fields and vertical plasma drifts, leading to an intensified equatorial ionization anomaly (EIA), poleward expansion of ionospheric irregularities and a rise in plasma bubbles up to an altitude of 1500 km [17]. A study by Oliveira et al. (2025) linked the unexpected early reentry of Starlink-1089—occurring 10 days earlier than predicted—to accelerated orbital decay likely caused by geomagnetic storm-induced atmospheric drag, emphasizing the vulnerability of LEO satellites to space weather during the October 2024 event [18]. Xia et al. (2025) reported that during the 10–12 October 2024 geomagnetic storm, field-aligned currents (FACs) and polar electrojets (PEJs) were more strongly influenced by the merging electric field () than in May 2024, with their intensity and latitude modulated by , solar wind pressure () and seasonal ionospheric conductivity [19].
This study investigates the ionospheric effects of the October 2024 geomagnetic storm, the second most intense of the current solar cycle, over the European sector. While a previous study by Pierrard et al. (2025) [16] examined this event over European latitudes, we significantly extend its scope by incorporating additional datasets, including the in situ electron density from Swarm satellites and ion drift velocities from European Digisondes. This integrated use of satellite- and ground-based observations enables a more detailed analysis of both vertical and horizontal ionospheric dynamics across a broader regional scale, offering new insights into mid-latitude storm-time responses not previously captured with this level of detail.
This article is structured as follows:
- Section 1 introduces the storm and reviews the existing literature.
- Section 2 outlines data sources and methodology.
- Section 3 details solar and geomagnetic activity.
- Section 4 presents the analysis results.
- Section 5 discusses the findings in terms of the physical drivers of ionospheric variability.
- Section 6 concludes with a summary of the key observations and implications.
2. Datasets and Methodology
This study utilizes hourly averaged measurements of key interplanetary parameters, including the solar wind speed (), dynamic pressure (), the component of the interplanetary electric field and the interplanetary magnetic field (IMF) component . It also incorporates geomagnetic indices such as , —which represent the strength of the horizontal component of Earth’s magnetic field in the equatorial plane, influenced by magnetospheric currents during geomagnetic activity—and the polar cap index (). All data were obtained from the OMNI Data Web platform (https://omniweb.gsfc.nasa.gov/form/omni_min.html (accessed on 20 March 2025)).
We investigated the temporal fluctuations of foF2 and hmF2 at eight European Digisonde stations selected based on their geomagnetic distribution, data continuity and quality, ensuring adequate spatial coverage during the event under study. The ionograms were obtained from the Digital Ionogram DataBase (DIDBase) of the Global Ionospheric Radio Observatory (GIRO) portal (http://giro.uml.edu, (accessed on 5 April 2025)). Unlike the autoscaling of ionograms, where software algorithms automatically extract parameters while having the chance for misinterpretation of ionograms, the ionograms were manually scaled in the present study to extract accurate foF2 and hmF2 values during the storm event. This approach avoids potential misinterpretations that often arise during disturbed ionospheric conditions, where autoscaling algorithms may fail to correctly capture the critical features of the ionogram. Based on prior studies, manual scaling can achieve an accuracy of ∼ for foF2 and ∼ for hmF2, which is essential for reliable analysis during storm-time conditions [20]. In this context, the high reliability and well-established accuracy of manual scaling render formal uncertainty estimates unnecessary for the analysis presented.
Additionally, we analyzed the in situ electron density () measurements from the Langmuir probes aboard Swarm A and B satellites, accessible via https://vires.services/, (accessed on 10 April 2025). The ESA Swarm mission consists of three identical satellites—Swarm A, B and C—in low-altitude polar orbits, which have been operational since 2014. The initial altitudes were approximately 465 km for Swarm A and C and 520 km for Swarm B, with orbital inclinations of 87.35° (Swarm A and C) and 87.75° (Swarm B). Although known uncertainties exist in the Swarm datasets, they are primarily associated with periods of low solar activity and regions at high or low latitudes, conditions not relevant to the present study [21].
For this analysis, vertical, eastward and northward plasma drift data derived from the GIRO were used to investigate the ionospheric response during the onset phase of the geomagnetic storm. Vertical drift variations reflect the influence of electric fields in the ionosphere, enabling us to distinguish between mechanisms such as PPEFs and disturbance dynamo effects. The eastward drift corresponds to the plasma convection toward the east driven by storm-induced electric fields, which alters ionospheric ionization patterns, whereas northward drift occurs due to the enhanced auroral electrojet during geomagnetic storms, shifting ionospheric plasma toward the poles, which influences ionospheric density and irregularities. The drift data have a temporal resolution of 5 min, and no explicit calibration or noise filtering procedures were applied, as these are automatically handled by the DriftExplorer tool (version 1.2.14) (https://ulcar.uml.edu/Drift-X.html (accessed on 23 April 2025)). The Direct Digisonde Drift Measurements (DDM) have been shown to demonstrate high stability and minimal error, as confirmed by Kouba et al. (2025) [22]. Consequently, the omission of explicit calibration or noise-filtering steps, as well as error bars, does not compromise the integrity of the drift analysis presented here. In addition to supporting real-time storm monitoring, GIRO drift measurements (https://giro.uml.edu/driftbase/ (accessed on 23 April 2025)) serve as valuable input for monitoring plasma convection.
3. Solar and Geomagnetic Activity in October 2024 Storm
On October 9, an X-class solar flare erupted from location N13W08 on the solar disc, and a westward halo coronal mass ejection (CME) originated, which was observed by SOHO/LASCO, traveling toward Earth at a speed of approximately 1435 km/s. Figure 1 displays the composite 6-day plots of the CME height-time and the geomagnetic storm index (), which are useful for indicating the CMEs, generating intense geomagnetic storms. These solar transients are observed at the same time and found to be associated as they erupted from the same location. Such solar transients are usually found to be geoeffective and are presented in Figure 1. This image was downloaded from https://cdaw.gsfc.nasa.gov/CME_list/daily_plots/dsthtx/2024_10/dsthtx_20241008.html (accessed on 20 March 2025).
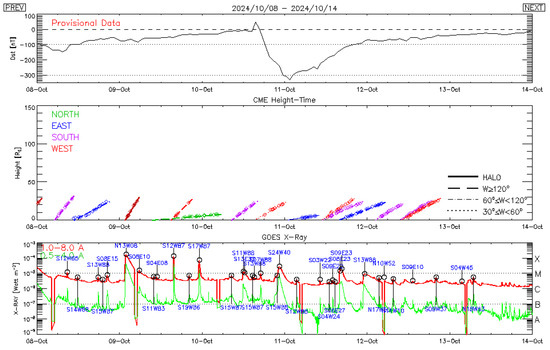
Figure 1.
Composite 6-day plots of the CME height-time and geomagnetic storm index (), highlighting CMEs driving intense geomagnetic storms.
The CME reached Earth on 10 October 2024 at approximately 15:00 UT. This suggests an average speed of about 1200 km/s as it traveled to 1 AU.
Figure 2 displays the time evolution of various interplanetary parameters between October 10 and 12 2024: the index, SYM-H, electric field (mV/m), flow pressure (nPa), solar wind velocity (km/s), IMF () component (nT), IMF magnetic field (nT) and polar cap index. The component of the interplanetary magnetic field (IMF) remained relatively stable, being close to zero nT between 00:00 and 12:00 UT on October 10. After a brief period of negative values early that day, it gradually increased to about 10 nT. The Interplanetary Coronal Mass Ejection (ICME) reached Earth at 15:14 UT on October 10. Upon its arrival, the ICME deposited energy into Earth’s magnetosphere, leading to the onset of a geomagnetic storm [23]. The CME shock impacted the magnetosphere triggering a sudden storm commencement (SSC), represented by the orange vertical line in Figure 2.
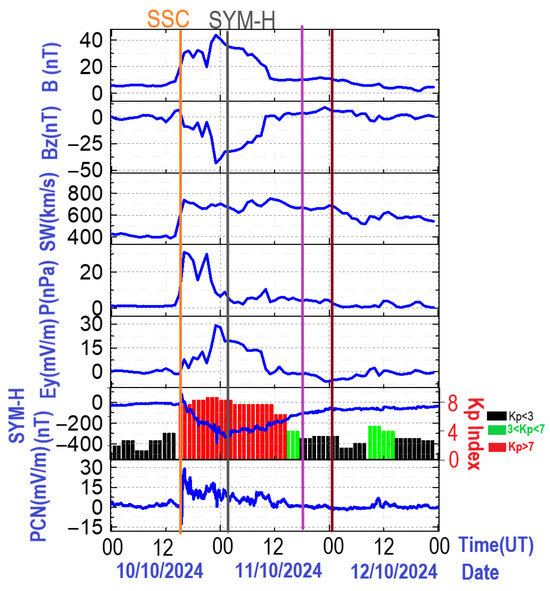
Figure 2.
Geomagnetic conditions during 10–12 October 2024 depicted in terms of (a) total magnitude B of IMF, (b) Bz component of IMF, (c) solar wind (SW) speed, (d) solar wind pressure, (e) interplanetary electric field (IEF) Ey, (f) SYM-H and Kp index and (g) polar cap index (PCN). The orange vertical lines represent the SSC, the black vertical line denotes the time of the SYM-H index minima during the storm, and the purple vertical line represents the end of the recovery phase of the geomagnetic storm.
Following the SSC on October 10, the solar wind velocity rapidly increased from 400 km/s to nearly 800 km/s (Figure 2). Both the pressure and the IMF component exhibited distinct two-step variations. During the time between these peaks, the solar wind velocity briefly increased from 700 to 800 km/s, indicating the arrival of a secondary solar wind structure from the Sun’s active region, further disturbing the interplanetary environment [24,25,26]. Similarly, the IMF component recorded two notable minima— at 16:00 UT and at 22:00 UT—separated by fluctuations of approximately . The black vertical line in Figure 2 denotes the time of the SYM-H index minima during the storm and the start of the recovery phase around 1:00 UT on 11 October. The index gradually decreased after the second peak in IMF , decreasing from to , classifying the event as extreme, as per Gonzalez’s (1994) classification [5]. The recovery lasted until 9:00 UT on October 13 (Figure 1), when the reached , which was less than 10% of the minimum value recorded during the storm’s main phase, marking the termination of the storm, as per the classification criteria of Kamide et al. (1998) [27]. This storm was the second most intense event of solar cycle 25, following only the Mother’s Day storm of 10–12 May 2024, which reached a value of [16,28,29]. To complement the analysis of geomagnetic storm intensity, the Kp index was examined as an additional measure of global geomagnetic disturbance (Figure 2). The Kp index quantifies geomagnetic activity on a quasi-logarithmic scale from 0 (quiet) to 9 (extremely disturbed) based on 3-h intervals of geomagnetic variation observed at mid-latitude stations. During the period of 10–11 October 2024, the Kp index revealed a significant increase in geomagnetic activity consistent with the storm’s peak phase. In Figure 2, the index is categorized and displayed using a color-coded histogram, where black bars represent quiet conditions , green indicates moderate activity and red highlights severe geomagnetic disturbances , illustrating the storm’s temporal evolution and intensity distribution across the event window. The polar cap index (PCN), developed by the International Association of Geomagnetism and Aeronomy (IAGA) and derived from 15-min magnetic averages at Thule (Qaanaaq), Greenland, monitors geomagnetic activity in the Northern Hemisphere’s polar region. Sensitive to solar wind parameters such as the IMF , and velocity, the PCN effectively tracks polar magnetic variations [30,31]. As shown in Figure 2, the PCN trends aligned closely with the Kp index during storm conditions, with sharp increases observed when , indicating intensified auroral electrojet activity from interplanetary shocks.
4. Results
As the second-largest storm of solar cycle 25, the October 2024 geomagnetic event stands out for its intensity and distinctive characteristics. Unlike the May storm, which was driven by a series of multiple coronal mass ejections (CMEs) over the course of a day, the October storm was triggered by a single CME. As a result, the May storm generated prolonged strong currents, while the October event, despite reaching a comparable peak intensity, subsided more quickly. Preliminary geomagnetic indices suggest that both the 10 May and 10 October 2024 storms rank among the most intense storms in recent years, surpassed only by the notorious Halloween storms of 2003. In this section, we provide a detailed analysis of the October 2024 storm, with a specific focus on its impact in the European sector, examining its ionospheric disturbance effects.
4.1. Ionospheric Effects over the European Sector
This section presents an analysis of the ionospheric response to the geomagnetic storm in the European sector. The key characteristics examined include the foF2, hmF2 and ion drift velocity. Variations in foF2 and hmF2 were extracted from manually scaled ionograms from Digisonde stations.
Figure 3 shows the geographic locations of the European Digisonde stations used in this study. These stations provide spatial coverage essential for analyzing the latitudinal and longitudinal ionospheric variations during storm-time conditions.
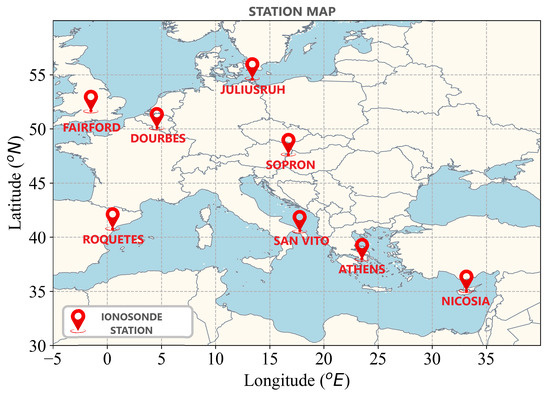
Figure 3.
Geographic locations of European Digisonde stations used in this study. The stations span mid-latitude regions from 30° N to 60° N latitude and from 5° W to 40° E longitude.
During the geomagnetic storm of 9–12 October 2024, the ionospheric response at European stations exhibited clear latitudinal differences, with both the northern (Fairford, Dourbes, Juliusruh and Sopron, located above 45° N) and southern (Roquetes, San Vito, Athens and Nicosia, located below 45° N) stations exhibiting broadly similar behaviors but with notable differences in magnitude, especially during the recovery phase.
For the northern European stations (Figure 4), a distinct storm-time response was observed, characterized by a pronounced increase in the peak height of the F2 layer (hmF2) (from 400–500 km to ∼650 km at Fairford, ∼700 km at Dourbes, ∼610 km at Juliusruh and ∼610 km at Sopron) and a simultaneous decrease in its critical frequency (foF2) around the storm’s peak on 11 October (from ∼12 MHz to ∼5 MHz at Fairford, from ∼12 MHz to ∼5 MHz at Dourbes, from ∼10 MHz to ∼6 MHz at Juliusruh and from ∼12 MHz to ∼6 MHz at Sopron). This behavior is consistent with enhanced vertical plasma transport, likely driven by storm-induced thermospheric winds and electric fields, leading to an uplift of the F2 layer. The upward motion reduces the plasma density at higher altitudes, thereby lowering foF2. These changes were especially prominent at the higher-latitude stations, underscoring the greater sensitivity of the northern ionosphere to storm-time electrodynamic forcing.
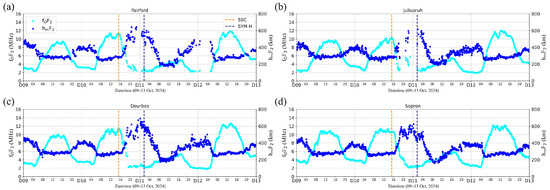
Figure 4.
Temporal variations in the critical frequency () and the peak height () of the F2 layer over multiple Digisonde stations located in Northern Europe (above 45° N latitude): (a) Fairford; (b) Juliusruh; (c) Dourbes; (d) Sopron. The orange vertical lines represent the SSC, and the black vertical line denotes the time of the SYM-H index minimum during the storm.
The southern European stations (Figure 5) exhibited a comparable response during the same period, with a rise in hmF2 (from 400–500 km to ∼650 km at Roquetes, ∼650 km at San Vito, ∼590 km at Athens and ∼630 at Nicosia) and a reduction in foF2 observed near the minimum of the index on 11 October (from ∼13 MHz to ∼6 MHz at Roquetes, from ∼13 MHz to ∼8 MHz at San Vito, from ∼13 MHz to ∼8 MHz at Athens and from ∼14 MHz to ∼11 MHz at Nicosia). This similarity suggests that a common physical mechanism—namely vertical uplift of the F2 layer due to storm-time thermospheric and electrodynamic forcing—was at play across both latitudinal regions. However, during the recovery phase, a comparatively lower hmF2 value was noted at the southern stations, indicating a reduced persistence or intensity of the uplift. This contrast may be attributed to latitudinal differences in thermosphere-ionosphere coupling processes, which modulate the magnitude and duration of storm-induced perturbations.
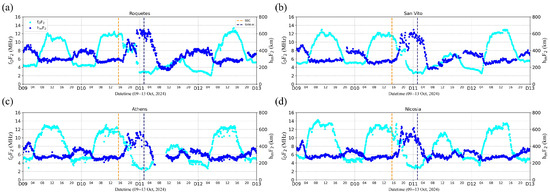
Figure 5.
Temporal variations in the critical frequency () and peak height () of the F2 layer over multiple Digisonde stations located in Southern Europe (located below 45° N latitude): (a) Roquetes; (b) SanVito; (c) Athens; (d) Nicosia. The orange vertical lines represent the SSC, and the black vertical line denotes the time of the SYM-H index minima during the storm.
In summary, while both northern and southern European regions responded similarly to the storm’s main phase, the northern stations experienced stronger and more prolonged ionospheric disturbances, which is particularly evident in the elevated hmF2 values during the recovery phase.
Using data from multiple Digisonde stations across Europe, we analyzed storm-induced ion drifts, with Figure 6, Figure 7 and Figure 8 displaying the north-south (Vx), east-west (Vy) and vertical (Vz) drift velocities, respectively.
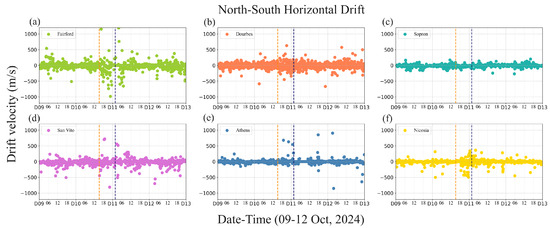
Figure 6.
North–south ionospheric horizontal drift over Europe, showing meridional plasma convection patterns influenced by geomagnetic conditions, at: (a) Fairford; (b) Dourbes; (c) Sopron; (d) San Vito; (e) Athens; (f) Nicosia. The orange vertical lines represent the SSC, and the black vertical line denotes the time of the SYM-H index minimum during the storm.
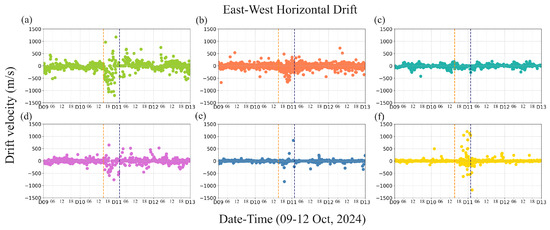
Figure 7.
East–west horizontal drift over Europe, illustrating zonal plasma convection shaped by electrodynamic and thermospheric processes, at: (a) Fairford; (b) Dourbes; (c) Sopron; (d) San Vito; (e) Athens; (f) Nicosia. The orange vertical lines represent the SSC, and the black vertical line denotes the time of the SYM-H index minimum during the storm.
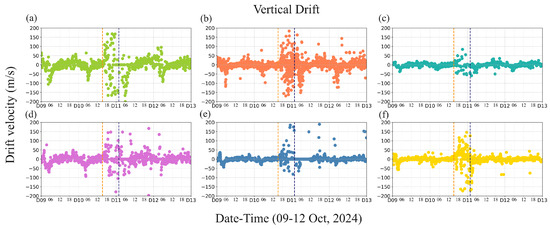
Figure 8.
Vertical ionospheric drift over Europe, indicating upward and downward plasma motion influenced by electric fields and neutral wind dynamics, at: (a) Fairford; (b) Dourbes; (c) Sopron; (d) San Vito; (e) Athens; (f) Nicosia. The orange vertical lines represent the SSC, and the black vertical line denotes the time of the SYM-H index minimum during the storm.
Strong ionospheric responses in terms of drift in the north-south direction were observed at various sites, particularly during key storm drivers such as IMF excursions and the SYM-H minimum (Figure 6). At Fairford, a prominent northward drift of ∼1000 m/s was recorded, whereas immediately after the SSC, a southward drift of ∼1000 m/s was observed, indicating notable north-south asymmetry. Dourbes recorded a northward drift of ∼500 m/s at 19:00 UT on October 10, followed by a southward drift of ∼650 m/s at 22:00 UT on the same day. No prominent drift motion was recorded at Sopron during the main or recovery phases of the storm. At San Vito, a northward drift of ∼700 m/s and a southward drift of ∼750 m/s were recorded during the main phase, reflecting the dynamic behavior of the ionosphere during the storm. At Athens, a southward drift of ∼700 m/s was recorded during the main phase of the storm. Nicosia showed a northward drift of ∼500 m/s, followed by a southward drift of ∼300 m/s, aligning closely with the minimum. These north-south drifts emphasize the influence of disturbance dynamo effects and PPEFs during geomagnetic storms, driving significant asymmetry in ionospheric convection.
The east-west ion drifts exhibited extreme fluctuations, with large reversals and rapid changes in drift velocity (Figure 7). Fairford recorded a rather strong westward drift of ∼1000 m/s at 17:00 UT, following the first minimum, and an eastward drift of ∼1200 m/s at 23:00 UT around the peak SYM-H. Dourbes showed a strong eastward drift of ∼500 m/s at 21:00 UT on October 10, coinciding with the second southward IMF turning. No prominent drift motion was recorded at Sopron during the main or recovery phases of the storm, even for the east-west horizontal drift. At San Vito, a westward drift of ∼700 m/s and a southward drift of ∼750 m/s were recorded during the main phase, reflecting the dynamic behavior of the ionosphere during the storm. At Athens, eastward drifts of ∼800 m/s and a westward drift were observed, though more pronounced east-west drifts were noted at other sites. Nicosia experienced intense westward drifts of nearly ∼1200 m/s, reflecting strong local electric field activity. These rapid reversals in east-west drifts suggest strong geomagnetic influences and electric field variations that rapidly change ionospheric flow, particularly during storm peaks and recovery phases.
The vertical plasma drifts exhibited substantial changes throughout the storm, particularly during the main and early recovery phases (Figure 8). At Fairford, a sharp upward vertical drift of ∼200 m/s was observed at 23:00 UT on October 10, coinciding with intense magnetospheric driving and prompt electric field penetration, followed by a downward drift of ∼150 m/s and a more prominent downward drift during the recovery phase. Similar trends were seen at other stations; Dourbes recorded fluctuating vertical drifts, including a maximum upward drift of ∼200 m/s at 21:00 UT and a downward drift of ∼160 m/s at 23:00 UT on October 10. Sopron recorded a vertical drift of ∼100 m/s upward and ∼50 m/s downward during the main phase of the storm. San Vito exhibited an upward drift of ∼150 m/s at 20:00 UT and a downward drift of ∼200 m/s at 23:00 UT on 10 October. At Athens, a sharp upward vertical drift of ∼200 m/s was observed at 23:00 UT on October 10, coinciding with intense magnetospheric driving and prompt electric field penetration. Over Nicosia, upward (∼150 m/s) and downward (∼200 m/s) vertical drifts were found, consistent with the storm’s progression. These vertical drift changes indicate the strong sensitivity of the ionosphere to external magnetospheric inputs, including prompt electric fields and disturbance dynamo effects, during geomagnetic storms.
Summarizing the above observations on north-south horizontal drift, east-west horizontal drift, and vertical drift, it was observed that the maximum drift of ∼1000 m/s was recorded at Fairford, a Northern European station at N latitude and E longitude during the main phase of the storm. The maximum east-west horizontal drift of ∼1000 m/s was observed just after the SSC at Fairford, whereas the maximum drift of ∼1000 m/s was observed at the SYM-H minima at Nicosia, which is located at N and E. A similar pattern for vertical drift was observed at all European stations under consideration, with a maximum drift of ∼200 m/s during the storm. These observations collectively underscore the dynamic and fluctuating ionospheric drifts observed during the storm, particularly in the north-south, east-west and vertical directions. The data highlight the significant influence of external magnetospheric factors such as IMF excursions and SYM-H minima, which drive the ionospheric response during geomagnetic storms. The timing and magnitude of these drifts reflect the ionospheric complex behavior, influenced by prompt electric field penetration, disturbance dynamo effects and strong geomagnetic activity.
Summarizing the observed ionospheric responses in the north-south, east-west, and vertical drift components, it is evident that the ionosphere exhibited highly dynamic behavior across the studied European stations during the geomagnetic storm. The most prominent horizontal drift in the north-south direction, reaching up to ∼1000 m/s, was recorded at Fairford ( N latitude, E longitude) during the storm’s main phase. A similarly strong east-west drift of ∼1000 m/s was also recorded at Fairford shortly after the storm sudden commencement (SSC), indicating the rapid onset of electric field penetration into the ionosphere. Notably, the highest east-west drift velocity of ∼1200 m/s occurred at Nicosia ( N latitude, E longitude) around the SYM-H minimum, suggesting intensified electric field activity at lower latitudes during peak geomagnetic disturbance. The vertical plasma drifts exhibited consistent signatures across all stations, with maximum upward drifts of ∼200 m/s observed during the main or early recovery phases of the storm. These vertical enhancements were often followed by significant downward drifts, indicating strong modulation of plasma transport in response to magnetospheric inputs. The temporal alignment of these vertical drifts with sharp IMF excursions and SYM-H variations further underscores the ionosphere’s sensitivity to storm-time electric fields and the coupling processes between the magnetosphere and ionosphere. Collectively, these observations reveal a highly responsive and asymmetric ionospheric system during geomagnetic storms, driven by complex interactions involving prompt penetration electric fields (PPEFs), disturbance dynamo effects and geomagnetic forcing. The variability in both drift direction and magnitude across different latitudes reflects the spatial and temporal complexity of ionospheric electrodynamics during disturbed space weather conditions. This suggests that the early storm-time drifts, particularly the intensification of the east-west drifts observed shortly after SSC, are predominantly driven by PPEFs, whereas the sustained vertical drift enhancements and subsequent reversals during the recovery phase point to the increasing influence of DDEFs. The drift differences between the northern and southern European stations further reflect the differential coupling efficiency of these drivers across mid- and low-latitude regions.
4.2. Storm Effects on Swarm Electron Density
In the previous section, storm-induced variations in foF2, hmF2 and ionospheric drifts were analyzed using data from Digisonde stations in the European sector. To achieve broader latitudinal coverage across Europe, this section utilizes in situ electron density () measurements from Swarm A and B satellites. The Swarm observations are presented in Figure 9, which shows the satellite tracks during quiet and disturbed intervals.
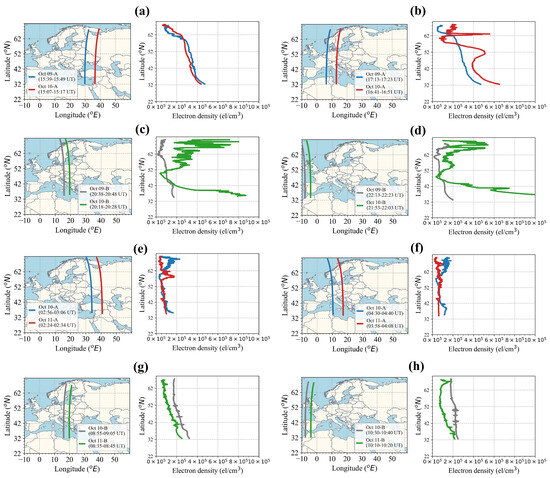
Figure 9.
Ten-minute tracks of Swarm . Swarm A is represented by red (disturbed times) and blue (quiet times) tracks, while Swarm B is represented by green (disturbed) and grey (quiet) tracks. (a) Swarm A: Quiet = Oct 9 (15:39–15:49 UT), Disturbed = Oct 10 (15:07–15:17 UT). (b) Swarm A: Quiet = Oct 9 (17:13–17:23 UT), Disturbed = Oct 10 (16:41–16:51 UT). (c) Swarm B: Quiet = Oct 9 (20:38–20:48 UT), Disturbed = Oct 10 (20:18–20:28 UT). (d) Swarm B: Quiet = Oct 9 (22:13–22:23 UT), Disturbed = Oct 10 (21:53–22:03 UT). (e) Swarm A: Quiet = Oct 10 (2:56–3:06 UT), Disturbed = Oct 11 (2:24–2:34 UT). (f) Swarm A: Quiet = Oct 10 (4:30–4:40 UT), Disturbed = Oct 11 (3:58–4:08 UT). (g) Swarm B: Quiet = Oct 10 (8:55–9:05 UT), Disturbed = Oct 11 (8:35–8:45 UT). (h) Swarm B: Quiet = Oct 10 (10:30–10:40 UT), Disturbed = Oct 11 (10:10–10:20 UT).
To complement the figure and provide a clearer overview of the time intervals and geographic coverage of each satellite pass, the corresponding details are summarized in Table 1.

Table 1.
Details of Swarm satellite passes shown in Figure 9, including time intervals and geographic coverage.
Ram Singh et al. (2025) [17], in their recent study, used Swarm data to examine the spatial extent of the ionospheric plasma density and irregularities over the American sector during the October 2024 geomagnetic storm. Pierrard et al. (2025) [16] used Swarm satellite data to derive a midnight plasmapause proxy based on magnetic and plasma observations collected between 9 and 12 October 2024. Xia et al. (2025) [19] investigated the temporal and spatial variations of field-aligned currents (FACs) and polar electrojets (PEJs) during the geomagnetic storms of 10–12 October 2024, where FACs were derived from vector magnetic field measurements by Swarms A and C and PEJs were calculated using scalar magnetic field data from Swarms A and B.
Figure 9 summarizes the observations between 32° and 72° latitude during 9–11 October 2025, showing 10-min European Swarm (electron density) variations under quiet and disturbed geomagnetic conditions, along with the corresponding satellite tracks. This figure shows a trough appearing near N on the 9th, following a depletion region around N on the 10th. From the Swarm data, it can be inferred that the higher-latitude trough moved poleward between the 9th and 11th. At 15:14 UT on 10 October, a sudden storm commencement (SSC) marked the onset of geomagnetic activity. During the initial phase of the storm, Swarm A recorded a notable enhancement in electron density () of approximately electrons/cm3 around 16:50 UT (Figure 9b), while Swarm B recorded a stronger enhancement of about electrons/cm3 near 20:20 UT (Figure 9c), with both recorded over the European sector. Swarm B subsequently recorded a peak value of approximately electrons/cm3 around the time of the minimum SYM-H, indicating a possible response to enhanced vertical plasma drifts driven by PPEFs or neutral wind surges. These electrodynamic processes can uplift the F2 layer, increasing both the hmF2 and electron density, particularly at middle latitudes during storm-time conditions. Starting after 1:00 UT on 11 October, during the recovery phase, Swarm A recorded electron density levels comparable to those typically seen during quiet-time conditions. In contrast, Swarm B recorded a significant depletion in electron density (Figure 9g,h), which may be attributed to storm-time compositional changes (e.g., increased N2/O ratio), ionospheric recombination or subsidence of the ionosphere due to westward disturbance dynamo electric fields (DDEFs). The observed differences in electron density responses between Swarm A and B resulted from their distinct orbital tracks and the fact that measurements were taken on consecutive days at the same universal time. This timing difference corresponds to varying ionospheric conditions, reflecting quiet versus disturbed geomagnetic states. Consequently, the spatial-temporal offset, combined with changes in geomagnetic activity across consecutive days, contributes to the variations observed, as accounted for in our analysis. These mechanisms generally lead to a reduction in plasma content during the recovery phase of geomagnetic storms.
5. Discussion
Regarding solar transients, solar flares and CMEs discharge large amounts of energy and charged particles into space. When these particles reach Earth and interact with its magnetosphere, they can cause intense geomagnetic storms, often called superstorms [32]. Over the past 30 years, encompassing solar cycles 22–24, researchers have investigated many of these superstorms to better understand their influence on the ionosphere-thermosphere (IT) system [33].
Geomagnetic storms transfer considerable energy into the upper atmosphere, causing significant changes in thermospheric wind patterns and neutral composition. These atmospheric changes lead to substantial ionospheric disturbances. Among the primary responses are increased electron densities on the dayside driven by intense PPEFs linked to strong southward interplanetary magnetic fields [34], along with extreme F2-layer uplifts—sometimes surpassing 800 km—which can result in severe plasma depletion [35]. The extreme depletion was observed for foF2, which was found to be directly connected to the equatorward displacement of the mid-latitude ionospheric trough (MIT) on the nightside [36,37,38].
This study explored the global ionospheric response to the October 2024 storm, focusing on three major observations discussed in Section 4.
Analysis of the European mid-latitude ionosphere revealed clear storm-time disturbances in both the foF2 and hmF2. Across all stations, a consistent pattern emerged during the main phase, namely a significant F-layer uplift and a concurrent reduction in foF2. Mosna et al. (2024) [39] reported similar foF2 suppression patterns during the March and April 2023 storms, with reductions of up to 60% at the middle latitudes lasting up to two days. These changes are physically linked to enhanced vertical plasma transport, primarily driven by PPEFs and storm-induced thermospheric winds. As plasma is lifted to higher altitudes, where the neutral density is lower, recombination rates decrease, resulting in a reduced electron concentration at the F2 peak. Consequently, the observed decrease in foF2 is a direct result of plasma redistribution rather than a net loss of ionization. These interpretations are consistent with previous observational studies [40], which associate storm-time F-layer uplifts and foF2 reductions with vertical plasma drifts induced by prompt penetration electric fields. The mechanisms discussed here are supported by observational evidence from this study, aligning well with the established understanding typically reinforced through both observations and modeling.
Latitudinal differences became more apparent during the storm’s recovery phase. Stations located above 45° N, such as those in Fairford and Juliusruh, exhibited more prolonged and pronounced uplifts in hmF2 compared with southern stations like those in Athens or Nicosia. This is consistent with the stronger storm-time electrodynamic forcing at higher latitudes, where the interplay of disturbance dynamo electric fields (DDEFs) and subauroral polarization fields associated with SAID signatures is more pronounced, facilitated by steep magnetic field inclinations and proximity to auroral regions. In contrast, lower-latitude regions, being further from the auroral electrojet and polar cap convection zones, tend to experience faster recovery and less intense electrodynamic forcing.
In addition to layer height and density changes, storm-time ionospheric dynamics were evident in the horizontal and vertical plasma drift patterns. The north-south drifts showed significant variability, with speeds reaching m/s at some locations. These intensifications in the plasma drifts were largely driven by the superposition of prompt penetration electric fields (PPEFs), which dominated during the main phase of storm, and disturbance dynamo electric fields (DDEFs), which emerged during the recovery phase. The variability in drift direction and speed reflects the time-dependent and spatially varying interplay between these two processes. The east-west drifts were even more dynamic, with sharp reversals and velocities exceeding m/s, particularly near transitions in the IMF . These fast westward flows are consistent with SAID signatures, which result from storm-time ion injections. The polarization electric field that develops between the inner edge of the ring current and the plasma sheet electrons contributes significantly to these westward drifts [41]. This field, as described by Southwood and Wolf (1978) [42], was mapped into the subauroral ionosphere, whcih was further modulated by magnetospheric convection changes associated with substorm activity. These observations illustrate the reconfiguration of the high-latitude electric field system, often intensified by strong PPEF inputs under southward IMF conditions. Vertical plasma drifts further support the presence of strong electrodynamic forcing. During the main phase, upward drifts over 200 m/s aligned with the enhanced eastward PPEF, driving uplift via convection. This is consistent with the observed F2-layer uplift. In contrast, the recovery phase featured downward drifts, attributed to the westward DDEF, which reduced the F-layer heights and densities. This transition highlights a clear temporal evolution in the electric field regime, where PPEF effects waned and DDEF effects began to dominate. Overall, the drift measurements provide critical insight into the time-varying dominance of PPEFs versus DDEFs and their role in reshaping ionospheric structure during geomagnetic storms. These patterns emphasize the complex electrodynamic interplay driving storm-time ionospheric behavior.
Complementary measurements from Swarm satellites provided a broader latitudinal context and high-resolution data on the electron density (Ne). During the period of 9–11 October 2025, they offered clear evidence of the presence and storm-time evolution of the MIT, as inferred from variations in the electron density profiles. Before the onset of geomagnetic activity, both Swarm A and B recorded distributions typical of quiet-time conditions, with a subtle mid-latitude depletion likely corresponding to the background MIT structure. During the storm’s main phase, both Swarm A and Swarm B recorded substantial increases in Ne, particularly around the time of the minimum. These enhancements are physically attributed to uplifted plasma layers and reduced recombination at higher altitudes, again driven by PPEFs and enhanced neutral wind surges. Notably, Swarm B recorded peak densities of about electrons/cm3, confirming significant ionospheric restructuring even at the middle latitudes.
Following the SSC at 15:14 UT on 10 October, both satellites recorded significant enhancements in at the middle latitudes, with peak values reaching up to electrons/cm3. These enhancements are consistent with known ionospheric responses to storm-time electric fields and thermospheric winds, specifically the uplift of the F2 layer, as is also evident in the present analysis of European mid-latitude ionospheric storm-time disturbances. Clear changes were observed in both foF2 and hmF2 across all stations, showing a consistent pattern of F2-layer uplift commonly associated with PPEFs and storm-induced neutral wind surges. This uplift likely displaced or temporarily obscured the MIT structure during the storm’s main phase.
In the subsequent recovery phase, particularly after 1:00 UT on 11 October, the two satellites recorded markedly different signatures. Swarm A, passing through a relatively undisturbed region, recorded a return to near-baseline values. In contrast, Swarm B recorded a pronounced electron density depletion at the middle latitudes, which is indicative of MIT reformation [43]. These depletions are consistent with established post-storm mechanisms such as enhanced recombination due to increased thermospheric N2/O ratios and plasma subsidence, which are often attributed to DDEFs. Although these mechanisms are not directly measured in this dataset, their inferred effects are evident in the observed reductions.
Moreover, the spatial characteristics of the trough observed by Swarm B aligned with previous findings that link MIT formation and equatorward displacement to storm-time auroral dynamics. Specifically, the equatorward expansion of the auroral oval, driven by enhanced particle precipitation during geomagnetic storms, is known to shift the MIT toward lower latitudes [44]. Additionally, elongated trough structures at high middle latitudes have been attributed to enhanced recombination associated with subauroral convection flows equatorward from the SAID regions [45,46]. Although not directly observed here, the pronounced depletion is suggestive of such processes. Furthermore, the role of SAIDs in triggering trough formation during disturbed conditions has been well documented and provides further interpretive context for the patterns observed in the Swarm B data [47].
Together, these observations reveal the localized and highly variable nature of the ionospheric response to geomagnetic disturbances, as captured solely through electron density measurements. The divergence between Swarms A and B further underscores the value of multi-point observations in capturing spatial gradients and structural features like MIT.
Overall, the findings presented here align with well-established patterns of ionospheric storm responses. The observed uplift of the F2 layer, drift reversals and plasma density fluctuations are consistent with the effects of rapid changes in magnetospheric convection and energy deposition from a solar wind. Latitudinal differences in storm impact further underscore the importance of magnetic geometry in determining ionospheric sensitivity. Collectively, these observations provide a comprehensive view of storm-time ionospheric dynamics, demonstrating the critical role of electric field penetration, thermospheric winds and magnetospheric forcing.
6. Conclusions
Based on the detailed analysis of the October 2024 geomagnetic storm, the following key findings highlight the nature of storm-induced ionospheric variability over the European sector:
- Nature of Solar Driver and Electrodynamic Coupling: Variability is strongly governed by the nature of the solar driver, latitude-dependent electrodynamic coupling and the interplay between electric fields and thermospheric winds.
- Main Phase Dynamics: The observed uplift of the F2 layer, coupled with pronounced drift reversals and plasma density enhancements during the main phase, underscores the critical roles of prompt penetration electric fields (PPEFs) and magnetospheric energy input. These enhancements were particularly pronounced during the storm’s peak, further highlighting the complex dynamics at play.
- Recovery Phase Disparities: The subsequent recovery phase revealed significant latitudinal disparities, influenced by varying thermosphere–ionosphere interactions, compositional changes and the displacement of the mid-latitude ionospheric trough (MIT).
Digisonde data and Swarm observations provide a coherent and physically consistent picture of the mid-latitude ionospheric response, contributing valuable insights toward modeling and forecasting ionospheric behavior during extreme space weather events. These findings suggest potential implications for understanding GNSS signal variability and satellite drag effects, which could help inform operational strategies and improve the reliability of satellite-based navigation and communication systems during future geomagnetic storms. The interpretations presented in this study are based solely on observational data. Incorporation of first-principles models and data assimilation approaches could further strengthen these findings, and this will be considered in future work.
Author Contributions
Conceptualization, S.C.T. and H.H.; methodology, T.B.; software, T.B.; validation, S.C.T. and H.H.; formal analysis T.B.; investigation S.C.T. and H.H.; resources, H.H. and T.B.; data curation, H.H. and T.B.; writing—original draft preparation, S.C.T.; writing—review and editing, S.C.T., H.H. and T.B.; visualization, T.B.; supervision, H.H.; project administration H.H. All authors have read and agreed to the published version of the manuscript.
Funding
This research received no external funding.
Data Availability Statement
All data used in this study are publicly available. Interplanetary parameters (, , and IMF ) and geomagnetic indices (, and ) were obtained from the OMNI Data Web (https://omniweb.gsfc.nasa.gov/form/omni_min.html (accessed on 20 March 2025)). Ionospheric parameters (foF2 and hmF2) were derived from manually scaled ionograms via the GIRO DIDBase (http://giro.uml.edu (accessed on 5 April 2025)). Swarm A and B electron density () data were accessed through the ESA Swarm portal (https://vires.services/ (accessed on 10 April 2025)). Plasma drift data (vertical, eastward and northward) were obtained from the GIRO Drift Database (https://giro.uml.edu/driftbase/ (accessed on 23 April 2025)).
Conflicts of Interest
Author Trisani Biswas is employed by the company GeoImaging Ltd. The remaining authors declare that the research was conducted in the absence of any commercial or financial relationships that could be construed as a potential conflict of interest.
Abbreviations
The following abbreviations are used in this manuscript:
| IMF | Interplanetary magnetic field |
| CME | Coronal mass ejection |
| ICME | Interplanetary coronal mass ejection |
| MC | Magnetic cloud |
| CIR | Co-rotating interaction region |
| SH | Sheath |
| TEC | Total electron content |
| FAC | Field-aligned current |
| PEJ | Polar electrojets |
| LEO | Low Earth orbit |
| EIA | Equatorial ionization anomaly |
References
- Kiplinger, A.L. Comparative Studies of Hard X-Ray Spectral Evolution in Solar Flares with High-Energy Proton Events Observed at Earth. Astrophys. J. 1995, 453, 973. [Google Scholar] [CrossRef]
- Tripathi, S.C.; Khan, P.A.; Aslam, A.M.; Gwal, A.K.; Purohit, P.K.; Jain, R. Investigation on spectral behavior of Solar transients and their interrelationship. Astrophys. Space Sci. 2013, 347, 227–233. [Google Scholar] [CrossRef]
- Richardson, I.G.; Cane, H.V. Solar wind drivers of geomagnetic storms during more than four solar cycles. J. Space Weather Space Clim. 2012, 2, A01. [Google Scholar] [CrossRef]
- Khan, P.A.; Tripathi, S.C.; Troshichev, O.A.; Waheed, M.A.; Aslam, A.M.; Gwal, A.K. Solar transients disturbing the terrestrial magnetic environment at higher latitudes. Astrophys. Space Sci. 2014, 349, 647–656. [Google Scholar] [CrossRef][Green Version]
- Gonzalez, W.D.; Joselyn, J.A.; Kamide, Y.; Kroehl, H.W.; Rostoker, G.; Tsurutani, B.T.; Vasyliunas, V.M. What is a geomagnetic storm? J. Geophys. Res. Space Phys. 1994, 99, 5771–5792. [Google Scholar] [CrossRef]
- Wei, Y.; Zhao, B.; Li, G.; Wan, W. Electric field penetration into Earth’s ionosphere: A brief review for 2000–2013. Sci. Bull. 2015, 60, 748–761. [Google Scholar] [CrossRef]
- Timoçin, E.; Ünal, İ.; Tulunay, Y.; Deniz Göker, Ü. The effect of geomagnetic activity changes on the ionospheric critical frequencies (foF2) at magnetic conjugate points. Adv. Space Res. 2018, 62, 821–828. [Google Scholar] [CrossRef]
- de Abreu, A.; Martin, I.; Fagundes, P.; Venkatesh, K.; Batista, I.; de Jesus, R.; Rockenback, M.; Coster, A.; Gende, M.; Alves, M.; et al. Ionospheric F-region observations over American sector during an intense space weather event using multi-instruments. J. Atmos. Sol.-Terr. Phys. 2017, 156, 1–14. [Google Scholar] [CrossRef]
- Purohit, P.K.; Mansoori, A.A.; Khan, P.A.; Atulkar, R.; Bhawre, P.; Tripathi, S.C.; Khatarkar, P.; Bhardwaj, S.; Aslam, A.M.; Waheed, M.A.; et al. Evaluation of geomagnetic storm effects on the GPS derived Total Electron Content (TEC). J. Phys. Conf. Ser. 2015, 640, 012072. [Google Scholar] [CrossRef]
- Zhao, B.; Wan, W.; Liu, L.; Igarashi, K.; Yumoto, K.; Ning, B. Ionospheric response to the geomagnetic storm on 13–17 April 2006 in the West Pacific region. J. Atmos. Sol.-Terr. Phys. 2009, 71, 88–100. [Google Scholar] [CrossRef]
- Basciftci, F.; Bulbul, S. Statistical analysis of the regional and global ionosphere model on intense geomagnetic storm. Indian J. Phys. 2023, 97, 3395–3409. [Google Scholar] [CrossRef]
- Tsurutani, B.; Mannucci, A.; Iijima, B.; Abdu, M.A.; Sobral, J.H.A.; Gonzalez, W.; Guarnieri, F.; Tsuda, T.; Saito, A.; Yumoto, K.; et al. Global dayside ionospheric uplift and enhancement associated with interplanetary electric fields. J. Geophys. Res. Space Phys. 2004, 109, a010342. [Google Scholar] [CrossRef]
- Mannucci, A.J.; Tsurutani, B.T.; Iijima, B.A.; Komjathy, A.; Saito, A.; Gonzalez, W.D.; Guarnieri, F.L.; Kozyra, J.U.; Skoug, R. Dayside global ionospheric response to the major interplanetary events of October 29–30, 2003 “Halloween Storms”. Geophys. Res. Lett. 2005, 32, l021467. [Google Scholar] [CrossRef]
- Paul, K.S.; Haralambous, H.; Oikonomou, C.; Paul, A.; Belehaki, A.; Ioanna, T.; Kouba, D.; Buresova, D. Multi-station investigation of spread F over Europe during low to high solar activity. J. Space Weather Space Clim. 2018, 8, A27. [Google Scholar] [CrossRef]
- da Silva Picanço, G.A.; Fagundes, P.R.; Moro, J.; Nogueira, P.A.B.; Muella, M.T.A.H.; Denardini, C.M.; Resende, L.C.A.; Silva, L.A.D.; Laranja, S. Dynamics of Polar-Equatorial Ionospheric Irregularities During the 10–13 October 2024 Superstorm. ESSOAr Preprints, 2024; preprint. [Google Scholar] [CrossRef]
- Pierrard, V.; Verhulst, T.G.W.; Chevalier, J.M.; Bergeot, N.; Winant, A. Effects of the Geomagnetic Superstorms of 10–11 May 2024 and 7–11 October 2024 on the Ionosphere and Plasmasphere. Atmosphere 2025, 16, 299. [Google Scholar] [CrossRef]
- Singh, R.; Scipión, D.E.; Kuyeng, K.; Condor, P.; Flores, R.; Pacheco, E.; Jara, C.D.L.; Manay, E. Ionospheric Responses to an Extreme (G5-Level) Geomagnetic Storm Using Multi-Instrument Measurements at the Jicamarca Radio Observatory on 10–11 October 2024. J. Geophys. Res. Space Phys. 2025, 130, e2024JA033642. [Google Scholar] [CrossRef]
- Oliveira, D.M.; Zesta, E.; Nandy, D. The 10 October 2024 Geomagnetic Storm May Have Caused the Premature Reentry of a Starlink Satellite. Front. Astron. Space Sci. 2025, 11, 1522139. [Google Scholar] [CrossRef]
- Xia, X.; Hu, X.; Wang, H.; Zhang, K. Correlation Study of Auroral Currents with External Parameters During 10–12 October 2024 Superstorm. Remote Sens. 2025, 17, 394. [Google Scholar] [CrossRef]
- Jeong, S.H.; Kim, Y.H.; Kim, K.N. Manual Scaling of Ionograms Measured at Jeju (33.4°N, 126.3°E) Throughout 2012. J. Astron. Space Sci. 2018, 35, 143–149. [Google Scholar] [CrossRef]
- Xiong, C.; Jiang, H.; Yan, R.; Lühr, H.; Stolle, C.; Yin, F.; Smirnov, A.; Piersanti, M.; Liu, Y.; Wan, X.; et al. Solar Flux Influence on the In-Situ Plasma Density at Topside Ionosphere Measured by Swarm Satellites. J. Geophys. Res. Space Phys. 2022, 127, e2022JA030275. [Google Scholar] [CrossRef]
- Kouba, D.; Mošna, Z.; Koucká Knížová, P. Apparent vertical ionospheric drift: A Comparative Assessment of Digisonde and Ionogram-Based Methods. EGUsphere 2025, 2025, 1–18. [Google Scholar] [CrossRef]
- Ponomarev, E.; Sedykh, P.; Urbanovich, V. Bow shock as a power source for magnetospheric processes. J. Atmos. Sol.-Terr. Phys. 2006, 68, 685–690. [Google Scholar] [CrossRef]
- Kilpua, E.; Koskinen, H.E.J.; Pulkkinen, T.I. Coronal mass ejections and their sheath regions in interplanetary space. Living Rev. Sol. Phys. 2017, 14, 5. [Google Scholar] [CrossRef]
- Kilpua, E.K.J.; Pomoell, J.; Price, D.; Sarkar, R.; Asvestari, E. Estimating the Magnetic Structure of an Erupting CME Flux Rope From AR12158 Using Data-Driven Modeling. Front. Astron. Space Sci. 2021, 8, 631582. [Google Scholar] [CrossRef]
- Song, H.; Li, L.; Zhou, Z.; Xia, L.; Cheng, X.; Chen, Y. The Structure of Coronal Mass Ejections Recorded by the K-Coronagraph at Mauna Loa Solar Observatory. Astrophys. J. Lett. 2023, 952, L22. [Google Scholar] [CrossRef]
- Kamide, Y.; Yokoyama, N.; Gonzalez, W.; Tsurutani, B.T.; Daglis, I.A.; Brekke, A.; Masuda, S. Two-step development of geomagnetic storms. J. Geophys. Res. Space Phys. 1998, 103, 6917–6921. [Google Scholar] [CrossRef]
- Paul, K.S.; Haralambous, H.; Moses, M.; Oikonomou, C.; Potirakis, S.M.; Bergeot, N.; Chevalier, J.M. Investigation of the Ionospheric Response on Mother’s Day 2024 Geomagnetic Superstorm over the European Sector. Atmosphere 2025, 16, 180. [Google Scholar] [CrossRef]
- Hayakawa, H.; Ebihara, Y.; Mishev, A.; Koldobskiy, S.; Kusano, K.; Bechet, S.; Yashiro, S.; Iwai, K.; Shinbori, A.; Mursula, K.; et al. The Solar and Geomagnetic Storms in 2024 May: A Flash Data Report. Astrophys. J. 2025, 979, 49. [Google Scholar] [CrossRef]
- Stauning, P. The Polar Cap (PC) index combination, PCC: Relations to solar wind properties and global magnetic disturbances. J. Space Weather. Space Clim. 2021, 11, 19. [Google Scholar] [CrossRef]
- Lockwood, M. Northern and Southern Hemisphere Polar Cap Indices: To What Extent Do They Agree and to What Extent Should They Agree? J. Geophys. Res. Space Phys. 2023, 128, e2023JA031464. [Google Scholar] [CrossRef]
- Bell, J.T.; Gussenhoven, M.S.; Mullen, E.G. Super storms. J. Geophys. Res. Space Phys. 1997, 102, 14189–14198. [Google Scholar] [CrossRef]
- Mannucci, A.J.; Tsurutani, B.T. Chapter 20—Ionosphere and Thermosphere Responses to Extreme Geomagnetic Storms. In Extreme Events in Geospace; Buzulukova, N., Ed.; Elsevier: Amsterdam, The Netherlands, 2018; pp. 493–511. ISBN 9780128127001. [Google Scholar] [CrossRef]
- Vlasov, M.N.; Kelley, M.C.; Makela, J.J.; Nicolls, M.J. Intense nighttime flux from the plasmasphere during a modest magnetic storm. J. Atmos. Sol.-Terr. Phys. 2003, 65, 1099–1105. [Google Scholar] [CrossRef]
- Greenspan, M.E.; Rasmussen, C.E.; Burke, W.J.; Abdu, M.A. Equatorial density depletions observed at 840 km during the great magnetic storm of March 1989. J. Geophys. Res. Space Phys. 1991, 96, 13931–13942. [Google Scholar] [CrossRef]
- Oikonomou, C.; Haralambous, H.; Paul, A.; Ray, S.; Alfonsi, L.; Cesaroni, C.; Sur, D. Investigation of the negative ionospheric response of the 8 September 2017 geomagnetic storm over the European sector. Adv. Space Res. 2022, 70, 1104–1120. [Google Scholar] [CrossRef]
- Berényi, K.A.; Heilig, B.; Urbář, J.; Kouba, D.; Kis, A.; Barta, V. Comprehensive analysis of the ionospheric response to the largest geomagnetic storms from solar cycle 24 over Europe. Front. Astron. Space Sci. 2023, 10, 1092850. [Google Scholar] [CrossRef]
- Paul, K.S.; Haralambous, H.; Oikonomou, C. Ionospheric response of the March 2023 geomagnetic storm over European latitudes. Adv. Space Res. 2024, 73, 6029–6040. [Google Scholar] [CrossRef]
- Mošna, Z.; Barta, V.; Berényi, K.A.; Mielich, J.; Verhulst, T.; Kouba, D.; Urbář, J.; Chum, J.; Koucká Knížová, P.; Marew, H.; et al. The March and April 2023 ionospheric storms over Europe. Front. Astron. Space Sci. 2024, 11, 1462160. [Google Scholar] [CrossRef]
- Abdu, M.A.; Maruyama, T.; Batista, I.S.; Saito, S.; Nakamura, M. Ionospheric responses to the October 2003 superstorm: Longitude/local time effects over equatorial low and middle latitudes. J. Geophys. Res. Space Phys. 2007, 112, A012228. [Google Scholar] [CrossRef]
- Foster, J.C.; Buonsanto, M.J.; Mendillo, M.; Nottingham, D.; Rich, F.J.; Denig, W. Coordinated stable auroral red arc observations: Relationship to plasma convection. J. Geophys. Res. Space Phys. 1994, 99, 11429–11439. [Google Scholar] [CrossRef]
- Southwood, D.J.; Wolf, R.A. An assessment of the role of precipitation in magnetospheric convection. J. Geophys. Res. Space Phys. 1978, 83, 5227–5232. [Google Scholar] [CrossRef]
- Karpachev, A. Advanced separation and classification of ionospheric troughs in midnight conditions. Sci. Rep. 2022, 12, 13434. [Google Scholar] [CrossRef]
- Liu, Y.; Li, Z.; Fu, L.; Wang, J.; Zhang, C. Studying the ionospheric responses induced by a geomagnetic storm in September 2017 with multiple observations in America. GPS Solut. 2019, 24, 3. [Google Scholar] [CrossRef]
- Aa, E.; Zou, S.; Ridley, A.; Zhang, S.; Coster, A.J.; Erickson, P.J.; Liu, S.; Ren, J. Merging of storm time midlatitude traveling ionospheric disturbances and equatorial plasma bubbles. Space Weather 2019, 17, 285–298. [Google Scholar] [CrossRef]
- Zhang, K.; Li, X.; Xiong, C.; Meng, X.; Li, X.; Yuan, Y.; Zhang, X. The influence of geomagnetic storm of 7-8 September 2017 on the Swarm precise orbit determination. J. Geophys. Res. Space Phys. 2019, 124, 6971–6984. [Google Scholar] [CrossRef]
- Schunk, R.W.; Banks, P.M.; Raitt, W.J. Effects of electric fields and other processes upon the nighttime high-latitude F layer. J. Geophys. Res. 1976, 81, 3271–3282. [Google Scholar] [CrossRef]
Disclaimer/Publisher’s Note: The statements, opinions and data contained in all publications are solely those of the individual author(s) and contributor(s) and not of MDPI and/or the editor(s). MDPI and/or the editor(s) disclaim responsibility for any injury to people or property resulting from any ideas, methods, instructions or products referred to in the content. |
© 2025 by the authors. Licensee MDPI, Basel, Switzerland. This article is an open access article distributed under the terms and conditions of the Creative Commons Attribution (CC BY) license (https://creativecommons.org/licenses/by/4.0/).