Article

Projected Hydrological Regime Shifts in Kazakh Rivers Under CMIP6 Climate Scenarios: Integrated Modeling and Seasonal Flow Analysis

by
Aliya Nurbatsina
1,*,
Aisulu Tursunova
1,
Lyazzat Makhmudova
1,
Zhanat Salavatova
1,2 and
Fredrik Huthoff
3,4,5
1
Institute of Geography and Water Security, Ministry of Science and Higher Education of the Republic of Kazakhstan, Almaty 050010, Kazakhstan
2
Faculty of Geography and Environmental Sciences, Al-Farabi Kazakh National University, Almaty 050040, Kazakhstan
3
Department Water Resources and Ecosystems, IHE Delft Institute for Water Education, 2601 DA Delft, The Netherlands
4
Group Marine and Fluvial Systems, Department of Civil Engineering and Management, Faculty of Engineering Technology, University of Twente, 7522 NB Enschede, The Netherlands
5
HKV, Botter 11-29, 8232 JN Lelystad, The Netherlands
*
Author to whom correspondence should be addressed.
Atmosphere 2025, 16(9), 1020; https://doi.org/10.3390/atmos16091020
Submission received: 21 July 2025 / Revised: 21 August 2025 / Accepted: 22 August 2025 / Published: 29 August 2025
(This article belongs to the Special Issue The Water Cycle and Climate Change (3rd Edition))

Abstract

The article presents an analysis of current (during the period 1985–2022) and projected (during the period 2025–2099) changes in the hydrological regime of the Buktyrma, Yesil, and Zhaiyk river basins in Kazakhstan under the conditions of global climate change. This study is based on the integration of data from General Circulation Models (GCMs) of the sixth phase of the CMIP6 project, socio-economic development scenarios SSP2-4.5 and SSP5-8.5, as well as the results of hydrological modelling using the SWIM model. The studies were carried out with an integrated approach to hydrological change assessment, taking into account scenario modelling, uncertainty analysis and the use of bias correction methods for climate data. A calculation method was used to analyse the intra-annual distribution of runoff, taking into account climate change. Detailed forecasts of changes in runoff and intra-annual water distribution up to the end of the 21st century for key water bodies in Kazakhstan were obtained. While the projections of river flow and hydrological parameters under CMIP6 scenarios are actively pursued worldwide, few studies have explicitly focused on forecasting intra-annual flow distribution in Central Asia, calculated using a methodology appropriate for this region and using CMIP6 ensemble scenarios. There have been studies on changes in the intra-annual distribution of runoff for individual river basins or local areas, but for the historical period, there have also been studies on modelling runoff forecasts using CMIP6 climate models, but have been very few systematic publications on the distribution of predicted intra-annual runoff in Central Asia, and this issue has not been fully studied. The projections suggest an intensification of flow seasonality (1), earlier flood peaks (2), reduced summer discharges (3) and an increased likelihood of extreme hydrological events under future climatic conditions. Changes in the seasonal structure of river flow in Central Asia are caused by both climatic factors—temperature, precipitation and glacier degradation—and significant anthropogenic influences, including irrigation and water management structures. These changes directly affect the risks of flooding and water shortages, as well as the adaptive capacity of water management systems. Given the high level of water management challenges and interregional conflicts over water use, the intra-annual distribution of runoff is important for long-term planning, the development of adaptation measures, and the formulation of public policy on sustainable water management in the face of growing climate challenges. This is critically important for water, agricultural, energy, and environmental planning in a region that already faces annual water management challenges and conflicts due to the uneven seasonal distribution of resources.

1. Introduction

Under the conditions of prevailing global climatic changes, the issues of water resource management acquire special significance, especially for regions with a continental climate and high dependence on the snow and glacier feeding of rivers, as it is typical for Kazakhstan and Central Asia. Current climatic trends are having a significant impact on the hydrological regime [1,2,3], which requires comprehensive analysis and forecasting to ensure sustainable water supply and prevent negative consequences for the economy and ecosystems.
The relevance of this study is determined not only by the need to assess current and forecast changes in the hydrological regime of the key rivers of Kazakhstan—Buktyrma, Yesil and Zhaiyk—but also by the fact that this article presents a detailed forecast of intra-annual water distribution under various climate change scenarios. Based on a review of the scientific literature, the forecasting of future changes in river flow and hydrological parameters, including climate scenarios based on the CMIP6 model ensemble, is actively being carried out for Central Asia. However, there are very few publications devoted specifically to the projected intra-annual distribution of river flow in Central Asia, calculated using the compositing method, based on modelled flow data, using CMIP6 ensemble scenarios, up to 2099. Most studies focus on annual runoff values or average seasonal distribution, as well as extreme events (droughts, floods), but not on detailed forecasts of intra-annual (monthly) runoff distribution calculated using the methodology for future periods based on CMIP6 scenarios. There are studies on changes in the intra-annual runoff distribution for individual river basins or local areas for the historical period [4,5,6,7], as well as studies on runoff forecasting using CMIP6 climate models [8,9], but there are very few systematic publications on the distribution of the forecast intra-annual runoff in the Central Asian region, and this issue has not been fully studied. Such a forecast is particularly important for improving the accuracy of regional runoff forecasts, forming the basis for comparative transboundary studies, as well as for the long-term planning of water management activities and the adaptation of agriculture, energy, and the utilities sector to new climatic conditions. The scenario assessments and methodologies for analysing the seasonal structure of water flow obtained are relevant for regions with similar hydro-climatic characteristics—the Eurasian steppe belt, transboundary river basins, and mountain systems facing increased extreme hydrological events and the risk of water shortages. This study is based on the integration of data from GCMs (CMIP6), modern socio-economic development scenarios (SSP2-4.5, SSP5-8.5), and hydrological modelling (SWIM model) [10]. This not only allows the identification of trends and seasonal shifts due to both natural and anthropogenic factors, but also the assessment of the risks of water deficit, floods, and droughts, taking into account intra-annual flow dynamics.
The importance of the study for Kazakhstan and Central Asia includes the following aspects:
-
The critical role of water resources for the economy, ecosystems, and social stability of the region;
-
The intensification of climatic risks, including temperature rise, reduction in snow cover, and glacier degradation, leads to changes in seasonal runoff patterns and the increased probability of extreme hydrological events and associated impacts [10];
-
The need for science-based forecasts for the anticipatory development of adaptation measures, effective water resources management, and the formation of public policy under changing climate conditions;
-
The transboundary character of many rivers in the region, which requires coordinated actions between Central Asian countries to ensure water security and reduce risk of conflicts.
Studies of intra-annual flow distribution and its changes in the Buktyrma, Yesil, and Zhaiyk basins have been carried out since the middle of the 20th century. The classical works of Kuzin P.S., Berkaliev Z.T., and Skotselas N.I. [11,12,13] laid the foundation for analysing the seasonal flow pattern for the rivers of Kazakhstan. In the Yesil (Zhabay) basin, Makhmudova L.K. and co-authors showed that, over the last 30 years, the timing of the beginning of snow accumulation has shifted to later in the year, and the timing of snowmelt has shifted to earlier in the year, which leads to a decrease in spring runoff and an increase in summer and winter runoff [14]. A reduction in the duration of ice cover and a shift in the timing of ice formation has been noted for the Zhaiyk river, which also affects the seasonal structure of runoff [15]. The impact of economic activity (construction of reservoirs, irrigation) lead to its ‘shearing’ of flood peaks and a decrease in the volume of water reaching the floodplain, which negatively affects ecosystems [16]. In recent years, a comprehensive analysis of multi-year trends in the intra-annual distribution of runoff, was made using methods of statistical analysis, modern GIS-technologies, and hydrological modelling [10,17,18]. It is shown that, for the Zhabay river—Atbasar city—spring runoff in April was between 63.5% (in a low-water year) and 79.2% (in a high-water year) of the annual runoff; for the Ulken Kobda river—Kobda village—the share of spring runoff varied from 38.4% to 71.6%, and for the Buktyrma river—Lesnaya Pristan—the spring–summer runoff for the period from April to July was 60–80% of the annual runoff.
The purpose of this study is to assess the future impact of climate change on the hydrological regime of the Buktyrma, Yesil, and Zhaiyk rivers, taking into account current climatic scenarios and economic activity (i), and to build a forecast of runoff (ii) and intra-annual distribution up to the end of the 21st century (iii).
This study is based on a comprehensive integration of modern methods of climatic and hydrological modelling, climate data correction, and development scenario analysis, which ensures the high practical significance of the results obtained for identifying key trends and risks, and will also enable the development of scientifically sound measures for sustainable water resource management in the context of growing climate challenges and social transformation in the region.

2. Conceptual Foundations

Climate change in Central Asia and Kazakhstan, as confirmed by recent CMIP6 modelling results and regional strategic documents, is having an increasingly pronounced impact on the country’s water resources [19,20]. In recent decades, the average annual temperature in Kazakhstan has been steadily increasing (by 0.3 °C per decade) and is expected to increase by 2.5–3.3 °C by the middle of the 21st century and by 3.6–6.8 °C by the end of the century, depending on the emission scenario [21]. Particularly intense warming is projected for spring and summer, leading to increased evaporation, reduced snow cover, and accelerated glacier melting, primarily in the Tien Shan Mountains and eastern Kazakhstan [22]. Higher temperatures and lower summer runoff worsen water quality, increasing salinity and pollution, especially in low-water years. The north and east of the country may receive more precipitation in winter and spring, but the south and west will face increased droughts and reduced water availability in summer [22].
The GCMs of the sixth phase (CMIP6), which allow taking into account a wide range of scenarios and uncertainties, have become a key tool for assessing the impact of climate change on water resources [23,24]. Studies show that CMIP6 demonstrate a higher sensitivity to temperature increase compared to previous phases (CMIP5), which leads to more pronounced warming projections and changes in the hydrological regime in Central Asia [25,26]. In particular, the analysis of 34 model simulations revealed that CMIP6 predicts not only a general warming, but also a shift in climate zones, reduced snow cover, and accelerated glacier melt, which entails increased runoff near glaciers and a potential increase in flood risk [25,26,27,28,29,30]. At the same time, studies have recorded an increase in drought events and the duration of droughts, especially towards the end of the 21st century, which is associated with increased evaporation and changes in precipitation patterns [25,31].
This study uses scenarios SSP2-4.5 and SSP5-8.5 from CMIP6. The use of this pair of scenarios is due to their representativeness in terms of covering the range of possible socio-economic and climate trajectories, which provides a comprehensive assessment of hydrological risks and uncertainties in the context of global climate change. The SSP2-4.5 scenario characterises a path of moderate development, involving limited efforts to reduce greenhouse gas emissions and the implementation of partial measures to adapt to and mitigate climate change. In this case, water bodies and river systems experience climate change in the range of 2.6–3.0 °C warming by the end of the 21st century, which corresponds to the likely development of events with a restrained decarbonisation policy on a global scale. This scenario allows for the analysis of changes in runoff and seasonal dynamics in the case of relatively favourable climatic conditions while maintaining current trends in socio-economic development. The SSP5-8.5 scenario, on the other hand, is an intensive scenario with rapid emissions growth, high economic activity, and minimal restrictions on fossil fuel use. In this case, extreme warming of 3.3–5.7 °C is predicted by the end of the century, leading to the most pronounced climate shifts and significant transformations in the intra-annual distribution of river flow, as well as an increased risk of extreme hydrological events (droughts, floods, shifts in peak flood levels, etc.). The application of these two scenarios in SWIM model calculations and the integration of the CMIP6 ensemble of climate models allows the following:
-
The adequate cover of the entire range of realistic future climate conditions for the Central Asian region;
-
The analysis of seasonal characteristics and probable extreme manifestations of the hydrological regime in the long term.
This approach complies with international requirements for the scenario analysis of natural and water systems and allows both natural and anthropogenic factors to be taken into account.
The empirical base of GCMs as CMIP5 and CMIP6 is based on a combination of long-term hydrometeorological observations, satellite data (GRACE, GLDAS), and hydrological modelling results using SWIM, SWAT, and other models. Regional forecasts are derived from the integration of data, the application of bias correction, and downscaling methods [32]. A number of works note that CMIP6 significantly improved the reproduction of extreme precipitation and seasonal climate features, especially in the mountainous and arid regions of Central Asia, although there is still uncertainty in the modelling of individual hydrological processes [25,31,32].

3. Study Area

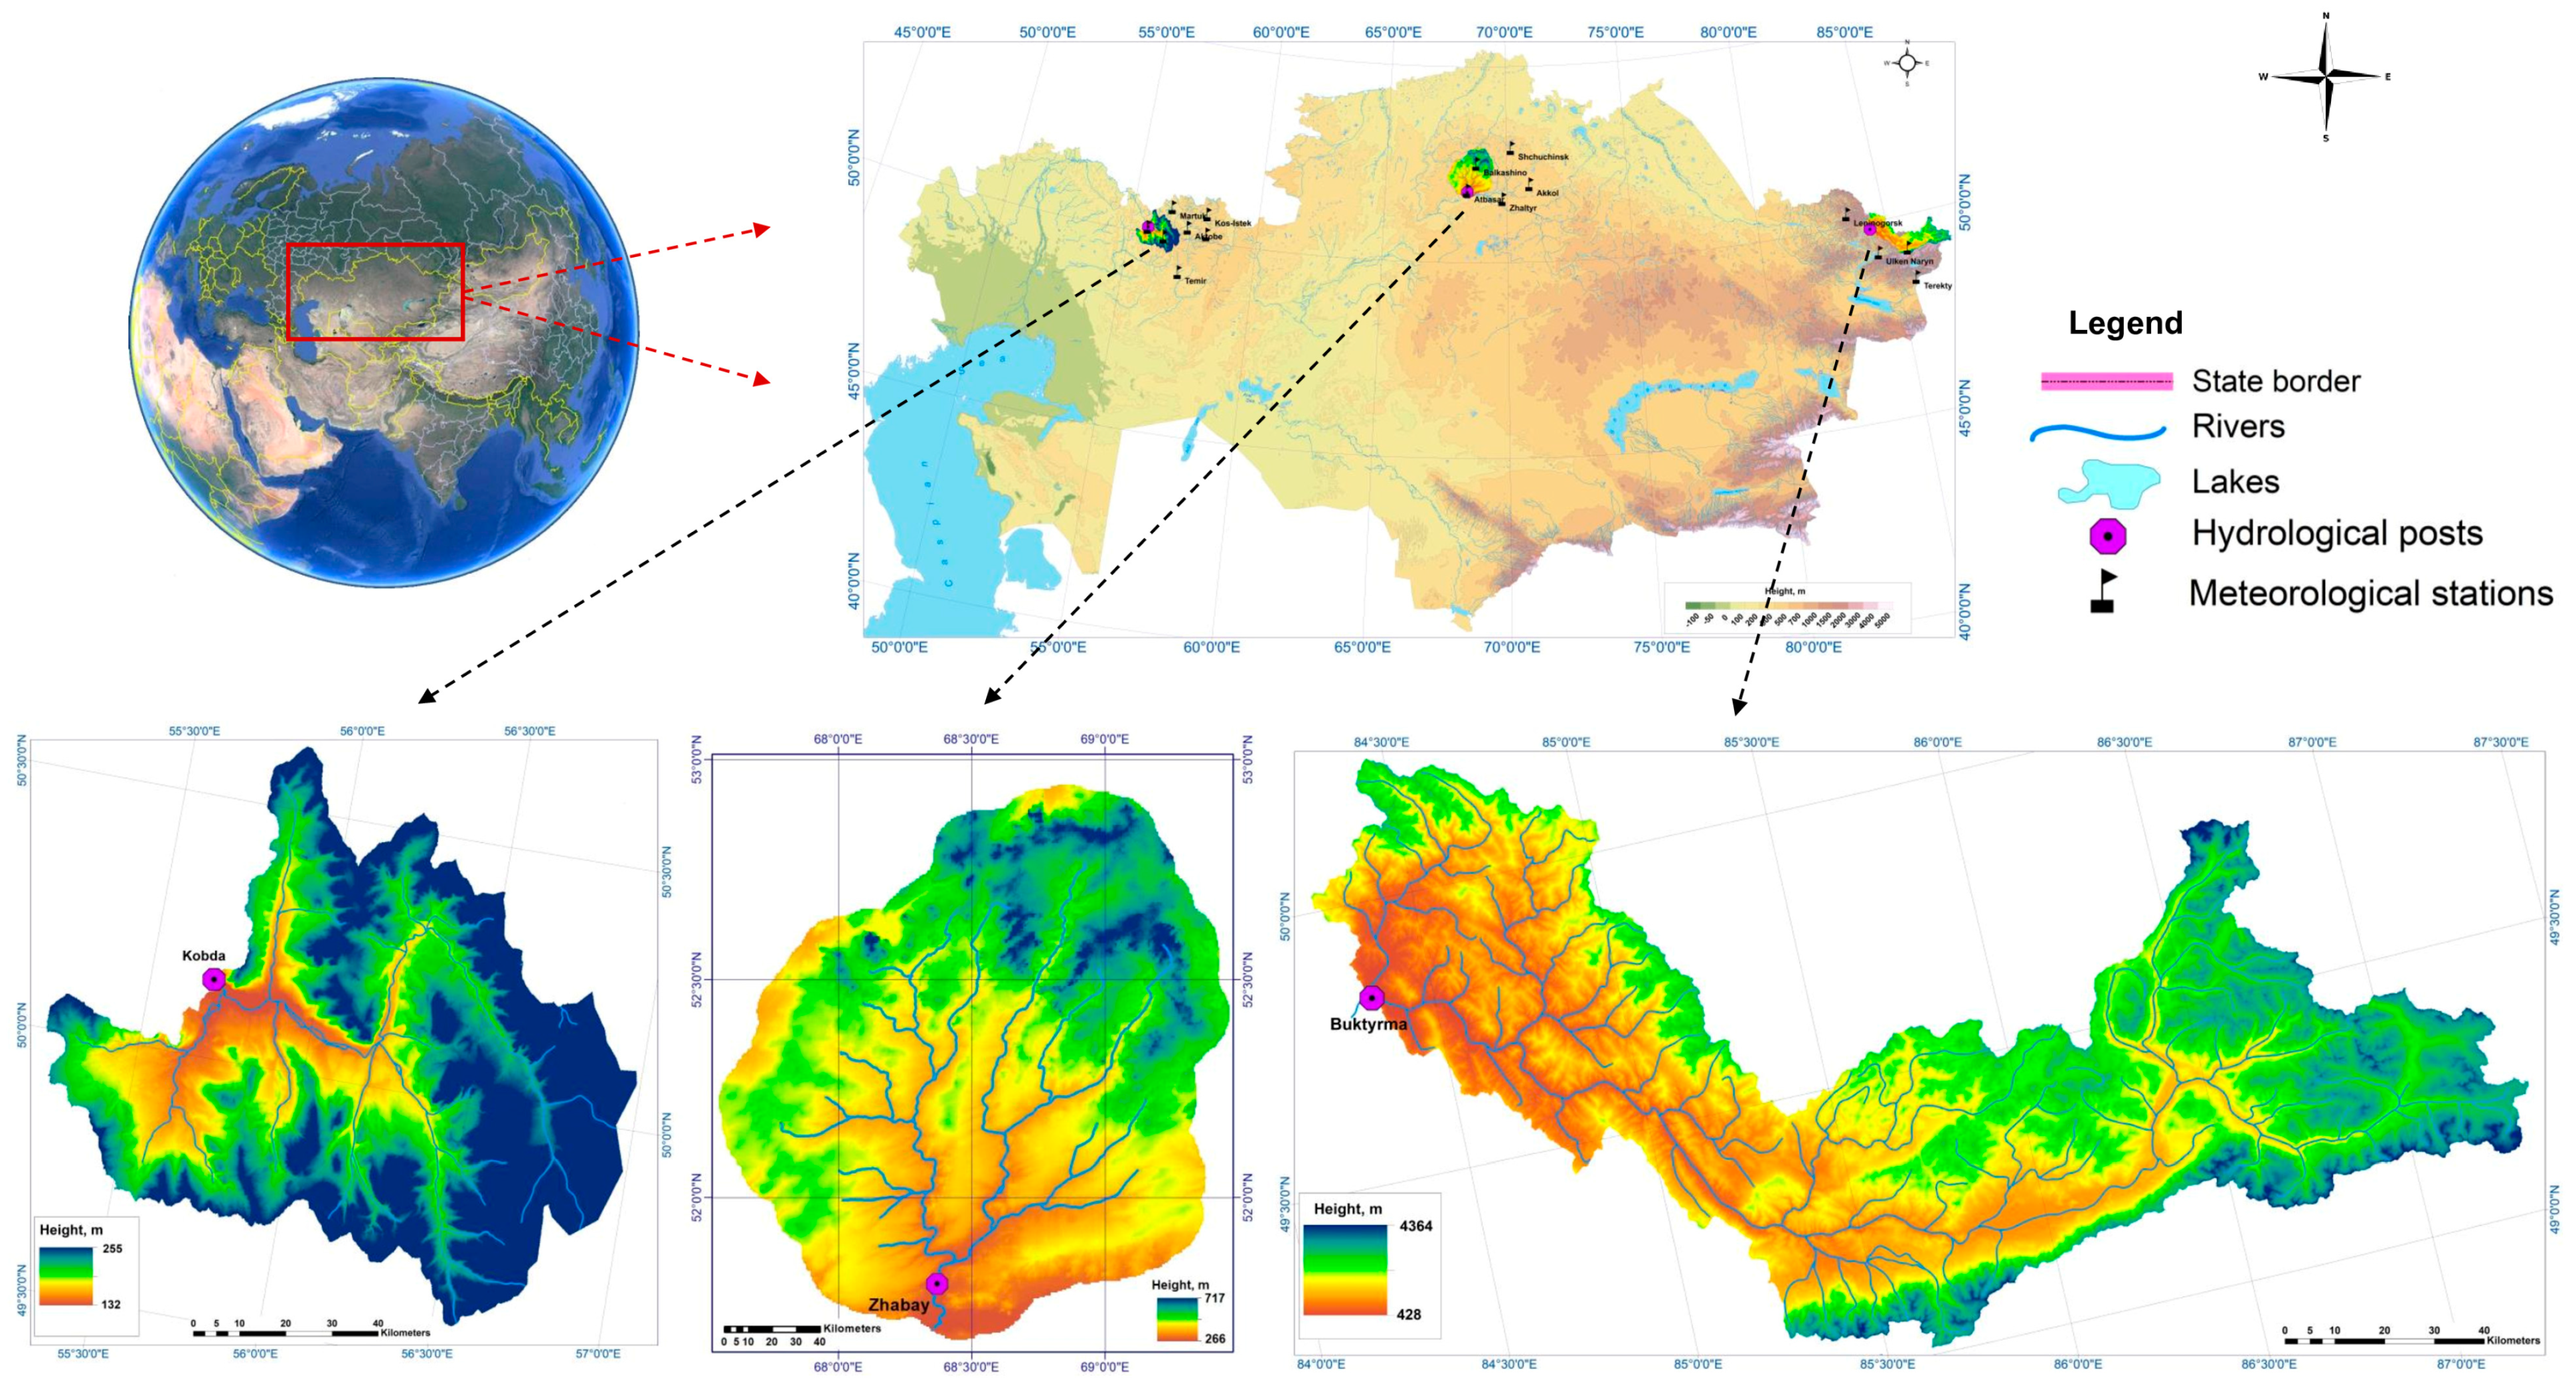
This study examined the catchment basins of three rivers: the Ulken Kobda river—Kobda village, the Zhabay river—Atbasar city, and the Buktyrma river—Lesnaya Pristan village (Figure 1).
The Buktyrma river is one of the largest rivers in Altai, a right tributary of the Ertis river, flowing through the territory of East Kazakhstan Region. The tributary is 336 km long, and the catchment area of the entire Buktyrma river is 12,660 km2. The main tributaries are the Belaya Berel, Sarymsakty, Khamir, and Berezovka. The river has a mixed water supply: 50–55% snow, 25–35% rain, and about 15% groundwater [33]. The average annual water flow is 214 m3/s. The Buktyrma flows into the Bukhtarma Reservoir, where there is a hydroelectric power station, one of the largest hydroelectric complexes in Kazakhstan. Energy, irrigation, water supply and shipping depend on its operation [34]. The hydrological regime is characterised by pronounced flooding, with the highest flow occurring from April to August, peaking in May, with April also contributing significantly. The catchment area includes mountainous, valley, and plain areas, with a predominantly continental climate and varying degrees of moisture. A distinctive feature of the Buktyrma river basin is also the role of glacial feeding, in contrast to the flat rivers of Zhabay and Ulken Kobda, where there is no glacial component. The modelling and forecasting of the flow of this river are necessary conditions for optimising hydropower potential, reducing flood risk and ensuring rational water use in the region.
The Zhabay river belongs to the Esil basin and is its right tributary. It is 196 km long and has a catchment area of 8800 km2. It flows through the Sandyktau and Atbasar districts of the Akmola region, with its source located on the slope of Mount Malinovaya. There are 14 tributaries to the river. It usually freezes in early November and thaws in mid-April. It is fed by snowmelt. The average annual water consumption is 9.45 m3/s, and the peak flood season is in April [35]. The water regime is characterised by pronounced seasonality and the long-term unevenness of runoff—water consumption fluctuates tens and hundreds of times from year to year, which significantly affects the economic use of water resources and creates a risk of flooding during periods of intense snowmelt or rainfall. Spring floods often cause the flooding of adjacent areas, which requires the development and application of methods for modelling and forecasting runoff in order to ensure rational water use, reduce flood risks, and improve public safety.
The Ulken Kobda river flows through the Aktobe Region and is formed by the confluence of the Kara Kobda and Sary Kobda rivers. It is 225 km long, with a catchment area of 14,700 km2. The average annual water flow (at the village of Kobda) is 6.23 m3/s, and the volume of runoff is 0.197 km3/year. It is mainly fed by snow, with the flood season beginning in mid-April and accounting for up to 90% of the annual runoff volume. A significant part of the annual runoff occurs in the spring: 38.4% in low-water years and 71.6% in high-water years. In dry years, the riverbed in the upper and middle reaches may be interrupted, breaking up into separate pools. The watershed is characterised by a variety of landscapes and the presence of steppe, forest-steppe, and desert areas. The Ulken Kobda river is of considerable interest for assessing water resources, as it flows in the arid climate of western Kazakhstan and is one of the main sources of surface water for economic use. Modelling and forecasting its flow are important for optimising water use, preventing water shortages and analysing the impact of climate change on the hydrological regime of the basin [36].

4. Materials and Methodology

In this study, a set of modern methods integrating climate modelling, hydrological calculations, and climate data processing methods was used to analyse and forecast the changes in the hydrological regime of selected rivers in Kazakhstan. The main approaches used in the work are presented below, with a description of each step.

4.1. Collection and Processing of Hydrometeorological Data

The official data of RSE ‘Kazhydromet’ on daily and average monthly water discharge (URL: https://www.kazhydromet.kz/ru/gidrologiya/ezhegodnye-dannye-o-rezhime-i-resursah-poverhnostnyh-vod-sushi-eds, accessed on 16 May 2025), air temperature, precipitation, relative humidity, and wind speed (URL: https://www.kazhydromet.kz/ru/interactive_cards, accessed on 21 May 2025) for a long historical period (1985–2022) were used. Modern GIS-technologies (ArcGIS 10.5, GRASS GIS 7.2.2) were used for spatial analysis and input data preparation, which made it possible to take into account relief, soil types, land use, and the other physiographic parameters of catchments [37].

4.2. Global and Regional Climate Modelling

Data from the GCMs of the sixth phase of the CMIP6 (Coupled Model Intercomparison Project Phase 6) project [35,37,38,39,40,41] were used to estimate future climate conditions. Two scenarios of socio-economic development and greenhouse gas emissions were selected:
-
The SSP2-4.5—‘moderate’ scenario, assuming the partial achievement of climate targets and the stabilisation of emissions, leading to a warming of 2.1–3.5 °C by 2100.
-
The SSP5-8.5 is an ‘intensive’ scenario characterised by rapid emissions growth and the warming of 3.3–5.7 °C by the end of the century.
CMIP6 models allow for a wide range of climate uncertainties and scenarios, and integrate the results to assess regional patterns of temperature and precipitation changes [35]. The following analysis was conducted to select the optimal models for compiling the CMIP6 model ensemble:
Stage 1. A detailed analysis was conducted on the 34 models presented on the NASA/GDDP-CMIP platform, indicating the country of development, and considering the principle of model distribution, input parameters, advantages and disadvantages.
Stage 2. Calculation and analysis of the obtained results of relative error, correlation coefficients and NSE, and the selection of models corresponding to the conditions of the calculated parameters.
Based on the results of the error assessment, models with the lowest reproduction error were selected from 34 models (Table 1). Fifteen models were selected for air temperature forecasting: ACCESS-ESM1-5, CanESM5, CMCC-CM2-SR5, CNRM-ESM2-1, EC-Earth3-Veg-LR, GFDL-CM4, HadGEM3-GC31-LL, HadGEM3-GC31-MM, IITM-ESM, KACE-1-0-G, KIOST-ESM, MIROC6, MIROC-ES2L, NESM3, TaiESM1. These models cover a wide range of climate systems and include various modelling methods, allowing for diverse projections of global temperature and its changes in response to anthropogenic impacts. The models represent a combination of different approaches, including the use of different parameters in calculating greenhouse effects, ocean and atmospheric circulations, and other factors.
Six models were selected for precipitation forecasting: ACCESS-ESM1.5, CanESM5, GFDL-ESM4, INM-CM5-0, NESM3, and UKESM1-0-LL. Precipitation forecasting requires the consideration of many factors, including atmospheric circulation, seasonal variations, and the influence of local and regional factors such as mountain ranges and ocean currents. Unlike temperature forecasts, precipitation often has greater local variability, requiring more detailed models for accurate predictions.
The reliability of the ensemble of models and future climate scenarios was assessed by comparing model calculations with observations at 16 meteorological stations in the regions under consideration: Balkashino, Atbasar, Zhaltyr, Akkol, Shchuchinsk, Novoaleksevevka, Ilyinsky, Aktobe, Temir, Martuk, Kos-Istek, Novorossisskoe, Katon-Karagay, Leninogorsk, Ulken-Naryn, Terekty.

4.3. Bias Correction of Climate Data

Bias correction methods [35,38,42] have been used to improve the accuracy of calculations and eliminate systematic errors in the output of climate models. The main methods are given as follows:
-
Delta variation—the method is based on the assumption that relative changes in climate variables (e.g., temperature or precipitation) obtained from modelling can be superimposed on historical observation series. To do this, the difference (for temperatures) or ratio (for precipitation) between the climate model in the future and in the base period is calculated. These corrections are then applied to the observed data, allowing the creation of adjusted time series. The method is widely used due to its simplicity and transparency, but it does not take into account changes in variance, the sequence of extreme events, and seasonal characteristics [43,44,45].
-
Linear scaling—in this approach, adjustments are made by aligning the average values of modelled climate variables with observed values. For temperature series, this is implemented as the addition of a systematic difference (bias), and for precipitation, as multiplication by a coefficient reflecting the ratio of the observed and modelled sums. The method is applicable for improving the average characteristics, but often does not take into account the differences in the distribution of values and does not eliminate errors in the reproduction of extreme events [42,46].
-
Quantile mapping—one of the most statistically sound methods, allowing for the correction of not only the bias of mean values, but also differences in the distributions of observed and modelled data. The essence of the method is to construct an empirical distribution function for observations and model data for the calibration period and to compare the corresponding quantiles. As a result, each value in the simulation series is assigned a corrective transformation that brings the distribution into line with the observed distribution. The method effectively reduces errors in modelling extremes (heavy precipitation, heat waves, and cold spells) and is often used in hydrological calculations that require a high accuracy of input data. However, it is more computationally expensive and sensitive to sample size than simple methods [47,48,49].
The application of bias correction methods is a key procedure in integrating climate projections into hydrological modelling. By ensuring consistency between the modelled and observed characteristics, this processing significantly reduces the risk of bias in water flow estimates.

4.4. Hydrological Modelling Using SWIM Model

The ecological-hydrological model SWIM (Soil and Water Integrated Model) [50,51] was used to simulate runoff and analyse intra-annual water distribution. SWIM is widely used around the world, especially for assessing the impact of climate change on river flow in the Elbe river basin [52,53] and other European river basins, including the Tagus, Emajogi, Lule, Rhine, Danube, Samara, Teterev, Western Bug, Tai, and Northern Dvina [54]. A more detailed description of the selection of the hydrological model is given in the work [1].
Key features of SWIM are given as follows:
-
The model is designed to evaluate the water balance, runoff, plant growth, erosion, and nutrient cycling in the basins ranging from 100 to 10,000 km2.
-
Hierarchical structure: basin—sub-basins—hydrotopes, which allows one to take into account the spatial heterogeneity of the landscape.
-
Integration of climatic, soil, hydrological and biological data, as well as the possibility of working with a GIS interface for spatial analyses.
-
Calibration and validation of the model was carried out on independent time intervals to improve the reliability of the calculations.
The SWIM model takes into account more than 35 parameters during calibration. The main ones are: riverbed roughness coefficients, parameters of maximum soil moisture capacity, evaporation, groundwater, soil erosion, initial soil moisture reserves, riverbed and floodplain parameters, snow accumulation and snowmelt; coefficients of change in characteristics with altitude, etc.
The results of the model effectiveness assessment were determined by the correlation coefficient (R), which characterises the closeness of the relationship (when R > 0.7, the equation is recommended for use [55]), and the Nash–Sutcliffe efficiency coefficient (NSE) [56], which is used to assess the predictive ability of hydrological models. For NSE > 0.6, the model is recommended for use; ideally, NSE should tend towards 1.

4.5. Calculation and Assessment of Intra-Annual Flow Distribution

In this work, the composition method or the method of Andreyanov V.G. [57] was used to calculate the intra-annual distribution of river flow, which has several advantages. One of the key advantages of the method is its ability to take into account changes in flow depending on the water content of the year. This is especially important for rivers where there is high variability in runoff between high-water and low-water years, which is typical for rivers in Kazakhstan. Unlike methods such as histograms or duration curves, which often do not reflect such changes, Andreyanov’s method allows for a more accurate consideration of the impact of climate change on runoff distribution.
In addition, the composition method allows for the effective division of runoff into different water phases, such as high-water (25% probability), medium-water (50%) and low-water years (75%) [58,59], which makes it particularly useful for analysing seasonal fluctuations:
-
High-water years—25%: This hydrological regime is observed approximately once every four years. In such years, the inflow to the reservoir significantly exceeds the average, which leads to an increase in the volume of runoff and a higher probability of floods and flash floods. A year with a 25% probability of exceeding the level is called a high-water year (or high-water), since such a high-water flow is maintained or exceeded only in 25 out of 100 years (or 1 out of 4 years);
-
Years with average flow—50%: These represent the most characteristic or ‘typical’ conditions, usually occurring once every two years. Years with a 50% probability of exceeding the average are called years with average flow, since this water flow is expected to be equal to or exceed the average in half of the observed years, making it close to the median level of annual flow;
-
Years with low consumption—75%: In these years, water consumption is significantly below average. Such conditions are observed on average three out of every four years (i.e., in 75% of years, water consumption exceeds this value, and only in 25% of years is it lower). Low-water years are characterised by low inflow, which often leads to problems with water supply and water use.
This breakdown makes it possible to more accurately predict periods of maximum and minimum flows, which is extremely important for effective water resource management, especially in the context of climate change. The simplicity and reliability of the method are also important advantages. Unlike regression analysis or exponential smoothing, which can depend on the quality and predictability of data, Andreyanov’s method is based on real data and avoids excessive assumptions or complex calculations. This makes the method convenient and reliable for practical use in a changing climate. In this regard, Andreyanov’s method was chosen for further use in the work.

5. Results

5.1. Calibration and Adaptation of the SWIM Model on Three Rivers

The advantage of this model, in conditions of a sparse observation network, is the possibility of using meteorological data from stations not located in the catchment area, since the model provides for data interpolation and filling in the entire basin area with indicators. Synchronous continuous flow series and meteorological data for 6–18 years were used for calibration. During these periods, the possibility of including years with different water levels was maximised: high-water, low-water, and average-water years. Key parameters were selected by calibrating the model based on the deviations of the calculated runoff hydrographs from actual values. The calibration parameters are mainly adjusted to changes in synoptic data (snowmelt temperature parameters, the threshold temperature for the transition of liquid precipitation to solid, etc.), which were determined for river catchments to the nearest hundredth. The results of the model effectiveness assessment can be seen in Table 2.
Based on the results obtained, it can be concluded that the use of a model based on the dependence of runoff on climatic characteristics is fully justified. The effectiveness of the modelling results according to NSE was 0.65–0.94, and according to the correlation coefficient, 0.84–0.98. The model accurately reproduces the dynamics of the simulated values, and the model time series can be deemed satisfactory.

5.2. Forecast Runoff of the Studied Rivers

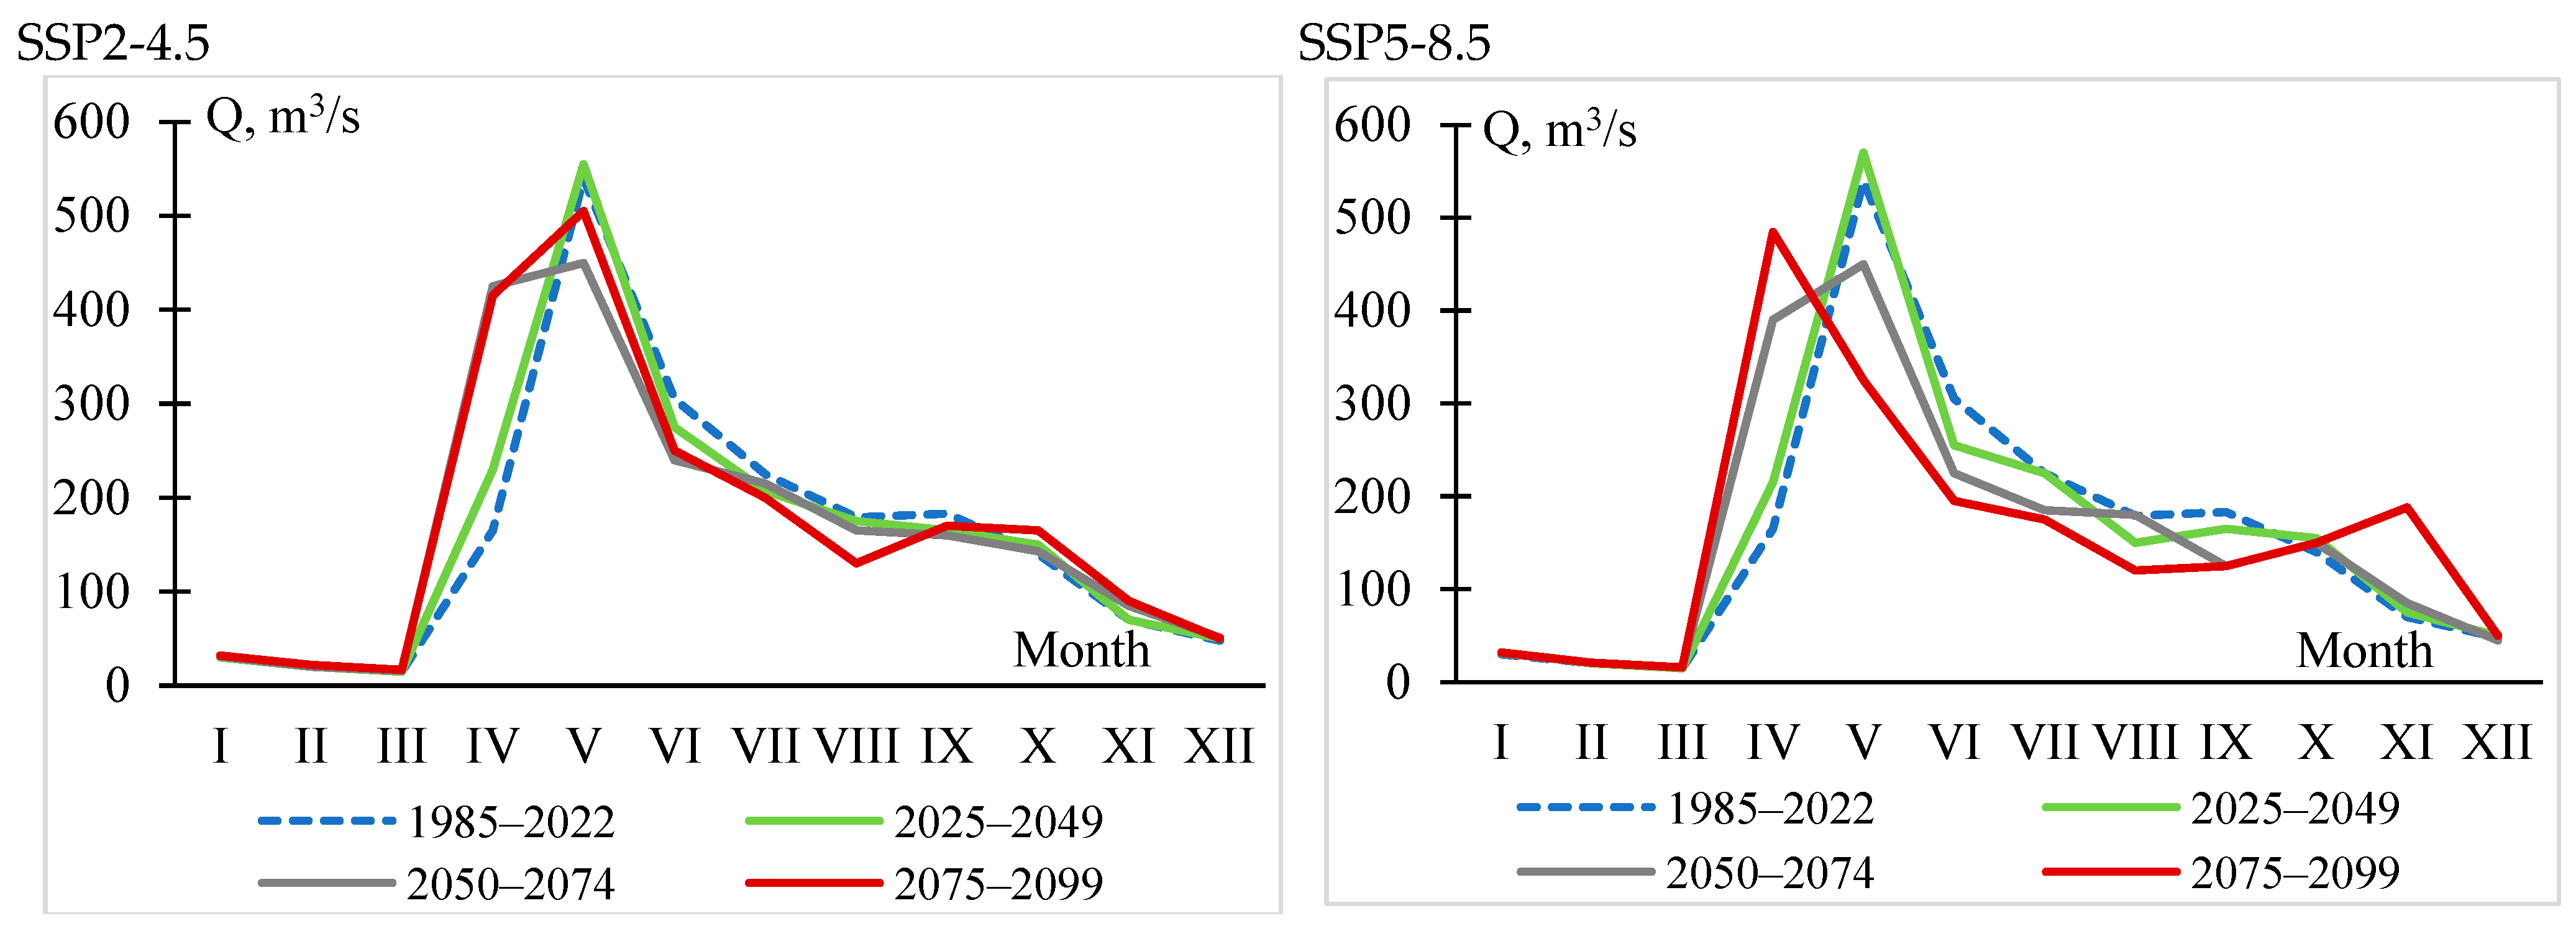
According to averaged data from global models under the scenarios of greenhouse gas concentrations SSP2-4.5 and SSP5-8.5, the forecast values of water runoff for the studied water bodies were modelled. These climate models satisfactorily describe the current temperature and precipitation regime in the study regions [60]. In accordance with the recommendations of the World Meteorological Organisation (WMO), 25–30-year periods (climatic ‘norms’) are used as the international standard for calculating the average annual values for temperature, precipitation and other meteorological indicators [61,62]. This ensures the comparability of results from different studies and regions, and provides an objective basis for assessing the degree of deviation of current weather conditions from typical conditions. Figure 2, Figure 3 and Figure 4 show representative seasonal dynamics of river flow over the last 40 years (from 1985 to the present) and for three periods (2025–2049, 2050–2074, 2075–2099). The analysis based on these intervals allows for the identification of stable climate trends and provides a scientifically sound basis for climate and water resource management planning.
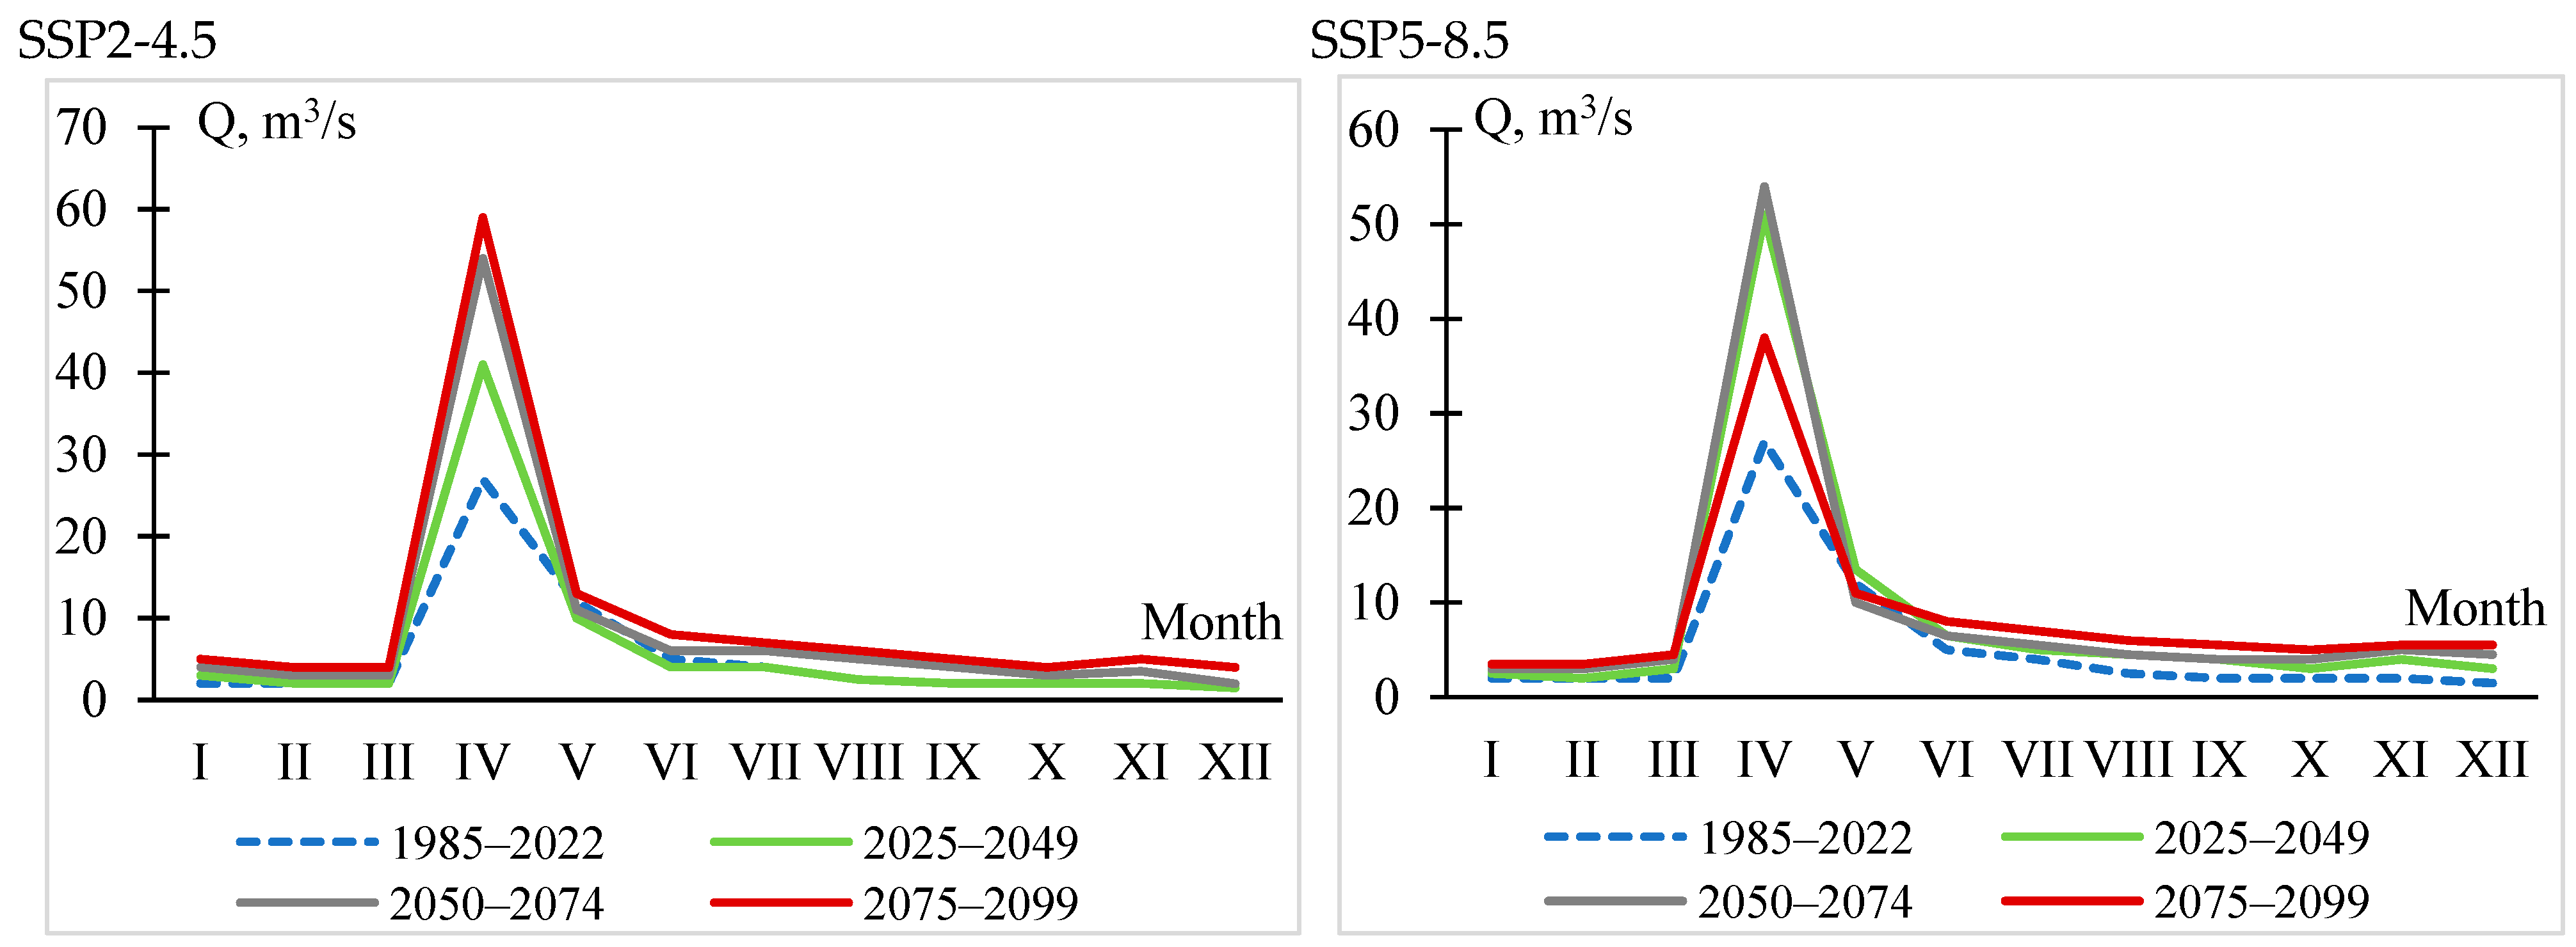
Figure 2 shows the results for Zhabay river basin. For the historical period (1985–2022), the average annual flow rate of the Zhabay river is approximately 13 m3/s, with characteristic seasonal fluctuations. There is a reduction in the flow during the winter months (<10 m3/s) and a district peak during the summer months due to snowmelt and increased precipitation.
According to the modelled water discharges (under the SSP2-4.5 scenario), on the river Zhabay—near the city of Atbasar—during the period from 2025 to 2049, the flood peak will be increased approximately 1.5 times (from 27 to 41 m3/s). From 2050 to 2074, there will be an even greater increase in the river water content in April, reaching an increase in the flood peak by 2 times (from 27 to 54 m3/s). Further from 2075–2099, the streamflow continues to increase. Since the Zhabay river basin exhibits significant seasonal and long-term variability in flow, which hinders the effective use of water resources and leads to significant damage, as evidenced by the floods of 2014, 2017, and 2024 in the city of Atbasar [10,11,12,13], understanding possible changes in the frequency and magnitude of floods on the Zhabay river is crucial for improving flood management strategies and ensuring water security in the region.
The results obtained under the SSP5-8.5 scenario on the Zhabay river show a similar situation. During the period from 2025 to 2049, the flood peak will be increased by about 1.9 (from 27 to 51 m3/s) times. From 2050 to 2074, there is an even greater increase in water availability in the basin in April, reaching a 2-fold increase in flood peak. Further from 2075–2099, the river discharge decreases again, but there is still a pronounced increase in flood peak magnitude relative to the historical observations.
Figure 3 shows that, according to the results obtained, scenario SSP2-4.5 is characterised by moderate climate transformation, with peak flood flows for the period 1985–2022 mainly formed by snowmelt from glacial and snow-covered areas, reaching values of around 500–550 m3/s. In the near future, 2025–2049, no significant changes in the volume and form of spring floods are expected—water consumption in the peak month is also forecast at 550 m3/s. The second period (2050–2074) is characterised by the maximum flow spreading over two months—April and May—and fluctuating between 420 and 450 m3/s. This trend indicates the faster melting of snow cover and glaciers due to rising temperatures. After 2075, there will be a 2.5-fold increase in the river’s water content in April, and high-water levels will also be observed for two months in a row, but the peak will still be reached in May—505 m3/s. At the same time, high seasonal contrast remains: summer and autumn flow rates remain low, indicating an increased risk of low-water periods.
Scenario SSP5-8.5 reflects more intense warming and sharp changes in climatic factors. In the base period, the spring peak is similar to the previous scenario (500–550 m3/s), while, during the period 2025–2049, there is a slight increase in maximum flow to 570 m3/s. During the period 2050–2074, the flood peak spreads over two months, with the maximum remaining in May at 450 m3/s. The period from 2075 to 2099 is characterised by a shift in the peak flood period from May to April and a sharp decrease in summer flows, reflecting the impact of glacier degradation and the intensification of extreme hydrological phenomena.
The results obtained for the Buktyrma river basin show that glacier degradation in the context of climate warming will contribute to a short-term increase in summer runoff due to accelerated melting, but in the long term, this will lead to a decrease in summer runoff and an increase in seasonal contrast.
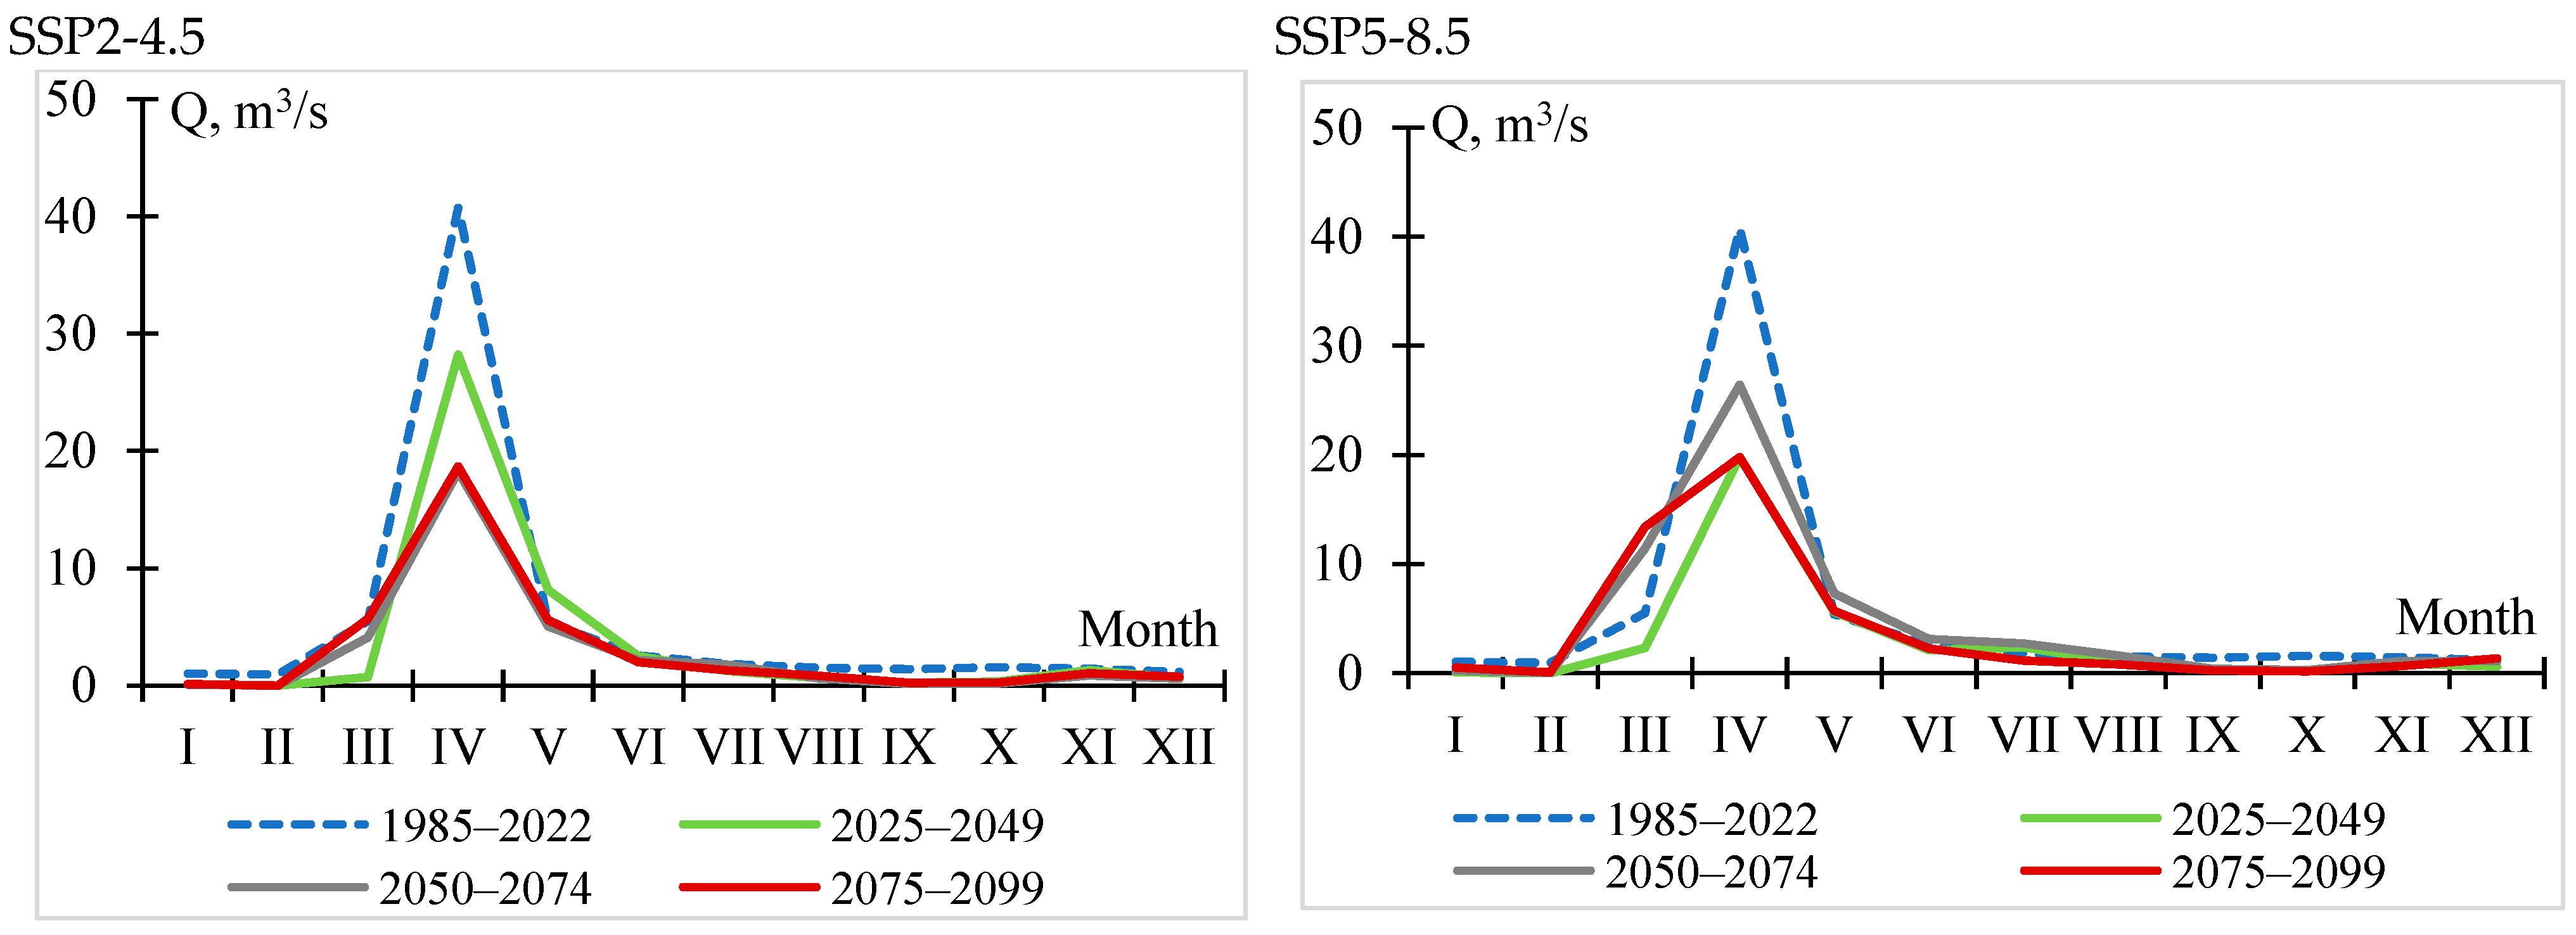
The average annual flow for the historical period (1985–2022) is 5.29 m3/s. According to the SSP2-4.5 scenario (Figure 4), the average annual flow for the period 2025–2049 is 3.68 m3/s, which is 30.5% lower compared to the historical period. This scenario can be attributed to moderate climate perturbations that affect precipitation and snow cover, resulting in reduced flows in the river.
The analysis of flow changes for the forecast periods showed a significant decrease in the water resources of the Ulken Kobda river for both scenarios SSP2-4.5 and SSP5-8.5 compared to the baseline historical period (Figure 4).
Under the SSP5-8.5 scenario, the average annual flow for the period 2025–2049 is around 2.93 m3/s, which is 44.8% lower than the historical value, indicating a more significant reduction. This trend can be attributed to more pronounced climatic changes, including higher temperatures, lower precipitation, and earlier snowmelt.
A comparison of the runoff changes between the two scenarios (SSP2-4.5 and SSP5-8.5) shows that the impact of more severe climatic conditions under the SSP5-8.5 scenario leads to a significant reduction in runoff, by 44.8% (from 5.29 to 2.92 m3/s), in contrast to the more moderate reduction under SSP2-4.5, where the reduction was 30.5% (from 5.29 to 3.68 m3/s). These data confirm that higher levels of greenhouse gas emissions, accompanied by intense climate change, lead to more dramatic reductions in water resources.
Table 3 presents the results of the CMIP6 multi-model ensemble calculations for the predicted annual runoff for the three rivers studied under the SSP2-4.5 and SSP5-8.5 climate change scenarios. For each scenario and time period (2025–2049, 2050–2074, 2074–2099), the 5th and 95th percentiles for the model ensemble are given, which allows for a quantitative assessment of the range of inter-model variability.

5.3. Forecast of Intra-Annual Distribution of River Runoff

A calculation and analysis of the intra-annual runoff dynamics of the Zhabay river was carried out for the forecast period up to 2099 under two scenarios (SSP2-4.5 and SSP5-8.5) for phases of varying water content. Climate change under both scenarios will have a significant impact on the formation, distribution, and seasonal structure of the Zhabay river’s flow. The analysis shows how the intra-annual regime is transformed under global warming conditions. According to CMIP6 scenarios, key climate changes in the Zhabay region include [31] the following:
-
An increase in mean annual air temperature (up to +2–4 °C depending on the scenario);
-
Shortening the duration of the snow period and decreasing snow reserves by the end of winter;
-
Acceleration of snowmelt in spring, leading to abrupt and short-lived floods;
-
Increased evapotranspiration in summer, which increases soil moisture deficit and reduces runoff;
-
A possible increase in precipitation during transitional seasons (autumn), mainly in the form of rainfall.
The combination of these factors forms the key trends in the change of the Zhabay river flow (Figure 5).
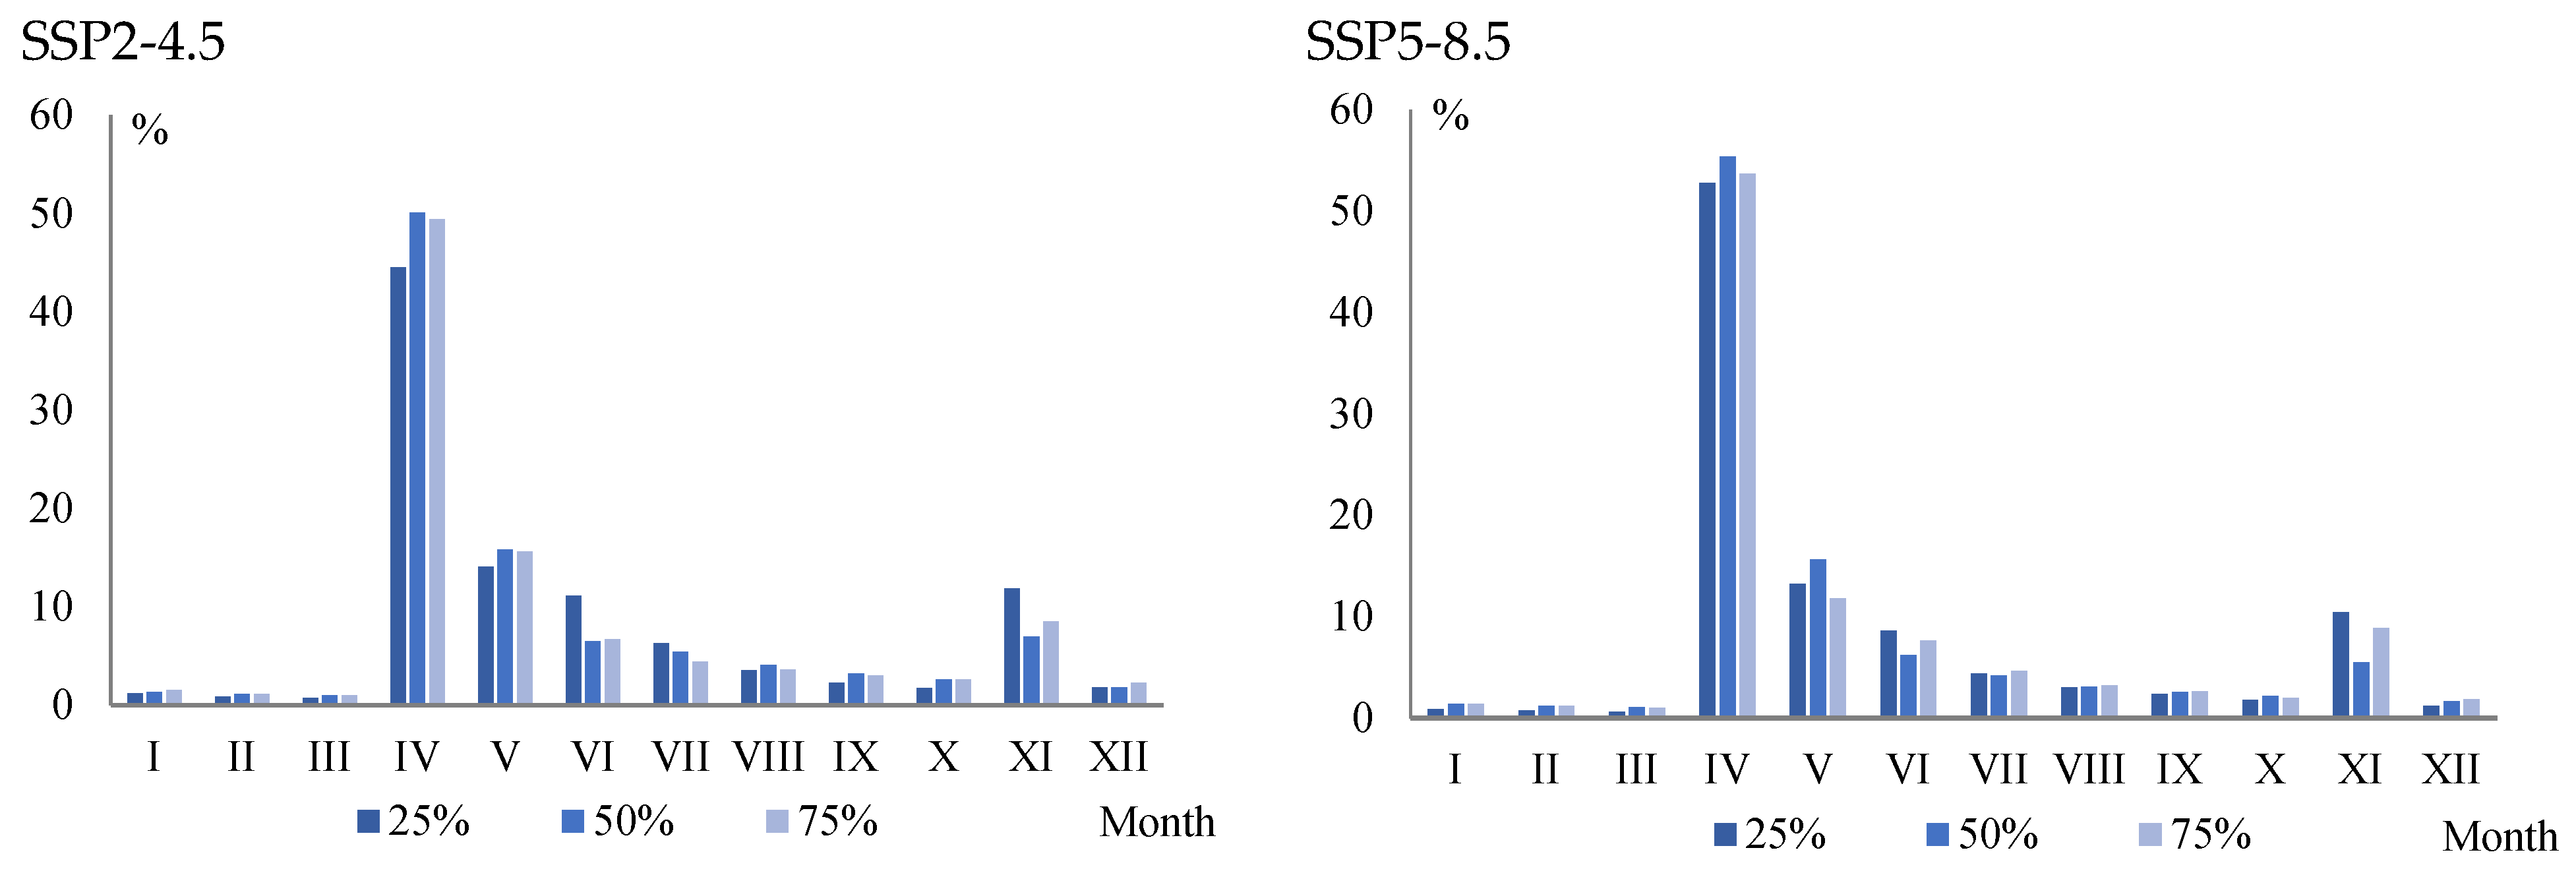
In both scenarios, there is a pronounced seasonality of runoff, dominated by the spring flood (April–May), which accounts for 44 to 55% of the annual volume. During the summer–autumn period (June–November), the contribution decreases significantly to between 18 and 25%, with November showing a localised increase in the runoff share.
The maximum volume of meltwater accumulates in the snowpack during the winter and is released over a short period in spring, resulting in a pronounced runoff peak in April. This pattern is especially distinct in high-flow and average-flow years under both climate scenarios. In contrast to the spring season, October is characterised by significantly lower runoff, which is governed by the end of the vegetation period, reduced evaporation, and moderate precipitation, predominantly in the form of rain. In certain years, a minor increase in runoff may be observed in October, attributed to late-autumn rainfall or specific features of subsurface flow dynamics. However, neither the magnitude nor the intensity of these processes is comparable to that of snowmelt-driven spring floods. Under current climatic conditions, the increasingly earlier termination of the solid precipitation and stabilisation of temperature patterns also contribute to the limited contribution of autumn runoff by inhibiting rapid surface water inflow. Thus, the contrast between the pronounced April peak and the episodic rise in October runoff in the Zhabay river is primarily driven by the dominant role of snowmelt in shaping the spring hydrological regime, whereas autumnal processes have a secondary influence, contributing only to localised anomalies through atmospheric precipitation and delayed groundwater discharge. The winter period (December–March) is characterised by extremely low values of less than 5% of annual runoff, which is typical of the continental climate of the region (Table 4).
According to the SSP2-4.5 scenario, in high-water years (25 per cent), the flood peak occurs in April (44.5 per cent), with notable contributions also in May (14 per cent) and June (11.1 per cent). In autumn, there is a secondary peak in November (11.9%). Winter months cumulatively contribute about 4.7 per cent.
In average water years (50%), April (50.1%) and May (15.8%) form the bulk of the runoff. The summer months are characterised by a decrease to 3–6%. The autumn maximum in November is weakened (6.9%).
In low-water years (75%), the spring peak persists (April—49.4%), whilst summer and autumn months are of limited importance. November increases again (8.5%) as a secondary peak. Winter values are minimal.
However, under scenario SSP5-8.5, in high water years, there is a significant strengthening of spring flows—up to 52.8% in April. The summer months are weakened and a local maximum (10.4%) is again recorded in November. Winter values are less than 3.5 per cent.
In mid-water years. April becomes dominant (55.4%), and May less so with 15.6%. Summer runoff is limited (less than 6%), and November yields 5.5%. Winter is extremely low (1–1.4%).
In low-water years (75%), April (53.7%) remains the main month of flow formation, with May (11.8%) decreasing in importance. Summer and winter have almost no pronounced contribution, with November again showing an increase (8.9%).
Spring floods will increase under extreme climatic scenarios, with the runoff concentration in April. Summer will become even more low-water, especially at SSP5-8.5, which may affect water supply during the growing season. Increased runoff in November may indicate a shift in seasonal precipitation or a change in snowmelt dynamics. Winter runoff loses its hydrological significance and requires a separate analysis in the context of channel freezing and water system management (Table 5).
Thus, there is an increased seasonality of runoff and a growing intra-annual contrast between spring and the rest of the seasons, especially under conditions of intense climatic change under the SSP5-8.5 scenario.
The CMIP6 climate scenarios in the Buktyrma river basin assume [31] the following
-
An increase in air temperature of 2–4 °C, depending on the scenario and season;
-
A reduction in snow cover accumulation in winter, especially under SSP5-8.5;
-
An acceleration of spring snowmelt and an increase in the proportion of precipitation in the form of rain during the warm season;
-
The increased intensity and frequency of autumn and summer showers;
-
A reduction in glacier storage in the highlands, which reduces the steady flow in the summer season.
These changes directly affect the hydrological regime of the Buktyrma mountain river (Figure 6).
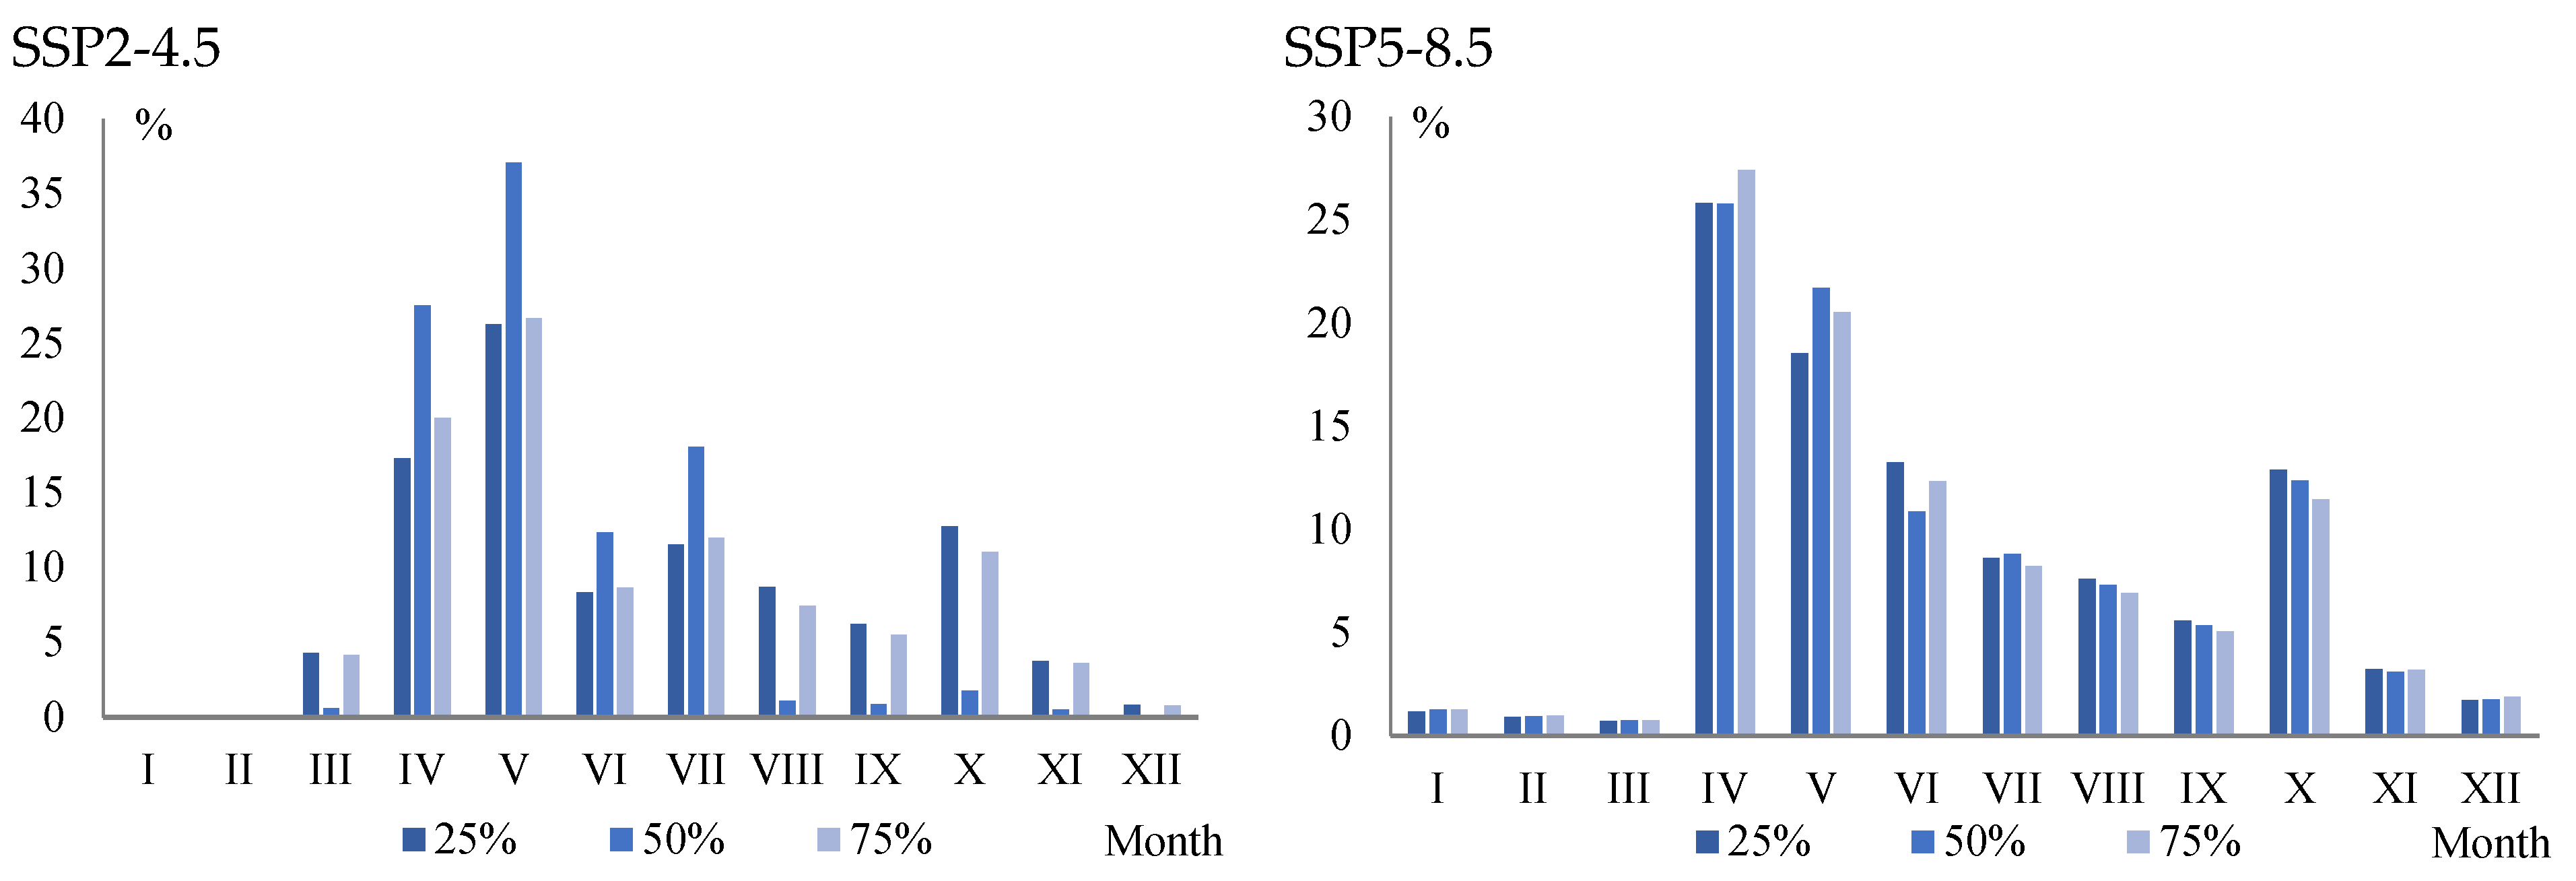
In all water availability variants, the main part of the annual runoff is formed during April–July, with a peak in May or April depending on the scenario. The autumn period (August–November) is also characterised by an additional contribution due to heavy precipitation. The winter period (December–March) remains low water, although there a modest increase in winter discharge is indicated under SSP5-8.5 (Table 6).
According to the SSP2-4.5 scenario, in the temperate climatic scenario, the traditional runoff distribution for mountain rivers is maintained, with a dominance of the May peak:
In high-water years, the runoff peaks are in May (26.2 per cent), with significant contributions also in July (11.5 per cent) and October (12.7 per cent). April and June are also active, which corresponds to the nature of spring–summer snowmelt. Winter runoff is mainly formed in March (4.3 per cent).
In average water years, runoff distribution is concentrated in May (37%) and July (18%). The contribution of autumn months is minimal, especially in August–November. Winter runoff is practically absent.
In dry years, the May maximum (26.7 per cent) and October secondary peak (11.0 per cent) persist. March also remains relatively active (4.2%).
Thus, in SSP2-4.5, the Buktyrma river is characterised by a two-stage flow structure—with the high flows in spring and autumn (October).
According to the SSP5-8.5 scenario, under enhanced warming, significant changes in runoff patterns characteristic of mountain basins are observed:
In high-water years, peak runoff shifts from May to April (25.8%), which is associated with accelerated snowmelt. The May contribution decreases (18.5%), while June and October remain significant (13.2% and 12.9%, respectively). Winter runoff increases, up to 4.5% in total, which may be related to the increased frequency of winter thaws or the transition of precipitation to the liquid phase.
In average water years, there is an even distribution of spring runoff between April (25.8%) and May (21.7%), with moderate values in June (10.9%) and October (12.4%). Winter runoff is about 4.9% of annual runoff.
In low-water years, April becomes the main runoff month (27.4%), while May and June also remain active. October shows a steady contribution (11.4%), winter—up to 4.9%.
For the Ulken Kobda river, under scenario SSP2-4.5—under moderate climate change—spring remains the main flow season, but summer flow gradually decreases due to decreased summer precipitation and increased temperature. Winter remains relatively stable, with minimal change. Under scenario SSP5-8.5—under more extreme climate change—although there will still be more water in the summer, under more extreme climate change, winter runoff will increase and summer runoff will decrease, changing the distribution of runoff by month and season. This is due to warmer winters, changes in precipitation patterns (with increased winter precipitation in the form of snow), and more intense snowmelt.
In order to assess the impact of climate change on the long-term flow distribution of the Ulken Kobda river, data on the intra-annual flow distribution were analysed based on two climate scenarios derived from the CMIP6 model (Figure 7).
Climatic changes projected under scenarios SSP2-4.5 and SSP5-8.5 could significantly affect the flow distribution of the Ulken Kobda river in the future, with a shift in peak flows towards the winter period and a reduction in summer flows (Table 7).
According to scenario SSP2-4.5, in high-water years, spring (April–May) accounts for 57.1 per cent of the annual runoff, while the summer period (June–August) gives 16.1 per cent in May and 4.8 per cent in June. The autumn and winter periods have lower rates, with 1.3% in September and 14.8% in March.
In average water years, spring accounts for 59.5% of the total runoff, summer accounts for 17.8%, autumn accounts for 5%, and winter accounts for 13.2%.
In low-water years, spring receives 63% of the runoff, summer and autumn have minimal contribution, and the winter period is 13.8%.
According to scenario SSP5-8.5, in high-water years, spring accounts for 48.3% of the annual runoff, which is 8.8% lower than in the SSP2-4.5 scenario. Summer runoff decreases to 14.4% and autumn runoff to 5.8%. Winter increases significantly, reaching 23%.
In average years, 55.2% of runoff is given in spring, 14.7% in summer, 4.9% in autumn, and the winter period increases to 15.7%.
In low-water years, 58.5% of runoff is given in spring, whilst summer and autumn lose a significant part, and the winter period is 6%.
6. Discussion

An analysis of the CMIP6 model ensembles for the region indicates a trend towards more frequent extreme hydrological events, including more abrupt floods and prolonged low-water periods in summer [63]. The Central Asian rivers are characterised not only by increased spring floods, but also by an increase in the frequency and duration of summer droughts, as well as a decrease in sustainable summer runoff. For the Buktyrma river and other Central Asian rivers, a doubling of April runoff and a decrease in summer runoff are projected under strong warming scenarios [30]. Similar trends have been identified for the Koktal basin (Zhetysu Alatau, Southeast Kazakhstan), where, in recent decades, there has been an increase in winter runoff, a decrease in the spring peak, and a decrease in summer runoff in low-water years, which is associated with earlier snowmelt and an increase in the frequency of winter thaws [64]. An increase in winter low-water runoff and a redistribution of seasonal water resources are also predicted in the study by Li, Z. et al., who found a statistically significant increase in winter runoff and a redistribution of intra-annual dynamics for the Zhetysu Alatau (Koktal, Sarykan, Bizhi) rivers, where part of the runoff shifts from spring to winter and early spring, and summer runoff decreases [64]. Similar conclusions are given for the Zhaiyk basin, where a decrease in the proportion of spring runoff and an increase in winter and autumn runoff are noted, which is associated with changes in the precipitation structure and temperature conditions [7]. The identified changes in hydrological regimes in the paper are similar to the results of previous regional and global studies. Namely, the shift and intensification of spring runoff peaks due to the accelerated melting of snow cover and glaciers in mountainous regions (Intergovernmental Panel on Climate Change [65]). The present study employs modern CMIP6 ensemble models with high spatial resolution, together with the physically structured hydrological model SWIM, which provides a more detailed representation of processes within the basins. Corrections for climate data biases demonstrate an improvement in the agreement of temperature and precipitation with observed parameters, which improves the quality of the input data for hydrological modelling. The results of the SWIM model calibration, confirmed by the NSE convergence coefficient from 0.65 to 0.94, indicate the high adequacy of reproducing historical discharges. It should nevertheless be emphasised that the assumption of the stationarity of biases may limit the accuracy of predicting extreme hydrological events and changes in precipitation distribution under future climatic conditions. The hydrological model takes into account the processes of snowmelt and the spatial and temporal distribution of precipitation. At the same time, the influence of anthropogenic factors, water intake, and the management of water bodies, is assessed indirectly in this study and requires further in-depth analysis, since these factors can significantly modify the hydrological regime.
Forecasting hydrological processes under climate change is always accompanied by systemic uncertainties. The contribution of climate model variability is taken into account through the use of the CMIP6 ensemble, but the quantitative assessment of uncertainty for these data in the study is limited. To improve the reliability of the forecast, it is recommended to use methods for quantitative assessment of uncertainty, including ensemble the modelling of hydrological processes, as well as probabilistic methods that allow forming confidence intervals.

7. Conclusions

Using the climate scenarios of global data models, water flow projections in 3 Kazakhstan river basins up to 2099 were obtained on the basis of hydrological model SWIM. Key points in each basin of the studied rivers are given as follows:
Buktyrma river—Lesnaya Pristan village. The analysis of the results obtained (according to scenarios SSP2-4.5 and SSP585) showed that changes in water flow until 2049 will be insignificant and close to the current river regime. Between 2050 and 2074, there will be a 1.7-fold increase in the river’s water content in April, with a flow volume of 1611 million m3, compared to 941.2 million m3 for the historical period (1). High water consumption will continue throughout April and May (2). During the period 2075–2099, according to the RCP 4.5 scenario, the peak flood in May will decrease, but a sharp increase in water levels is expected in April; according to the SSP585 scenario, the peak flood will shift from May to April (3). The processes of glacier degradation in the Buktyrma basin are associated with changes in the seasonal distribution of runoff: earlier and more abrupt spring floods are expected, along with a decrease in the stability of summer water supply and a possible increase in extreme hydrological events.
Ulken Kobda River—Kobda village. Under the SSP2-4.5 scenario, the average annual flow for the period 2025–2049 is around 3.68 m3/s, which is 30.5% lower compared to the historical period (1985–2022)—5.29 m3/s (4). This result can be attributed to moderate climatic changes that affect precipitation and snow cover, resulting in reduced flows in the river. Under the SSP5-8.5 scenario, the average annual flow for the period 2025–2049 is around 2.93 m3/s, which is 44.8% lower than the historical value, indicating a more significant reduction (5). This trend can be attributed to more pronounced climatic changes, including higher temperatures, lower precipitation, and earlier snowmelt, which have significant impacts on the hydrological regime of the region.
The results of the analysis of flow changes on the Ulken Kobda river indicate a significant impact of climate change on water resources in the region. Projections show a significant decline in flows in the future, requiring adaptation measures and improved water management, especially in the context of high greenhouse gas emission scenarios (SSP5-8.5).
For Zhabay river—Atbasar city—the analysis of the results obtained showed (according to scenarios SSP2-4.5 and SSP5-8.5) that, between 2025 and 2049, the peak flood discharge will increase by approximately 1.5 times (from 27 to 41 m3/s) (6). From 2050 to 2074, there will be an even greater increase in the river’s water content in April, with the peak flood increasing by 2 times (from 27 to 54 m3/s) (7). During the period 2075–2099, according to the SSP2-4.5 scenario, the river’s water content will continue to increase (8). With the constant flooding of the riverbed in this part of the river, the scenario results play an important role in water resource management planning on the Zhabay river; according to the SSP5-8.5 scenario, the river water availability approaches the current water availability parameters, but there are risks of a sharp increase in the flood peak.
The results of water content in the studied rivers according to the scenarios show a significant change in the temporal and quantitative distribution of water content in rivers in the coming century. The main influence on the surface runoff of the Buktyrma river will be the melting of glaciers and snow. The contribution of glacier degradation to the flow of the Buktyrma river may result in a slight increase in the peak flood level until 2050, but between 2050 and 2099, the maximum volume—the peak of surface runoff—will shift to an earlier period, as the increase in air temperature will lead to an earlier start of high water on rivers (9). On the Zhabay river, after 2050, the most noticeable increase in precipitation is expected, mainly in winter, as well as an increase in torrential rains in spring, so intensive snowmelt and rains will provoke high spring floods, twice as high as the floods at present (10). On the Ulken Kobda river, earlier snowmelt will lead to a reduction in the snow accumulation period in the Ulken Kobda river basin, a decrease in soil freezing, and a decrease in river water content compared to the period from 1985 to 2022.
The rate of air temperature increase in Kazakhstan exceeds the global average, which is intensifying the transformation of the hydrological regime. Modelling under CMIP6 scenarios (SSP2-4.5, SSP5-8.5) indicates the further strengthening of these trends by the end of the 21st century. All considered rivers show a decrease in the proportion of spring runoff and an increase in winter low-water flow (on the Zhabay less than 1% in winter, but the trend is positive). Buktyrma is characterised by a prolonged spring–summer flood, while Zhabay and Ulken Kobda are characterised by a sharp peak in spring and a low winter low-water period. A significant positive trend in spring–summer runoff was detected for the Buktyrma (slope coefficient up to 57 m3/s/10 years in May) (11), and an increase in April runoff by 34 m3/s/10 years for the Zhabay (12). In winter months, all rivers show a positive trend of low-water flow, which is associated with warming and a reduction in the soil freezing depth.
The trends identified in this study—shift and strengthening of the spring peak, reduction in summer runoff, increase in winter low-water runoff and increase in the risk of extreme events—are consistent with the results of independent international and regional studies from recent years. The use of modern climate models and analysis methods makes it possible to improve the reliability of forecasts and the validity of strategies for adapting to climate risks, which is important for long-term water management planning and sustainable water resource management in the region. The quantitative indicators obtained and the trends identified require adjustments to water resource management strategies, especially in the context of increasing water scarcity and the growth of extreme events.

Author Contributions

Conceptualisation, A.N.; methodology, A.T. and L.M.; software, A.N.; formal analysis, Z.S., A.N. and F.H.; data curation, Z.S.; investigation, A.N. and Z.S.; resources, Z.S.; writing—original draft preparation, A.N. and F.H.; writing—review and editing, A.T. and L.M.; visualisation, A.N. and Z.S.; supervision, A.T. and L.M.; project administration, A.T. All authors have read and agreed to the published version of the manuscript.

Funding

This research has been funded by the Committee of Science of the Ministry of Science and Higher Education of the Republic of Kazakhstan (Grant No. AP19678734 ‘Assessment of the current and predicted hydrological changes of Kazakhstan river basins based on modeling’ (ex. Buktyrma, Esil, Zhaiyk rivers)).

Institutional Review Board Statement

Not applicable.

Informed Consent Statement

Not applicable.

Data Availability Statement

Data are contained within the article.

Conflicts of Interest

Fredrik Huthoff is an employee of HKV. The paper reflects the views of the scientists and not the company. The remaining authors declare that the research was conducted in the absence of any commercial or financial relation-ships that could be construed as a potential conflict of interest.

References

  1. Tran, T.N.D.; Nguyen, B.Q.; Grodzka-Łukaszewska, M.; Sinicyn, G.; Lakshmi, V. The Role of Reservoirs under the Impacts of Climate Change on the Srepok River Basin, Central Highlands of Vietnam. Front. Environ. Sci. 2023, 11, 1304845. [Google Scholar] [CrossRef]
  2. Didovets, I.; Krysanova, V.; Nurbatsina, A.; Fallah, B.; Krylova, V.; Saparova, A.; Niyazov, J.; Kalashnikova, O.; Hattermann, F.F. Attribution of current trends in streamflow to climate change for 12 Central Asian catchments. Clim. Change 2024, 177, 16. [Google Scholar] [CrossRef]
  3. Cui, T.; Tian, F.; Yang, T.; Wen, J.; Khan, M.Y.A. Development of a comprehensive framework for assessing the impacts of climate change and dam construction on flow regimes. J. Hydrol. 2020, 590, 125358. [Google Scholar] [CrossRef]
  4. Chigrinets, A.G.; Duskaev, K.K.; Satmurzaev, A.A.; Insigenova, A.E.; Salavatova, J.T. Study of the main characteristics and intra-annual distribution of water flow in the rivers of the territory of Almaty. Hydrometeorol. Ecol. 2021, 3, 44–62. [Google Scholar] [CrossRef]
  5. Abdrakhimov, R.G.; Blagovechshenskiy, V.P.; Ranova, S.U.; Akzharkynova, A.N.; Gülbaz, S.; Aldabergen, U.R.; Kamalbekova, A.N. Changes in Intra-Annual River Runoff in the Ile and Zhetysu Alatau Mountains under Climate Change Conditions. Water 2025, 17, 2165. [Google Scholar] [CrossRef]
  6. Abdrakhimov, R.G.; Blagovechshenskiy, V.P.; Ranova, S.U.; Akzharkynova, A.N.; Gülbaz, S.; Aldabergen, U.R.; Kamalbekova, A.N. Assessment of Changes in Hydrometeorological Indicators and Intra-Annual River Runoff in the Ile River Basin. Water 2024, 16, 1921. [Google Scholar] [CrossRef]
  7. Issaldayeva, S.; Alimkulov, S.; Raimbekova, Z.; Bekseitova, R.; Karatayev, M. The Climatic and River Runoff Trends in Central Asia: The Case of Zhetysu Alatau Region, the South-Eastern Part of Kazakhstan. Heliyon 2023, 9, e17521. [Google Scholar] [CrossRef]
  8. Liu, S.; Long, A.; Yan, D.; Luo, G.; Wang, H. Predicting Ili River Streamflow Change and Identifying the Major Drivers with a Novel Hybrid Model. J. Hydrol. Reg. Stud. 2024, 53, 101807. [Google Scholar] [CrossRef]
  9. Yang, Z.; Bai, P.; Tian, Y.; Liu, X. Glacier Coverage Dominates the Response of Runoff and Its Components to Climate Change in the Tianshan Mountains. Water Resour. Res. 2025, 61, e2024WR037947. [Google Scholar] [CrossRef]
  10. Nurbatsina, A.; Salavatova, Z.; Tursunova, A.; Didovets, I.; Huthoff, F.; Rodrigo-Clavero, M.-E.; Rodrigo-Ilarri, J. Flood modelling of the Zhabay River Basin under climate change conditions. Hydrology 2025, 12, 35. [Google Scholar] [CrossRef]
  11. Kuzin, P.S. Regime of Rivers of Southern Regions of Western Siberia, Northern and Central Kazakhstan; Gidrometeoizdat: Saint Petersburg, Russia, 1953; 538p. [Google Scholar]
  12. Skotselyas, N.I. Calculation of intra-annual runoff distribution for unstudied rivers of the Altai Mountains. Proc. Kazn. 1975, 15, 15–20. [Google Scholar]
  13. Berkaliev, Z.T. Hydrological Regime of Rivers of Central, Northern and Western Kazakhstan; Academy of Sciences of Kazakh SSR: Almaty, Kazakhstan, 1959; 278p. [Google Scholar]
  14. Makhmudova, L.K.; Beisembin, K.; Moldakhmetov, M.; Musina, A. Intra-annual flow distribution of the rivers in the Yesil river basin. Water Conserv. Manag. 2024, 8, 241–250. [Google Scholar] [CrossRef]
  15. Tursyn, N.Z. Assessment of long-term changes in ice phenomena and meteorological elements in the Zhaiyk River. Hydrometeorol. Ecol. 2024; in press. [Google Scholar] [CrossRef]
  16. Burlibaev, M.Z.; Burlibaeva, D.M. O sovremennom sostoyanii gidrologo-gidrokhimicheskogo rezhima reki Zhaiyk [On the Current State of the Hydrological and Hydrochemical Regime of the Zhaiyk River]. Gidrometeorol. Ekol. 2022, 3, 22–30. [Google Scholar] [CrossRef]
  17. Nurbatsina, A.A.; Tursunova, A.A.; Salavatova, Z.T. Intra-annual distribution of runoff of typical rivers of Kazakhstan (using the example of the Buktyrma, Esil, Zhaiyk rivers). Hydrometeorol. Ecol. 2025, 1, 24–37. [Google Scholar] [CrossRef]
  18. Tursunova, A.; Nurbatsina, A.; Salavatova, Z.; Huthoff, F. Sustainability challenges in Kazakhstan’s river systems: Assessing climate-induced hydrological changes. Sustainability 2025, 17, 3405. [Google Scholar] [CrossRef]
  19. Intergovernmental Panel on Climate Change. Climate Change 2021: The Physical Science Basis. Contribution of Working Group I to the Sixth Assessment Report of the Intergovernmental Panel on Climate Change; Masson-Delmotte, V., Zhai, P., Pirani, A., Connors, S.L., Péan, C., Berger, S., Caud, Y., Chen, L., Goldfarb, M.I., Gomis, M., et al., Eds.; Cambridge University Press: Cambridge, UK, 2021; Available online: https://www.ipcc.ch/report/ar6/wg1/ (accessed on 26 June 2025).
  20. Intergovernmental Panel on Climate Change. Climate Change 2022: Impacts, Adaptation and Vulnerability. Contribution of Working Group II to the Sixth Assessment Report of the Intergovernmental Panel on Climate Change; Pörtner, H.-O., Roberts, D.C., Tignor, M., Poloczanska, E.S., Mintenbeck, K., Alegría, A., Craig, M., Langsdorf, S., Löschke, S., Möller, V., et al., Eds.; Cambridge University Press: Cambridge, UK, 2022; Available online: https://www.ipcc.ch/report/ar6/wg2/ (accessed on 11 June 2025).
  21. Ministry of Ecology and Natural Resources of the Republic of Kazakhstan. Second National Communication of the Republic of Kazakhstan to the UNFCCC; Ministry of Ecology and Natural Resources of the Republic of Kazakhstan: Astana, Kazakhstan, 2023.
  22. Jiang, J.; Zhou, T.; Chen, X.; Zhang, L. Future Changes in Precipitation over Central Asia Based on CMIP6 Projections. Environ. Res. Lett. 2020, 15, 054009. [Google Scholar] [CrossRef]
  23. Wu, Y.; Miao, C.; Slater, L.; Fan, X.; Chai, Y.; Sorooshian, S. Hydrological projections un-der CMIP5 and CMIP6: Sources and magnitudes of uncertainty. Bull. Am. Meteorol. Soc. 2024, 105, E59–E74. [Google Scholar] [CrossRef]
  24. Liu, T.; Liu, Y.; Si, Z.; Wang, L.; Zhao, Y.; Wang, J. Future Streamflow and Hydrological Drought Under CMIP6 Climate Projections. Atmosphere 2025, 16, 691. [Google Scholar] [CrossRef]
  25. Fallah, B.; Didovets, I. Climate change impacts on Central Asia: Trends, extremes and future projections. Int. J. Climatol. 2024; submitted. [Google Scholar] [CrossRef]
  26. Gulakhmadov, A.; Chen, X.; Gulahmadov, N.; Rizwan, M.; Gulakhmadov, M.; Nadeem, M.U.; Rakhimova, M.; Liu, T. Modeling of Historical and Future Changes in Temperature in the Panj River Basin (PRB) in Central Asia. Sci. Rep. 2025; in press. [Google Scholar]
  27. Arjdal, K.; Driouech, F.; Vignon, É.; Chéruy, F.; Manzanas, R.; Drobinski, P.; Chehbouni, A.; Idelkadi, A. Future of Land Surface Water Availability over the Mediterranean Basin and North Africa: Analysis and Synthesis from the CMIP6 Exercise. Atmos. Sci. Lett. 2023, 24, e1180. [Google Scholar] [CrossRef]
  28. Herrera-Lormendez, P.; John, A.; Douville, H.; Matschullat, J. Projected Changes in Synoptic Circulations over Europe and Their Implications for Summer Precipitation: A CMIP6 Perspective. Int. J. Climatol. 2023, 43, 3373–3390. [Google Scholar] [CrossRef]
  29. Zhang, B.; Liu, C.; Wang, G.; Su, B.; Zhao, J. Evaluation of the Performance of CMIP6 Models in Simulating Extreme Precipitation and Its Projected Changes in Global Climate Regions. Nat. Hazards 2025, 121, 1737–1763. [Google Scholar] [CrossRef]
  30. Deepa, R.; Kumar, V.; Sundaram, S. A Systematic Review of Regional and Global Climate Extremes in CMIP6 Models under Shared Socio-Economic Pathways. Theor. Appl. Climatol. 2024, 4, 2523–2543. [Google Scholar] [CrossRef]
  31. Hua, L.; Zhao, T.; Zhong, L. Future changes in drought over Central Asia under CMIP6 forcing scenarios. J. Hydrol. Reg. Stud. 2022, 43, 101191. [Google Scholar] [CrossRef]
  32. Schaffhauser, T.; Lange, S.; Tuo, Y.; Disse, M. Change in climate impact assessment from CMIP5 to CMIP6 in a high-mountainous catchment of Central Asia. In Proceedings of the EGU General Assembly Conference Abstracts, Vienna, Austria, 23–27 May 2022. [Google Scholar]
  33. Shivareva, S.P.; Avezova, A. Water resources of Kazakhstan: State and water management. J. Hydrol. Ecol. 2012, 7, 58–64. [Google Scholar]
  34. Zhensikbayeva, N.; Saparov, K.; Kabdrakhmanova, N.; Atasoy, E.; Yeginbayeva, A.; Abzeleeva, K.; Bakin, S.; Sedelev, V.; Amangeldy, N. An assessment of the construction and hydrographic conditions of Bukhtarma and Ust-Kamenogorsk reservoirs in the East Kazakhstan region for 2017–2021. Sustainability 2024, 16, 10348. [Google Scholar] [CrossRef]
  35. Makhmudova, L.; Moldakhmetov, M.; Mussina, A.; Kurmangazy, E.; Kambarbekov, G.; Zharylkassyn, A.; Zhulkainarova, M. Study of Water Stress in Plains Rivers: Climate and Human Influence. Evergreen 2024, 11, 1530–1543. [Google Scholar] [CrossRef]
  36. Alimkulov, S.; Tursunova, A.; Saparova, A.; Kulebaev, K.; Zagidullina, A.; Myrzahmetov, A. Resources of River Runoff of Kazakhstan. Int. J. Eng. Adv. Technol. 2019, 8, 2242–2250. [Google Scholar] [CrossRef]
  37. Didovets, I.; Lobanova, A.; Krysanova, V.; Menz, C.; Babagalieva, Z.; Nurbatsina, A.; Gavrilenko, N.; Khamidov, V.; Umirbekov, A.; Qodirov, S.; et al. Central Asian rivers under climate change: Impacts assessment in eight representative catchments. J. Hydrol. Reg. Stud. 2021, 34, 100779. [Google Scholar] [CrossRef]
  38. Eyring, V.; Bony, S.; Meehl, G.A.; Senior, C.A.; Stevens, B.; Stouffer, R.J.; Taylor, K.E. Overview of the Coupled Model Intercomparison Project Phase 6 (CMIP6). Geosci. Model. Dev. 2016, 9, 1937–1958. [Google Scholar] [CrossRef]
  39. O’NEill, B.C.; Tebaldi, C.; van Vuuren, D.P.; Eyring, V.; Friedlingstein, P.; Hurtt, G.; Knutti, R.; Kriegler, E.; Lamarque, J.-F.; Lowe, J.; et al. The Scenario Model Intercomparison Project (ScenarioMIP) for CMIP6. Geosci. Model. Dev. 2016, 9, 3461–3482. [Google Scholar] [CrossRef]
  40. Golian, S.; El-Idrysy, H.; Stambuk, D. Using CMIP6 Models to Assess Future Climate Change Effects on Mine Sites in Kazakhstan. Hydrology 2023, 10, 150. [Google Scholar] [CrossRef]
  41. Models in NASA Earth Exchange Global Daily Downscaled Projections (NEX-GDDP-CMIP6). NASA Center for Climate Simulation. Available online: https://www.nccs.nasa.gov/services/data-collections/land-based-products/nex-gddp-cmip6 (accessed on 14 March 2025).
  42. Teutschbein, C.; Seibert, J. Bias correction of regional climate model simulations for hydrological climate-change impact studies: Review and evaluation of different methods. J. Hydrol. 2012, 456–457, 12–29. [Google Scholar] [CrossRef]
  43. Hay, L.E.; Wilby, R.L.; Leavesley, G.H. A Comparison of Delta Change and Downscaled GCM Scenarios for Three Mountainous Basins in the United States 1. J. Am. Water Resour. Assoc. 2000, 36, 387–397. [Google Scholar] [CrossRef]
  44. Lenderink, G.; Buishand, A.; Van Deursen, W. Estimates of Future Discharges of the River Rhine Using Two Scenario Methodologies: Direct versus Delta Approach. Hydrol. Earth Syst. Sci. 2007, 11, 1145–1159. [Google Scholar] [CrossRef]
  45. IPCC-TGICA. General Guidelines on the Use of Scenario Data for Climate Impact and Adaptation Assessment; Version 1; IPCC Data Distribution Centre: Geneva, Switzerland, 2004; Available online: https://www.ipcc-data.org/guidelines/dgm_no2_v1_09_2004.pdf (accessed on 13 June 2025).
  46. Leander, R.; Buishand, T.A. Resampling of Regional Climate Model Output for the Simulation of Extreme River Flows. J. Hydrol. 2007, 332, 487–496. [Google Scholar] [CrossRef]
  47. Panofsky, H.A.; Brier, G.W. Some Applications of Statistics to Meteorology; Mineral Industries Extension Services, College of Mineral Industries, Pennsylvania State University: University Park, PA, USA, 1958. [Google Scholar]
  48. Themeßl, M.J.; Gobiet, A.; Heinrich, G. Empirical-Statistical Downscaling and Error Correction of Regional Climate Models and Its Impact on the Climate Change Signal. Clim. Change 2012, 112, 449–468. [Google Scholar] [CrossRef]
  49. Piani, C.; Weedon, G.P.; Best, M.; Gomes, S.M.; Viterbo, P.; Hagemann, S.; Haerter, J.O. Statistical Bias Correction of Global Simulated Daily Precipitation and Temperature for the Application of Hydrological Models. J. Hydrol. 2010, 395, 199–215. [Google Scholar] [CrossRef]
  50. Krysanova, V.; Arnold, J.G. Advances in ecohydrological modelling with SWAT—A review. Hydrol. Sci. J. 2008, 53, 939–947. [Google Scholar] [CrossRef]
  51. Krysanova, V.; Hattermann, F.; Wechsung, F. Development of the Ecohydrological Model SWIM for Regional Impact Studies and Vulnerability Assessment. Hydrol. Process. 2005, 19, 763–783. [Google Scholar] [CrossRef]
  52. Hesse, C.; Krysanova, V. Modeling Climate and Management Change Impacts on Water Quality and In-Stream Processes in the Elbe River Basin. Water 2016, 8, 40. [Google Scholar] [CrossRef]
  53. Hattermann, F.F.; Wattenbach, M.; Krysanova, V.; Wechsung, F. Runoff Simulations on the Macroscale with the Ecohydrological Model SWIM in the Elbe Catchment—Validation and Uncertainty Analysis. Hydrol. Process. Int. J. 2005, 19, 693–714. [Google Scholar] [CrossRef]
  54. Lobanova, A.; Liersch, S.; Nunes, J.P.; Didovets, I.; Stagl, J.; Huang, S.; Koch, H.; López, M.d.R.R.; Maule, C.F.; Hattermann, F.; et al. Hydrological Impacts of Moderate and High-End Climate Change Across European River Basins. J. Hydrol. Reg. Stud. 2018, 18, 15–30. [Google Scholar] [CrossRef]
  55. Gmurman, V.E. Theory of Probability and Mathematical Statistics: Textbook for Universities, 10th ed.; stereotype; Vysshaya Shkola: Moscow, Russia, 2004; 479p, ISBN 5-06-004214-6. [Google Scholar]
  56. Nash, J.E.; Sutcliffe, J.V. River Flow Forecasting through Conceptual Models, Part I—A Discussion of Principles. J. Hydrol. 1970, 10, 282–290. [Google Scholar] [CrossRef]
  57. Andreyanov, V.G. Intra-Annual Distribution of Runoff; Gidrometeoizdat: Saint Petersburg, Russia, 1960. [Google Scholar]
  58. Sarigil, G.; Cavus, Y.; Aksoy, H.; Eris, E. Frequency curves of high and low flows in intermittent river basins for hydrological analysis and hydraulic design. Stoch. Environ. Res. Risk Assess. 2024, 38, 3079–3092. [Google Scholar] [CrossRef]
  59. Rozhdestvenskii, A.V.; Chebotarev, A.I. Statisticheskie Metody v Gidrologii [Statistical Methods in Hydrology]; Gidro-meteoizdat: Saint Petersburg, Russia, 1974. [Google Scholar]
  60. ISIMIP. The Inter-Sectoral Impact Model Intercomparison Project. 2023. Available online: https://www.isimip.org/ (accessed on 21 February 2025).
  61. World Meteorological Organization (WMO). Guidelines on the Calculation of Climate Normals (WMO-No. 1203); WMO: Geneva, Switzerland, 2017; Available online: https://www.agroorbi.pt/livroagrometeorologia/DocsProg/Temas%26Exerc%C3%ADciosExtraPorCap%C3%ADtulo/Cap1_Introdu%C3%A7%C3%A3o/Docs/WMO%20Guidelines%20on%20the%20Calculation%20of%20Climate%20Normals_en.pdf (accessed on 5 June 2025).
  62. Livezey, R.E.; Vinnikov, K.Y.; Timofeyeva, M.M.; Tinker, R.; van den Dool, H.M. Estimation and Extrapolation of Climate Normals and Climatic Trends. J. Appl. Meteorol. Climatol. 2007, 46, 1759–1776. [Google Scholar] [CrossRef]
  63. De Beurs, K.M.; Henebry, G.M.; Owsley, B.C.; Sokolik, I.N. Large Scale Climate Oscillation Impacts on Temperature, Precipitation and Land Surface Phenology in Central Asia. Environ. Res. Lett. 2018, 13, 065018. [Google Scholar] [CrossRef]
  64. Zoi Environment Network. Climate Change in Central Asia: A Visual Synthesis; Zoi Environment Network: Geneva, Switzerland, 2018. [Google Scholar]
  65. Legg, S. IPCC, 2021: Climate Change 2021—The Physical Science Basis. Interaction 2021, 49, 44–45. [Google Scholar]
Figure 1. Catchment areas: Ulken Kobda river—Kobda village, Zhabay river—Atbasar city, and Buktyrma river—Lesnaya Pristan village.
Atmosphere 16 01020 g001
Figure 2. Flow hydrograph of the Zhabay river—Atbasar city—according to SSP2-4.5 and SSP5-8.5 scenario data.
Atmosphere 16 01020 g002
Figure 3. Flow hydrograph of the river Buktyrma—Lesnaya Pristan village according to the SSP2-4.5 and SSP5-8.5 scenarios.
Atmosphere 16 01020 g003
Figure 4. Flow hydrograph of the river Ulken Kobda—Kobda village—according to the SSP2-4.5 and SSP5-8.5 scenarios.
Atmosphere 16 01020 g004
Figure 5. Intra-annual flow distribution on the Zhabay river—Atbasar city for years of different water availability for the period 2025–2099: 25%—high-water year, 50%—middle-water year, 75%—low-water year.
Atmosphere 16 01020 g005
Figure 6. Intra-annual flow distribution on the Buktyrma river—Lesnaya Pristan village for years of different water availability during the period 1985–2022, 25%—high-water year, 50%—middle-water year, and 75%—low-water year.
Atmosphere 16 01020 g006
Figure 7. Intra-annual flow distribution on the Ulken Kobda river—Kobda village for years of different water availability for 1985–2022, 25%—high-water year, 50%—middle-water year, and 75%—low-water year.
Atmosphere 16 01020 g007
Table 1. Description of GCMs from the CMIP6 dataset.
Model IndexCountryModel NameAtmospheric Resolution (Latitude × Longitude)Choosing a Model by Air TemperatureChoosing a Model by Atmospheric Precipitation
1ACCESS-ESM1-5 Australia Australian Community Climate and Earth System Simulator 1.875° × 1.25°++
2CanESM5 Canada Canadian Earth System Model2.81° × 2.77°++
3CMCC-CM2-SR5 Italy Centro Euro-Mediterraneo sui Cambiamenti Climatici Climate Model 20.9° × 1.25°+
4CNRM-ESM2-1 France Centre National de Recherches Météorologiques Earth System Model 1.41° × 1.39°+
5EC-Earth3-VEG-LR Consortium of European Institutions EC-Earth Consortium Earth System Model 0.7° × 0.7°+
6GFDL-CM4 USA Geophysical Fluid Dynamics Laboratory Climate Model 1.25° × 1°+
7GFDL-ESM4 USA Geophysical Fluid Dynamics Laboratory Earth System Model1.25° × 1° +
8HadGEM3-GC31-LL UK Hadley Centre Global Environment Model1.88° × 1.25°+
9HadGEM3-GC31-MM UK Hadley Centre Global Environment Model1.88° × 1.25°+
10IITM-ESM India Indian Institute of Tropical Meteorology Earth System Model2° × 2°+
11INM-CM5-0 Russia Institute of Numerical Mathematics Climate Model 2° × 1.5° +
12KACE-1-0-G South Korea Korea Institute of Atmospheric Prediction Systems Climate Model 1.88° × 1.25°+
13KIOST-ESM South Korea Korea Institute of Ocean Science and Technology Earth System Model1.88° × 1.25°+
14MIROC6 Japan Model for Interdisciplinary Research on Climate 1.41° × 1.39°+
15MIROC-ES2L Japan Model for Interdisciplinary Research on Climate Earth System 2.81° × 2.77°+
16NESM3 China Nanjing University of Information Science and Technology Earth System Model 1.88° × 1.85°++
17TaiESM1 Taiwan Taiwan Earth System Model 2° × 2°+
18UKESM1-0-LL United Kingdom UK Earth System Model 1.88° × 1.25° +
Table 2. Main parameters of the calibration process for the rivers under study.
Name of the RiverName of the Hydrological PostCalibration PeriodNSE MeaningCorrelation Coefficient, R
StartEnd
BuktyrmaLesnaya Pristan village200220070.850.89
ZhabayAtbasar city200020170.940.98
Ulken KobdaKobda village198419920.650.84
Table 3. Projected changes in annual runoff of the Buktyrma, Zhabay, and Ulken Kobda rivers according to the CMIP6 model ensemble (5th and 95th percentiles) in the SSP2-4.5 and SSP5-8.5 scenarios.
ScenariosYearsBuktyrma River, m3/sZhabay River, m3/sUlken Kobda River, m3/s
5%95%5%95%5%95%
SSP2-4.52025–204933520155.47.357.240.86
2050–207434020355.115.96.521.62
2074–209936820650.96.546.320.69
SSP5-8.5 2025–2049380.4166.837.818.436.691.13
2050–2074396.6198.639.437.1710.040.77
2074–2099390.2213.644.477.688.451.55
Base period 1985–202222913.05.3
Table 4. Intra-annual distribution of the runoff of the Zhabay river—Atbasar city—for years of different water availability (in % of annual runoff).
SSP2-4.5
Provision of the year, %Spring (IV–V)Summer–Autumn (VI–XI)Winter (XII–III)Amount for the year
IVVVIVIIVIIIIXXXIXIIIIIIII
25%—high water44.514.011.16.33.52.31.811.91.81.20.90.8100
50%—middle water50.115.86.55.44.13.22.66.91.81.31.21.0100
75%—low water49.415.66.74.53.63.02.68.52.31.61.11.0100
SSP5-8.5
Provision of the year, %Spring (IV–V)Summer–Autumn (VI–XI)Winter (XII–III)Amount for the year
IVVVIVIIVIIIIXXXIXIIIIIIII
25%—high water52.813.28.64.43.02.41.810.41.20.90.70.6100
50%—middle water55.415.66.24.23.12.62.25.51.71.41.21.1100
75%—low water53.711.87.74.63.22.62.08.91.91.41.21.0100
Table 5. Comparative characteristics of seasonal features of river flow under scenarios SSP2-4.5 and SSP5-8.5.
IndicatorSSP2-4.5SSP5-8.5
Spring peakApril (up to 50%)April (up to 55%)
Flood durationStretched (IV–V)Compressed, sharp peak
Summer runoff+10–18%+3–8%
Autumn contribution (XI)Up to +11%Up to +10.4%
Winter runoffLow, March—activeAlmost disappears
SeasonalityPronouncedSharply contrasted
Table 6. Intra-annual flow distribution of the Buktyrma river—Lesnaya Pristan —for years of different water availability (in % of annual flow).
SSP2-4.5
Provision of the year, %Spring–Summer (IV–VII)Autumn (VIII–XI)Winter (XII–III)Amount for the year
IVVVIVIIVIIIIXXXIXIIIIIIII
25%—high water17.326.28.311.58.76.212.73.70.80.10.14.3100
50%—middle water27.537.012.318.01.10.91.80.50.10.00.00.6100
75%—low water20.026.78.712.07.45.511.03.60.80.10.14.2100
SSP5-8.5
Provision of the year, %Spring–Summer (IV–VII)Autumn (VIII–XI)Winter (XII–III)Amount for the year
IVVVIVIIVIIIIXXXIXIIIIIIII
25%—high water25.818.513.28.67.65.612.93.21.71.20.90.7100
50%—middle water25.821.710.98.87.35.312.43.11.81.31.00.8100
75%—low water27.420.512.38.26.95.111.43.21.91.31.00.7100
Table 7. Intra-annual flow distribution of the Ulken Kobda river—Kobda village for years with different water availability (in % of annual flow).
SSP2-4.5
Provision of the year, %Spring (IV–V)Summer–Autumn (VI–XI)Winter (XII–III)Amount for the year
IVVVIVIIVIIIIXXXIXIIIIIIII
25%—high water57.116.14.82.81.30.70.30.41.50.20.014.8100
50%—middle water59.517.82.91.50.90.50.20.22.80.50.213.2100
75%—low water63.017.81.80.80.50.30.10.21.60.30.013.8100
SSP5-8.5
Provision of the year, %Spring (IV–V)Summer–Autumn (VI–XI)Winter (XII–III)Amount for the year
IVVVIVIIVIIIIXXXIXIIIIIIII
25%—high water48.314.45.83.21.60.40.20.81.80.50.023.0100
50%—middle water55.214.74.92.81.70.60.50.92.50.60.215.7100
75%—low water58.516.57.54.12.60.50.91.50.21.40.56.0100
Disclaimer/Publisher’s Note: The statements, opinions and data contained in all publications are solely those of the individual author(s) and contributor(s) and not of MDPI and/or the editor(s). MDPI and/or the editor(s) disclaim responsibility for any injury to people or property resulting from any ideas, methods, instructions or products referred to in the content.