Particulate Matter (PM10) Concentrations and Emissions at a Commercial Laying Hen House with High-Quality and Long-Term Measurement
Abstract
1. Introduction
2. Materials and Methods
2.1. The Monitoring Site
2.1.1. Egg Farm and Laying Hen House
2.1.2. House Ventilation
2.1.3. Laying Hens
2.2. Monitoring Method
2.2.1. Mobile Lab
2.2.2. Monitoring Instrument and Sensors
2.2.3. Data Acquisition and Control
2.3. PM10 Sampling and Concentration Measurement
2.3.1. Exhaust Air PM10 Concentration
2.3.2. Outdoor Air PM10 Concentration
2.4. Other Measurements
2.4.1. Ventilation Rate Measurement
- All 46 fans were monitored individually and continuously for their blade rotational speeds using NPN Hall Effect sensors (Model NJK-5002C, made in Taiwan).
- Differential static pressures across the house’s west and east side walls, in which the ventilation fans were installed, were continuously measured using differential pressure sensors (Model 260, Setra Systems, Boxborough, MA, USA).
- A portable Wall Fan Tester was designed and built to determine the on-site fan ventilation rates under different fan rotational speeds and differential static pressures.
- Exhaust air speeds were measured continuously at two selected fans (fans 3 and 4) using 18 cm vane axial anemometer (Model 27106T, R.M. Young Co., Traverse City, MI, USA) for real-time fan operation check as a quality assurance measure.
2.4.2. Weather Measurement
2.4.3. Indoor Temperature and Relative Humidity Measurement
2.4.4. Hen Activity, House Lighting, and Manure Belt Operation Monitoring
2.5. Data Processing, Analysis, and Interpretation
2.5.1. Data Processing Procedure and Software
2.5.2. PM10 Emission Calculation
2.5.3. Data Analysis and Emission Assessment
3. Results and Discussion
3.1. Data Completeness
3.2. Outdoor Environmental Conditions
3.2.1. Outdoor Temperature and Relative Humidity
3.2.2. Solar Radiation, Wind Speed, and Atmospheric Pressure
3.3. Indoor Environmental Condition
3.3.1. Indoor Temperature and Relative Humidity
3.3.2. House Ventilation Rate
3.3.3. House Lighting
3.4. PM10 Concentration
3.4.1. PM10 Concentration at Ambient and STP Conditions
3.4.2. Indoor and Outdoor PM10 Concentration
3.4.3. Temporal Variations in PM10 Concentration
3.4.4. PM10 Concentration Difference Between TEOM-N and TEOM-S
3.4.5. Pegged PM10 Concentration
3.5. PM10 Emission Rate
3.5.1. PM10 Emission from the House
3.5.2. Temporal Variation in PM10 Emission
3.5.3. Effect of Concentration and Ventilation on PM10 Emission
3.5.4. Effects of Molting on the Egg Farm PM10 Emission
3.5.5. PM10 Emission from the Egg Farm
3.6. Comparison with the Reported PM10 Concentration and Emission
4. Conclusions
- (1)
- High-level quality assurance and quality control played a major role in achieving >98% PM10 emission data completeness.
- (2)
- Long-term and continuous measurement are necessary to cover seasonal and diurnal variations in PM10 concentrations and emissions and to characterize air pollution at animal buildings.
- (3)
- Measurement results from the two side-by-side TEOMs demonstrated that different instruments can introduce variations in measurement results.
- (4)
- During the routine house cleaning time using a power dust blower near the indoor TEOMs by the farm staff, the airborne PM10 concentrations sometimes went extremely high and exceeded 9000 µg m−3.
- (5)
- The ADM in-house PM10 concentration at STP, averaged from the two TEOMs, was 236 µg m−3, close to the 256 µg m−3 measured in the same house in 2004–2005. The ADM outdoor PM10 concentration at STP was 33 µg m−3.
- (6)
- The net ADM PM10 emissions from the house in three different units were 2.6 kg d−1 house−1, 6319 mg d−1 AU−1 and 18.9 mg d−1 hen−1. The ADM PM10 emission of 18.9 mg d−1 hen−1 was within the range reported in the literature, which was between 12.4 and 25.2 mg d−1 hen−1 for manure belt laying hen houses.
- (7)
- Comparison with the PM10 emissions from the same house in 2004–2005 revealed that artificial molting was related to a remarkable increase in PM10 concentrations and emissions.
- (8)
- Based on the emission per hen per day from the house, the estimated ADM PM10 emission from the entire egg farm was 35.6 kg d−1. The annual emission from the egg farm was 12,702 kg year−1 (14.0 tons per year), below the emission threshold of ≥250 tons per year for Type A Sources and ≥100 tons per year for Type B Sources for Primary PM10.
Author Contributions
Funding
Institutional Review Board Statement
Informed Consent Statement
Data Availability Statement
Acknowledgments
Conflicts of Interest
References
- Guyonnet, V. (Ed.) World egg production and marketing trends. In Handbook of Egg Science and Technology; CRC Press: Boca Raton, FL, USA, 2023; Chapter 2; pp. 9–26. [Google Scholar] [CrossRef]
- USEPA. The Clean Air Act (As Amended Through P.L. 108–201, February 24, 2004); U.S. Environmental Protection Agency: Washington, DC, USA, 2004; p. 465.
- USEPA. Particulate Matter. Available online: http://www.epa.gov/pm/ (accessed on 1 February 2025).
- Kim, K.H.; Kabir, E.; Kabir, S. A review on the human health impact of airborne particulate matter. Environ. Int. 2015, 74, 136–143. [Google Scholar] [CrossRef]
- Adams, K.; Greenbaum, D.S.; Shaikh, R.; van Erp, A.M.; Russell, A.G. Particulate matter components, sources, and health: Systematic approaches to testing effects. J. Air Waste Manage. Assoc. 2015, 65, 544–558. [Google Scholar] [CrossRef]
- Grantz, D.A.; Garner, J.H.B.; Johnson, D.W. Ecological effects of particulate matter. Environ. Int. 2003, 29, 213–239. [Google Scholar] [CrossRef]
- Prajapati, S.K. Ecological effect of airborne particulate matter on plants. Environ. Skept. Crit. 2012, 1, 12–22. [Google Scholar]
- Cambra-Lopez, M.; Hermosilla, T.; Lai, H.T.L.; Aarnink, A.J.A.; Ogink, N.W.M. Particulate matter emitted from poultry and pig houses: Source identification and quantification. Trans. ASABE 2011, 54, 629–642. [Google Scholar] [CrossRef]
- Ahaduzzaman, M.; Milan, L.; Morton, C.L.; Gerber, P.F.; Walkden-Brown, S.W. Characterization of poultry house dust using chemometrics and scanning electron microscopy imaging. Poult. Sci. 2021, 100, 11. [Google Scholar] [CrossRef] [PubMed]
- Kirychuk, S.P.; Dosman, J.A.; Reynolds, S.J.; Willson, P.; Senthilselvan, A.; Feddes, J.J.R.; Classen, H.L.; Guenter, W. Total dust and endotoxin in poultry operations: Comparison between cage and floor housing and respiratory effects in workers. J. Occup. Environ. Med. 2006, 48, 741–748. [Google Scholar] [CrossRef] [PubMed]
- Wang, K.; Shen, D.; Dai, P.Y.; Li, C.M. Particulate matter in poultry house on poultry respiratory disease: A systematic review. Poult. Sci. 2023, 102, 8. [Google Scholar] [CrossRef] [PubMed]
- Bao, J.; Xie, Q.J. Artificial intelligence in animal farming: A systematic literature review. J. Clean Prod. 2022, 331, 13. [Google Scholar] [CrossRef]
- Lagua, E.; Mun, H.-S.; Ampode, K.M.B.; Park, H.-R.; Kim, Y.-H.; Yang, C.-J. Monitoring using artificial intelligence reveals critical links between housing conditions and respiratory health in pigs. J. Anim. Behav. Biometeorol. 2024, 12, e2024008. [Google Scholar] [CrossRef]
- Burns, A.M.; Chandler, G.; Dunham, K.J.; Carlton, A.G. Data gap: Air quality networks miss air pollution from concentrated animal feeding operations. Environ. Sci. Technol. 2023, 57, 20718–20725. [Google Scholar] [CrossRef]
- Xin, H.; Gates, R.S.; Green, A.R.; Mitloehner, F.M.; Moore, P.A.; Wathes, C.M. Environmental impacts and sustainability of egg production systems. Poult. Sci. 2011, 90, 263–277. [Google Scholar] [CrossRef]
- Knight, R.M.; Tong, X.; Zhao, L.; Manuzon, R.B.; Darr, M.J.; Heber, A.J.; Ni, J.-Q. Particulate matter concentrations and emission rates at two retrofitted manure-belt layer houses. Trans. ASABE 2021, 64, 829–841. [Google Scholar] [CrossRef]
- Ni, J.-Q.; Diehl, C.A.; Chai, L.; Chen, Y.; Heber, A.J.; Lim, T.-T.; Bogan, B.W. Factors and characteristics of ammonia, hydrogen sulfide, carbon dioxide, and particulate matter emissions from two manure-belt layer hen houses. Atmos. Environ. 2017, 156, 113–124. [Google Scholar] [CrossRef]
- Ni, J.-Q.; Chai, L.; Chen, L.; Bogan, B.W.; Wang, K.; Cortus, E.L.; Heber, A.J.; Lim, T.-T.; Diehl, C.A. Characteristics of ammonia, hydrogen sulfide, carbon dioxide, and particulate matter concentrations in high-rise and manure-belt layer hen houses. Atmos. Environ. 2012, 57, 165–174. [Google Scholar] [CrossRef]
- Heber, A.J.; Lim, T.-T.; Ni, J.-Q.; Tao, P.C.; Schmidt, A.M.; Koziel, J.A.; Hoff, S.J.; Jacobson, L.D.; Zhang, Y.; Baughman, G.B. Quality assured measurements of animal building emissions: Particulate matter concentrations. J. Air Waste Manage. Assoc. 2006, 56, 1642–1648. [Google Scholar] [CrossRef] [PubMed]
- Li, Q.-F.; Wang-Li, L.; Wang, K.; Chai, L.; Cortus, E.L.; Kilic, I.; Bogan, B.W.; Ni, J.-Q.; Heber, A.J. The National Air Emissions Monitoring Study’s southeast layer site: Part II. Particulate matter. Trans. ASABE 2013, 56, 1173–1184. [Google Scholar] [CrossRef]
- Dunlop, M.; Ristovski, Z.D.; Gallagher, E.; Parcsi, G.; Modini, R.L.; Agranovski, V.; Stuetz, R.M. Odour, dust and non-methane volatile organic-compound emissions from tunnel-ventilated layer-chicken sheds: A case study of two farms. Anim. Prod. Sci. 2013, 53, 1309–1318. [Google Scholar] [CrossRef][Green Version]
- Morgan, R.J.; Wood, D.J.; Van Heyst, B.J. The development of seasonal emission factors from a Canadian commercial laying hen facility. Atmos. Environ. 2014, 86, 1–8. [Google Scholar] [CrossRef]
- Wang, Y.; Niu, B.; Ni, J.-Q.; Xue, W.; Zhu, Z.; Li, X.; Zou, G. New insights into concentrations, sources and transformations of NH3, NOx, SO2 and PM at a commercial manure-belt layer house. Environ. Pollut. 2020, 262, 114355. [Google Scholar] [CrossRef]
- Mostafa, E.; Buescher, W. Indoor air quality improvement from particle matters for laying hen poultry houses. Biosyst. Eng. 2011, 109, 22–36. [Google Scholar] [CrossRef]
- Costa, A.; Ferrari, S.; Guarino, M. Yearly emission factors of ammonia and particulate matter from three laying-hen housing systems. Anim. Prod. Sci. 2012, 52, 1089–1098. [Google Scholar] [CrossRef]
- Fabbri, C.; Valli, L.; Guarino, M.; Costa, A.; Mazzotta, V. Ammonia, methane, nitrous oxide and particulate matter emissions from two different buildings for laying hens. Biosyst. Eng. 2007, 97, 441–455. [Google Scholar] [CrossRef]
- Rosa, E.; Arriaga, H.; Calvet, S.; Merino, P. Assessing ventilation rate measurements in a mechanically ventilated laying hen facility. Poult. Sci. 2019, 98, 1211–1221. [Google Scholar] [CrossRef] [PubMed]
- Alberdi, O.; Arriaga, H.; Calvet, S.; Estelles, F.; Merino, P. Ammonia and greenhouse gas emissions from an enriched cage laying hen facility. Biosyst. Eng. 2016, 144, 1–12. [Google Scholar] [CrossRef]
- Winkel, A.; Mosquera, J.; Aarnink, A.J.A.; Koerkamp, P.; Ogink, N.W.M. Evaluation of manure drying tunnels to serve as dust filters in the exhaust of laying hen houses: Emissions of particulate matter, ammonia, and odour. Biosyst. Eng. 2017, 162, 81–98. [Google Scholar] [CrossRef]
- Green, A.R.; Wesley, I.; Trampel, D.W.; Xin, H. Air quality and bird health status in three types of commercial egg layer houses. J. Appl. Poult. Res. 2009, 18, 605–621. [Google Scholar] [CrossRef]
- Hayes, M.D.; Xin, H.; Li, H.; Shepherd, T.A.; Zhao, Y.; Stinn, J.P. Ammonia, greenhouse gas, and particulate matter emissions of aviary layer houses in the midwestern U.S. Trans. ASABE 2013, 56, 1921–1932. [Google Scholar]
- Li, S.; Li, H.; Xin, H.; Burns, R.T. Particulate matter concentrations and emissions of a high-rise layer house in Iowa. Trans. ASABE 2011, 54, 1093–1101. [Google Scholar] [CrossRef]
- Shepherd, T.A.; Zhao, Y.; Li, H.; Stinn, J.P.; Hayes, M.D.; Xin, H. Environmental assessment of three egg production systems—Part II-Ammonia, greenhouse gas, and particulate matter emissions. Poult. Sci. 2015, 94, 534–543. [Google Scholar] [CrossRef]
- Ni, J.-Q. Measuring and modeling mechanical ventilation for long-term environmental monitoring in large commercial laying hen house. Animals 2024, 14, 3339. [Google Scholar] [CrossRef]
- Lay, D.C.; Fulton, R.M.; Hester, P.Y.; Karcher, D.M.; Kjaer, J.B.; Mench, J.A.; Mullens, B.A.; Newberry, R.C.; Nicol, C.J.; O’Sullivan, N.P.; et al. Hen welfare in different housing systems. Poult. Sci. 2011, 90, 278–294. [Google Scholar] [CrossRef] [PubMed]
- Anonymous. Operating Manual, TEOM Series 1400a, Ambient Particulate (PM-10) Monitor; Part Number 42-003347; Thermo Fisher Scientific: Franklin, MA, USA, 2008; p. 530. [Google Scholar]
- USEPA. List of designated reference and equivalent methods; U.S. EPA: Research Triangle Park, NC, USA, 2013; p. 60.
- Lim, T.-T.; Cortus, E.L. Data Processing Program (CAPECAB)—Standard Operating Procedure (SOP) B6; Department of Agricultural and Biological Engineering, Purdue University: West Lafayette, IN, USA, 2007. [Google Scholar]
- Cortus, E. CAPECAB Instruction Manual; Department of Agricultural and Biological Engineering, Purdue University: West Lafayette, IN, USA, 2015; p. 112. [Google Scholar]
- Lim, T.-T.; Bogan, B.W. Calculation and Reporting of Air Emissions from Barns (Revision 2.0); B4; Agricultural and Biological Engineering, Purdue University: West Lafayette, IN, USA, 2009; p. 23. [Google Scholar]
- Lim, T.-T.; Sun, H.; Ni, J.-Q.; Zhao, L.; Diehl, C.A.; Heber, A.J.; Hanni, S.M. Field tests of a particulate impaction curtain on emissions from a high-rise layer barn. Trans. ASABE 2007, 50, 1795–1805. [Google Scholar] [CrossRef]
- Ni, J.-Q. A new factor of dynamic lighting schedule on dust production in commercial laying hen house. Environ. Pollut. 2025, 375, 126281. [Google Scholar] [CrossRef] [PubMed]
- Li, Q.F.; Lingjuan, W.L.; Liu, Z.F.; Heber, A.J. Field evaluation of particulate matter measurements using Tapered Element Oscillating Microbalance in a layer house. J. Air Waste Manage. Assoc. 2012, 62, 322–335. [Google Scholar] [CrossRef]
- Anonymous. Title 40 Chapter I Subchapter C Part 51—Requirements for Preparation, Adoption, and Submittal of Implementation Plans—Subpart A—Air Emissions Reporting Requirements; National Archives and Records Administration: Washington, DC, USA, 2021; pp. 169–682.
- Purdue University. Ammonia and Particulate Matter Emissions from a Belt-Battery Layer Barn. Final Report; Agricultural and Biological Engineering Department, Purdue University: West Lafayette, IN, USA, 2006; p. 19. [Google Scholar]


| Measurement | Instrument or Sensor | Location |
|---|---|---|
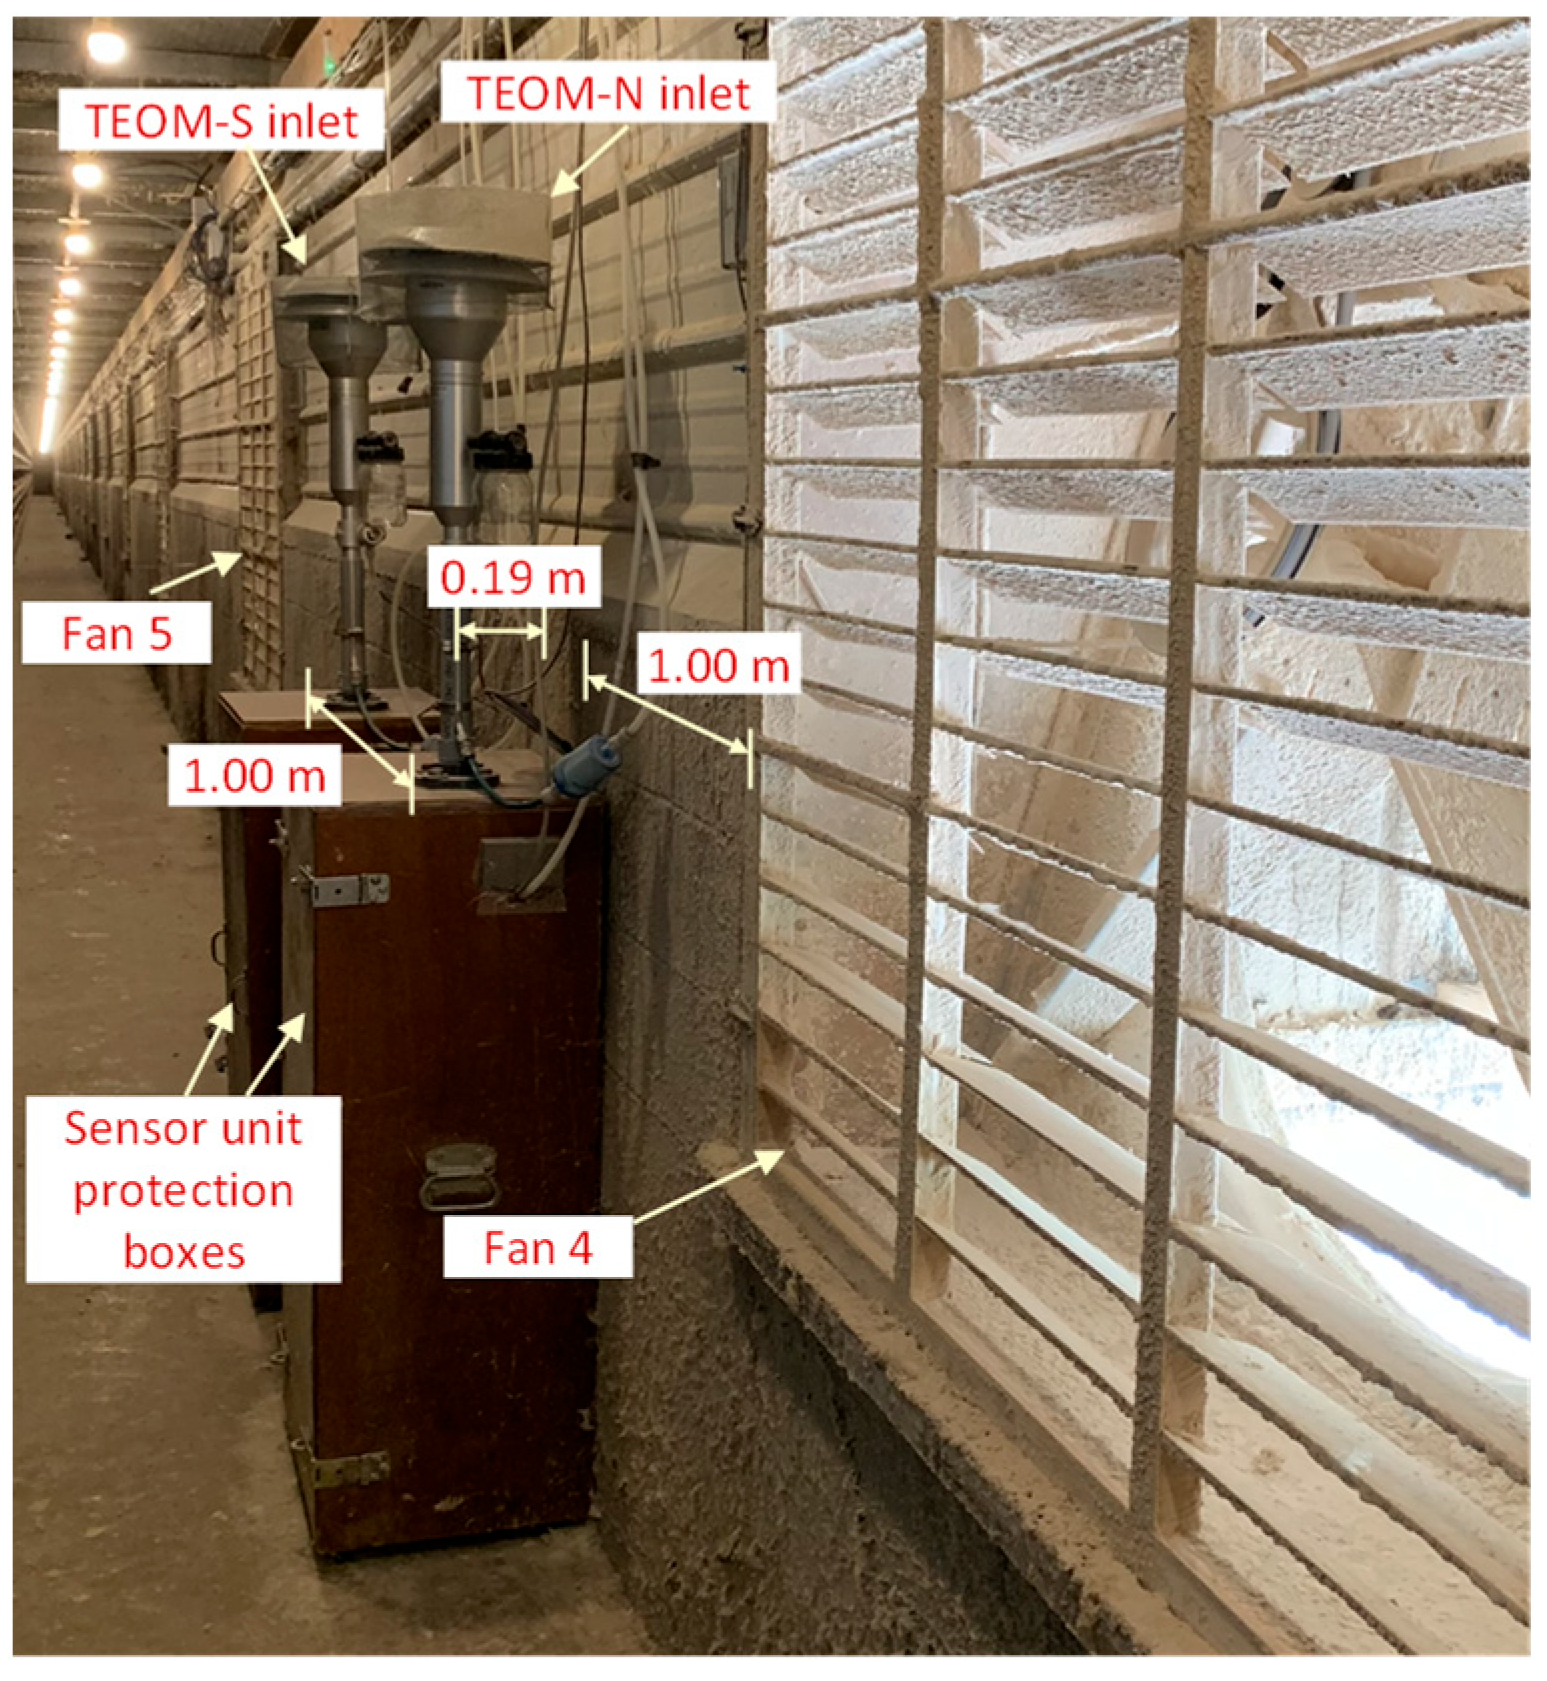
| PM10 concentration | TEOM × 3 | Fan 4 and mobile lab roof |
| Fan rotational speed | Hall Effect sensor × 46 | Fans 1–46 |
| House differential pressure | differential pressure transmitter × 3 | East and west side walls |
| RH/T | RH/T transmitter × 2 | Fans 5 and 28 |
| Temperature | Type T thermocouple × 5 | House, raceway, and TEOM pump chamber |
| Activity | Passive Infrared Detector × 2 | Fans 5 and 28 |
| Lighting | Light sensor × 1 | Fan 5 |
| Manure belt operation | Current switch × 2 | Manure belt control box |
| Fan airflow speed | Impeller anemometer × 2 | Fans 3 and 4 |
| Weather condition | Wireless weather station × 1 | Rooftop of the processing plant |
| Total | 67 |
| Data Type | Hourly Means | Daily Means | ||
|---|---|---|---|---|
| Valid Hours, h | Completeness, % | Valid Days, d | Completeness, % | |
| Weather data | 4416 | 100.0 | 184 | 100.0 |
| Ventilation rate | 4369 | 98.9 | 181 | 98.4 |
| PM10-N STP | 4322 | 97.9 | 179 | 97.3 |
| PM10-S STP | 4371 | 99.0 | 182 | 98.9 |
| PM10-O STP | 4379 | 99.2 | 182 | 98.9 |
| PM10 emission from the house | 4357 | 98.7 | 181 | 98.4 |
| Statistics | Outdoor T, °C | Outdoor RH, % | Solar Radiation, W m−2 | Wind Speed, km h−1 | Atmospheric Pressure, mb |
|---|---|---|---|---|---|
| Hourly means | |||||
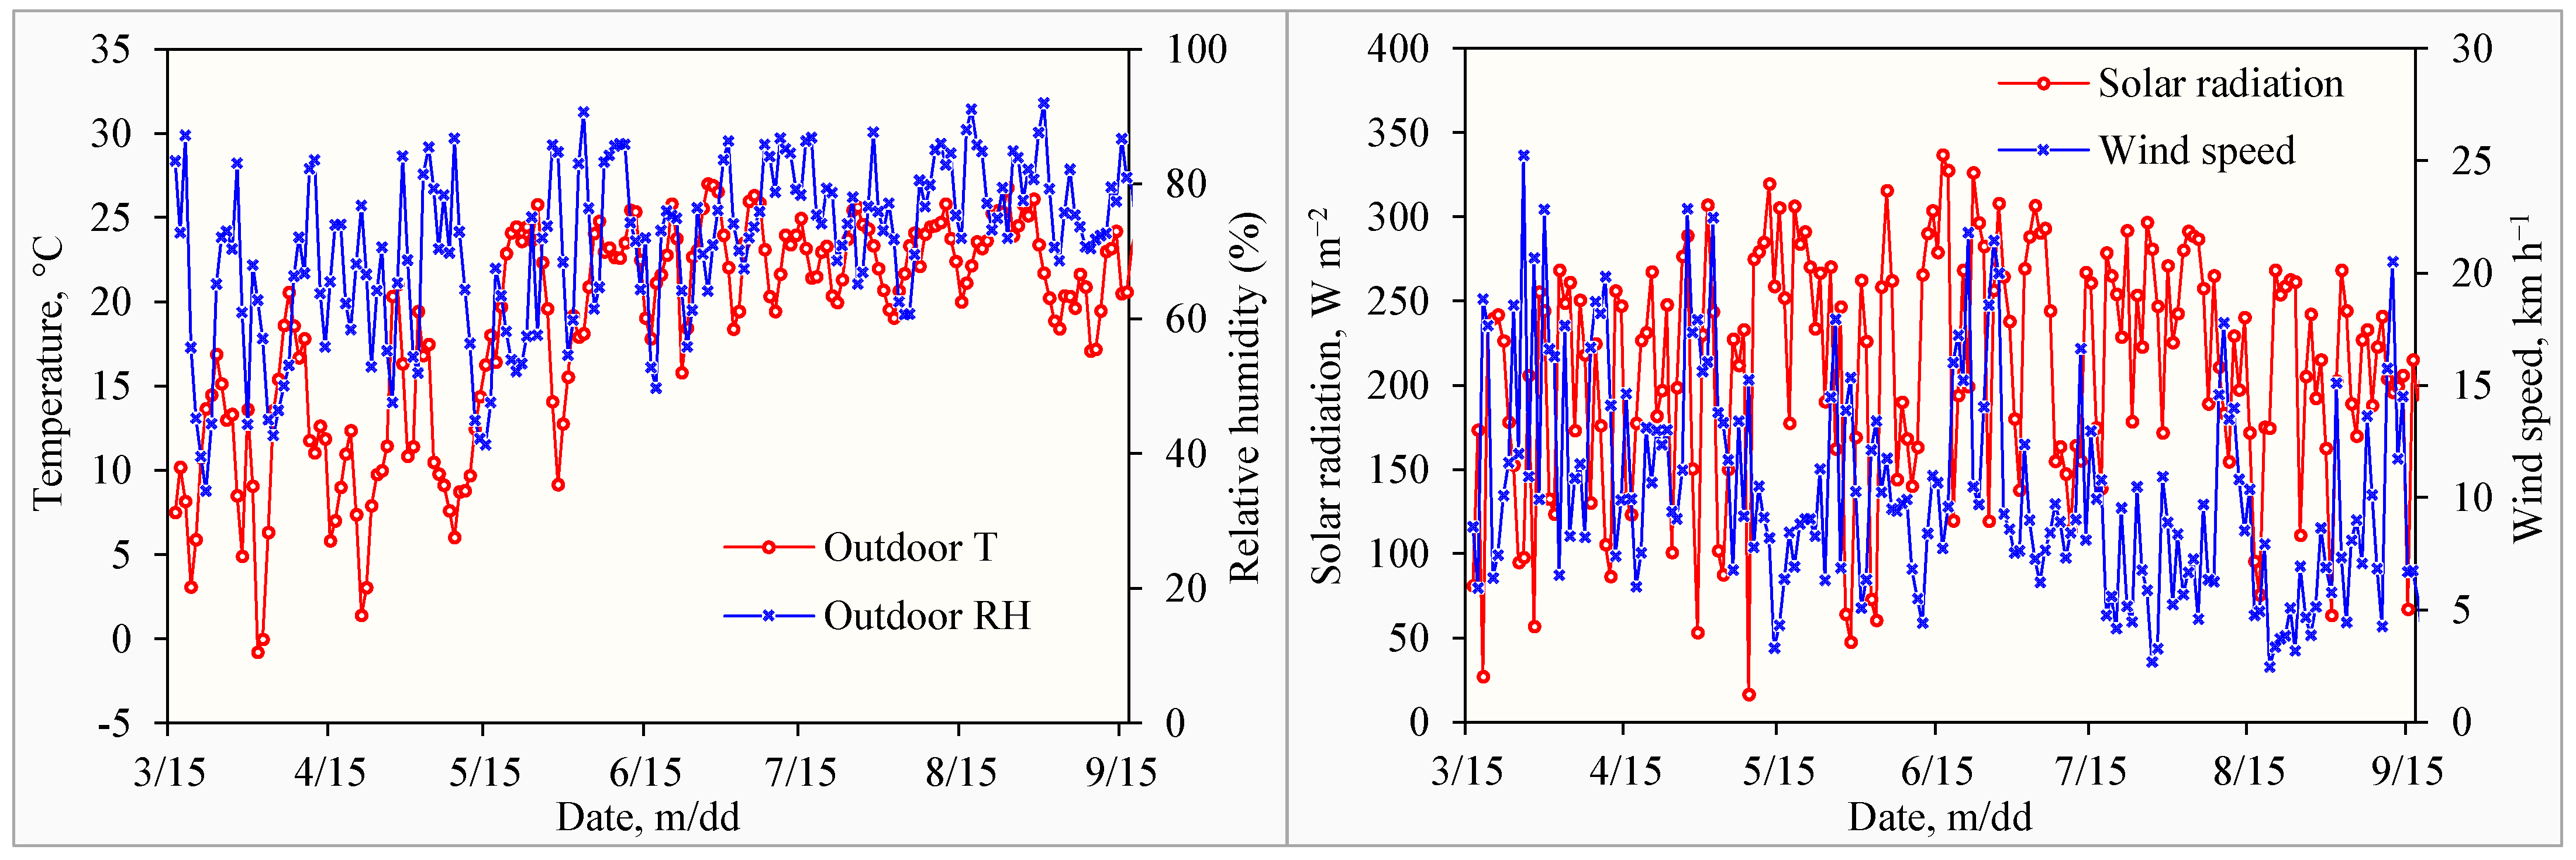
| Range | −6.2 to 34.2 | 20.2 to 95.7 | 0.0 to 991.0 | 0.0 to 58.1 | 975 to 1014 |
| AHM ± Std | 18.5 ± 7.3 | 70.8 ± 17.2 | 210.5 ± 272.3 | 10.4 ± 6.7 | 995 ± 6 |
| AHM ± 95% c.i. | 18.5 ± 0.2 | 70.8 ± 0.5 | 210.5 ± 8 | 10.4 ± 0.2 | 995 ± 0 |
| Daily means | |||||
| Range | −0.8 to 27.0 | 34.4 to 91.9 | 16.6 to 336.5 | 2.4 to 25.2 | 977 to 1011 |
| ADM ± Std | 18.5 ± 6.4 | 70.8 ± 12.3 | 210.5 ± 70.0 | 10.4 ± 4.8 | 995 ± 5 |
| ADM ± 95% c.i. | 18.5 ± 0.9 | 70.8 ± 1.8 | 210.5 ± 10.1 | 10.4 ± 0.7 | 995 ± 1 |
| Fan 5 T, °C | Fan 28 T, °C | Fan 5 RH, % | Fan 28 RH, % | East dP, Pa | West dP, Pa | |
|---|---|---|---|---|---|---|
| Hourly means | ||||||
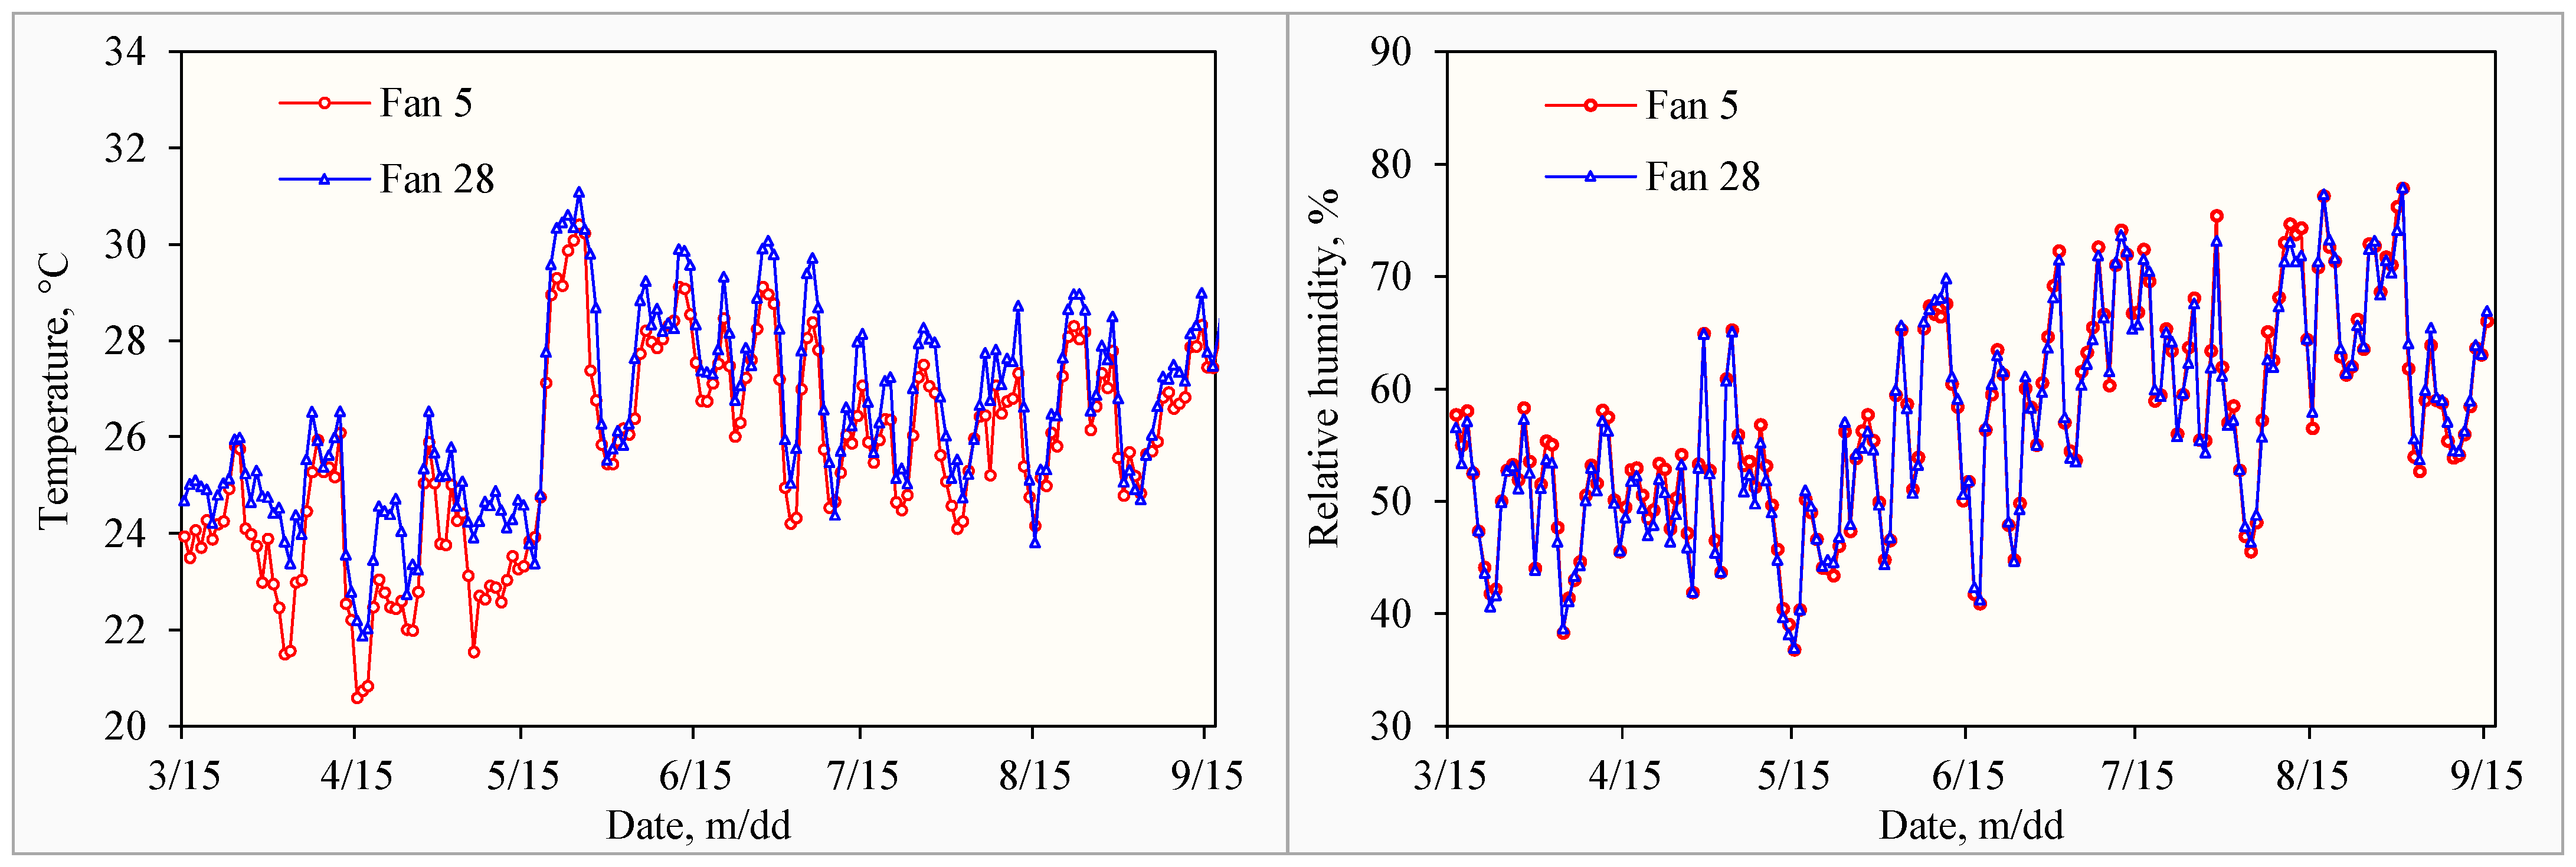
| Range | 18.7 to 33.5 | 20.4 to 33.6 | 23.1 to 83.6 | 25.4 to 82.0 | −64.3 to 3.1 | −64.2 to −1.5 |
| AHM ± Std | 25.1 ± 2.5 | 25.9 ± 2.5 | 57.0 ± 11.3 | 56.8 ± 11 | −17.7 ± 5.8 | −18.6 ± 6.1 |
| AHM ± 95% c.i. | 25.1 ± 0.1 | 25.9 ± 0.1 | 57.0 ± 0.3 | 56.8 ± 0.3 | −17.7 ± 0.2 | −18.6 ± 0.2 |
| Daily means | ||||||
| Range | 20.1 to 29.7 | 21.3 to 30.5 | 36.9 to 77.9 | 37.0 to 77.9 | −26.9 to −3.4 | −35.6 to −4.5 |
| ADM ± Std | 25.1 ± 2.1 | 25.9 ± 2.0 | 57.0 ± 9.3 | 56.8 ± 9.3 | −17.7 ± 4.0 | −18.6 ± 4.0 |
| ADM ± 95% c.i. | 25.1 ± 0.3 | 25.9 ± 0.3 | 57.0 ± 1.3 | 56.8 ± 1.3 | −17.7 ± 0.6 | −18.6 ± 0.6 |
| Statistics | Non-Converted PM10 Concentrations, µg m−3 | PM10 Concentrations at STP, µg m−3 | ||||||
|---|---|---|---|---|---|---|---|---|
| North | South | N, S Mean | Ambient | North | South | N, S Mean | Ambient | |
| Hourly means | ||||||||
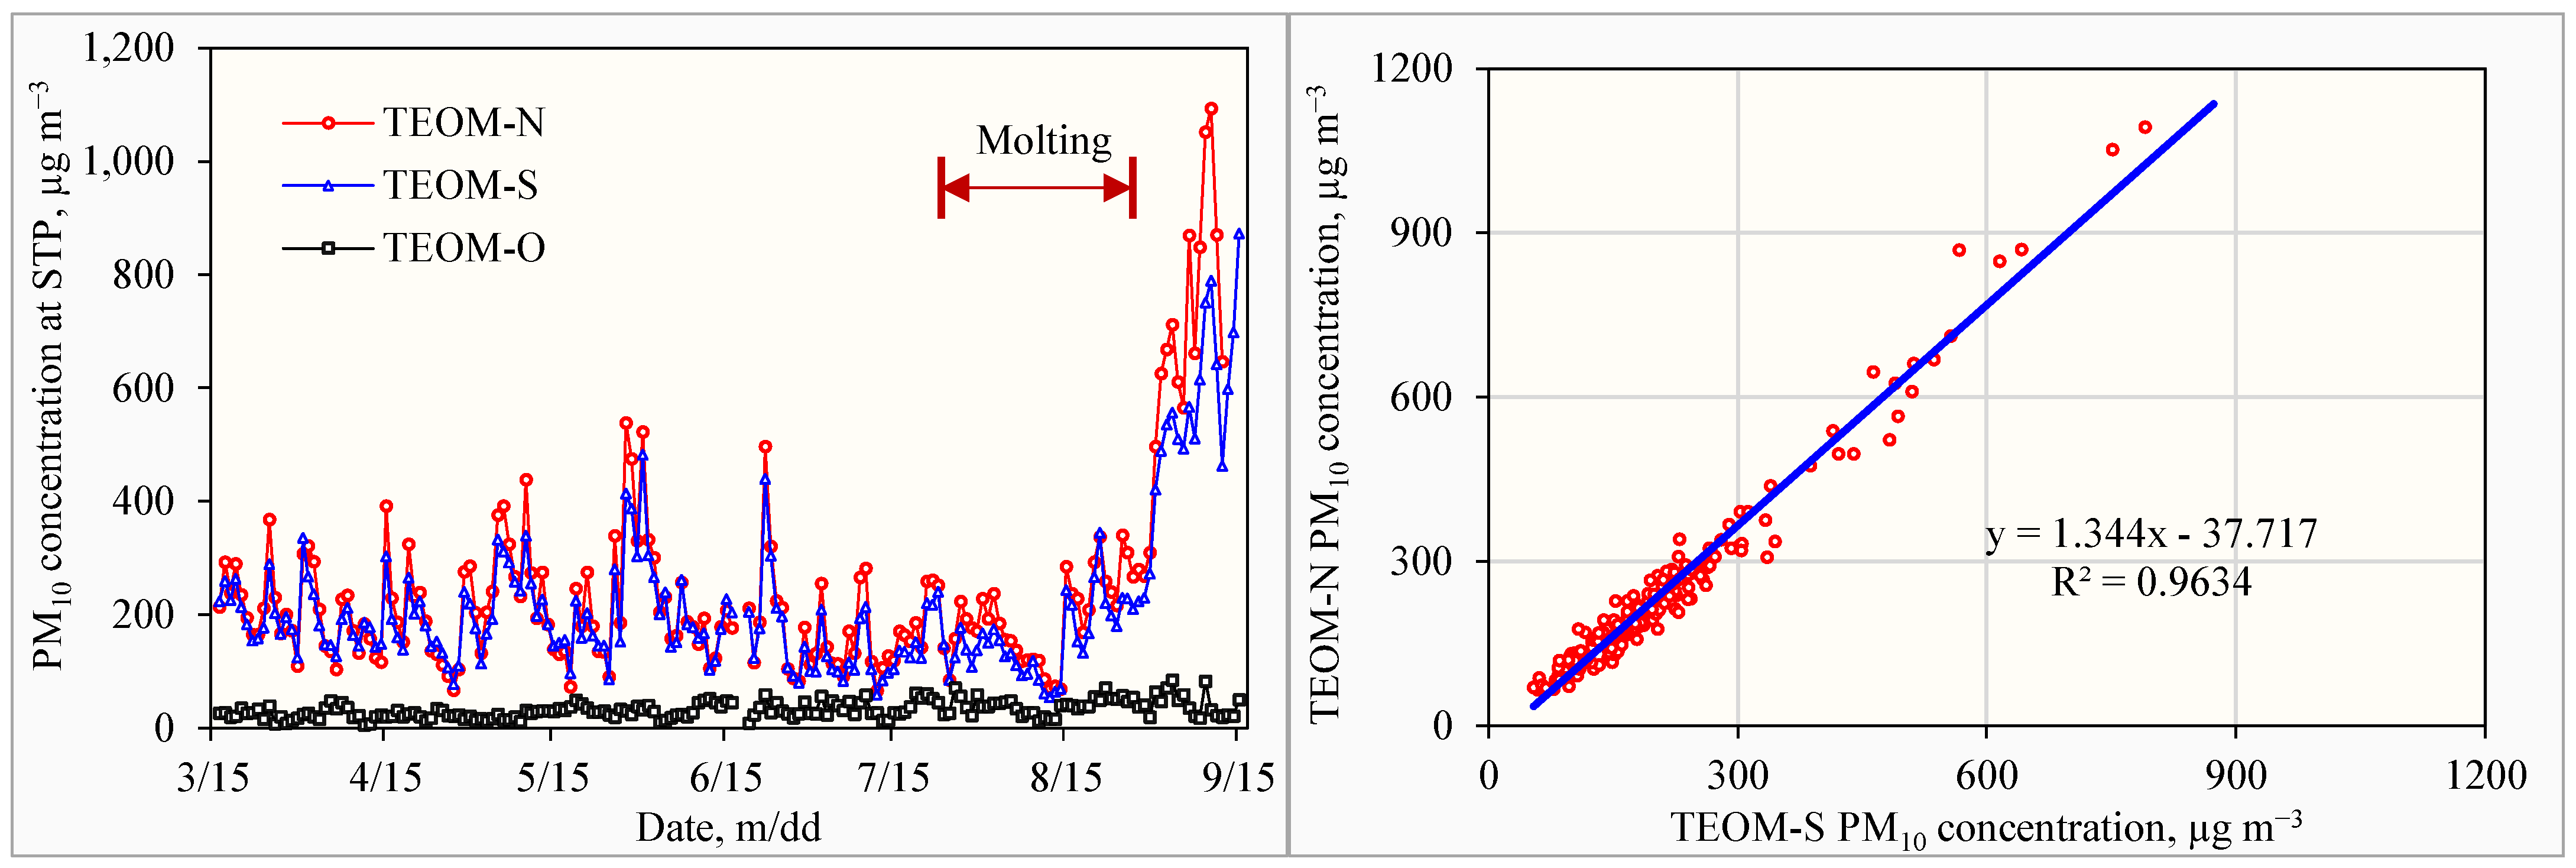
| Range | −137 to 3856 | −110 to 4081 | −123 to 3968 | −11 to 250 | −131 to 7833 | −105 to 4004 | −118 to 3893 | −11 to 243 |
| AHM ± Std | 255 ± 283 | 226 ± 230 | 243 ± 257 | 33 ± 26 | 246 ± 273 | 218 ± 222 | 235 ± 248 | 33 ± 25 |
| AHM ± 95% c.i. | 255 ± 8 | 226 ± 7 | 243 ± 8 | 33 ± 1 | 246 ± 8 | 218 ± 7 | 235 ± 7 | 33 ± 1 |
| Daily means | ||||||||
| Range | 69 to 1134 | 57 to 913 | 65 to 977 | 6 to 86 | 66 to 1094 | 54 to 873 | 62 to 942 | 6 to 85 |
| ADM ± Std | 253 ± 179 | 226 ± 148 | 244 ± 169 | 33 ± 16 | 244 ± 173 | 218 ± 142 | 236 ± 162 | 33 ± 15 |
| ADM ± 95% c.i. | 253 ± 26 | 226 ± 21 | 244 ± 25 | 33 ± 2 | 244 ± 25 | 218 ± 21 | 236 ± 24 | 33 ± 2 |
| Date | TEOM-N, min | TEOM-S, min |
|---|---|---|
| 7 March 2021 | 2 | |
| 31 March 2021 | 10 | |
| 7 April 2021 | 3 | |
| 15 April 2021 | 8 | |
| 19 April 2021 | 6 | |
| 12 May 2021 | 4 | |
| 31 May 2021 | 6 | |
| 31 May 2021 | 4 | |
| 21 August 2021 | 6 | |
| 25 August 2021 | 4 | |
| 6 September 2021 | 21 | |
| 8 September 2021 | 9 | |
| 10 September 2021 | 1 | |
| Total | 62 | 22 |
| Statistics | House, kg d−1 | House, mg d−1 AU−1 | House, mg d−1 hd−1 | Farm, kg d−1 (1) | Farm, kg d−1 (2) |
|---|---|---|---|---|---|
| Hourly mean | |||||
| Range | −3.7 to 40.4 | −9175 to 94,892 | −26.5 to 292.7 | −54.2 to 518.8 | −48.3 to 534.5 |
| AHM ± Std | 2.6 ± 3.2 | 6265 ± 7721 | 18.7 ± 23.3 | 35.2 ± 45.4 | 34.5 ± 44.9 |
| AHM ± 95% c.i. | 2.6 ± 0.1 | 6265 ± 229 | 18.7 ± 0.7 | 35.2 ± 1.3 | 34.5 ± 1.3 |
| Daily mean | |||||
| Range | 0.4 to 10.2 | 998 to 24,784 | 3.1 to 74.9 | 5.4 to 148.2 | 5.6 to 147.9 |
| ADM ± Std | 2.6 ± 2.1 | 6319 ± 5015 | 18.9 ± 15.3 | 35.6 ± 31.1 | 34.8 ± 30.9 |
| ADM ± 95% c.i. | 2.6 ± 0.3 | 6319 ± 731 | 18.9 ± 2.2 | 35.6 ± 4.5 | 34.8 ± 4.5 |
| Statistics | Three Emission Periods | ||
|---|---|---|---|
| 16 March–27 April | 28 April–13 August | 14 August–15 September | |
| Outdoor temperature, °C | 10.66 | 20.56 | 22.24 |
| Outdoor relative humidity, % | 62.35 | 71.65 | 78.42 |
| Indoor temperature, °C | 22.96 | 25.72 | 25.98 |
| Indoor relative humidity, % | 50.19 | 57.42 | 64.25 |
| House ventilation, m3 min−1 | 4494 | 12,267 | 14,366 |
| PM10-N concentration, µg m−3 | 200.4 | 196.9 | 468.4 |
| PM10-S concentration, µg m−3 | 188.5 | 173.4 | 397.1 |
| PM10-O concentration, µg m−3 | 24.23 | 32.24 | 44.79 |
| House emission rate, kg d−1 | 1.08 | 2.07 | 6.20 |
| Emission rate per hen, mg d−1 hen−1 | 7.70 | 15.00 | 45.50 |
| Location, House, Duration | PM10 Concentration, µg m−3 | PM10 Emission (mg d−1 hen−1) | Reference |
|---|---|---|---|
| Ohio, one house, 6 months | 256 ± 108 | 12.4 ± 13.3 | [45] |
| Indiana, house A, 2 years | 415 ± 428 | 12.4 ± 19.3 | [17,18] |
| Indiana, house B, 2 years | 761 ± 661 | 25.2 ± 33.3 | [17,18] |
| Ohio, house 1, 1 year | 497 ± 232 | 18.0 ± 9.6 | [16] |
| Ohio, house 2, 1 year | 522 ± 168 | 17.8 ± 9.6 | [16] |
| Ohio, one house, 6 months | 236 ± 162 | 18.9 ± 2.2 | This study |
Disclaimer/Publisher’s Note: The statements, opinions and data contained in all publications are solely those of the individual author(s) and contributor(s) and not of MDPI and/or the editor(s). MDPI and/or the editor(s) disclaim responsibility for any injury to people or property resulting from any ideas, methods, instructions or products referred to in the content. |
© 2025 by the authors. Licensee MDPI, Basel, Switzerland. This article is an open access article distributed under the terms and conditions of the Creative Commons Attribution (CC BY) license (https://creativecommons.org/licenses/by/4.0/).
Share and Cite
Ni, J.-Q.; Heber, A.J. Particulate Matter (PM10) Concentrations and Emissions at a Commercial Laying Hen House with High-Quality and Long-Term Measurement. Atmosphere 2025, 16, 1021. https://doi.org/10.3390/atmos16091021
Ni J-Q, Heber AJ. Particulate Matter (PM10) Concentrations and Emissions at a Commercial Laying Hen House with High-Quality and Long-Term Measurement. Atmosphere. 2025; 16(9):1021. https://doi.org/10.3390/atmos16091021
Chicago/Turabian StyleNi, Ji-Qin, and Albert J. Heber. 2025. "Particulate Matter (PM10) Concentrations and Emissions at a Commercial Laying Hen House with High-Quality and Long-Term Measurement" Atmosphere 16, no. 9: 1021. https://doi.org/10.3390/atmos16091021
APA StyleNi, J.-Q., & Heber, A. J. (2025). Particulate Matter (PM10) Concentrations and Emissions at a Commercial Laying Hen House with High-Quality and Long-Term Measurement. Atmosphere, 16(9), 1021. https://doi.org/10.3390/atmos16091021


